research & analysis uk 2014 · research & analysis uk 2014 report sample pet products &...
TRANSCRIPT

© MTW Research 2014
1
Pet Products Market & Accessories Market
Research & Analysis
UK 2014
Report Sample
Pet Products & Accessories Market Size & Industry Review 2008-2014; SWOT & PEST Analysis, Product Mix & Key Trends 2008-2018; 90 Pet Retailers’ &
Manufacturers Profiles & Key Financials; Market Forecasts to 2018
3rd Edition
October 2014

© MTW Research 2014
2
Research & Analysis Report Contents 1. INTRODUCTION TO RESEARCH & ANALYSIS REPORTS 5
1.1 Key Features & Benefits of this Research & Analysis Report 5
2. UK PET PRODUCTS & PET ACCESSORIES MARKET 6
2.1 EXECUTIVE SUMMARY & MARKET OVERVIEW 6
2.2 PET PRODUCTS & ACCESSORIES MARKET SIZE & TRENDS 2008-2018 8
2.2.1 Total UK Pet Products Market 2008-2018 8
2.2.2 UK Pet Products Market by Key Sector 10
2.2.3 Pet Accessories Market – UK 2008-2018 13
2.2.4 Pet Accessories Market Size 2008-2018 – Constant Prices 16
2.2.5 Future Prospects 20
2.3 KEY MARKET TRENDS IN THE PET PRODUCTS & ACCESSORIES MARKET 23
2.3.1 PEST Analysis – Illustration of Key Market Forces 23
2.3.2 Political & Legal Influences & Trends 24
2.3.3 Economic Influences & Trends 25
2.3.4 UK House Building Market – New Build Dwellings 2008-2018 31
2.4 SWOT ANALYSIS – Strengths, Weaknesses, Opportunities, Threats 34
3. PET ACCESSORIES TRENDS & SHARES 36
3.1 Share by Key Product Sector – 2014, 2008 & 20184 36
3.2 UK Pet Toys Market 2008-2018 40
3.3 Pet Housing, Bedding & Hygiene Market 2008 – 2018 44
3.4 Pet Grooming, Health & Well-Being Products Market 2008-2018 47
3.5 Pet Collars, Leads & Harnesses Market 2008-2018 50
3.6 Pet Bowls & Feeding Utensils Market 2008 – 2018 52
4. PET PRODUCT MANUFACTURER PROFILES 55
4.1 Pet Product Manufacturers Profiles & 4 Year KPIs, Turnover & Profit 55
1 Page Profile & 4 Years Financials with Turnover & Profit for 60+ Pet Product Manufactsurers 55-118
5. PET ACCESSORY DISTRIBUTION CHANNEL SHARES & TRENDS 2008-2018 119
5.1 Share by Key Distribution Channel 2014, 2008 & 2018 119
5.2 Specialist Pet Retailers Market – Industry Structure 123
5.2.1 Market Mix by Growth/Decline Over Last 12 Months 123
5.2.2 Industry Share by Credit Rating in 2014 124
5.2.3 Industry Mix by Age of Companies in 2014 125
5.2.4 Industry Share by Number of Employees in 2014 126
5.2.5 Industry Mix by Turnover Band in 2014 127
5.2.6 Industry Sales Share by Geographical Region in 2014 128
5.3 Key Market Trends in the Pet Retailers Industry 2008-2018 130
5.3.1 Pet Retailers Market Profitability 2008-2018 130
5.3.2 Pet Retail Industry Assets 2008-2018 131
5.3.3 Pet Retailers Industry Debt 2008-2013 132
5.3.4 Pet Products Retailers Market Net Worth 2008-2018 134
5.3.5 Sales Per Employee in Pet Retailers Market 2008-2018 136
5.4 Pet Retailers 1 Page Profiles & 4 Year Financial Indicators 138
1 Page Profile & 4 Years Financials with Turnover & Profit for 30 Pet Retailers & Distributors 138-169
5.5 Specialist Pet Retailers Ranking & Turnover Estimates 170
5.5.1 Pet Retailers Listing 170
5.5.2 Pet Retailers & Distributors Ranking By Turnover 171
5.5.3 Pet Products & Accessories Retailer Turnover Estimates 2013 172
5.5.4 Pet Retailers Ranking by Profitability 173
5.5.5 Pet Retailers Ranking by Assets 174
5.5.6 Pet Retailers Ranking by Debt 175
5.5.7 Pet Retailers Ranking by Net Worth 176
© MTW Research 2014
3
Market Report Tables & Charts
Figure 1: Total Pet Products Market – UK 2008 - 2018 By Value £bn Figure 2: Share by Key Sector in Pet Products Market 2014 Figure 3: Pet Accessories Market – UK 2008 - 2018 By Value £m Figure 4: Pet Accessories Market – UK 2008 - 2018 Constant Prices £M Figure 5: Pet Ownership Levels (Millions) 2008-2018 Figure 6: Share by Pet Type Owned in the UK 2014 Figure 7: PEST Analysis for UK Pet Accessories & Pet Products Market in 2014 Figure 6: UK Economic Annual Performance– GDP 2008-2018 Figure 7: UK Economic Annual Performance– Inflation (CPI) 2008-2018 Figure 8: UK Economic Annual Performance– Interest Rates (Bank of England) 2008-2018 Figure 9: UK Unemployment Numbers 2008-2018 Figure 10: Total New Build Home Completions UK: 2008-2018 Figure 11: UK New Home Build Activity Split by LA, HA & Private 2014 Figure 12: UK Private Sector New Build Home Completions 2008-2018 Figure 12: Key Strengths & Weaknesses in the Pet Accessories Market 2014-2018 Figure 13: Key Opportunites & Threats in the Pet Accessories Market 2014-2018 Figure 14: Share by Key Product Sector in Pet Accessories Market 2014 Figure 15: Share by Product in Pet Accessories Market 2008 Figure 16: Forecast Share by Product in Pet Accessories Market 2018 Figure 17: Pet Toys Market by Value 2008-2018 £M Figure 18: Pet Housing, Bedding & Hygiene Market by Value 2008-2018 £M Figure 19: Pet Grooming, Health & Well-Being Market by Value 2008-2018 £M Figure 20: Pet Collars, Leads & Harnesses Market by Value 2008-2018 £M Figure 21: Pet Bowls & Feeding Utensils Market by Value 2008-2018 £M Figures 22-85: 4 Years 'At a Glance' Financial Charts for 60+ Pet Product Manufacturers Figure 86: Share by Distribution Channel for Pet Accessories Market 2014 Figure 87: Share by Distribution Channel for Pet Accessories 2008 Figure:88 Share by Distribution Channel for Pet Accessories 2018 Figure 89: Market Share by Pet Retailers Sales Growth / Decline 2014 Figure 90: Market Share by Credit Rating in the Pet Retail Industry 2014 Figure 91: Market Share by Company Age in the Pet Retail Market 2014 Figure 92: Mix by Number of Employees in the Pet Retailers Market 2014 Figure 93: Share by Turnover Band in the Pet Retailers Market 2014 Figure 94: Sales by UK Region in the Pet Retail Market 2014 Figure 95: Pet Retailers Market Profitability 2008 – 2018 £M Figure 96: Pet Retailers Assets 2008 – 2018 £M Figure 97: Average Pet Retailers Assets 2008 – 2018 £M Figure 98: Pet Retailers Market Debt – UK 2008 – 2018 £M Figure 99: Pet Retailers Market Average Debt 2008 - 2018 £M Figure 100: Pet Retailers Market Net Worth – UK 2008 – 2018 £M Figure 101: Pet Retailers Average Net Worth – UK 2008 – 2018 £M Figure 102: Pet Retailers Sales Per Employee 2008 – 2018 £ Figures 103 - 135: 4 Years Financials 'At A Glance' Charts for 30+ Pet Retailers Figure 136: Pet Retailers Company Listing Figure 137: Pet Retailers & Distributors Ranked By Turnover 2013 Figure 138: Pet Retailers & Distributors Sales Estimates 2013 £M Figure 139: Pet Retailers Ranked By Profit 2013 Figure 140: Pet Retailers Ranked By Assets 2013 Figure 141: Pet Retailers Ranked By Debt 2013 Figure 142: Pet Retailers Ranked By Net Worth 2013

© MTW Research 2014
4
Published in 2014 by
This report reflects MTW Research’s independent view of the market which may differ from other third party views. Whilst we try to ensure that our reports are an accurate depiction of their
respective markets, it must be emphasised that the figures and comment contained therein are estimates based on a mix of primary and secondary research, and should therefore be treated as
such.
Terms & Conditions of Use The information contained within this report remains the copyright of MTW Research. Subject to these Terms and Conditions (this "Agreement"), MTW Research ("we", "our", "us") makes available this publication and data or information contained therein (the "Report"). Your use of this report
constitutes your acknowledgment and assent to be bound by this Agreement.
Permitted Use, Limitations on Use
You may access purchased Reports only as required to view the Reports for your individual use, and may print/copy a purchased Report once for your use. You may copy extracts from purchased Reports onto your own documents, provided that all citations are attributed to "MTW Research", and are for internal use only. You may not republish, resell or redistribute any Report, or do anything else with any Report, which is not specifically permitted in this Agreement. You may not reproduce, store in a retrieval system or transmit by any means, electronic or mechanical, any report
without the prior permission of MTW Research.
Limitation of Liability
You are entirely liable for activities conducted by you or anyone else in connection with your use of the Report. We take no responsibility for any incorrect information supplied to us during the research process. Market information is based on telephone interviews and secondary sources
whose accuracy we cannot guarantee. You acknowledge when ordering that MTW Research Reports are for your internal use and not for general publication or disclosure to third parties, unless otherwise agreed. Neither MTW Research nor any of its affiliates, owners, employees or other representatives will be liable for damages arising out of or in connection with the use of the Report or the information, content, materials or
products included in the Report. This is a comprehensive limitation of liability that applies to all damages of any kind, including (without limitation) compensatory, direct, indirect or consequential damages, loss of data, income or profit, loss of or damage to property and claims of third parties.
Applicable Law
This Agreement will be governed by and construed in accordance with the laws of England and Wales without giving effect to the principles of conflict of laws thereof, and to the extent permitted by applicable law, you consent to the jurisdiction of courts situated in England and Wales in
any action arising under this agreement.
Intellectual Property Rights
You acknowledge that legal and beneficial interest in Intellectual Property Rights in connection with the Report belong to us. This includes all Intellectual Property Rights in any Material. You have no rights in or to the Report and you may not use any Material other than as permitted under this Agreement. We grant you a non-exclusive, non-transferable licence to use the Intellectual Property Rights referred to above solely for the use
of Material as permitted under this agreement.
Companies Included Whilst MTW endeavour to ensure that the majority of the major companies active in the market with which this report is concerned are
included, it should be noted that the list of companies included in this report is not exhaustive and the inclusion or otherwise of a company in this report does not necessarily indicate, nor should be interpreted as, a company’s relevance or otherwise in a particular market.
Whilst we endeavour to attain high levels of accuracy, it should be borne in mind that the rankings and other information provided within this report contain an element of estimation, should be regarded as such and treated with a degree of caution.
Estimates Provided
In order to enable benchmarking, competitor analysis and facilitate further market research, MTW have provided estimates for turnover, profit before tax and number of employees for small, medium sized and other companies who are not obliged to submit this information to Companies House. As such, in the interests of clarity, all data relating to turnover, profit and number of employees provided in this report should be regarded as independent estimates by MTW. Whilst we endeavour to attain high levels of accuracy with these estimates, they
may not reflect the actual figures of a company and should therefore be treated with caution.

© MTW Research 2014
5
1. Introduction to Research & Analysis Reports
1.1 Key Features & Benefits of this Research & Analysis Report
MTW’s “Research & Analysis” market reports provide an independent, comprehensive review of
recent, current and future market size and trends in an easy to reference format. Each report
provides vital market intelligence in terms of size, product mix, SWOT, key trends and influences,
supply and distribution channel trends. In addition, rankings by turnover, profit and other key
financials for the market leaders are provided as well as a 1 page profile for each key player in the
market. Contact, telemarketing & mailing details are also provided for each company to enable the
reader to quickly develop sales leads.
Based on company sales returns which provide higher confidence levels and researched by market
research professionals with experience in the industry, MTW’s Research and Analysis reports are used
as a foundation for coherent strategic decision making based on sound market intelligence and for
developing effective marketing plans. MTW reports can also used as an operational sales and
marketing tool by identifying market leaders, enabling the reader to quickly grow sales to new clients
and focus marketing budgets.
This report includes:-
• Market Size, PEST, SWOT & Trends – Historical, Current & Future
Based on sales data from a representative proportion of the industry, this report provides market size
by value over a ten-year period. As they are based on quantitative data as well as qualitative input
from the industry, our reports are more accurate than other qualitative based reports and offer better
value for money. By combining the best of both quantitative and qualitative input, we offer our
clients greater confidence in our market forecasts as well as discussing key market trends and
influences from a qualitative perspective.
• Product Mix – Past, Current & Future
This report identifies the key product sectors in the market and provides historical, current and
forecast market share estimates for each, alongside qualitative discussion on key trends for each
segment of the industry. With input for this report being both qualitative and quantitative we are able
to offer an effective insight into the core components of the market, as well as forecasting future
market shares.
• Distribution Channel Sales – Past, Current & Future
The report identifies the key distribution channels that drive demand for this market and provides a
current, historical & future market share estimate. This enables the reader to identify the key driving
forces behind current market demand and adapt business tactics accordingly. With forecasts of
market share by key channels also provided, the reader is able to undertake strategic decisions with
greater confidence as well as basing marketing strategies on solid market intelligence.
• Market Leaders Ranking
This report identifies the key players in the market and ranks them by a number of criteria, including
turnover and profitability. This enables the reader to identify the most relevant potential key
customers in a market, understand their current position in the market and quickly identify new
targets. Also, MTW provide a turnover estimate for every company included in the report, enabling
the reader to develop market share estimates.
• Company Profiles & Sales Leads – Retailers & Manufacturers
This report includes a 1 page profile for each company including full contact details for developing fast
sales leads; 4 years of the most recent key financial indicators; and MTW’s ‘at a glance’ chart,
enabling the reader to quickly gauge the current financial health of a company.
• Relevant Research, Saving You Time
MTW Research have been researching and writing market reports in these sectors since 1999 and as
such we are able to develop a company listing which is more relevant to the market, rather than
automatically selecting companies to be included by industry code. Our reports represent excellent
value for money and don’t bombard you with irrelevant financial data; they are designed to enable
you to engage in fast and effective market analysis. We focus on providing what’s important in an
easy to reference and use format.
© MTW Research 2014
6
2. UK PET PRODUCTS & PET ACCESSORIES MARKET
2.1 EXECUTIVE SUMMARY & MARKET OVERVIEW
The UK Pet Products & Accessories Market is defined as consisting of the sale of
new products designed for use by UK consumers with domestic animals who are primarily regarded as pets. Specifically, this report reviews the total UK pet
products market and further examines pet accessories sales between 2008 and 2014 with forecasts to 2018 segmented by each of the main sectors below:-
• Pet Toys – dog, cat, small animal, fish, reptile etc
• Pet Housing & Bedding – cages, tanks, aquariums, bedding etc
• Grooming, Health & Well-Being – vitamins, treatments, grooming etc
• Collars & Leads – harnesses, restraints, ID tags etc
• Feeding Accessories – Pet bowls, feeding utensils, water bottles, dishes etc
• Miscellaneous Pet Products – e.g. catflaps, clothing, letterbox cages etc
The report also provides top line market size & product mix in 2014 for the key sectors within the overall UK pet products industry, including:-
• Pet Food
• Pet Accessories (as above)
• Kennelling / Pet Holidays
• Vets / Insurance
• Other Pet Expenditure
All prices in this report are measured at retail selling prices excluding any value added tax, other taxes and delivery charges. Products designed for use with
farm animals, horses and other livestock are specifically excluded from this report.
The methodology for this report is based on the last 4 years of financial data
from more than 90 companies active in the industry coupled with a wide range of secondary sources including companies involved in the industry, websites,
Companies House, HM Government, trade journals, credit reference agencies, industry commentators and our own experience of researching this market for
more than a decade.
The total UK pet products market is estimated to have grown to a value of
around £xx billion ads retail selling prices in 2014, reflecting an industry which has exhibited a xxxx xxxxxxx x xxxxxxx xxxxxx than has been evident in many
other segments of the consumer goods industry in the UK.
The UK pet products market has been influenced by xxxx xxxxxxx levels in recent years with this supported by an increasing xxxx xxxxxxx xxxx xxxxxxx
by consumers. In addition xxxx xxxxxxx and xxxx xxxxxxx development by suppliers of a xxxx xxxxxxx of pet products has continued to generate value
growth opportunities for the industry in recent years.
© MTW Research 2014
7
A key segment within the overall pet products market, the UK pet accessories sector is expected to be worth some £xx million at retailers selling prices,
having xxxx xxxxxxx by just under x% since 2013 and by some xx% since 2008.
In line with trends in the overall pet products market, sales of pet accessories
continue to exhibit xxxx xxxxxxx xxxx xxxxxxx xxxx xxxxxxx xxxx xxxxxxx performance, though sources indicate that 2014 performance has been xxxx
xxxxxxx xxxx xxxxxxx xxxx xxxxxxx xxxx xxxxxxx xxxx xxxxxxx xxxx xxxxxxx xxxx xxxxxxx coupled with xxxx xxxxxxx xxxx xxxxxxx xxxx xxxxxxx xxxx
xxxxxxx xxxx xxxxxxx levels. Forecasts are for the market to exhibit above
xxxx xxxxxxx xxxx xxxxxxx xxxx xxxxxxx of around 1-2% in the short term with this likely to xxxx xxxxxxx xxxx xxxxxxx xxxx xxxxxxx in the medium to
longer term.
The largest sector within the pet accessories market is represented by products designed for xxxx xxxxxxx xxxx xxxxxxx xxxx xxxxxxx. These products will
reach a value of just over £xxx million at retailers selling prices in 2014, reflecting xxxx xxxxxxx of just over x% since 2013. The second largest sector
of the market is accounted for by xxxx xxxxxxx, with a market value of around £xxx million. xxxx xxxxxxx xxxx xxxxxxx products are also a key sector of the
UK pet accessories market, accounting for just under 22% of total sales in 2014.
The xxxx xxxxxxx xxxx xxxxxxx sector continues to maintain the majority share
by value of the pet accessories market in 2014, with this sector comprising of
around xx% of total industry sales. This sector remains dominated in volume terms by xxxx xxxxxxx xxxx xxxxxxx retailers operating on a xxxx xxxxxxx
basis with a xxxx xxxxxxx number of SKUs (stock units). The second largest sector is accounted for by xxxx xxxxxxx xxxx xxxxxxx retailers, with this sector
estimated to account for around 16% of the market by value.
The internet / mail order channel is xxxx xxxxxxx xxxx xxxxxxx xxxx xxxxxxx xxxx xxxxxxx xxxx xxxxxxx in volume terms, with companies in this sector able
to offer xxxx xxxxxxx xxxx xxxxxxx xxxx xxxxxxx xxxx xxxxxxx. Companies active in this sector are expected to incr xxxx xxxxxxx xxxx xxxxxxx sales xxxx
xxxxxxx xxxx xxxxxxx than £x0 million in the next four years with sales forecast to reach in excess of £xxx million by 2018. Supermarkets are also
likely to xxxx xxxxxxx xxxx xxxxxxx of the UK pet accessories market and by 2018 our forecasts are for sales of pet accessories through this channel to
exceed £xx million.
For the preceding 12 months to October 2014, our estimates suggest that just
over xx% of the specialist pet retailer channel experienced growth which could be described as ‘rapid’, with sales rising by more than 10% per year. Further,
around xx% of the pet retailers market is estimated to have experienced some sales growth over the last 12 months. During the last 12 months, therefore,
just under xx% of the total specialist pet retailer market experienced some element of overall sales growth, reflecting xxxx xxxxxxx xxxx xxxxxxx xxxx
xxxxxxx volume and value demand across the majority of products in the UK pet products market in late 2013 and most of 2014.

© MTW Research 2014
8
2.2 PET PRODUCTS & ACCESSORIES MARKET SIZE & TRENDS 2008-2018
2.2.1 Total UK Pet Products Market 2008-2018
Despite two recent recessions, sales of UK pet products have continued to xxxx xxxxxxx many other consumer markets, with a number of key products sectors
apparently xxxx xxxxxxx and a subsequent decline xxxx xxxxxxx xxxx xxxxxxx in recent years.
In 2014 the overall UK pet products market is estimated to be worth just over
£x billion at retail selling prices, reflecting an industry which continues to xxxx xxxxxxx the overall UK economy. The market continues to offer a number of
opportunities for growth for both UK manufacturers and retailers with sales xxxx xxxxxxx xxxx xxxxxxx xxxx xxxxxxx across a relatively wide range of pet
products sectors.
Buoyed by both xxxx xxxxxxx xxxx xxxxxxx coupled with growth in xxxx
xxxxxxx xxxx xxxxxxx, sales of pet products are estimated to have xxxx xxxxxxx by around xx% since 2008, illustrating the xxxx xxxxxxx rates of xxxx
xxxxxxx in the industry in recent years.
The following chart illustrates our estimates of the performance of the overall UK pet products market since 2008, with forecasts to 2018:-
Figure 1: Total Pet Products Market – UK 2008 - 2018 By Value £bn
Chart Censored in Sample
Source: MTW Research / Trade Estimates
As illustrated, the total UK pet products market is estimated to have grown from a value of around
© MTW Research 2014
9
2.2.2 UK Pet Products Market by Key Sector
The following chart illustrates our estimates of the mix by key product sector within the UK pet products & services market in 2014:-
Figure 2: Share by Key Sector in Pet Products Market 2014
Pie Chart Censored in Sample
Source: MTW Research / Company Accounts
As illustrated, xxxx xxxxxxx are currently estimated to account for around xx% of
the total UK pet products & services market in 2014, reflecting a value of around £xx billion with UK households spending just under £x million per week in 2014. Whilst
this sector has experienced
© MTW Research 2014
10
2.2.3 Pet Accessories Market – UK 2008-2018
The UK Pet Accessories market encompasses a wide range of products and is estimated to be worth just under £xx million in 2014 as illustrated in the
following chart:-
Figure 3: Pet Accessories Market – UK 2008 - 2018 By Value £m
Chart Censored in Sample
Source: MTW Research / Trade Estimates
Sales of pet accessories have experienced particularly xxxx xxxxxxx xxxx xxxxxxx in recent years, as illustrated in the above chart. Since 2008 the
market is estimated to have xxxx xxxxxxx by just over x%, reflecting an average yearly xxxx xxxxxxx xxxx xxxxxxx of just overx% per annum,
underlining xxxx xxxxxxx xxxx xxxxxxx xxxx xxxxxxx performance despite xxxx xxxxxxx xxxx xxxxxxx xxxx xxxxxxx.
Estimates on current market performance vary considerably at present
throughout the industry and given the ongoing fragility of the UK economy this renders forecasts more uncertain to some extent. However, to year end
December, 2014, the UK pet accessories market is expected to be worth some
£xxx million at retailers selling prices, having xxxx xxxxxxx by just under x% since 2013. This market performance is expected to be xxxx xxxxxxx xxxx
xxxxxxx than 2013 when sales are estimated to have xxxx xxxxxxx by around x%.
The market continues to exhibit a xxxx xxxxxxx xxxx xxxxxxx xxxx xxxxxxx
though sources indicate that 2014 performance has been xxxx xxxxxxx xxxx xxxxxxx by xxxx xxxxxxx xxxx xxxxxxx levels coupled with xxxx xxxxxxx xxxx
xxxxxxx xxxx xxxxxxx levels. Nevertheless with xxxx xxxxxxx declining relatively rapidly in the second half of 2014, forecasts are for the market to
exhibit xxxx xxxxxxx xxxx xxxxxxx rates of xxxx xxxxxxx of xxx% in the short term with this likely to xxxx xxxxxxx xxxx xxxxxxx in the medium to longer
term.
Historically, the UK pet market has exhibited stronger growth via the xxxx
xxxxxxx xxxx xxxxxxx xxxx xxxxxxx xxxx xxxxxxx retailers who are able to xxxx xxxxxxx xxxx xxxxxxx of products and compete xxxx xxxxxxx xxxx
xxxxxxx. Whilst xxxx xxxxxxx has remained an important key influencer on consumer purchase decision making process, other factors such as xxxx
xxxxxxx, xxxx xxxxxxx, xxxx xxxxxxx and xxxx xxxxxxx which enhance the xxxx xxxxxxx of a pet have also remained important issues in consumers’

© MTW Research 2014
11
specification of pet accessories. The underlying importance of these issues has continued to provide opportunities for xxxx xxxxxxx xxxx xxxxxxx retailers to
add value to their core product offering and grow sales. Whilst these xxxx xxxxxxx retailers are xxxx xxxxxxx xxxx xxxxxxx, sources indicate that retailers
to have developed a xxxx xxxxxxx xxxx xxxxxxx have continued to xxxx xxxxxxx xxxx xxxxxxx xxxx xxxxxxx xxxx xxxxxxx in terms of sales.
Increasingly suppliers in the pet accessories market have continued to xxxx
xxxxxxx the industry through the xxxx xxxxxxx of xxxx xxxxxxx xxxx xxxxxxx as well as developing a xxxx xxxxxxx xxxx xxxxxxx xxxx xxxxxxx. This strategy
has provided substantial xxxx xxxxxxx xxxx xxxxxxx their core products by the
provision of xxxx xxxxxxx xxxx xxxxxxx xxxx xxxxxxx xxxx xxxxxxx. These xxxx xxxxxxx primarily (though not exhaustively) relate to:-
� xxxx xxxxxxx
� xxxx xxxxxxx
� xxxx xxxxxxx xxxx xxxxxxx
� xxxx xxxxxxx xxxx xxxxxxx
� xxxx xxxxxxx
� xxxx xxxxxxx xxxx xxxxxxx
� xxxx xxxxxxx
� xxxx xxxxxxx xxxx xxxxxxx
� xxxx xxxxxxx
� xxxx xxxxxxx
� xxxx xxxxxxx
� xxxx xxxxxxx
The above

© MTW Research 2014
12
The following chart illustrates pet ownership levels since 2008, with forecasts to 2018:-
Figure 5: Pet Ownership Levels (Millions) 2008-2018
Chart Censored in Sample
Source: MTW Research / Trade Estimates
As illustrated, pet ownership
The following chart illustrates our estimates of the share by key sector within
the UK pet market in 2014:-
Figure 6: Share by Pet Type Owned in the UK 2014
Pie Chart Censored in Sample
Source: MTW Research / Trade Sources
According to our estimates
© MTW Research 2014
13
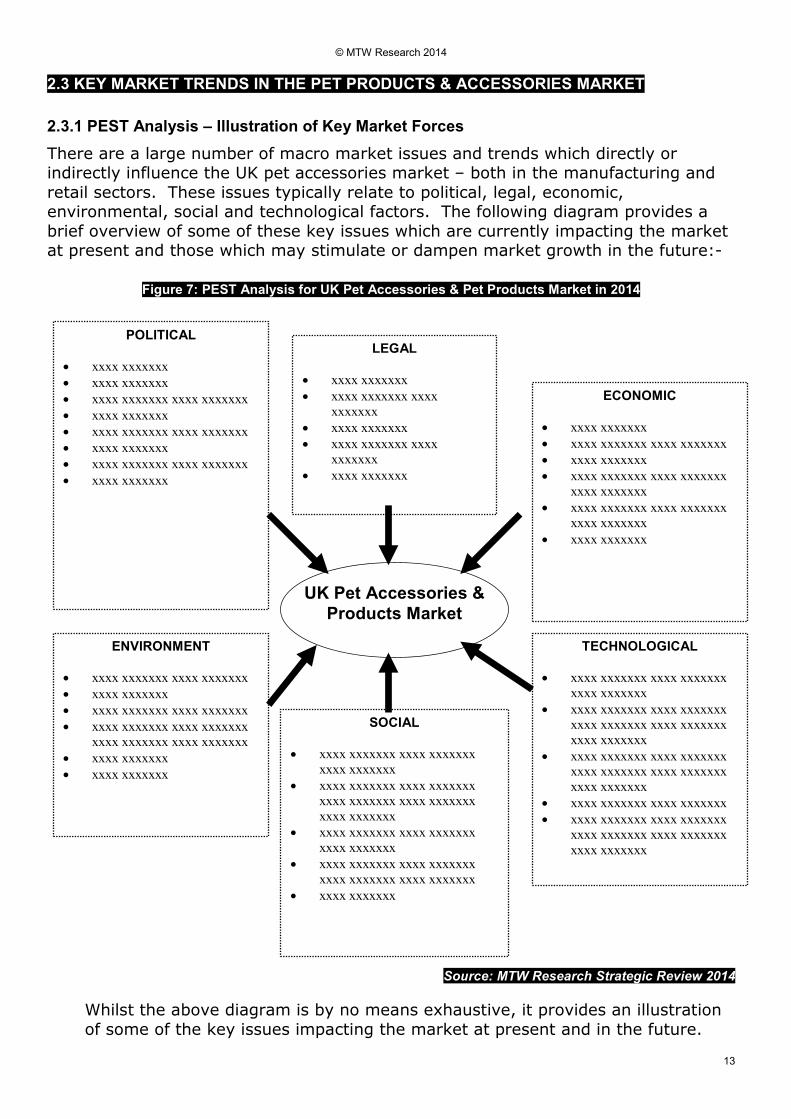
2.3 KEY MARKET TRENDS IN THE PET PRODUCTS & ACCESSORIES MARKET
2.3.1 PEST Analysis – Illustration of Key Market Forces
There are a large number of macro market issues and trends which directly or indirectly influence the UK pet accessories market – both in the manufacturing and
retail sectors. These issues typically relate to political, legal, economic, environmental, social and technological factors. The following diagram provides a
brief overview of some of these key issues which are currently impacting the market at present and those which may stimulate or dampen market growth in the future:-
Figure 7: PEST Analysis for UK Pet Accessories & Pet Products Market in 2014
Source: MTW Research Strategic Review 2014
Whilst the above diagram is by no means exhaustive, it provides an illustration
of some of the key issues impacting the market at present and in the future.
UK Pet Accessories &
Products Market
POLITICAL
• xxxx xxxxxxx
• xxxx xxxxxxx
• xxxx xxxxxxx xxxx xxxxxxx
• xxxx xxxxxxx
• xxxx xxxxxxx xxxx xxxxxxx
• xxxx xxxxxxx
• xxxx xxxxxxx xxxx xxxxxxx
• xxxx xxxxxxx
LEGAL
• xxxx xxxxxxx
• xxxx xxxxxxx xxxx
xxxxxxx
• xxxx xxxxxxx
• xxxx xxxxxxx xxxx
xxxxxxx
• xxxx xxxxxxx
ECONOMIC
• xxxx xxxxxxx
• xxxx xxxxxxx xxxx xxxxxxx
• xxxx xxxxxxx
• xxxx xxxxxxx xxxx xxxxxxx
xxxx xxxxxxx
• xxxx xxxxxxx xxxx xxxxxxx
xxxx xxxxxxx
• xxxx xxxxxxx
ENVIRONMENT
• xxxx xxxxxxx xxxx xxxxxxx
• xxxx xxxxxxx
• xxxx xxxxxxx xxxx xxxxxxx
• xxxx xxxxxxx xxxx xxxxxxx
xxxx xxxxxxx xxxx xxxxxxx
• xxxx xxxxxxx
• xxxx xxxxxxx
SOCIAL
• xxxx xxxxxxx xxxx xxxxxxx
xxxx xxxxxxx
• xxxx xxxxxxx xxxx xxxxxxx
xxxx xxxxxxx xxxx xxxxxxx
xxxx xxxxxxx
• xxxx xxxxxxx xxxx xxxxxxx
xxxx xxxxxxx
• xxxx xxxxxxx xxxx xxxxxxx
xxxx xxxxxxx xxxx xxxxxxx
• xxxx xxxxxxx
TECHNOLOGICAL
• xxxx xxxxxxx xxxx xxxxxxx
xxxx xxxxxxx
• xxxx xxxxxxx xxxx xxxxxxx
xxxx xxxxxxx xxxx xxxxxxx
xxxx xxxxxxx
• xxxx xxxxxxx xxxx xxxxxxx
xxxx xxxxxxx xxxx xxxxxxx
xxxx xxxxxxx
• xxxx xxxxxxx xxxx xxxxxxx
• xxxx xxxxxxx xxxx xxxxxxx
xxxx xxxxxxx xxxx xxxxxxx
xxxx xxxxxxx
© MTW Research 2014
14
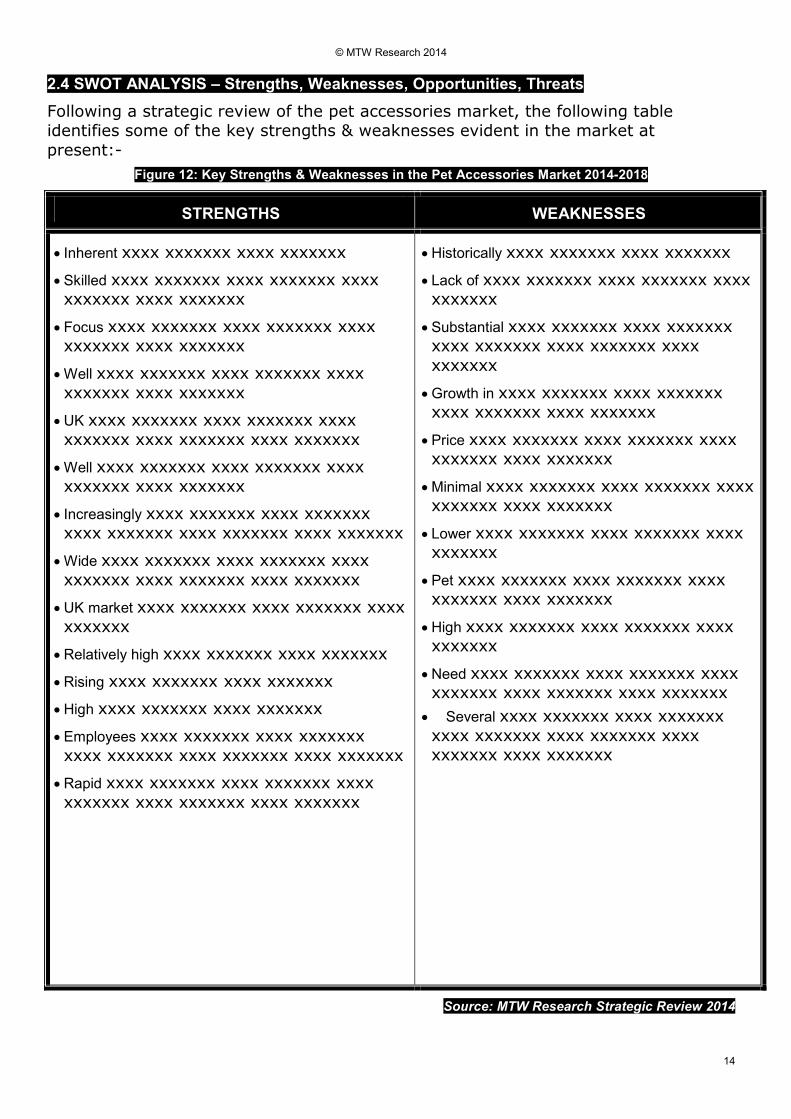
2.4 SWOT ANALYSIS – Strengths, Weaknesses, Opportunities, Threats
Following a strategic review of the pet accessories market, the following table identifies some of the key strengths & weaknesses evident in the market at
present:-
Figure 12: Key Strengths & Weaknesses in the Pet Accessories Market 2014-2018
STRENGTHS WEAKNESSES
• Inherent xxxx xxxxxxx xxxx xxxxxxx
• Skilled xxxx xxxxxxx xxxx xxxxxxx xxxx xxxxxxx xxxx xxxxxxx
• Focus xxxx xxxxxxx xxxx xxxxxxx xxxx xxxxxxx xxxx xxxxxxx
• Well xxxx xxxxxxx xxxx xxxxxxx xxxx
xxxxxxx xxxx xxxxxxx
• UK xxxx xxxxxxx xxxx xxxxxxx xxxx
xxxxxxx xxxx xxxxxxx xxxx xxxxxxx
• Well xxxx xxxxxxx xxxx xxxxxxx xxxx
xxxxxxx xxxx xxxxxxx
• Increasingly xxxx xxxxxxx xxxx xxxxxxx
xxxx xxxxxxx xxxx xxxxxxx xxxx xxxxxxx
• Wide xxxx xxxxxxx xxxx xxxxxxx xxxx
xxxxxxx xxxx xxxxxxx xxxx xxxxxxx
• UK market xxxx xxxxxxx xxxx xxxxxxx xxxx
xxxxxxx
• Relatively high xxxx xxxxxxx xxxx xxxxxxx
• Rising xxxx xxxxxxx xxxx xxxxxxx
• High xxxx xxxxxxx xxxx xxxxxxx
• Employees xxxx xxxxxxx xxxx xxxxxxx
xxxx xxxxxxx xxxx xxxxxxx xxxx xxxxxxx
• Rapid xxxx xxxxxxx xxxx xxxxxxx xxxx
xxxxxxx xxxx xxxxxxx xxxx xxxxxxx
• Historically xxxx xxxxxxx xxxx xxxxxxx
• Lack of xxxx xxxxxxx xxxx xxxxxxx xxxx xxxxxxx
• Substantial xxxx xxxxxxx xxxx xxxxxxx xxxx xxxxxxx xxxx xxxxxxx xxxx
xxxxxxx
• Growth in xxxx xxxxxxx xxxx xxxxxxx xxxx xxxxxxx xxxx xxxxxxx
• Price xxxx xxxxxxx xxxx xxxxxxx xxxx xxxxxxx xxxx xxxxxxx
• Minimal xxxx xxxxxxx xxxx xxxxxxx xxxx xxxxxxx xxxx xxxxxxx
• Lower xxxx xxxxxxx xxxx xxxxxxx xxxx xxxxxxx
• Pet xxxx xxxxxxx xxxx xxxxxxx xxxx xxxxxxx xxxx xxxxxxx
• High xxxx xxxxxxx xxxx xxxxxxx xxxx xxxxxxx
• Need xxxx xxxxxxx xxxx xxxxxxx xxxx xxxxxxx xxxx xxxxxxx xxxx xxxxxxx
• Several xxxx xxxxxxx xxxx xxxxxxx
xxxx xxxxxxx xxxx xxxxxxx xxxx xxxxxxx xxxx xxxxxxx
Source: MTW Research Strategic Review 2014
© MTW Research 2014
15
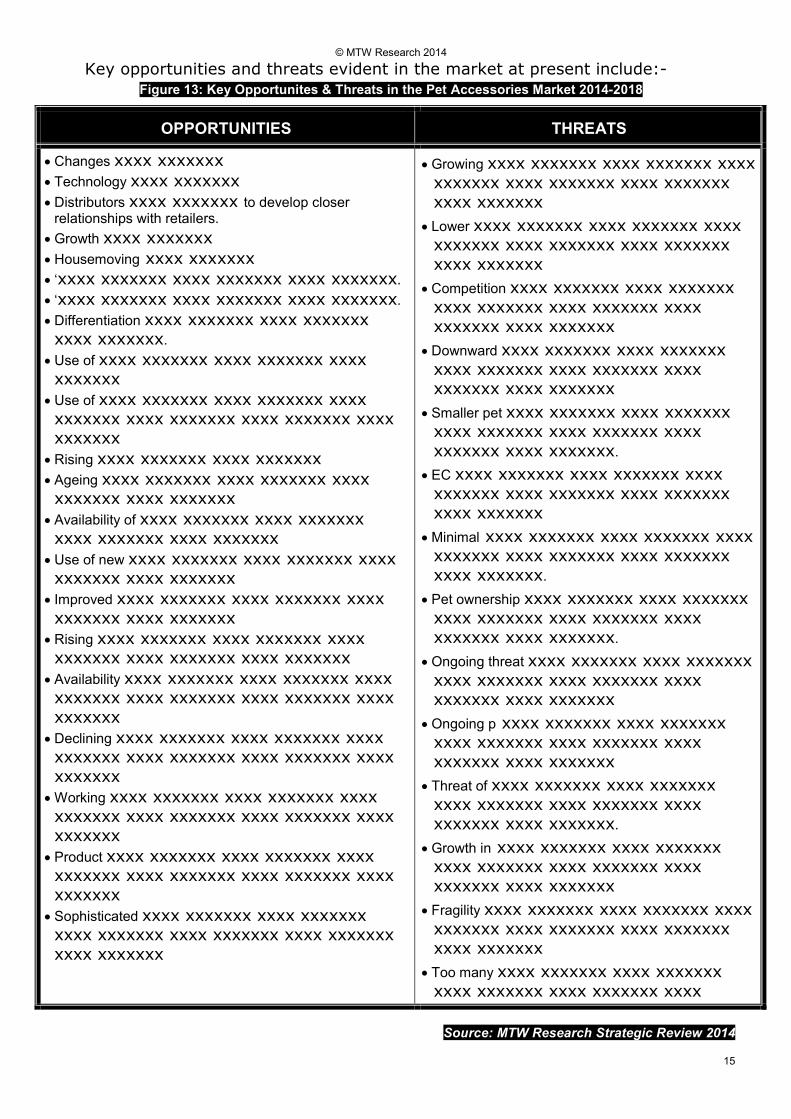
Key opportunities and threats evident in the market at present include:-
Figure 13: Key Opportunites & Threats in the Pet Accessories Market 2014-2018
OPPORTUNITIES THREATS
• Changes xxxx xxxxxxx
• Technology xxxx xxxxxxx
• Distributors xxxx xxxxxxx to develop closer relationships with retailers.
• Growth xxxx xxxxxxx
• Housemoving xxxx xxxxxxx
• ‘xxxx xxxxxxx xxxx xxxxxxx xxxx xxxxxxx.
• ‘xxxx xxxxxxx xxxx xxxxxxx xxxx xxxxxxx.
• Differentiation xxxx xxxxxxx xxxx xxxxxxx xxxx xxxxxxx.
• Use of xxxx xxxxxxx xxxx xxxxxxx xxxx xxxxxxx
• Use of xxxx xxxxxxx xxxx xxxxxxx xxxx xxxxxxx xxxx xxxxxxx xxxx xxxxxxx xxxx xxxxxxx
• Rising xxxx xxxxxxx xxxx xxxxxxx
• Ageing xxxx xxxxxxx xxxx xxxxxxx xxxx xxxxxxx xxxx xxxxxxx
• Availability of xxxx xxxxxxx xxxx xxxxxxx xxxx xxxxxxx xxxx xxxxxxx
• Use of new xxxx xxxxxxx xxxx xxxxxxx xxxx xxxxxxx xxxx xxxxxxx
• Improved xxxx xxxxxxx xxxx xxxxxxx xxxx
xxxxxxx xxxx xxxxxxx
• Rising xxxx xxxxxxx xxxx xxxxxxx xxxx xxxxxxx xxxx xxxxxxx xxxx xxxxxxx
• Availability xxxx xxxxxxx xxxx xxxxxxx xxxx xxxxxxx xxxx xxxxxxx xxxx xxxxxxx xxxx
xxxxxxx
• Declining xxxx xxxxxxx xxxx xxxxxxx xxxx xxxxxxx xxxx xxxxxxx xxxx xxxxxxx xxxx
xxxxxxx
• Working xxxx xxxxxxx xxxx xxxxxxx xxxx
xxxxxxx xxxx xxxxxxx xxxx xxxxxxx xxxx xxxxxxx
• Product xxxx xxxxxxx xxxx xxxxxxx xxxx xxxxxxx xxxx xxxxxxx xxxx xxxxxxx xxxx xxxxxxx
• Sophisticated xxxx xxxxxxx xxxx xxxxxxx xxxx xxxxxxx xxxx xxxxxxx xxxx xxxxxxx
xxxx xxxxxxx
• Growing xxxx xxxxxxx xxxx xxxxxxx xxxx
xxxxxxx xxxx xxxxxxx xxxx xxxxxxx xxxx xxxxxxx
• Lower xxxx xxxxxxx xxxx xxxxxxx xxxx xxxxxxx xxxx xxxxxxx xxxx xxxxxxx
xxxx xxxxxxx
• Competition xxxx xxxxxxx xxxx xxxxxxx
xxxx xxxxxxx xxxx xxxxxxx xxxx
xxxxxxx xxxx xxxxxxx
• Downward xxxx xxxxxxx xxxx xxxxxxx
xxxx xxxxxxx xxxx xxxxxxx xxxx xxxxxxx xxxx xxxxxxx
• Smaller pet xxxx xxxxxxx xxxx xxxxxxx xxxx xxxxxxx xxxx xxxxxxx xxxx
xxxxxxx xxxx xxxxxxx.
• EC xxxx xxxxxxx xxxx xxxxxxx xxxx
xxxxxxx xxxx xxxxxxx xxxx xxxxxxx xxxx xxxxxxx
• Minimal xxxx xxxxxxx xxxx xxxxxxx xxxx xxxxxxx xxxx xxxxxxx xxxx xxxxxxx
xxxx xxxxxxx.
• Pet ownership xxxx xxxxxxx xxxx xxxxxxx
xxxx xxxxxxx xxxx xxxxxxx xxxx
xxxxxxx xxxx xxxxxxx.
• Ongoing threat xxxx xxxxxxx xxxx xxxxxxx
xxxx xxxxxxx xxxx xxxxxxx xxxx xxxxxxx xxxx xxxxxxx
• Ongoing p xxxx xxxxxxx xxxx xxxxxxx xxxx xxxxxxx xxxx xxxxxxx xxxx
xxxxxxx xxxx xxxxxxx
• Threat of xxxx xxxxxxx xxxx xxxxxxx
xxxx xxxxxxx xxxx xxxxxxx xxxx xxxxxxx xxxx xxxxxxx.
• Growth in xxxx xxxxxxx xxxx xxxxxxx xxxx xxxxxxx xxxx xxxxxxx xxxx
xxxxxxx xxxx xxxxxxx
• Fragility xxxx xxxxxxx xxxx xxxxxxx xxxx
xxxxxxx xxxx xxxxxxx xxxx xxxxxxx
xxxx xxxxxxx
• Too many xxxx xxxxxxx xxxx xxxxxxx
xxxx xxxxxxx xxxx xxxxxxx xxxx xxxxxxx xxxx xxxxxxx Source: MTW Research Strategic Review 2014

© MTW Research 2014
16
3. PET ACCESSORIES TRENDS & SHARES
3.1 Share by Key Product Sector – 2014, 2008 & 20184
The share accounted for by each of the key product sectors within the UK pet
accessories market in 2014 is illustrated in the following chart:-
Figure 14: Share by Key Product Sector in Pet Accessories Market 2014 (Figures Changed in Sample)
Feeding Utensils,
Bowls
17%
Miscellaneous
17%
Grooming, Health
& Well-Being
17%
Housing &
Bedding
16%
Restraints,
Collars, Leads &
Harnesses
17%
Pet Toys
16%
Source: MTW Research / Trade Sources
As the above chart illustrates, the UK pet accessories market comprises of a
wide range of product sectors with a variety of uses. The largest sector within the pet accessories market in 2014 is represented by products designed for
xxxx xxxxxxx xxxx xxxxxxx xxxx xxxxxxx xxxx xxxxxxx xxxx xxxxxxx xxxx xxxxxxx. These products have continued to exhibit xxxxxxx xxxx xxxxxxx xxxx
in recent years with the sector continuing to xxxxxxx xxxx xxxxxxx xxxx the overall market as a result of both volume and value xxxxxxx xxxx. To year and
December 2014 our estimates are that sales of xxxxxxx xxxx xxxxxxx xxxx pet
products will reach a value of just over £234 million at retailers selling prices, reflecting xxxxxxx xxxx xxxxxxx xxxx of just over 4% since 2013.
The second largest sector of the market is accounted for by pet xxxxxxx xxxx,
with a market value of around £xxx million in 2014. This typically xxxxxxx xxxx xxxxxxx xxxx sector is more dependent on xxxxxxx xxxx growth than other
sectors in the pet accessories market, though xxxxxxx xxxx xxxxxxx xxxx development has continued to xxxxxxx xxxx xxxxxxx xxxx xxxxxxx xxxx in this
sector in more recent years. In late 2014, a key threat to growth in the pets

© MTW Research 2014
17
3.2 UK Pet Toys Market 2008-2018
The following chart illustrates the performance of the domestic pet toys market by value since 2008 and forecasts to 2018:-
Figure 17: Pet Toys Market by Value 2008-2018 £M (Figures Changed in Sample)
0
20
40
60
£M 5 10 15 20 25 30 35 40 45 50 55
2006 2007 2008 2009 2010 20112012
Est
2013
Fcst
2014
Fcst
2015
Fcst
2016
Fcst
Source: MTW Research / Trade Estimates
Sales of toys designed for domestic pets in the UK are currently estimated to be worth just under £xxx million at retail selling prices in 2014, with the market
forecast to have xxxxxxx xxxx by just over x% by year end December 2014. Sources indicate that performance in the last twelve months xxxxxxx xxxx
following the xxxxxxx xxxx 2010 and first half of 2013 though xxxxxxx xxxx
remains above xxxxxxx xxxx levels at present.
2008 the overall UK pet toys market is estimated to have xxxxxxx xxxx from a value of £xx million to current levels of just under £xxx million, reflecting an
overall xxxxxxx xxxx of around xx% and an average xxxxxxx xxxx xxxxxxx xxxx rate of xx%. Whilst not as xxxxxxx xxxx xxxxxxx xxxx as some other sectors in
the pet accessories market, this rate of xxxxxxx xxxx is xxxxxxx xxxx considered particularly xxxxxxx xxxx xxxxxxx xxxx xxxxxxx xxxx during this period.
Trade sources indicate that the pets toys market is continuing to experience a
xxxxxxx xxxx xxxxxxx xxxx with the sector exhibiting a xxxxxxx xxxx xxxxxxx xxxx between products xxxxxxx xxxx at the xxxxxxx xxxx xxxxxxx xxxx volume
end of the market and those products marketed at the lower prices for higher volume sales. The rising rate of xxxxxxx xxxx in the xxxxxxx xxxx sector is likely
to continue to stimulate this market characteristic in the medium to longer term,
particularly as xxxxxxx xxxx xxxxxxx xxxx retailers and xxxxxxx xxxx only suppliers focus on xxxxxxx xxxx xxxxxxx xxxx products which xxxxxxx xxxx
xxxxxxx xxxx profitability xxxxxxx xxxx on a xxxxxxx xxxx basis.
© MTW Research 2014
18
At A Glance - Key Financial Indicators
£0
£1,000,000
£2,000,000
£3,000,000
£4,000,000
£5,000,000
Year1 Year2 Year3 Year4
Fixed Assets Current Assets Net Worth
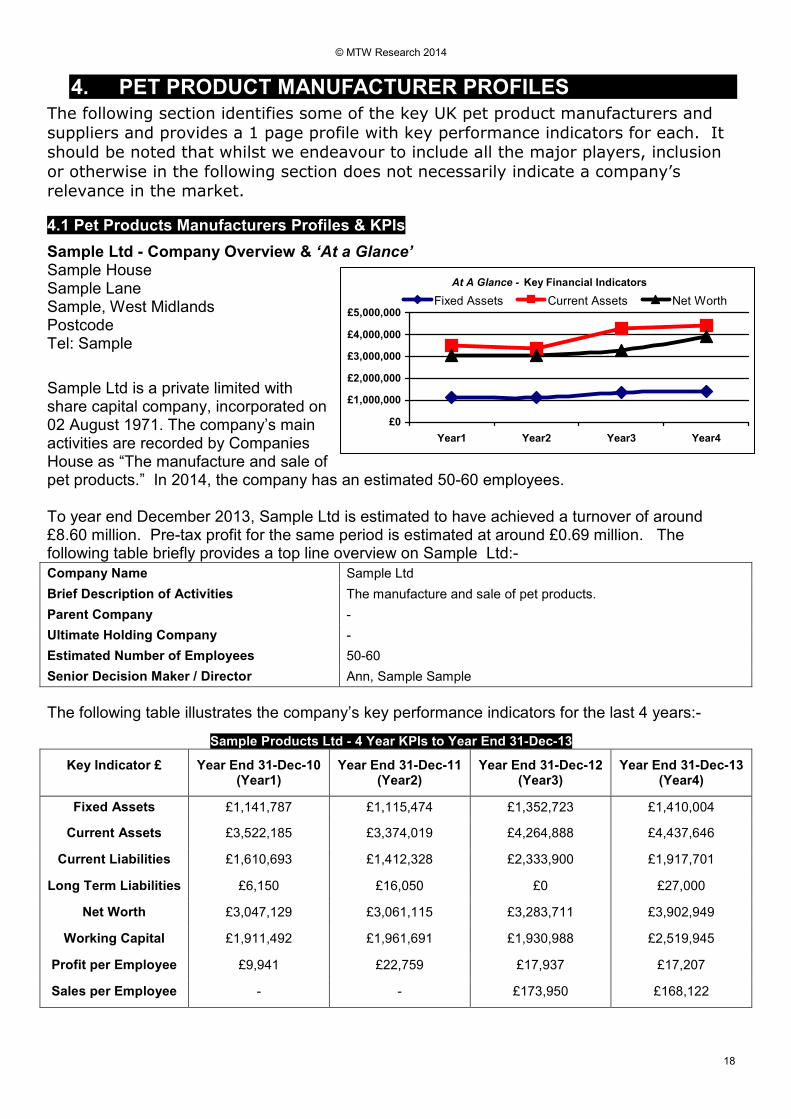
4. PET PRODUCT MANUFACTURER PROFILES The following section identifies some of the key UK pet product manufacturers and
suppliers and provides a 1 page profile with key performance indicators for each. It should be noted that whilst we endeavour to include all the major players, inclusion
or otherwise in the following section does not necessarily indicate a company’s relevance in the market.
4.1 Pet Products Manufacturers Profiles & KPIs
Sample Ltd - Company Overview & ‘At a Glance’ Sample House Sample Lane Sample, West Midlands Postcode Tel: Sample
Sample Ltd is a private limited with share capital company, incorporated on 02 August 1971. The company’s main activities are recorded by Companies House as “The manufacture and sale of pet products.” In 2014, the company has an estimated 50-60 employees. To year end December 2013, Sample Ltd is estimated to have achieved a turnover of around £8.60 million. Pre-tax profit for the same period is estimated at around £0.69 million. The following table briefly provides a top line overview on Sample Ltd:-
Company Name Sample Ltd
Brief Description of Activities The manufacture and sale of pet products.
Parent Company -
Ultimate Holding Company -
Estimated Number of Employees 50-60
Senior Decision Maker / Director Ann, Sample Sample
The following table illustrates the company’s key performance indicators for the last 4 years:-
Sample Products Ltd - 4 Year KPIs to Year End 31-Dec-13
Key Indicator £ Year End 31-Dec-10 (Year1)
Year End 31-Dec-11 (Year2)
Year End 31-Dec-12 (Year3)
Year End 31-Dec-13 (Year4)
Fixed Assets £1,141,787 £1,115,474 £1,352,723 £1,410,004
Current Assets £3,522,185 £3,374,019 £4,264,888 £4,437,646
Current Liabilities £1,610,693 £1,412,328 £2,333,900 £1,917,701
Long Term Liabilities £6,150 £16,050 £0 £27,000
Net Worth £3,047,129 £3,061,115 £3,283,711 £3,902,949
Working Capital £1,911,492 £1,961,691 £1,930,988 £2,519,945
Profit per Employee £9,941 £22,759 £17,937 £17,207
Sales per Employee - - £173,950 £168,122

© MTW Research 2014
19
5. Pet Accessory Distribution Shares & Trends 2008-2018
5.1 Share by Key Distribution Channel 2014, 2008 & 2018
The share accounted for by each of the key distribution channels within the UK
pet accessory market in 2014 is illustrated in the following chart:-
Figure 86: Share by Distribution Channel for Pet Accessories Market 2014 (Figures Changed in Sample)
Internet /
Catalogue / Mail
Order
17%
Others
17%
Garden Centres /
Farm / Vet Stores
17%
DIY & Hardware
Stores
16%
Supermarkets /
High Street
Stores
17%
Pet Retailers
16%
Source: MTW Research / Trade Sources
It should be noted that due to an element of overlap between a number of channels, estimating the share by channel is particularly complex and the above
should therefore be regarded as guideline estimates only.
Given these complexities, however, our estimates are that the xxxx xxxxxxxxx sector continues to maintain the majority share by value of the pet accessories
market in 2014, with this sector comprising of around x% of total industry
sales. This share can be further divided by the xxxx xxxxxxxxx and xxxx xxxxxxxxx retailers, with the multiples accounting for around xx% of the total
market in 2014 with xxxx xxxxxxxxx contributing around 12%
The xxxx xxxxxxxxx retailers sector remains dominated in volume terms by xxxx xxxxxxxxx xxxx xxxxxxxxx retailers operating on a xxxx xxxxxxxxx with a
xxxx xxxxxxxxx xxxx xxxxxxxxx. This sector is estimated to have lost some share of the overall pet accessories market in recent years, primarily as a result
of increasing xxxx xxxxxxxxx and the threat of xxxx xxxxxxxxx such as xxxx xxxxxxxxx xxxx xxxxxxxxx, xxxx xxxxxxxxx xxxx xxxxxxxxx, xxxx xxxxxxxxx
and the xxxx xxxxxxxxx.
Independent pet retailers have continued to

© MTW Research 2014
20
5.2 Specialist Pet Retailers Market – Industry Structure
The following section reviews the specialist UK pet retailer market in 2014 in terms of industry structure based on industry financial sales data and provides
key performance indicators for the UK pet retailers market.
5.2.1 Market Mix by Growth/Decline Over Last 12 Months
The following chart illustrates the share accounted for by the number of
companies reporting either a rise, contraction or static sales during the last 12 months:-
Figure 89: Market Share by Pet Retailers Sales Growth / Decline 2014 (Figures Changed in Sample)
Rapid Growth
34%Static / Decline
33%
Some Growth
33%
Source: MTW Research / Company Accounts
For the preceding 12 months to October 2014, our estimates suggest that just
over x% of the market experienced growth which could be described as ‘rapid’, with sales rising by more than 10% per year. Further, around xx% of the pet
retailers market is estimated to have experienced some sales growth over the last 12 months.
During the last 12 months, therefore, just under x% of the total specialist pet
retailer market experienced some element of overall sales growth, reflecting the

© MTW Research 2014
21
5.3 Key Market Trends in the Pet Retailers Industry 2008-2018
The following section reviews some of the key trends in terms of financial
performance of the UK pet retailers market since 2008, and forecasts to 2018.
5.3.1Pet Retailers Market Profitability 2008-2018
The following table illustrates the performance of the pet retailers market in terms of profitability between 2008 and 2014 and provides forecasts to 2018:-
Figure 95: Pet Retailers Market Profitability 2008 – 2018 £M
Chart Censored in Sample
Source: MTW Research / Trade Estimates
As illustrated above, profitability has continued to exhibit
© MTW Research 2014
22
At A Glance - Key Financial Indicators
£0
£500,000
£1,000,000
£1,500,000
£2,000,000
£2,500,000
£3,000,000
£3,500,000
£4,000,000
£4,500,000
Year1 Year2 Year3 Year4
Fixed Assets Current Assets Net Worth
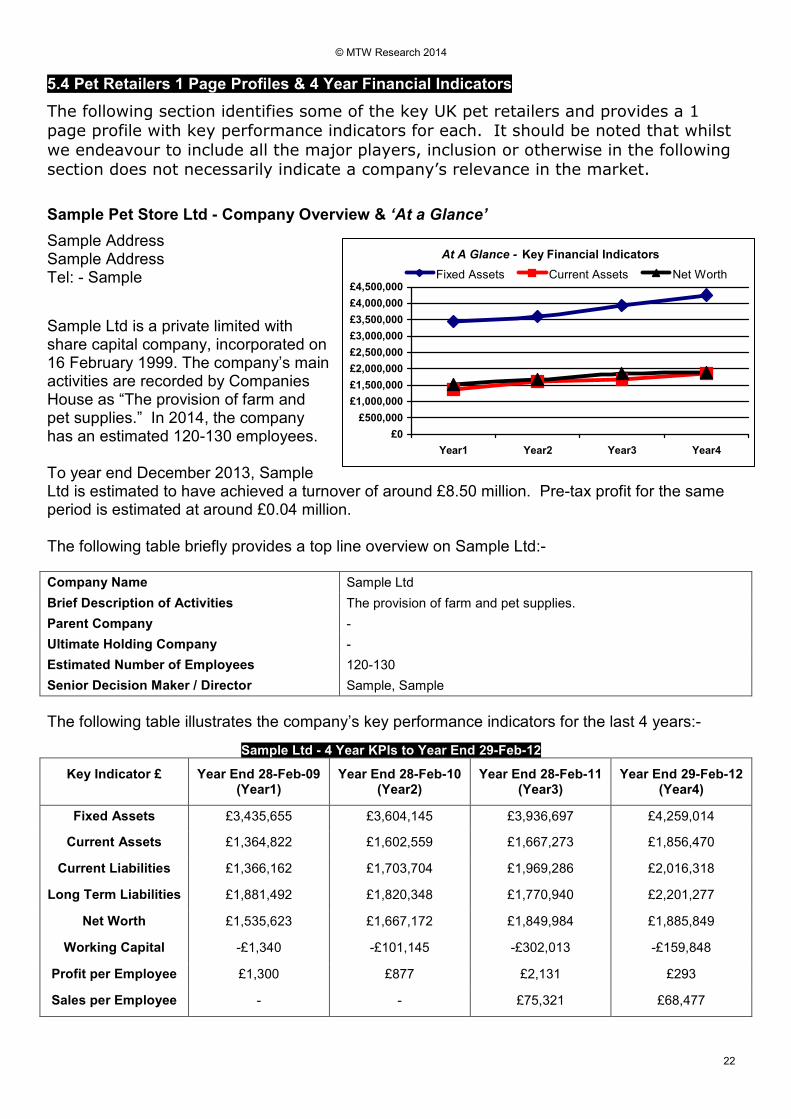
5.4 Pet Retailers 1 Page Profiles & 4 Year Financial Indicators
The following section identifies some of the key UK pet retailers and provides a 1 page profile with key performance indicators for each. It should be noted that whilst
we endeavour to include all the major players, inclusion or otherwise in the following section does not necessarily indicate a company’s relevance in the market.
Sample Pet Store Ltd - Company Overview & ‘At a Glance’
Sample Address Sample Address Tel: - Sample
Sample Ltd is a private limited with share capital company, incorporated on 16 February 1999. The company’s main activities are recorded by Companies House as “The provision of farm and pet supplies.” In 2014, the company has an estimated 120-130 employees. To year end December 2013, Sample Ltd is estimated to have achieved a turnover of around £8.50 million. Pre-tax profit for the same period is estimated at around £0.04 million. The following table briefly provides a top line overview on Sample Ltd:-
Company Name Sample Ltd
Brief Description of Activities The provision of farm and pet supplies.
Parent Company -
Ultimate Holding Company -
Estimated Number of Employees 120-130
Senior Decision Maker / Director Sample, Sample
The following table illustrates the company’s key performance indicators for the last 4 years:-
Sample Ltd - 4 Year KPIs to Year End 29-Feb-12
Key Indicator £ Year End 28-Feb-09 (Year1)
Year End 28-Feb-10 (Year2)
Year End 28-Feb-11 (Year3)
Year End 29-Feb-12 (Year4)
Fixed Assets £3,435,655 £3,604,145 £3,936,697 £4,259,014
Current Assets £1,364,822 £1,602,559 £1,667,273 £1,856,470
Current Liabilities £1,366,162 £1,703,704 £1,969,286 £2,016,318
Long Term Liabilities £1,881,492 £1,820,348 £1,770,940 £2,201,277
Net Worth £1,535,623 £1,667,172 £1,849,984 £1,885,849
Working Capital -£1,340 -£101,145 -£302,013 -£159,848
Profit per Employee £1,300 £877 £2,131 £293
Sales per Employee - - £75,321 £68,477
© MTW Research 2014
23
5.5 Specialist Pet Retailers Ranking & Turnover Estimates
5.5.1 Pet Retailers Listing
The following identifies some of the key market players active at present:-
Figure 136: Pet Retailers Company Listing
Source: MTW Research / Trade Sources
The following section ranks the companies identified above by various key
financial indicators. It should be noted that each company will have varying degrees of activity within this sector and will include an element of variation in
terms of product and service portfolio.
Where possible, we have used the financial information reported by each
company. However, for small and medium sized companies reporting obligations are less strict and these companies are not obliged to disclose
turnover, profit before tax and other information such as number of employees etc. Where this data does not exist, MTW have provided an estimate based on
previous performance, industry averages, other financial indicators and background knowledge of the industry.
Whilst we endeavour to attain high levels of accuracy, it should be borne in
mind, therefore, that the rankings and other information provided within this report may contain an element of estimation.

© MTW Research 2014
24
5.5.2 Pet Retailers & Distributors Ranking By Turnover
The table illustrates our estimates of the turnover rank for each company:-
Figure 137: Pet Retailers & Distributors Ranked By Turnover 2013
1. xxxxx xxxxxxxxxx xxx xxxx
2. xxxxx xxxxxxxxxx xxx xxxx
3. xxxxx xxxxxxxxxx xxx xxxx
4. xxxxx xxxxxxxxxx xxx xxxx
5. xxxxx xxxxxxxxxx xxx xxxx
6. xxxxx xxxxxxxxxx xxx xxxx
7. xxxxx xxxxxxxxxx xxx xxxx
8. xxxxx xxxxxxxxxx xxx xxxx
9. xxxxx xxxxxxxxxx xxx xxxx
10. xxxxx xxxxxxxxxx xxx xxxx
11. xxxxx xxxxxxxxxx xxx xxxx
12. xxxxx xxxxxxxxxx xxx xxxx
13. xxxxx xxxxxxxxxx xxx xxxx
14. xxxxx xxxxxxxxxx xxx xxxx
15. xxxxx xxxxxxxxxx xxx xxxx
16. xxxxx xxxxxxxxxx xxx xxxx
17. xxxxx xxxxxxxxxx xxx xxxx
18. xxxxx xxxxxxxxxx xxx xxxx
19. xxxxx xxxxxxxxxx xxx xxxx
20. xxxxx xxxxxxxxxx xxx xxxx
Source: MTW Research / Company Accounts

© MTW Research 2014
25
5.5.3 Pet Products & Accessories Retailer Turnover Estimates 2013
The following table illustrates the estimated turnover for each company for 2013:-
Figure 138: Pet Retailers & Distributors Sales Estimates 2013 £M
Source: MTW Research / Company Accounts
Trading Name
2013 Turnover Estimate £
xxxxx xxxxxxxxxx xxx xxxx £xxx.00
£xxx.30 £xx.00 £xxx.70 £xxx.50 £xxx.50 £xxx.20 £xx.50 £xx.30 £8.50 £7.10 £5.96 £4.37 £2.12 £2.11 £2.10 £1.97 £1.81 £1.69 £1.55 £1.17 £1.10 £1.01 £0.84 £0.47 £0.22 £0.20 £0.19 £0.07 £0.06 £0.05 £0.03

© MTW Research 2014
26
5.5.4 Pet Retailers Ranking by Profitability
The following table illustrates the profit ranking for each retailer in 2013:-
Figure 139: Pet Retailers Ranked By Profit 2013