report - world food programme 2010 cfsva+n_shorter version... · office national de nutrition...
TRANSCRIPT

Comprehensive Food and Nutrition Security and Vulnerability Analysis (CFSVA+N)
MADAGASCAR
Data collected in August/September 2010
In partnership with:
Office National de Nutrition VPM/Santé Publique The Gates Foundation IFAD UNDP Institut National de la Statistique Direction Générale de la Météorologie DSEC/Statistique Agricole
REPORT

CFSVA+N Madagascar 2010
2
Rural Madagascar Comprehensive Food and Nutrition Security and Vulnerability Analysis November 2011
Experts from different organizations have contributed to the drafting of this report; Maherisoa Rakotonirainy (VAM Officer, WFP), Isabelle Nirina (Data Analyst, WFP), Chiara Brunelli (Food Security Analyst, WFP), Rijasoa Rakotoarinoro (M&E/GIS, WFP), Amal Tucker Brown (Nutrition Specialist, UNICEF ), Paola Valenti (Nutrition Manager UNICEF). The report has been reviewed and cleared by the nutrition cluster and the food security and livelihood cluster. The study was funded by UNICEF and WFP with financial support from the Bill and Melinda Gates Foundation, IFAD and UNDP. The views expressed herein can in no way be taken to reflect the official opinion of the donor. For information about Food Security Analysis, visit www.wfp.org/food-security For information about nutrition security, visit http://www.unicef.org/nutrition/index_4050.html For questions or comments concerning any aspect of the survey and this report, please contact: WFP Madagascar Mr Maherisoa Rakotonirainy [email protected] Ms Isabelle Nirina [email protected] Ms Katy Elliott [email protected] UNICEF Madagascar Ms Amal Tucker Brown [email protected] Ms Karine Coudert [email protected] WFP Regional Bureau (OMJ – Johannesburg) Mr Eric Kenefick [email protected] WFP Headquarters (OMXF – Rome) Mr Siemon Hollema [email protected] Ms Chiara Brunelli [email protected] UNICEF Region Bureau (ESARO) Saba Mebrahtu [email protected]
ONN Lalaharizaka Andriantsarafara [email protected] Mr Jean- François Coordonnateur National ONN [email protected] Ministère de la Santé Dr Olivier Razafinimananana [email protected] Dr Simon Rakotonirina (Directeur de la santé de la mère et de l’enfant)[email protected]

CFSVA+N Madagascar 2010
3
Foreword
Madagascar remains a low-income, food deficit country with a high level of undernutrition. UNICEF and WFP country offices continue to support Madagascar in efforts to achieve the Millennium Development Goal (MDG) of eradicating extreme poverty and hunger in the country by 2015. Since the beginning of 2009, major political and economical changes have occurred in Madagascar resulting in the country suffering from a diminished capacity to monitor and plan for food and nutritional insecurity and establish a solid and comprehensive baseline data to take into consideration the impact of the deep changes that the Country has experienced. Furthermore, as clearly evident in several food security- and nutrition- focused surveys, the relationship between food security and nutrition in Madagascar is quite complex.
In response to the situation, in 2010 , UNICEF and WFP carried out a joint Comprehensive Food and Nutrition Security and Vulnerability Analysis (CFSVA+N). Information on household livelihoods, food and nutrition security and vulnerability was compiled and critically analysed through an innovative methodological approach. Most importantly, the study aims to identify the underlying causes of food insecurity and malnutrition, the impact of shocks and households ability to cope. With answers to these questions, policymakers can be guided in responding appropriately to reduce vulnerability. Sincere gratitude is extended to all the cluster members for their valuable input and support during this exercise, especially the Office National de Nutrition (ONN), the Ministère de la Santé Publique, the Institut National de la Statistique (INSTAT), Direction Générale de la Météorologie and the Direction du Suivi Evaluation et de la Communication/Statistique Agricole. Special thanks go to the Bill and Melinda Gates Foundation, IFAD and UNDP for providing financial resources to implement the CFSVA+N exercise. Without these resources, the study would not have been possible. We hope that this report will shed further light on the food and nutrition security situation in Madagascar.
Krystyna Bednarska Bruno Maes Country Director Country Representative WFP Madagascar UNICEF Madagascar

CFSVA+N Madagascar 2010
4
Acknowledgements This report is the outcome of a collaborative process that began in January 2010 and would not have been possible without the contribution of many individuals and organizations. First and foremost, however, the World Food Programme (WFP) and the United Nations Children Emergency Funds (UNICEF) are grateful for the support of the technical departments of the Office National de Nutrition (ONN), of the Ministère de l’ Agriculture and of the Ministère de la Santé Publique, the Chefs de Région and the local authorities. Colleagues from UN system agencies and civil society organisations participating also provided insights and suggestions during the preparatory and implementation phases of the survey. In particular, thanks go to the members of the “Food Security and Livelihood” Cluster and those of the “Nutrition” Cluster in Madagascar. In turn, and in large measure, the survey could never have been implemented without the dedicated participation and professionalism of:
- WFP Madagascar, the VAM Officer Maherisoa Rakotonirainy and the VAM Assistants Isabelle Nirina and Rijasoa Rakotoarinoro. Special appreciation and thanks go to Olga Keita.
- UNICEF Madagascar, the Nutrition Specialist Amal Tucker Brown, the Nutrition Manager Paola Valenti, and Bradley (Woody) Woodruff. Special appreciation and thanks go to Valerie Taton.
- All the CFSVA+N Team members – especially during the data collection phase. Technical assistance during various stages of the process was provided by Eric Kenefick, Sylvie Montembault, Veronica Rammala, from the WFP Regional Bureau in Johannesburg, and from Joyce Luma, Siemon Hollema, Chiara Brunelli, Oscar Gobbato, Rogerio Bonifacio, Ceren Gurkan, Issa Sanogo from the VAM Unit in WFP Headquarters, by Saba Mebrahtu from the UNICEF Regional Bureau in Nairobi. A final token of appreciation goes to the Bill and Melinda Gates Foundation, IFAD and UNDP who provided the additional resources necessary to carry out such an effort and for which WFP and UNICEF are grateful.

CFSVA+N Madagascar 2010
5
Table of Contents
Foreword ..................................................................................................................................................... 3
Acknowledgements ..................................................................................................................................... 4
Acronyms .................................................................................................................................................... 7
KEY FINDINGS ........................................................................................................................................... 8
Food security and vulnerability ................................................................................................................ 8
Nutrition security ..................................................................................................................................... 9
CONTEXT ................................................................................................................................................... 11
METHODOLOGY ..................................................................................................................................... 11
BACKGROUND ........................................................................................................................................... 14
1. FOOD CONSUMPTION ........................................................................................................................ 16
2. STATE OF FOOD INSECURITY .............................................................................................................. 18
2.1 WHERE ARE THE FOOD INSECURE?................................................................................................... 19
2.2 COPING WITH FOOD INSECURITY ..................................................................................................... 19
2.3 HOW DO SEASONS AFFECT FOOD SECURITY? ................................................................................... 20
2.4 WHO IS AT GREATEST RISK OF FOOD INSECURITY? ........................................................................... 21
3. MADAGASCAR’S VULNERABILITIES ..................................................................................................... 23
3.1 AGRICULTURAL UNDER PERFORMANCE AND MALPRACTICE ............................................................ 23
3.2 STAGNANT YIELDS IN CROP FARMING .............................................................................................. 25
3.3 NATURAL DISASTERS AND CLIMATE CHANGE ................................................................................... 30
3.4 PERSISTENT POVERTY ....................................................................................................................... 33
3.5 LACK OF INFRASTRUCTURE AND ACCESS TO MARKETS ..................................................................... 35
3.6 DEPENDENCY ON BUYING FOOD ...................................................................................................... 35
4. STATE OF MALNUTRITION .................................................................................................................. 37
4.1 GLOBAL ACUTE MALNUTRITION OF UNDER FIVES ............................................................................ 37
4.3 STUNTING IN UNDER FIVES .............................................................................................................. 40
4.4 UNDERWEIGHT IN UNDER FIVES ...................................................................................................... 41
5. INFANT AND YOUNG CHILD FEEDING PRACTICES AND HOUSEHOLD FOOD SECURITY ......................... 42

CFSVA+N Madagascar 2010
6
5.1 BREASTFEEDING PRACTICES ............................................................................................................. 42
5.2 INTRODUCTION OF SOLID, SEMI-SOLID AND SOFT FOODS ................................................................ 43
5.3 COMPLEMENTARY FEEDING PRACTICES ........................................................................................... 43
6. HEALTHY ENVIRONMENT AND CARE SEEKING BEHAVIOUR ................................................................ 46
6.1 CHILD HEALTH .................................................................................................................................. 46
6.2 HEALTH SEEKING BEHAVIOUR .......................................................................................................... 47
6.3 PREVENTATIVE TREATMENT FOR CHILDREN ..................................................................................... 47
6.4 MATERNAL HEALTH AND HEALTH SEEKING BEHAVIOUR ................................................................... 48
6.5 COMMUNITY HEALTH SERVICES ....................................................................................................... 48
6.6 WATER AND SANITATION ................................................................................................................. 49
7. RECOMMENDATIONS ......................................................................................................................... 52
7.1 IMPROVING FOOD DEMAND AND SUPPLY ........................................................................................ 52
7.2 INVESTING IN HUMAN AND SOCIAL CAPITAL .................................................................................... 52
7.3 COPING WITH SHOCKS/DISASTERS ................................................................................................... 52
7.4 TACKLING ACUTE MALNUTRITION .................................................................................................... 52
7.5 ACTIVITIES TO TACKLE STUNTING ..................................................................................................... 53
CFSVA+N Madagascar 2010
7
Acronyms CFSVA+N : Comprehensive food and nutrition security, and vulnerability analysis CO : Country Office CSI : Coping strategy index DSEC : Direction de Suivi-Evaluation et de Communication/Ministère de l'Agriculture DHS : Demographic and Household Survey NHS : National Households Survey FAO : Food and Agriculture Organisation of the United Nations FCS : Food consumption score IFAD : International Fund for Agriculture Development ha : hectare HTA : High Transition Authority HF cyclone :
High frequency cyclone
HDI : Human development index BMI : Body Mass Index INSTAT : Institut National de la Statistique GAM : Global acute malnutrition SAM : Severe acute Malnutrition MDER : Minimum dietary energy requirement MF cyclone :
Medium frequency cyclone
UN : United Nations MDG : Millennium Development Goals WHO : World Health Organization NGO : Non Governemental Organization ONN : Office National de la Nutrition WFP : United Nations World Food Programme GDP : Gross Domestic Product UNDP : United Nations Development Programme SMART : Standardized Monitoring & Assessment of Relief and Transition UNICEF : United Nations Children’s Fund USD : US Dollar

CFSVA+N Madagascar 2010
8
KEY FINDINGS
FOOD SECURITY AND VULNERABILITY
Poor rural households devote some 66 percent of their expenditures to food with the lion’s share of this food bill spent on rice (32 percent). The southern and the west south-western zones have the highest share of food expenditures, at 69 percent and 70 percent respectively.
Casual labourers are the poorest livelihood group by asset ownership across all zones except in the MF cyclone eastern coast and west south-western, where the poorest are small farmers (generally the second poorest income group across all zones).
Nationally, 53 percent of rural households have unacceptable food consumption, i.e., they consume limited or insufficient nutritious foods to maintain an active and healthy life. Of these, 12 percent have poor food consumption, mainly surviving on tubers (cassava 5.5 days a week) with proteins essentially absent from their diet. In the southern zone more than half of households have poor and only 22 percent acceptable consumption. The west south-western zone has the second highest prevalence of poor consumption (19 percent), followed by the HF cyclone eastern coast (12 percent), where a concerning 54 percent have borderline consumption.
More than a third are classified as food insecure and almost half are vulnerable to food insecurity. Just 17 percent of households are considered food secure. The southern is the most food insecure zone (68 percent) followed by the HF cyclone eastern coast and the west south-western.
Only 28 percent of farmers considered they had enough land to cultivate during the 2009-2010 agricultural season. The issue of land access and land tenure security is preventing smallholders from gaining access to more land, and hampering extensive farming and economies of scale. Overall, 70 percent of farming households cultivate less than 1.5 hectares and average land size is 1.2 ha. The number of smallholder farmers is high in the west south-western, southern and in the MF cyclone eastern coast
Many irrigation schemes are poorly maintained further contributing to low crop yields, while 30 percent of households have either no irrigation or irrigate less than a quarter of their land, a proportion that rises to almost half in the southern zone, the area most exposed to drought.
Overall, 84 percent of households experience a time of the year when they don’t have enough cash or food. February and October emerge as the most difficult months, with around a third facing a lack of cash/food then. Again it is the southern zone where households are hit the hardest followed by the west south-western.
Just over half of all households ‘always or often’ reduce their daily rations (thereby cutting their calorie intake) and switch to less preferred food (which is likely to be of lower

CFSVA+N Madagascar 2010
9
nutritional value) to cope with shortages. In the southern zone 72 percent reduce their daily rations and 67 percent cut the number of meals they eat.
Those at greater risk of food insecurity include: households with more members; households headed by a woman or by an elderly person; households with a higher percentage of dependents; small farmers and casual labourers; informal sector workers; households that cultivate less land and/or a lower variety of crops; farmers whose total cereal production is lower; farmers who report a harvest period of less than two months; households who rely on receiving gifts and hunting/gathering as a food source; and farmers that are net consumers (ie., in deficit) rather than net producers (ie., with surplus).
NUTRITION SECURITY
The global acute malnutrition (GAM) prevalence for children under five in rural Madagascar is 5.4 percent, representing 176 000 children at any point in time, with the proportion peaking in the southern zone at 7.1 percent. There is a higher prevalence of acute malnutrition among boys than girls (6.2 percent vs. 4.2 percent).
Children under two years old at greater risk of acute malnutrition are (in order of importance): children whose mothers have poor educational level, children who are ill and children who do not receive age-appropriate infant feeding (optimal complementary feeding or exclusive breastfeeding). Neither household food insecurity nor household wealth is associated with wasting, yet maternal education is. This suggests that poor infant feeding habits impact a child’s nutritional status irrespective of household wealth and food security in Madagascar.
Almost half (49 percent) of under-fives suffer from stunted growth, representing 1.6 million children, with the highest level found in the highlands (64 percent). Stunting is higher among boys (53 percent) than girls (45 percent) in all livelihood zones except for the central highlands.
Some 20 percent of children under six months are already stunted and there is a higher prevalence of stunting among children born with a low birth weight and among children born to short mothers, pointing to poor nutritional/health practices of pregnant women and lactating women.
In total 75 percent of children under six months are exclusively breastfed with the lowest level in the southern zone (57 percent). No difference is seen by maternal education and household wealth. However 82 percent of girls are exclusively breastfed compared with only 68 percent of boys, which may explain the higher GAM and stunting levels seen among boys than girls.
Feeding practices for 6-23 month olds are very poor with only 13 percent of this age group having received the minimum acceptable diet (encompassing meal frequency and dietary diversity). Children from the wealthiest households or whose mother is educated are three

CFSVA+N Madagascar 2010
10
times more likely to receive an acceptable diet compared to those from poor or less educated households.
Fewer 6-23 month olds from households with a borderline food consumption profile received the minimum acceptable diet (six percent) than those in households with poor food consumption profile (nine percent). An analysis reveals borderline households are more likely to sell micronutrient rich foods such as fruits and vegetables in order to purchase rice and less nutritious foods and non-food items.
In total, 44 percent of children were sick during this time period with the lowest proportion in the central highlands and the highest in the southern zone. Treatment was sought for only 26 percent of sick children. Younger children are more likely to be seen by a health provider - as are boys (28 percent compared with 23 percent for girls). The proportion of children for whom treatment was sought increases with increasing wealth index, though no significant difference is seen by maternal education level.
Only around a quarter (26 percent) of households have access to an improved water source in the dry season, with the lowest access seen in the southern zone (13 percent). And just 2.6 percent of households report having access to improved sanitation varying from 6.2 percent in the central highlands to 0.2 percent in the southern zone. Worryingly, some 58 percent of households state that they practise open defecation and 93 percent of Fokontany claim that open air defecation is practised in their Fokontany.
Only 22 percent of women report using soap to wash their hands following latrine use with the highest proportion in the central highlands (43 percent) and the lowest in the southern zone (11 percent). Significantly more mothers from wealthier households wash their hands compared to those from poor households. Indeed households state that six percent of their household income is spent on soap.

CFSVA+N Madagascar 2010
11
CONTEXT
Efforts to improve Madagascar’s food security and nutrition over the last two years have been thwarted by political instability which has disrupted data collection1. With up-to-date critical information needed to contribute to evidence based decision making, UNICEF and WFP agreed to carry out a joint Comprehensive Food and Nutrition Security and Vulnerability Analysis (CFSVA+N) in 2010.
The survey’s primary objectives are to:
Provide an accurate and detailed assessment of the current food and nutrition security situation
Assess the causes and risk factors for food and nutrition insecurity
Identify potential ways to mitigate food and nutrition insecurity
Reveal pockets of vulnerability where special assistance may be required.
This marks the country’s first country-wide study of food security and vulnerability since the 2005 CFSVA2. It complements the Demographic and Health Survey (DHS) 2008/2009 by updating the regional level nutrition data.
METHODOLOGY
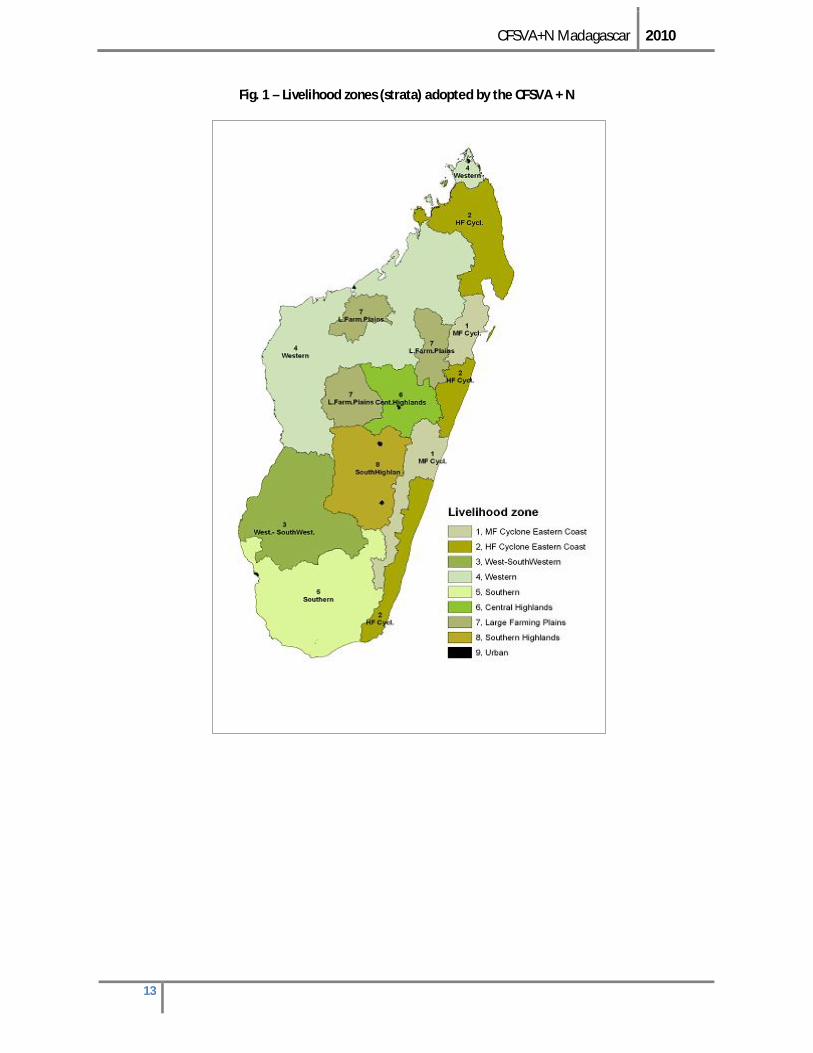
Madagascar is administratively divided into 22 regions and 119 districts (107 rural, 12 urban). In view of the heterogeneity in livelihoods within the regions, the country is also stratified into nine livelihood zones (eight rural and one urban) using indicators that reflect the socio-economic and geographical factors linked to food security and nutrition, demographic characteristics and malnutrition rates3. The strata were validated by the Madagascar food security and livelihoods cluster. The survey was designed to provide anthropometric and food security data representative at regional and livelihood zone level for the rural areas of Madagascar.
The detailed Full Report (CD-ROM or website4) provides further in-depth analysis as well as tables on food security, nutrition security and vulnerability at regional and livelihood zones level.
Table 1 - Characteristics of the eight livelihood zones 1 The 2009 political crisis disrupted the data collection process of the Demographic and Health Survey (DHS) 2008/09 affecting the tracking on MDG 1 (hunger target) and the evaluation of the five-year National Nutrition Action Plan.
The most recent national poverty reduction strategy, the Madagascar Action Plan (MAP), will come to an end in 2012. The United Nations Development Assistance Framework (UNDAF), previously aligned with the MAP, has been revised and extended by two years due to the current political uncertainty. This represents a crossroads for long-term programming. The last Common Country Assessment (CCA) dates back to 2001. 2 http://documents.wfp.org/stellent/groups/public/documents/ena/wfp108512.pdf 3 Principal Component Analysis (PCA) and Cluster Analysis (CA) were used to group the districts with similar characteristics. Indicators used for the stratification were: 1) cyclone impact frequency; 2) elevation; 3) average 10-years rainfall; 4) percentage of population reliant on livestock breeding as main activity; 5) average size of cultivated land per household; 6) contribution of each district to national production for the main crops; 7) percentage of literate population; 8) percentage of children attending primary school; 9) percentage of female headed households; 10) underweight and stunting prevalence. 4 http://mg.one.un.org/HAYZARA or www.wfp.org/countries/madagascar

CFSVA+N Madagascar 2010
12
Geography Livelihoods Demographics Malnutrition
Med
ium
freq
uenc
y cy
clon
e ea
st c
oast
Medium elevation; very high average annual rainfall; medium frequency of cyclones
Low percentage of population reliant on livestock; medium sized farming areas; low production of cereals and tubers
High percentage of children in primary school against total population; medium literacy rate; low percentage of female headed households
Medium prevalence of stunting and high prevalence of underweight
Hig
h fr
eque
ncy
cycl
one
east
ern
coas
t
Low elevation; high average annual rainfall; very high frequency of cyclones
Low percentage of population reliant on livestock; medium sized farming areas; medium production of rice and cassava, low production of other staple crops
Medium percentage of children in primary school against total population; medium literacy rates. High percentage of female headed households
Low prevalence of stunting and medium prevalence of underweight
Wes
t sou
th-
wes
tern
Low elevation; low average annual rainfall; high frequency of cyclones
Medium percentage reliant on livestock; farming areas of medium size; low production of rice, sweet potatoes, potatoes and tarot. Medium production of cassava and maize
Low percentage of children in primary school against total population, and low literacy rate. High percentage of female headed households
Low prevalence of stunting and medium prevalence of underweight
Wes
tern
Low elevation with medium-average annual rainfall and medium frequency of cyclones
Medium-high percentage reliant on livestock; medium sized farming areas; medium production of rice, cassava and maize; very low production of sweet potatoes, potatoes and tarots
Medium percentage of children in primary school against total population, and medium literacy rate. Medium percentage of female headed households
Low prevalence of stunting and underweight
Sout
hern
Medium elevation; low average annual rainfall; medium frequency of cyclones
High percentage of population reliant on livestock; medium sized farming areas; very high production of cassava and high production of maize; low production of rice
Low percentage of children in primary school against total population, and very low literacy rate. High percentage of female headed households
Medium prevalence of stunting and high prevalence of underweight
Cent
ral h
ighl
ands
High elevation; high average annual rainfall; low frequency of cyclones
Medium percentage reliant on livestock. Farming areas of medium size. Medium production of rice and cassava; low production of maize, high production of sweet potatoes and tarot, very high production of potatoes
Low percentage of children in primary school against total population; very high literacy rate. Low percentage of female headed households
Medium prevalence of stunting and low prevalence of underweight
Larg
e fa
rmin
g pl
ains
Medium elevation; low average annual rainfall; medium frequency of cyclones
High percentage reliant on livestock; large farming areas; high production of rice and maize; medium production of cassava; low production of other staple crops
Low percentage of children in primary school against total population and high literacy rate; low percentage of female headed households.
Medium prevalence of stunting and low prevalence of underweight
Sout
hern
hig
hlan
ds
High elevation with medium average annual rainfall and low frequency of cyclones
Medium percentage of population reliant on livestock. Farming areas of small size. Medium production of rice; high production of cassava and maize; very high production of sweet potatoes, potatoes and tarot
Medium percentage of children in primary school against total population and high literacy rate; medium percentage of female headed households
High prevalence of stunting and medium prevalence of underweight
CFSVA+N Madagascar 2010
13
Fig. 1 – Livelihood zones (strata) adopted by the CFSVA + N

CFSVA+N Madagascar 2010
14
BACKGROUND
In the 1960s, Madagascar was one of the better-performing African economies, but recurrent crises have sent the economy into decline, weakened the socio-cultural fabric of society and prompted chronic poverty.
Now it is among the least developed and poorest countries in the world, ranked 135th out of 168 according to the 2010 Human Development Index (HDI), with per capita income down from 473USD in 1970 to 410USD in 20085. More than three-quarters of the population (76.5percent) lives below the poverty line6 with rural poverty rates even higher at 82.2 percent.
The presidential coup of 2009, which culminated in the transfer of power to the High Transitional Authority (HTA), dealt a huge blow. As a reaction, development aid packages were frozen and foreign aid decreased by 40 percent7, hitting public services hard since 86 percent of aid supports public sector services directly or indirectly8. This crisis, combined with the global financial turmoil, plunged Madagascar into severe recession with GDP dropping by almost five percent. The particularly hard hit sectors were tourism, textile exports, the shrimp business, construction and public works where job losses were severe.
Still, as little as three years ago Madagascar was improving on the HDI, cutting under five mortality rates9 (down from 159 deaths per 1000 live births in 1997 to 72 in 2008) and increasing primary school enrolment10 and on track to meet three MDGs (gender equality, primary education for all, and the fight against HIV/AIDS, malaria and other diseases),
MDG progress has been severely shaken by the political crisis. On MDG1 target 1A (“halve, between 1990 and 2015, the proportion of people whose income is less than one dollar a day”), the challenge is insurmountable since it would entail more than halving the poverty rate to 35percent by 201511. Trends also indicate that reaching MDG1 target 1C (“halve, between 1990 and 2015, the proportion of people who suffer from hunger”), as there has been little change in stunting levels in children and recent data shows that Madagascar is 6th in the world with regards to stunting in under-fives12.
Agriculture is the mainstay of the Malagasy economy accounting for 26 percent of the national GDP and employing almost four fifths of the rural population. But most (70 percent) are smallholder farmers whose land size averages 1.2 ha. Very few produce higher value products such as fruits, cash crops or other vegetables, making the sector relatively isolated from the country’s recent economic woes. Following a bumper harvest in 2008/2009 (thanks to a series of incentives, financial support and technical assistance), in 2009/2010 about half of households
5 World Bank, http://go.worldbank.org/D41QD46W10 6 2010 National Household Survey 7 From an initially expected USD 740 million to USD 433 million and included USD 170 million in direct budget support. Source: Julien Chevillard, Analyse préliminaire de l’impact de la crise institutionnelle et politique, 2009, UNDP. The freeze in the assistance affected mainly development aid. 8 Vulnerability Assessment I, Interagency Working Group on Monitoring Vulnerability, 2009 9 INSTAT and DHS 2003/04. 10 EPM 2005. 11 EPM 2010. 12 State of the World’s Children 2011. Madagascar ranks 6th behind Afghanistan, Yemen, Timor-Lesete, Malawi, and Ethiopia.

CFSVA+N Madagascar 2010
15
reported a decrease in rice, cassava and maize production. What’s more the drought-prone southern regions experienced another year of crop failure due to lack of rainfall, while the south-eastern districts lost half of their rice harvests following the tropical storm Hubert.
Madagascar’s primary sector, essentially agriculture and mining, have been resilient with an exceptional rice harvest in 2009 (up by 40 percent from 2008 levels) and the mining sector growing significantly thanks to the “ilmenite” mining project, the largest in Madagascar’s history, which started production in mid-2009.
Madagascans also remain relatively insulated from food price inflation. Per capita rice consumption is amongst the highest in the world with no more than 10 percent of rice imported. The domestic and imported varieties purchased in local markets remained shielded from the global rice price spike of April 2008. Generally speaking, despite seasonal patterns, levels of food price volatility occur in a low, predictable range. But World Bank research suggests that Madagascar is not completely segmented from international markets13 and global price volatility may still exert upward price pressure on domestic markets.
Indeed the economic situation remains extremely fragile with recovery (and foreign aid) largely dependent on an internationally-recognized resolution of the political crisis.
13 Madagascar Economic Updates - October 2010, World Bank.

CFSVA+N Madagascar 2010
16
1. FOOD CONSUMPTION
he Malagasy diet is based mainly on rice (average weekly consumption is 6.2 times a week), vegetables (4.4 times a week) and tubers (mainly cassava, 3.9). Vegetable and animal proteins are rarely consumed (once and 2.3 times respectively). Fish is the most popular
animal protein, with an average weekly consumption of 1.3 days.
Nationally, over half (53 percent) of rural households or 9.6 million people have an unacceptable food consumption, i.e. they consume limited or insufficient nutritious foods to maintain an active and healthy life. Of these, 12 percent or about 400,000 households have an extremely one-sided consumption pattern, mainly surviving on tubers (cassava 5.5 days a week) with cereals on 3.5 days and vegetables just twice. Proteins are essentially absent from their diet. They are classified as having poor food consumption. People with acceptable food consumption, i.e. their general dietary intake is more plentiful and composed of food items from all the main food groups, constitute less than half (47 percent) of the total population.
These consumption groups (acceptable, borderline and poor) were created based on the frequency and variety of consumption of different food items. Technical details are provided in Annex II of the detailed Full Report.
With more than half of the population or about 1,026,260 people having poor food consumption and only 22 percent acceptable consumption, the southern zone fares the worst. The west south-western zone has the second highest prevalence of poor consumption (19 percent), but the absolute number of people is much lower (160,978)
TFig. 2 – Poor Consumption distribution (% HHs)

CFSVA+N Madagascar 2010
17
due to the lower population density. The HF cyclone eastern coast follows with 11.6 percent having poor consumption, which equates to very high numbers of people (436,580), and a concerning 53.7 percent (more than 2 million people) have borderline consumption.
CFSVA+N Madagascar 2010
18
How is food insecurity measured?
The food security classification goes a step beyond the actual consumption. It introduces elements of sustainability by combining consumption with income, expenditures and coping strategies. It is identified by combining four food access indicators:
wealth index food consumption score coping strategy index per capita monthly expenditures (Methodological details are in Annex II of the detailed Full Report). Then households are classified as either food insecure, vulnerable or food secure.
2. STATE OF FOOD INSECURITY
ood security exists when all people, at all times, have physical, social and economic access to sufficient, safe and nutritious food
which meets their dietary needs and food preferences for an active and healthy life (1996 World Food Summit). The key word is ‘access’ to food. Access depends on the general food supply and people’s ability to acquire food. Together with how this food is utilized, which in turn depends on caring and hygiene practices, health status and overall nutritional awareness of the population, the food security outcome, i.e. nutrition status, is determined.
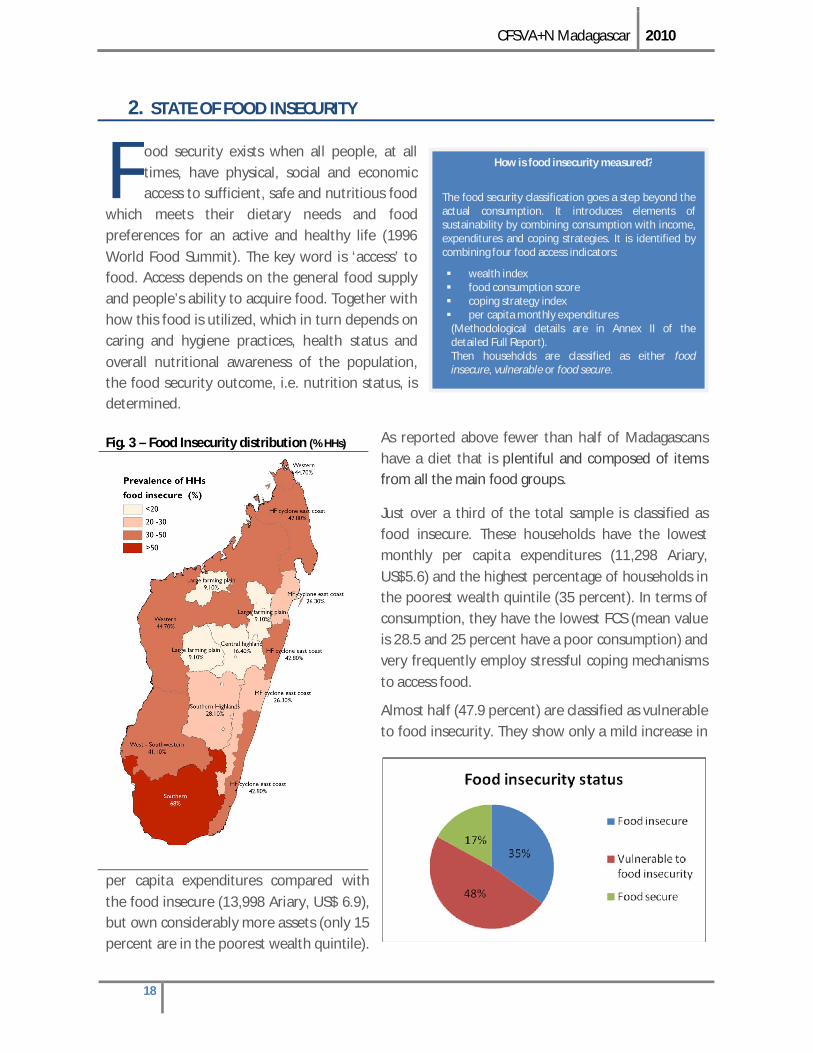
As reported above fewer than half of Madagascans have a diet that is plentiful and composed of items from all the main food groups.
Just over a third of the total sample is classified as food insecure. These households have the lowest monthly per capita expenditures (11,298 Ariary, US$5.6) and the highest percentage of households in the poorest wealth quintile (35 percent). In terms of consumption, they have the lowest FCS (mean value is 28.5 and 25 percent have a poor consumption) and very frequently employ stressful coping mechanisms to access food.
Almost half (47.9 percent) are classified as vulnerable to food insecurity. They show only a mild increase in
per capita expenditures compared with the food insecure (13,998 Ariary, US$ 6.9), but own considerably more assets (only 15 percent are in the poorest wealth quintile).
F
Fig. 3 – Food Insecurity distribution (% HHs)

CFSVA+N Madagascar 2010
19
In addition, they eat much better (mean FCS is 36.3 and only six percent have a poor consumption) and have a low tendency to engage in stressful coping mechanisms.
Just 16.9 percent of households are considered food secure. They have an unquestionably higher purchasing power with a total per capita monthly expenditure averaging 42,226 Ariary (US$ 21.1). Only one percent of food secure households is in the poorest wealth quintile, one percent has poor consumption and the tendency towards coping mechanisms is also low.
2.1 WHERE ARE THE FOOD INSECURE?
As expected, the southern is the most food insecure zone, with 68 percent of households considered as food insecure - a natural consequence of the very bad performance on all four indicators.
Even though it does not report high poor consumption prevalence the western has the next highest percentage of food insecure households (44.7 percent), mainly driven by the comparative low per capita expenditures and poor wealth. It is followed by the HF cyclone eastern coast (42.6 percent) and the west south-western (40.9 percent). The heart of the country appears more food secure with the large farming plains and central highlands reporting the lowest level of food insecurity (9.1 and 16.6 percent respectively).
In terms of absolute estimates, the highest number of food insecure households is found in the HF cyclone eastern coast (343,291 households), followed by the southern (246,046 households) and the western (194,233 households). Interestingly, the southern highlands, where the food insecurity prevalence is low, has a sizeable number of food insecure households.
2.2 COPING WITH FOOD INSECURITY
Just over half of all households ‘always or often’ reduce their daily rations (thereby cutting their calorie intake) and switch to less preferred food (which is likely to be of lower nutritional value) to cope with shortages. In the southern zone 72 percent reduce their daily rations and 67 percent cut the number of meals they eat. Here the reduced Coping Strategy Index is as high as 24 and all five coping strategies reach the highest values14. It is followed by the HF cyclone eastern coast and the west south-western, all zones with high poor consumption. As far as income groups are concerned small farmers, agricultural labourers and casual labourers have the highest reduced CSI.
14 The average value in Madagascar is 14.8, but the reduced CSI varies between 0 and 56. Therefore in the Southern a medium level of coping is observed.

CFSVA+N Madagascar 2010
20
Table 2 – CSI and coping strategies by livelihood zone and income groups Livelihood zones Percentage of households who applied the strategies often or
always
Reduced CSI
daily ration reduced
number of daily meals reduced
food borrowed
switch to less preferred food
adults reduce food intake
Southern 24.0 72 67 30 70 38 HF cyclone eastern coast 16.9 56 24 21 49 28 West south-western 16.3 50 38 18 51 19 Western 15.6 56 45 15 61 14 Southern highlands 12.6 46 21 15 39 22 Central highlands 12.4 65 2 7 67 21 MF cyclone eastern coast 11.7 42 18 17 39 13 Large farming plains 6.7 22 6 5 19 7 Income groups Small farmers 16.5 56 34 20 47 25 Medium/big farmers 13.2 51 22 13 47 17 Informal labourers 13.9 51 26 13 50 22 Public sector salaried/remittances
10.8 33 18 18 35 10
Casual labourers 16.3 58 30 22 54 20 Agro pastoralists 15.4 52 26 12 63 28 Fisher folks 13.8 46 26 15 39 22 Private salaried 14.7 53 16 16 59 33 Other activities 14.8 56 23 17 65 21 Agric. labourers 18.1 74 19 20 76 30
2.3 HOW DO SEASONS AFFECT FOOD SECURITY?
Overall, 84 percent of households experience a time of the year when they don’t have enough cash or food. February and October emerge as the most difficult months, with around a third facing a lack of cash/food then.
Again it is the southern zone where households are hit the hardest. Here some 92 percent of households report a deficit in cash or food, followed by the west south-western (89 percent), with the deficit peaking in September, followed by a slow decline. The situation is at its best between April and May.
The MF and HF cyclone eastern coast zones and the large farming plains experience two annual shortage peaks, the first occurring in October, and the second in February for the large farming plains (where 36 percent reported a deficit) and April for the eastern coast.
The deficit peak for the western zone and central and southern highlands occurs between December and February. In January 2010, 59 percent of households in the central highlands didn’t have enough cash/food while 48 percent experienced this two months later in the western zone.

CFSVA+N Madagascar 2010
21
2.4 WHO IS AT GREATEST RISK OF FOOD INSECURITY?
Households with more members. Food insecure household have an average of 5.4 members compared with 4.9 in vulnerable households and 4.8 in food secure. A fifth of food insecure households have seven or more members compared with 15 percent of the vulnerable and 11 percent of the food secure. Although larger in size, food insecure households have a weaker human capital i.e., they can rely on a limited or less qualified labour force.
Households headed by a woman or by an elderly person, and those with a higher percentage of dependents. About 28 percent of the food insecure households, 19 percent of the vulnerable to food insecurity households, and 15 percent of the food secure households are headed by women. About 17 percent of the food insecure households, 14 percent of the vulnerable to food insecurity households, and 12 percent of the food secure households are headed by an elderly person. About 57 percent of the food insecure households, 54 percent of the vulnerable to food insecurity households, and 42 percent of the food secure households have a high percentage of dependents15.
Small farmers and casual labourers. Nearly half (47 percent) of small farmers are food insecure and only six percent are classified as food secure. Similarly, 43 percent of casual labourers are food insecure and only six percent are food secure.
Informal sector workers. More than a quarter is food insecure while vulnerability to food insecurity is particularly high among the medium / big farmers (59 percent versus a country average of 48 percent).
Households that cultivate less land. While the average land size in rural Madagascar is 1.2 ha, the food insecure cultivate an average of 0.96 ha, the vulnerable 1.24 and the food secure 1.77.16 Half of households (52 percent) cultivate less than a hectare.
Households that cultivate a lower variety of crops. The food insecure grows 3.1 varieties on average, compared with 3.6 and 3.4 for the vulnerable and food secure respectively.
Those whose total cereal production is lower. At country level, food insecure farmers report cereal production of 498 kg/year per household for the 2009-2010 agricultural season, compared with 861 kg/year per household by vulnerable farmers and 1,235 Kg/year per household by food secure. These estimates suggest that the food secure tend to produce 2.5 times more than the food insecure. The positive linear relationship between total cereal production and food security, which can be observed in all the zones, is particularly evident in the southern highlands (food secure produce three times more than the food insecure), and the large farming plains (2.6 times more). This is because there is such a wide gap in land access between the food insecure and the food secure in these zones.
Farmers who report a short harvest period i.e., less than two months.
15.. The analysis considered also the association between food security and chronic illness, presence of orphans, migration. No clear significant relationship was found with these indicators. 16 Differences between each couple are statistically significant.

CFSVA+N Madagascar 2010
22
Households whose food sources are less predictable than producing their own or purchasing, i.e., they rely on receiving gifts and hunting/gathering,
Farmers who are net consumers (i.e., in deficit) rather than net producers (i.e., with surplus), This means they are more exposed to price increases, plunged into deeper food insecurity if prices rise.

CFSVA+N Madagascar 2010
23
A note on land tenure reform
Land tenure reform was launched in 2005 in a bid to allow the poorest farmers to secure access to the land they work, giving them the chance to exercise their ownership rights. But some farmers seem reluctant to approach the local land tenure offices for fear of becoming subject to property taxation. Others are put off by the excessive costs of land tenure certification fees. Plus much of the funding for this reform has been suspended by donors following the 2009 institutional crisis, jeopardizing its continuation.
3. MADAGASCAR’S VULNERABILITIES
he following key issues are not just exposing Madagascar to food insecurity but they are becoming the driving forces of it.
3.1 AGRICULTURAL UNDER PERFORMANCE AND MALPRACTICE
Agriculture is at the heart of the Malagasy economy, accounting for 26 percent of the national GDP. Nearly 80 percent of Madagascans live in rural areas, where about 78 percent of the active population works in agriculture.
The majority are subsistence farmers with very few producing higher value products such as fruits, cash crops or other vegetables, making the sector relatively isolated from the country’s recent economic woes. Such a lack of economic diversification exposes them to climatic variations, be they predictable (the lean/dry season) or unpredictable (cyclones, floods and droughts).
Although improved agricultural techniques, initiated by various rural development projects, has boosted production in areas such as the southern highlands since 200817, traditional methods keep crop yields very low, perpetuating deep poverty in rural areas. Lack of equipment, agricultural inputs and technical skills combine with the country’s outdated and badly-maintained transport network system, affecting not only the connectivity between the farms and the consumers but also trade development between regions.
Overall, half (52 percent) of farming households cultivate less than one hectare and 70 percent less than 1.5 ha. The average land size is 1.2 ha. In the southern and the west south-western zones, large plots of land are more prevalent while the central highlands has the highest percentage of households farming less than one ha (65 percent), followed by the southern highlands because of the landscape. Asked if they had access to sufficient land during the 2009-2010 agricultural season only 28 percent considered they had enough land to cultivate.
Lack of land tenure reform and the parcelling of farm lands is preventing these smallholders from gaining access to more land, and hampering extensive farming and economies of scale. In fact large areas of Madagascar’s fertile lands remain unfarmed.
17 Community data, CFSNVA, 2010
T

CFSVA+N Madagascar 2010
24
The plight of the south
In terms of poverty levels, food security, food consumption and levels of acute malnutrition, the drought-prone southern zone is the worst in Madagascar. Insufficient and irregular rainfall since 2008 had devastating impacts on the 2010 main harvest, leaving many vulnerable families in need of assistance. The region appears to have the poorest diet with households eating cassava almost every day and children having the least varied or nutritious diets.
Some 92% of households experience a time of the year when they don’t have enough cash or food with the deficit peaking in September. Faced with the greatest food shortages in the country some 72% of southerners reduce their daily rations and 67% cut the number of meals they eat in a bid to cope. An estimated 205 252, more than half of all households, have poor consumption and 68% are considered food insecure.
Although the low cultivation of rice in favour of cassava and maize may explain why irrigation is the poorest in the country, the fact that half of households have no irrigation is alarming because of the vulnerability to droughts. These recurrent droughts reduce the harvest period to an average of just 3.3 months for the main crop.
The situation appears at odds with the fact that WFP concentrates its activities in this part of the country. But WFP emergency response is implemented for a limited period of time (3-4 months) and reaches only a very small proportion of the population. Emergency interventions (implemented in Anosy, Androy and Atsimo Andrefana) normally target between 10,000 and 20,000 households, reaching 40,000 during droughts.
Irrigation schemes supply water to about 40 percent of all cultivated lands 18 but many are poorly maintained, further contributing to low crop yields. According to the survey data, 30 percent of farmers have either no irrigation or irrigate less than a quarter of their land, but this rises to almost half in the southern zone, the area most exposed to droughts.
Settlements, shifting cultivation, overgrazing, charcoal production, human-made bush fires and uncontrolled expansion of farmland are destroying Madagascar’s forests. By affecting the hydrological balance, deforestation destroys rice fields, thus leaving the farming populations poorer and more food insecure. In the face of the increased vulnerability and food insecurity, households tend to adopt coping strategies that further contribute to the stripping of vegetative cover and degradation of watersheds.19 Such destruction could be avoided only by increasing land productivity or with a controlled plan of expansion.
Where farmers are pushing into the hills, in a bid to increase stagnating yields in lowland areas and meet the demands of a growing population, unsustainable land management practices are causing upland soil erosion and water surface run-off and sedimentation for downstream irrigation infrastructures. This reduces the lowland cultivated area and causes flooding of crop fields in the rainy season and water shortages in the dry season.
Many schemes are caught in a vicious circle of poor yields, low capacity of water users to pay for maintenance, and degradation of the schemes.
Lack of growth in the sector can also be attributed to the country’s outdated and badly-maintained transport network system, affecting not only the connectivity between the farms and the consumers but also trade development between regions. The cost of transporting agricultural products to urban centres becomes excessive and contributes to market segmentation.
18 Irrigation and Watershed Management Project, World Bank, 2008 19 “Programme review and formulation support mission”, WFP, 2009

CFSVA+N Madagascar 2010
25
Fig. 4 – Percentage of households that have irrigated less than 25 percent of land by livelihood zone
0% 10% 20% 30% 40% 50% 60%
Western
West-SouthWestern
MF Cyclone Eastern Coast
HF Cyclone Eastern Coast
Central Highlands
Large Farming Plains
Southern Highlands
Southern
Madagascar
no irrigation
up to 25% of land
3.2 STAGNANT YIELDS IN CROP FARMING
In 2008/09, there was a marked increase in overall agricultural production20. Rice production increased by 16 percent over the previous year thanks to a series of incentives, including financial support (subsidized fertilizers and seeds) and technical extension assistance, provided by the Government’s “Sustainable Green Revolution” initiative in 2008. Maize production increased by 22 percent - though it was down by the same percentage in the drought-prone south due to scant and erratic rainfalls. Tropical cyclone Ivan heavily destroyed or flooded/silted cereal fields in the HF cyclone eastern coast and the central highlands causing a decline in cereal production in 2008.
In the 2009/2010 the southern regions of the country experienced another year of crop failure due to lack of rainfalls, while the south-eastern districts lost half of their rice harvests following the tropical storm Hubert.
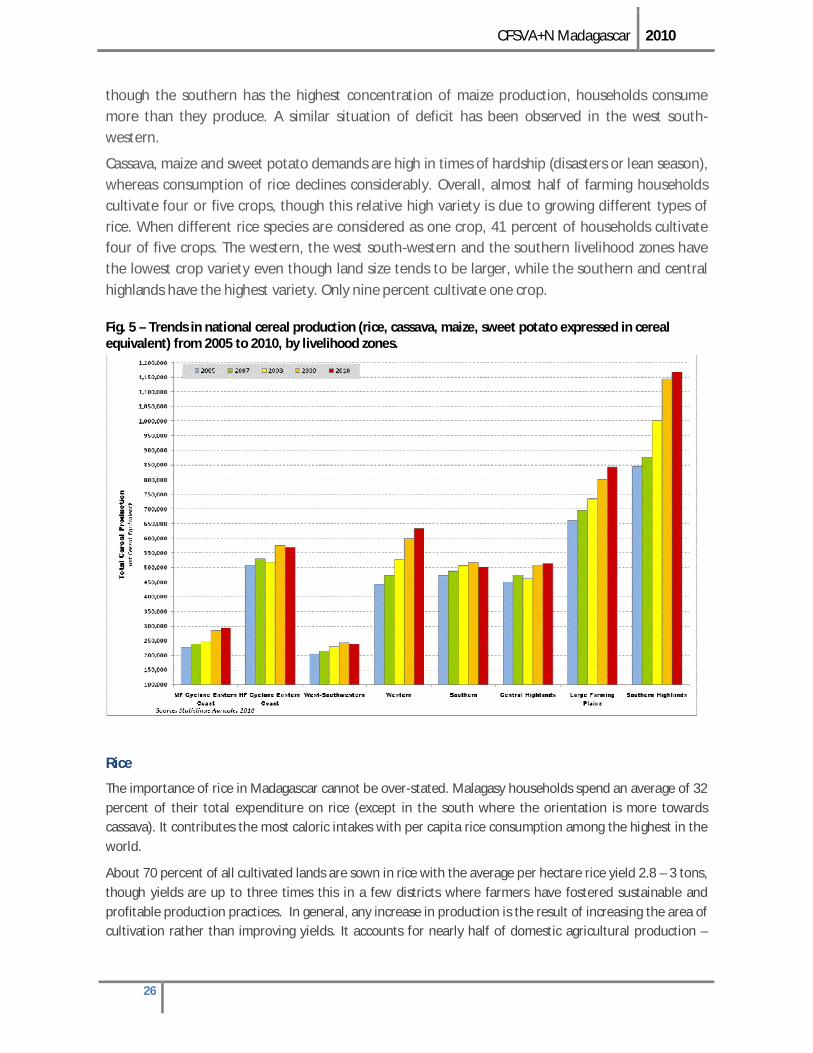
Agricultural productivity in all key crops (rice, cassava/manioc, maize and sweet potato) remains quasi-stagnant due to the use of traditional cultivation methods and resistance to using improved techniques. While Madagascar produces around 90 percent of its domestic cereal needs, production varies widely from region to region with some areas suffering chronic insufficient local production to meet the needs of local people and others having a net cereal surplus. The deficit areas are the MF and HF cyclone east coast, western and central highlands, while the west south-western, southern, large farming plains and southern highlands produce a surplus.
A high prevalence of net consuming (i.e. consume more than they produce/deficit) households is a sign of concern, as dependency on markets exposes households to price fluctuations. An increase in the amount of land significantly boosts the chances of being a ‘net producer’ especially for rice and maize. The large farming plains have the highest percentage of rice and maize net producers, suggesting this zone has a good amount of marketable surplus for these two commodities. Even
20 Rapid Joint Crop and Food Security Assessment Mission, FAO/WFP, June 2009
CFSVA+N Madagascar 2010
26
though the southern has the highest concentration of maize production, households consume more than they produce. A similar situation of deficit has been observed in the west south-western.
Cassava, maize and sweet potato demands are high in times of hardship (disasters or lean season), whereas consumption of rice declines considerably. Overall, almost half of farming households cultivate four or five crops, though this relative high variety is due to growing different types of rice. When different rice species are considered as one crop, 41 percent of households cultivate four of five crops. The western, the west south-western and the southern livelihood zones have the lowest crop variety even though land size tends to be larger, while the southern and central highlands have the highest variety. Only nine percent cultivate one crop.
Rice
The importance of rice in Madagascar cannot be over-stated. Malagasy households spend an average of 32 percent of their total expenditure on rice (except in the south where the orientation is more towards cassava). It contributes the most caloric intakes with per capita rice consumption among the highest in the world.
About 70 percent of all cultivated lands are sown in rice with the average per hectare rice yield 2.8 – 3 tons, though yields are up to three times this in a few districts where farmers have fostered sustainable and profitable production practices. In general, any increase in production is the result of increasing the area of cultivation rather than improving yields. It accounts for nearly half of domestic agricultural production –
Fig. 5 – Trends in national cereal production (rice, cassava, maize, sweet potato expressed in cereal equivalent) from 2005 to 2010, by livelihood zones.

CFSVA+N Madagascar 2010
27
but most is produced by small farmers for subsistence purposes. Almost two thirds of the surveyed households cultivated rice in the 1st season21 and more than half in the 2nd season.
The rice that is sold essentially comes from a few select areas (Lake Alaotra and Marovoay plains in particular) or from commercial imports. After a considerable peak in 2007 caused by ‘Cyclone Indlala’, rice prices exhibited a mild decreasing trend, which can be explained by the increase in domestic production. The relative decline in prices has hit the producers (farmers) who also have to cope with the increasing cost of inputs22.
Rice imports account for a maximum of 10 percent of the domestic demand23 though they have always played an important role in covering some intra-regional and lean season deficits24.
More than half (54 percent) of households cultivating rice are ‘net consumers’ meaning they have a rice deficit and 40 percent are ‘net producers’ meaning they have a surplus. The highest presence of net consumers is found on the eastern coast (68 percent in the HF eastern coast and 61 percent in the MF). The Large Farming Plains is unquestionably the zone with the highest percentage of net producers (61 percent).
Households’ rice production performance has been assessed according to duration of harvest and decrease in production25. Key results for the two seasons of rice can be summarized as follows:
Since rice is a very important crop for the HF cyclone eastern coast, it is worrying to see that this zone had the highest percentage of households with poor harvest (19 percent) in the first season and the third highest in the second (19 percent).
When both first and second seasons are considered, households farming rice in the southern zone tend to have a very short harvest period because the area is drought-prone and farmers give preference to cassava and maize.
In the west south-western, the percentage of households reporting decreased production is far below the average in the first season, but is very high during the second season (77 percent of the households).
Households with more land (ie., 1.5 ha or more) report a decrease more frequently than small farmers.
Approximately half of households report a decrease in rice production (as well as cassava and maize) for 2009/10 compared with the previous season. Such a high percentage is explained by the marked increase in overall agricultural production in 2008/09, probably facilitated by the series of incentives (i.e., subsidized fertilizers and seeds) and technical extension assistance provided by the government’s Green Revolution Initiative funding. Such funds were not sufficiently available during the 2009/2010 campaign after the suspension of development aid packages to Madagascar following the 2009 political upheaval. The only accessible funds to support the continuation of the initiative were a small amount left over from the 2008/09 funding, not enough to achieve the same
level of performance.
21 Rice varieties cultivated during the first season are: Jeby, Hosy, and Vary Be (harvested in Sept/Oct) and Vary Aloha (harvested in Dec/Jan). Rice varieties cultivated during the second season are Asara and Vatomandry (harvested in Mar/Avr/Mai/Juin). 22 Prices of fertilizers and other inputs (Source: CFSAM 2010). 23Note sur le prix du riz à Madagascar, Hélène DAVID-BENZ, Cirad, UMR Moisa, Observatoire du Riz, 2011 ; Diagnostic et perspectives de développement de la filière riz à Madagascar, Ministère de l’Agriculture, 2001 24Review of Madagascar's Rice sub-sector, Louis Bockel 2002 25 Households were asked to report the number of months the harvest would last, and the amount produced in the 2009-10 and in the 2008-09 seasons. The report focuses only on rice, cassava and maize. For each crop, results refer only on the farmers that cultivated that specific crop. Short (or poor) harvest is defined as a harvest that lasts less than 2 months.

CFSVA+N Madagascar 2010
28
Fig. 6 – Rice 1st season: poor harvest and decrease in production ( percent HHs)
Fig. 7 – Rice 2nd season: poor harvest and decrease in production ( percent HHs)
Cassava
Cassava is the second main crop and is grown throughout the island, with 74 percent of households cultivating it in the 2009-2010 season (23 percent as main crop). It grows best on flat terrain where soils are deep, light and rich in organic matter26 and average annual temperatures are 23 – 25˚C27. It constitutes a key dietary reserve when household stocks decline and rice prices climb28.
Cassava cultivation methods are mostly traditional and farmers rarely use external inputs, except in a few specific areas where they have begun to use improved technologies such as manure application, plant spacing and annual fallows. Again any increase in production is mainly due to expanding the cultivation area rather than boosting productivity.
In the southern zone it is the major crop for nearly 60 percent of households accounting for about a third of all the crops cultivated and more than 27 percent of caloric intake. In the adjacent west south-western zone it accounts for about a quarter of all the crops cultivated. In both zones it performs better than other crops because of the edaphic characteristics of soils and climatic conditions. However it is of considerable concern that these two chief cassava producing zones
26 Food Security in Madagascar: A Situation Analysis, Gilles Bergeron, 2002 27 Filières de l’Agriculture, de l’Elevage et de la Pêche, Fiche n°113 : Filière Manioc, Ministère de l’Agriculture, 2004 28 Food Security in Madagascar: A Situation Analysis, Gilles Bergeron, 2002
Fig. 8 – Cassava: poor harvest and decrease in production (% HHs)

CFSVA+N Madagascar 2010
29
have the highest percentages of households reporting a decrease in production (71 percent in the west south-western and 61 percent in the southern.) The southern has the highest prevalence of households with a short harvest period (31 percent of households have a harvest of less than two months).
Both zones also have the highest percentages of net consumers (85 percent for the southern and 71 percent for west south-western) and the lowest percentage of net-producers.
Maize
Maize, although not that important overall, is grown by more than a third of farmers (11 percent as the main crop) and provides 15 percent of all caloric requirements in the south. It is a warm weather crop, that grows best in light soils, with an optimal moisture regime (such as in recession cropping “baiboho”). A water deficit in the 20 to 30 days before flowering and 10 to 15 days after causes up to a 50 percent reduction in yield29. The critical temperature detrimentally affecting yield is approximately 32˚C30. The western zone has the highest percentage of maize cultivation (21.5 percent) followed by the large farming plains (19 percent), where the agro-climatic conditions are more suitable for maize production than in the southern where it represents 18 percent of total crops and is the main crop for 12 percent of households (versus a country average of 2 percent). The average yield is 2.2mt/ha in the large farming plains compared with 1.3 mt/ha in the south and 1.9mt/ha in the western.31 It has replaced sorghum as the food staple for southerners since its introduction to the area in the 1980s to satisfy the high demand for export32 and by development projects in the decade after the severe drought of 1991-1992.33 29 Filières de l’Agriculture, de l’Elevage et de la Pêche, Fiche n°108 : Filière Maïs, Ministère de l’Agriculture, 2004 30 Maize production, Jéan du Plessis, 2003 31 Statistique Agricole, 2005 to 2008 32 Instabilité des cours de maïs et incertitude en milieu rural: le cas de la déforestation dans la région de Tuléar (Madagascar), Faroux, 2000 33 Projet Objectif Sud, Sécurité alimentaire et développement économique pour le grand sud e Madagascar, Dillot, 2000 and Evaluation globale de la coopération de l’Union Européenne dans les domains agricoles et du développement rural – Madagascar, 1998.
Fig. 9 – Maize: poor harvest and decrease in production (% HHs)

CFSVA+N Madagascar 2010
30
Climate overview
Madagascar’s climate is broadly bi-modal with two distinct periods, a warm wet season (from October to April) and a cool dry season (from May to September). This general description is subject to geographical variation as the dry season is well defined and long (up to eight months) in the southwest, while in the northeast there is no proper dry season to speak of, at most 2-3 months of reduced rainfall.
The seasonal rainfall spatial pattern in Madagascar is broadly one of a northeast to southwest decreasing rainfall gradient: in the southwest, climate is semi-desert (Sahelian) while the north-eastern coast is sub-equatorial with year-round high rainfall and humidity.
While 41 percent of all households report a decrease in maize production the percentage rises to more than half in the southern zone (54 percent) mainly due to crop failures caused by low and erratic rainfall over three consecutive years.34 It is also the zone with the shortest harvest (56 percent of households had a short harvest). Overall, a third of households cultivating maize are net consumers and 38 percent net producers. The highest percentage of net consumers (68 percent) and the lowest of net producers (14 percent) are in the southern zone, which is alarming since the zone has such a high concentration of maize producers.
The net consumption situation in the other two zones where maize production is important is much higher, with 25 percent net consumers in the western and only 13 percent in the large farming plains. Considering these results and the positive cereal equivalent balance, the latter has the greatest potential in terms of surplus.
3.3 NATURAL DISASTERS AND CLIMATE CHANGE
After the Comoros Islands Madagascar is the African country most exposed to climatic shocks. Over the past 35 years at least 50 natural disasters, including cyclones, drought, epidemics, floods, famines and locust infestations, have affected more than 11 million people35.
34 Rapid Joint Crop and Food Security Assessment Mission, FAO/WFP, 2009 and Rapid Joint Crop and Food Security Assessment Mission, FAO/WFP/Ministry of Agriculture, June 2010. 35 EM-DAT: The OFDA/CRED International Disaster Database, www.emdat.be - Université catholique de Louvain - Brussels - Belgium.
CFSVA+N Madagascar 2010
31
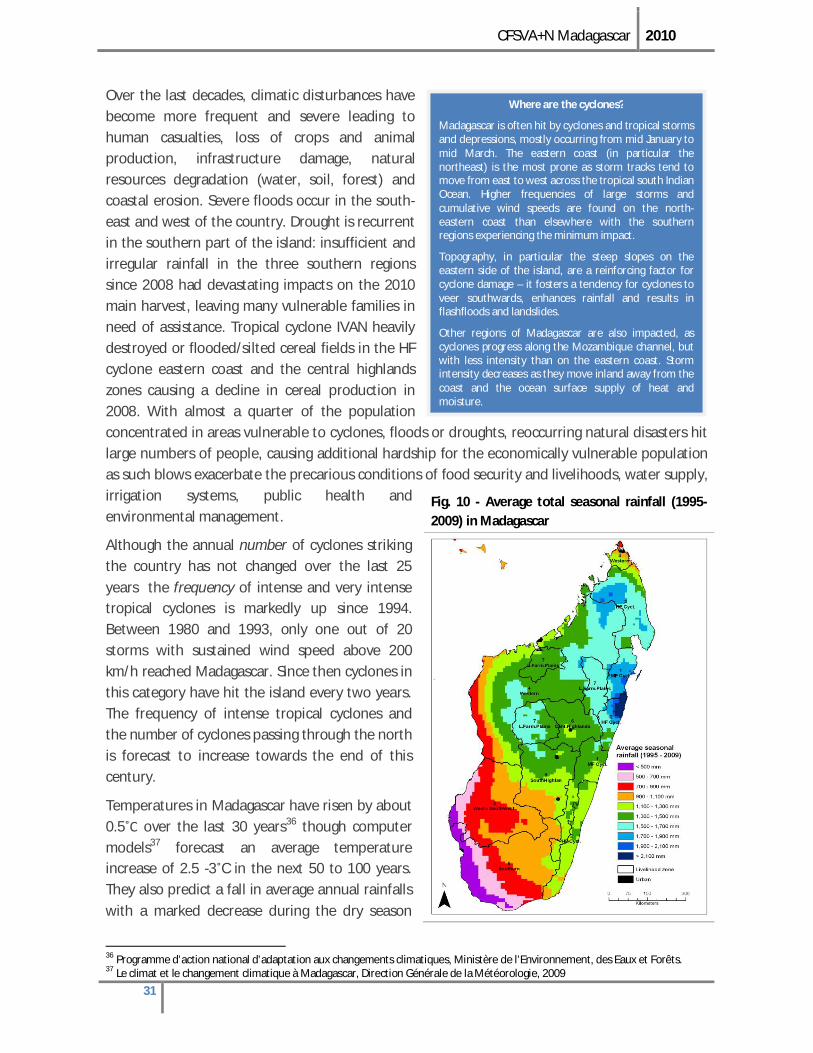
Where are the cyclones?
Madagascar is often hit by cyclones and tropical storms and depressions, mostly occurring from mid January to mid March. The eastern coast (in particular the northeast) is the most prone as storm tracks tend to move from east to west across the tropical south Indian Ocean. Higher frequencies of large storms and cumulative wind speeds are found on the north-eastern coast than elsewhere with the southern regions experiencing the minimum impact.
Topography, in particular the steep slopes on the eastern side of the island, are a reinforcing factor for cyclone damage – it fosters a tendency for cyclones to veer southwards, enhances rainfall and results in flashfloods and landslides.
Other regions of Madagascar are also impacted, as cyclones progress along the Mozambique channel, but with less intensity than on the eastern coast. Storm intensity decreases as they move inland away from the coast and the ocean surface supply of heat and moisture.
Over the last decades, climatic disturbances have become more frequent and severe leading to human casualties, loss of crops and animal production, infrastructure damage, natural resources degradation (water, soil, forest) and coastal erosion. Severe floods occur in the south-east and west of the country. Drought is recurrent in the southern part of the island: insufficient and irregular rainfall in the three southern regions since 2008 had devastating impacts on the 2010 main harvest, leaving many vulnerable families in need of assistance. Tropical cyclone IVAN heavily destroyed or flooded/silted cereal fields in the HF cyclone eastern coast and the central highlands zones causing a decline in cereal production in 2008. With almost a quarter of the population concentrated in areas vulnerable to cyclones, floods or droughts, reoccurring natural disasters hit large numbers of people, causing additional hardship for the economically vulnerable population as such blows exacerbate the precarious conditions of food security and livelihoods, water supply, irrigation systems, public health and environmental management.
Although the annual number of cyclones striking the country has not changed over the last 25 years the frequency of intense and very intense tropical cyclones is markedly up since 1994. Between 1980 and 1993, only one out of 20 storms with sustained wind speed above 200 km/h reached Madagascar. Since then cyclones in this category have hit the island every two years. The frequency of intense tropical cyclones and the number of cyclones passing through the north is forecast to increase towards the end of this century.
Temperatures in Madagascar have risen by about 0.5˚C over the last 30 years36 though computer models37 forecast an average temperature increase of 2.5 -3˚C in the next 50 to 100 years. They also predict a fall in average annual rainfalls with a marked decrease during the dry season
36 Programme d’action national d’adaptation aux changements climatiques, Ministère de l’Environnement, des Eaux et Forêts. 37 Le climat et le changement climatique à Madagascar, Direction Générale de la Météorologie, 2009
Fig. 10 - Average total seasonal rainfall (1995-2009) in Madagascar
CFSVA+N Madagascar 2010
32
and an intense increase during the rainy season - except for the southern part where rainfalls will remain the lowest, with an extension of the drought period. Such warming will disrupt the agro climate and force changes in the farming system and economic orientations of the regions.
Droughts have taken a greater grip on the country in the past seven years with the exception of 2006/07. The 2005/06 season and the period between the 2007/08 and 2009/10 seasons were particularly difficult. Drought impacts on crops are far more severe in areas of lower rainfall, such as the southern and southwestern regions than in areas of high or very high rainfall (north and northeast) where fluctuations occur mostly above the crops’ water requirements.
Different crops have different water requirements so what is drought for one is not necessarily drought for another. For example the probability of drought for cassava is generally lower than the probability of drought for maize because of the lower water requirements of the crop.
The differences in sensitivity to water deficits are made clear by the production figures for 2010 – maize production fell in the southern and south western livelihood zones by 25 percent and 21 percent respectively, compared to insignificant variations (drops of 3 percent and 5 percent respectively) in cassava production (compared to the mean of the previous five years).
Considering the water requirements of a standard maize crop and the sensitivity of this crop to water supply deficits during key stages of its development (flowering and early grain filling) it is questionable whether maize is the most suitable crop for the southern and western regions.
The exception is in the extreme south of the country where cassava has higher probabilities of drought compared to maize because the rainfall season here is quite short and the water supply may be insufficient for such a long development cycle crop.
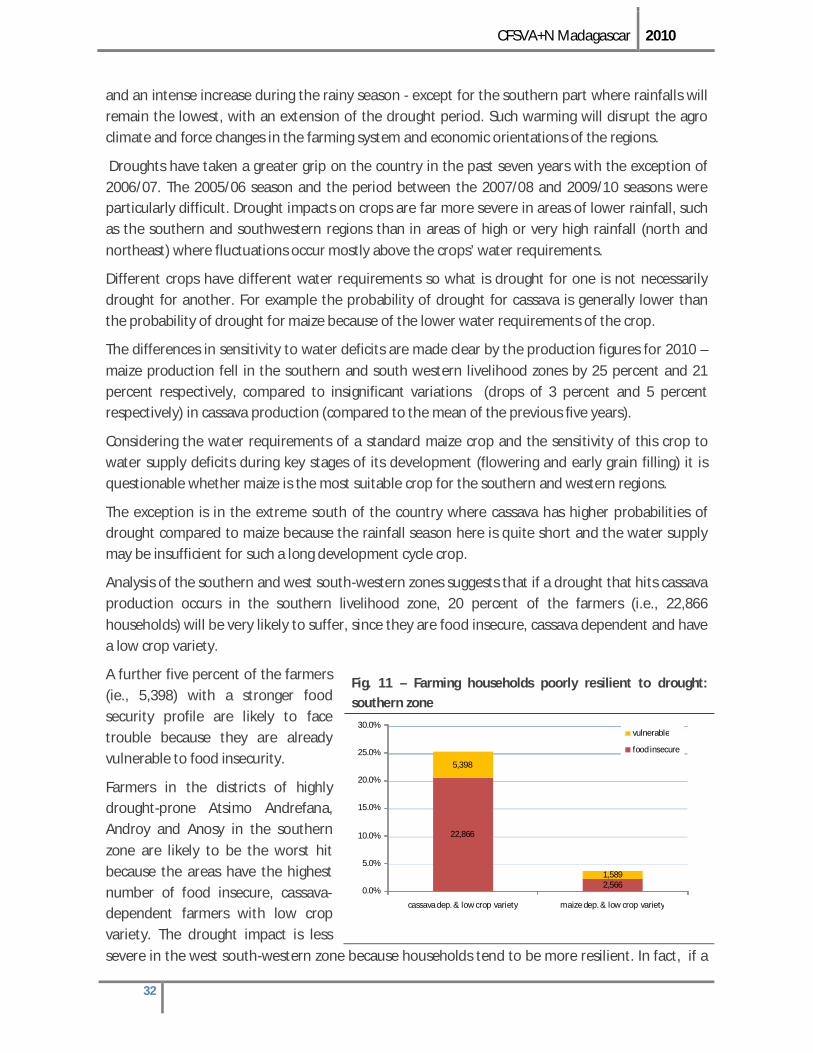
Analysis of the southern and west south-western zones suggests that if a drought that hits cassava production occurs in the southern livelihood zone, 20 percent of the farmers (i.e., 22,866 households) will be very likely to suffer, since they are food insecure, cassava dependent and have a low crop variety.
A further five percent of the farmers (ie., 5,398) with a stronger food security profile are likely to face trouble because they are already vulnerable to food insecurity.
Farmers in the districts of highly drought-prone Atsimo Andrefana, Androy and Anosy in the southern zone are likely to be the worst hit because the areas have the highest number of food insecure, cassava-dependent farmers with low crop variety. The drought impact is less severe in the west south-western zone because households tend to be more resilient. In fact, if a
Fig. 11 – Farming households poorly resilient to drought:
southern zone
22,866
2,566
5,398
1,589
0.0%
5.0%
10.0%
15.0%
20.0%
25.0%
30.0%
cassava dep. & low crop variety maize dep. & low crop variety
vulnerable
food insecure

CFSVA+N Madagascar 2010
33
Measuring poverty
Wealth: Non-productive assets and some aspects of housing infrastructure give a good idea of a household’s prosperity. Combining them into a household wealth index (WI), gives a proxy indicator of wealth. The variables used in a principal components analysis included: ownership of at least one table, chair, bed, kerosene lamp, bike, radio, watch, mobile phone, TV, DVD, iron, improved water source and / or treated water, crowding index, type of floor. See annex II of the detailed Full Report.
Expenditure: The survey examined the expenditure patterns of the sampled households as they can be considered a proxy for purchasing power. Income: The survey collected the income derived by each earning activity as total income provides an opportunity for relative comparisons of purchasing power among different zones and groups.
A note on income groups
Some 60% of the surveyed households work in agriculture, 43% as their main activity. There are four chief income groups: small farmers cultivating less than one hectare (20%), informal sector workers (20%), medium/big farmers cultivating more than one hectare (19%) and casual labourers (16%).
Informal sector w orkers have no formal contract with an employee and include drivers, guardians, artisans, small traders, shop-keepers, etc. Casual labourers are daily labourers who are usually (but not necessarily) employed in the agricultural sector, but different to agricultural labourers because they don’t have a stable occupation. The rise in unemployment caused by the domestic crisis has fuelled an increase in the number of informal sector workers and casual labourers. Such workers are often vulnerable and exposed to economic shocks.
The percentage of small farmers is higher in the west south-western zone (33%), while medium/big farmers are more concentrated in the western and large farming plains (28%). The central and southern highlands have the lowest percentage of farmers because of the significant presence of informal sector workers. Casual labourers are more present in the eastern part of the country, with peaks in the MF cyclone eastern coast (23%) and the large farming plains (22%).
drought hits cassava production here, nine percent of the farmers (ie., 8,160 households) will be very likely to suffer and another 9 percent will probably face hardship.
3.4 PERSISTENT POVERTY
More than 75 percent of the 20 million population live on less than a dollar a day, severely hampering their ability to cope with food insecurity.
Madagascans devote some 66 percent of their expenditures to food, with soap and clothes accounting for the next largest portion of their spending at six percent each. The lion’s share of their food bill is spent on rice (32 percent), followed by tubers (eight percent) meat (seven percent), oil and sugar (five percent each).
In terms of wealth quintiles (see box) the southern livelihood zone has by far the highest prevalence of poverty with 71 percent of households in the two poorer wealth quintiles, of which 40 percent are in the poorest. This zone is followed by the west south-western, where 44 percent of households fall into the two lowest quintiles (which is close to the national average), 27 percent of which are in the poorest quintile.
Casual labourers are by far the poorest income group by asset ownership across all zones except in the MF cyclone eastern coast and west south-western, where the small farmers are the poorest38. Generally the small farmers are the second poorest income group. Perhaps surprisingly the percentage of poorest/poor among the informal sector workers and medium / big farmers is below the country average.
38 In several zones (ie., Medium and High Frequency Eastern Coast, the West-South Western and the Southern) agricultural labourers showed the highest level of poverty but the number of households was too small to support such evidence.

CFSVA+N Madagascar 2010
34
Female-headed households and households that experienced a recent death are more likely to fall into the poorest wealth quintiles. Poorer households have a higher percentage of dependents and higher crowding index39.
In terms of per capita income and expenditure the southern zone again fares worst: 60 percent of its households are in the poorest/poor income quintiles and half are in the two lowest expenditure quintiles. The MF cyclone eastern coast also raises concerns, because despite a generally good performance on the asset side, households report low expenditures and low income. Casual labourers report low income and expenditures, thus confirming a tendency towards poverty while more than half of small farmers are in the poorest wealth quintiles, 60 percent have low income and a considerably high percentage have the lowest/low per capita expenditures.
Asked what they perceived to be the main changes in expenditures households say they have seen the biggest increase in education and food (67 percent and 62 percent respectively), perhaps because of the Government reducing grants for school fees.
While no major difference has been noticed between the zones on education expenditures, the percentage of households reporting an increase in food expenditure is as high as 90 percent in the west south-western. Price hikes in agricultural inputs were mentioned more frequently in the large farming plains, the southern and west south-western zones.
Table 3 – Per capita expenditures, income and wealth by livelihood zones (Percentage of households in the two lowest quintiles)
Livelihood zones Total per capita expenditures (lowest/low)
Per capita income (poorest/poor)
Wealth quintiles (poorest/poor)
Central highlands 31 % 23 % 15 %
HF cyclone eastern coast 48 % 49 % 42 %
Large farming plains 25 % 30 % 37 %
MF cyclone eastern coast 56 % 47 % 38 %
Southern 50 % 60 % 71 %
Southern highlands 25 % 37 % 43 %
Western 52 % 36 % 36 %
West south-western 8 % 27 % 44 %
39 Crowding index is the number of persons per room (equal to household size divided by number of rooms in the dwelling, toilet and kitchen excluded). Dependents are non working age people (either above 60 or below 15 years old).

CFSVA+N Madagascar 2010
35
Table 4 – Per capita expenditures, income and wealth by income groups (Percentage of households in the two lowest quintiles)
Income groups Total per capita expenditures (lowest/low)
Per capita income (poorest/poor)
Wealth quintiles (poorest/poor)
Small farmers 46 % 60 % 53 % Medium/big farmers 48 % 46 % 31 % Informal labourers 32 % 29 % 32 % Public sector salaried/remittances
28 % 14 % 21 %
Casual labourers 48 % 49 % 58 % Agro pastoralists 33 % 33 % 44 % Fisher folks 38 % 35 % 40 % Private sector salaried 7 % 7 % 5 % Other activities 33 % 23 % 36 % Agric. labourers 53 % 43 % 37 %
3.5 LACK OF INFRASTRUCTURE AND ACCESS TO MARKETS
Crop surpluses protect households from external shocks such as price rises and crop failures – but only when there are proper storage facilities and good road networks. By ensuring the preservation of harvest, storage allows producers to sell when prices are most favourable or at a time convenient to them. By connecting producers to markets, roads allow them to turn surpluses into cash.
The lack of access to market and storage facilities and poor communication infrastructures leave many remote areas isolated and unable to trade surpluses or obtain agricultural inputs, particularly in the December to March rainy season when entire regions become periodically inaccessible. During this two month period travel to market is disrupted in virtually all zones because of poor road conditions and prices are at their highest
Almost a quarter of the sampled Fokontany don’t have a market. Of those the nearest one is up to three hours away. Only the west south-western and large farming plains have more opportunities of exchange with a market in two Fokontany out of five. The HF cyclone eastern coast, the west south-western and the large farming plains are the least isolated areas and the MF cyclone eastern coast and the southern the most isolated.
Walking is still the most used means of transport in rural Madagascar, with the nearest bush-taxi typically a one to three hour walk from the community. Though it varies greatly by zone the average cost of transport, linking the Fokontany to the district capital, is 5000 Ariary. For example, in the MF cyclone eastern coast it costs the equivalent of 0.7 kg of rice per hour and over 2 kg of rice per hour in the large farming plains. Such variations are mainly down to poor infrastructure, but also because of oligopolistic behaviour and collusion between collectors and wholesalers.
3.6 DEPENDENCY ON BUYING FOOD
More than two thirds of food is purchased. Some 62 percent of households report “purchase” as the main source for rice, the most consumed food and the most produced crop in the country.

CFSVA+N Madagascar 2010
36
Informal sector workers are most likely to purchase their food while medium/big farmers are least likely, followed by agro-pastoralists and small farmers, indicating that land access and agricultural production are associated with less market dependency.
The highest dependency on purchase is found in the west south-western zone and the minimum in the western, though it should be noted that the survey was carried out in September which coincides with the harvesting of the first season of rice, which heavily influences households’ purchasing behaviour.
Table 5 – Number of months HHs purchase rice and cassava at the market rice procured
at the market cassava procured at the market
Average no. months
>6months ( percentHHS)
Average no. months
>6months ( percentHHS)
MF cyclone eastern coast 6.3 57 percent 2.5 18 percent
HF cyclone eastern coast 7.3 59 percent 5.3 42 percent
West south -western 8.7 70 percent 8.6 70 percent
Western 5.9 46 percent 6.9 60 percent
Southern 10.2 86 percent 9.0 80 percent
Central highlands 6.7 58 percent 5.0 42 percent
Large farming plains 6.0 45 percent 3.7 29 percent
Southern highlands 6.3 49 percent 4.6 37 percent
Madagascar 6.8 56 percent 5.6 46 percent

CFSVA+N Madagascar 2010
37
4. STATE OF MALNUTRITION
adagascar is one of the 20 countries in the world with the highest burden of under-
nutrition40. About a quarter of the population is undernourished (up from about a fifth in the 1990s) i.e., their food intake regularly provides less than their minimum dietary energy requirements (MDER: 2133 kcal per adult equivalent per day)41. Children are particularly susceptible to malnutrition and are the most affected.
4.1 GLOBAL ACUTE MALNUTRITION
OF UNDER FIVES
Overall, the global acute malnutrition (GAM) prevalence for children under five in the rural zones covered by the August/September 2010 CFSVA+N is 5.4 percent (176,000 children). The proportion is highest in the southern zone at 7.1 percent where poor and erratic rainfall has impacted the harvest. This zone is followed by the MF cyclone eastern coast, which was hit by tropical storm Hubert in March 2010 resulting in wide-spread flooding of cultivatable land, and the western zone, both with GAM rates of 6.2 percent.
GAM prevalence, also referred to as wasting, was calculated using weight-for-height and/or oedema based on the WHO standards (2006).
Infants are most vulnerable between six and 23 months of age (8.3 percent suffer GAM) as they explore different foods and their environment and experience the maturation of their immune system. But it is of great concern that 4.1 percent of children under six months of age suffer from GAM, at a time when they should be exclusively breastfed and less likely to be exposed to pathogens.
There is a higher prevalence of acute malnutrition among boys (6.2 percent) than girls (4.6 percent). This difference between the sexes is particularly marked in the HF cyclone east coast, the western zone and the west south-western zone: in the latter 6.5 percent of boys suffer from acute malnutrition compared to 1.2 percent of girls.
40 Lancet Nutrition Series 2008 41 The State of the World Food Insecurity, FAO, 2010
M Fig. 12 - Distribution of wasting by livelihood zone

CFSVA+N Madagascar 2010
38
A note on maternal education
By far the highest proportion of uneducated women are found in the southern zone where over 60% have no education compared with an average of 28% for the rest of rural Madagascar. The central highlands fares best: here 31% of women are educated to
secondary level and 56% to primary level.
Fig. 13 – Prevalence of malnutrition by health status of the child
Table 6 - Global acute malnutrition by livelihood zone and sex
Boys Girls
P*
Global Acute Malnutrition
(%)
95% Confidence
Interval
Global Acute Malnutrition
(%)
95% Confidence
Interval
MF cyclone east coast
6.9 [4.4 - 10.5] 5.6 [3.7 - 8.6] 0.3 HF cyclone east coast
6.2 [4.9 - 7.8] 4.4 [4.3 - 6.6] 0.03 West- Southwestern 6.5 [3.7 - 11.2] 1.2 [0.4 - 3.7] 0.0003 Western 7.9 [6.0 - 10.4] 4.3 [2.9 - 6.5] 0.006 Southern 8.6 [6.2 - 11.8] 5.6 [4.3 - 7.3] 0.05 Central highland 4.0 [2.4 - 6.6] 3.5 [2.3 - 5.5] 0.5 Large farming Plains 5.0 [3.6 - 7.0] 5.6 [4.1 - 7.5] 0.5 Southern Highlands 3.8 [2.5 - 5.7] 4.5 [2.5 - 7.9] 0.6
Madagascar 6.2 [5.4 - 7.1] 4.6 [3.9 - 5.3] 0.0007
As expected the prevalence of GAM in children is higher in the poorest households at 6.7 percent for those in the lowest quintile compared with 2.5 percent in the highest. There is also a significantly higher level of GAM among mothers with no or only primary level education (6.2 percent) compared to mothers with secondary level education or more (1.7 percent).
Unsurprisingly children from households with a poor food consumption profile are significantly more likely to have acute malnutrition than those from households with acceptable consumption at 8 percent versus 3.7 percent. Similarly there is a significantly higher prevalence of GAM among the under fives in food insecure households (6.5 percent) than food secure (4.1 percent).
Overall, GAM prevalence is significantly higher (7 percent) among children who were sick in the two weeks running up to the survey. In fact the odds of a child suffering from acute malnutrition is 64 percent higher if the child is sick in this period, but even greater for babies under six months who are 90 percent more likely to suffer acute malnutrition if they are ill, highlighting the importance of promoting exclusive breastfeeding for this age group because of the protection it affords them42.
42 WHO Collaborative Study Team on the Role of Breastfeeding on the Prevention of Infant Mortality. Effect of breastfeeding on infant and childhood mortality due to infectious diseases in less developed countries: a pooled analysis. Lancet, 2000, 355:451–455.

CFSVA+N Madagascar 2010
39
Acute malnutrition is more prevalent among 6-23 month olds who did not receive an acceptable diet the day before the survey, compared with children who did have an acceptable diet (7.7 percent vs 3.8 percent).
For infants under six months, acute malnutrition prevalence is higher for those not exclusively breast fed at 29 percent compared with 20 percent for those who are exclusively breastfed. Morbidity levels are also higher for those not exclusively breastfed (65 percent compared with 35 percent).
In order to ascertain the perception of acute malnutrition the community based questionnaire asked “Do you think there are many thin children in your community? If yes, do you view this as a problem?”
Overall 67 percent of communities stated that they have a lot of thin children in their community of which 93 percent considered it problematic. The proportion varies from 89 percent in the west south-western zone and 88 percent in the southern zone to only 38 percent in the central zone.
4.2 WHO IS AT GREATEST RISK OF ACUTE MALNUTRITION?
The characteristic that emerged as significantly associated with acute malnutrition in children in order of impact are:
Children under five whose mothers have no education or just have primary education Children under five who are or were ill. Children under five in food insecure households Children under five in poorer households Children in the 6-23 month age group
For children under two years old, a different set of characteristics emerged as significant in order of impact:
Children whose mothers have no education or just have primary education. Children under two who are or were ill. Children under two who do not receive acceptable infant feeding (complementary or exclusive
breastfeeding) If a child is a boy
Neither household food insecurity nor household wealth is associated with wasting, yet maternal education is. This suggests that poor infant feeding habits impacts a child’s nutritional status irrespective of wealth and food security in Madagascar.
Fig. 14 - Proportion of infants < 6 months who were sick in the 2 weeks prior to the survey by breastfeeding status
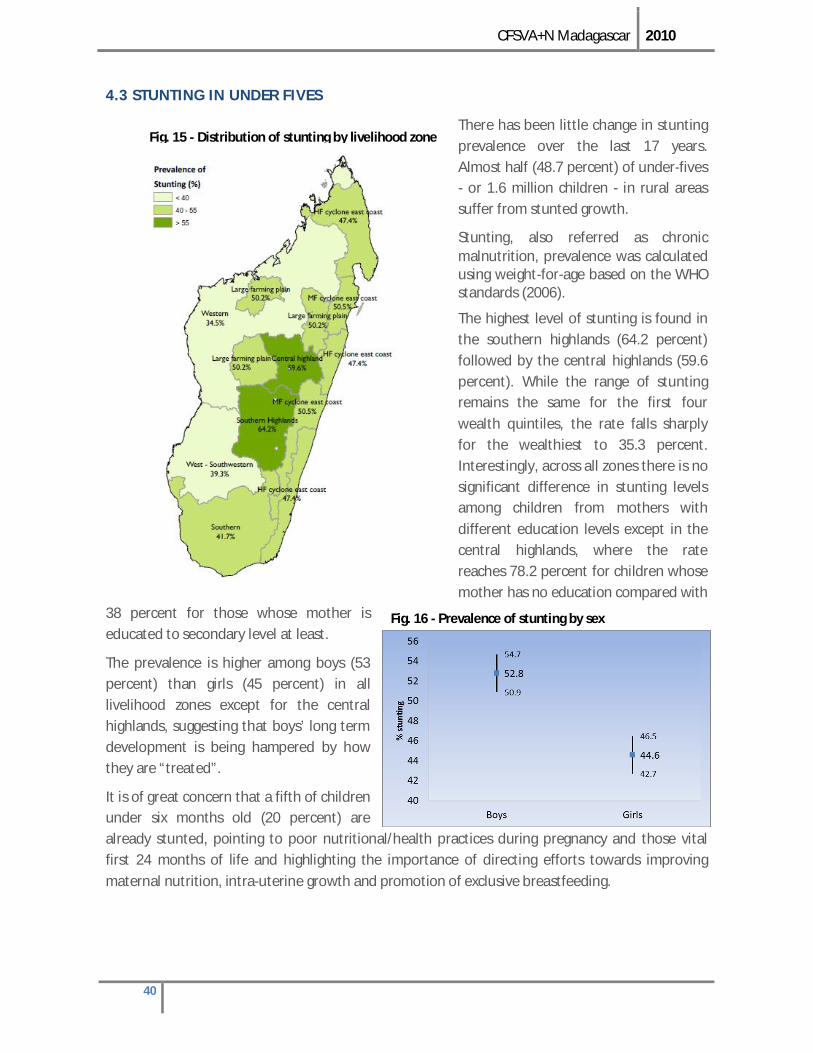
CFSVA+N Madagascar 2010
40
4.3 STUNTING IN UNDER FIVES
There has been little change in stunting prevalence over the last 17 years. Almost half (48.7 percent) of under-fives - or 1.6 million children - in rural areas suffer from stunted growth.
Stunting, also referred as chronic malnutrition, prevalence was calculated using weight-for-age based on the WHO standards (2006).
The highest level of stunting is found in the southern highlands (64.2 percent) followed by the central highlands (59.6 percent). While the range of stunting remains the same for the first four wealth quintiles, the rate falls sharply for the wealthiest to 35.3 percent. Interestingly, across all zones there is no significant difference in stunting levels among children from mothers with different education levels except in the central highlands, where the rate reaches 78.2 percent for children whose mother has no education compared with
38 percent for those whose mother is educated to secondary level at least.
The prevalence is higher among boys (53 percent) than girls (45 percent) in all livelihood zones except for the central highlands, suggesting that boys’ long term development is being hampered by how they are “treated”.
It is of great concern that a fifth of children under six months old (20 percent) are already stunted, pointing to poor nutritional/health practices during pregnancy and those vital first 24 months of life and highlighting the importance of directing efforts towards improving maternal nutrition, intra-uterine growth and promotion of exclusive breastfeeding.
Fig. 15 - Distribution of stunting by livelihood zone
Fig. 16 - Prevalence of stunting by sex
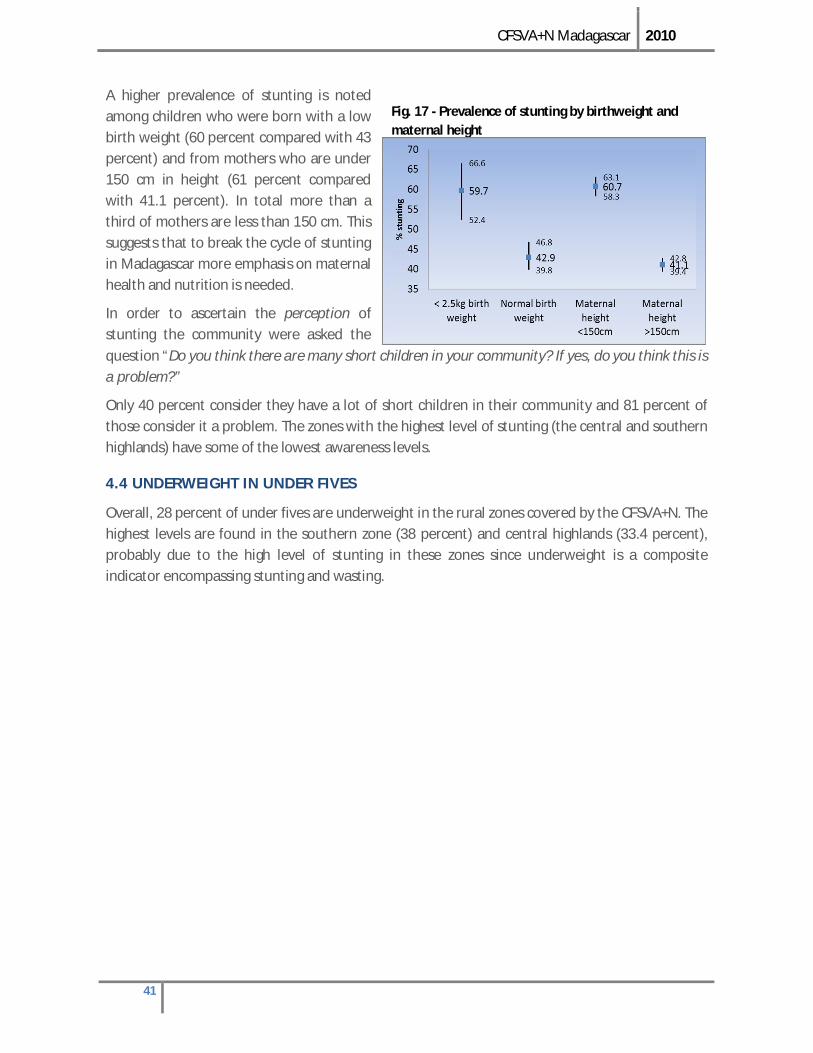
CFSVA+N Madagascar 2010
41
A higher prevalence of stunting is noted among children who were born with a low birth weight (60 percent compared with 43 percent) and from mothers who are under 150 cm in height (61 percent compared with 41.1 percent). In total more than a third of mothers are less than 150 cm. This suggests that to break the cycle of stunting in Madagascar more emphasis on maternal health and nutrition is needed.
In order to ascertain the perception of stunting the community were asked the question “Do you think there are many short children in your community? If yes, do you think this is a problem?”
Only 40 percent consider they have a lot of short children in their community and 81 percent of those consider it a problem. The zones with the highest level of stunting (the central and southern highlands) have some of the lowest awareness levels.
4.4 UNDERWEIGHT IN UNDER FIVES
Overall, 28 percent of under fives are underweight in the rural zones covered by the CFSVA+N. The highest levels are found in the southern zone (38 percent) and central highlands (33.4 percent), probably due to the high level of stunting in these zones since underweight is a composite indicator encompassing stunting and wasting.
Fig. 17 - Prevalence of stunting by birthweight and maternal height

CFSVA+N Madagascar 2010
42
5. INFANT AND YOUNG CHILD FEEDING PRACTICES AND HOUSEHOLD FOOD SECURITY
nfant and young child feeding and household food security are important underlying causes of malnutrition. They
influence a child’s dietary intake which subsequently has an impact on the child’s nutritional status. In addition inadequate infant feeding practices adversely affect a child’s health which in turn influences the child’s nutritional status. As seen in chapter 4, there is a higher prevalence of acute malnutrition and morbidity among non-exclusively breastfed infants under six months compared with exclusively breastfed. This also holds for 6-23 month old children who have not received an acceptable diet compared with those that have.
5.1 BREASTFEEDING PRACTICES
Overall 74.5 percent of children under six months were exclusively breastfed the day before the survey with the lowest level in the southern (57 percent) and west south-western zones (61 percent). No difference in exclusive breastfeeding habits is noted by household wealth or maternal education, but a significantly higher proportion of girls (82 percent) are exclusively
breastfed than boys (68 percent).
This difference in sexes may explain the higher acute malnutrition and stunting levels among the boys. The results suggest that there are widespread cultural beliefs related to exclusive breastfeeding that are different for boys and girls and that these beliefs transcend maternal education levels and wealth.
While the proportion of babies put to the breast within an hour of birth is low at 58.5 percent, it drops as low as 29 percent in the
southern zone. It is higher if the mother is educated to secondary level or beyond (64.5 percent, and lower if they have no education (50.3 percent). It is also lower if the mother sought antenatal
I A note on low birth weight
Only 26% of new-borns are weighed with the lowest proportion in the southern zone (8%). The proportion steadily increases with each wealth quintile from 5.4% for the lowest quintile to 56% for the highest. A similar pattern is seen for maternal education: just 9% of babies born to women with no education are weighed rising to 30% for those with primary education and 58% for those with secondary. Babies of mothers who sought professional antenatal care are nearly four times more likely to have been weighed at birth (30% versus 7.5%).
In total, 13.5% of children who were weighed at birth were less than 2.5kg i.e. of low birth weight with the percentage peaking in the HF cyclone east coast zone at 27%. These are likely to be underestimates since it only refers to children alive at the time of the survey: infants with a low birth weight have a higher mortality risk and may have died prior to the survey.
Fig. 18 - Proportion of infants < 6 months exclusively breastfed by sex

CFSVA+N Madagascar 2010
43
follow-up from a traditional birth attendant (47 percent) compared to those who sought antenatal follow-up from a health professional (61 percent), irrespective of maternal education. This suggests that parenting education may compensate for poor education levels with regards to behaviour change.
5.2 INTRODUCTION OF SOLID, SEMI-SOLID AND SOFT FOODS
The vast majority of children receive solid foods by the age of nine months (91 percent). However, 21 percent of infants are given solid foods before six months with nearly twice as many boys (28 percent) as girls (15 percent) given solid or semi-solid foods before this age. Of those that are given solid, semi-solid or soft foods before six months, 67 percent are given grain, roots and/or tubers.
5.3 COMPLEMENTARY FEEDING PRACTICES
Infant feeding practices for 6-23 month old are very poor with only 13 percent having received the minimum acceptable diet, which encompasses meal frequency and dietary diversity. The lowest proportion is in the southern zone (three percent) and highest in the west south-western (19 percent).
The mother’s education status has a major impact on whether a child receives the minimum acceptable diet: 30 percent of children whose mothers are educated to secondary level have a minimum acceptable diet compared with just 9 percent of those who are educated to primary level. The difference between the wealth quintiles is also particularly marked: 31 percent of children in households in the highest quintile receive a minimum acceptable diet against about 10 percent for those in the other four quintiles.
Regarding household food consumption profile significantly more children from households with an acceptable food consumption profile are benefiting from an acceptable dietary intake compared to households with borderline or poor food consumption. Nevertheless this still remains low with only 19 percent of children in these households receiving the minimum acceptable diet. Interestingly fewer children received the minimum acceptable diet in households with a borderline food consumption profile (six percent) than those in households with a poor food consumption profile (nine percent). An analysis of the characteristics of households with borderline food consumption profile shows that these households are more likely to sell micronutrient rich foods such as vegetables in order to purchase staples and less nutritious foods and non-food items.
Fig. 19 - Proportion of children 6-23.9 months of age who receive the minimum acceptable diet by maternal education

CFSVA+N Madagascar 2010
44
Overall meal frequency is acceptable with 73 percent of children (breastfed and non-breastfed) having received the minimum number of meals in the day prior to the survey. However, the proportion dips to just 33 percent in the southern zone. For dietary diversity the situation is far worse with only 14 percent of the 6-23 month age group having received the minimum dietary diversity and is as low as 11 percent for those whose mothers have no education, rising to 34 percent for those with secondary level education or more. The same disparity is seen by household wealth, with 39 percent of children in households in the highest quintile receiving a minimum dietary diversity compared with only 10 percent of children in the other four.
Infants between six months and a year old have the worst dietary diversity with only 7.9 percent receiving the minimum dietary diversity, rising to 19 percent for those in the 12-18 month age group and 16 percent in the 18-24 month group. What’s more they are fed less micronutrient- rich foods than older children, a worrying trend and opposing recommendations for this age group whose requirements are no longer being met by breast milk alone.
Unsurprisingly grains/roots and tubers form a key part of a child’s diet across all age groups and livelihood zones with more than 95 percent of children consuming them. However the consumption of “flesh foods” and vitamin A rich foods varies by livelihood zones with the lowest levels found in the southern zone.
Optimal complementary feeding depends not only on what is fed, but also on how, when, where and by whom the child is fed. Overall, 65 percent of children are reportedly helped to eat and 71 percent encouraged eating. But in the southern zone only half (51 percent) are helped to eat. The HF cyclone east coast has the lowest proportion encouraged to eat (52 percent) followed by the southern (57 percent).
While 92 percent of those in the highest wealth bracket encourage their children to eat, this slips to 57 percent for the poorest. And 90 percent of children whose mothers have secondary level
Which households have borderline food consumption?
Those that:
Are “casual labourer” or vegetable sellers Spend more on rice rather than on other cereals (they eat
less maize) Spend more on sugar/salt Spend more on traditional medicines and clothes Are casual labourer or vegetable sellers. Practise more cash crop agriculture (rice, cane sugar or
exported crops) Are net sellers (of cassava) with the main source of food
“own production”. Have younger head of household (under 24 years) or older
(over 60 years) Have more orphans (4% of children)
Fig. 20 - Proportion of children who received food from the different food groups by age group

CFSVA+N Madagascar 2010
45
education are encouraged to eat compared with 56 percent of those whose mothers have no education.

CFSVA+N Madagascar 2010
46
6. HEALTHY ENVIRONMENT AND CARE SEEKING BEHAVIOUR
he odds of a child suffering from acute malnutrition is 64 percent higher if the child is sick, with 7 percent of children who were sick in the two weeks before the survey suffering acute malnutrition compared with 4 percent of children who were not sick. During illness and recovery phase, the body requires more nutrients to fight disease and to rebuild. In addition sick children tend to have a poorer appetite which minimises their food intake. Considering this relationship between child illness and acute malnutrition as seen in chapter 4, it is important to look at the characteristics of children sick in the two weeks before the survey, care seeking behaviour for these children as well as preventative measures, including ensuring a healthy clean environment to improve child health.
6.1 CHILD HEALTH
In total, 44 percent of children were sick during this time period with the lowest proportion in the central highlands (25 percent) and the highest in the southern zone where twice as many children were sick (60 percent).
As for the types of illness, fever is more prevalent in the southern zone (29.5 percent compared with 19.5 percent overall) and acute respiratory infection (cough and rapid breathing) more prevalent in the MF cyclone east (14.8 percent versus 10 percent overall). Meanwhile diarrhea incidence is highest in both these zones at 19 percent compared with 13 percent throughout rural Madagascar.
Children between six and 17 months are most likely to be ill because they are being introduced to complementary food and are exploring their environment.
Again children from households in the lowest and second lowest wealth quintile are more likely to be sick compared with those in the richer quintiles. But from the third quintile onwards, wealth does not seem to have an impact on the probability of being sick and there is only very weak evidence that maternal education has an impact on the probability.
There is great variation in seasonal trends in morbidity with diarrheal disease affecting children mainly around May and June and acute respiratory disease affecting them in October and November according to monthly health centre data.
T
Fig. 21 - Morbidity in the two weeks prior to survey by age group

CFSVA+N Madagascar 2010
47
6.2 HEALTH SEEKING BEHAVIOUR
Treatment was sought for only 26 percent of sick children – again with a significant difference between livelihood zones, varying from 44.5 percent in the large farming plains to just 11.3 percent in the west south- western zone.
Younger children are more likely to be seen by a health provider - as are boys (28 percent compared with 23 percent for girls), suggesting again that boys are treated differently to girls, irrespective of maternal education and household wealth. The proportion of children for whom treatment is sought rises with increasing wealth index though no significant difference is seen by maternal education.
6.3 PREVENTATIVE TREATMENT FOR CHILDREN
Overall 77 percent of children are given vitamin A supplements at 11 - 59 months; 79 percent are de-wormed at the same age and the same percentage is vaccinated against measles between nine and 59 months. This varies considerably by livelihood zone with children in the central highlands given the highest percentage of preventative treatments at well over 90 percent for all three and once again those in the southern zone benefitting the least (around half are de-wormed and receive vitamin A supplements while 59 percent are vaccinated against measles). The further a child lives from a health centre the less likely he/she is to receive preventative care.
Maternal education also has a major impact with children whose mothers have no education less likely to receive preventative treatment. The same is true for wealth index with the lowest and second lowest quintile less likely to receive preventative treatment for their children compared with the richer quintiles. Interestingly, although a difference is seen between sick boys and girls with regards to seeking treatment, no difference is seen between the sexes for preventative
treatment.
Fig. 22 - Proportion of children sick in the two weeks prior to the survey for whom treatment was sought
Fig. 23 – Preventative care for under fives by maternal education
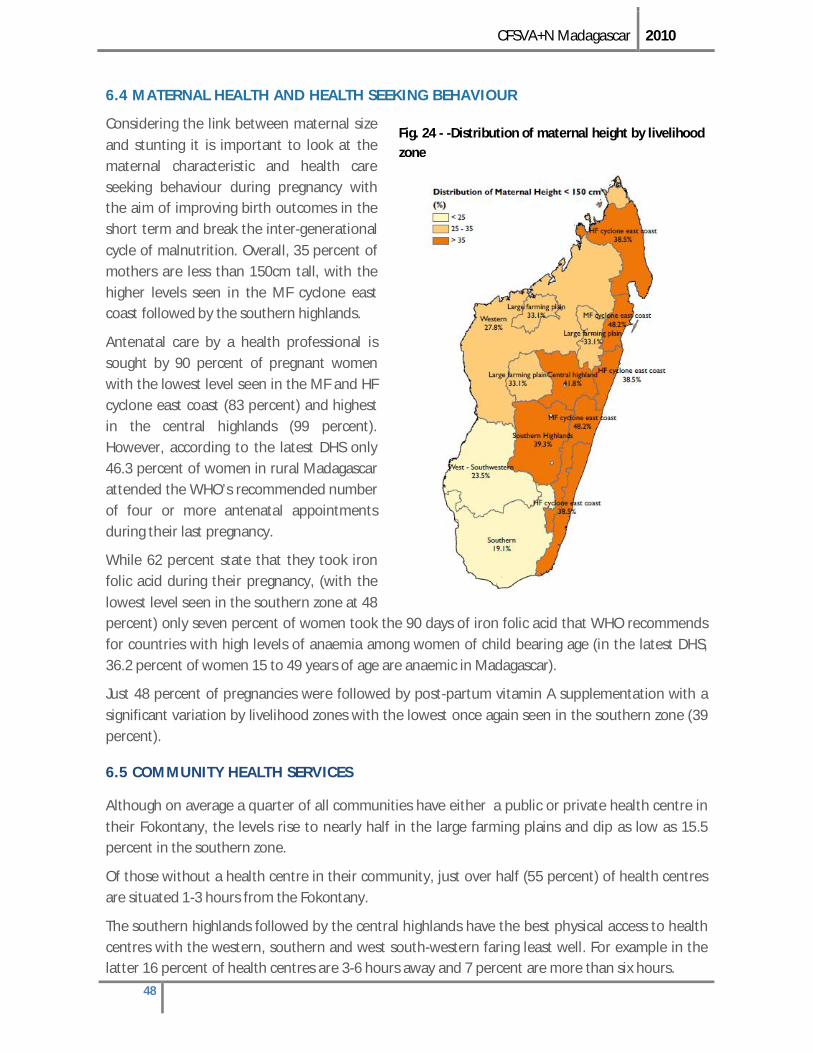
CFSVA+N Madagascar 2010
48
6.4 MATERNAL HEALTH AND HEALTH SEEKING BEHAVIOUR
Considering the link between maternal size and stunting it is important to look at the maternal characteristic and health care seeking behaviour during pregnancy with the aim of improving birth outcomes in the short term and break the inter-generational cycle of malnutrition. Overall, 35 percent of mothers are less than 150cm tall, with the higher levels seen in the MF cyclone east coast followed by the southern highlands.
Antenatal care by a health professional is sought by 90 percent of pregnant women with the lowest level seen in the MF and HF cyclone east coast (83 percent) and highest in the central highlands (99 percent). However, according to the latest DHS only 46.3 percent of women in rural Madagascar attended the WHO’s recommended number of four or more antenatal appointments during their last pregnancy.
While 62 percent state that they took iron folic acid during their pregnancy, (with the lowest level seen in the southern zone at 48 percent) only seven percent of women took the 90 days of iron folic acid that WHO recommends for countries with high levels of anaemia among women of child bearing age (in the latest DHS, 36.2 percent of women 15 to 49 years of age are anaemic in Madagascar).
Just 48 percent of pregnancies were followed by post-partum vitamin A supplementation with a significant variation by livelihood zones with the lowest once again seen in the southern zone (39 percent).
6.5 COMMUNITY HEALTH SERVICES
Although on average a quarter of all communities have either a public or private health centre in their Fokontany, the levels rise to nearly half in the large farming plains and dip as low as 15.5 percent in the southern zone.
Of those without a health centre in their community, just over half (55 percent) of health centres are situated 1-3 hours from the Fokontany.
The southern highlands followed by the central highlands have the best physical access to health centres with the western, southern and west south-western faring least well. For example in the latter 16 percent of health centres are 3-6 hours away and 7 percent are more than six hours.
Fig. 24 - -Distribution of maternal height by livelihood zone
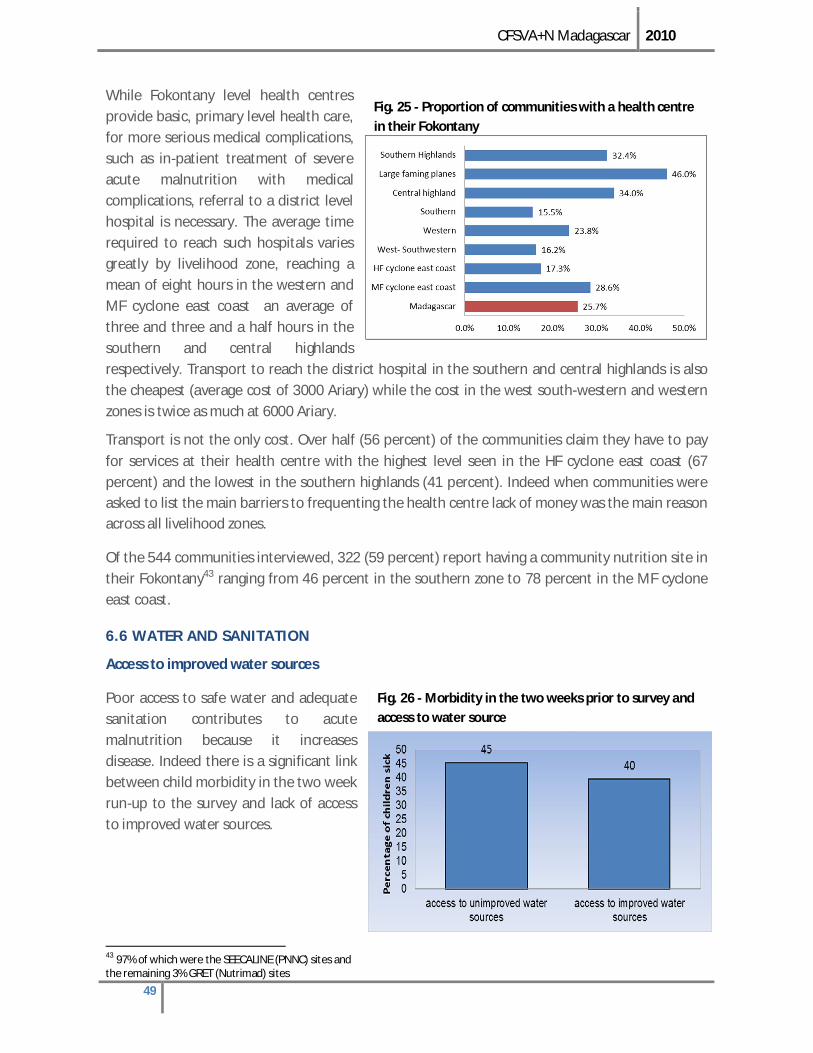
CFSVA+N Madagascar 2010
49
While Fokontany level health centres provide basic, primary level health care, for more serious medical complications, such as in-patient treatment of severe acute malnutrition with medical complications, referral to a district level hospital is necessary. The average time required to reach such hospitals varies greatly by livelihood zone, reaching a mean of eight hours in the western and MF cyclone east coast an average of three and three and a half hours in the southern and central highlands respectively. Transport to reach the district hospital in the southern and central highlands is also the cheapest (average cost of 3000 Ariary) while the cost in the west south-western and western zones is twice as much at 6000 Ariary.
Transport is not the only cost. Over half (56 percent) of the communities claim they have to pay for services at their health centre with the highest level seen in the HF cyclone east coast (67 percent) and the lowest in the southern highlands (41 percent). Indeed when communities were asked to list the main barriers to frequenting the health centre lack of money was the main reason across all livelihood zones.
Of the 544 communities interviewed, 322 (59 percent) report having a community nutrition site in their Fokontany43 ranging from 46 percent in the southern zone to 78 percent in the MF cyclone east coast.
6.6 WATER AND SANITATION
Access to improved water sources
Poor access to safe water and adequate sanitation contributes to acute malnutrition because it increases disease. Indeed there is a significant link between child morbidity in the two week run-up to the survey and lack of access to improved water sources.
43 97% of which were the SEECALINE (PNNC) sites and the remaining 3% GRET (Nutrimad) sites
Fig. 25 - Proportion of communities with a health centre in their Fokontany
Fig. 26 - Morbidity in the two weeks prior to survey and access to water source

CFSVA+N Madagascar 2010
50
The findings point to the fact that there has been no improvement in access to improved water sources since 2008. Only around a quarter (26 percent) of households have access to an improved water source in the dry season, increasing slightly to 27.7 percent in the rainy season with the lowest access seen in the southern zone (21.5 percent in the rainy season but dropping to 13.1 percent in the dry season). However, communities report periods when access to water (improved or unimproved) is difficult notably the months from September to November.
Overall, 38 percent of households report that they treat their drinking water44, mainly by boiling it (92 percent) with the lowest levels seen in the southern zone at just 12 percent. An analysis of water treatment by wealth quintiles reveals it is only the poorest that are less likely to treat their drinking water.
Access to improved sanitation
Just 2.6 percent of households report having access to improved sanitation varying from 6.2 percent in the central highlands to 0.2 percent in the southern zone. Worryingly, some 58.2 percent of households state that they practise open defecation and 93 percent of Fokontany state that open air defecation is practised in their Fokontany.
Hand washing
Only 21.7 percent of women report using soap to wash their hands following latrine use with the highest proportion in the central highlands
44 It is important to note that information on quality of treatment methods was not assessed so it is not known if the households appropriately treated then drinking water to ensure water safety.
Fig. 28 - Percentage of children sick in the two weeks prior to the survey by mothers’ hand washing practices
Fig. 27 - Percentage of households with access to improved water source during the dry season

CFSVA+N Madagascar 2010
51
(43.2 percent) and the lowest in the southern zone (10.5 percent).
Although no link was found between maternal hand washing and acute malnutrition, child morbidity is significantly higher among children whose mothers do not wash their hands. Not surprisingly soap usage is higher in communes in which soap is available to purchase (20.1 percent compared to 8.1 percent). While the vast majority of communities claim they have soap commercially available, only half (51 percent) of the communities in the southern zone have access.
Significantly more mothers from wealthier households wash hands than those from poor households. Indeed households state that 6 percent of their household income is spent on soap.
Fig. 29 - Percentage of mothers who wash their wash hands after latrine use, by wealth quintile

CFSVA+N Madagascar 2010
52
7. RECOMMENDATIONS
7.1 IMPROVING FOOD DEMAND AND SUPPLY
With over 80 percent of the rural population employed in agriculture, low farm productivity is among the leading causes of poverty and food insecurity in Madagascar.
Boost national and household agricultural production (in quantity and quality) - Provide incentives
(i.e., subsidized fertilizers and seeds) and technical extension assistance to subsistence farmers and improve land tenure structure through wide implementation of the National Land Tenure programme). Promote access to credit; improve water management.
Invest in transport infrastructure, road construction/repairs and market facilities - to link areas of high agricultural potential with deficit areas.
Develop a dynamic market system - Develop a national market price information system and develop
market chains linking producers with potential buyers.
Improve post-harvest handling - Strengthen the capacity of farmer associations/organizations to
improve storage techniques, fight against pests and improve food processing technology.
Promote natural resource management - Watershed protection, conservation agriculture,
reforestation, bush fire control.
7.2 INVESTING IN HUMAN AND SOCIAL CAPITAL
Implement social protection programmes to combat widespread poverty - Support productive
safety nets targeting the most food insecure through community asset creation programmes.
Strengthen policies that promote education - The country needs to pursue: free and compulsory
primary education for all; re-introduction of adult-literacy programmes, especially for women; parenting education to encourage behaviour change; the opportunity to attract children to school and feed them there by implementing/extending school canteen projects in food insecure areas.
7.3 COPING WITH SHOCKS/DISASTERS
Improve the resilience of households and communities in risk areas - Ensure appropriate
preparedness and response mechanisms to emergency food and nutrition insecurity by assessing needs, prepositioning emergency food stocks and updating and reviewing contingency plans.
7.4 TACKLING ACUTE MALNUTRITION
Concentrating on activities that reduce the risk of disease will contribute to the reduction in acute malnutrition.
Manage acute malnutrition - Continue the integration and expansion of the integrated management of
acute malnutrition into routine activities at the health centre/ community level. Improve surveillance and

CFSVA+N Madagascar 2010
53
early warning systems for the early detection of a worsening nutritional situation for rapid deployment disaster reduction strategies.
Concentrate on programmes to promote exclusive breast feeding - Ensure that there is a continual
focus on the promotion of exclusive breastfeeding for children under 6 months via community-based behavior change programs and the use of different communication channels (mass media, inclusion in school curriculum, inclusion of the private sector).
Improve access to health care for children - through community-based management of childhood
diseases and promotion of preventative vaccination programmes via communication strategies designed for women with a low education levels.
Improve access to safe water - Activities to improve access to safe water, including promoting adequate
water treatment methods help reduce childhood illness and subsequently acute malnutrition.
Facilitate access to soap at the Fokontany level – Activities to improve access to soap at the
Fokontany level to help in the promotion of hand washing.
7.5 ACTIVITIES TO TACKLE STUNTING
Reinforcing activities which improve the health and nutrition status of teenagers and women of child bearing age will reduce the prevalence of low birth weight and small stature among women to cut stunting.
Improve the dietary intake of children aged 6-23 months – Promote appropriate complementary
feeding including dietary diversity, with particular focus on the use of local products via community-based behaviour change programmes.
Reduce the risk of teenage pregnancies – Activities which delay the first pregnancy until after 20 years
will reduce the proportion of short women45,46 and the risk of a low birth weight infant.
Improve iron folic acid supplementation of pregnant and lactating women – Promote the full
course of iron folic acid by pregnant and lactating women, thereby reducing the risk of low birth weight.
Improve the attendance of the full antenatal classes – Ensure all pregnant women attend the
recommended four antenatal classes and have access to the minimum range of interventions during the antenatal classes in order to reduce the risk of low birth weight.
Integrate nutrition counselling into agricultural activates – To ensure that vulnerable households
consume the foods they produce.
Promote the use and benefits of home gardens – To increase household access and utilization of
micronutrient rich foods.
45Casanueva E et al 2006. Adolescents with adequate birth weight newborns diminish energy expenditure and cease growth. J Nutr 136: 2498-2501 46 Rah JH, Christian P, Shamim AA, Arju UT, Labrique AB, Rashid M. Pregnancy and lactation hinder growth and nutritional status of adolescent girls in rural Bangladesh. J Nutr. 2008;138:1505-11.

CFSVA+N Madagascar 2010
54