remote sensing, gis, and land use and land cover mapping along the · pdf fileremote sensing,...
TRANSCRIPT
REMOTE SENSING, GIS, AND LAND USE AND LAND COVER MAPPING ALONG THE I-10 CORRIDOR
Adam Johnson, Graduate Research Assistant
Dennis D. Truax, Professor Charles G. O’Hara, Consortium Manager
John Cartwright, Geospatial Application Specialist National Consortium on Remote Sensing in Transportation – Environmental Assessment
Mississippi State University Engineering Research Center
Box 9627 Mississippi State, MS 39762-9627 U.S.A.
[email protected] [email protected]
[email protected] [email protected]
ABSTRACT The National Consortium on Remote Sensing in Transportation – Environmental Assessment headed out of Mississippi State University conducts research into the nature of land cover change as it relates to transportation features. For an environmentally sensitive area on the Mississippi Gulf Coast, ongoing research studies the changes in land cover for the area with particular emphasis on changes that have occurred related to completion of Interstate 10. Analyses of population and demographic information, existing land cover data, and non-spectral retrospective research illustrate that the area has changed dramatically in the past thirty years as evidence by a population increase of around 50%. These preliminary studies have detected the growth and change, but the lack of spectral analysis precludes the identification of spatial patterns of growth and change for the area. Spatial patterns of population growth and land cover change were identified through exploratory analyses, land cover classification, and change detection analyses conducted on multitemporal Landsat TM data. Exploratory analyses included creating tasseled-cap transformations and normalized difference vegetation index (NDVI) products of the Landsat TM image data. Tasseled cap transformation was used to enhance spectral information of Landsat TM data and to subdivide the landscape into water and non-water areas. The tasseled cap transformation optimizes data viewing for vegetation studies, a task essential for ecosystem delineation as related transportation system impact analysis. In this study, three specific bands were used with reasonable success to correlate soil, wetness, and vegetation. Tasseled cap results and changes in values with time were used to assess changes in environment. These changes were compared and contrasted to changes in Normalized Difference Vegetation Indices and results were used to assist in subdividing areas on the landscape prior to classification. Combinations of supervised and unsupervised classifications were conducted to define land cover and land use types for the area. The resulting products of the exploratory analyses and classification were then used to assess spatial patterns of land cover and land use change for the area.
INTRODUCTION
The National Consortium on Remote Sensing in Transportation for Environmental Assessment (NCRST-E) is one of the four consortia established by NASA and US Department of Transportation to lead in the application of remote sensing and geospatial technologies in the transportation industry. The primary mission of NCRST-E is to develop and promote the use of remote sensing and geospatial technologies and requisite analysis products by transportation decision-makers and environmental assessment specialists in measuring, monitoring, and assessing environmental conditions in relation to transportation infrastructure. The consortium is composed of universities (Mississippi State University, Auburn University, the University of Alabama-Huntsville, and the University of Mississippi), government (NASA Marshall Space Flight Center and Global Hydrology and Climate Center), and commercial (Intermap Technologies, Inc. and Earthwatch Incorporated) partners (King et al. 2001).
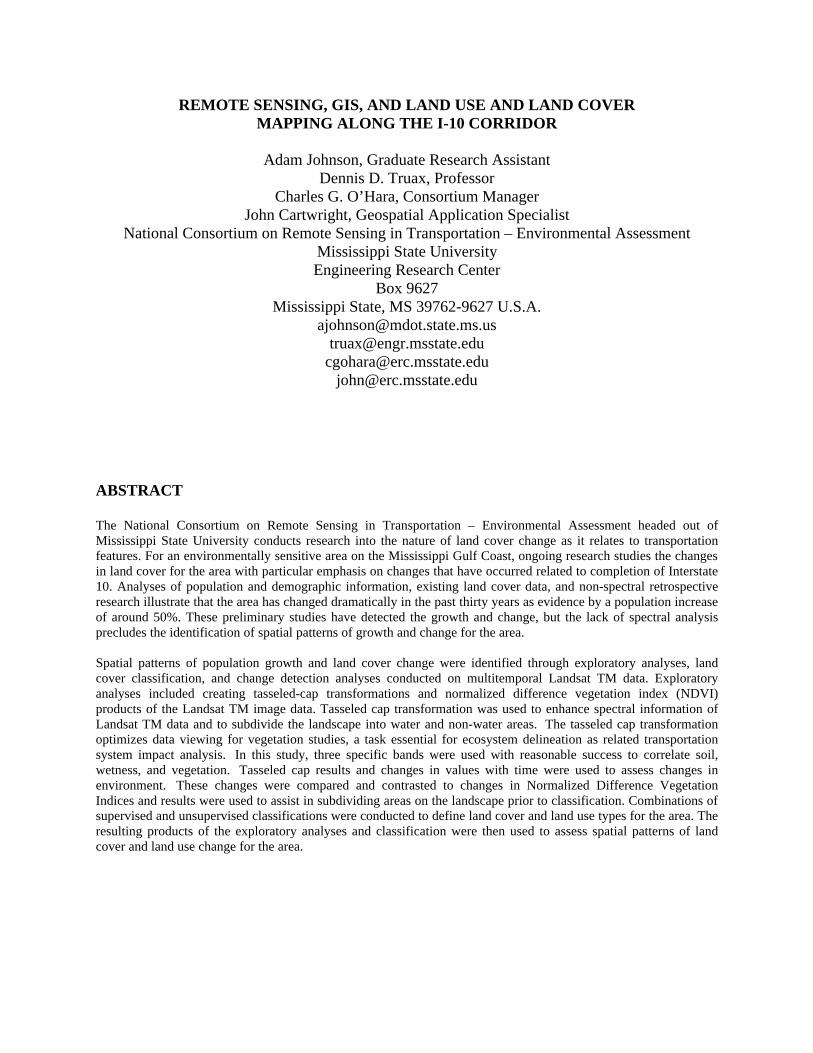
Projects of the NCRST-E include land-use/land-cover (LULC) studies in various environments, wetland assessment, and air quality monitoring as they are related to transportation planning and assessment. The Mississippi State University project involved the generation of a LULC for a sensitive, yet complex coastal environment. The study area selected for the project was the Interstate 10 (I-10) corridor, consisting of the three southern most counties of Mississippi; Hancock, Harrison, and Jackson (Figure 1). The overall goals of the project
were to: 1) analyze LULC trends based on prior LULC studies, 2) assess the present LULC of the corridor and the amount and type of change across the landscape in terms of LULC over the past decade with remotely sensed products at the regional scale, and 3) compare various methodologies for LULC classification in terms of the overall accuracies and robustness of the final classification product (King et al., 2001). Demographic and Physical Setting The three coastal counties in Mississippi have undergone considerable changes in land-use, demographics, socio-economic conditions and environmental stability over the past 30 years. During this time span I-10 has been completed, extensive population growth has occurred, and the coastal counties have changed from being mostly small fishing communities to a complex mixture of residential, commercial, and industrial urban areas with a robust tourism industry due to the onset of a large casino gaming industry in the early 1990’s. These changes have resulted in a diverse landscape with protected unspoiled coastal wilderness areas intermixed with active urban areas and booming port based industries. Over the past three decades the state of Mississippi has had an increase in population of approximately 28% (from 2.2 million in 1970 to 2.85 million in 2000) (Mississippi State Data Center, 2001). The three coastal counties of Mississippi have experienced a much more accelerated population growth over the past three decades, with the total population for Hancock, Harrison, and Jackson counties increasing from slightly less than 240,000 in 1970 to
more than 360,000 in 2000, representing an overall increase of more than 50% (nearly twice that of the state). The majority of the population increase occurred between 1970 and 1980 for the three counties with less significant changes from 1980 to 1990 (Table 1). Between 1990 and 2000 there was a resurgence in the population increases, which corresponds to the onset of the large casino gaming industry (Meyer-Arnedt, 1998).
Figure 1: Hancock, Harrison, and Jackson counties in southern Mississippi.
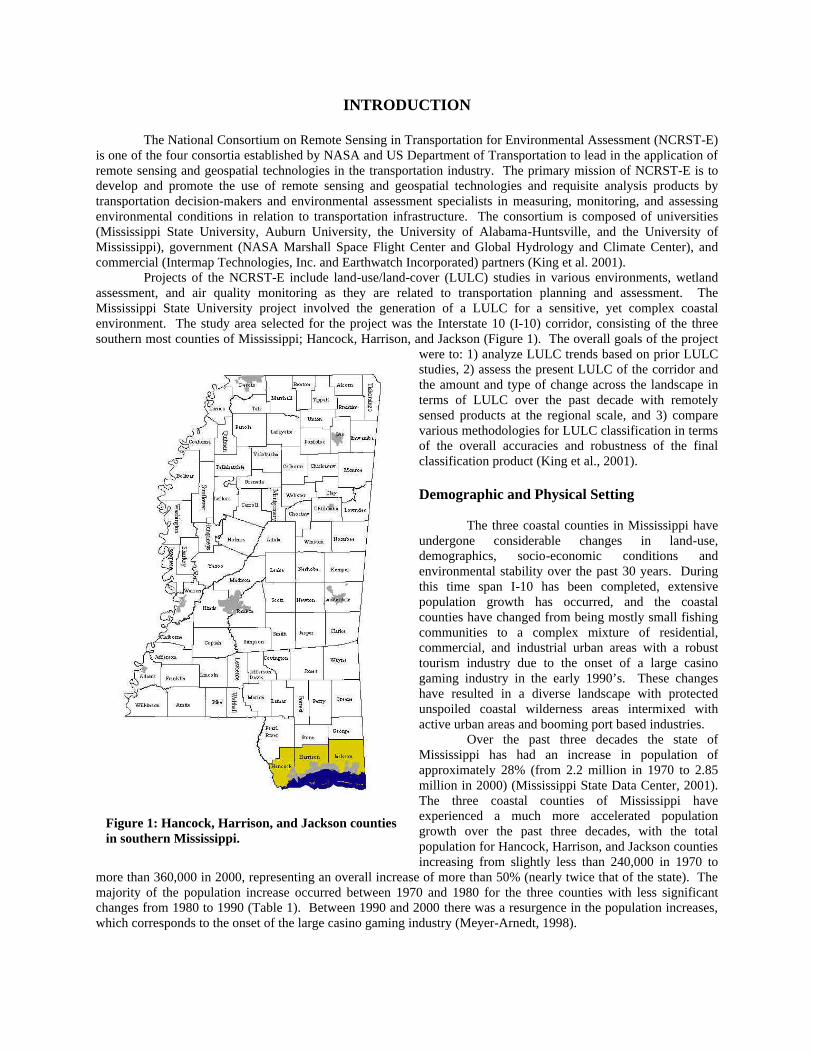
The Mississippi Gulf Coast is a collection of sensitive environments comprised of a mixture of complex environments including estuaries, freshwater and coastal marshes, pine savannahs, diverse bottomlands, and terraced uplands. The majority of the Mississippi Gulf Coast lies within the Flatlands Coastal Plain physiographic province adjacent to the Mississippi Sound, with the northern portions of the three coastal counties located within the Middle Coastal Plain physiographic province (Ovianki, 1998). A significant part of the three county study area is within National Forest, Wildlife Management Areas, National Wildlife Refuges, and other protected natural areas. The location of these protected environmentally sensitive areas coupled with the dense urban development along the Mississippi coast appear to guide if not contain growth patterns within the study area (Figure 2).
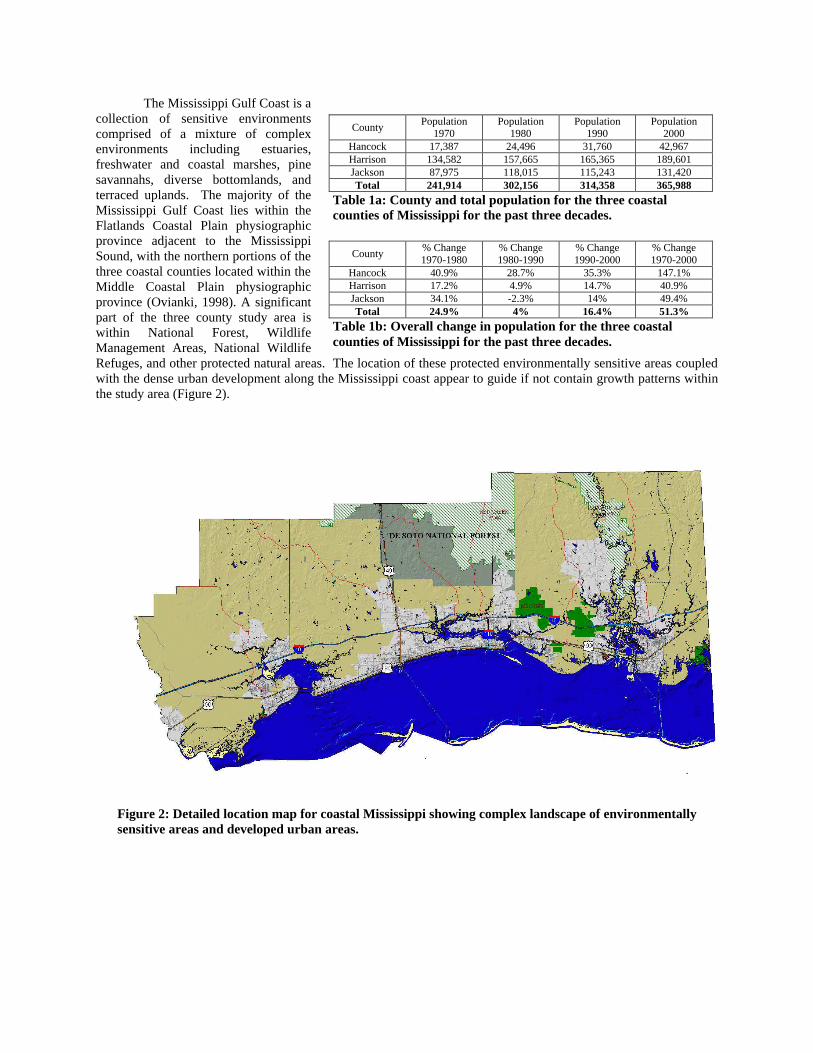
County Population 1970
Population 1980
Population 1990
Population 2000
Hancock 17,387 24,496 31,760 42,967 Harrison 134,582 157,665 165,365 189,601 Jackson 87,975 118,015 115,243 131,420 Total 241,914 302,156 314,358 365,988
Table 1a: County and total population for the three coastal counties of Mississippi for the past three decades.
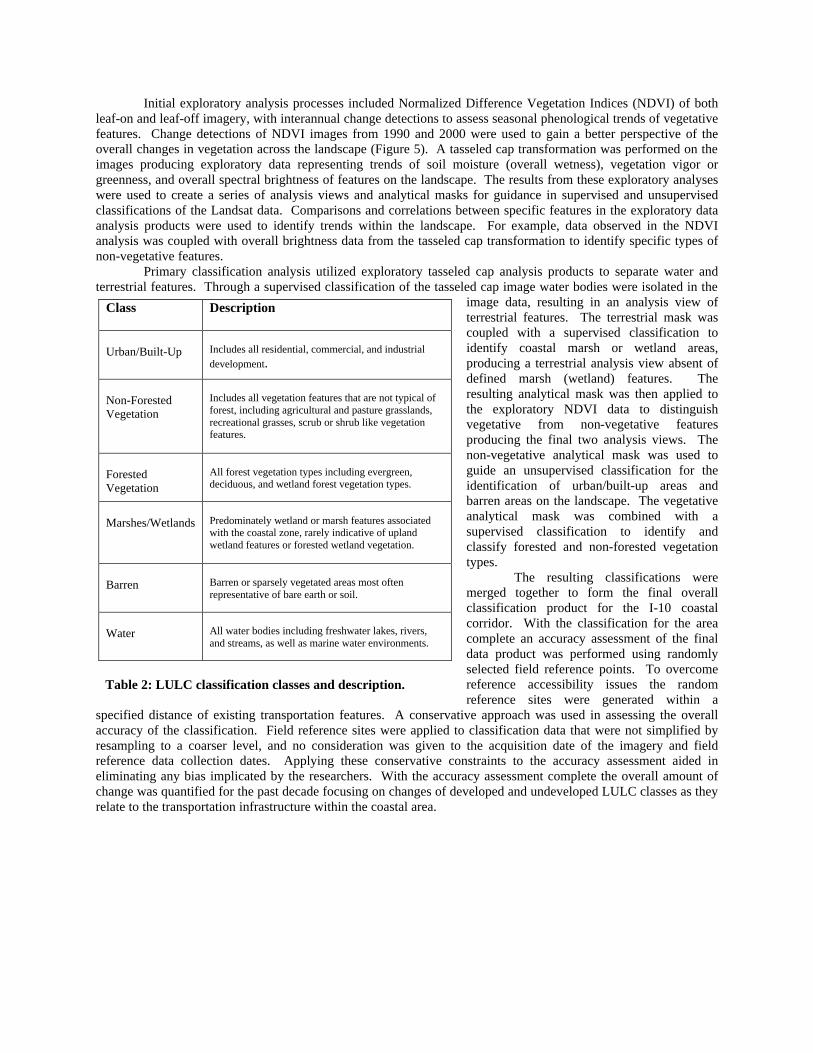
County % Change 1970-1980
% Change 1980-1990
% Change 1990-2000
% Change 1970-2000
Hancock 40.9% 28.7% 35.3% 147.1% Harrison 17.2% 4.9% 14.7% 40.9% Jackson 34.1% -2.3% 14% 49.4% Total 24.9% 4% 16.4% 51.3%
Table 1b: Overall change in population for the three coastal counties of Mississippi for the past three decades.
Figure 2: Detailed location map for coastal Mississippi showing complex landscape of environmentally sensitive areas and developed urban areas.

DATA AND CLASSIFICATION PROCEDURES The LULC classification for the I-10 corridor project of the Mississippi Gulf Coast was based primarily on Landsat 5 Thematic Mapper (TM) from 1990 and Landsat 7 Enhanced Thematic Mapper (ETM) data from 2000. Historical Landsat imagery from 1972 and 1980 were used for visual assessment of development and land-use trends within the area; however, this imagery was not classified due to inferior quality of data acquired by the earlier multi-spectral sensors (MSS) as compared to the later TM and ETM sensors (Figure 3). All of the Landsat data were geo-registered to a customized Transverse Mercator projection for the State of Mississippi using a common set of ground control points, with a resultant root mean square error (RMSE) of less than 9 meters (less than .33 pixels).
In addition to the Landsat satellite image data, various other spatial data sources were used to gain insight into development patterns, trends, and to predict future growth patterns. These data sources included existing aerial imagery, demographic GIS data, National Land Cover Data (NLCD) from the Multiresolution Land Characteristics (MRLC) consortium from 1992, and LULC data from the Mississippi Automated Resource Information System (MARIS) from 2000 (Figure 4). Analysis of the NLCD and MARIS LULC data provided valuable insights into certain aspects of development trends in the three coastal counties of Mississippi. However, a direct comparison of the data was problematic due to discrepancies in the classification approaches of the data sets. General Classification and Assessment Procedures
The primary LULC classification scheme used for this project was derived from the Anderson classification system for a level one classification (Anderson et al., 1976). The classification scheme utilized six LULC classes representing urban/built-up areas, non-forested vegetation, forested vegetation, marshes, barren, and water features (Table 2). The level one classes were then used to derive level two classes where urban/built-up areas were divided into areas of residential, industrial, and transportation features. The classification was performed on leaf-on imagery from August of 1990 and July of 2000, which allowed for an overall assessment of change over the past decade. Initial clustering analysis of the data proved to be unsatisfactory in terms of identifying specific LULC classes and warranted an exploratory analysis of the data to assist in the identification of the LULC classes previously described.
Figure 3: Sample Landsat satellite imagery from 1972 (A), 1990, (B), and 2000 (C).
Figure 4a: NLCD LULC data from 1992.
Figure 4b: MARIS LULC data from 2000.
A B C
Initial exploratory analysis processes included Normalized Difference Vegetation Indices (NDVI) of both leaf-on and leaf-off imagery, with interannual change detections to assess seasonal phenological trends of vegetative features. Change detections of NDVI images from 1990 and 2000 were used to gain a better perspective of the overall changes in vegetation across the landscape (Figure 5). A tasseled cap transformation was performed on the images producing exploratory data representing trends of soil moisture (overall wetness), vegetation vigor or greenness, and overall spectral brightness of features on the landscape. The results from these exploratory analyses were used to create a series of analysis views and analytical masks for guidance in supervised and unsupervised classifications of the Landsat data. Comparisons and correlations between specific features in the exploratory data analysis products were used to identify trends within the landscape. For example, data observed in the NDVI analysis was coupled with overall brightness data from the tasseled cap transformation to identify specific types of non-vegetative features. Primary classification analysis utilized exploratory tasseled cap analysis products to separate water and terrestrial features. Through a supervised classification of the tasseled cap image water bodies were isolated in the
image data, resulting in an analysis view of terrestrial features. The terrestrial mask was coupled with a supervised classification to identify coastal marsh or wetland areas, producing a terrestrial analysis view absent of defined marsh (wetland) features. The resulting analytical mask was then applied to the exploratory NDVI data to distinguish vegetative from non-vegetative features producing the final two analysis views. The non-vegetative analytical mask was used to guide an unsupervised classification for the identification of urban/built-up areas and barren areas on the landscape. The vegetative analytical mask was combined with a supervised classification to identify and classify forested and non-forested vegetation types.
The resulting classifications were merged together to form the final overall classification product for the I-10 coastal corridor. With the classification for the area complete an accuracy assessment of the final data product was performed using randomly selected field reference points. To overcome reference accessibility issues the random reference sites were generated within a
specified distance of existing transportation features. A conservative approach was used in assessing the overall accuracy of the classification. Field reference sites were applied to classification data that were not simplified by resampling to a coarser level, and no consideration was given to the acquisition date of the imagery and field reference data collection dates. Applying these conservative constraints to the accuracy assessment aided in eliminating any bias implicated by the researchers. With the accuracy assessment complete the overall amount of change was quantified for the past decade focusing on changes of developed and undeveloped LULC classes as they relate to the transportation infrastructure within the coastal area.
Class
Description
Urban/Built-Up
Includes all residential, commercial, and industrial development.
Non-Forested Vegetation
Includes all vegetation features that are not typical of forest, including agricultural and pasture grasslands, recreational grasses, scrub or shrub like vegetation features.
Forested Vegetation
All forest vegetation types including evergreen, deciduous, and wetland forest vegetation types.
Marshes/Wetlands
Predominately wetland or marsh features associated with the coastal zone, rarely indicative of upland wetland features or forested wetland vegetation.
Barren
Barren or sparsely vegetated areas most often representative of bare earth or soil.
Water
All water bodies including freshwater lakes, rivers, and streams, as well as marine water environments.
Table 2: LULC classification classes and description.
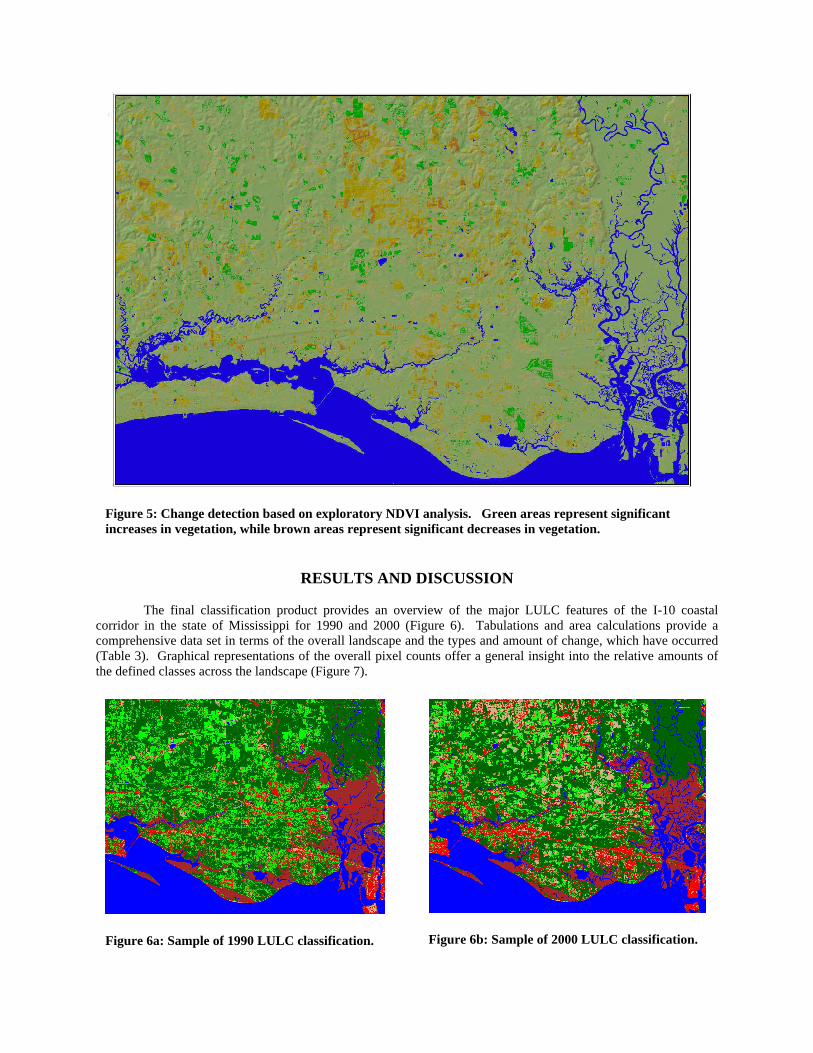
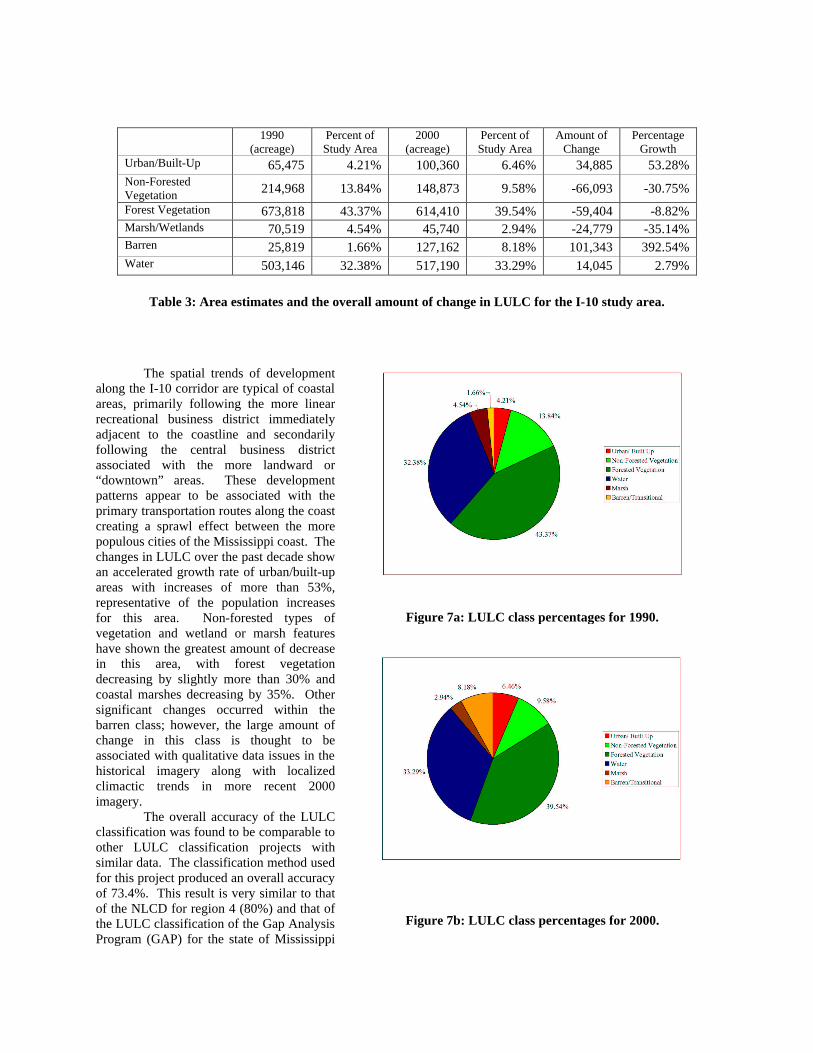
Figure 6a: Sample of 1990 LULC classification.
RESULTS AND DISCUSSION
The final classification product provides an overview of the major LULC features of the I-10 coastal
corridor in the state of Mississippi for 1990 and 2000 (Figure 6). Tabulations and area calculations provide a comprehensive data set in terms of the overall landscape and the types and amount of change, which have occurred (Table 3). Graphical representations of the overall pixel counts offer a general insight into the relative amounts of the defined classes across the landscape (Figure 7).
Figure 5: Change detection based on exploratory NDVI analysis. Green areas represent significant increases in vegetation, while brown areas represent significant decreases in vegetation.
Figure 6b: Sample of 2000 LULC classification.
The spatial trends of development
along the I-10 corridor are typical of coastal areas, primarily following the more linear recreational business district immediately adjacent to the coastline and secondarily following the central business district associated with the more landward or “downtown” areas. These development patterns appear to be associated with the primary transportation routes along the coast creating a sprawl effect between the more populous cities of the Mississippi coast. The changes in LULC over the past decade show an accelerated growth rate of urban/built-up areas with increases of more than 53%, representative of the population increases for this area. Non-forested types of vegetation and wetland or marsh features have shown the greatest amount of decrease in this area, with forest vegetation decreasing by slightly more than 30% and coastal marshes decreasing by 35%. Other significant changes occurred within the barren class; however, the large amount of change in this class is thought to be associated with qualitative data issues in the historical imagery along with localized climactic trends in more recent 2000 imagery.
The overall accuracy of the LULC classification was found to be comparable to other LULC classification projects with similar data. The classification method used for this project produced an overall accuracy of 73.4%. This result is very similar to that of the NLCD for region 4 (80%) and that of the LULC classification of the Gap Analysis Program (GAP) for the state of Mississippi
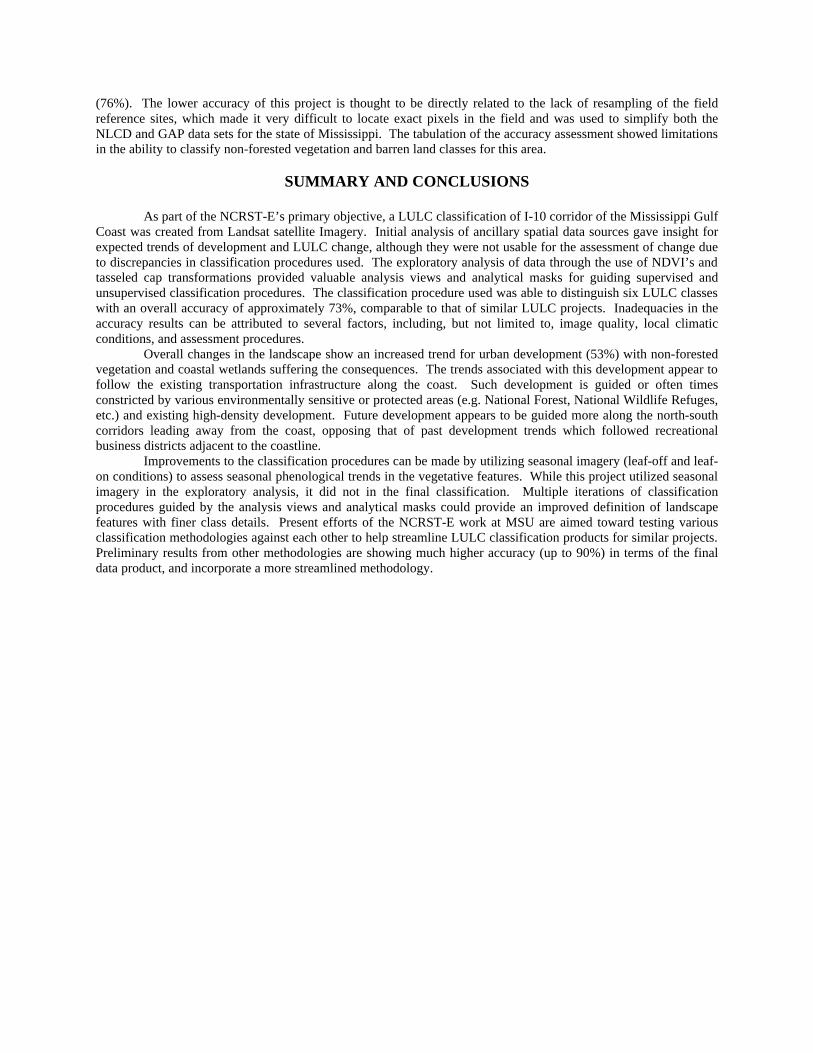
1990 (acreage)
Percent of Study Area
2000 (acreage)
Percent of Study Area
Amount of Change
Percentage Growth
Urban/Built-Up 65,475 4.21% 100,360 6.46% 34,885 53.28% Non-Forested Vegetation 214,968 13.84% 148,873 9.58% -66,093 -30.75%
Forest Vegetation 673,818 43.37% 614,410 39.54% -59,404 -8.82% Marsh/Wetlands 70,519 4.54% 45,740 2.94% -24,779 -35.14% Barren 25,819 1.66% 127,162 8.18% 101,343 392.54% Water 503,146 32.38% 517,190 33.29% 14,045 2.79%
Table 3: Area estimates and the overall amount of change in LULC for the I-10 study area.
Figure 7a: LULC class percentages for 1990.
Figure 7b: LULC class percentages for 2000.
(76%). The lower accuracy of this project is thought to be directly related to the lack of resampling of the field reference sites, which made it very difficult to locate exact pixels in the field and was used to simplify both the NLCD and GAP data sets for the state of Mississippi. The tabulation of the accuracy assessment showed limitations in the ability to classify non-forested vegetation and barren land classes for this area.
SUMMARY AND CONCLUSIONS
As part of the NCRST-E’s primary objective, a LULC classification of I-10 corridor of the Mississippi Gulf
Coast was created from Landsat satellite Imagery. Initial analysis of ancillary spatial data sources gave insight for expected trends of development and LULC change, although they were not usable for the assessment of change due to discrepancies in classification procedures used. The exploratory analysis of data through the use of NDVI’s and tasseled cap transformations provided valuable analysis views and analytical masks for guiding supervised and unsupervised classification procedures. The classification procedure used was able to distinguish six LULC classes with an overall accuracy of approximately 73%, comparable to that of similar LULC projects. Inadequacies in the accuracy results can be attributed to several factors, including, but not limited to, image quality, local climatic conditions, and assessment procedures.
Overall changes in the landscape show an increased trend for urban development (53%) with non-forested vegetation and coastal wetlands suffering the consequences. The trends associated with this development appear to follow the existing transportation infrastructure along the coast. Such development is guided or often times constricted by various environmentally sensitive or protected areas (e.g. National Forest, National Wildlife Refuges, etc.) and existing high-density development. Future development appears to be guided more along the north-south corridors leading away from the coast, opposing that of past development trends which followed recreational business districts adjacent to the coastline.
Improvements to the classification procedures can be made by utilizing seasonal imagery (leaf-off and leaf-on conditions) to assess seasonal phenological trends in the vegetative features. While this project utilized seasonal imagery in the exploratory analysis, it did not in the final classification. Multiple iterations of classification procedures guided by the analysis views and analytical masks could provide an improved definition of landscape features with finer class details. Present efforts of the NCRST-E work at MSU are aimed toward testing various classification methodologies against each other to help streamline LULC classification products for similar projects. Preliminary results from other methodologies are showing much higher accuracy (up to 90%) in terms of the final data product, and incorporate a more streamlined methodology.

REFERENCES Anderson, J.R., Hardy, E.E., Roach, J.T., Witmer, R. E. (1976). A Land Use and Land Cover Classification System for Use with Remote Sensor Data. United States Government Printing Office. Washington D.C. King, R. L. and C.G. O'Hara, July 9-13, 2001, The National Consortium of Remote Sensing in Transportation – Environmental Assessment, Proceedings of the IEEE 2001 International Geoscience and Remote Sensing Symposium, Sydney, Australia. (CD) Meyer-Arendt, K.J. (1998), Casino gaming on the Mississippi Gulf Coast, in Marine Resources and History of the Mississippi Gulf Coast, (D.M. McCaughan, ed.), Vol. III, pp. 291-308, MS Department of Marine Resources, Biloxi, MS. Mississippi Automated Resource Information System (MARIS) (2000). 2000 digital land use/land cover maps for Mississippi. http://www.maris.state.ms.us/ Mississippi Gap Analysis Program (1997). Mississippi land cover map. Mississippi State University, http://www.cfr.msstate.edu/gap/gap.htm Oivanki, S.M. (1998). Geology and geomorphology of the Mississippi Gulf Coast, in Marine Resources and History of the Mississippi Gulf Coast, (D.M. McCaughan, ed.), Vol. II, pp. 291-308, MS Department of Marine Resources, Biloxi, MS. University of Mississippi, State Data Center of Mississippi (2001). Public law data (PL 94-171) Percent population change for Mississippi counties 1970-2000. http://www.olemiss.edu/depts/sdc/countygro.pdf United States Geological Survey (USGS) (1992). Multi-resolution land characteristics – statewide digital data for Mississippi. http://landcover.usgs.gov/nationallandcover.html