application of remote sensing and gis technology in ... · of the total natural area, of which land...
TRANSCRIPT
Journal of Agricultural Science and Technology A and B & Hue University Journal of Science 7 (2017) 48-59 doi: 10.17265/2161-6256/2017.10.007S
Application of Remote Sensing and GIS Technology in
Mapping Partition Saline Intrusion to Paddy Land: A
Case Study at Phu Vang District, Thua Thien Hue
Province
Nguyen Hoang Khanh Linh, Le Ngoc Phuong Quy, Truong Do Minh Phuong and Nguyen Trac Ba An
Faculty of Land Resources and Agricultural Environment, University of Agriculture and Forestry, Hue University, 102 Phung Hung
Street, Hue 530000, Vietnam
Abstract: Adapting and restricting salinity intrusion in Vietnam is being concerned by more researchers as well as the local authorities. This study aimed to use remote sensing and geographic information system (GIS) technology for mapping paddy areas and salinity intrusion in spring crop 2015 at Phu Vang district, thereby helping precondition for assessing and monitoring changes in salinity intrusion to serve for salinization management in study area. Based on acquisition imagery, land use map and normalized difference vegetation index (NDVI) were extracted to interpolate the salinity of area by combining the laboratory analysis of collected soil samples from the field. The result showed that there were 1,067.107 ha of salinity land area accounting for 10.04% of the rice land in Phu Vang district, where the moderate salinity level was 180.67 ha and low salinity level was 866.431 ha. The salinity rice land was mainly distributed in Vinh Ha commune, Phu An commune and Phu Dien commune. The salinity in this area ranged from 0.4 mS/cm to 1.41 mS/cm and the moderate salinity was approximately 0.9 mS/cm. Besides, this research also showed that the salinity (electrical conductivity) and the development of vegetation (NDVI) were closely related with each other up to 61.4%. Key words: GIS, remote sensing, normalized difference vegetation index, salinity intrusion, paddy land.
1. Introduction
Nowadays, salinity intrusion is becoming more
complicated and has big impact on agricultural
production as well as the life of the residents [1, 2].
Therefore, there were several researches which
focused on salinity done recently in different
provinces along the coastal regions of Vietnam [3, 4].
Annual survey showed that the district’s salinity of
coastal soil has been significantly increasing, which
adversely affects cultivation, husbandry and the life of
local residents [5].
The situation requires local authorities having
Corresponding author: Nguyen Hoang Khanh Linh, Ph.D.,
research fields: application of remote sensing & GIS, modelling land use change.
various solutions to monitor and forecast for salinity
intrusion assessment. Mapping the status of salinity
intrusion at different period could be considered as an
effective method for monitoring any changing, thus
help decision-makers assess the extent of development
and timely direct interventions. Based on salinity
intrusion map, the affected areas could be detected by
the characteristics of soil, thereby identifying the
extent of the effects of salty entry to the cultivated
species. However, it would be time consuming and
costly, if it is done by traditional method, such as
collecting a large numerous of salinity soil samples,
laboratory analysis, statistics analysis, etc.. Therefore,
remote sensing technology has created a revolution for
researches in recent years. With the advantage of
being able to provide full image of the Earth surface,
D DAVID PUBLISHING
Application of Remote Sensing and GIS Technology in Mapping Partition Saline Intrusion to Paddy Land: A Case Study at Phu Vang District, Thua Thien Hue Province
49
it is considered as an appropriate and effective tool in
identifying suitable cropping pattern—the factor that
shows the attributes and salinity of soil and water, as
well as being directly affected by salinity intrusion [6,
7]. In addition, the geographic information system
(GIS) with the ability to overlay multiple map layers
helps to effectively assess and analyze current salinity
intrusion situation [8]. Salinity intrusion partition
mapping will serve as basis for state agencies to
improve land management and use. Being a coastal
district in the Central region, salinity intrusion
situation in Phu Vang is the concern of villagers as
well as a pressing issue for local authorities. This
article aimed to study the application of GIS and
remote sensing technology in salinity intrusion
partition of paddy land in Phu Vang district, Thua
Thien Hue province.
2. Methodology
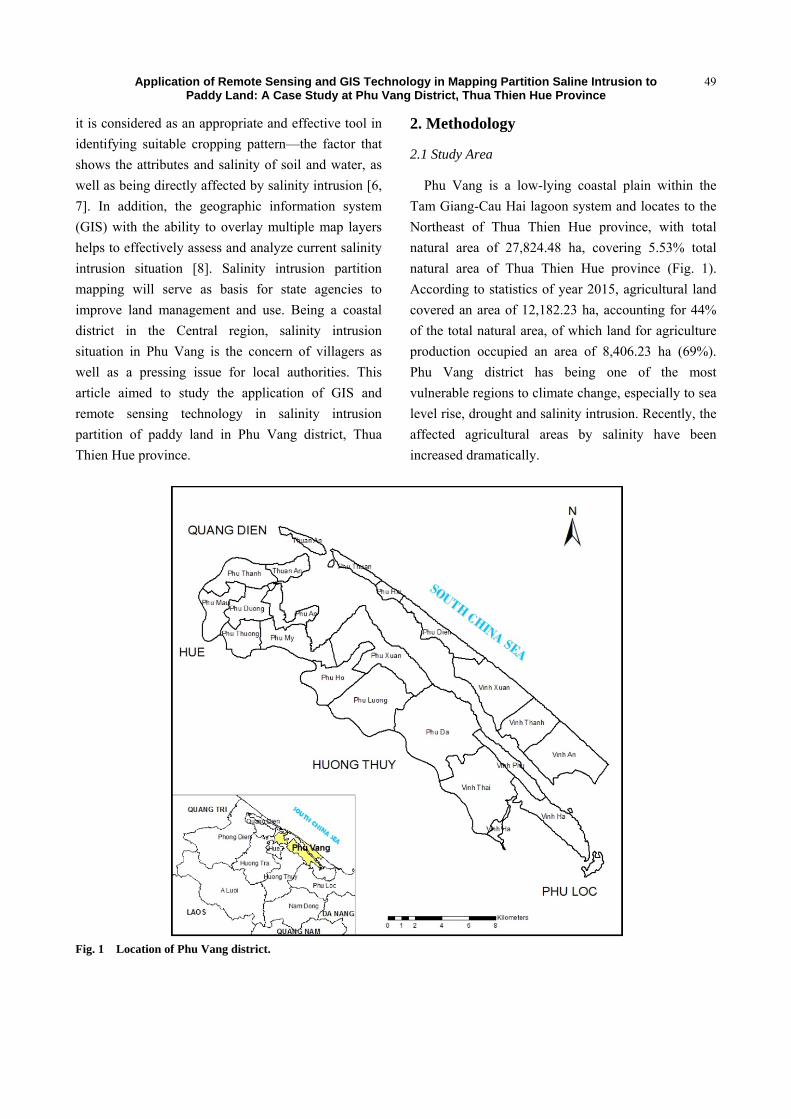
2.1 Study Area
Phu Vang is a low-lying coastal plain within the
Tam Giang-Cau Hai lagoon system and locates to the
Northeast of Thua Thien Hue province, with total
natural area of 27,824.48 ha, covering 5.53% total
natural area of Thua Thien Hue province (Fig. 1).
According to statistics of year 2015, agricultural land
covered an area of 12,182.23 ha, accounting for 44%
of the total natural area, of which land for agriculture
production occupied an area of 8,406.23 ha (69%).
Phu Vang district has being one of the most
vulnerable regions to climate change, especially to sea
level rise, drought and salinity intrusion. Recently, the
affected agricultural areas by salinity have been
increased dramatically.
Fig. 1 Location of Phu Vang district.
Application of Remote Sensing and GIS Technology in Mapping Partition Saline Intrusion to Paddy Land: A Case Study at Phu Vang District, Thua Thien Hue Province
50
2.2 On-Site Sampling Survey
For on-site sampling method, sampling sites should
be accurately and thoughtfully selected in order to
optimize traveling and avoid going into areas with
difficult terrain, thus making it more difficult for
actual sampling. Besides, samples selected must be
large enough to differentiate from other samples. For
this research, 60 samples were selected from paddy
rice field in communes and town belonging to Phu
Vang district and nearby Tam Giang-Cau Hai lagoon,
including Phu Thuan, Phu Hai, Phu Dien, Vinh Xuan,
Vinh An, Vinh Hai, Vinh Thai, Vinh Phu, Phu Da,
Phu Xuan, Phu My, Phu An, Phu Thanh and Thuan
An.
2.3 Classification of Remote Sensing Images Using
ENVI Software
To conduct partition of salinity intrusion map in
paddy area at Phu Vang district, Landsat 8 satellite
images were downloaded from Earth Explorer
(http://earthexplorer.usgs.gov). The images cover the
first eight months of 2015 based on Phu Vang
district’s 2015 seasonal calendar, in which
winter-spring season is from January to April and
summer-autumn season is from April to August
according to Gregorian calendar (Table 1). Although
the average cloud coverage percentage of some
images is high, there is almost no covered cloud in
study area. Therefore, they are appropriate to use for
conducting research. After downloading, image
channels were combined and cropped to the boundary
of Phu Vang district, Thua Thien Hue province.
2.3.1 Unsupervised Classification
In this method, image pixels are automatically
distributed into layers based on several homogeneous
usage spectrum attributes, using group classification
technique. This method is used when entities recorded
on the images are unknown or unfamiliar, and it also
helps avoid subjective human errors.
2.3.2 Supervised Classification
Supervised classification requires a sample area to
be selected as a criterion for classification. From the
selected samples, computer will identify pixels that
have the same features on reflection spectrum. Then
comparison algorithms are run to evaluate whether a
specific pixel is qualified to be assigned to a layer.
The algorithm used in supervised classification is
maximum likelihood. This method assumes that
spectrum band with standard distribution will be
classified into layers with the highest likelihood. The
calculation is not based only on the distance, but also
on the gray-scale variation trend of each layer.
2.4 Determining the Normalized Difference Vegetation
Index (NDVI)
NDVI is used to demonstrate and monitor
vegetation distribution at Phu Vang district. NDVI is
calculated based on the reflectance difference of
near-infrared band (NIR) and red band of Landsat
image, as following Eq. (1):
– NIR red
NIR red
NDVIr r
r r=
+ (1)
Table 1 Landsat 8 images used in the research.
No. Image name Cloud cover (%)
Date acquired
1 LC81250492015024LGN00 0.30 24/01/2015
2 LC81250492015056LGN00 10.36 25/02/2015
3 LC81250492015088LGN00 25.77 29/03/2015
4 LC81250492015120LGN00 9.83 14/04/2015
5 LC81250492015136LGN00 26.24 16/05/2015
6 LC81250492015168LGN00 12.34 16/06/2015
7 LC81250492015232LGN00 48.85 03/07/2015
8 LC81250492015264LGN00 15.7 20/08/2015
Application of Remote Sensing and GIS Technology in Mapping Partition Saline Intrusion to Paddy Land: A Case Study at Phu Vang District, Thua Thien Hue Province
51
where, rNIR and rred stand for the spectral reflectance
measurements acquired in the near-infrared and red
(visible) regions, respectively.
NDVI values range from +1.0 to -1.0, but values
less than 0 typically do not have any ecological
meaning, so the range of the index is truncated to
0.0-1.0.
After NDVI values have been processed and
calculated, the sequence images are aggregated using
maximum value composite (MVC) method. In this
method, the highest combined values of pixels in the
input images are used to determine the output. This
will correct, remove or reduce pixels whose value is
interpreted as clouds (absolute value of NDVI is
smaller than or approximately equal to 0), or pixels
affected by system differences or other causes that may
decrease the value of NDVI compared with reality.
2.5 Accuracy Assessment
It is needed to assess the accuracy of extracted map
and give evidence for implementing the next steps. In
this study, the Kappa coefficient (K) was used to
calculate the accuracy of classification result. The K
value ranges from 0 to 1 and indicates the proportional
reduction of error, done by a factor completely
random classification [9]. Kappa index is calculated
by the following Eq. (2):
1 1
2
1
·
·
– ( )
– ( )
r r
ij i ii i
r
i ii
N x x xK
N x x
+ += =
+ +=
×=
(2)
where, xij: number of counts in the ijth cell of the
confusion matrix; N: total number of counts in the
confusion matrix; x+i: marginal total of column i; xi+:
marginal total of row i. The value of K lies between 0
and 1, where 0 represents agreement due to chance
only and 1 represents complete agreement between the
two data sets.
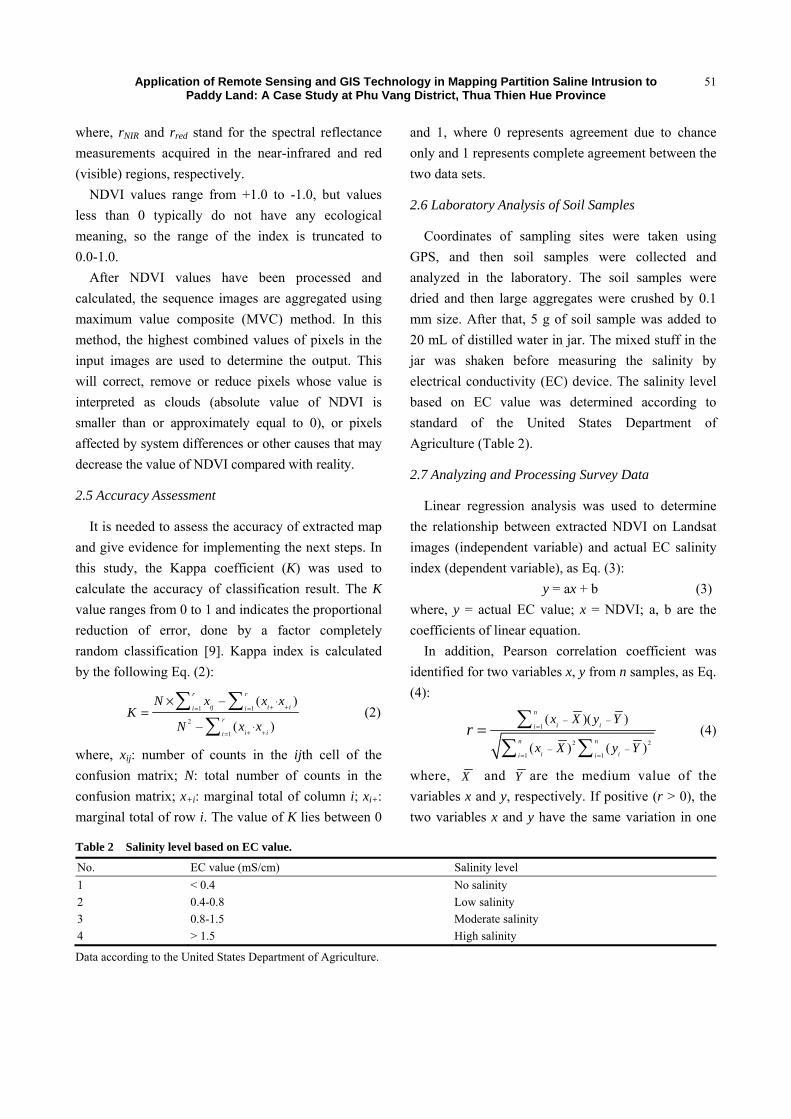
2.6 Laboratory Analysis of Soil Samples
Coordinates of sampling sites were taken using
GPS, and then soil samples were collected and
analyzed in the laboratory. The soil samples were
dried and then large aggregates were crushed by 0.1
mm size. After that, 5 g of soil sample was added to
20 mL of distilled water in jar. The mixed stuff in the
jar was shaken before measuring the salinity by
electrical conductivity (EC) device. The salinity level
based on EC value was determined according to
standard of the United States Department of
Agriculture (Table 2).
2.7 Analyzing and Processing Survey Data
Linear regression analysis was used to determine
the relationship between extracted NDVI on Landsat
images (independent variable) and actual EC salinity
index (dependent variable), as Eq. (3):
y = ax + b (3)
where, y = actual EC value; x = NDVI; a, b are the
coefficients of linear equation.
In addition, Pearson correlation coefficient was
identified for two variables x, y from n samples, as Eq.
(4):
1
2 2
1 1
– –
– –
( )( )
( ) ( )
n
i ii
n n
i ii i
x X y Y
x X y Yr =
= =
=
(4)
where, X and Y are the medium value of the
variables x and y, respectively. If positive (r > 0), the
two variables x and y have the same variation in one
Table 2 Salinity level based on EC value.
No. EC value (mS/cm) Salinity level
1 < 0.4 No salinity
2 0.4-0.8 Low salinity
3 0.8-1.5 Moderate salinity
4 > 1.5 High salinity
Data according to the United States Department of Agriculture.
Application of Remote Sensing and GIS Technology in Mapping Partition Saline Intrusion to Paddy Land: A Case Study at Phu Vang District, Thua Thien Hue Province
52
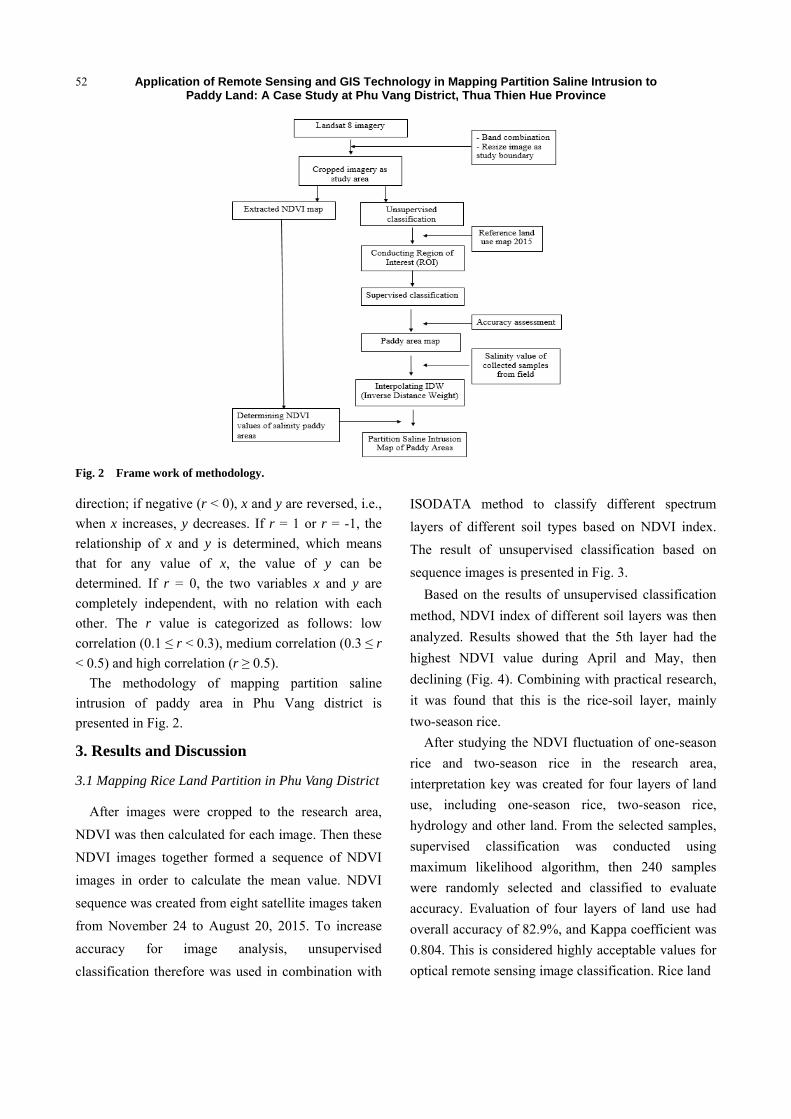
Fig. 2 Frame work of methodology.
direction; if negative (r < 0), x and y are reversed, i.e.,
when x increases, y decreases. If r = 1 or r = -1, the
relationship of x and y is determined, which means
that for any value of x, the value of y can be
determined. If r = 0, the two variables x and y are
completely independent, with no relation with each
other. The r value is categorized as follows: low
correlation (0.1 ≤ r < 0.3), medium correlation (0.3 ≤ r
< 0.5) and high correlation (r ≥ 0.5).
The methodology of mapping partition saline
intrusion of paddy area in Phu Vang district is
presented in Fig. 2.
3. Results and Discussion
3.1 Mapping Rice Land Partition in Phu Vang District
After images were cropped to the research area,
NDVI was then calculated for each image. Then these
NDVI images together formed a sequence of NDVI
images in order to calculate the mean value. NDVI
sequence was created from eight satellite images taken
from November 24 to August 20, 2015. To increase
accuracy for image analysis, unsupervised
classification therefore was used in combination with
ISODATA method to classify different spectrum
layers of different soil types based on NDVI index.
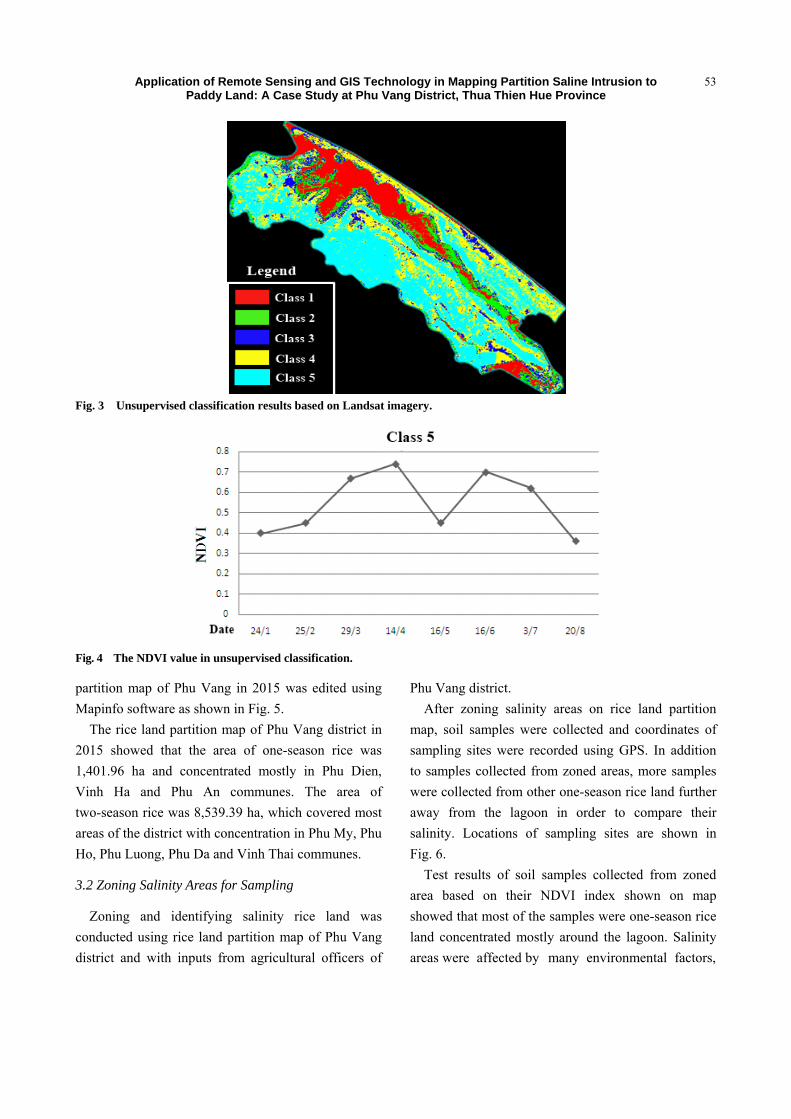
The result of unsupervised classification based on
sequence images is presented in Fig. 3.
Based on the results of unsupervised classification
method, NDVI index of different soil layers was then
analyzed. Results showed that the 5th layer had the
highest NDVI value during April and May, then
declining (Fig. 4). Combining with practical research,
it was found that this is the rice-soil layer, mainly
two-season rice.
After studying the NDVI fluctuation of one-season
rice and two-season rice in the research area,
interpretation key was created for four layers of land
use, including one-season rice, two-season rice,
hydrology and other land. From the selected samples,
supervised classification was conducted using
maximum likelihood algorithm, then 240 samples
were randomly selected and classified to evaluate
accuracy. Evaluation of four layers of land use had
overall accuracy of 82.9%, and Kappa coefficient was
0.804. This is considered highly acceptable values for
optical remote sensing image classification. Rice land
Application of Remote Sensing and GIS Technology in Mapping Partition Saline Intrusion to Paddy Land: A Case Study at Phu Vang District, Thua Thien Hue Province
53
Fig. 3 Unsupervised classification results based on Landsat imagery.
Fig. 4 The NDVI value in unsupervised classification.
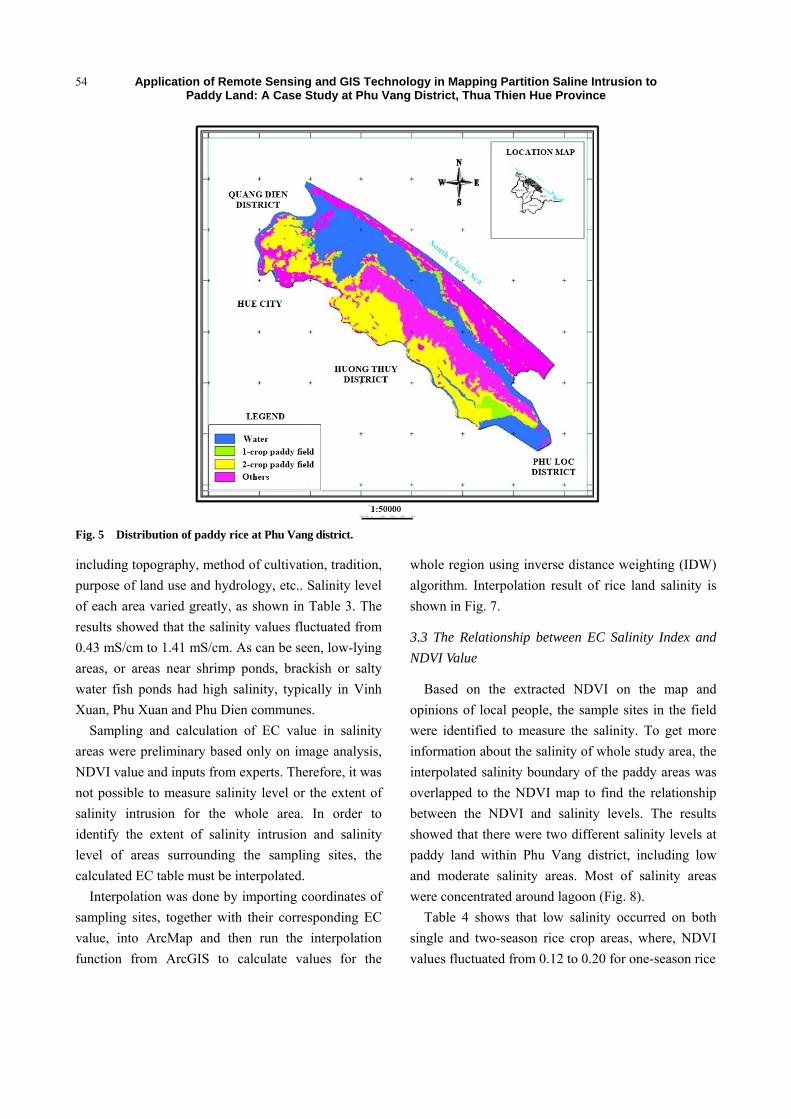
partition map of Phu Vang in 2015 was edited using
Mapinfo software as shown in Fig. 5.
The rice land partition map of Phu Vang district in
2015 showed that the area of one-season rice was
1,401.96 ha and concentrated mostly in Phu Dien,
Vinh Ha and Phu An communes. The area of
two-season rice was 8,539.39 ha, which covered most
areas of the district with concentration in Phu My, Phu
Ho, Phu Luong, Phu Da and Vinh Thai communes.
3.2 Zoning Salinity Areas for Sampling
Zoning and identifying salinity rice land was
conducted using rice land partition map of Phu Vang
district and with inputs from agricultural officers of
Phu Vang district.
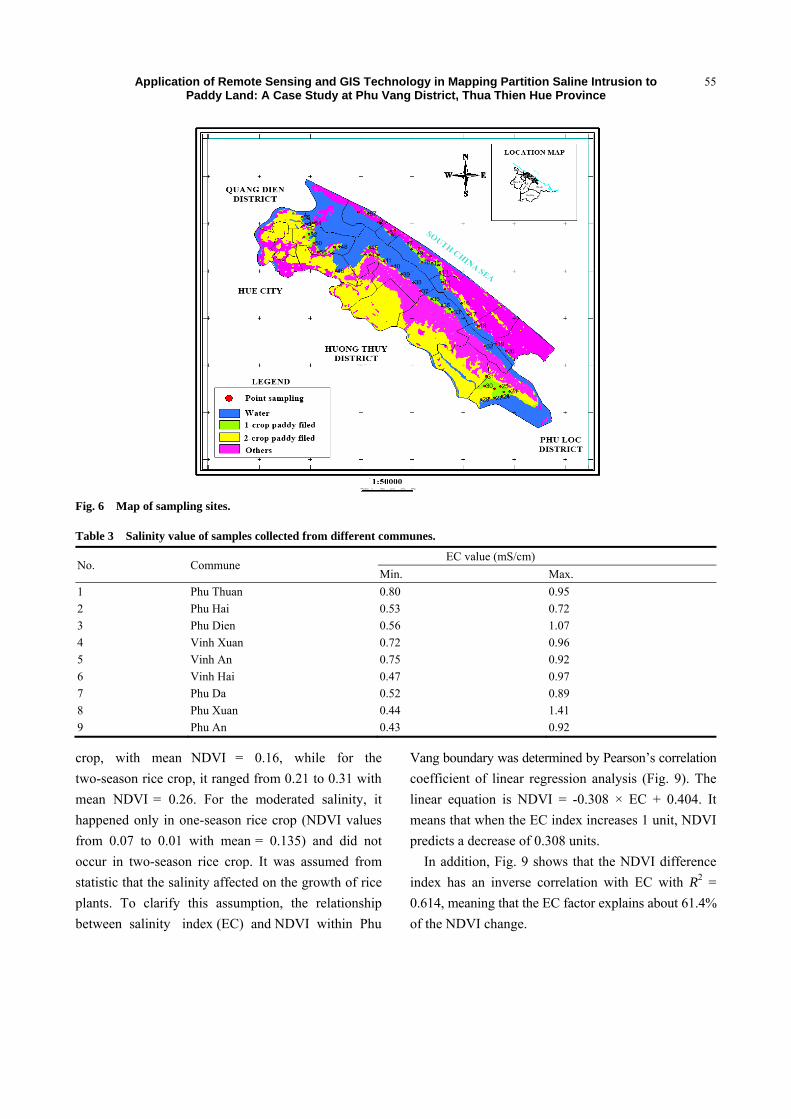
After zoning salinity areas on rice land partition
map, soil samples were collected and coordinates of
sampling sites were recorded using GPS. In addition
to samples collected from zoned areas, more samples
were collected from other one-season rice land further
away from the lagoon in order to compare their
salinity. Locations of sampling sites are shown in
Fig. 6.
Test results of soil samples collected from zoned
area based on their NDVI index shown on map
showed that most of the samples were one-season rice
land concentrated mostly around the lagoon. Salinity
areas were affected by many environmental factors,
Application of Remote Sensing and GIS Technology in Mapping Partition Saline Intrusion to Paddy Land: A Case Study at Phu Vang District, Thua Thien Hue Province
54
Fig. 5 Distribution of paddy rice at Phu Vang district.
including topography, method of cultivation, tradition,
purpose of land use and hydrology, etc.. Salinity level
of each area varied greatly, as shown in Table 3. The
results showed that the salinity values fluctuated from
0.43 mS/cm to 1.41 mS/cm. As can be seen, low-lying
areas, or areas near shrimp ponds, brackish or salty
water fish ponds had high salinity, typically in Vinh
Xuan, Phu Xuan and Phu Dien communes.
Sampling and calculation of EC value in salinity
areas were preliminary based only on image analysis,
NDVI value and inputs from experts. Therefore, it was
not possible to measure salinity level or the extent of
salinity intrusion for the whole area. In order to
identify the extent of salinity intrusion and salinity
level of areas surrounding the sampling sites, the
calculated EC table must be interpolated.
Interpolation was done by importing coordinates of
sampling sites, together with their corresponding EC
value, into ArcMap and then run the interpolation
function from ArcGIS to calculate values for the
whole region using inverse distance weighting (IDW)
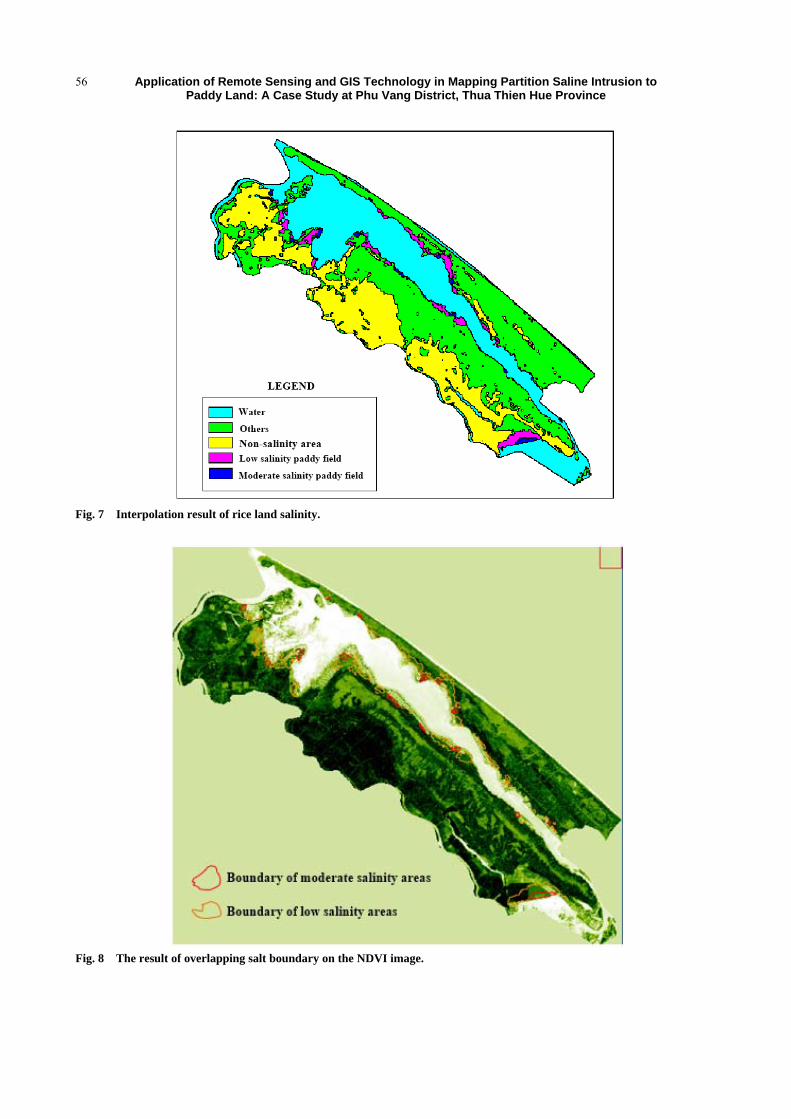
algorithm. Interpolation result of rice land salinity is
shown in Fig. 7.
3.3 The Relationship between EC Salinity Index and
NDVI Value
Based on the extracted NDVI on the map and
opinions of local people, the sample sites in the field
were identified to measure the salinity. To get more
information about the salinity of whole study area, the
interpolated salinity boundary of the paddy areas was
overlapped to the NDVI map to find the relationship
between the NDVI and salinity levels. The results
showed that there were two different salinity levels at
paddy land within Phu Vang district, including low
and moderate salinity areas. Most of salinity areas
were concentrated around lagoon (Fig. 8).
Table 4 shows that low salinity occurred on both
single and two-season rice crop areas, where, NDVI
values fluctuated from 0.12 to 0.20 for one-season rice
Application of Remote Sensing and GIS Technology in Mapping Partition Saline Intrusion to Paddy Land: A Case Study at Phu Vang District, Thua Thien Hue Province
55
Fig. 6 Map of sampling sites.
Table 3 Salinity value of samples collected from different communes.
No. Commune EC value (mS/cm)
Min. Max.
1 Phu Thuan 0.80 0.95
2 Phu Hai 0.53 0.72
3 Phu Dien 0.56 1.07
4 Vinh Xuan 0.72 0.96
5 Vinh An 0.75 0.92
6 Vinh Hai 0.47 0.97
7 Phu Da 0.52 0.89
8 Phu Xuan 0.44 1.41
9 Phu An 0.43 0.92
crop, with mean NDVI = 0.16, while for the
two-season rice crop, it ranged from 0.21 to 0.31 with
mean NDVI = 0.26. For the moderated salinity, it
happened only in one-season rice crop (NDVI values
from 0.07 to 0.01 with mean = 0.135) and did not
occur in two-season rice crop. It was assumed from
statistic that the salinity affected on the growth of rice
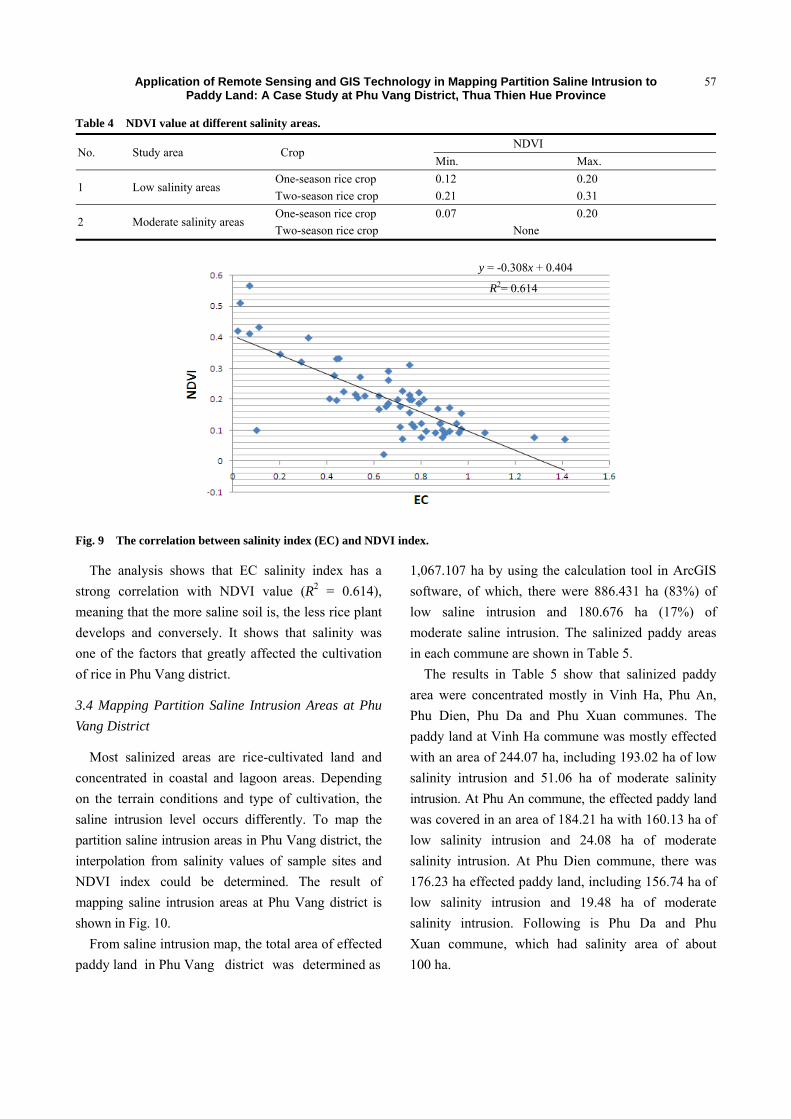
plants. To clarify this assumption, the relationship
between salinity index (EC) and NDVI within Phu
Vang boundary was determined by Pearson’s correlation
coefficient of linear regression analysis (Fig. 9). The
linear equation is NDVI = -0.308 × EC + 0.404. It
means that when the EC index increases 1 unit, NDVI
predicts a decrease of 0.308 units.
In addition, Fig. 9 shows that the NDVI difference
index has an inverse correlation with EC with R2 =
0.614, meaning that the EC factor explains about 61.4%
of the NDVI change.
Application of Remote Sensing and GIS Technology in Mapping Partition Saline Intrusion to Paddy Land: A Case Study at Phu Vang District, Thua Thien Hue Province
56
Fig. 7 Interpolation result of rice land salinity.
Fig. 8 The result of overlapping salt boundary on the NDVI image.
Application of Remote Sensing and GIS Technology in Mapping Partition Saline Intrusion to Paddy Land: A Case Study at Phu Vang District, Thua Thien Hue Province
57
Table 4 NDVI value at different salinity areas.
No. Study area Crop NDVI
Min. Max.
1 Low salinity areas One-season rice crop 0.12 0.20
Two-season rice crop 0.21 0.31
2 Moderate salinity areas One-season rice crop 0.07 0.20
Two-season rice crop None
Fig. 9 The correlation between salinity index (EC) and NDVI index.
The analysis shows that EC salinity index has a
strong correlation with NDVI value (R2 = 0.614),
meaning that the more saline soil is, the less rice plant
develops and conversely. It shows that salinity was
one of the factors that greatly affected the cultivation
of rice in Phu Vang district.
3.4 Mapping Partition Saline Intrusion Areas at Phu
Vang District
Most salinized areas are rice-cultivated land and
concentrated in coastal and lagoon areas. Depending
on the terrain conditions and type of cultivation, the
saline intrusion level occurs differently. To map the
partition saline intrusion areas in Phu Vang district, the
interpolation from salinity values of sample sites and
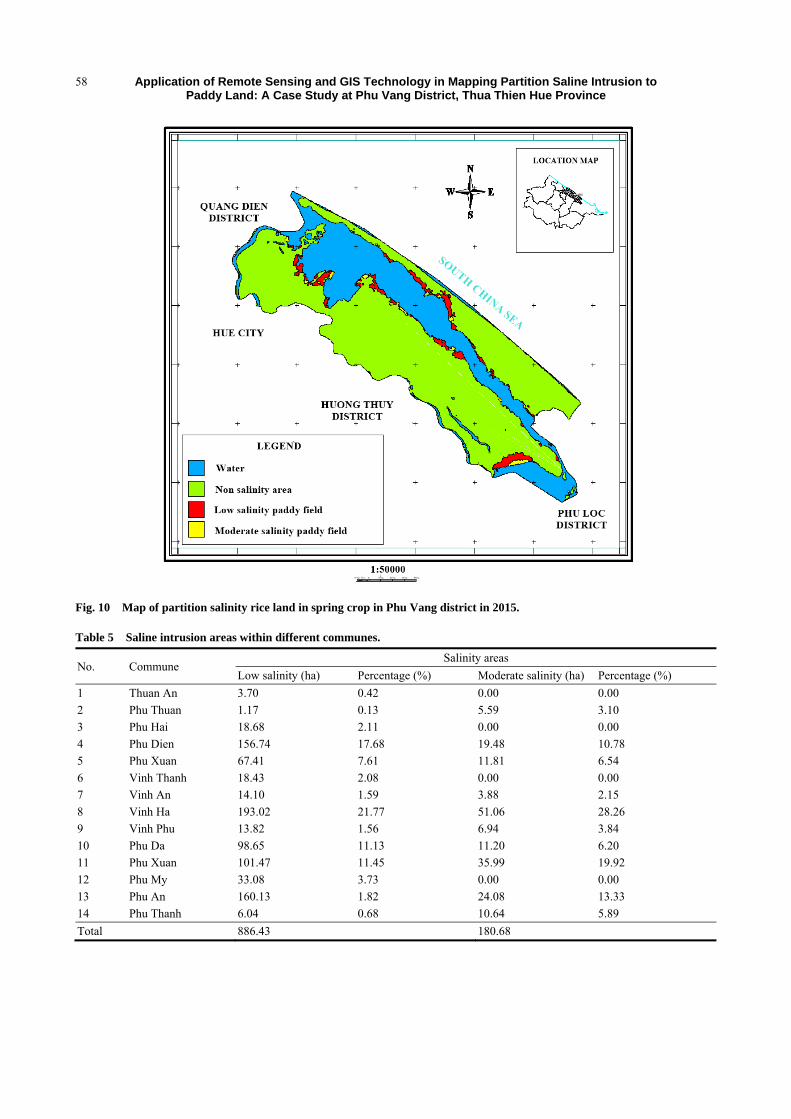
NDVI index could be determined. The result of
mapping saline intrusion areas at Phu Vang district is
shown in Fig. 10.
From saline intrusion map, the total area of effected
paddy land in Phu Vang district was determined as
1,067.107 ha by using the calculation tool in ArcGIS
software, of which, there were 886.431 ha (83%) of
low saline intrusion and 180.676 ha (17%) of
moderate saline intrusion. The salinized paddy areas
in each commune are shown in Table 5.
The results in Table 5 show that salinized paddy
area were concentrated mostly in Vinh Ha, Phu An,
Phu Dien, Phu Da and Phu Xuan communes. The
paddy land at Vinh Ha commune was mostly effected
with an area of 244.07 ha, including 193.02 ha of low
salinity intrusion and 51.06 ha of moderate salinity
intrusion. At Phu An commune, the effected paddy land
was covered in an area of 184.21 ha with 160.13 ha of
low salinity intrusion and 24.08 ha of moderate
salinity intrusion. At Phu Dien commune, there was
176.23 ha effected paddy land, including 156.74 ha of
low salinity intrusion and 19.48 ha of moderate
salinity intrusion. Following is Phu Da and Phu
Xuan commune, which had salinity area of about
100 ha.
y = -0.308x + 0.404
R2= 0.614
Application of Remote Sensing and GIS Technology in Mapping Partition Saline Intrusion to Paddy Land: A Case Study at Phu Vang District, Thua Thien Hue Province
58
Fig. 10 Map of partition salinity rice land in spring crop in Phu Vang district in 2015.
Table 5 Saline intrusion areas within different communes.
No. Commune Salinity areas
Low salinity (ha) Percentage (%) Moderate salinity (ha) Percentage (%)
1 Thuan An 3.70 0.42 0.00 0.00
2 Phu Thuan 1.17 0.13 5.59 3.10
3 Phu Hai 18.68 2.11 0.00 0.00
4 Phu Dien 156.74 17.68 19.48 10.78
5 Phu Xuan 67.41 7.61 11.81 6.54
6 Vinh Thanh 18.43 2.08 0.00 0.00
7 Vinh An 14.10 1.59 3.88 2.15
8 Vinh Ha 193.02 21.77 51.06 28.26
9 Vinh Phu 13.82 1.56 6.94 3.84
10 Phu Da 98.65 11.13 11.20 6.20
11 Phu Xuan 101.47 11.45 35.99 19.92
12 Phu My 33.08 3.73 0.00 0.00
13 Phu An 160.13 1.82 24.08 13.33
14 Phu Thanh 6.04 0.68 10.64 5.89
Total 886.43 180.68
Application of Remote Sensing and GIS Technology in Mapping Partition Saline Intrusion to Paddy Land: A Case Study at Phu Vang District, Thua Thien Hue Province
59
4. Conclusions
The integration of remote satellite and field survey
is a new approach for mapping paddy land and the
salinity intrusion. The extracted maps could be used to
assess the change of land use and the level of salinity
intrusion in different periods of time, which help the
local authorities at Phu Vang district have good
strategies in management of the effected paddy land.
Based on the map of paddy land at Phu Vang district
in 2015, it was estimated that the area of one-season
rice crop was 1,401.96 ha and 8,539.39 ha for
two-season rice crop. There were around 1,067.107 ha
salinity area, accounting for 10.04% of total paddy
land, of which 180.67 ha moderate salinity area and
866.43 ha low salinity areas. The salinity at Phu Vang
district ranged from 0.4 mS/cm to 1.41 mS/cm and the
average salinity was approximately 0.9 mS/cm.
In addition, the research also showed the negative
relationship between salinity index (EC) and
vegetation development (NDVI). According to
the results, the salinity and NDVI within the
boundary of Phu Vang district were closely related to
61.4%. The higher the salinity of land was, the lower
the established NDVI of rice plant was, and
conversely.
References
[1] Hieu, N. T. 2010. “Climate Change and Impact in Vietnam.” Institute of Meteorology, Hydrology and Environment. Accessed August, 2017. http://csdl.dmhcc. gov.vn/upload/csdl/2008923579_1.-Bien-doi-khi-hau-va-
tac-dong-o-Viet-Nam.pdf. (in Vietnamese) [2] Al-Mulla, Y. A. 2010. “Salinity Mapping in Oman Using
Remote Sensing Tools: Status and Trends.” In A
Monograph on Management of Salt-Affected Soils and
Water for Sustainable Agriculture, edited by Ahmed, M.,
Al-Rawahy, S. A., and Hussain, N. Muscat, Oman: Sultan
Qaboos University, 17-24.
[3] Tuyet, Q. T. T. 2015. “Assessment of Salinity Intrusion
due to Climate Change in the Lower Part of the River
Basin, Nghe An Province.” Master thesis, Hanoi Science
University. (in Vietnamese)
[4] Nui, N. D. 2014. “Study Salinity Intrusion in Water Resources and Propose Solutions for Exploitation and Use at Ha Tinh Coastal Zone.” Master thesis, Hanoi University of Science. (in Vietnamese)
[5] Lobell, D. B., Lesch, S. M., Corwin, D. L., Ulmer, M. G., Anderson, K. A., Potts, D. J., Doolittle, J. A., Matos, M. R., and Baltes, M. J. 2010. “Regional-Scale Assessment of Soil Salinity in the Red River Valley Using Multi-year MODIS EVI and NDVI.” J. Environ. Quality 39 (1): 35-41.
[6] Dung, T. T. P. 2012. “Application of Remote Sensing
Image MODIS to Partition the Impact of Salt Intrusion in
Ben Tre Province.” Bachelor thesis, Nong Lam
Univeristy. (in Vietnamese)
[7] Huong, H. T. T., Minh, V. Q., and Tuan, L. A. 2016.
“Using Remote Sensing MODIS Data for Monitoring the
Effects of Drought and Flood on Rice Farming System
Changes in the Vietnamese Mekong Delta.” Can Tho
University Journal of Science 45: 52-65. (in Vietnamese)
[8] Thoi, N. K., Thanh, P. V., Vinh, T. Q., and Hien, N. T. T.
2011. Remote Sensing. Hanoi, Vietnam: Hanoi University
of Agriculture. (in Vietnamese)
[9] Treitz, P. M., Howarth, P. J., and Gong, P. 1992.
“Application of Satellite and GIS Technologies for
Land-Cover and Land-Use Mapping at the Rural-Urban
Fringe: A Case Study.” Photogramm. Eng. Rem. Sens. 58
(4): 439-48.