o f nr e m o tes journal of remote sensing & gis · ... j remote sensing & gis 2016, 5:4...
TRANSCRIPT

Research Article OMICS International
Kumar and Babu, J Remote Sensing & GIS 2016, 5:4DOI: 10.4172/2469-4134.1000177Journal of Remote Sensing & GIS Jo
urna
l of R
emote Sensing & GIS
ISSN: 2469-4134
Volume 5 • Issue 4 • 1000177J Remote Sensing & GIS, an open access journalISSN: 2469-4134
Keywords: Customized web GIS based application; Land use planning; Ground water; Agriculture crop monitoring system; Yield information; DSS for agricultural information
IntroductionAgriculture is the backbone of Indian economy, contributing about
40 percent towards Gross National Product (GNP) and provid ing livelihood to about 70 per cent of the population. So, for a primarily agrarian country like India, accurate and timely information on the types of crops grown and their acreages, crop yield and crop growth conditions are essential for strengthening country's food security and distribution system. Pre-harvest estimates of crop production are needed for guiding the decision makers in formulating optimal strategies for planning, distribution, price fixation, procurement, transportation and storage of essential agricultural products [1]. Advance forecasting about crop condition and crop production has a strong bearing on national economy as well as day-to-day life of the masses. The sugar and onion crises of late 90s showed that a faulty crop forecasting system could create havoc for the government and the public.
The space borne remote sensing and GIS Technology has been providing information for many agricultural applications, such as identification and area estimation of short duration and marginal crops grown in fragmented land holdings, detection of crop stress due to nutrients and diseases, and quantification of its effect on crop yield. There is a strong need to develop methodologies for improving crop yield models, retrieval of agro-met and canopy parameters, quantification of soil loss, damage assessment and generation of information on moisture and nutrient status of soil sub-surface horizons, inorder to achieve the best crop yield [2].
In order to bridge these gaps, the use of WEB GIS and Spatial data base generated through the high resolution satellite imagery will be
*Corresponding author: Dr. Santosh Kumar K, Associate Professor, H&S, Methodist college of Engineering and Technology, King Koti, Abids, Hyderabad, Telangana, India, Tel: +917729992731; E-mail: [email protected]
Received October 22, 2016; Accepted November 14, 2016; Published November 16, 2016
Citation: Kumar SK, Babu SDB (2016) A Web GIS Based Decision Support System for Agriculture Crop Monitoring System-A Case Study from Part of Medak District. J Remote Sensing & GIS 5: 177. doi: 10.4172/2469-4134.1000177
Copyright: © 2016 Kumar SK, et al. This is an open-access article distributed under the terms of the Creative Commons Attribution License, which permits unrestricted use, distribution, and reproduction in any medium, provided the original author and source are credited.
AbstractThe success of planning for developmental activities depends on the quality and quantity of information available
on both natural and socio-economic resources. It is, therefore, essential to devise the ways and means of organizing computerized information system. These systems must be capable of handling vast amount of data collected by modern techniques and produce up to date information. Remote sensing technology has already demonstrated its capabilities to provide information on natural resources such as crop, land use, soils, forest etc., on regular basis. The role of remote sensing and GIS in agricultural applications can be broadly categorized into two groups-inventorying/mapping and management. While remote sensing data alone are mostly used for, inventorying, crop acreage estimation, crop condition assessment, crop yield forecasting, soil mapping, etc., purposes, the management related activities like irrigation management, cropping system analysis, precision farming, etc., needs various other types of spatial physical! Environmental information. The latter has to be integrated with remote sensing data, where the functionality of GIS will be used. In the present study, techniques of remote sensing and Geographic Information System (GIS) have been used to monitor and map the Sugarcane crop at farm level. The Quick bird data of 60 cm resolution was acquired and was geometrically corrected and georeferenced for subsequent processing and analysis using Digital Image Processing (DIP) and GIS. After the generation of the thematic layers at farm level using GIS, using the various customization tolls available in the GIS a web based monitoring system for the sugarcane has been prepared. This monitoring system helps the decision makers to take appropriate decisions in order to increase the crop production and other activities related to the crop. The Web GIS helps the non-technical users to access the information and take appropriate measures to improve the crop production. These user-friendly systems need to be developed and made simple in order to take the technology from the scientific community to the common man.
A Web GIS Based Decision Support System for Agriculture Crop Monitoring System-A Case Study from Part of Medak DistrictSantosh Kumar K1* and Suresh Babu DB2
1Methodist college of Engineering and Technology, King Koti, Abids, Hyderabad, Telangana, India2Centre for Spatial Information Technology (CSIT), JNTUH, Hyderabad, Telangana, India
used for generating the processing and analytical techniques, that would enable integration of ground based parameters with the satellite data.
In order to study the advantage of using the space technology and information technology in crop monitoring and management of various activities involved in achieving a better yield a study is being done using high resolution satellite data and the use of information technology to create a web GIS application for monitoring the crop production with special emphasis on sugar cane crop.
Scope of the Study For the present study a particular land allotted to the sugar plants
by the concerned authorities of the government was taken up for Micro level planning. The Management of the Sugar Plants is responsible for all the measures for improving the Crop Production in the allotted land by proving the Seeds, fertilizers, Pesticides, Loans etc., to the Farmers. The Management is solely responsible for taking all the measures for improving crop production. In order to achieve the above mentioned features the management will do precise Field Wise observation of the

Citation: Kumar SK, Babu SDB (2016) A Web GIS Based Decision Support System for Agriculture Crop Monitoring System-A Case Study from Part of Medak District. J Remote Sensing & GIS 5: 177. doi: 10.4172/2469-4134.1000177
Page 2 of 20
Volume 5 • Issue 4 • 1000177J Remote Sensing & GIS, an open access journalISSN: 2469-4134
Pradesh and Gulbarga and Bidar of Karnataka state in west (Figure 1) [5]. The mandal lies between North Latitudes 17°46' 22'' and 17°32' 32'' and East Longitudes 77°26' 42'' and falls in Survey of India Toposheet Nos. 56G/6, 56G/9 and 56G/10 of scale 1:50000 published by Survey of India in 1973. The total area of the study area is 392.15 sq. km (Table 1).
MethodologyThe following methodology is adopted in the present study to
meet the above-mentioned objectives. The base map is generated at 1:25,000 scale from the SOI Toposheet. The thematic layers like LULC, Soil, Slope etc., are generated using the IRS P6 LISS IV images. Taking the SOI Toposheets as source, the thematic layers like drainage and contours are prepared at 1: 25,000 scales [6]. The slope map is derived using Survey of India topographical sheets at 1:25000 scale with 5-meter contour interval. The rainfall and temperature data and other collateral data of the study area are collected and are integrated in the GIS Domain. The DEM (Digital Elevation Model) is generated from the contours. The soil map is taken as the base for integration.
A scheme for thematic data integration and recommendation for various combinations of land parameters was evolved by observations in the field. Following the scheme of data integration, action plan maps were generated giving suitable site-specific recommendations for alternate land use and water conservation measures [6]. While formulating the locale-specific action plan, the earlier research carried out by various research centers in the field of agriculture etc., were taken into consideration along with the prevailing socio-economic conditions.
All these data which are generated in the GIS domain are used as inputs in the Application developed using the open source software. The developed open source web based decision support system is an package which works independent of the GIS software’s and tools were created in the package in such a that any use user without the Technical Knowledge can also operate the package and can perform some of the functions like displaying the data, querying the data, overlay and union which are there in the GIS software’s.
Technologies Used for the StudyFor the present study high resolution satellite data of 60 cm
resolution is used to prepare the field wise spatial map. The revenue map of the study area is geometrically corrected using the Imagery and also by collecting control points using the GPS from the field. The information related to the each survey number is collected by field survey. This data are linked to the spatial data to generate Information system [7]. The data generated in the GIS are customized using java and a web based spatial decision support system is generated for better planning and management of the Agriculture Crop (Figure 2).
land. To Monitor each and every field and for better Communication from the Field data, management will follow the Hierarchy Like Chief Cane Agriculture Officer, Deputy Cane Agriculture Officer, Area mangers, Field Assistants, Who will be incharge for two to three Villages. In the absence of an online management system it was observed that gaps were arising in the hierarchy which May lead to gaps in the communication and management [3]. Due to the wide extent of the area and the Hierarchy of employees, it is very difficult to monitor the allotted land very closely. Even for Planning the Regular Water, fertilizers and Pesticides Applications to the Fields and for identifying the Optimum way of Transportation of the Crop which is ready for Cutting to the Sugar Plants is being done manually, which is very tidies and it may lead to improper management, this in turn reduces the Crop Production. Most of the Managements are not keeping the records or History of the Fields at one Place and all these are Operated Manually and also not following the Technical Maps, Like Soil, Slope, and Ground Water Maps to Get the More Production. Even to Monitor the Field Assistants performance also management don’t have any Specific System.
The proposed System will be used for forecasting of crop production, Identifying the Fields, which are ready for harvesting, need for the use of fertilizer, and application of water, transportation and canal facilities etc., for all the Fields and also to get field wise reports like, Delay in providing water to the crops and use of fertilizers in the field at the appropriate time [4]. This technology is effectively used for monitoring the crop production and yield information of crop pertaining to the total land belongs to the Client.
The end use of such a system will be felt in obtaining higher productivity, lower overheads, data mining for long term planning and efficiency improvement, transparency to the management and cost control, enhanced management satisfaction, faster response and optimum utilization of available resources. The remote sensing coupled with GIS techniques play a vital role to achieve the Objectives [4].
Objectivesyy To Develop a WEB GIS Based unified data warehouse Model
for Agro based Industries., (A Case Study of Sugar Cane Agriculture i.e., Land which Belongs to a Particular Sugar Plant).
yy To provide information access to the Users for improving productivity through web GIS based decision support system for Agriculture Field Monitoring System.
yy To develop an open source web GIS based decision support system for Agriculture Field Monitoring System.
yy To develop a user-friendly monitoring system with WEB GIS technology and made available to common man apart from the Scientific Community.
yy To generate the natural resources thematic layers like LULC, Ground Water, Soil and slope maps for the Study Area and make use for Online Study.
Location and ExtentZaheerabad Mandal lies in the Medak District which is situated in
the Telangana region of Andhra Pradesh, India. Zaheerabad is located about 100 km from Hyderabad on the Mumbai-Hyderabad national highway (NH-9). The mandal is bounded on the north by Nyalkal, Northeast by Jharasangam, Southeast by Kohir mandals of Andhra
S.No Type of Software Purpose of usage Name of the software with Versions
1 GIS Software GIS Work Arc GIS (Ver 9.3)
2 Development software
WEB Portal Development Work
PHP, Openalyers API, PostgreSQL+PostGIS(DBMS)
Jquery, Java Script, HTML
3 Animation and Design software
Design, Animation Work
(web portal development)
Macromedia Flash (8), Adobe Photoshop CS2, Coreldraw Graphics Suits (12), Adobe
Dreamweaver CS3
4 Server Used Geoserver (Open Source Map Server)Apache (Open Source WEB Server)
Table 1: Technologies used for the study.

Citation: Kumar SK, Babu SDB (2016) A Web GIS Based Decision Support System for Agriculture Crop Monitoring System-A Case Study from Part of Medak District. J Remote Sensing & GIS 5: 177. doi: 10.4172/2469-4134.1000177
Page 3 of 20
Volume 5 • Issue 4 • 1000177J Remote Sensing & GIS, an open access journalISSN: 2469-4134
Results and DiscussionsSustainable agricultural land use and cropping pattern plans
of the area are generated by GIS based logical integration of crop suitability’s, land productivity, land capability, socio-economic and terrain characteristics information. Specific action plans are devised for optimum management of land and water resources through integration of information on natural resources, socio-economic and meteorological data and contemporary technology. An important task of Developed Application is to facilitate the linkage between non-spatial data and the spatial data. The non-spatial data like census, socio economics, agricultural inputs, etc., would be available in tabular form and has to be retrieved from the relational database management system (RDBMS). On the other hand, the spatial information is in the form of maps, referenced to the geographic latitudes-longitudes. The non-spatial tabular information is linked to the spatial information through a customized GIS approach. This query-shell facilitates data handling. The strength of GIS is the integration of multi-layered data from different sources and various scales [7]. The integration of different layers of information has been a difficult task manually until the maps were drawn on a transparent film. With the availability of GIS, which takes the data into digital space, the ability to see through maps, which are overlaid one over the other digitally and analyze the maps is achieved. Database management systems integrated with graphic interface have a powerful query capability. This will finally give the analytical ability to pose complex query and extract information spatially.
The end use of such a system will be felt in obtaining higher productivity, lower overheads, data mining for long term planning and efficiency improvement, transparency to the management and cost control, enhanced management satisfaction, faster response and optimum utilization of available resources. The remote sensing coupled with GIS techniques play a vital role to achieve the Objectives.
Figure 1: Village map of Zahirabad mandal.
Figure 2: Early research.

Citation: Kumar SK, Babu SDB (2016) A Web GIS Based Decision Support System for Agriculture Crop Monitoring System-A Case Study from Part of Medak District. J Remote Sensing & GIS 5: 177. doi: 10.4172/2469-4134.1000177
Page 4 of 20
Volume 5 • Issue 4 • 1000177J Remote Sensing & GIS, an open access journalISSN: 2469-4134
The conventional monitoring system of management can be enhanced with the integration of latest WEBGIS technology. The existing conventional monitoring system most of the times relay on the oral communication through telephonic conversations as input for the decision making. There is large scope for miscommunication of the information or communication gap due to the higher human interference in the system. This miscommunication may lead to delay in decision making and other works.
Land use/Land coverThe knowledge of spatial distribution of land cover/land use of large
area is of great importance to regional planners and administrators. Conventional ground methods are time consuming and no uniform classification system was used in the preparation of maps with the advent of remote sensing technology the above problems have been solved to quite some extent (Figure 3) [8].
Satellite data can provide information on large areas and the temporal data can be utilized for change detection and updating old data. The land use/land cover categories that can be obtained from the remotely sensed data include level I classes of land use classification system such as water bodies, forest, grass land, agricultural land, barren land and scrub land. The Spatial Distribution of the various land use land cover classes found the study are given below in Table 2.
Geo-morphologyThe mandal is covered under Godavari basin. Karanja Vagu is a
major small river which flows NW-NE direction in this mandal. The drainage pattern is dendritic in granite terrain and parallel in Deccan Traps. The hard rocks viz., Archeans and Deccan Traps occupy 79.35%, soft rocks viz., laterites 20.63% and alluvium 0.2%. The depth to water table in granite varies from 4.5 to 199 mm, in laterites from 5 to 30 m and in alluvium from 0.5 to 7.5 m. In Deccan Traps, Water occurs in fractures, crevices and joints. A number of lineaments form the promising zones for ground water development. Laterites are highly porous and permeable and possess good water bearing capacity. Ground water is moderately hard and is required to be softened before use [8]. The land forms in the district are mostly structural, denudation and fluvial in origin. In the northern parts, crystalline complex represented by meta sediments, gneisses and granite forms a distinct pediplain. This unit resulting out of the denudational process comprises landforms like residual hills, Inselberg and shallow weathered pediplain. In the western part, landforms are of moderately dissected plateau.
Hydro geomorphologyHydrogeomorphology deals with the study of landform in relation to
groundwater occurrence and availability. It is manifested at the surface, mainly by geology, geomorphology, structure and recharge conditions (Figure 4). All the four parameters were studied and integrated to arrive at the groundwater prospects under each geomorphic cum lithologic unit, designated as hydrogeomorphic unit. The following Geomorphic units are mapped in the Zaheerabad Mandal at 1:50,000 scale are listed below in Table 3. The various geomorphic units which are which are present in Zaheerabad Mandal and is given below in Table 3.
Ground water potential mapGround water potential maps are prepared by integrating
information on geomorphology, slope lithology, structural features and the precipitation. Ground water recharge depends on favourable slope, permeability and degree of compactness of the rocks. The movement and occurrence of ground water is controlled mainly by Geology,
Geomorphology and Recharge Conditions of the area [9]. The Geology and Geomorphology of the study area have been studied and by combining the individual litholo-landform units the Geomorphology map is prepared. These Geomorphic units have been evaluated for their Ground Water Prospects based on the hydrogeological characteristics of the geological and geomorphological parameters. The areal extent of various Geomorphic units with the ground water potential for the zaheerabad mandal is given in Figure 5.
SoilsThe district exhibits a variety of soils. Black cotton soil ranging in
thickness from 0.3 to 0.75 m occurs in Zaheerabad, Tumkund, Kotur and Didgi villages. Red soil ranges in thickness from 0.75 to 2 m. It possesses high water retention capacity. Major part of the district is arable unirrigated land around Zaheerabad. Around 17 soil series were mapped for the entire mandal using the satellite imageries and field survey at 1:50,000 (Figure 6).
Derived soil parameters: Soil-site and other land characteristics studied and recorded during field data collection and mapping have been interpreted and the soil map units grouped with respect to the major soil attributes such as soil depth (effective rooting depth), surface soil texture, gravelliness and stoniness, soil drainage, soil available-water capacity, soil slope, soil erosion, calcareousness etc. Such interpretative grouping of soil and land characteristics help in identifying areas that have specific problems like shallow rooting depth, severe erosion, poorly drained areas, sandy areas, steeply sloping lands, salt affected lands etc., and areas that have high potential like very deep soils, non-gravelly soils, non-saline or level areas etc., for sustained agricultural and non-agricultural uses.
Soil depth: Soil depth determines to a great extent the rooting system of plants which is ultimately reflected in crop growth and crop yield (Figure 7). It determines the capacity of the soil column to hold water and supply plant nutrients in relation to soil texture, mineralogy and gravel content. The extent of area under each depth-class association for the study area is given in Table 4.
Soil erosion: Soil erosion refers to the wearing away of the earth's surface by the forces of water, wind and ice. It is both destructive and constructive. It is responsible for causing variations in topography by eroding elevated land surfaces and at the same time depositing the eroded material in the plains, basins and valleys. It is further aggravated by human intervention through indiscriminate felling of trees, overgrazing, mining, and cultivation on steep slopes and degraded lands, thus affecting the natural ecosystem. Based on the intensity of erosion as observed visually during field survey and mapping, and also the amount of soil (loss of A or B horizons) removed in the soil profiles examined, the soils of study area have been classified under three erosion classes 'liz ;- ej-nil or slight erosion, e2-moderate erosion and e3-severe erosion.
Soil calcareousness: Calcareousness (lime content) is the term used to indicate the content of calcium carbonate in the soil. In the field, it is estimated by observation of the effervescence given by the soil when it is moistened with dilute hydrochloric acid. Soil calcareousness classes used were 0-nil effervescence (non-calcareous), 1-slight effervescence (slightly calcareous), 2-strong effervescence (strongly calcareous). Calcareousness influences soil pH and the availability of macronutrients and micronutrients (Figure 8). Physical conditions of soils are also greatly influenced by the quantity and size of lime nodules and concretions. The extent of area under each calcareousness class association for the study area is given in Table 5.

Citation: Kumar SK, Babu SDB (2016) A Web GIS Based Decision Support System for Agriculture Crop Monitoring System-A Case Study from Part of Medak District. J Remote Sensing & GIS 5: 177. doi: 10.4172/2469-4134.1000177
Page 5 of 20
Volume 5 • Issue 4 • 1000177J Remote Sensing & GIS, an open access journalISSN: 2469-4134
Figure 3: Land use land cover map, Zaherabad Mandal, Medak District, A.P.
Figure 4: Hydro geomorphology map, Zaherabad Mandal, Medak District, A.P.

Citation: Kumar SK, Babu SDB (2016) A Web GIS Based Decision Support System for Agriculture Crop Monitoring System-A Case Study from Part of Medak District. J Remote Sensing & GIS 5: 177. doi: 10.4172/2469-4134.1000177
Page 6 of 20
Volume 5 • Issue 4 • 1000177J Remote Sensing & GIS, an open access journalISSN: 2469-4134
Figure 5: Ground water potential map, Zaheerabad Mandal, Medak District, A.P.
Figure 6: Soil map, Zaheerabad Mandal, Medak District, AP.

Citation: Kumar SK, Babu SDB (2016) A Web GIS Based Decision Support System for Agriculture Crop Monitoring System-A Case Study from Part of Medak District. J Remote Sensing & GIS 5: 177. doi: 10.4172/2469-4134.1000177
Page 7 of 20
Volume 5 • Issue 4 • 1000177J Remote Sensing & GIS, an open access journalISSN: 2469-4134
Figure 7: Soil depth map, Zaheerabad Mandal, Medak District, A.P.
Figure 8: Soil calcarenous map, Zaheerabad Mandal, Medak District, A.P.

Citation: Kumar SK, Babu SDB (2016) A Web GIS Based Decision Support System for Agriculture Crop Monitoring System-A Case Study from Part of Medak District. J Remote Sensing & GIS 5: 177. doi: 10.4172/2469-4134.1000177
Page 8 of 20
Volume 5 • Issue 4 • 1000177J Remote Sensing & GIS, an open access journalISSN: 2469-4134
growth and seedling emergence, intercultural operations and farm mechanization (Figure 10).
The gravel and stone content by volume for each of the soil horizon, as well as on the surface recorded during soil survey were used for grouping the soils into different gravelly or stony classes. The gravelly and stony classes used were (1) go-non-gravelly (0-15% gravel), (2) g1-slightly gravelly (15-35% gravel), (3) g2-moderately gravelly (35-60% gravel), (4) g3-strongly gravelly (60-90% gravel), and (5) st 5-strongly stony (>90% stones). The extent of area under each gravelliness /stoniness class association for the study area is given in Table 7.
SlopeSlope refers to the inclination of the surface of the land. It is
defined by gradient, shape and length, and is an integral part of any soil as a natural body. The length and gradient of slope influences soil formation and soil depth, which in turn affects land development and land use (Figure 11). Around 97 sq.km of area under mandal is level to nearly level slope, 220 sq.km of area is under very gently sloping lands and 72 sq.km is covered under gently sloping land (Table 8).
Land evaluation methodsSoil map provides the user with information about the soil and
landform conditions at any site of interest (Young, 1976). Soil maps are produced to suit the needs of users with widely different problems because they contain considerable detail to show basic soil differences. Land evaluation is a tool for strategic land-use planning. It predicts land performance, both in terms expected benefits from and constraints to productive land use, as well as the expected environmental degradation due to these uses. There are various land evaluation methods used for assessing the potential and productivity of soil for agricultural purposes. Some of them can be listed as below:
(i). Land Capability Classification
(ii). Soil and Land Irrigability Classification
Soil available-water capacity: Available-water capacity (AWC) of soils is mainly dependent on the amount, intensity and distribution of rainfall, infiltration, permeability, drainage and texture, type of clay minerals, soil depth and content of coarse fragments. Classes of soil available-water capacity are based on the ability of soil column to retain water between the tensions of 0.33 kPa and 15 kPa in a depth of 100 cm soil or the entire column if the soil is shallower (Figure 9). The AWC of soils of the study area estimated from soil depth, gravel and stone and mineralogy can help in determining the length of crop growing period which helps in land use planning. The AWC classes used for grouping the soils of the district were (1) very low (<50 mm m-1), (2) low (50-100 mm m-1), (3) medium (100-150 mm m-1), (4) high (150-200 mm m-1) and (5) very high (>200 mm m-1). The extent of area under each AWC class association for the study area is given in Table 6.
Graveliness and stoniness: Gravel is the term used for describing coarse fragments between 2 mm and 7.5 cm diameter and stones between 7.5 cm and 25 cm. The presence of gravel and stones in the soil reduces the volume of soil that affects moisture storage, drainage, infiltration and runoff, and hinders plant growth by impeding root
Land use/Land cover category (LULC) Area in Sq. Km Area in %Forest Plantation 3.00 0.76Kharif Unirrigated 188.83 48.13
Scrub Forest 31.20 8Double Crops 42.46 10.9
Land with Scrub 115.14 29.3Land Without Scrub 5.71 1.5Deciduous Forest 3.52 0.9
Fuel Wood species 0.96 0.2Plantation 1.27 0.3
Barren rocky & Stony waste 0.04 0.01Total 392.13 100
Table 2: Spatial distribution of the various land use/land cover category.
Geomorphic Units Ground water Potential Area in Sq. Km Area in %
Moderately Thick Lateritic Plateau Moderate 84.05 21.43
Moderately Thick Lateritic Valley Moderate to Good 141.80 36.17
Thick Lateritic Plateau Moderate to Poor 166.28 42.40Total 392.13 100.00
Table 3: Areal extent of geomorphic units of Zaheerabad Mandal.
Mapping Unit Description Area in Sq. Km Area in %2 Extremely Shallow 98.99 25.243 Shallow 79.52 20.28
4 Moderately Shallow 17.36 4.43
7 Very Deep 192.10 48.99Water Bodies 4.16 1.06
Total 392.13
Table 4: Areal extent of soil depth units.
Mapping Unit Description Area in Sq. Km Area in %0 0-15% Non-Gravelly 76.04 19.391 15-35 % Slightly Gravelly 117.365 29.932 35-60 % Gravelly 194.58 49.62
Water Bodies 4.16 1.06Total 392.13 100.00
Table 5: Areal extent of soil calcareousness units.
Mapping Unit Description Area in Sq. Km Area in %1 Very Low 189.17 48.242 Low 44.28 11.293 Very High 154.52 39.41
Water Bodies 4.16 1.06Total 392.13 100.00
Table 6: Areal extent of soil water capacity units.
Slope Categories Description Area in Sq. Km Area in %
A (0-1%) Level to Nearly Level 97.07 24.76
B (1- 3%) Very Gently Sloping 219.20 55.90
C (3 – 8%) Gently Sloping 71.70 18.28Water Bodies 4.16 1.06
Total 392.13 100.00
Table 7: Areal extent of soil texture units.
Mapping Unit Description Area in Sq. Km Area in %C Clay 189.17 48.24
GC Low 44.28 11.29GSC Very High 154.52 39.41
Water Bodies 4.16 1.06Total 392.13 100.00
Table 8: Areal extent of slope units.

Citation: Kumar SK, Babu SDB (2016) A Web GIS Based Decision Support System for Agriculture Crop Monitoring System-A Case Study from Part of Medak District. J Remote Sensing & GIS 5: 177. doi: 10.4172/2469-4134.1000177
Page 9 of 20
Volume 5 • Issue 4 • 1000177J Remote Sensing & GIS, an open access journalISSN: 2469-4134
Figure 9: Soil water capacity map, Zaheerabad Mandal, Medak District, A.P.
Figure 10: Soil texture Map, Zaheerabad Mandal, Medak District., A.P.

Citation: Kumar SK, Babu SDB (2016) A Web GIS Based Decision Support System for Agriculture Crop Monitoring System-A Case Study from Part of Medak District. J Remote Sensing & GIS 5: 177. doi: 10.4172/2469-4134.1000177
Page 10 of 20
Volume 5 • Issue 4 • 1000177J Remote Sensing & GIS, an open access journalISSN: 2469-4134
Land capability classification: Land capability classification is an interpretative grouping of soils to show the capability of different soils to produce field crops or to be put to other alternative uses such as pasture, forestry, as habitat for wildlife, recreation etc., on a sustained basis. It is based on inherent soil characteristics, external land features and other environmental factors that limit the use of the land (IARI 1970). Eight land capability classes identified. Soils suitable for agriculture are grouped under classes I to IV according their limitations for sustained agricultural production. Soils not suitable for agriculture are grouped under classes V to VIII for use for pasture, forestry, recreation purposes, quarrying and mining, and as habitat for wildlife (Figure 12). The land capability classes have subclasses to indicate the dominant limitation for agricultural use. Four kinds of limitations are recognized at the subclass level and denoted by "e" for problems caused by water and wind erosion, "w" for problems of drainage, wetness or overflow, "s" for soil limitations affecting plant growth like soil depth, heavy clay or sandy texture, gravelliness and stoniness, salinity or sodicity etc., and "c" for climate limitation. The aerial extents are mentioned in Table 9.
Land irrigability: Land irrigability classification is primarily concerned with predicting the behaviour of soils under the greatly altered water regime brought about by introduction of irrigation. Land irrigability classification is an interpretative grouping of soil map units into soil irrigability classes based on the degree of limitations for sustained use under irrigation and on physical and socio-economic factors (IARI, 1970) Soil irrigability classes are assigned without regard to the availability of irrigation water, water quality, land preparation costs, availability of drainage outfalls and other non-soil related factors. Five soil irrigability classes are recognized. They are class A (none to slight soil limitations), class B (moderate soil limitations), class C
(severe soil limitations), class D (very severe soil limitations) and class E (not suited for irrigation) (Figure 13).
The suitability of land for irrigation depends on the quality and quantity of water, drainage requirements and other economic considerations in addition to the soil irrigability class. Lands suitable for irrigation are grouped under classes 1 to 4 according to their limitations. Lands not suitable for irrigation are grouped under classes 5 (temporarily classed as not suitable pending further investigations) and class 6 (permanently not suitable). Land irrigability classes have subclasses to indicate the dominant limitations for sustained use under irrigation. Three subclasses based on limitations are recognized and denoted by "s" for soil limitations such as heavy clay or sandy texture, soil depth, gravelliness and stoniness, "d" for drainage problems and "t" for limitations of topography. The aerial extents of various land irrgability are mentioned in Table 10.
Finalization of action planTo analyze and integrate spatial data using GIS, the thematic
maps were digitized, coded and stored using GIS software packages. Intersection of various theme maps was done progressively overlaying one layer over the other and by applying suitable decision criteria developed for that area. The final composite units bring out various types of homogeneous units/polygons. These would fit into the decision rules/recommendation arrived at. The draft action plan is discussed with the department officials, district administration, local research centers, NGOs working in the area and some progressive farmers for their feedback. Such feedback is critically evaluated considering the concept of sustainability for suitable modifications/improvements. Subsequently, the draft action plan is validated on the ground before being finalized.
Figure 11: Slope map, Zaheerabad Mandal, Medak District, A.P.

Citation: Kumar SK, Babu SDB (2016) A Web GIS Based Decision Support System for Agriculture Crop Monitoring System-A Case Study from Part of Medak District. J Remote Sensing & GIS 5: 177. doi: 10.4172/2469-4134.1000177
Page 11 of 20
Volume 5 • Issue 4 • 1000177J Remote Sensing & GIS, an open access journalISSN: 2469-4134
Figure 12: Land capability map, Zaheerabad Mandal, Medak District.A.P.
Figure 13: Land irragability map, Zaheerabad Mandal, Medak District.A.P.

Citation: Kumar SK, Babu SDB (2016) A Web GIS Based Decision Support System for Agriculture Crop Monitoring System-A Case Study from Part of Medak District. J Remote Sensing & GIS 5: 177. doi: 10.4172/2469-4134.1000177
Page 12 of 20
Volume 5 • Issue 4 • 1000177J Remote Sensing & GIS, an open access journalISSN: 2469-4134
Recommendations: The soil and land resource units of Zaheerabad Mandal were assessed and evaluated for their suitability for growing rice, sorghum, maize, sugarcane, cotton, green gram, black gram, bengal gram, red gram, groundnut, sunflower, soybean, safflower, castor, and guava which are the major crops grown in different parts of the mandals. The parametric approach of Sys (1985) which is a modified version of the FAO Framework for Land Evaluation (1976) was used for evaluating the land suitability. The Framework for Land Evaluation has recognized two orders, namely, order S-suitable for agriculture and order N-not suitable for agriculture. These orders are further subdivided into classes, subclasses and units. Order S-suitable for agriculture has three classes, highly suitable-S1, moderately suitable-S2 and marginally suitable-S3. Order N-not suitable for agriculture has two classes, N1-currently not suitable and N2-permanently not suitable for agriculture. The criteria assumed for differentiating into - e classes are that, under a given management level specified to obtain optimum yield from a highly suitable land (Sl), the maximum reduction in yield successively may be in the order of about 25% for S2 and 50% for S3 classes. The suitability subclass reflects the kinds of limitations and indicate the kind of land improvements required within a class. The subclasses are indicated by the symbol using-lower case letters following the arabic numeral (c-climate, e-erosion hazard, f-flood hazard, g-gravelliness, k-workability, I-topography, m-moisture availability, n-nutrient availability, p-crusting, r-rooting condition, t-texture, w-drainage, z-excess of salts/calcareousness). The suitability evaluation shows the areas that are highly suitable (class S1), moderately suitable (subclasses of S2), marginally suitable (subclasses of S3), currently not suitable; (class N1) and permanently not suitable (class N2) for each crop.
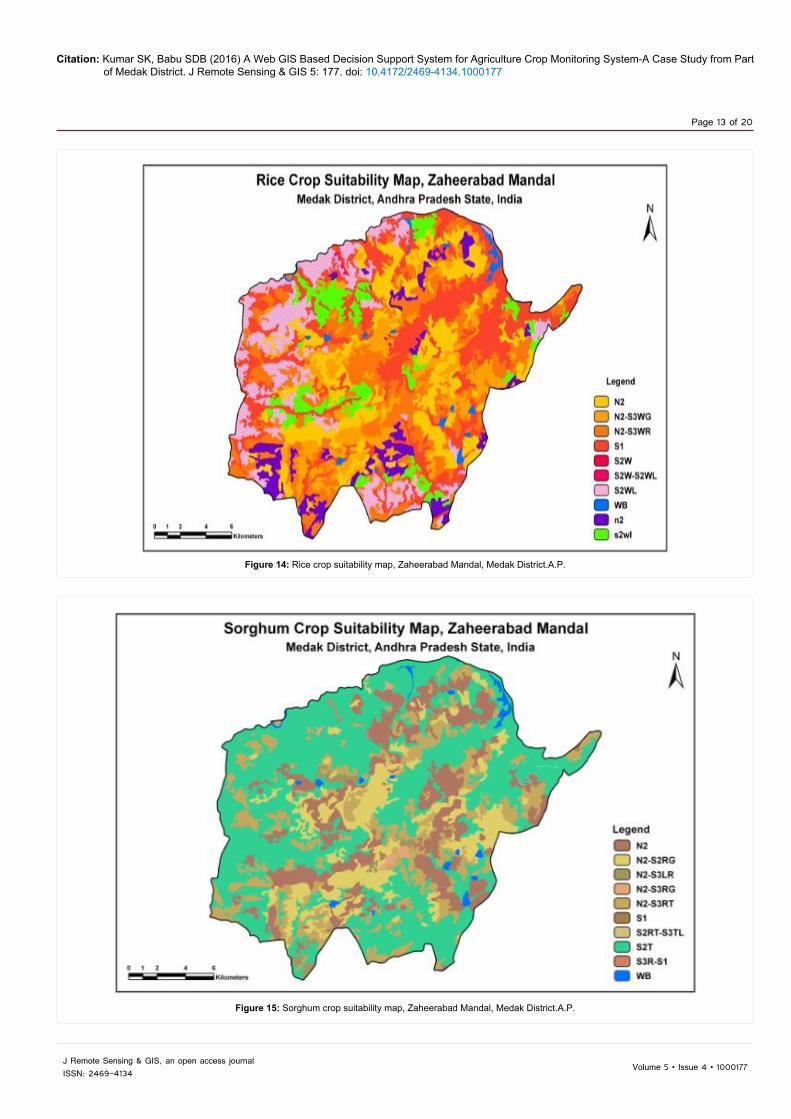
Land suitability for rice: The land suitability assessment revealed that there are 4 suitability classes, 5 subclasses and 14 subclass associations with different kinds and degree of limitations. About 13358 has (27.79%) area has been rated as moderately suitable in the mandal, 21614 ha (46.31%) area as marginally and 14186 ha (43.60%) area as unsuitable (N2) for growing Rice crop (Figure 14).
Land suitability for sorghum: The land suitability evaluation showed that there are 4 suitability classes, 5 classes and 17 subclass associations with different kinds and degree of limitations. About 13358 has (27.79% TGA) area has been rated as moderately suitable in the mandal, 21614 ha (46.31%) area as marginally and 14186 ha (43.60%) area as unsuitable (N2) for growing Rice crop (Figure 15).
Land suitability for maize: The suitability evaluation indicated that there are 4 suitability classes, 6 subclasses and 16 associations of subclasses with different kinds and degree of limitations. About 10498 ha (21.01%) area has been rated as highly suitable (S1) in the mandal, 22940 has (46.31%) area as moderately suitable (S2), 2862 (5.79%) area ,as marginally suitable (S3) and 13322 (26.89%) area as unsuitable (N2) for growing maize crop (Figure 16).
Land suitability for sugarcane: The land suitability evaluation showed that there are 4 suitability classes, 5 subclasses and 15 subclass associations with different kinds and degree of limitations. About 10246 ha (20.64% TGA) area has been rated as highly suitable (S1) in the mandal, 15646 ha (31.53%) area as moderately suitable (S2), 16745 ha (33.75%) area as marginally suitable (S3) and 6985 ha (14.07%) area as unsuitable (N2) for growing crop (Figure 17).
The Proposed Approach for System The real time information of current status of the fields at
various locations is possible with the continuous monitoring with the Geographic information Systems with supervisors. The proposed system contains two major components of Geographic Information system. The static data contain detailed mapping of the allotted Field Area as a spatial database in WEBGIS platform. The Dynamic data regarding the Fields of particular Sugar Plants are collected. The Proposed system will takes the input and continuously displays to enable the management for decision making of the realistic situation. The system can be accessed by separate logins for administrator and user. There is a scope for unlimited number of user to login to the system. By logging in the admin we can have an total view of the Area allotted for the particular Sugar Plant. The administrator has the rights to With a Supreme Authority, from this view and Creating new ID for managers, Filed supervisors and other authorized persons etc. (Figure 18).
Development of Open Source Web Based Decision Support System
Web based GIS are evolved from different Web maps and client server architecture to distributed ones. As such, Internet reshapes all functions of information systems including: gathering, storing, retrieving, analyzing, and visualizing data. Moreover, disseminating spatial information on the Internet improves the decision making processes. Development of the Web and expansion of the Internet provide two key capabilities that can greatly help the stakeholders. First, the Web allows visual interaction with data. By setting up a Web Server, clients can produce maps. Since the maps and charts are published on the Internet, other clients can view these updates, helping to speed up the evaluation process. Second, because of the near ubiquitous nature of the Internet, the geospatial data can be widely accessible. Clients can work on it from almost any location. The combination of easy access to data and visual presentation of it addresses some of the primary difficulties in performing geosciences evaluations. Web GIS is not without its challenges. The primary problem is speed; GIS relies on extensive use of graphics. Connection speeds over the Internet can make heavy use of graphics intolerably slow for users. This facility, to view maps with administrative and other necessary overlays. The site have facilitate user in query regarding crops and growing environments (Figure 19). Generally in every Sugar Industry the typical Organization Hierarchy is as follows, Chief Cane manager, Field Manager, field Supervisor and etc.
Admin loginFrom the Given WEB Site ADMIN can Login like shown in Figure 20.
Land Capability Units Area in Sq. Km Area in %II ES 98.25 25.05III ES 90.46 23.07III WS 94.96 24.31IV ES 104.3 26.60
Water Bodies 4.16 1.06Total 392.13 100.00
Table 9: Areal extent of land capability units.
Land Irrigability Units Area in Sq. Km Area in %2ST 31.44 8.023DS 165.16 42.123ST 20 .36 5.204ST 94.06 23.986ST 76.95 19.62
Water Bodies 4.16 1.06Total 392.13 100.00
Table 10: Areal extent of land irrigability units.
Citation: Kumar SK, Babu SDB (2016) A Web GIS Based Decision Support System for Agriculture Crop Monitoring System-A Case Study from Part of Medak District. J Remote Sensing & GIS 5: 177. doi: 10.4172/2469-4134.1000177
Page 13 of 20
Volume 5 • Issue 4 • 1000177J Remote Sensing & GIS, an open access journalISSN: 2469-4134
Figure 14: Rice crop suitability map, Zaheerabad Mandal, Medak District.A.P.
Figure 15: Sorghum crop suitability map, Zaheerabad Mandal, Medak District.A.P.

Citation: Kumar SK, Babu SDB (2016) A Web GIS Based Decision Support System for Agriculture Crop Monitoring System-A Case Study from Part of Medak District. J Remote Sensing & GIS 5: 177. doi: 10.4172/2469-4134.1000177
Page 14 of 20
Volume 5 • Issue 4 • 1000177J Remote Sensing & GIS, an open access journalISSN: 2469-4134
Figure 16: Maize crop suitability map, Zaheerabad Mandal, Medak District.A.P.
Figure 17: Sugarcane crop suitability map, Zaheerabad Mandal, Medak District.A.P.

Citation: Kumar SK, Babu SDB (2016) A Web GIS Based Decision Support System for Agriculture Crop Monitoring System-A Case Study from Part of Medak District. J Remote Sensing & GIS 5: 177. doi: 10.4172/2469-4134.1000177
Page 15 of 20
Volume 5 • Issue 4 • 1000177J Remote Sensing & GIS, an open access journalISSN: 2469-4134
Figure 18: Web based GIS architecture.
Figure 19: Flow chat of Web based decision support system.

Citation: Kumar SK, Babu SDB (2016) A Web GIS Based Decision Support System for Agriculture Crop Monitoring System-A Case Study from Part of Medak District. J Remote Sensing & GIS 5: 177. doi: 10.4172/2469-4134.1000177
Page 16 of 20
Volume 5 • Issue 4 • 1000177J Remote Sensing & GIS, an open access journalISSN: 2469-4134
Manager login
The total view of the Area allotted for the Sugar Plant can be seen after Login in the system. The road network of the study area is captured from the satellite imagery and is overlaid on the map. From this we can do analysis on the nearest route to reach the particular field and the SDSS can also predict alternative root in case of any problem in the main route (Figure 23).
Similarly from the DSS package we can identifying the fields which are ready for cutting and to view the delay reports of water, Fertilizers and etc., from the fields and then see to rectify that delays by avoiding the dependency in the oral communication by seeing the data about each and every field like Farmer name, date of seeding, date of application of fertilizer and water, other crop information and etc., which is useful for continuous monitoring of fields to know the status of the crop and also the performance of the field supervisor and Thus the human error in communication can be minimized with the continuous monitoring of real time data available within the system by any superior prior to implement the decision (Figure 24).
Field supervisor loginThe total spatial view of the area allotted for the Supervisor of the
Sugar Plant can be seen after logging in to the system. From the spatial view the information about each individual field like name of the farmer, date of sowing, date of application of fertilizer and water, other crop information etc., which is useful for system to avoid any dependency and dependency on the oral communication. Thus the human error in communication can be minimized with the continuous monitoring of real time data available within the system by any manager prior to taking major decisions (Figure 21).
Field historyFrom this Package the history related to every field can be analyzed.
For example the date on which water and fertilizer can be known for each field. If there is a delay or laxity by the farmer in the applying of water or fertilizer the same can be known from the SDSS package. It also provides information about the date on which the field needs to be watered and also the due date for which the field should be watered. In case of the application of the fertilizers to the field can also be known using this Package (Figure 22).
Figure 20: Admin login for web GIS based decision support system for agriculture crop monitoring system.
Figure 21: Field supervisor login for web GIS based decision support system for agriculture crop monitoring system.

Citation: Kumar SK, Babu SDB (2016) A Web GIS Based Decision Support System for Agriculture Crop Monitoring System-A Case Study from Part of Medak District. J Remote Sensing & GIS 5: 177. doi: 10.4172/2469-4134.1000177
Page 17 of 20
Volume 5 • Issue 4 • 1000177J Remote Sensing & GIS, an open access journalISSN: 2469-4134
Figure 22: Field history.
Figure 23: Manager login for web GIS based decision support system for agriculture crop monitoring system.
Figure 24: Web GIS based decision support system for agriculture crop monitoring system.

Citation: Kumar SK, Babu SDB (2016) A Web GIS Based Decision Support System for Agriculture Crop Monitoring System-A Case Study from Part of Medak District. J Remote Sensing & GIS 5: 177. doi: 10.4172/2469-4134.1000177
Page 18 of 20
Volume 5 • Issue 4 • 1000177J Remote Sensing & GIS, an open access journalISSN: 2469-4134
Reports (Figures 25-28) Facilities provided by decision support system for agriculture
crop monitoring
yy Easy to use and Access the Data.
yy Getting Online information about Fields and Efficiency of the fields yielding & etc.
yy Easy to get the performance of Filed Supervisors.
yy Easy to get the History of each and every field.
yy Giving feel like actual Filed/Site Visit to the Management.
yy Reduce the Delay in application of water, Fertilizers and etc.
yy Transparency in Crop growth and land activities with Higher productivity and lower overheads
yy Transparency to the management and cost control.
yy Transparency for Planning of application of water from cannels, Route planning for transportation of crop after yielding to the Sugar plant and etc.
yy Easy to Maintain the Fields belongs to particular Sugar Plants.
yy Easy to get the status of Each and every Filed, So that Total allotted land status of Each and every Stage of the Crop Route map to reach the location.
yy Faster response and optimum utilization of available resources.
Figure 25: Delay in water application.
Figure 26: Delay in fertilizer application.

Citation: Kumar SK, Babu SDB (2016) A Web GIS Based Decision Support System for Agriculture Crop Monitoring System-A Case Study from Part of Medak District. J Remote Sensing & GIS 5: 177. doi: 10.4172/2469-4134.1000177
Page 19 of 20
Volume 5 • Issue 4 • 1000177J Remote Sensing & GIS, an open access journalISSN: 2469-4134
Figure 27: Delay in water and fertilizer application.
Figure 28: Fields ready for cutting.

Citation: Kumar SK, Babu SDB (2016) A Web GIS Based Decision Support System for Agriculture Crop Monitoring System-A Case Study from Part of Medak District. J Remote Sensing & GIS 5: 177. doi: 10.4172/2469-4134.1000177
Page 20 of 20
Volume 5 • Issue 4 • 1000177J Remote Sensing & GIS, an open access journalISSN: 2469-4134
yy Getting the Online status of Each and every Stage of the Crop in particular field.
Summary of delay reports to sugarcane plant management: The system provides continuous monitoring on crop activities and facilitates dynamic planning of strategies to meet the changing requirements of the crop or Sugar plant activities with respect to the impedance of the implementation of planned strategies. The scope for the enhancement in the system is much more as the advancement of the web technology. The databases can be made available for all the concerned authorities through Internet and intranet facilities. This connectivity definitely enhances the mutual cooperation of the authorities to accomplish the task with more efficiency.
ConclusionWEBGIS is essential to effective preparedness, communication,
and training tool for the management of Agro based industries, which offers enhancement for the existing manual system to avoid the human error in making the decisions to enhance the crop production and also provides continuous monitoring of the crop and field activities and operations. With the effective utilization of the advantages provided by the WEBGIS spatial database the efficiency in the planning and implementing activities can be improved.
References1. Bernard A (2003) A DSS is an Integration of Web-Based Programs. Geographic
Information Systems (GIS) Capabilities and Databases, USA, pp: 484-495.
2. David H (2006) Web-Based Systems, Client can use any internet-Connectedcomputer or web-enabled Mobile Phone or PDA to gain Real time Access tothe data, USA.
3. Mathlyalagana V (2004) Web GIS has the Potential to share data, provide easy access for users with limited GIS Knowledge, USA.
4. Alaguraja P, Durairaju S, Yuvaraj D, Sekar M, Muthuveerran P, et al. (2010)Land Use and Land Cover Mapping-Madurai District, Tamilnadu. India UsingRemote Sensing and GIS Techniques. International Journal of Civil andStructural Engineering 1: 91-100.
5. Gupta YK, Gupta RD, Kumar K (2010) Web GIS for Planning InfrastructuralFacilities at Village Level. Map india, India.
6. Aydİnoglu AC, Yomralİoglu T, Inan HI, Seslİ FA (2016) Managing land use/cover data harmonized to support land administration and environmental applications in Turkey. Scientific Research and Essays 5: 275-284.
7. Anselin L (1990) What is special about spatial data Alternative perspectiveon spatial data analysis. In Spatial Statistics: Past, Present and Future, (ed.)Griffith DA, Monograph 12, Institute of Mathematical Geography 21: 265-280.
8. Lillisand (2016) Keefe Fundamentals of Geographic Information Systems.
9. Upton GJ, Fingleton B (1985) GIS Development magazines of August,October 2003. Spatial data analysis by example, volume 1: Point pattern andquantitative data. Wiley, Toronto Singapore, Brisbane 28: 664.