evaluations of land use/land cover changes and land degradation in dera district, ethiopia: gis and...
TRANSCRIPT

International Journal of Scientific Research in Environmental Sciences, 2(6), pp. 199-208, 2014
Available online at http://www.ijsrpub.com/ijsres
ISSN: 2322-4983; ©2014 IJSRPUB
http://dx.doi.org/10.12983/ijsres-2014-p0199-0208
199
Full Length Research Paper
Evaluations of Land Use/Land Cover Changes and Land Degradation in Dera
District, Ethiopia: GIS and Remote Sensing Based Analysis
Temesgen Gashaw1*
, Amare Bantider2, Abraham Mahari
1
1Department of Natural Resource Management, Adigrat University, Ethiopia
2Center for Food Security Studies, College of Development Studies, Addis Abeba University, Ethiopia
*Corresponding Author: [email protected]
Received 23 February 2014; Accepted 29 April 2014
Abstract. Evaluation of land use/land cover changes and land degradation in Dera District, Ethiopia were undertaken using
two remotely sensed datasets (Landsat 5 TM of 1985 and Landsat 7 ETM+ imagery 2011). Land use/land cover change
detection and Normalized Difference Vegetation Index analysis was carried out on the two images. Global positioning system
and topographical maps of scale 1:50,000 for ground verification and ERDAS Imagine 9.1 and ArcGIS 9.2 software for
satellite image processing and analysis were used for the study. Field observations and focus group discussions were also
conducted to obtain addition information. The result of this study showed that cultivated and degraded lands were increased by
25.79% and 398% respectively at the expense of forest, shrub and grazing lands. Normalized Difference Vegetation Index
analysis has also indicated the increased of land degradation between 1985 and 2011 images which mainly aggravated by land
use/land cover changes.
Keywords: land use/land cover change, land degradation, NDVI
1. INTRODUCTION
Land use and land cover (LU/LC) change is a major
issue of global environment change (Prakasam, 2010).
The terms “land use” and “land cover” are often
confused. Land use change is defined as the alteration
of land use due to human intervention for various
purposes, such as for agriculture, settlement,
transportation, infrastructure and manufacturing, park
recreation uses, mining and fishery. In contrast, land
cover change refers to the conversion of land cover
from one category of land cover to another and/ or the
modifications of conditions within a category (Meyer
and Turner, 1992).
Land use dynamics is one of the major
environmental problems in Ethiopia (Berhan, 2010).
Studies conducted in different parts of the country
reported a significant decrease of vegetation cover due
to the expansion of cultivated land (Gete and Hurni,
2001; Belay, 2002; Gessesse and Kleman, 2007;
Abate, 2011). Estimates of deforestation in Ethiopia,
which is mainly for expansion of rain fed agriculture,
vary from 80,000 to 200,000 ha per annum (EPA,
1997). While, some studies conducted in the
previously degraded parts of north Ethiopia, revealed
improvement of vegetation cover due to plantation
and enclosure of the previously degraded hillsides in
the period since the 1980s. For example, a study
conducted by Woldeamlak (2002) in Chemoga
watershed, East Gojjam revealed the increased of
forest cover at a rate of 11 ha per annum from 1957-
1998, even though it is eucalyptus plantation. Similar
study by Amare (2007) and Amare et al. (2011) in
Eastern Escarpment of Wello, Ethiopia and Munro et
al. (2008) in Tigray highlands disclosed that
vegetation cover improved since the 1980s owing to
land rehabilitation efforts of the community supported
by the government and multilateral donor agencies.
Land degradation includes all process that
diminishes the capacity of land resources to perform
essential functions and services in ecosystems (Hurni
et al., 2010) are caused by two interlocking complex
systems: the natural ecosystem and the human social
system. Interactions between the two systems
determine the success or failure of resource
management (Berry, 2003). The major causes of land
degradation in Ethiopia are rapid population increase,
severe soil loss, deforestation, low vegetative cover
and unbalanced crop and livestock production (Girma,
2001). In this case, the Ethiopian highlands are highly
affected by land degradation, which have eroded the
Gashaw et al.
Evaluations of Land Use/Land Cover Changes and Land Degradation in Dera District, Ethiopia: GIS and Remote
Sensing Based Analysis
200
natural resource bases of the area (Tilahun et al.,
2001).
LU/LC changes and land degradation are
interrelated (Gete and Hurni, 2001; Lambin et al.,
2003; Kiage et al., 2007; Messay, 2011) because
LU/LC changes are associated with deforestation,
biodiversity loss and land degradation (Maitima et al.,
2009). As rightly noted by Abate (2011) it is taken as
a serious problem in changing the environment.
Similarly, Desta et al. (2000); Tilahun et al. (2001);
Belay (2002) stated that LU/LC changes towards
cultivated land aggravates soil erosion problems
unless proper management are undertaken. A study by
Hurni and Ludi (2000) also reveals that human land
use around the Simen Mountains National Park has
accelerated the degradation of vegetation and soils.
Thus, evaluating the existing LU/LC and its periodic
change and land degradation is useful for urban
planners, policy makers and natural resource
managers (Tahir et al., 2013). In this case, GIS and
remote sensing provides an ability to characterize
large assessment areas and establish reference
conditions (Abate, 2011). However, studies on
evaluation of LU/LC dynamics and land degradation
and their linkage are rare in Ethiopia in general and in
the study area in particular. Thus, this study aims to
evaluate the pattern of LU/LC changes and land
degradation and to analysis their link.
2. MATERIALS AND METHODS
2.1. Study area
This study was conducted in Dera district, Ethiopia
which is located between 12°
92' - 13°
12' N latitude
and 34°
40' - 35°
80' E longitude and elevation from
1798 m to 2118 m above sea level. Topographically,
the area exhibited plateau at the upper limit to plain in
the lower limit. The average annual rainfall and
temperature is 1250 mm and 19 ᵒC respectively.
Agriculture is the major economic activity which is
characterized by rain-fed and predominantly
subsistence nature. Both crops and livestock
productions are equally important at Dega and
Woinadega agro-ecological zones of the study area.
The main soil types of the study area are Nitisols,
Vertisols, Gleysols, Luvisols and Cambisols. The
dominant vegetation type includes: Eucalyptus
species, Croton macrostachyus, Juniperus procera,
Cordia africana and Ficus vasta.
2.2. Data collection
Two years multi-temporal satellite imageries (Landsat
5 TM of 1985 and Landsat 7 ETM+ imagery 2011)
were used for the study. Field observations and focus
group discussions with farming households (HHs)
were also conducted to obtain additional information.
Global positioning system and topographical maps of
scale 1:50,000 were used for ground verification.
Table 1: Types of landsat and toposheet used in the study
Image Path Row Sensor Resolution or
Scale
No of Bands Date of
acquisition
Source
Landsat5 169 52 TM 30 X 30 7 25/12/1985 GLCF
Landsat7 169 52 ETM + 30 X 30 8 12/1/2011 GLCF
Toposheet 1:50,000 EMA
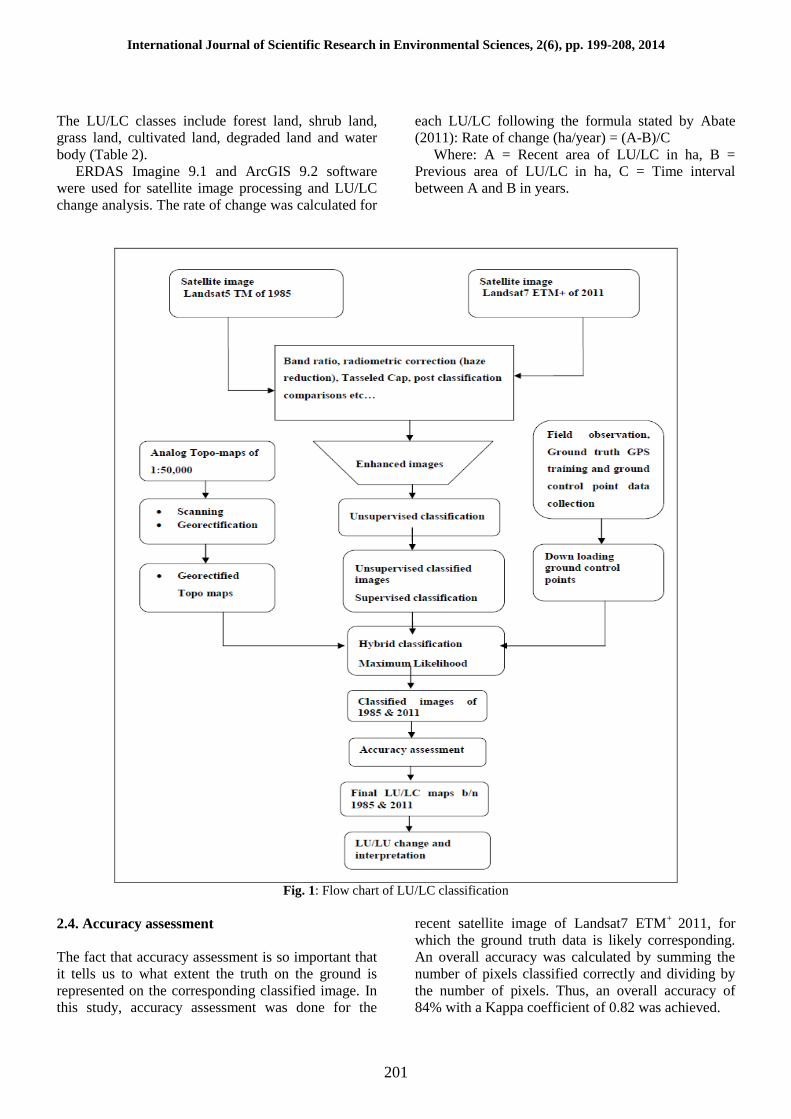
2.3. Image Classification Methods
The overall objective of image classification
procedures is to automatically categorize all pixels in
an image into LU/LC classes to extract useful
thematic information (Boakye et al., 2008). Multi–
spectral image classification is one of the most used
methods to extract thematic information from satellite
images (Sarma et al., 2008). Image preprocessing
including band ratio, radiometric correction (haze
reduction), Tasseled Cap and post classification
comparisons were performed to correct the surface
features reflectance characteristics. Then, the LU/LC
maps were produced from Landsat5 TM of 1985 and
Landsat7 ETM+ of 2011.
Image classification was undertaken using hybrid
classification method involving both unsupervised and
supervised techniques. The hybrid classification
method was chosen because it improves the accuracy
and efficiency of the classification which involves
feature identification through both spectral and spatial
pattern recognition (Lillesand and Kiefer, 2000).
Using signature editor of unsupervised classes,
supervised categorization of image pixels were made
on the basis of their pixel by pixel spectral reflectance
and spatial relationships of pixels with pixels
surrounding them through geo-linking techniques.
Among different classification algorithms, maximum
likelihood was used for supervised classification by
taking 60 training areas for six major LU/LC class
categories (10 training points for each LU/LC class).
International Journal of Scientific Research in Environmental Sciences, 2(6), pp. 199-208, 2014
201
The LU/LC classes include forest land, shrub land,
grass land, cultivated land, degraded land and water
body (Table 2).
ERDAS Imagine 9.1 and ArcGIS 9.2 software
were used for satellite image processing and LU/LC
change analysis. The rate of change was calculated for
each LU/LC following the formula stated by Abate
(2011): Rate of change (ha/year) = (A-B)/C
Where: A = Recent area of LU/LC in ha, B =
Previous area of LU/LC in ha, C = Time interval
between A and B in years.
Fig. 1: Flow chart of LU/LC classification
2.4. Accuracy assessment
The fact that accuracy assessment is so important that
it tells us to what extent the truth on the ground is
represented on the corresponding classified image. In
this study, accuracy assessment was done for the
recent satellite image of Landsat7 ETM+
2011, for
which the ground truth data is likely corresponding.
An overall accuracy was calculated by summing the
number of pixels classified correctly and dividing by
the number of pixels. Thus, an overall accuracy of
84% with a Kappa coefficient of 0.82 was achieved.

Gashaw et al.
Evaluations of Land Use/Land Cover Changes and Land Degradation in Dera District, Ethiopia: GIS and Remote
Sensing Based Analysis
202
Table 2: Description of Land use and land cover classes (Adopted from Abate, 2011) Land use/Land cover
classes
Description
Cultivated land Areas allotted to rain fed and irrigated cultivation, including fallow plots, cultivated land mixed
with some bushes, trees and the scattered rural settlements included within the cultivated fields.
Forest land Areas covered by trees forming closed or nearly closed canopies; Forest;
Plantation forest; Dense (50-80% crown cover).
Shrub land Land covered by small trees, bushes, and shrubs, in some cases mixed with grasses; less dense than
forests.
Grass land Areas of land where small grasses are the predominant natural vegetation usually used for grazing.
Water body Areas covered by manmade small dams, seasonal water bodies and permanent water bodies.
Degraded land Are parts of the land surface which is mainly covered by bare soil and exposed rocks.
2.5. Methods of vegetation stress detection
In order to recognize the vegetation trend which is an
indicator of both environmental stress and land cover
degradation, the TM imagery of 1985 and ETM+ of
2011 acquired on December and January respectively
were used to calculate Normalized Difference
Vegetation Index (NDVI). NDVI is an empirical
formula designed to separate green vegetation from
other surfaces based on the vegetation reflectance
properties of the area. NDVI value of the result will
be between -1 and 1. NDVI values greater than zero
indicate the presence of vegetation. The higher the
vegetation index value, the higher the probability that
the corresponding area on the ground has a dense
coverage of green vegetation. Negative values
indicating no vegetation and correspond to the
presence of water bodies (Kiage et al., 2007). The
final NDVI map of the study area were categorized
into four parts that is water bodies (NDVI value < 0),
highly stressed (0 < NDVI value ≤ 0.2), moderately
stressed (NDVI value 0.2 < NDVI value ≤ 0.4) and
low stressed areas (NDVI value > 0.4). Thus, it is
possible to know the vegetation trend of the area from
1985 and 2011. ERDAS Imagine 9.1 for calculating
NDVI values and ArcGIS 9.2 for NDVI mapping
were used.
By using the NDVI result of two different years
image (1985 and 2011) vegetation changes were
detected which is calculated as NDVI= (NIR-RED)/
(NIR+RED)
Where NIR is the near infrared band response for a
given pixel and RED is the red response
3. RESULTS AND DISCUSSIONS
3.1. Land use/Land cover change analysis
The result of this study showed that cultivated and
degraded land had increased at a rate of 38.29 ha/year
and 15.2 ha/year respectively in the last 26 years
(1985-2011). These changes were at the expense of
forest, shrub and grass land (Table 3). In addition,
farmers in the area are encroaching and cultivating
sloppy and marginal areas, which aggravate land
degradation. LU/LC changes are complex and
interrelated that is the expansion of one land use type
is at the expense of others (Belay, 2002; Abate, 2011).
In relation to this finding, recent watershed based land
use studies has showed that land use change is brutal
and there has been agricultural land size expansion at
the expense of natural vegetation cover lands and
marginal areas without any appropriate conservation
measures (Woldeamlak, 2002; Amsalu et al., 2006;
Gessesse and Kleman, 2007). Similarly, Gete and
Hurni (2001) have also documented the expansion of
cultivated land at the expense of forestland between
1957 and 1982 in Dembecha area, northwestern
Ethiopia.

International Journal of Scientific Research in Environmental Sciences, 2(6), pp. 199-208, 2014
203
Table 3: LU/LC changes of the study area between 1985 and 2011 LU/LC class 1985 2011 Change in ha
(1985-2011)
Rate of change in
ha/year (1985-2011)
Percentage change
(1985-2011)
Area (ha) % Area (ha) %
Water body 38.79 0.53 35.64 0.48 -3.15 -0.12 -8.12%
Forest 706.41 9.6 310.14 4.22 -396.27 -15.24 -56.09%
Shrub 1408.32 19.14 464.4 6.31 -943.92 -36.3 -67.07%
Grass 1243.98 16.91 1196.46 16.26 -47.52 -1.83 -3.81%
Cultivated 3859.74 52.47 4855.23 66 +995.49 +38.29 +25.79%
Degraded 99.36 1.35 494.73 6.72 +395.37 +15.2 +398%
Total area 7356.6 100 7356.6 99.99
Fig. 2: LU/LC map of the study area (1985 and 2011)
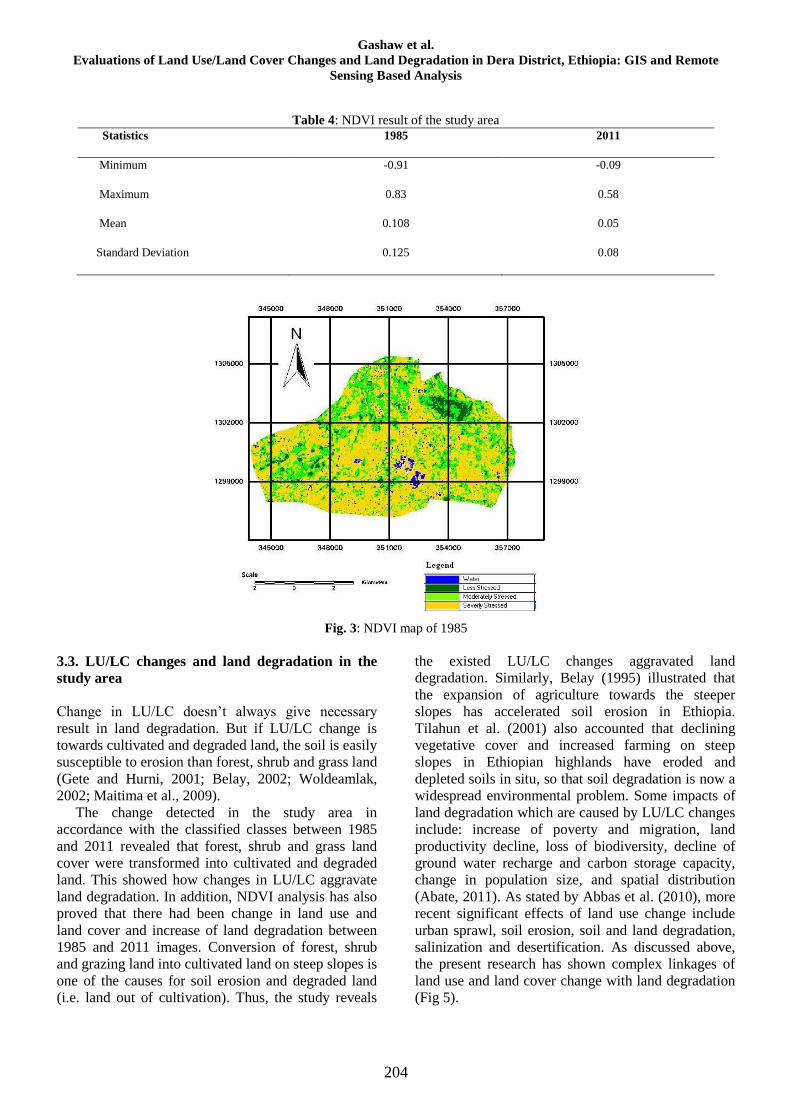
3.2. Land degradation assessment
The statistics and visual observation of the NDVI
images over the subsequent periods were an evidence
for land cover changes that may well indicate
increased deforestation and land degradation in the
study area. As it can be visually compared, the
amount of green vegetation is falling. Taking the
maximum value, it dramatically decreases from 0.83
in 1985 to 0.58 in 2011. To this effect, the standard
deviation value decreases in certain value in 2011
image as compared to 1985 because of the change in
vegetation cover (Table 4). Overall, there was an
increase in the size of the land cover class classified as
severely stressed area. Similar study conducted by
Kiage et al. (2007) the Lake Baringo catchment,
Kenya, East Africa and Brhane (2010) in Dendi
district case study, Ethiopia reported the decline of
total vegetation cover and the increase of land
degradation in the study periods. Similarly, a study by
Ochego (2003) in Aberdares (Kenya) is also in
agreement with the findings of this study, who stated
that a positive mean of stressed area in the
period1987-2000. NDVI differencing is an indication
of reduction in biomass within this period of study
which implies a decline in vegetation.
Gashaw et al.
Evaluations of Land Use/Land Cover Changes and Land Degradation in Dera District, Ethiopia: GIS and Remote
Sensing Based Analysis
204
Table 4: NDVI result of the study area
Statistics 1985 2011
Minimum -0.91 -0.09
Maximum 0.83 0.58
Mean 0.108 0.05
Standard Deviation 0.125 0.08
Fig. 3: NDVI map of 1985
3.3. LU/LC changes and land degradation in the
study area
Change in LU/LC doesn’t always give necessary
result in land degradation. But if LU/LC change is
towards cultivated and degraded land, the soil is easily
susceptible to erosion than forest, shrub and grass land
(Gete and Hurni, 2001; Belay, 2002; Woldeamlak,
2002; Maitima et al., 2009).
The change detected in the study area in
accordance with the classified classes between 1985
and 2011 revealed that forest, shrub and grass land
cover were transformed into cultivated and degraded
land. This showed how changes in LU/LC aggravate
land degradation. In addition, NDVI analysis has also
proved that there had been change in land use and
land cover and increase of land degradation between
1985 and 2011 images. Conversion of forest, shrub
and grazing land into cultivated land on steep slopes is
one of the causes for soil erosion and degraded land
(i.e. land out of cultivation). Thus, the study reveals
the existed LU/LC changes aggravated land
degradation. Similarly, Belay (1995) illustrated that
the expansion of agriculture towards the steeper
slopes has accelerated soil erosion in Ethiopia.
Tilahun et al. (2001) also accounted that declining
vegetative cover and increased farming on steep
slopes in Ethiopian highlands have eroded and
depleted soils in situ, so that soil degradation is now a
widespread environmental problem. Some impacts of
land degradation which are caused by LU/LC changes
include: increase of poverty and migration, land
productivity decline, loss of biodiversity, decline of
ground water recharge and carbon storage capacity,
change in population size, and spatial distribution
(Abate, 2011). As stated by Abbas et al. (2010), more
recent significant effects of land use change include
urban sprawl, soil erosion, soil and land degradation,
salinization and desertification. As discussed above,
the present research has shown complex linkages of
land use and land cover change with land degradation
(Fig 5).

International Journal of Scientific Research in Environmental Sciences, 2(6), pp. 199-208, 2014
205
Fig. 4: NDVI map of 2011
Fig. 5: Conceptual linkages of LU/LC changes and land degradation in the study area (Adapted from Maitima et al., 2009)
4. CONCLUSIONS
Evaluation of LU/LC changes and land degradation
using GIS and remote sensing applications in the
study area verified that forest, shrub and grazing land
were transformed into cultivated land. NDVI analysis
has also proved the increased of land degradation
between 1985 and 2011 images. These imply the
observed LU/LC changes are a cause for the observed
land degradation. Thus, creating off-farm job
opportunities, increasing family planning activities,
appropriate soil and water conservation measures,
appropriate use of soil fertility improving mechanisms
and also proper management of the land will reduce
the problem. Furthermore, the land use policy of the
country should be effectively implemented to reverse
the trend of LU/LC changes and land degradation and
at the same time to enhance the livelihood of farming
households.
REFERENCES
Abate S (2011). Evaluating the land use and land
cover dynamics in Borena Woreda of South
Wollo highlands, Ethiopia. Journal of
Sustainable Development in Africa, 13 (1): 87-
105.
Abbas I, Muazu M, Ukoje J (2010). Mapping land
use-land cover and change detection in Kafur
local government, Katsina, Nigeria (1995-2008)
using remote sensing and GIS. Research

Gashaw et al.
Evaluations of Land Use/Land Cover Changes and Land Degradation in Dera District, Ethiopia: GIS and Remote
Sensing Based Analysis
206
Journal of Environmental and Earth Sciences,
2(1): 6-12.
Amare B (2007). Landscape Transformation and
Opportunities for Sustainabable Land
Managewment Along the Escarpmemts of
Wello, Ethiopia. PhD Thesis, Bern University,
Bern.
Amare B, Hurni H, Gete Z (2011). Responses of rural
households to the impacts of population and
land-use changes along the Eastern Escarpment
of Wello, Ethiopia. Norwegian Journal of
Geography, 65:42-53.
Amsalu A, Leo S, Jan de G (2006). Long-term
dynamics in land resource use and the driving
forces in Beressa watershed, highlands of
Ethiopia. Journal of Environmental
management, 83: 13-32.
Berry L (2003). Land degradation in Ethiopia: its
impact and extent in Berry L, Olson J. and
Campbell D (ed): Assessing the extent, cost and
impact of land degradation at the national level:
findings and lessons learned from seven pilot
case studies. Commissioned by global
mechanism with support from the World Bank,
1-12.
Belay T (2002). Land-cover/land-use changes in the
Derekolli catchment of the South Welo Zone of
Amhara Region, Ethiopia. Michigan State
University Press, 18(1): 1-20.
Berhan G (2010). The role of Geo-information
technology for predicting and mapping of forest
cover spatio-temporal variability: Dendi district
case study, Ethiopia. Journal of Sustainable
Development in Africa, 12(6): 9-33.
Boakye E, Odai N, Adjei A, Annor O (2008). Landsat
images for assessment of the impact of land use
and land cover changes on the Barekese
Catchment in Ghana. European Journal of
Scientific Research, 22(2): 269-278.
Desta L, Menale K, Benin S, Pender J (2000). Land
degradation and strategies for sustainable
development in the Ethiopian high land,
Amhara region: socio-economic and policy
research working paper 32. International
Livestock Research Institute.
EPA (1997). Environmental Policy of Ethiopia.
Environmental Protection Authority in
collaboration with the Ministry of Economic
Development and cooperation. Environmental
Impact Assessment guidelines. The Federal
Environmental Protection Authority.
Gessesse D, Kleman J (2007). Pattern and Magnitude
of Deforestation in the South Central Rift
Valley Region of Ethiopia. Mountain Research
and Development, 27: 162-168.
Gete Z, Hurni H (2001). Implications of land use and
land cover dynamics for mountain resource
degradation in the Northwestern Ethiopian
Highlands. Mountain Research and
Development. 21 (2): 184-191.
Girma T (2001). Land degradation: A challenge to
Ethiopia. International Livestock Research
Institute, Addis Ababa, Ethiopia, 815-823.
Hurni H, Ludi E (2000). Reconciling Conservation
with Sustainable Development: a Participatory
Study inside and around the Simen Mountains
National Park, Ethiopia. With the assistance of
an interdisciplinary group of contributors,
University of Berne, Switzerland.
Hurni H, Solomon A, Amare B, Berhanu D, Ludi E,
Portner B, Birru Y, Gete Z (2010). Land
degradation and sustainable land management
in the highlands of Ethiopia. In: Hurni H,
Wiesmann U, editors; with an international
group of co-editors. Global change and
sustainable development: A synthesis of
regional experiences from research
partnerships. Georaphica Bernensia, 5: 187-
201.
Kiage L, Liu K, Walker N, Lam N, Huh O (2007).
Recent land-cover/use change associated with
land degradation in the Lake Baringo
catchment, Kenya, East Africa: evidence from
Landsat TM and ETM+. International Journal of
Remote Sensing, 28(19): 4285- 4309.
Lambin E, Geist H, Lepers E (2003). Dynamics of
land use and land cover change in tropical
regions. Annu. Rev. Environ. Resour., 28: 206-
232.
Lillesand T and Kiefer R (2000). Remote Sensing and
Image Interpretation. 4th ed. John Wiley and
Sons inc. New York.
Maitima J, Mugatha S, Reid R, Lyaruu H, Pomery D,
Gachimbi L, Mathai S, Mugisha S, Majule A
(2009). The linkages between land use change,
land degradation and biodiversity across East
Africa. International Livestock Research
Institute, 3(10): 310-325.
Munro R, Deckers J, Mitiku H, Grove A, Poesen J,
Nyssen J (2008). Soil landscapes, land cover
change and erosion features of the Central
Plateau region of Tigrai, Ethiopia: Photo-
monitoring with an interval of 30 years. Catena.
75: 55–64.
Messay M (2011). Land-use/land-cover dynamics in
Nonno district, Central Ethiopia. Journal of
Sustainable Development in Africa, 13(1): 123-
139.
Meyer W, Turner IIB (1992). Human Population
Growth and Global Land-Use/Cover Change.

International Journal of Scientific Research in Environmental Sciences, 2(6), pp. 199-208, 2014
207
Annual Review of Ecology and Systematics,
23: 39-57.
Ochego H (2003). Application of remote sensing in
deforestation monitoring: A case study of the
Aberdares (Kenya). 2nd FIG Regional
Conference. Marrakech, Morocco, December 2-
5, 2003.
Prakasam C (2010). Land use and land cover change
detection through remote sensing approach: A
case study of Kodaikanal taluk, Tamil nadu.
International journal of Geomatics and
Geosciences, 1(2): 150-158.
Sarma P, Lahkar B, Ghosh S, Rabha A, Das J, Nath
N, Dey S, Brahma N (2008). Land-use and
land-cover change and future implication
analysis in Manas National Park, India using
multi-temporal satellite data. Current science,
95(2): 1-5.
Tahir M, Imam E, Hussain T (2013). Evaluation of
land use/land cover changes in Mekelle City,
Ethiopia using Remote Sensing and GIS.
Computational Ecology and Software, 3(1): 9-
16.
Tilahun A, Takele B, Endrias G (2001). Reversing the
degradation of arable land in the Ethiopian
Highlands. Managing Africa’s Soils No. 23.
International center for research in agro
forestry.
Woldeamlak B (2002). Land cover dynamics since the
1950s in Chemoga Watershed, Blue Nile Basin,
Ethiopia. Mountain Research and Development,
22(3): 263-269.

Gashaw et al.
Evaluations of Land Use/Land Cover Changes and Land Degradation in Dera District, Ethiopia: GIS and Remote
Sensing Based Analysis
208
Temesgen Gashaw graduated his first degree from Jigjiga University, Ethiopia in Geography and
Environmental Studies (2009). Then, he employed his M.SC degree from Dilla University,
Ethiopia with specialization in Sustainable Natural Resource Management (2012). He completed
his first and second degree with Great Distinction. Currently, He is a lecture at Adigrat University,
Ethiopia in Natural Resource Management department since July 2012.
Amare Bantider (PhD) is Assistant Professor of Geography and Land Resource Management at
the Center for Food Security Studies, College of Development Studies, Addis Ababa University.
He obtained his first and second degrees from the Department of Geography and Environmental
Studies at Addis Ababa University (Ethiopia) in 1987 and 1996 respectively. He obtained his PhD
degree University of Bern, Switzerland in 2007. He was an Assistant Professor of Geography and
Land Resource Management at Dilla University, Ethiopia (2007-2013) and was Director for
Research and Community Service Directorate Office of Dilla University. He coordinated and
participated in several collaborative research projects such as Integrated River Basin Management
in Ethiopia, Doing Development with Young People, Soil and Water Conservation, and
Integrated Watershed Management. He published research articles on several reputable journals
and peer reviewed books.
Abraham Mahari received his first degree from Jimma University, Ethiopia in Natural Resource
Management in 2007. He later obtained his Master’s degree from Mekelle University with
specialization in Tropical Land Resources Management in 2011. Currently, he is working for
Adigrat University, Ethiopia as a lecturer under the department of Natural Resource Management
and has published numerous refereed articles in professional journals.