relationship between corporate governance...
TRANSCRIPT

CHAPTER – 6
RELATIONSHIP BETWEEN CORPORATE GOVERNANCE VARIABLES AND LISTING
PERFORMANCE OF INDIAN IPOs
IPO provides an opportunity to the issuing company to tap wider pool of public funds in
order to provide capital for its future growth. Its inherent nature of penetrating into public
pockets breaking the private arenas and the unique setting characterized by information
asymmetry has always grabbed attention of researchers and academicians. IPO pricing,
timing and performance have been three primary issues which have been dominant areas
of research in this field. Pricing of IPOs, however, remains the most contentious issue.
Two anomalies related to pricing issues are (1) high initial returns (or underpricing) and
(2) long run underperformance (Ching-Yi Lin, 2005). Where IPO underprcing reduces
the initial owners’ wealth, long run underperformance results in a wealth loss to all
shareholders.
Underpricing though used interchangeably with the initial returns, remains the common
terminology used in IPO literature (e.g., Ritter, 1998). Greater the extent of underpricing,
higher will be the initial returns. IPO underpricing, which refers to stock returns
experienced during the initial trading day in the secondary market, reduces the capital
received by an IPO firm through IPO process (Lin and Chuang, 2011) and is regarded as
a direct wealth transfer from founders and initial shareholders to new external investors
(Filatotchev and Bishop, 2002).
This performance indicator is unique to the IPO context and represents the difference
between investment banker's initial valuation of the firm and stock market's valuation of
firm at the end of first day of public trading and hence is referred to as money that initial
shareholders "leave on the table" (e.g., Tully, 1999). As noted by Certo, et al. (2001b),
underpricing captures both wealth creation for first-day investors and lost (unretained)
wealth for initial shareholders who sold their equity to the investment banker at a price
below its value in investor market at the end of first day of trading. Economic magnitude
of IPO underpricing is formidable and the phenomenon is globally pervasive.

Relationship Between Corporate Governance Variables and Listing Performance of Indian IPOs
151
Table 6.1: Equally Weighted Average Initial Returns for 50 Countries
Country Source Sample
Size Time
Period
Avg. initial
Return Argentina Eijgenhuijsen & van der Valk 20 1991-1994 4.40% Australia Lee, Taylor & Walter; Woo; Pham; Ritter 1,562 1976-2011 21.80% Austria Aussenegg; Ritter 102 1971-2010 6.30% Belgium Rogiers, Manigart & Ooghe; Manigart 114 1984-2006 13.50% DuMortier; Ritter Brazil Aggarwal, Leal & Hernandez; Saito; 275 1979-2011 33.10% Ushisima Bulgaria Nikolov 9 2004-2007 36.50% Canada Jog & Riding; Jog & Srivastava; 696 1971-2010 6.70% Kryzanowski, Lazrak & Rakita; Ritter Chile Aggarwal, Leal & Hernandez; 65 1982-2006 8.40% Celis & Maturana; Ritter China Chen, Choi, & Jiang; Jia & Zhang 2,102 1990-2010 137.40% Cyprus Gounopoulos, Nounis, and Stylianides; 73 1997-2011 20.30% Chandriotis Denmark Jakobsen & Sorensen; Ritter 164 1984-2011 7.40% Egypt Omran 53 1990-2000 8.40% Finland Keloharju 162 1971-2006 17.20% France Husson & Jacquillat; Leleux & Muzyka; 697 1983-2010 10.50% Paliard & Belletante; Derrien & Womack; Chahine; Ritter; Vismara Germany Ljungqvist; Rocholl: Ritter; Vismara 736 1978-2011 24.20% Greece Nounis, Kazantzis & Thomas; 373 1976-2011 50.80% Thomadakis, Gounopoulos & Nounis Hong Kong McGuinness; Zhao & Wu; Ljungqvist & 1,259 1980-2010 15.40% Yu; Fung, Gul, and Radhakrishnan; Ritter India Marisetty and Subrahmanyam; Ritter 2,964 1990-2011 88.50% Indonesia Suherman 410 1990-2012 25.70% Iran Bagherzadeh 279 1991-2004 22.40% Ireland Ritter 31 1999-2006 23.70%
Israel Kandel, Sarig & Wohl; Amihud & Hauser;
348 1990-2006 13.80%
Ritter Italy Arosio, Giudici & Paleari; 273 1985-2009 16.40% Cassia, Paleari & Redondi; Vismara Japan Fukuda; Dawson & Hiraki; Hebner & 3,136 1970-2011 40.20% Hiraki; Pettway & Kaneko; Hamao, Packer, & Ritter; Kaneko & Pettway Jordan Al-Ali and Braik 53 1999-2008 149.00% Korea Dhatt, Kim & Lim; Ihm; Choi & Heo; 1,593 1980-2010 61.60% Mosharian & Ng; Cho; Joh; Ritter
Relationship Between Corporate Governance Variables and Listing Performance of Indian IPOs
152
Country Source Sample
Size Time
Period
Avg. initial
Return Malaysia Isa; Isa & Yong; Yong; Ma 413 1980-2009 62.60% Mauritius Bundoo 40 1989-2005 15.20% Mexico Aggarwal, Leal & Hernandez; 88 1987-1994 15.90% Eijgenhuijsen & van der Valk Netherlands Wessels; Eijgenhuijsen & Buijs; 181 1982-2006 10.20% Jenkinson, Ljungqvist, & Wilhelm; Ritter New Zealand Vos & Cheung; Camp & Munro; Ritter 214 1979-2006 20.30% Nigeria Ikoku; Achua 114 1989-2006 12.70%
Norway Emilsen, Pedersen & Saettem; Liden; Ritter
153 1984-2006 9.60%
Philippines Sullivan & Unite; Ritter 123 1987-2006 21.20% Poland Jelic & Briston; Woloszyn 309 1991-2012 13.30% Portugal Almeida & Duque; Ritter 28 1992-2006 11.60% Russia Ritter 40 1999-2006 4.20% Saudi Arabia Al-Anazi, Forster, & Liu 76 2003-2010 264.50% Singapore Lee, Taylor & Walter; Dawson; Ritter 591 1973-2011 26.10% South Africa Page & Reyneke; Ali, Subrahmanyam & 285 1980-2007 18.00% Gleason; Ritter Spain Ansotegui & Fabregat; Alvarez Otera 128 1986-2006 10.90% Sri Lanka Samarakoon 105 1987-2008 33.50% Sweden Rydqvist; Schuster; de Ridder 374 1980-2011 27.20% Switzerland Kunz,Drobetz, Kammermann & Walchli; 159 1983-2008 28.00% Ritter Taiwan Chen 1,312 1980-2006 37.20% Thailand Wethyavivorn & Koo-smith; Lonkani & 459 1987-2007 36.60% Tirapat; Ekkayokkaya and Pengniti Turkey Kiymaz; Durukan; Ince; Kucukkocaoglu 355 1990-2011 10.30% United Kingdom
Dimson; Levis 4,877 1959-2011 16.10%
United States Ibbotson, Sindelar & Ritter; Ritter 12,340 1960-2012 16.80%
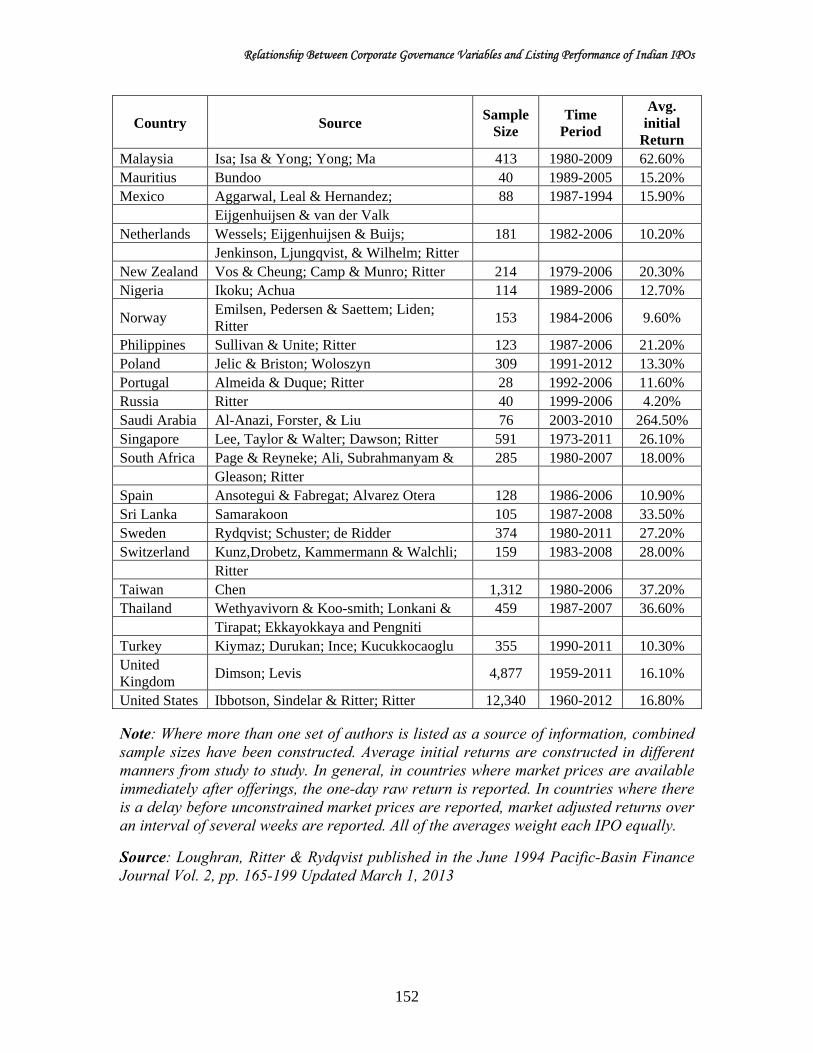
Note: Where more than one set of authors is listed as a source of information, combined sample sizes have been constructed. Average initial returns are constructed in different manners from study to study. In general, in countries where market prices are available immediately after offerings, the one-day raw return is reported. In countries where there is a delay before unconstrained market prices are reported, market adjusted returns over an interval of several weeks are reported. All of the averages weight each IPO equally.
Source: Loughran, Ritter & Rydqvist published in the June 1994 Pacific-Basin Finance Journal Vol. 2, pp. 165-199 Updated March 1, 2013

Relationship Between Corporate Governance Variables and Listing Performance of Indian IPOs
153
Ample evidence has been documented to highlight the existence and extent of
underpricing across different regions. Table 6.1 presents the prevalence of the
positive initial returns as available on the listing day across different countries. The
table elucidates and validates the existence of underpricing across all economies
differing only in extent. A large number of studies have addressed the underpricing
phenomenon and attempted to find explanations to this premium. Several theories
have emerged to explain these positive initial returns such as information asymmetry
(Baron, 1982), winners’ curse hypothesis (Rock, 1986), underwriters’ reputation
theory (Carter and Manaster, 1990) and signaling hypothesis (Allen and Faulhaber,
1989; Grinblatt and Hwang, 1989; Welch, 1989). Although many theories attempt to
unravel the mystery of IPO underpricing, no one convincing common explanation has
sprang up. However, most of the theories revolve around information asymmetry
between issuing firm and other participants in the IPO process. Asymmetric
information is higher for smaller and newer firms and inherent costs make it difficult
to resolve these problems and this increases agency costs which manifest as
underpricing.
6.1 CORPORATE GOVERNANCE AND UNDERPRICING
Due to information asymmetry problem, wherein issuers have better information about
their firm’s future performance than outside investors, the firms adopt varied mechanisms
to signal firm quality and communicate their true value to investors. Rather, at the heart
of signaling theory is information asymmetry (Spence, 1973). This is necessary in the
light of prevailing uncertainty in the minds of investors. Literature on underpricing, much
of which is based on signaling theory, addresses various signals employed by firms to
dispel the apprehensions of investing public. These include retained ownership (Leland
and Pyle, 1977 and Keasey and McGuiness, 1992), underpricing for seasoned issues
(Ibbotson, 1975; Allen and Faulhaber, 1989; Welch, 1989), prestigious underwriters
(Booth and Smith, 1986; Carter and Manaster, 1990; Michaely and Shaw, 1994) reputed
investment bankers (Carter et al., 1998; Paudyal, et al., 1998), auditor reputation (Titman
and Trueman, 1986) and prestige of venture capitalists (Megginson and Weiss, 1991; Da
Silva Rose et al., 2002).

Relationship Between Corporate Governance Variables and Listing Performance of Indian IPOs
154
Despite the extant literature on signaling in context of IPO underpricing, little attention
has been devoted to association between corporate governance attributes and IPO initial
performance particularly in the context of Asian economies (Yong, 2007). This has
emerged as an explanation to underpricing in the times of shift towards qualitative signals
in the backdrop of losing relevance of financial and quantitative information in
communicating credibility of new issue firms. Kim and Ritter (1999) suggested that the
relationship between financial information and equity values is particularly tenuous in the
IPO context. The disturbing regularity of corporate upheavals and financial irregularities
globally have stimulated the growing interest in corporate governance mechanisms. Also,
Yong (2007) shared the view that corporate governance is the new area of IPO research.
Thus corporate governance emerged as an important area and its relevance is constantly
increasing. It is widely accepted that good corporate governance systems are associated
with better corporate value, and is also a key element in corporate competitiveness and
access to capital (Jensen and Meckling, 1979; Shleifer and Vishny, 1997). Sanders and
Boivie (2004) suggest that corporate governance parameters can serve as useful screening
and sorting criteria that influence investors' valuations of the IPO firm when primary
information sources are limited or obscure. Researchers also believe that certain
governance related signals reduce investor anxiety and contribute in reducing extent of
underpricing. Governance attributes as a signaling device lie consistent with the two key
criteria for an effective signal: they are observable and known in advance (i.e. occur prior
to any transaction offer) and are costly for lower quality IPO firms to utilize due to
difficulty in imitation.
6.2 EMPIRICAL EVIDENCE ON UNDERPRICING AND GOVERNANCE
Investigation of corporate governance mechanisms as signals at the time of IPO, thus,
emerges as an important empirical issue in research. IPO provides a unique setting to
evaluate effects of governance as effective monitoring is all the more critical for firms
going public in the face of aggravated agency conflicts (Brennan and Franks, 1997). Very
limited initiatives in this direction have been documented though literature in Indian
context is almost non-existent. The investigation becomes important given the economic
and financial dimension of India and also because the influences of corporate governance

Relationship Between Corporate Governance Variables and Listing Performance of Indian IPOs
155
variables on underpricing are expected to be different in emerging markets owing to
different institutional environments.
Prior efforts in relation to corporate governance and underpricing have been largely
limited to developed economies and other typical areas but developing markets of India
lack this exploration. Few studies have recently attempted to investigate board of
directors and IPO underpricing (listing day performance) using data from the United
States (e.g., Certo et al., 2001; Howton et al., 2001). Evidence from emerging markets is
quite rare, among the few are Chen and Strange (2004), Lin and Chuang (2011), and
Yatim (2011), which use a sample of IPO firms in China, Taiwan and Malaysia,
respectively. The impact of governance measures on performance of IPOs in small
frontier markets of West Africa facing the challenge of adoption of international
governance best practices (Hearn 2011, Hearn 2012) has also been studied. In the light of
the economic significance of Indonesia being the largest economy in Southeast Asia,
Darmadi and Gunawan (2012) explored the influence of corporate governance
mechanisms on initial returns for this emerging market attracting foreign attention and
investments. Chen and Yang (2013) did not find a significant relationship between
underpricing and governance and ownership structure for ChiNext IPOs. On the same
lines, IPO investors on the Alternative Investment Market (London) were found not to
necessarily view the monitoring benefits of board structure and managerial ownership as
important signals of firm quality (Wu and Hsu, 2012). Clearly concentration of past
efforts has been in developed and established economies of US (Certo et al., 2001a; Certo
et al., 2001b; Howton et al., 2001; Dempere, 2007), UK (Filatotchev and Bishop, 2002;
Chahine et al., 2009), France (Chahine, 2004; Mnif, 2009). However, with the vibrancy
in growth of economies, research efforts have been redirected towards growing and
emerging markets of Australia (Ching Yi-Lin, 2005), China (Li, 2005; Li and Naughton,
2007), Indonesia (Darmadi and Gunawan, 2012); Malaysia (Yatim, 2011); Singapore
(Mitchelle et al., 2008) and now it should be India.
With regards to Indian markets, however, literature on information asymmetry problems
at the time of IPO and contribution of governance attributes in mitigating these and
resulting effect on initial pricing performance is rather scant. This issue, therefore, forms
the main focus of present effort.
Relationship Between Corporate Governance Variables and Listing Performance of Indian IPOs
156
6.3 SAMPLE AND METHODOLOGY
The primary objective of this chapter is to examine the relationship between corporate
governance measures (as measured through board structures and ownership variables)
and listing day performance of newly issued securities. Signaling power of these
attributes and how far are they incorporated and relied on in taking the investment
decisions is attempted to be studied.
Sample for this objective is the firms which issued new equity securities between the time
period April 1, 2001 and March 31, 2012 and got them listed on the Bombay Stock
Exchange (BSE). IPO prospectuses prepared and submitted for the purpose of issue is the
source of culling data on corporate governance systems of IPO firms. For information on
market prices of securities and SENSEX values the ACEEQUITY database and BSE
website (www.bseindia.com) were relied on. Additional information about firm attributes
and issue variables was collected using above sources as well as PROWESS and
Capitaline database.
To analyse the relationship between IPO’s initial returns and corporate governance
mechanisms multiple regression analysis has been employed. As a precursor to regression
analysis relationships between underpricing and governance variables have been explored
using ANOVA and t-tests to investigate if the board structures and ownership patterns
differ across return continuum. Variables of interest, i.e., the governance variables for
analysis have been categorized into those relating to board structures and others
indicating ownership patterns. Other than these, firm specific and issue specific variables
have also been included in study to control for their effects on returns. Listing day returns
have been measured as raw returns (unadjusted) and market returns (those adjusted for
market movements with SENSEX as the barometer). The description of variables as
operationalized in the study is provided in Table 6.2.
With the specified objectives and outlined data and sample the chapter proceeds first to
examine and establish the underpricing phenomenon in India, examine the degree and
direction of governance variables to the listing day returns and then checking for
dependency of returns on these attributes.

Relationship Between Corporate Governance Variables and Listing Performance of Indian IPOs
157
Table 6.2: Operationalization of Research Variables for Study of Corporate Governance and Returns
Variables Operationalization Dependent Variable
Underpricing on listing day
1. Raw return- Closing price on the first trading day on the secondary market minus offer price, divided by offer price
2. MAER- Raw return minus the market return as measured by the BSE’s sensitive index
Independent Variables (Board related)Board size Total number of directors on the board
Board committees Inverse of total number of board committees to assist the board
Board independence Percentage of independent directors on the board Women directors Percentage of women directors on the board Age of board Average of the individual age of all board members
Related board members Number of members on the board who are related to each other
Board reputation The total number of board directorships held by non-executive directors at other firms
Independent Variables (Ownership related)
Promoter ownership Percentage of shares held by board of promoters (founders) at the time of issue
Promoter ownership squared
Square term of the percentage of shares held by board of promoters (founders) at the time of issue
Block holder ownership Number of shareholders holding shares more than 10% of total shares to denote concentrated ownership
Top 10 shareholding Percentage of shares owned by the 10 largest shareholders of a firm
Top 10 shareholding squared
Square term of percentage of shares owned by the 10 largest shareholders of a firm
Control Variables (Issue and firm related)
Subscription ratio Number of times the IPO has been subscribed: indicator of over or under subscription
Issue size Logarithm transformation of proceeds received from issuing new shares (in crores)
Listing delay Number of days between close of issue and listing on BSE Issue price The offer price of shares issued through IPO
IPO age Logarithm transformation of number of years between date of incorporation and IPO issue date
Total assets Logarithm transformation of book value of total assets as expressed in crores of rupees
Relationship Between Corporate Governance Variables and Listing Performance of Indian IPOs
158
6.4 PRESENCE AND EXTENT OF UNDERPRICING IN INDIAN IPOs
It has been adequately documented that underpricing is a pervasive phenomenon
implying that the investors buying new issue securities on offer date have pocketed high
returns on the first trading day suggesting that the securities had been undervalued. Prices
fixed for the shares by the issuers and managers to the issue was lower than the
valuations provided by the market on listing day and this phenomenon is regarded in IPO
context as ‘underpricing’.
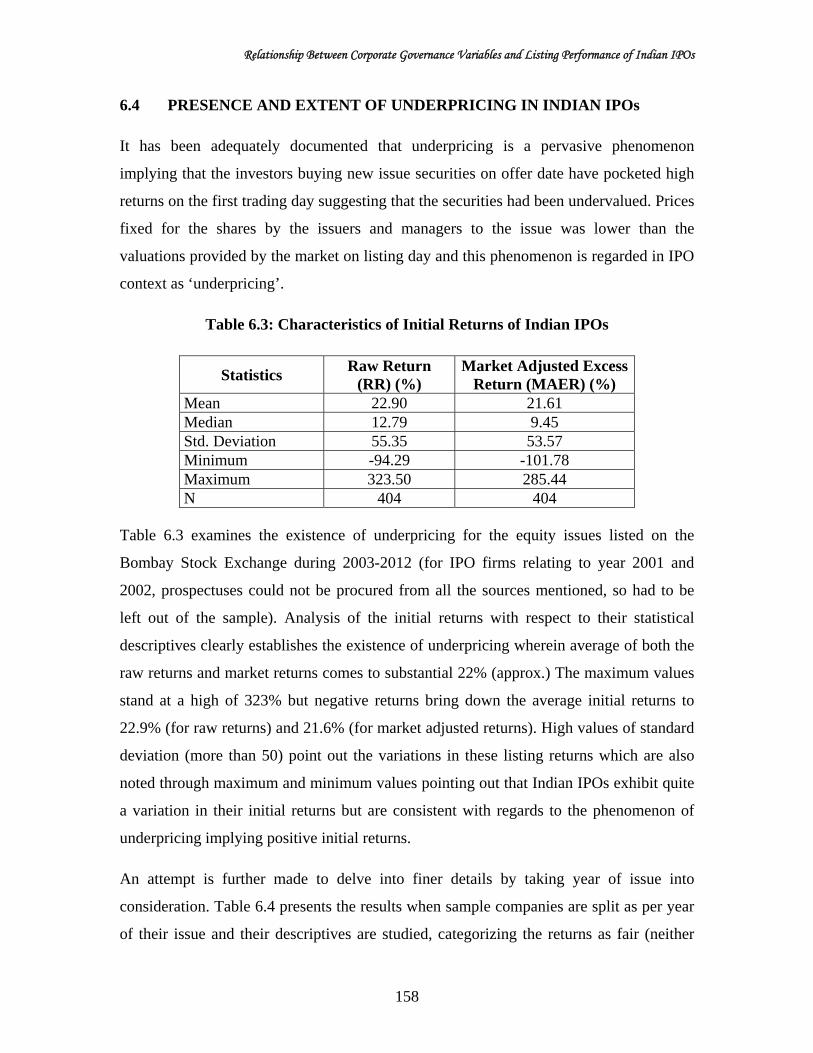
Table 6.3: Characteristics of Initial Returns of Indian IPOs
Statistics Raw Return
(RR) (%) Market Adjusted Excess
Return (MAER) (%) Mean 22.90 21.61 Median 12.79 9.45 Std. Deviation 55.35 53.57 Minimum -94.29 -101.78 Maximum 323.50 285.44 N 404 404
Table 6.3 examines the existence of underpricing for the equity issues listed on the
Bombay Stock Exchange during 2003-2012 (for IPO firms relating to year 2001 and
2002, prospectuses could not be procured from all the sources mentioned, so had to be
left out of the sample). Analysis of the initial returns with respect to their statistical
descriptives clearly establishes the existence of underpricing wherein average of both the
raw returns and market returns comes to substantial 22% (approx.) The maximum values
stand at a high of 323% but negative returns bring down the average initial returns to
22.9% (for raw returns) and 21.6% (for market adjusted returns). High values of standard
deviation (more than 50) point out the variations in these listing returns which are also
noted through maximum and minimum values pointing out that Indian IPOs exhibit quite
a variation in their initial returns but are consistent with regards to the phenomenon of
underpricing implying positive initial returns.
An attempt is further made to delve into finer details by taking year of issue into
consideration. Table 6.4 presents the results when sample companies are split as per year
of their issue and their descriptives are studied, categorizing the returns as fair (neither

Relationship Between Corporate Governance Variables and Listing Performance of Indian IPOs
159
underpriced nor overpriced, no returns), positive (underpriced issues) and negative
(overpriced issues). Of the total IPO companies 263 across all years are underpriced
giving positive returns to investors on the listing day while 141 of the 404 IPOs result in
negative returns.
Table 6.4: Summary Statistics of Year-wise IPO Raw Returns
Year N Mean Median SD Min Max Positive Fair Negative 2003 4 73.34 61.07 58.44 22.90 148.33 4 0 0 2004 20 48.75 37.17 69.71 -89.11 209.71 17 0 3 2005 55 46.07 31.53 63.38 -14.81 323.50 48 0 7 2006 65 27.41 15.80 44.10 -30.12 230.26 47 0 18 2007 98 34.21 15.67 59.92 -42.17 286.25 63 0 35 2008 37 -16.83 -6.64 45.13 -94.29 68.11 14 0 23 2009 20 4.37 1.35 35.99 -58.72 129.25 12 0 8 2010 63 10.89 6.00 35.08 -88.64 103.98 38 0 25 2011 37 3.51 -11.07 55.55 -69.83 153.50 17 0 20 2012 5 6.56 2.80 12.82 -5.00 25.68 3 0 2
The initial unadjusted returns of these IPOs are found to be positive on an average for all
years of sample except for the year 2008 wherein these returns are recorded at -16.83
percent which coincide with the global downturn which did not leave even the Indian
capital market unaffected. Another distinct pattern which emerges is the decreasing initial
returns over time which can be conjectured to the legislative initiatives aiming at
normalizing returns to ensure efficient market mechanisms. Mean returns from these
IPOs as on the listing day show a diluting effect which is elucidated by the decreasing
values (48.75 in 2004 to 10.89 in 2010). The tendency, however, of positive returns of
individual IPOs remains strong to which the very high maximum values stand evidence,
which are way above 100 percent for almost all years. None of the IPOs in any of the
years delivers fair returns or is fairly priced when their offer price and listing day prices
are compared.
Similarly, these returns when adjusted against the returns of the market (i.e. against the
SENSEX values) to calculate MAER also show almost similar results. When checking
for number of positive and negative MAER IPOs, again 263 are underpriced while the
number of overpriced IPOs stands at 141 confirming the existence of a trend of positive

Relationship Between Corporate Governance Variables and Listing Performance of Indian IPOs
160
returns to the investors of IPO (underpricing). Table 6.5 presents a year wise description
of MAER of sample IPO firms which establishes existence of underpricing in Indian
markets. Positive returns accruing to initial investors though are decreasing over time
being negative and minimum in 2008-09 which coincides with the financial hiccups
world over as a fall out of global crisis.
Table 6.5: Summary Statistics of Year-wise IPO Initial Market Adjusted Excess Returns
Year N Mean Median SD Min Max Positive Fair Negative 2003 4 65.40 52.31 54.47 21.61 135.36 4 0 0 2004 20 45.63 30.32 72.15 -101.78 203.38 17 0 3 2005 55 41.55 27.73 59.38 -12.81 277.40 48 0 7 2006 65 23.06 9.70 43.57 -30.32 230.89 47 0 18 2007 98 33.76 15.22 58.00 -28.69 285.44 63 0 35 2008 37 -11.27 -1.03 45.89 -101.55 84.87 14 0 23 2009 20 1.79 -1.25 37.70 -65.66 134.57 12 0 8 2010 63 10.16 4.11 34.84 -85.69 98.19 38 0 25 2011 37 4.48 -6.19 54.81 -75.06 144.52 17 0 20 2012 5 7.75 4.27 13.74 -4.42 29.22 3 0 2
The median values for MAER also show decreasing values indicating a trend of
mitigation of underpricing which is being attempted through tighter norms and stringent
rules for IPO pricing and allied mechanisms. Minimum values here do point out existence
of overpricing but it remains low both in number and quantum as positive returns
dominate as indicated by mean values. High values of standard deviations depict huge
variations with returns varying significantly across mean values but consistency with
regards to positive returns is certain.
Although quantum of underpricing in Indian markets is reclining but it is far from being
non-existent and thus remains a prolific research area. Fairly priced IPOs are a distant
dream (no IPOs in this category) retaining contentiousness of IPO pricing. Thus, research
in this area is continuous with all studies forwarding different explanations to this
pervasive underpricing phenomenon. Initial testing of initial returns of IPO in India
confirm the existence of a phenomena where securities are undervalued before issue and
market valuations as confirmed on listing are higher than these, resulting in high returns

Relationship Between Corporate Governance Variables and Listing Performance of Indian IPOs
161
for first day investors. Underpricing, as found to exist, is investigated henceforth for
meaningful explanations drawn primarily from corporate governance.
6.5 COMPARISON OF IPO FIRMS WITH POSITIVE AND NEGATIVE
INITIAL RETURNS
Indian IPOs have been found to be generating positive returns for initial investors as
established from the listing day returns. This implies that on an average the IPO
valuations of securities are found to be lower than the valuations of securities by the
markets on listing in stock exchange which helps the investors of IPO to pocket positive
returns. Listing day returns of the IPOs though on an average have been positive but
negative returns also exist. To get deeper insights into behavior of initial returns, they are
segregated as positive returns (underpriced IPOs) and as IPOs with negative returns to
find out if these two types of firms vary with respect to governance characteristics and
firm variables. Do these two categories of firms differ from each other on the basis of
variables of interest when measured using raw returns and market adjusted returns is
attempted to be investigated in this section.
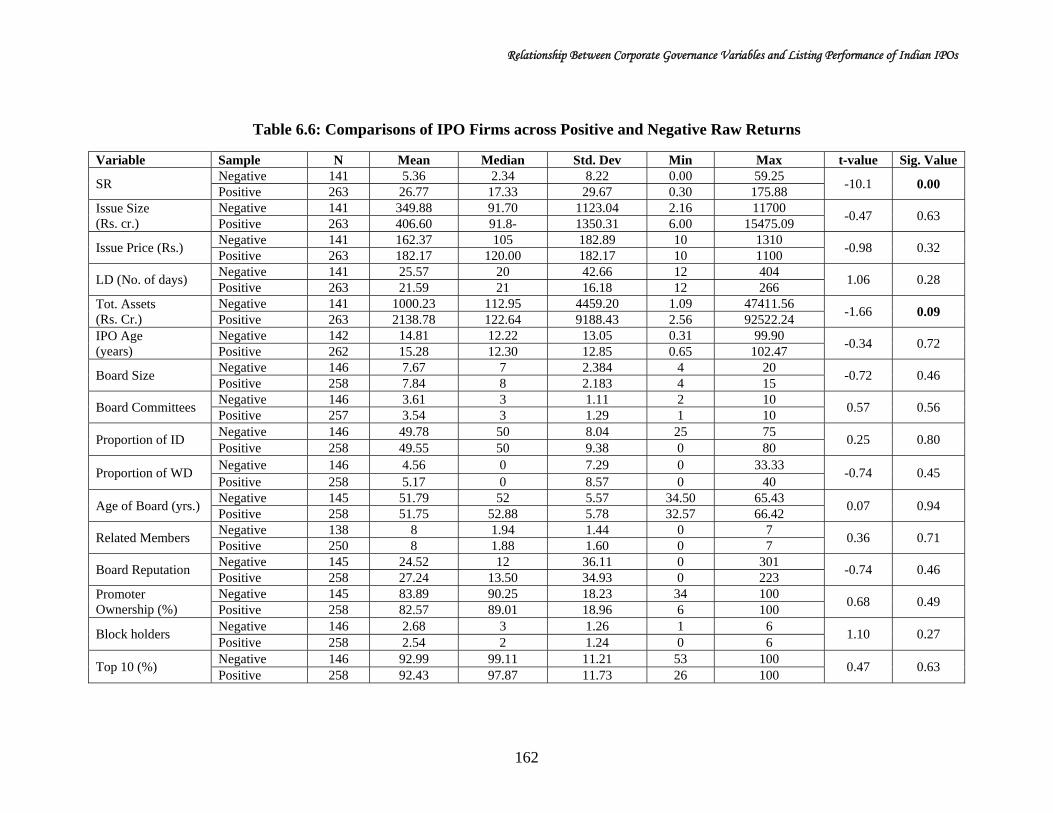
Table 6.6 presents details of both types of firms on governance parameters as well as
other control variables differentiated on the basis of raw returns i.e. unadjusted listing day
prices. Each of the variables included for analysis is explored for underpriced and
overpriced IPOs to see if there lies a significant difference among these firms in relation
to each of the parameters. Firm variables included in study are subscription ratio, issue
size, issue price, listing delay, total assets and age of IPO firm due to their inherent
potential to influence the returns. It is therefore attempted to check if, on account of these
variables the firms generating positive and negative returns vary or are similar.
The subscription ratio, indicating number of times the issue has been subscribed
(oversubscribed), shows significantly different values for firms with positive returns and
those generating negative first day returns. IPOs which are overpriced have mean
subscription ratio of 5.36 in contrast to 26.71 times for underpriced IPOs. A striking
difference is also observed for maximum values of these two classes on account of
subscription ratio which stands at an astoundingly high ratio of 175 for positive returns
Relationship Between Corporate Governance Variables and Listing Performance of Indian IPOs
162
Table 6.6: Comparisons of IPO Firms across Positive and Negative Raw Returns
Variable Sample N Mean Median Std. Dev Min Max t-value Sig. Value
SR Negative 141 5.36 2.34 8.22 0.00 59.25
-10.1 0.00 Positive 263 26.77 17.33 29.67 0.30 175.88
Issue Size (Rs. cr.)
Negative 141 349.88 91.70 1123.04 2.16 11700 -0.47 0.63
Positive 263 406.60 91.8- 1350.31 6.00 15475.09
Issue Price (Rs.) Negative 141 162.37 105 182.89 10 1310
-0.98 0.32 Positive 263 182.17 120.00 182.17 10 1100
LD (No. of days) Negative 141 25.57 20 42.66 12 404
1.06 0.28 Positive 263 21.59 21 16.18 12 266
Tot. Assets (Rs. Cr.)
Negative 141 1000.23 112.95 4459.20 1.09 47411.56 -1.66 0.09
Positive 263 2138.78 122.64 9188.43 2.56 92522.24 IPO Age (years)
Negative 142 14.81 12.22 13.05 0.31 99.90 -0.34 0.72
Positive 262 15.28 12.30 12.85 0.65 102.47
Board Size Negative 146 7.67 7 2.384 4 20
-0.72 0.46 Positive 258 7.84 8 2.183 4 15
Board Committees Negative 146 3.61 3 1.11 2 10
0.57 0.56 Positive 257 3.54 3 1.29 1 10
Proportion of ID Negative 146 49.78 50 8.04 25 75
0.25 0.80 Positive 258 49.55 50 9.38 0 80
Proportion of WD Negative 146 4.56 0 7.29 0 33.33
-0.74 0.45 Positive 258 5.17 0 8.57 0 40
Age of Board (yrs.) Negative 145 51.79 52 5.57 34.50 65.43
0.07 0.94 Positive 258 51.75 52.88 5.78 32.57 66.42
Related Members Negative 138 8 1.94 1.44 0 7
0.36 0.71 Positive 250 8 1.88 1.60 0 7
Board Reputation Negative 145 24.52 12 36.11 0 301
-0.74 0.46 Positive 258 27.24 13.50 34.93 0 223
Promoter Ownership (%)
Negative 145 83.89 90.25 18.23 34 100 0.68 0.49
Positive 258 82.57 89.01 18.96 6 100
Block holders Negative 146 2.68 3 1.26 1 6
1.10 0.27 Positive 258 2.54 2 1.24 0 6
Top 10 (%) Negative 146 92.99 99.11 11.21 53 100
0.47 0.63 Positive 258 92.43 97.87 11.73 26 100

Relationship Between Corporate Governance Variables and Listing Performance of Indian IPOs
163
IPOs. Higher subscription ratio is indicative of higher demand which then is translated
into better performance. Thus, on account of number of times IPO is subscribed the two
categories of firms significantly differ making this characteristic an important
distinguishing feature. Firms with positive returns have been found to have a higher
subscription ratio on an average than those with negative returns.
For issue size, which represents the total value of shares offered through the IPO, the
mean values are found to be higher for firms generating positive returns but the
differences are not statistically significant. Though median values and maximum
values along with other descriptives show a difference but they fail the test of
statistical significance giving inference that issue size and issue price of securities of
issuing firms are not a basis of distinction between firms with positive and negative
returns. Time gap between the close of issue and listing of securities on BSE, called
as listing delay, is 22 days on an average for positive returns firms while it stands as
26 days for firms with negative returns. Minimum value though stands at 12 for both
categories but the maximum is found as high as 404 days for overpriced IPOs.
However, these differences again are not statistically significant. IPO age also
displays the same behavior but the differences lack statistical validity. Total assets
value of IPO firms at the time of IPO is also studied for both these types of firms and
these are found to be significantly higher for firms with positive returns (at 10% level
of significance) standing at a mean value of 2139 crores. Huge differences are also
observed in maximum values which are almost double the value of assets of
overpriced IPOs for firms with positive returns. It can be deduced that total asset base
of underpriced firms are significantly higher than other firms as computed at the time
of IPO.
On account of governance attributes, the return typology is found to hold no
significance as the little differences found lack statistical significance. Ratio of
independent directors, board committees, age of board members assume almost equal
mean values across all firms and do not bring out any significant differences among
firms with positive and negative returns. Firms with more reputed directors, larger

Relationship Between Corporate Governance Variables and Listing Performance of Indian IPOs
164
board size, and more women as directors on board leave more money on the table, i.e.
are underpriced but this hypothesis lacks statistical significance as seen from the
insignificant values for these variables in Table 6.6. With regards to ownership
variables also, the results do not conform to test of statistical validity though lower
percentage of promoter ownership, lower number of block holders and lower
percentage of shares retained by top 10 owners is seen for firms generating positive
returns to IPO investors but statistical insignificance again remains an issue.
Differences are noted for sample firms on these governance variables but they are not
found to be significant enough to qualify as differentiating criteria between firms
ensuring positive returns and negative returns for the investors. On the whole
differences in means for the categorized firms exist only on account of subscription
ratio, total assets and not on account of corporate governance measures.
Similar exploration is done for MAER wherein, again firms are classified as those with
positive returns and others which deliver negative returns to investors as measured on
the listing day. Results for the analysis have been presented in Table 6.7 which
includes all firm variables, issue variables and the governance proxies considered in
the study.
With regards to subscription ratio the results are on the same lines as in case of raw
returns as discussed above making it an important and significant point of distinction
between the two categories of firms. All other firm variables and those relating to IPO
fail to bring about a statistically significant difference among underpriced and
overpriced IPOs though variation in mean values is noted. Except for listing delay and
issue size firms with negative returns have mean values lower for variables including
subscription ration, issue price, total assets and IPO age than the underpriced firms
highlighting the strong credentials which enable firms to sustain the costs associated
with underpricing of issue. The insignificant values for these variables, however, show
that the firms are almost similar on these accounts and do not present discernible
differences.

Relationship Between Corporate Governance Variables and Listing Performance of Indian IPOs
165
Table 6.7: Comparisons of IPO Firms across Positive and Negative MAERs
Variable Sample N Mean Median Std. Dev Min Max t-value Sig. Value
SR Negative 147 5.95 2.35 8.71 0.00 59.25
-8.19 0.00 Positive 257 26.85 17.25 30.20 0.30 175.88
Issue Size (Rs. cr.)
Negative 147 389.91 91.70 1209.21 2.16 11700 0.02 0.98
Positive 257 387.69 91.90 1324.86 6.00 15475.09
Issue Price (Rs.) Negative 147 163.07 106.50 181.55 10 1310
-1.09 0.27 Positive 257 184.72 120 188.61 10 1032
LD (No. of days) Negative 146 25.46 20 42.08 12 404
1.05 0.29 Positive 258 21.60 21 16.33 12 266
Tot. Assets (Rs. Cr.)
Negative 148 1167.31 108.62 5908.83 1.09 61500.78 -1.23 0.21
Positive 256 2078.80 122.64 8812.21 2.56 92522.24 IPO Age (years)
Negative 148 14.15 12.22 10.97 0.31 70.45 -1.02 0.30
Positive 256 15.51 12.30 13.84 0.65 102.47
Board Size Negative 147 7.63 7 2.38 4 20
-1.00 0.31 Positive 252 7.86 8 2.18 4 16
Board Committees Negative 147 3.56 3 1.08 2 10
-0.00 0.99 Positive 251 3.57 3 1.31 1 10
Proportion of ID Negative 147 49.27 50 7.85 25 75
-0.72 0.47 Positive 252 49.93 50 9.49 0 80
Proportion of WD Negative 147 5.09 0 7.71 0 33.33
0.14 0.88 Positive 252 4.97 0 8.42 0 40
Age of Board (yrs.) Negative 147 51.76 52.38 5.79 34.50 65.43
-0.08 0.93 Positive 251 51.81 52.71 5.65 32.57 66.42
Related Members Negative 142 2.01 2 1.46 0 7
1.16 0.24 Positive 241 1.82 2 1.57 0 6
Board Reputation Negative 146 25.83 13 39.29 0 301
-0.17 0.85 Positive 252 26.48 12 33.21 0 182
Promoter Ownership (%)
Negative 146 85.47 92.38 17.39 34 100 1.91 0.05
Positive 252 81.80 87.15 19.11 6 100
Block holders Negative 147 2.67 3 1.25 1 6
0.91 0.36 Positive 252 2.56 2 1.25 0 6
Top 10 (%) Negative 147 94.03 99.42 10.43 59 100
1.66 0.09 Positive 252 92.07 97.47 11.86 26 100

Relationship Between Corporate Governance Variables and Listing Performance of Indian IPOs
166
Moving on to the governance factors, as in case of raw returns, mean values for board
committees, percentage of independent directors, age of board and number of block
holders display no differences among the two types of firms. Women directors on an
average show a higher value for firms with negative MAER, a result which lies in
contradiction to those seen for raw returns but this higher value does not stand the test of
statistical significance and so no concrete conclusions can be drawn. Same are the results
for number of board committees constituted in the IPO firm to help board members
discharge their responsibilities and number of shareholders holding more than 10% of
total shares (block holders). Number of members on board and other directorships of
these members expressed as board reputation are found to be higher in case of
underpriced IPO firms highlighting that larger and reputed boards are afforded by these
firms which generate positive returns for IPO investors. Ownership variables as
represented by promoter ownership and ownership in the hands of top 10 shareholders
show significant results implying that differences exist among underpriced and
overpriced issues on account of these two components. Promoter holding in these
underpriced issues is lower than the other firms reflecting the fact that there is more
dilution of control by such firms and hence their ability to stand the control and cost
issues. Ownership concentration levels for such firms are also low indicating a trend of
dispersed ownership taken positively by the markets as reflected from the positive returns
on the listing day. Other than these ownership parameters, none of the governance
attributes are found to have significant values when comparing the mean values of firms.
On the whole, when comparing firms with positive and negative returns the mean
differences are found to be significant only for subscription ratio and total assets (in case
of raw returns) getting to the conclusion that firms do differ on account of this ratio. For
corporate governance variables, the differences on various parameters are not found to be
significant except for promoter and block holder ownership. The differences among
underpriced and overpriced firms on account of governance mechanisms are not found to
be significant which means that these mechanisms do not bring about significant changes
in returns. Underpriced firms are not found to be governance wise different from those
with negative returns and the reasons for differences in returns lie in factors other than
these. Corporate governance preparedness of IPO firms is not solely responsible for

Relationship Between Corporate Governance Variables and Listing Performance of Indian IPOs
167
concrete and substantial differences in these firms when compared for means on the basis
of listing day returns. Taking the study of IPO returns further, the need for which is
highlighted from results above, governance attributes considered in the study are
individually studied against the positive and negative returns for further insight.
6.6 ANALYSIS OF GOVERNANCE VARIABLES ACROSS LISTING RETURNS
The present section attempts to find explanations to the underpricing phenomenon
using corporate governance attributes measured through board structures and ownership
variables. Within this broader objective it also becomes pertinent to analyze the
behavior and response of listing day prices to these governance attributes. The returns
on listing day are measured through two variables: the raw returns or unadjusted returns
which are measured as a difference between listing price and offer price and dividing
by offer price. As a variant, these returns are adjusted for market movements as
represented by SENSEX values on these two dates to be regarded as MAER- the
market adjusted excess returns.
For this section, raw returns and market adjusted returns on the listing day are segregated
as positive and negative returns and how they respond to each of the governance
attributes is studied. Positive returns imply the IPOs being underpriced while overpriced
IPOs result in negative returns. Each of the governance variables included in the study
have been studied for their association with positive and negative returns and overall
returns.
6.6.1 Board Size and Initial Returns
Board size, indicating the total number of directors on board of company is a very
important board characteristic. The researchers have not been able to reach a consensus
with regards to most appropriate board size. There is, for example, some evidence that
smaller boards are more beneficial (e.g., Yermack, 1996). While, there is also support for
larger boards being more effective (Alexander et al., 1993).
To understand the relationship between board size and returns, board size is categorized
into four classes: up to 5 denoting smaller boards; 6-8 medium sized boards where 8 was
Relationship Between Corporate Governance Variables and Listing Performance of Indian IPOs
168
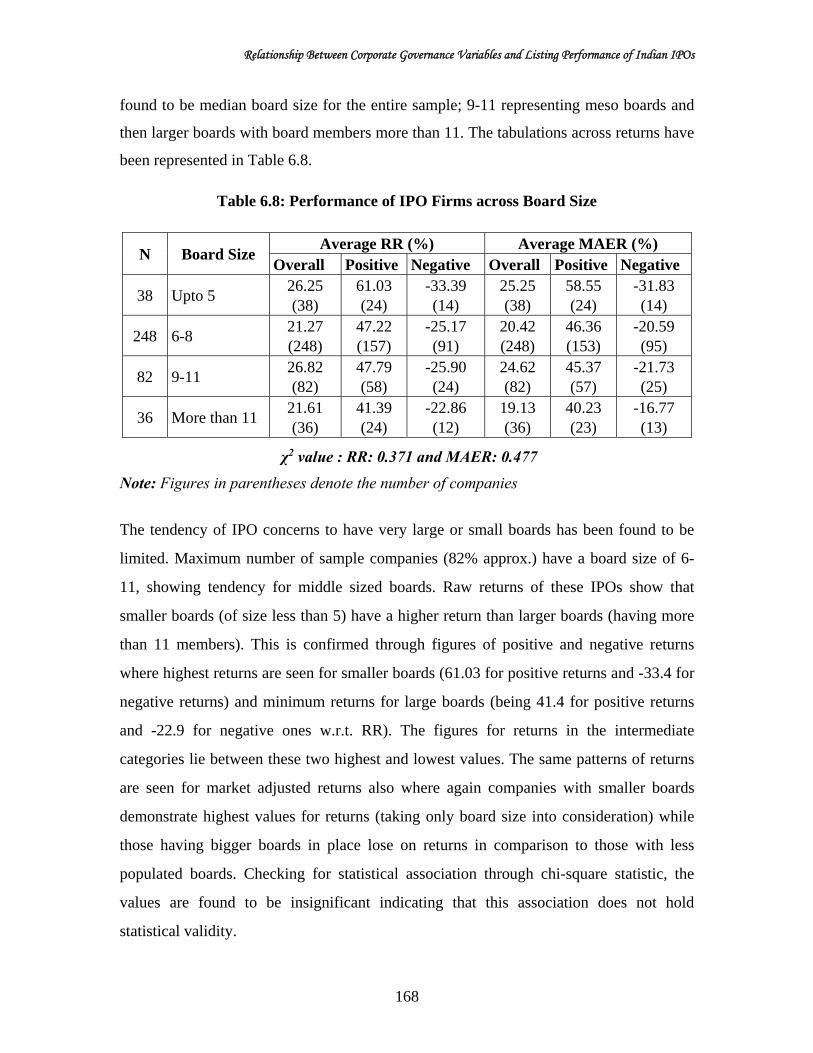
found to be median board size for the entire sample; 9-11 representing meso boards and
then larger boards with board members more than 11. The tabulations across returns have
been represented in Table 6.8.
Table 6.8: Performance of IPO Firms across Board Size
N Board Size Average RR (%) Average MAER (%)
Overall Positive Negative Overall Positive Negative
38 Upto 5 26.25 (38)
61.03 (24)
-33.39 (14)
25.25 (38)
58.55 (24)
-31.83 (14)
248 6-8 21.27 (248)
47.22 (157)
-25.17 (91)
20.42 (248)
46.36 (153)
-20.59 (95)
82 9-11 26.82 (82)
47.79 (58)
-25.90 (24)
24.62 (82)
45.37 (57)
-21.73 (25)
36 More than 11 21.61 (36)
41.39 (24)
-22.86 (12)
19.13 (36)
40.23 (23)
-16.77 (13)
χ2 value : RR: 0.371 and MAER: 0.477
Note: Figures in parentheses denote the number of companies
The tendency of IPO concerns to have very large or small boards has been found to be
limited. Maximum number of sample companies (82% approx.) have a board size of 6-
11, showing tendency for middle sized boards. Raw returns of these IPOs show that
smaller boards (of size less than 5) have a higher return than larger boards (having more
than 11 members). This is confirmed through figures of positive and negative returns
where highest returns are seen for smaller boards (61.03 for positive returns and -33.4 for
negative returns) and minimum returns for large boards (being 41.4 for positive returns
and -22.9 for negative ones w.r.t. RR). The figures for returns in the intermediate
categories lie between these two highest and lowest values. The same patterns of returns
are seen for market adjusted returns also where again companies with smaller boards
demonstrate highest values for returns (taking only board size into consideration) while
those having bigger boards in place lose on returns in comparison to those with less
populated boards. Checking for statistical association through chi-square statistic, the
values are found to be insignificant indicating that this association does not hold
statistical validity.

Relationship Between Corporate Governance Variables and Listing Performance of Indian IPOs
169
Clearly then, listing returns do support the hypothesis of smaller boards (but when seen in
isolation) advocating ease in reaching consensus and less conflicts which generally
emanate from divergent views. The tendency of the companies for middle sized boards
may emerge from the inherent complexities in decision making and necessity of diverse
viewpoints.
6.6.2 Board Committees and Initial Returns
Board committees are included as a part of board structures and are meant to enable
board members perform their fiduciary duties more efficiently and effectively.
Committees are constituted with directors as members and chairpersons for facilitating
and ensuring corporate accountability and enhancing credibility of board structures.
Recognizing their eminence, board committees have been necessitated by law. Clause 49
of the listing agreement in India recommends constitution of mandatory committees
(Audit Committee and Shareholder/ Investors Grievance Committee) and non-mandatory
committee (Remuneration Committee).
Table 6.9: Performance of IPO Firms across Board Committees
N Number of
Board Committees
Average RR (%) Average MAER (%) Overall Positive Negative Overall Positive Negative
23 Less than 3 37.40 (23)
60.86 (17)
-29.07 (6)
33.39 (23)
63.12 (15)
-22.37 (8)
237 3 25.81 (237)
50.07 (160)
-26.97 (77)
25.42 (237)
47.95 (158)
-20.99 (79)
143 More than 3 16.65 (143)
42.07 (85)
-24.05 (58)
14.85 (143)
41.80 (83)
-22.09 (60)
χ2 value : RR: 0.066 and MAER: 0.135
Note: Figures in parentheses denote the number of companies
To analyze the responsiveness of returns to number of committees of board constituted
by the concerned IPO company, board committees are categorized as compulsory (2
which implies less than 3), non-mandatory (3) and voluntary (more than 3) on the lines of

Relationship Between Corporate Governance Variables and Listing Performance of Indian IPOs
170
recommendations of Clause 49. These are then checked for underpriced firms (positive
returns) and overpriced firms (negative returns) against both raw and adjusted returns.
Indian IPO firms are found to have mostly three committees on their boards as have been
specified by the listing agreement’s Clause 49 namely Audit Committee, Shareholder/
Investors Grievance Committee and Remuneration Committee. However, seeing the
facilitations these committees provide to board and decision making, number of firms
having more than 3 board committees is also noticeable (almost 35%). This constitution
of committees is also done in the light of credibility and reliability which they are
supposed to convey to investors. The distribution of returns across various categories of
board committees is presented in Table 6.9 wherein classifications have been provided to
raw returns and market returns.
The overall average raw returns show a declining trend to increase in number of board
committees as they fall down to 17% for more than three committees while they stand at
37% for two board committees, the mandatory number. The split of these returns as
positive and negative also corroborates these results. Amongst the underpriced firms
(those with positive returns), the highest percentage of average returns stands at 61%
which dilutes to 42.07 as the number of board committees increases from two to more
than three. The negative returns also show a decrease as the IPO concerns constitute
voluntary board committees. MAERs when investigated across different number of board
committees also indicate a similar trend reflecting highest returns for firms with only two
committees. Among positive MAERs, returns stand at 42% for more than 3 board
committees while for only two, these returns are as high as 63%. The patterns for
negative MAERs are not very discernible and stand differently from the negative raw
returns for which explanations that can be conjectured are market movements.
With regards to board committees it is, therefore, clear that there definitely lies a
relationship with returns, though inverse. The existence of relationship is confirmed
through significant value of chi-square (0.066) for raw returns and loosely significant for
adjusted returns. IPO concerns are governed largely by the legal compulsions and
potential of the variable to communicate better preparedness on decision making aspect
but this is not commensurate with the listing day returns.

Relationship Between Corporate Governance Variables and Listing Performance of Indian IPOs
171
6.6.3 Board Independence and Initial Returns
Proportion of independent directors on the board has always been a dominating measure
of corporate governance measure. Independent directors are expected to bring expertise
and an independent view to board which can take care of interests of stakeholders and
effective decision making. With the New Companies Act, 2013 clearly defining
independent directors, empowering them and granting supremacy in conducting affairs of
a company, the pertinence of board independence has accentuated. The legal requirement
as per clause 49 of listing agreement provides that where the Chairman of the Board is a
non-executive director, at least one-third of the Board should comprise of independent
directors and in case he is an executive director, at least half of the Board should
comprise of independent directors. Provided that where the non-executive Chairman is a
promoter of the company or is related to any promoter or person occupying management
positions at the Board level or at one level below the Board, at least one -half of the
Board of the company shall consist of independent directors. However, Companies Act,
2013 provides that all listed companies should have at least one-third of the Board as
independent directors. Such other class or classes of public companies as may be
prescribed by the Central Government shall also be required to appoint independent
directors. On the basis of requirements before the implementation of new law,
classifications in this category have been made as less than 50%, exactly 50%, 51-70% to
provide for the requirement of one-third of board strength and more than this percentage
which reflects the voluntary requirement to have more independent directors than
mandated.
The results for percentage of independent directors and their effects in case of
underpriced and overpriced firms have been tabulated in Table 6.10. Maximum
frequency is observed for the proportion of independent directors between half and one
third of total board strength. The number of IPO firms with independent directors less
than 50% stands at 70 (17 percent of total sample) highlighting those not abiding by legal
requirements. This is seen among firms which came out with their IPO in early years of
the sample as non-compliance in new IPOs is almost non-existent. Inducting more than
the mandated numbers of independent directors is not a frequently followed practice,
hardly one percent (4 IPOs) of firms fall in this category.

Relationship Between Corporate Governance Variables and Listing Performance of Indian IPOs
172
Table 6.10: Performance of IPO Firms across Proportion of Independent Directors
N Independent directors (%)
Average RR (%) Average MAER (%) Overall Positive Negative Overall Positive Negative
70 Less than 50% 18.57 (70)
38.24 (46)
-24.16 (24)
16.79 (70)
39.44 (42)
-15.90 (28)
247 50% 21.64 (247)
45.65 (164)
-27.61 (83)
20.31 (247)
45.18 (156)
-21.80 (91)
83 51-70% 30.44 (83)
65.90 (50)
-23.28 (33)
29.76 (83)
57.06 (56)
-26.88 (27)
4 More than 70% 19.43
(4) 28.37
(3) -7.41 (1)
17.07 (4)
25.44 (3)
-8.03 (1)
χ2 value : RR: 0.553 and MAER: 0.287
Note: Figures in parentheses denote the number of companies
Numbers for returns indicate that as the proportion of independent directors increases,
both raw and market returns, on an average, increase till the mandatory requirements
(indicated by 70%) but beyond that the average returns drop down steeply. Breaking
up this return to positive and negative returns, the patterns observed are no different.
When the proportion of board independence increases beyond two-thirds of total
strength, the positive returns fall down to 28.37 from the highest level of 66% (to 25%
from 57% in case of market return). The negative returns, in case of MAER, get all the
more negative till proportion of 70 and then stand at -8% when percentage of
independent directors surpasses 70%. The negative raw returns, however, differ a little
as their upturn is observed at the level of 50% though negative values are minimum for
highest proportion. The chi-square values of 0.553 and 0.287 for RR and MAER
respectively, confirm the lack of significant association between board independence
and returns.
For the relation of independent directors to returns, mandatory level (of two-third)
provides the point of turns to the increasing returns which suddenly fall indicating that
firms with two-thirds of directors as independent deliver maximum returns on the listing
date. Overall, on this account it can be summarized that firms prefer to stick to the
specified mandatory requirement on board independence which is supplemented by good
returns at these points.

Relationship Between Corporate Governance Variables and Listing Performance of Indian IPOs
173
6.6.4 Gender Diversity and Initial Returns
Even in times of women empowerment, presence of women on corporate boards remains
a rarity. It is actually their absence on boards globally which makes news and this indeed
has made gender diversity a widely talked and extensively researched issue. Presence of
women on boards draws theoretical support from agency, resource dependency and
institutional theory and has extant empirical support which necessitates women in
directorial position for financial and non-financial gains. Gender diversity, therefore, has
emerged as an important aspect of board structure and purported to be influential in board
effectiveness.
Table 6.11: Performance of IPO Firms across Levels of Gender Diversity
N No. of
Women directors
Average RR (%) Average MAER (%) Overall Positive Negative Overall Positive Negative
277 0 23.88 (277)
48. 20 (178)
-23.48 (99)
22.38 (277)
46.16 (176)
-22.46 (96)
103 1 20.44 (103)
51.00 (60)
-22.20 (43)
19.47 (103)
51.00 (57)
-19.36 (46)
24 2* 22.26 (24)
33.06 (20)
-29.07 (4)
22.42 (24)
35.08 (19)
-23.14 (5)
χ2 value : RR: 0.723 and MAER: 0.905
Note: Figures in parentheses denote the number of companies * Only one company had three women directors so clubbed in this category only
Maximum number of women directors in sample companies was found to be three which
existed for a single company (Beeyu Overseas Limited) and so for tabulating results here
the company has been clubbed with the third category of 2 directors. The number of
women directors, hence varies between zero and two and for these the average returns
have been studied. As evident from Table 6.11, no discernible relationship can be figured
between these two variables as corroborated by insignificant values for the chi-square test
of association. Average initial returns are found to be almost same for no women
companies and those with two women as directors with a comparatively lesser return for
those with one woman indicating that approach of tokenism would not help convert
concept of gender diversity into returns. In case of underpriced IPOs, the raw returns are

Relationship Between Corporate Governance Variables and Listing Performance of Indian IPOs
174
seen to be increasing and then sharp rise is observed as the number of women increases to
two. For negative raw returns and both positive and negative MAERs, the performance in
terms of return first improves with one woman director and with addition of one more
woman the performance weakens.
For gender diversity the numbers indicate very negligible representation of women on
boards which seems to be an exercise in letter blowing away the spirit. The maximum
number of women not surpassing mark of two is really a matter of concern calling for
remedial measures (like introduced in the Companies Act, 2013 whereby inducting at
least one woman as director on the board has been made mandatory for specified
companies). There definitely lies a relationship with returns, though that emerges clearly
in one section of sample (positive raw returns) but the low numbers can be held
responsible for same. The effect on returns can be purported to be more emphatic and
evident in case of large number of women as directors in companies.
6.6.5 Board Age and Initial Returns
Experience and maturity of board members is expected to lend viability and credibility to
the strategic decisions taken in board rooms which are expected to set the pace for firm’s
growth and development. One of the important factors from where this experience and
maturity emanates is the age of board members. Age of board, as referred here, refers to
average of individual age of each of the board members and is included here being
another measure of board quality. It affects on decision making and therefore its
relationship with returns is analyzed next.
Board age was found to vary between 32 and 66 years. The classifications across this
range have been made as young boards (up to 40 years), experienced boards (41-
55years), mature boards (with mean age in the range of 56 to 65 years) and senior boards
(more than 65 years ripe in age and experience). The age classifications of board are
contrasted with positive, negative and overall returns and the results are presented in
Table 6.12. IPO boards are found to be having directors which are middle aged for their
experience and maturity rather than having very senior directors (boards with average age
of more than 65 years are merely 5 of the total sample) and numbers stand low even for
Relationship Between Corporate Governance Variables and Listing Performance of Indian IPOs
175
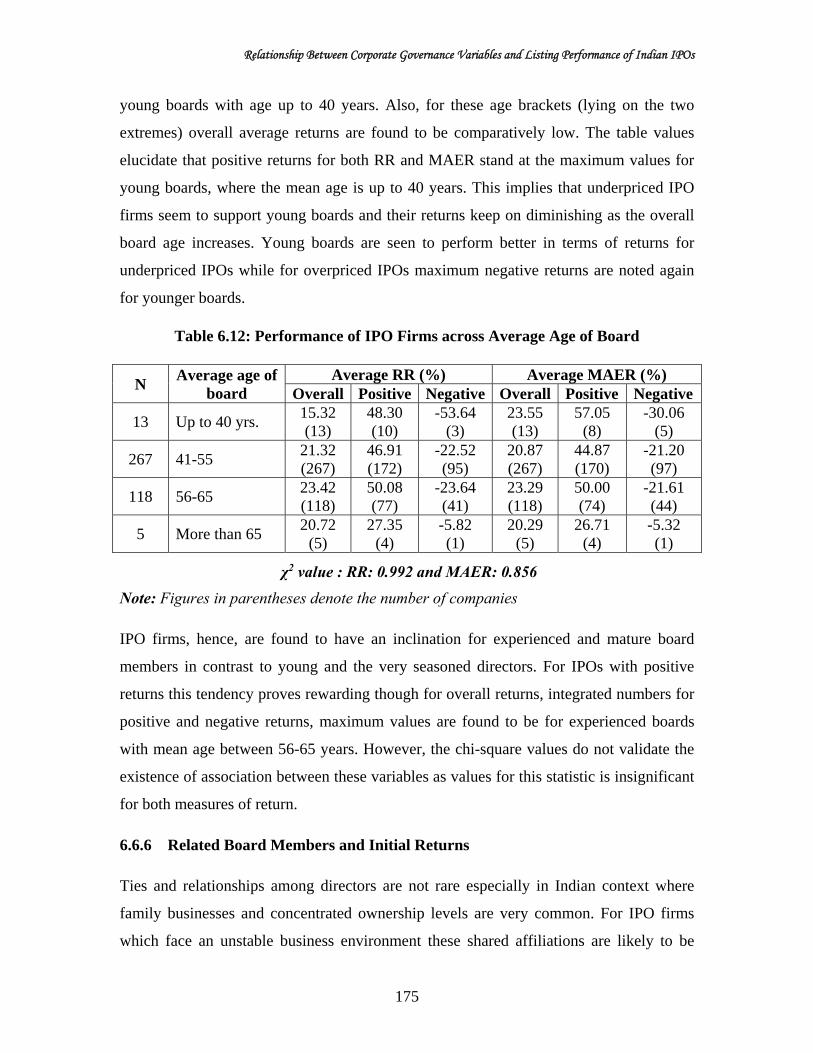
young boards with age up to 40 years. Also, for these age brackets (lying on the two
extremes) overall average returns are found to be comparatively low. The table values
elucidate that positive returns for both RR and MAER stand at the maximum values for
young boards, where the mean age is up to 40 years. This implies that underpriced IPO
firms seem to support young boards and their returns keep on diminishing as the overall
board age increases. Young boards are seen to perform better in terms of returns for
underpriced IPOs while for overpriced IPOs maximum negative returns are noted again
for younger boards.
Table 6.12: Performance of IPO Firms across Average Age of Board
N Average age of
board Average RR (%) Average MAER (%)
Overall Positive Negative Overall Positive Negative
13 Up to 40 yrs. 15.32 (13)
48.30 (10)
-53.64 (3)
23.55 (13)
57.05 (8)
-30.06 (5)
267 41-55 21.32 (267)
46.91 (172)
-22.52 (95)
20.87 (267)
44.87 (170)
-21.20 (97)
118 56-65 23.42 (118)
50.08 (77)
-23.64 (41)
23.29 (118)
50.00 (74)
-21.61 (44)
5 More than 65 20.72
(5) 27.35
(4) -5.82 (1)
20.29 (5)
26.71 (4)
-5.32 (1)
χ2 value : RR: 0.992 and MAER: 0.856
Note: Figures in parentheses denote the number of companies
IPO firms, hence, are found to have an inclination for experienced and mature board
members in contrast to young and the very seasoned directors. For IPOs with positive
returns this tendency proves rewarding though for overall returns, integrated numbers for
positive and negative returns, maximum values are found to be for experienced boards
with mean age between 56-65 years. However, the chi-square values do not validate the
existence of association between these variables as values for this statistic is insignificant
for both measures of return.
6.6.6 Related Board Members and Initial Returns
Ties and relationships among directors are not rare especially in Indian context where
family businesses and concentrated ownership levels are very common. For IPO firms
which face an unstable business environment these shared affiliations are likely to be

Relationship Between Corporate Governance Variables and Listing Performance of Indian IPOs
176
valuable by encouraging friendly and co-operative exchanges. Though these can also
destroy rather than create value by creating excessive managerial power leading to
managerial entrenchment. Thus, the importance of this variable as a governance attribute
and its potential effect on IPO returns remains immense. The association of this variable
across returns is tabulated in Table 6.13.
Table 6.13: Performance of IPO Firms across Related Board Members
N Related
members on board
Average RR (%) Average MAER (%)
Overall Positive Negative Overall Positive Negative
128 None 27.85 (128)
45.00 (38)
-12.76 (89)
25.60 (128)
42.14 (90)
-13.57 (38)
109 Two 18.79 (109)
52.82 (63)
-27.82 (46)
18.61 (109)
52.85 (61)
-24.91 (48)
102 2-4 22.57 (102)
51.38 (62)
-22.07 (40)
21.83 (102)
51.88 (59)
-19.42 (43)
49 More than 4 23.71 (49)
34.40 (40)
-26.26 (9)
20.34 (49)
34.88 (36)
-19.93 (13)
χ2 value : RR: 0.628 and MAER: 0.635
Note: Figures in parentheses denote the number of companies
More than two thirds of the sampled IPO firms have related members on the boards and
of these more than half of them have related members more than two indicative of the
trend of inducting family members on the board rather than scouting for options outside.
The instances of having more than four members from the family as directors at the same
time are also found which amount to 12% of the entire sample. Analyzing these numbers
of related members against returns it is found that the listing returns on an average are
lower for boards with two related members than those for boards with all directors
unrelated to each other. Then again, it rises against 2-4 members category and falls for
companies with more than four related members. On the whole the mean listing day
returns are highest for firms where directors have no family ties amongst themselves (RR
of 28% and MAER of 26%) while for those IPOs which are underpriced and generate
positive returns, the maximum value stands against the category of two related directors
being 53% for both raw returns and adjusted returns. For the overpriced IPOs, no evident
trends are discovered. Insignificant values of chi-square here again not only just point
towards lack of association but also indicate the need for further analysis.

Relationship Between Corporate Governance Variables and Listing Performance of Indian IPOs
177
The variable of related board members definitely influences the returns though the kind
of relationship is mixed which is positive at some levels and then tends to turn negative.
Very high number of directors with family ties which each other does not for sure result
in value addition rather tends to erode values which draws its explanation from
‘entrenchment hypothesis’.
6.6.7 Board Reputation and Initial Returns
Interlocking directorate which refers to the practice of members of one corporate board
serving on the boards of multiple corporations, is a common practice. These multiple
directorships where on one side can allow for cohesion and coordinated action on the
other side, work as a reputational signal to the investors on account of competence and
quality of firm management. This director prestige also can lend legitimacy to these new
ventures which resort to various mechanisms to communicate their credibility and
performance potential to investing public.
Table 6.14: Performance of IPO Firms across Board Reputation
N No. of other
directorships Average RR (%) Average MAER (%)
Overall Positive Negative Overall Positive Negative
20 None 0.50 (20)
30.92 (10)
-29.91 (10)
-0.32 (20)
25.70 (11)
-32.12 (9)
159 1-10 26.58 (159)
56.44 (102)
-28.86 (57)
25.94 (159)
53.03 (105)
-26.74 (54)
160 11-50 21.66 (160)
43.73 (106)
-21.65 (54)
19.56 (160)
44.14 (97)
-18.28 (63)
64 More than 50 24.52 (64)
40.58 (45)
-13.51 (19)
23.41 (64)
40.04 (44)
-13.19 (20)
χ2 value : RR: 0.147 and MAER: 0.689
Note: Figures in parentheses denote the number of companies
Board reputation, as it is referred to, has been measured through other directorships of
non-executive directors. On the basis of patterns observed, these have been categorized
from zero to 50, though the highest value observed was 303. A director having no other
directorships is unusual though 20 companies fall in this category which is mostly
companies with practices of in-bred directors. The concentration is seen for other
directorships in the range of a few to fifty which has 79% of the sample values.

Relationship Between Corporate Governance Variables and Listing Performance of Indian IPOs
178
Interlocking directorates prove to build upon value for the IPO firms which are translated
into listing day returns (loosely significant for raw returns as revealed from the chi-square
value of 0.147) because they stand pretty low for companies where directors have no
other directorships as evident from figures in Table 6.14. Maximum returns are found to
be associated with directorships ranging from 1-10 which is highest among other
categories with other directorships greater than 10. This trend is observed both for overall
raw and market returns as well as for segregated returns.
Figures and facts on this variable clarify that other directorships do contribute to
reputation and prestige of boards, the steep increase in values from 0.50 to 26% for raw
returns but as these directorships increase this rise in value starts diluting. When seen
against returns, other directorships must be adopted by concerns but their higher numbers
probably increase doubts as to diversion of focus and commitment on part of directors
with interlocks.
6.6.8 Promoter Ownership and Initial Returns
In addition to the board variables, three ownership variables have also been included as
proxies for corporate governance of firms because Lemmon and Lins (2003) contend that
ownership structure is a fundamental determinant of the extent of agency problems
between insiders and outsiders, which may in turn affect the firm’s valuation. The first
variable included is promoter ownership which reflects the proportion of shares held by
promoters in the firm’s share capital. The relationship between returns and promoter
ownership as pointed out by Morck, Shleifer, and Vishny (1988) depends on 2 opposing
forces: the ‘convergence of interests’ effect (where higher ownership tends to align the
interests of promoters with those of shareholders) and the ‘entrenchment effect’ (which
allows them to entrench themselves and work for self-interests).
Indian firms being primarily family promoted firms have a strong tendency to be owned
and managed by the founders and hence it is attempted to study how this ownership
affects the returns of IPOs on listing day. The results have been tabulated in Table 6.15
wherein ownership of shares by promoters is put into three categories and studied for
positive, negative and overall returns. The clear tendency of high ownership by promoters

Relationship Between Corporate Governance Variables and Listing Performance of Indian IPOs
179
emerges out where almost 93% of the total sample companies have promoter ownership
more than 50% of total capital and highest numbers are seen for more than 75% of the
shares indicating trends of high promoter ownership among Indian IPOs.
Table 6.15: Performance of IPO Firms across Promoter Ownership
N Promoter
ownership (%) Average RR (%) Average MAER (%)
Overall Positive Negative Overall Positive Negative
29 Upto 50% 24.96 (29)
47.94 (19)
-18.70 (12)
26.18 (29)
42.65 (21)
-17.07 (8)
90 51-75% 22.09 (90)
47.63 (61)
-31.62 (29)
21.13 (90)
45.43 (61)
-29.98 (29)
284 More than 75% 23.04 (284)
47.61 (183)
-27.47 (101)
21.40 (284)
47.01 (175)
-19.74 (109)
χ2 value : RR: 0.681 and MAER: 0.146
Note: Figures in parentheses denote the number of companies
The overall raw returns are noted to increase along increased ownership by promoters of
the company while the adjusted returns stand at a maximum where promoter ownership is
the minimum. A clear increasing trend is seen for positive MAERs, i.e. for underpriced
IPOs (the loosely significant value of 0.146 for MAER), where average returns are found
to be increasing with higher levels of promoter ownership which shows
operationalization of the alignment effect. This trend, however, is not consistent across
all categories of returns. In case of overpriced IPOs, as categorized on the basis of
MAERs, the return stands most negative for middle ranges of ownership while least
negative for least promoter ownership levels. When contrasted with negative raw returns
the patterns are not very similar where least negative values are seen for highest
ownership levels. For IPOs with positive raw returns, the higher values stand for lowest
and highest ownership levels which give an indication towards a u-shaped relationship
between ownership and returns.
Indian IPOs are definitely governed by the tendencies of family promoted businesses
resulting in concentrated ownership and high levels of promoter ownership. These levels
definitely influence the returns as on listing day though the relationship does not emerge
out concretely (insignificant values for chi-statistic) hinting at a curvilinear relationship

Relationship Between Corporate Governance Variables and Listing Performance of Indian IPOs
180
where in mix of both direct and relationship exists. The dominance of convergence and/or
entrenchment effect, thus, remains an empirical issue.
6.6.9 Block Shareholders and Initial Returns
Variable block shareholders has been introduced as a measure of concentrated ownership
which is expected to affect the returns under the same principles of ‘alignment of interest’
and ‘entrenchment of interest’. Block shareholders mean the number of shareholders of
the firm owning more than 10 percent of the total shares at the time of IPO. Larger the
number of these block shareholders the more dispersed is the ownership structure of the
firm and vice-versa. The behavior of listing day returns to these block ownership patterns
is attempted to be studied and results are presented in Table 6.16 which shows the largest
IPOs for the intermediate category where the number of block holders stands between 2
and 4.
Table 6.16: Performance of IPO Firms across Number of Block Shareholders
N Number of
block holders Average RR (%) Average MAER (%)
Overall Positive Negative Overall Positive Negative
90 Up to 2 27.71 (90)
48.41 (61)
-15.82 (29)
25.20 (90)
45.12 (61)
-16.71 (29)
285 2-4 21.46 (285)
46.28 (185)
-25.36 (100)
20.20 (285)
45.36 (180)
-22.93 (105)
29 4-6 25.13 (29)
59.56 (17)
-23.63 (12)
24.34 (29)
60.99 (16)
-20.77 (13)
χ2 value : RR: 0.391 and MAER: 0.220
Note: Figures in parentheses denote the number of companies.
For the overall average of returns, both unadjusted and adjusted reveal that for less
number of block holders the returns are maximum, which first decrease and then
increase as the number of these block holders increase. The non-existence of concrete
and clear association between these attributes is confirmed by the insignificant chi-
square values. Among positive returns, maximum return values for raw and market
returns are noted for firms which have higher number of block shareholders. This
implies that larger number of block holders result in more underpricing due to the
tendencies of these block holders to extract private benefits which do not accrue to

Relationship Between Corporate Governance Variables and Listing Performance of Indian IPOs
181
other shareholders. For firms with negative return, these returns again indicate a
relationship wherein returns first decrease and then increase with increase in number of
block holders. The relationship as unraveled for ownership variable above, hints at a
non-linear tendency where the operation of both the entrenchment and alignment
hypothesis exists at different levels.
6.6.10 Ownership by Top 10 Shareholders and Initial Returns
As another measure of ownership and more specifically concentration of ownership,
ownership levels of top 10 owners are included. Cumulative percentage of shares held by
10 largest shareholders would indicate the extent of concentration existing at the time of
IPO. Higher this percentage the more concentrated ownership is believed to be and vice
versa. Claessens and Djankov (1999) find that firm profitability and labour productivity
are positively associated with ownership concentration.
In this direction, IPO firms are classified into categories wherein it is observed that firms
have high concentration levels because largest numbers of IPOs are found to have 85%
and higher equity ownership in hands of the top 10 owners. 130 of the total firms have
ownership at the level of 100% implying that all ownership is limited in the hands of 10
shareholders and the situation seemingly becomes grave when these 10 owners include
promoters and family members. Thus, concentrated ownership is found to be a typical
feature of Indian IPOs.
Table 6.17: Performance of IPO Firms across Ownership by Top 10 Shareholders
N Top 10 owners
(%) Average RR (%) Average MAER (%)
Overall Positive Negative Overall Positive Negative
71 Upto 85% 23.49 (71)
44.31 (49)
-22.87 (22)
22.00 (71)
40.76 (50)
-22.66 (21)
203 85-100% 25.67 (203)
48.34 (139)
-23.58 (64)
23.95 (203)
47.63 (133)
-21.05 (70)
130 Exactly 100% 18.24 (130)
48.50 (75)
-23.01 (55)
17.75 (130)
47.58 (74)
-21.66 (56)
χ2 value : RR: 0.061 and MAER: 0.043
Note: Figures in parentheses denote the number of companies

Relationship Between Corporate Governance Variables and Listing Performance of Indian IPOs
182
The relationship of these levels to returns are presented in Table 6.17 which elucidates
that overall average returns stand at a maximum for intermediate category (26% RR and
24% MAER) and for levels higher and lower than this the returns are lower. For the
underpriced firms with positive listing day returns, returns are the maximum (48%) when
100% ownership is in hands of 10 shareholders indicating that firms with higher
concentrated levels of ownership are more underpriced. For the overpriced firms also, the
returns become less negative with increasing levels of ownership concentration.
Ownership concentration levels definitely bear a relationship with the IPO returns on the
listing day but as deciphered from the overall figures the relationship is a curvilinear
relationship where first the working of alignment effect becomes evident and then the
entrenchment tendencies are seen for higher levels of ownership concentration. The
corroboration of the supposed relationship of ownership by top 10 shareholders is done
by the significant values of chi-square which stand significant at (10% and 5%
significance level for RR and MAER respectively).
In this section, various measures of corporate governance have been studied for their
relationship with overall listing returns and also when these returns are segregated as
positive and negative returns and degree of association is attempted to be statistically
confirmed through chi-square test statistics. The responsiveness of raw returns and
market adjusted excess returns to the governance parameters becomes important in the
light of the fact that IPO initial pricing behavior is attempted to be explained through
governance attributes. Returns across different ranges of board structure components and
ownership variables definitely vary but variation patterns for most of the variables are
seen to be a mix of increasing and decreasing trends. It is found that for board structure
variables which include board size, percentage of independent directors, board
committees, proportion of women directors, age of board, related board members and
board reputation, the relationship stands more specific and discernible with regards to
underpriced firms, i.e. where the returns are positive. For companies with negative
returns, there definitely lies responsiveness to the board structure components but it for
sure is not a straight line relationship. Three ownership variables though show
consistency in patterns highlighting the fact that higher ownership concentration results

Relationship Between Corporate Governance Variables and Listing Performance of Indian IPOs
183
in higher underpricing whether measured through block holders or cumulative ownership
by top 10 owners. For overall returns and overpriced firms, the relationship is governed
both by convergence and divergence of interests each operating at different levels. With
regards to statistical significance as checked through chi-square test, of all variables only
the ownership levels of top 10 owners, which measures concentration levels, is found to
be significant. The analysis in this section also highlights the need of more
comprehensive analysis for more confident results. To conclude this relationship of
returns to board and ownership variables it can be put that investigation at this level
though indicates existence of relationship but for more concrete conclusions a deeper and
comprehensive analysis is required.
6.7 RELATIONSHIP OF CORPORATE GOVERNANCE ATTRIBUTES TO
LISTING DAY PERFORMANCE
Underpricing has been established as a pervasive phenomenon world over and the
preliminary evidence as presented in this chapter also confirms this to exist for Indian
IPOs as revealed for the sample. Average underpricing has been found to be existent at
the mean levels of more than 20%. Various theories have been proposed as explanations
and justifications for this pricing anomaly. Building upon the signaling theory, wherein
IPO firms resort to diverse signals to fend off the information asymmetry challenges and
communicate their credibility to investing public, further investigation is done. In the IPO
context, decreasing significance of financial information and emergence of corporate
governance concerns and evidence of gaffes have seen governance mechanisms being
adopted as signals for prospective investors. Compulsive commitment of the nations
worldwide to governance matters and allegiance to codes of conduct has brought the
spotlight to these attributes being resorted to garner public support for new issues.
Qualifying as credible signals as advocated by signaling theory, corporate governance
variables are being studied as explanations to underpricing. In this section it is attempted
to gauge the explanatory power of corporate governance mechanisms in context of listing
day returns and to understand how far are these signals incorporated by Indian investors
in their investment decisions. For the purpose, first the variables included in the model
and their descriptive statistics are studied with a detail on their hypothesized relationship

Relationship Between Corporate Governance Variables and Listing Performance of Indian IPOs
184
with listing day returns. Then the regression models employed with returns: both
unadjusted and adjusted are analyzed for achieving the objective.
Pricing of the IPOs with a certain level of governance mechanisms in place and how far
these governance matters qualify as a signal when investors decide on making an
investment choice is attempted to be ascertained. Towards this objective multiple
regression analysis has been employed using both raw returns, where no adjustments for
market returns are made and for market adjusted excess returns discounting the returns of
IPOs for market returns reflected through movements of SENSEX, as dependent
variables. The model employed is as follows:
Underpricingi = α + β1Subscription ratioi + β2 Issue sizei + β3 Issue pricei + β4 Listing
delayi + β5 IPO agei + β6 Total assetsi +β7 Board sizei + β8 Board committeesi +β9 Board
independencei + β10 Women directori + β11 Board agei + β12 Related board members + β13
Board reputation + β14 Promoter ownershipi + β15 Block shareholderi + β16 Top 10
ownershipi + εi
Before running regressions, the models have been tested to assure that they do not suffer
from multicollinearity and heteroskedasticity problems. Autocorrelation is not an issue of
concern in the study as it is a problem typical to time series data. The existence of
heteroscedasticity was, however, confirmed and as a solution, White’s heteroskedasticity
Consistent Standard Errors have been used. VIFs (Variance-Inflating Factors) have been
computed for explanatory variables to check the problem of collinearity between
variables, which is an important assumption in regression analysis. However, no violation
of this was noticed as all VIF values were below 10 (Gujarati, 2003).
Specifications of the variables employed in the model have been detailed in Table 6.2 in
earlier part of this chapter. The variables can be categorized as firm variables, issue
variables and corporate governance proxy variables. Firm and issue variables have been
included as control variables on the basis of ample empirical evidence supporting their
influence on listing day pricing performance. Corporate governance variables are the
interest variables which have been attempted to be comprehensively represented through
board structure variables and ownership related measures. Each of these variables has

Relationship Between Corporate Governance Variables and Listing Performance of Indian IPOs
185
been included in the regression model for their potential effect on listing returns of IPOs.
These expected relationships have been detailed out in the next section.
6.7.1 Theoretical relationship of variables for study
For finding explanations to the underpricing phenomenon as it exists on the listing day
through corporate governance mechanisms, multiple regression analysis has been
employed. The returns on the listing day, measure of underpricing used as dependent
variable, are measured through two variants; the returns of the particular stock calculated
irrespective of market returns, regarded as raw returns and returns which are discounted
for the market returns as measured through returns of the market barometer, SENSEX
values in this case. The variables of interest are measures of governance as they exist at
the time of new issue to validate their signaling effectiveness and resulting impact on first
day returns. Other than this, a few firm and issue variables have been employed to
monitor compounding influences of alternative signaling mechanism. Each of these
variables, their measure and theoretical relationship to the dependent variable is discussed
below.
i) Subscription ratio - It reflects the rate at which the issue has been subscribed
with a higher ratio reflecting more demand for the new issue and vice versa and
also can provide for possible influences of demand pressures on IPO stock’s
value. Koh and Walter (1989) proposed that higher the interest and demand of the
issue, the higher would be degree of underpricing and subscription ratio works
very well as the proxy for demand and resulting popularity of the issue. Chahine
and Tohme’ (2009) incorporated oversubscription for its use by issuers to increase
the likelihood of IPO’s success (Amihud et al., 2003) in line with information
cascades model of Welch (1992). Hence, the researchers propose a positive
influence of subscription ratio to the levels of underpricing and thus the inclusion
of the variable.
ii) Issue size - Issue size is regarded by some authors as proxy for ex-ante risk. It has
been included to capture the inherent and fundamental risk of an IPO so as to
provide for its plausible influence on performance of the issue in line with related
prior works (Ching-Yi Lin, 2005; Li, 2005; Li and Naughton, 2007; Mitchell et
al., 2008; Mnif, 2009; Chen and Yang, 2013). Issue size is measured by the

Relationship Between Corporate Governance Variables and Listing Performance of Indian IPOs
186
product of offer price and total number of shares offered to the public. Ritter
(1991) argues that smaller issuers tend to have better initial returns and worse
long-term performance compared to larger issues (Li and Naughton, 2007). This
implies that smaller the issue size larger would be the quantum of underpricing
thus subliming to a negative relationship between the two variables.
iii) Issue price - The price at which one unit of new equity shares are offered to
public is the issue price and has also been included as a control variable. Corhay
and Rad (2002) find a negative relation between long-run performance of IPOs
and inverse of issue price. Su and Fleisher (1999) reported offer price is
significantly negatively related to IPO initial returns in Chinese settings.
However, in Indian context over a long time period inverse of issue price has been
found to be positively related to long run performance of IPOs (Sehgal and Singh,
2009). It is expected that higher the issue price more will be the demand for
securities indicating better pricing performance.
iv) Listing delay - It refers to the time lag (measured in days) between IPO
subscription date and date when these shares get actually listed on stock
exchange, the Bombay Stock Exchange in this case. In the scenario of information
asymmetry characterized by existence of both informed and uninformed investors,
on the lines of Lee et al. (1996) this time gap is a variable to proxy for degree of
informed demand. The longer gaps in these two time points is expected to reduce
information asymmetry and thus less degree of underpricing needed by firms to
give thrust to issue. In this spirit, negative relationships were reported by How et
al. (1995) and Lee et al. (1996). However, it is also argued that long lags produce
a number of risks to be borne by investors which is perceived as a weaker
certification leading to a positive plausible relationship between time delay in
listing and level of underpricing (Chowdhry and Sherman, 1996; Mok and Hui,
1998; Chan et al., 2004; Chahine and Tohme, 2009; Chen and Yang, 2013).
v) IPO age - IPO age implies the number of years the firm has been incorporated
prior to the IPO date, computed as issue year minus the year of incorporation. The
variable is included for its reported relationship with IPO performance (e.g.,
Megginson and Weiss, 1991; Mikkelson et al., 1997; Ritter, 1998; Certo et al.,
2001a). Researchers suggest that older firms which have been in the market for

Relationship Between Corporate Governance Variables and Listing Performance of Indian IPOs
187
larger time are perceived to be less risky and experience less severe uncertainty
and so can be expected to perform better than their younger peers (Firth, 1997;
Mikkelson et al., 1997; Durukan, 2002 and Georgen et al., 2007) and thereby firm
age is expected to be positively associated with initial returns. Ritter (1991),
however, shows that older the IPO firm the lower the initial return and higher the
long run performance implying that the operating history is negatively related to
initial returns. Hence, it is important to control for IPO age and the natural
logarithm of age is incorporated as control for operating history.
vi) Total Assets - An indicator of firm size, total assets is measured by the natural
logarithm of book value of total assets immediately before the public issue. IPO
firms with larger asset base are shown to have higher survival rate (Jain and Kini,
1999), better long run performance (Durukan, 2002; Georgen et al., 2007) and
positive association with initial returns of IPO firms (Ritter, 1984; Ritter, 1991;
Mikkelson et al., 1997; Certo et al., 2001a; Mnif, 2010; Hearn, 2011). The
theoretical justifications for firm size are same as those of firm age as both are
taken as proxies of ex-ante uncertainty associated with firms. Firms with larger
asset base are expected to have lower level of risk and uncertainty and would thus
be required to underprice less in comparison to firms with smaller asset base
which have less shock absorbing power.
vii) Board size - Board size is a central issue in corporate governance. Pearce and
Zahra (1992) and Dalton et al. (1999) argue that board size is one of the important
determinants of effective corporate governance. Agency theory suggests that
service and control functions of directors would be less effective when the board
is large due to agency problems (Hermalin and Weisbach, 2003). From the
strategic decision making perspective smaller boards are associated with group
cohesiveness and more effective decision making (Goodstein et al., 1994; Mak
and Roush, 2000). Resource dependency theory, however, offers an alternative
argument for larger boards believing that size of the board is related to firm’s
ability to obtain critical resources (Pfeffer, 1972). Studies have found evidence
supporting the positive relationship of board size to firm performance (eg. Mak
and Li, 2001; Ferris et al., 2003) based on the resource dependency theory.
Within the IPO context as well, the empirical evidence on relationship of board

Relationship Between Corporate Governance Variables and Listing Performance of Indian IPOs
188
size to short term underpricing is mixed. Carter et al. (1998a), Certo et al.
(2001b), Yatim (2011), Darmadi and Gunawan (2012) show that board size and
underpricing are negatively related. On the other hand some researchers (eg. Li
and Naughton, 2007; Mnif, 2010; Hearn, 2011) have established positive
relationship between board price and initial underpricing and have attributed
larger boards to coordination and decision making problems which add to
asymmetric information and agency costs. Some other studies (Finkle, 1998;
Howton et al., 2001; Dempere, 2007; Lin and Chuang, 2011; Chen and Yang,
2013) however, fail to establish any relationship between the two. Thus, the
relation of board size to underpricing has not been unequivocally established till
date.
viii) Board committees - The number of board committees constituted for supporting
and assisting the board of directors has been included as next variable. Evidence
supports the idea that many important decisions are made in board committees
and those decisions affect the performance of the firm (Carter et al., 2010).
Bilimoria and Piderit (1994) submit that previous research indicates the
delegation of corporate governance to board committees facilitates effective board
and corporate functions and provides a means and structure for effective
governance by addressing important corporate concerns. The literature regarding
the beneficial impact arising from the constitution of these board committees, as
an inherent part of governance mechanisms, on the underpricing levels is almost
non-existent. However, given that establishment of committees is recommended
in governance codes and will entail costs in having these committees in place,
they should qualify as signals of quality of governance and credibility of issue. As
conjectured by Hearn (2011), signaling of quality role of committee establishment
will reduce underpricing being associated with larger value firms which are able
to have these costly procedures in place. More board committees are expected to
provide better monitoring leading investors to perceive that they can mitigate
information asymmetry. How far these work as effective signals of governance
and firm quality needs to be investigated.
ix) Board independence - It has been measured through the proportion of
independent directors on the board of the total board size. Independent directors

Relationship Between Corporate Governance Variables and Listing Performance of Indian IPOs
189
are expected to monitor management more effectively being more objective and
independent in approach (Fama and Jensen, 1983). They are guided by the motive
of safeguarding the interest and wealth of shareholders and thus help in diluting
the information asymmetry and agency issues (Jensen and Meckling, 1976,
Williamson, 1985). In contrast, boards dominated by outsiders may also lead to
over monitoring and stifle strategic actions (Fama and Jensen, 1983; Baysinger
and Butler, 1985; Goodstein et al., 1994, Darmadi and Gunawan, 2012). Within
the IPO context, negative relationship of proportion of independent/outside
directors has been established for different environmental settings (Chahine,
2004; Chahine and Filatotchev, 2008; Hearn, 2011; Lin and Chuang, 2011). For
other institutional settings (Certo et al., 2001a; Howton et al., 2001; Filatotchev
and Bishop, 2002; Darmadi and Gunawan, 2012) the relationship established is
positive suggesting that board independence in these country settings is adopted
as a signal and is discounted as a signal of good quality by investors in their
investment decisions. Li and Naughton (2007) and Chen and Yang (2013) in
China, Yatim (2011) in Indonesia and Wu and Hsu (2012) in AIM of UK failed to
find any significant association between these two variables. The relationship thus
remains far from being explicit and unidirectional leaving scope for further
investigation.
x) Women directors - Another aspect of board which is studied is gender diversity
represented through the percentage of women directors on the board. Drawing
support for their inclusion on board, from theories of agency and resource
dependency, presence of women directors is expected to enhance monitoring
effectiveness and firm value (detailed out in previous chapter). The impact of
gender diversity in IPO context with regards to its effectiveness as signal and
impact on level of underpricing remains dominantly an unexplored area. A limited
number of research efforts seek explanations to underpricing using gender
diversity (Hearn, 2011; Chen and Yang, 2013; Thorsell and Isaksson, 2014) and
thus inclusion of the variable as a measure of corporate governance.
xi) Age of board - Board structure and experienced board can help substitute for
information access and fend off certain problems associated with information
asymmetry at the time of offer (Certo et al., 2001a; Certo et al., 2001b). The

Relationship Between Corporate Governance Variables and Listing Performance of Indian IPOs
190
experience of board and its influence on performance has been sparsely
considered in previous research largely due to issues of measurability and
shortage of data. In this study attempt was made to measure it through experience
and age of board members but non-disclosure of experience limited it to age of
board members only. Average age of board members has been adopted to
represent the experience and capability of boards thus providing for a measure of
professionalism and decision making acumen. If the board can serve as a signal to
communicate to investors the performing potential of the firm as argued by
researchers (eg. Certo et al., 2001a; Higgins and Gulati, 2003; Thorsell and
Isaksson, 2014), the experience of the boards can strengthen this signal and hence
contribute to the performance of the firms. Further supporting this argument, as
Thorsell and Isaksson (2014) put, that older directors, besides experience, also
provide wisdom, possibly economic resources (Kang et al., 2007), and a higher
level of maturity and moral development (Daboub et al., 1995) than do younger
directors. It is hence, attempted to check for the influence, if any, of age of board
on underpricing of Indian IPOs and their credibility as a signaling mechanism.
xii) Related Board members - The number of directors on the board who are related
to each other as disclosed in the issuing prospectus are measured next. These
family ties and connections are not rare especially in Indian settings where
corporates are marked with family ownership and concentrated control tendencies
resulting in controlling shareholders electing their own family members as
directors. While family ties may solve manager–owner conflicts of interests, they
may also give rise to minority-shareholder expropriation and/or private benefits of
control (Chahine and Goergen, 2013). The traditional conflict of interests between
managers and owners, as described by Berle and Means (1932) and Jensen and
Meckling (1976) is expected to be diluted in a family company. It may, in
contrast, also destroy rather than create value. It may generate excessive
managerial power resulting in managerial entrenchment. How these relatedness
among board directors works for the level of underpricing being a component of
board structures is attempted to be studied.
xiii) Board reputation - Multiple board appointments are expected to augment
reputation of directors as expert decision makers and thus can help build the

Relationship Between Corporate Governance Variables and Listing Performance of Indian IPOs
191
reputational capital of firm (Fama, 1980; Fama and Jensen, 1983). These external
ties also find support in resource dependency theory which advocates access to
valuable information and resources which are all the more necessary for startup
firms (Pfeffer and Salancik, 1978; Borch and Huse, 1993; Filatotchev and Bishop,
2002). This reputational advantage lends legitimacy to the corporation (Higgins
and Gulati, 2003) and also can work as signals of effective monitoring (D’ Aveni,
1990; Shivdasani, 1993; Certo et al., 2001a). These in turn may help the firm to
overcome information asymmetry problems which otherwise can restrict investor
participation in the issue and adversely affect the performance of IPO. In this
light, on the lines of Yatim (2011), the total number of directorships held by non-
executive directors in other firms is included in the present study to represent the
board reputation and its contribution in explaining and containing the extent of
underpricing.
xiv) Promoter ownership - Other than the board structure variables, three ownership
variables have also been included as ownership structure is expected to affect the
ability of the shareholders to control agency problems (Jensen and Meckling,
1976) and firm value (Berle and Means, 1932). First, amongst these is promoter
or founder ownership measured as the percentage of shares held by promoters in
IPO firm. Promoter and family controlled firms are expected to have greater value
and operating efficiency as founding family members have more incentive to
improve firm performance than non-family decision makers (McConaughy et al.,
2001; Chahine, 2004) which in turn results in alignment of interests with those of
shareholders. In contrast, the founders as controllers and decision makers may
tend to favor family shareholders at the expense of the public investors (Shleifer
and Vishny, 1997) giving way to the risk of non-professional managerial
approach (Classens et al., 2000) and thus creating conflicts of interests and a host
of agency problems (Filatotchev and Bishop, 2002). Moreover, the nature of this
relationship suggests existence of non-linear relationship of founders’ ownership
with IPO underpricing and hence, squared term of promoter ownership is also
included to check the non-linearity of relationship (as in Chahine et al., 2009).
xv) Block holders - The other aspect of ownership examined is ownership
concentration expressed through block holders and ownership percentage of top

Relationship Between Corporate Governance Variables and Listing Performance of Indian IPOs
192
10 shareholders. The variable block holders represents the number of shareholders
owning more than 10 percent of total shares to reflect the concentration
tendencies, lower the number of block holders higher the ownership concentration
and vice versa. The results of initial examination (presented in preceding sections)
make it explicit that high concentration levels are common in Indian IPOs
necessitating the effect of this trend on IPO performance measured through initial
underpricing. It has been established in relation to traditional corporations
(Barclay and Holderness, 1989) and close ended funds (Barclay et al., 1993) that
the block holders by virtue of their controlling through ownership levels extract
private benefits which do not accrue to other shareholders. With the study of
existence of concentrated ownership levels (La Porta et al., 1999; Classens et al.,
2000; Faccio and Lang, 2002) the impact of these levels on performance of IPOs
becomes important to be studied. Concentrated ownership where on one side can
work for aligning the interests of management and shareholders and thereby
enhance firm value (Li and Simerly, 1998), can also lead to extraction of private
benefits by these controlling shareholders leading to additional costs for minority
shareholders (Shleifer and Vishny, 1997).
xvi) Top 10 holders - Total percentage of shares held by top 10 shareholders of the
IPO firm is represented by the other ownership variable expected to express the
extent of dispersed or concentrated ownership levels. In the light of international
best practice of diversified ownership reflected in legislations associated with
most markets (Hearn, 2012) in order to check for expected expropriation of
minority shareholders, if any, this variable needs to be investigated for its
plausible association with IPO performance. As Li and Simerly (1998) argue,
concentrated ownership is perceived as a monitoring mechanism, so that the
interests of management and shareholders can be aligned, thereby enhancing firm
value and benefitting minority shareholders. Though there are also apprehensions
of added costs for minority shareholders (Shleifer and Vishny, 1997) resulting
from tendencies to work for personal interests and private benefits on the part of
controlling shareholders. To understand the exact relationship, the squared term is
also included for studying the existence of non-linearity of relationship.

Relationship Between Corporate Governance Variables and Listing Performance of Indian IPOs
193
Thus, these are the variables included as governance and issue variables to find
explanations to the underpricing phenomenon using multiple regression analysis through
the model specified above.
6.7.2 Summary Statistics
Table 6.18 reports the descriptive statistics of research variables included in the
regression model. The variables as discussed include two dependent variables, the
measure of initial returns expressed as unadjusted (raw) and adjusted (market) returns on
the first day of listing. The average level of initial returns with both raw and adjusted
returns stands at around 21% indicating existence of underpricing phenomenon amongst
Indian IPOs. The maximum value for raw returns is noted to be higher than those for
market returns indicating market movements adjusting the high returns. With regards to
minimum values and values for standard deviation the two dependent variables do not
display any major difference.
Coming to the control variables employing firm and issue characteristics, Indian IPOs
on an average have been oversubscribed (19.29 times and minimum value of zero)
reflecting the active operations in capital market in general and new issue markets
specifically. The highest value noted for this variable stands at 176 indicating the very
high demand patterns for new issues. The standard deviation value of 26 though
indicates variations in this mean subscription rate but is not very high to question the
vibrancy of markets. Issue size expressed in crores of rupees shows wide variation in
offer size as observed through minimum value of 2.16 crores and maximum value of
15475 crores and also a high value of standard deviation. The mean value for issue
size is noted as 387 crores which indicates that Indian IPOs are of reasonably big size
on an average. The trend of issuing IPOs at a high premium than the face value is also
very evident from mean value of issue price which stands at Rs 175 against the
minimum value of 10. This high issue price trends cannot however be generalized as
standard deviation of 189 indicates huge variations within the maximum (1310) and
minimum values (10).

Relationship Between Corporate Governance Variables and Listing Performance of Indian IPOs
194
Table 6.18: Summary Statistics of Variables Employed in Regression
Variables Mean Median Max Min Std. Dev. N Raw Return 22.90 12.79 323.50 -94.29 55.35 404 Market Adjusted Excess Return 21.61 9.45 285.44 -101.78 53.57 404 Subscription Ratio 19.29 6.94 175.88 0.00 26.50 403 Issue Size 386.81 91.70 15475.09 2.16 1276.06 403 Log Issue Size 4.70 4.52 9.65 0.77 1.35 403 Issue Price 175.37 114.00 1310.00 10.00 189.19 404 Inverse of Issue Price 0.02 0.01 0.10 0.00 0.02 404 Listing Delay 23.01 20.00 404.00 12.00 28.61 395 IPO Age (Years) 15.20 12.29 102.47 0.31 13.14 404 Log IPO Age 1.11 1.12 2.01 0.12 0.29 404 Total Assets 1728.11 119.99 92522.24 1.09 7831.91 402 Log Total Assets 5.11 4.79 11.44 0.08 1.79 402 Board Size 7.78 8.00 20.00 4.00 2.26 404 Board Committees 3.56 3.00 10.00 1.00 1.23 403 Inverse of Board Committees 0.31 0.33 1.00 0.10 0.09 403 Independent Directors 49.63 50.00 80.00 0.00 8.91 404 Women Directors 0.38 0.00 3.00 0.00 0.60 404 Age of Board 51.76 52.67 66.42 32.57 5.70 403 Related Board Members 1.90 2.00 7.00 0.00 1.54 388 Board Reputation 26.26 13.00 301.00 0.00 35.34 403 Promoter Ownership 83.04 89.45 100.00 5.81 18.69 403 Block Shareholder Ownership 2.59 2.50 6.00 0.00 1.25 404 Top 10 Ownership 92.63 98.34 100.00 25.86 11.53 404 Promoter Ownership Square 7244.17 8001.30 10000.00 33.76 2771.50 403 Top 10 Ownership Square 8713.64 9670.76 10000.00 668.74 1860.28 404
The time which elapses between close of issue and listing date is regarded as the listing
delay wherein it is observed that mean time taken to list by the sample IPOs is 23 days
though for a lone case the time was as long as 404 days. The regulatory regimes and
global practices have worked in reducing this time gap and firms are now attempting to
minimize this listing period and thus the minimum value of 10 days is seen which comes
from IPOs relating to later time periods of the sample. Firms’ standing and experience as
measured through age in years reveals that it is on an average 15 years of existence that
the firms decide to go public. Though instances of very mature (maximum value of 102
years) and too young firms (0.31) are also seen. Total assets of the firm as per the last
financial year preceding the IPO have also been studied to provide for the effect of firm
size. There lies no consistency with regards to total asset base of these firms which is

Relationship Between Corporate Governance Variables and Listing Performance of Indian IPOs
195
noted through high values of standard deviation and huge difference in the minimum and
maximum values. The median value of 120 crores denotes the mid value for sample
indicating the point splitting the sample into two halves. Mean value of 1728 crores
indicates the general trend of firms with larger asset base opting to go public.
Moving on to board structure variables, the mean and median board size stands at 8
indicating the trend of intermediate board size, neither too small nor too big. Sample does
have firm with board as big as 20 members and on the lower size a board size of four is
also observed, the variations being validated by standard deviation of 2. Committees of
the board constituted to assist the board in discharging its functions smoothly and
effectively seem to be governed by the regulatory norms which specify two committees
as compulsory and third one is specified as non-mandatory. IPO firms on an average have
three committees constituted at the time of IPO though the highest value stands at 10.
Variations on this aspect around the mean value of 3 is low indicating inclination to go by
the norms and institute three committees for board’s assistance keeping voluntary aspect
rather low.
Board independence viewed as a dominant aspect of board structures, is investigated
next. Here again, law and regulations have their effect keeping the mean and median
value to 50%. The maximum value of 80 percent signifies a rarity wherein firms induct
larger number of independent directors for greater board quality while the minimum
value of 10 percent highlights the defaulters on this account (relates to an IPO company
of earlier time period when norms were new to land and stricter implementation came
later). Gender diversity and very low number of women directors, as explained at length
in Chapter 5, remains an issue of concern. Maximum number of women directors stands
at three (and that too for a single company of the sample) while minimum is zero into
which a large number of IPOs fall. Low standard deviation and very low mean values
only contribute to confirmation of the fact that women presence on boards is rather
minimal and calls for remedial action. The mean age of board, overall average of age of
individual board members, stands at 52 years indicating an incline for experienced
persons as directors on board. The upper and lower bounds stand at 66 and 33 years
respectively highlighting that very young and very senior directors are not usually

Relationship Between Corporate Governance Variables and Listing Performance of Indian IPOs
196
inducted on boards of young companies seeking to establish their monitoring and
decision making abilities.
Amongst Indian IPOs there is observed a practice of having related family members as
directors where the mean and median values stand at 2. Maximum relatives on one board
was found to be 7 though the information on this variable was missing for many firms (N
here being only 388). Interlocking directorates taken as a measure of board reputation is
also found to be a common practice. A non-executive director was found to have other
directorships as high as 301 which was recorded as the highest value for this variable in
contrast to the minimum value of zero indicating significant variations around the mean,
also as indicated by 33 as standard deviation. Mean holdings of the promoters of the
company stand at a high of 83% with maximum value being just equal to 100 confirming
the pattern of family ownerships and control (which is further strengthened through
appointment of relatives on boards). The shareholdings of all promoters have been
cumulated for this purpose whose values affirm that promoter controlled IPOs is common
sight in Indian markets. The average number of block shareholders (holding more than
10% of total equity) is found to be three which only represents the number of controlling
members and decision makers for IPO firm while the cumulated average holdings of top
10 shareholders stand at almost 93%, both indicating concentrated ownership levels in
the IPO firm. No clues for dispersed ownerships are found in initial investigation and
their impact and implications will be attempted to be sought in next section.
Descriptive statistics as explained above paint an initial rough picture of the variables
under consideration though for their impact and influences on the dependent variable
further investigations have been done. The results of regression analysis have been
presented and explained in the next section.
6.7.3 Regression Results
The present study performs cross sectional regression analysis to explore the impact of
corporate governance measures on the initial underpricing of IPOs in Indian markets the
results for which have been presented in Tables 6.19 and 6.20. Separate regression
models using the variables detailed out in earlier part of this chapter have been run for

Relationship Between Corporate Governance Variables and Listing Performance of Indian IPOs
197
raw returns and market adjusted excess returns. Before running regression analysis, the
models were checked for multicollinearity and heteroscedasticity. The existence of
problem of heteroscedasticity was discovered and to provide for it, White’s
heteroskedasticity Consistent Standard Errors have been used. Multicollienarity was not
an issue of concern as the VIFs (Variance-Inflating Factors) were found to be below 10.
Regression analysis is first done using raw returns as dependent variable and the results
are reported in Table 6.19. In regression analysis, the sample consists of 376 IPOs of the
total of 404 issued during the sample period. The reduced sample size is due to missing
data on estimated dependent and independent variables. In order to explore the
contribution of corporate governance variables in explaining the initial returns and to
segregate this effect from contribution of firm and issue specific variables four separate
regression models have been built. Model 1 includes only the control variables. Model 2
combines the control variables with the board structure components of corporate
governance while Model 3 replaces board composition with ownership variables. These
help to bring out the effects of two broad dimensions of governance and thus compare
their explanatory power. Model 4, the final model, integrates all the control and
governance variables together with the quadratic forms of variables for their plausible
non-linear relationship with dependent variable.
Deriving support from past literature, control variables have been included in the study
for their ability to influence the initial day listing returns and these have been included in
Model 1. These variables overall explain 32% of the total variations in dependent
variable with subscription ratio, issue size and issue price being significant in all four
models. The variable subscription ratio is positive and significant at 1% level of
significance indicating that higher subscription ratio reflects the demand for the issue
which is perceived as a signal of good quality and thus better performance of the issue
and higher returns. This relationship is consistent with Chahine and Tohme (2009) and
Chen and Yang (2013) indicating that investors contemplate this as a measure of firm’s
ability to garner higher demand based on its credentials. Issue size also regarded as offer
size reflects a negative and statistically significant relationship to underpricing leading to
the inference that firms with larger issue size are less underpriced in contrast to those

Relationship Between Corporate Governance Variables and Listing Performance of Indian IPOs
198
having a smaller issue. These findings lie in line with observations made by Hearn (2013)
in Sub Saharan Africa and Li (2005) in Chinese IPO market which confirm that firms
with larger offerings contribute to diluting the uncertainties and extenuating the
apprehensions of investing community. Certo et al. (2001a), however, have empirically
proven positive relationship of offer size to underpricing (for developed and mature IPO
markets of USA) which can be attributed to differences in institutional set ups and
maturity of the markets. Issue price (transformed as its inverse to better decipher the
relationship) shares a positive significant relationship with underpricing contradicting the
findings of Li (2005) and Be’dard et al., (2008). The findings here seem to suggest that
the price at which a firm offers shares is perceived as inherent ability of the firm to
command premium for its issue and only firms with stronger credentials can dare to price
its product in higher grade which works in addressing the uncertainties of investors.
Thus, higher issue price results in lesser costs associated with information asymmetry and
agency and as a result firms underprice less than otherwise they do to compensate their
investors for risks which they associate with firm and their issue.
Listing delay which measures the lapse between issue and listing dates gives no
significant results and the findings are found to be in sync with the findings with regards
to Chinese IPO market (Li, 2005 and Ching-Yi Lin, 2005). The negative sign of the
listing delay coefficients leads to conclusion that longer gap in listing results in lower
underpricing possibly because the gap helps investors to bridge the gaps in information.
Natural logarithmic transformations of age of the firm and total assets have been
incorporated in the model as other control variables and both of these are found to be
insignificant though opposite in direction of relationship. The coefficients for IPO age are
positive in all models sharing consistency with relationships found by Mitchell et al.
(2008) in Singapore, Mnif (2010) in France, Yatim (2011) in Malaysia and Hearn (2012)
in Sub Saharan Africa suggesting that firms with longer standing in markets tend to
dispel the apprehensions and uncertainties of investors but this lacks statistical
significance. Results for total assets show negative association with underpricing across
all models but this association lacks significance which is supported by previous findings
highlighting same nature of relationship (Ching-Yi Lin, 2005; Be’dard et al., 2008;

Relationship Between Corporate Governance Variables and Listing Performance of Indian IPOs
199
Hearn, 2011; Chen and Yang, 2013). Larger asset base of the issuing firm has been found
to be reducing the extent of underpricing amongst the Indian firms.
Of the six firm variables incorporated in the multiple regression model, subscription ratio,
issue size and issue price are found to be statistically significant across all models. The
model with these variables is found to be robust making the regressions meaningful and
reliable. On the same lines, these variables are regressed with market adjusted excess
returns as dependent variable and the results obtained are similar to those with raw
returns which have been presented in Table 6.20. Model 1 in Table 6.20 is also robust
and explanatory power of these variables is again 32% reflecting that results are akin to
unadjusted returns of listing day. For MAER, the relationship of these control variables
lie in the same direction and share same statistical significance and thus are governed by
the logical support provided above.
Moving on to the variables of interest, corporate governance attributes which form the
focus of study are studied in next models. The governance attributes have been studied as
those relating to board structures and others dealing with ownership measures. To bring
out their effects and sift out the influence of each, these have been introduced in separate
models with control variables. Model 2 includes board composition attributes along with
the control variables while Model 3 replaces the board components with ownership
measures. Results are overall found to be robust across all models as suggested by the
statistically significant F-values.
Board size, introduced as an important component of board structures is found to be
significant and positive in Model 2 and in the cumulative Model 4. This signifies that
board size is an important consideration for investors in India. From the market’s point of
view, investors may perceive a large board as a signal of high degree of monitoring and
effective decision making and intention of firms to protect the interests of shareholders
by appointing more members on firm’s board. Within the signaling theory framework,
this also signifies that high-quality IPO firms may choose larger boards to communicate
its quality and credibility to potential investors. This relationship finds its support from
the works of Li and Naughton (2007), Mnif (2010) and Hearn (2011) lying in
contradiction to Carter et al. (1998a), Certo et al. (2001a), Darmadi and Gunawan (2012).

Relationship Between Corporate Governance Variables and Listing Performance of Indian IPOs
200
Table 6.19: Relationship between Corporate Governance Measures and Initial Unadjusted Returns
Independent Variables Model 1 Model 2 Model 3 Model 4
Constant 31.704
(2.044)** -20.883 (-0.778)
75.091 (1.283)#
7.214 0.106
Subscription Ratio 1.167
(11.568)*** 1.106
(11.269)*** 1.196
(11.224)*** 1.142
(11.064)***
Log (Issue Size) -7.059
(-2.190)** -7.314
(-2.303)** -7.968
(-2.360)*** -8.566
(-2.547)***
1/Issue Price 509.105
(2.383)*** 427.342
(2.056)** 530.750
(2.470)*** 450.280
(2.200)**
Listing Delay -0.0163 (-0.072)
-0.038 (-0.174)
-0.018 (-0.080)
-0.038 (-0.179)
Log (IPO Age) 4.744
(0.5580) 10.609
(1.436)# 6.201
(0.720) 11.534
(1.407)#
Log (Total Assets) -2.104
(-1.028) -2.489
(-1.241) -1.635
(-0.799) -2.162
(-1.079)
Board Size 2.217
(2.147)**
2.775 (2.768)***
Board Committees 78.705
(3.147)***
77.125 (3.117)***
Independent Directors 0.2428
(1.1057)
0.315 (1.407)#
Women Directors -2.217
(-0.4575)
-3.600 (-0.696)
Average Age of Board 0.0452
(0.1009)
0.183 (0.4022)
Related Board Members -1.924 (1.388)
-2.271
(-1.499)
Other Directorships 0.0523 (1.046)
0.055
(1.076)
Promoter Ownership 2.131
(2.805)*** 2.364
(2.904)***
Block Shareholders -1.391
(-0.663) -0.168
(-0.079)
Top 10 Ownership -3.310
(-2.561)*** -3.661
(-2.659)***
Promoter Ownership Squared -0.014
(-2.663)*** -0.016
(-2.742)***
Top 10 Ownership Squared 0.022
(2.687)*** 0.025
(2.865)***
R2 0.3337 0.3511 .3442 .3743
Adjusted R2 0.3234 0.3278 .3318 .3427
Number of Observations 395 377 394 376
F Statistic 32.392*** 15.107*** 18.744*** 11.864***
Note: One*, two** and three asterisks*** indicate statistical significance at the level of 10%, 5% and 1%, respectively. T-statistics are provided in the parentheses.

Relationship Between Corporate Governance Variables and Listing Performance of Indian IPOs
201
Table 6.20: Relationship between Corporate Governance Measures and Initial Market Adjusted Excess Returns
Independent Variables Model 1 Model 2 Model 3 Model 4
Constant 30.426
(2.010)** -18.765 (0.707)
75.625 (1.320)
10.475 0.159
Subscription Ratio 1.135
(11.739)*** 1.082
(11.343)*** 1.161
(11.444)*** 1.114
(11.191)***
Log (Issue Size) -5.991
(-1.910)** -5.834
(-1.925)** -6.777
(-2.066)** -6.930
(-2.173)**
1/Issue Price 495.783
(2.376)*** 435.751
(2.176)** 517.046
(2.455)*** 458.827
(2.323)**
Listing Delay -0.075
(-0.368) -0.094
(-0.478) -0.076 (0.380)
-0.094 (-0.491)
Log (IPO Age) 4.502
(0.538) 10.492
(1.461)# 5.911
(0.695) 11.456 (1.569)
Log (Total Assets) -2.563
(-1.277) -2.994
(-1.542)# -2.147
(-1.070) -2.716
(-1.403)
Board Size 1.692
(1.682)**
2.211 (2.264)**
Board Committees 70.193
(2.768)***
68.586 (2.759)***
Independent Directors 0.239
(1.092)
0.308 (1.378)
Women Directors -2.032
(-0.432)
-3.264 (-0.652)
Average Age 0.053
(0.123)
0.183 (0.412)
Related Board Members -1.629
(-1.200)
-1.942 (-1.311)
Other Directorships 0.048
(0.969)
0.051 (0.995)
Promoter Ownership 1.892
(2.540)*** 2.106
(2.646)***
Block Shareholder Ownership -1.044
(-0.518) 0.141
(0.070)
Top 10 Ownership -3.144
(-2.489)*** -3.429
(-2.543)***
Promoter Ownership Squared -0.013
(-2.424)*** -0.014
(-2.508)***
Top 10 Ownership Squared -0.021
(2.613)*** 0.023
(2.740)***
R2 0.3357 0.3506 0.3506 0.3713
Adjusted R2 0.3254 0.3273 0.3318 0.3395
Number of Observations 395 377 394 376
F Statistic 32.595*** 15.034 18.695*** 11.680***
Note: One*, two** and three asterisks*** indicate statistical significance at the level of 10%, 5% and 1%, respectively. T-statistics are provided in the parentheses.

Relationship Between Corporate Governance Variables and Listing Performance of Indian IPOs
202
The findings find theoretical support in the propositions of Pfeffer (1972) based on
resource dependency theory. In Indian markets, therefore, larger board size is used as a
signal and is perceived as a positive signal by investors thus drawing them towards the
new issue. It, however, can also be conjectured that larger boards act to reduce
coordinative efficiency and effective communication between directors and accentuate
the problem of asymmetric information and agency issues which is reflected in higher
underpricing.
Board committees constituted for effective decision making and enhancing the
effectiveness of boards are also found to have a highly significant (at 1% level of
significance) and positive association with the dependent variables (both raw returns and
market adjusted excess returns). The investigation of board committees as a component
of governance mechanism and its relationship to initial underpricing is rather limited in
literature and thus calls for more empirical efforts. Findings here, however, are in line
with results of Hearn (2011 and 2012) which relate to African markets. From signaling
perspective, the number of board committees do work as signals for new issue firms, in
the light that larger number of committees reflects the voluntary initiatives by firms as
regulations specify two committees as mandatory and third as non-mandatory. Increase in
quantum of underpricing with larger number of board committees, on the other hand, also
can be taken to indicate shortcomings in application of corporate governance
mechanisms. As Hearn (2011) explains that establishment of committees being deemed
superfluous and tend to lack in genuine independence. His explanations tend to hold true
for world markets marked by weak levels of legal enforcement and Indian markets have
provided many reasons to be a fit case for it. Board independence or proportion of
independent directors is next pertinent attribute of corporate governance which has been
included in many studies only to provide equivocal results. Percentage of independent
directors has a positive association with level of underpricing as measured on listing day
though this relationship does not have statistically significance. Board independence does
not seem to be adopted as an indicator of issue quality by the investors in Indian IPO
market which may be because board independence remains a contentious issue more so
in the light of serious corporate gaffes in the recent past. Denis and McConnell (2003)
and Dahya and McConnell (2005) had proven that higher proportion of outside directors

Relationship Between Corporate Governance Variables and Listing Performance of Indian IPOs
203
does not assure better performance. Li and Naughton (2007) and Yatim (2011) also found
the positive but insignificant impact of board independence on IPO underpricing in the
markets chosen for study. Gender diversity on boards has not been directly investigated
with regards to IPO underpricing and thus support on this account is almost non-existent.
It is expected that more women on boards would imply adding more sensitivity to
corporate issues and this is expected to contribute to effectiveness and thus reduce
underpricing. The coefficient for percentage of women directors is negative implying that
higher percentage of women tends to decrease levels of underpricing and vice versa but
lack of statistical significance of the coefficient does not leave the issue settled. For
Indian markets, women directors does not qualify as a signal of monitoring though it
could be because of women being a rare sight on boards and thus investors not attaching
value to this parameter in their investment decision.
Age of board members is also expected to have an influence on monitoring capabilities of
the new issue firms and thus on pricing performance of IPOs. The variable is found to be
insignificant across both Model 2 and Model 4 refuting its role as important governance
attribute and its effect on underpricing, the dependent variable as checked for by Wu and
Hsu (2012) only to be found insignificant. Positive direction of relationship, though,
points out that younger boards result in lower underpricing levels indicating that mature
boards are taken as indicators of good quality of board and firm’s potential to perform.
The variable has hardly been covered in the governance attributes in earlier research
works on the subject and thus calls for comprehensive and thorough analysis in the light
of non-existent literature and insignificance of coefficients. Related board members does
constitute an essential attribute in study of board structures given the practice of family
controlled businesses resulting in family dominated boards, especially in Indian settings.
Lack of research in Indian context on specific issue of governance and underpricing
leaves this as an untouched dimension of governance literature. The coefficient for
related members is negative though only loosely significant (in Model 3 at 20%)
signifying that larger number of relatives on boards tends to reduce quantum of
underpricing providing support for alignment of interests hypothesis in contrast to
entrenchment tendencies. The lack of statistical validity of these results, however, does
not enable reaching a firm conclusion.

Relationship Between Corporate Governance Variables and Listing Performance of Indian IPOs
204
Board reputations measured through interlocking directorships of non-executive directors
is found to be positively related to underpricing consistent to the results of Yatim (2011).
This seems to be also supporting the argument of Filatotchev and Bishop (2002) who
argued that outside board memberships create a negative impact on the investors’
assessment of firm quality although insignificance of these coefficients fail to lend
complete support to the argument. These findings stand in contrast to conclusions drawn
by Thorsell and Issakson (2014) which prove a positive and significant relationship
between interlocking directorates and underpricing for Sweden IPOs. Model 2 including
board structure variables is a statistically significant model and explains almost 33
percent of the quantum of underpricing. Amongst these variables board size and board
committees are found to be significant providing explanations to the phenomenon and
support the behavior of this pricing anomaly with the help of signaling theory and related
agency and information asymmetry hypotheses. The contribution of board variables to
the model when checked through the adjusted R2 is very negligible (0.44 percent increase
in adjusted R2) indicating that to Indian investor board composition does not seem to
matter much.
For MAER as dependent variable, the adjusted R2 value is almost the same as for raw
returns and the relationship of individual variables to the adjusted underpricing shows no
difference to the patterns observed for raw returns. Model 2 in Table 6.20 denoting
control and board structure variables is significant and robust with N standing at 377
IPOs. When compared to the raw returns model the contribution of board variables is a
notch lower (0.20 percent increase in value of R2 from the value in Model 1). The
justifications and supports built for RR model hold true for regressions run with MAER
as the results do not come up with any remarkable differences in direction and nature of
relationships. The conclusion that board variables do not qualify as significant explainers
to underpricing phenomenon and negligible consideration by investors while making
their investment decision stand very much true here also.
Model 3 introduces the ownership variables, other component of governance methods
together with the control variables. Ownership by promoters is included as a measure of
family ownership by the founders of the concern which is likely to impact performance of

Relationship Between Corporate Governance Variables and Listing Performance of Indian IPOs
205
IPOs under the influence of family interest protection (Shleifer and Vishny, 1997) and
alignment of interests (Fama and Jensen, 1983) hypotheses. With the clues of
operationalization of both these hypotheses and in accordance with Chahine (2004)
efforts to check non-linearity of promoter ownership have been made through
introduction of the square term. The significance of coefficients at 1% level of
significance for promoter ownership and its squared term confirm the existence of non-
linear relationship of this ownership attribute to underpricing. The significant coefficients
highlight the signaling potential of this ownership variable confirming that investors do
discount this attribute while putting in their money into a new issue. The curvilinear
relationship explains that increasing ownership levels do address the concerns of
information asymmetry and associated uncertainties but at higher levels of family
ownership the concerns for entrenchment and sacrificing general interests for self-
interests start dominating. Other two ownership measures relate to concentrated
ownership expressed through block shareholders and total shareholding of top 10 owners.
These again are largely governed by the two hypothesis mentioned above. Howton et al.
(2001), Fan et al. (2007) and Hearn (2012) proved the existence of negative relationship
of measures of ownership concentration with underpricing and same has been observed
for the present study. The negative relationship between underpricing and levels of block
shareholders provides some indication of the role of block holders in corporate
governance and its enforcement within firms in countries with weaker levels of investor
protection. However, not being statistically significant the relationship does not lead to a
concrete conclusion on this account. Total shareholding of the top 10 shareholders of the
IPO firm, a reflection of extent of concentrated ownership levels, shares a large, negative
and statistically significant relationship at 99% confidence level and remains strongly
significant for the square term as well confirming the existence of non-linear relationship.
The results find support in the findings of Chen and Yang (2013) in Chinese markets
though the results there lacked statistical significance. The exploration of this measure
holds higher eminence for Indian markets where family controlled firms and concentrated
ownership patterns are pervasive. The results confirm the role of ownership patterns in
mitigating information asymmetry and diluting the concerns of uncertainty dominant
among potential investors. Though this relationship does not confirm linearity indicating

Relationship Between Corporate Governance Variables and Listing Performance of Indian IPOs
206
that with higher ownership concentration underpricing does decrease but after a point it
starts working in opposite direction indicating that beyond a level the concentrated trends
of ownership accentuate new issue problems and hence larger extent of underpricing.
Ownership variables when regressed against the MAER as shown in tabulations in Table
6.20 also confirm significance of promoter ownership and cumulative ownership of top
10 shareholders at 1% significance level and evidence of quadratic relationship of these
variables to underpricing levels. The model confirms to test of robustness and gives
results for the sample size of 394. Overall, the results in no way contradict the findings
noted with respect to raw returns rather corroborate the results showing that market
movements have not been very drastic on either side to bring changes to variables, their
coefficients and significance of these coefficients. Model 3 and its variables, i.e. the
control and ownership variables together explain 33.18% variations (with both RR and
MAER) which is higher than the explanatory power of model with board structure
variables (which was 32.7%). When analyzed for individual effects, the influence of
ownership variables is higher and stronger than board structure variables though the
difference lies of a few basis points only.
To build a comprehensive model and to reflect the aggregate effects of corporate
governance attributes Model 4 is constructed where all corporate governance variables
together with the controls identified have been introduced. The regression model is found
to be a good fit at 99% confidence and qualifies the tests of robustness. The adjusted R2
value of 0.34 (for both RR and MAER) shows that the variables explain 34% of
variations in the model which is better in its explanatory power when compared to
previous literature reportings (Certo et al., 2001a; Filatotchev and Bishop, 2002; Mnif,
2010; Chahine et al., 2011; Hearn, 2011; Yatim, 2011; Wu and Hsu, 2012; Darmadi and
Gunawan, 2012) where the reported R2 was maximum 20% for regression models
employing governance attributes to explain underpricing levels for different economic
and institutional settings. The overall conclusion, however, which resonates in majority
of the past findings remains that the explanatory power of governance mechanisms with
regards to initial pricing performance remains low the reasons for which need to be
further explored in respect of different market set ups for concrete inferences.

Relationship Between Corporate Governance Variables and Listing Performance of Indian IPOs
207
6.8 CONCLUSION
The primary purpose of this chapter is to study the relationship of listing day
underpricing with the corporate governance attributes of IPO firms when they go public.
Explanations to the underpricing phenomenon which have been diverse and
comprehensive in literature yet equivocal are sought through corporate governance
mechanisms which the firm puts in place at the time of reaching out to the investors.
Investigations made in the study confirm the existence of underpricing regarded as an
anomaly necessitating the need for understanding the reasons from newer perspectives.
IPO investors garner positive returns on listing day indicating mispricing of the securities
in the light of their market performance. Evident diminution in severity of underpricing is
noticed over the years in the quest for efficient markets in the wake of global
competition. Probing the differences in structuring of firms with positive and negative
returns, no differences are noticed across governance attributes. This indicates that
positive and negative return firms do not differ on account of their board structures and
ownership patterns rather differences lie in other factors which can be dug into through
separate explorations. In finding explanations to underpricing using governance
mechanisms, board size comes out as a significant variable confirming as a signal to
investors of the firm quality. The results also indicate a tendency of larger boards to result
in higher underpricing which creeps up from coordination problems resulting in increased
costs. Board committee is the only other board variable which presents explanations to
high initial returns with the logic of working as a signal for investing community.
Positive relationship of this variable to underpricing also raises doubts as to lacking
genuine independence especially in Indian contours which are proven to be characterized
by weak governance. Results confirm to a non-linear relationship shared by promoter
ownership and ownership by top 10 owners w.r.t. initial returns of IPOs. The signaling
potential of these ownership variables is confirmed highlighting that ownership and
control of new issue firms is an important consideration for the investors when taking the
investment decision. Another fact which surfaces from these results is that higher
ownership with the promoters does dispel uncertainty and problems of information
asymmetry but at higher levels tendencies of entrenchment of interests become evident.
Findings confirm to tendencies of concentrated ownerships in Indian markets but at

Relationship Between Corporate Governance Variables and Listing Performance of Indian IPOs
208
higher levels of concentration underpricing tends to increase in contrast to that at lower
levels. These confirm that both alignment of interest and entrenchment hypothesis work
in conjunction at different levels of ownership with their allied benefits and costs in terms
of initial returns.
The regression models stand the tests of robustness and confirm to past findings. On the
whole, models incorporating governance parameters explain 34% of variations in initial
returns of the IPOs as on listing day. A major portion of this variability is, however,
attributed to control variables introduced on the lines of past literature. Corporate
governance measures have a miniscule contribution (only 2%) indicating the emphasis
and attention on these dimensions in initial offers is not enough and thus investors do not
incorporate these as a major consideration in their investment decision. There is
confirmation of the fact that these do qualify as signals which are frantically resorted to at
the time of IPO by the issuers but need is to integrate these into decision criteria by
emphasizing on governance both in letter and spirit. Explanatory power of these
governance measures can definitely be enhanced when governance parameters evolve as
distinguishing criteria amongst firms and investors realize their worth and their potential
to help a firm perform better. Better governed IPOs should definitely perform better and
this realization on the part of Indian investors can add to the eminence of governance
mechanisms as effective signals and evolve as a basis for better performance.