reinvigorating springfield’s economy: lessons from
TRANSCRIPT

No. 09‐6
Reinvigorating Springfield’s Economy:
Lessons from Resurgent Cities
Yolanda K. Kodrzycki and Ana Patricia Muñoz
with Lynn Browne, DeAnna Green, Marques Benton, Prabal
Chakrabarti, David Plasse, Richard Walker, and Bo Zhao
Abstract:
As part of the Federal Reserve Bank of Boston’s commitment to supporting efforts to
revitalize the economy of Springfield, Massachusetts, this paper analyzes the economic
development approaches of other mid‐sized manufacturing‐oriented cities during the
past half century. From among a comparison group of 25 municipalities that were similar
to Springfield in 1960, the study identifies 10 “resurgent cities” that have made substantial
progress in improving living standards for their residents, and that are recognized as vital
communities in a broader sense by experts on urban economic development and policy.
These case studies suggest that industry mix, demographic composition, and geographic
position are not the key factors distinguishing the resurgent cities from Springfield.
Instead, the most important lessons from the resurgent cities concern leadership and
collaboration. Initial leadership in these cities came from a variety of key institutions and
individuals. In some cases, the turnaround started with efforts on the part of the public
sector, while in other cases nongovernmental institutions or private developers were at
the forefront. Regardless of who initiated the turnaround, economic redevelopment
efforts spanned decades and involved collaborations among numerous organizations and
sectors.
JEL Classifications: R0, N0
Yolanda Kodrzycki is a senior economist and policy advisor and Ana Patricia Muñoz is a research associate at the Federal Reserve Bank of Boston. Their email addresses are, [email protected], and [email protected], respectively. This paper was produced in collaboration with the other
members of the Federal Reserve Bank of Boston project “Toward a More Prosperous Springfield,
Massachusetts.”
The authors are grateful to Teresa Huie and Catherine Spozio of the Federal Reserve Bank of Boston for
extensive research assistance and to external experts for sharing their knowledge of individual cities.
This paper, which may be revised, is available on the web site of the Federal Reserve Bank of Boston at http://www.bos.frb.org/economic/ppdp/index.htm.
The views expressed in this paper are solely those of the authors and not necessarily those of the Federal Reserve Bank of Boston or the Federal Reserve System.
version of: October 1, 2009

1
The City of Springfield’s economic position has eroded over the past five decades. In
1960, Springfield’s median family income was slightly higher than the national average. By the
mid‐2000s, median family income had decreased to only about two‐thirds of the national
average. Springfield’s poverty rate went from being a little below average in 1980 to over twice
the U.S. average in recent years. To some extent, this deterioration in living standards in
Springfield reflects the forces of deindustrialization and suburbanization that challenged many
city economies during these decades. However, these nationwide forces do not fully account
for Springfield’s decline. As an earlier Federal Reserve Bank of Boston discussion paper noted,
Springfield’s economy worsened relative to other mid‐sized manufacturing‐oriented cities.1
Although Springfield’s economic position was in line with its peer group in the 1960s, by 2005–
07, its median annual family income had fallen to nearly $4,000 below the peer‐city average and
its poverty rate had risen to 4 percentage points above that level.
This paper offers lessons from other mid‐sized manufacturing‐oriented cities that have
reinvigorated their economies more successfully than Springfield. We refer to these
municipalities as “resurgent cities.” This term means that these cities have made substantially
more progress than other cities with similar challenges and opportunities in improving living
standards for their residents, and are recognized as vital communities in a broader sense by
experts on urban economic development and policy. To be sure, these cities continue to struggle
with a variety of problems, many of which have become more acute with the nationwide
recession that started in late 2007.
Drawing a dividing line between resurgent and nonresurgent cities ultimately involves
making judgment calls, as many if not all of the cities can point to examples of successful
programs and aspects of economic and social improvement.2 On the whole, however, we
believe the cities designated as resurgent offer meaningful lessons to Springfield and the other
remaining mid‐sized manufacturing‐oriented cities. To our knowledge, the approach of
examining cities with a similar starting point is a new way of analyzing Springfield’s
development.3
1 See Browne, Green, et al. (2009). 2 For interesting examples of similarities and differences in expert opinions and statistical measures of urban success,
see Wolman, Hill and Furdell (2000). 3 For example, The MassINC Springfield Economic Growth Initiative makes use of a comparison city definition that
was developed for the Brookings Institution by Furdell and Wolman (2006). Furdell and Wolman start by focusing
on 302 cities that met at least one of the following criteria in either 1990 or 2000: (1) population of at least 50,000 and
primary city in metropolitan area; (2) population equal to at least 50 percent of the population of the primary city in
the metropolitan area; and (3) population of at least 150,000. The 65 “weak market” cities, which include Springfield,
were those that fared poorly in terms of economic growth during the 1990s (measured by employment, payroll, and

2
The research strongly suggests that industry mix, demographic composition, and
geographic location are not the key factors distinguishing the resurgent cities from Springfield.
Therefore, the erosion of Springfield’s economic position relative to its peer cities has been due
mostly to other factors. Identifying these other factors and taking the appropriate actions is
likely to increase Springfield’s chances of reaching its economic potential.
The most important lessons from the resurgent cities concern leadership and
collaboration. Initial leadership in these cities came from a variety of key institutions and
individuals. In some cases, the turnaround started with efforts on the part of the public sector,
while in other cases nongovernmental institutions or private developers were at the forefront.
In all cases, the instigators of revitalization in the peer group cities recognized that it was in
their own interest to prevent further deterioration in the local economy, and they took
responsibility for bringing about improvement. Regardless of who initiated the turnaround,
economic redevelopment efforts spanned decades and involved collaborations among
numerous organizations and sectors. These joint efforts involved creating new, distinct entities.
The names of the collaborations in the various peer cities provide a sense of their central focus:
“Economic Development Corporation,” “Growth Alliance,” “Civic Federation,” “Center for the
City,” and “UniverCity Partnership,” for example.
The stories of the resurgent cities involve fundamental shifts in local economies and
human and physical infrastructure. Mid‐sized cities that were once known for manufacturing
items ranging from refrigerators and home furnishings to jewelry and cigarettes have earned
new identities. Many have turned to more technology‐related forms of manufacturing for part
of their transformation. All of the cities have diversified their economic base away from the
manufacturing sector. Among the peer group are places now being called the “Renaissance
City,”“Wall Street West,” “Most Intelligent Community,” and “All‐American City.”
In addition to feeling the recent blows from a nationwide recession and financial crisis,
the resurgent cities continue to face the challenges of providing quality education and training
to broader segments of their populations and extending the benefits of resurgence to more of
their neighborhoods. Their efforts along these lines are multifaceted, but they often involve key
initiatives on the part of educational institutions and foundations.
Springfield’s Peer Cities and Why They are Relevant
Figure 1 shows the locations of the 25 cities chosen for Springfield’s peer group. In 1960,
27 percent of all U.S. workers had manufacturing jobs, almost as high a share as in the
number of establishments) and economic well‐being of city residents in 2000 (measured by per capita income,
median household income, poverty rate, unemployment rate, and labor force participation rate).
3
immediate aftermath of World War II. The large concentration in manufacturing provided
employees with good access to what are now referred to as “middle‐class jobs.” All of the peer
cities relied more heavily on manufacturing than the nation as a whole. Some 30 percent or
more of the employed residents of each city worked in the manufacturing sector in 1960, with
an average concentration of 38 percent.4 Manufacturing’s share of employment remained at
least 20 percent in 1980 in each of the comparison cities.
Within this peer group, Springfield’s reliance on manufacturing employment was closer
to the bottom than the top (Figure 2). The city’s manufacturing employment share was about
one‐third in 1960—similar to the share in places such as Jersey City (NJ), Fort Wayne (IN),
Providence (RI), and Grand Rapids (MI). On the high end, slightly over one‐half of all workers
living in Waterbury (CT), Flint (MI), and Gary (IN) were employed by manufacturing firms.
The share of manufacturing jobs nationally has decreased dramatically since the early
1960s and, in fact, the total number of people employed in the U.S. manufacturing sector is lower
now than it was then. In addition, manufacturing work has shifted increasingly to suburban
areas, making it that much harder for city residents to access these jobs.5 And although current
average pay levels in some other industries with urban locations (such as finance and
professional and technical services) are now as high as or even higher than pay in
manufacturing, the educational and skill requirements for obtaining such jobs are in many cases
quite different from those in the manufacturing industry. Thus, in addition to the loss of
manufacturing jobs, the peer group cities have faced greater‐than‐average challenges related to
preparing their residents for new types of work. In‐migration of individuals and families with
low levels of schooling or other training has further compounded these problems. Finally, the
process of adjusting to job losses in manufacturing has arguably been harder than the
adjustment to losses in some other sectors because many manufacturing plants were large.
Plant shutdowns and permanent layoffs in manufacturing have tended to cause sharp spikes in
local unemployment.
The choice of peer cities was based also on the role of the city in its region and on the
size of its population. Like Springfield, each of the other cities constitutes the primary urban
4 Many of the statistics in Decennial Censuses and other surveys refer to data as of the prior year. This study follows
common practice in ignoring slight discrepancies in timing across data from a single source. Thus, all information
from the 1960 Census, for example, is treated as if it pertained to the year 1960. 5 In the 1950s, 70 percent of all jobs in metropolitan areas of the United States were located in central cities; by 1990,
the central‐city share had dropped to 45 percent, and the nation was “approaching the time when ... only about 40
percent of MSA jobs [would] be located [in central cities].” See Mieszkowski and Mills (1993). For the mid‐2000s, a
recent study found that only 21 percent of all metropolitan‐area jobs were located within three miles of the central
business district. For manufacturing, the share was even smaller, 14 percent. See Kneebone (2009).

4
center of its respective metropolitan area.6 Most had between 100,000 and 250,000 residents
from 1960 to 1980, although a few started with larger populations in 1960 before shrinking in
size.
In contrast to its below‐peer‐group‐average reliance on manufacturing, Springfield’s
1960 population of 174,000 placed it in the upper half of the peer group, and similar in size to
Gary and Grand Rapids (Figure 3). The largest city in terms of population was Rochester (NY),
with just over 300,000 inhabitants. Other cities with more than 200,000 residents were Akron,
Jersey City, Dayton, Syracuse, and Providence. The smallest cities in the peer group—with
fewer than 110,000 residents—were Peoria (IL), Waterbury, and Allentown (PA).
As shown below, none of the peer cities with over 40 percent dependence on
manufacturing in 1960 has yet achieved resurgent status. By contrast, size in and of itself is
considered neither an advantage nor a disadvantage in economic adjustment. The logic is more
that a mid‐sized city that constitutes the primary urban center of its region faces a somewhat
different array of challenges and opportunities than a city that is substantially different in scale
or has strong, geographically induced ties to a large city.7
Large cities often are home to prominent businesses and institutions that have ample
financial and civic capacity, and that attract or spin off other enterprises. Small‐to‐medium‐
sized municipalities located on the fringes of such large cities may find themselves benefiting
from these spillovers—or, on the other hand, suffering if the nearby large city falls into
economic decline.
Small cities may benefit from having cohesive social networks that facilitate public
decision‐making. By contrast, medium‐sized cities often have diverse populations. Reaching
consensus may be difficult when residents have different backgrounds and life experiences. On
the other hand, diversity can be a strength. Valuable in themselves, differing perspectives and
skills may foster innovation and creativity, and may offset the tendency to build a city economy
centered on a single dominant industry or institution.
Defining Resurgence
Although the 25 peer cities were quite similar to one another and to Springfield in 1960,
their paths have since diverged. Broad measures of the economic well‐being of residents plus
other information on community vitality drawn from a wide range of reports, books, and
6 The specific concept used is the metropolitan statistical area (MSA), defined by the U.S. Office of Management and
Budget. 7 For a more extensive discussion of the role of city size in economic development, see Fox and Axel‐Lute (2008).

5
newspaper articles were used to characterize the cities. This study concentrates on examining
long‐term trends, as opposed to more temporary developments associated with business cycles.
As a first cut, resurgent cities were defined as those showing better performance than
Springfield in each of the following respects as of the mid‐2000s:8
Median family income
Change in median family income ranking since 1960
Poverty rate
Percentage point change in poverty rate since 19809
Percent change in population since 1960.
Median family income measures the financial resources of the typical family, while the
poverty rate provides an indication of the share of residents who have difficulty satisfying even
basic living needs. Both measures are related to the availability and quality of jobs for city
residents. Population change is included as a secondary factor. A declining population
indicates that a city offers inadequate economic opportunities or amenities to retain its
residents, let alone attract new residents. Cities with population losses have difficulty raising
enough own‐source revenues to fund public services.
Three of the cities ultimately selected for the resurgent category—Providence, New
Haven, and Evansville—actually had population losses from 1960 to the mid‐2000s slightly
larger than Springfield’s, but there was ample other evidence of their successful transformation.
Providence and Evansville, for example, have shown major improvements since 1960 in median
family income relative to the other cities. Among other indicators of success, New Haven has
gone from having one of the highest crime rates in the 1970s to having one of the lowest in the
2000s. In general, all three of these cities appear to have more positive reputations in the media
and in various urban comparisons than Springfield.
On the other hand, Bridgeport outperformed Springfield according to all of the
statistical selection criteria other than population change. The City of Bridgeport was forced to
8 Most of the historical statistics used in this study are drawn from decennial Censuses, including the information
obtained through sampling U.S. households. In the 2000 Census, for example, one of every six households received
the “long form” which required them to answer detailed questions on social, economic, and housing characteristics in
addition to the basic questions asked of all households on age, sex, race, Hispanic origin, household relationship, and
owner/renter status. Starting in 2005, the Bureau began to administer the American Community Survey (ACS) in
order to collect detailed information of the sort previously obtained from the long form. The most recent data for
Springfield and the comparison cities are published in two forms. The 2007 ACS 1‐year estimates describe average
characteristics for calendar year 2007, while 2005–2007 ACS 3‐year estimates describe average characteristics for the
period of calendar years 2005, 2006, and 2007. This study relies on the 2005–2007 ACS 3‐year estimates because they
are based on larger samples and therefore contain less sampling error. 9 The 1980 Census was the first to measure population poverty rates.

6
declare bankruptcy in 1991, but has since seen substantial economic development. It was
excluded from the resurgent city category because of ongoing serious social issues. In
particular, Bridgeport’s low educational attainment, high crime rate, and governance problems
continue to detract from its overall reputation.
Measuring Success
Table 1 shows the key economic indicators for all the peer cities. The resurgent cities are
shown at the top: Evansville (IN), Fort Wayne (IN), Grand Rapids (MI), Greensboro (NC), Jersey
City (NJ), New Haven (CT), Peoria (IL), Providence (RI), Winston‐Salem (NC), and Worcester
(MA). Figure 4 summarizes these indicators, comparing the data for Springfield to the averages
for the resurgent cities and the averages for the remaining cities.
As alluded to in the introduction, median family income in Springfield fell from 106
percent of the U.S. median in 1960 to only 65 percent in 2005–07.10 Consequently, 17 cities had
higher median family income than Springfield in the mid‐2000s, up from only 12 in 1960. As a
group, the mid‐sized manufacturing cities have become less prosperous than the nation as a
whole. In 2005–07, the average median family income in the resurgent cities was $49,521, 18
percent lower than the U.S. median. Springfield’s median family income of $39,371 was similar
to the average for nonresurgent cities.
Springfield’s poverty rate has risen nearly 10 percentage points since 1960, from 18
percent to just under 28 percent. This is a far greater increase than in the resurgent city group (4
percentage points on average). Springfield also compares somewhat unfavorably with the
remaining cities in its share of poor residents. In 2005–07, the average poverty rate in the
nonresurgent cities was about 26 percent; among these cities, Akron, Allentown, Bridgeport,
Erie, Paterson, Rockford, South Bend, and Waterbury all had lower fractions of poor people
than Springfield.
On average, the resurgent cities had about 18 percent more residents in 2005–07 than in
1960. Springfield’s population fell 15 percent over this time period. The city’s population
decline from 1960 to 1980 was in line with the nonresurgent city average, but Springfield
suffered somewhat smaller population losses after 1980 than was typical in other nonresurgent
cities.
To some extent, the resurgent cities have been able to increase their populations and
median family incomes by adding adjacent suburban land. In fact, Table 1 shows that all of the
resurgent peer cities outside New England—but none within New England—have been able to
10 As noted in footnote 8, the three‐year period 2005–07 is used instead of a one‐year period (2005, 2006, or 2007) in
order to reduce sampling error.

7
grow through annexing adjacent land. In the case of Fort Wayne, which more than doubled in
acreage between 1960 and 2000, annexation was a conscious economic improvement strategy. In
general, however, it is hard to gauge the degree to which annexation was a cause—as opposed
to an effect—of population increase and economic growth.
Characteristics of Resurgent and Nonresurgent Cities
Before turning to more detailed accounts of how the resurgent cities came to differ from
Springfield, it is useful to examine certain additional summary characteristics of resurgent and
nonresurgent cities. This section of the study looks at region of the country, population,
industry concentration, race and Hispanicity, and crime. Doing so provides an initial indication
of whether Springfield faced unusually strong obstacles to success or pursued different industry
strategies than the more successful comparison cities.
The data indicate that successful transformation was only weakly linked to geography.
On the one hand, the group of 10 resurgent cities includes the two Southern peer cities,
Greensboro and Winston‐Salem, but none of the cities from Ohio, Pennsylvania, or New York.
Otherwise, however, except for tiny Rhode Island, each of the states represented in the
comparison group has both at least one resurgent city and at least one nonresurgent city. In
New England, New Haven, Providence, and Worcester have developed more successfully than
Springfield, Bridgeport, Hartford, or Waterbury. These findings suggest that although
statewide policies—such as North Carolina’s pro‐growth stance—may have been a factor in
easing economic adjustment, cities ultimately play an important role in determining their own
fates.
Economic resurgence was virtually uncorrelated with city population size. (See Table 1
and Figure 3, where the resurgent cities are depicted by darker bars and the remaining peer
cities by lighter bars.) Gary and Grand Rapids had almost identical populations in 1960, yet
their economic performance over the next five decades differed considerably. The same
conclusion applies to Hartford and Fort Wayne, or Erie and Evansville.
The clearest predictor of resurgence was initial manufacturing intensity (Table 2 and
Figure 2). None of the cities where over 40 percent of employed residents had manufacturing
jobs in 1960 has yet managed to make a successful transition to the “post‐industrial” economy.
Springfield, however, is one of the few cities in the comparison group—along with Syracuse
and Hartford—that has not yet made a successful transformation despite having had relatively
low reliance on manufacturing jobs in 1960. In other words, the fact that 34 percent of
Springfield’s employed residents held manufacturing jobs in 1960 may help to explain the city’s
current economic distress, but it does not explain why Springfield continues to lag behind its
peer cities.

8
In 1960, other sectors of urban economies provided far fewer jobs than manufacturing.
The second largest industry for the peer group cities was retail and wholesale trade, which
generally employed between 15 and 20 percent of resident jobholders (Table 2). Employment
shares in all of the remaining industries were in the single‐digits. Springfield had a greater
concentration of employment in finance, insurance, and real estate than any of the resurgent
cities except Jersey City, but the number of residents who worked in finance and related
industries in Springfield was less than one‐fifth of the number who worked in manufacturing.
Industry mix today
Table 3 shows employment patterns for peer city populations as of 2005–07.11 The
declining dependence on manufacturing is striking. On average, only about 14 percent of
residents of all the cities were employed in the manufacturing sector in the mid‐2000s. In the
comparison group, more residents worked in health care and social assistance than in
manufacturing. In addition, a number of other industries were major employers of urban
populations, especially retail trade, education, and leisure and hospitality. Industry
diversification has become the norm in both the resurgent and the nonresurgent cities.
Among the resurgent cities, there are some notable differences in industry mix,
suggesting variation in their economic development strategies. Jersey City residents are much
more likely to find work in financial and other professional services than residents of the other
resurgent cities. One‐fifth of New Haven’s employed adults work in the education sector.
Providence has a greater concentration of workers in the leisure and hospitality category
(including hotels, restaurants, arts, and entertainment) than the other cities shown. The four
relatively successful cities in the Midwest—Evansville, Fort Wayne, Grand Rapids, and
Peoria— have diversified away from manufacturing, but nevertheless remain somewhat more
dependent on manufacturing than their peers in other parts of the country.
Finally, the data on employment shares provide insights on how Springfield compares
with the other cities. The most striking difference is that 19 percent of Springfield residents are
employed in health care and social assistance. Among the resurgent cities, the average share is
under 15 percent, and the highest is 17 percent (in New Haven).
Springfield’s high reliance on health care and social assistance jobs is not necessarily
good or bad. However, it does suggest that the city may want to give some thought to
strategies that attract other types of employers to the city—or that improve residents’ access to
11 Data on industry composition by city are more detailed for 2005–07 than for 1960. In addition, industry definitions
changed when U.S. statistical agencies shifted to using NAICS (North American Industry Classification System)
rather than SIC (Standard Industrial Classification) codes to classify jobs. Reflecting changes in the economy, NAICS
codes provide more information on nonmanufacturing industries than was provided in SIC codes.

9
(or qualifications for) jobs in other sectors. Springfield residents are less likely to be employed
in the professional and business services sector or in educational services than residents of the
resurgent cities. Springfield’s employment shares in retail trade and manufacturing are also on
the low side.
Demographic changes: race and Hispanicity
No account of changes in the peer cities would be complete without mention of race and
ethnicity. In 1960, the peer group cities were not very different from the nation as a whole in
their racial composition. On average, whites comprised 87 percent of city populations,
compared with 95 percent of the national population. Now, however, the peer city populations
are much more racially mixed than many other parts of the United States. As of 2005–07, the
average city in the comparison group was 56 percent white and 44 percent nonwhite—that is,
people who characterized themselves as Black, Asian, or other races (Table 4). The mix for the
nation in 2005–07 was 76 percent white and 24 percent other racial categories.
As in most other medium‐sized manufacturing‐intensive cities in New England and the
Midwest, in 1960 over 90 percent of Springfield’s population was white. In 2005–07, Springfield
had a relatively low white share, 52 percent. Thus, like the nonresurgent cities on average,
Springfield has undergone a far more dramatic change in its racial composition over the last
five decades than the nation.
However, most of the resurgent cities also have experienced noteworthy changes in
racial composition. In 2005–07, their populations were 62 percent white, on average, and two of
the resurgent cities—Jersey City and New Haven—went from being over 85 percent white in
1960 to having nonwhite majorities in 2005–07. The change in racial mix in Providence over this
period was quite similar to Springfield’s.
Where Springfield differs most notably from its comparison group is in its ethnic
composition. About one‐third of Springfield’s population is Hispanic—roughly twice the
average shares of either the resurgent or the nonresurgent group, and higher than in any of the
resurgent cities except Providence (Table 5). Jersey City had the second highest share of
Hispanics among the resurgent cities in 2005–07. The presence of Hispanics in Jersey City is
more longstanding, however. In 1980, nearly one out of every five residents of Jersey City was
of Hispanic origin.
On balance, these findings suggest that Springfield officials should be particularly
interested in any steps that the peer cities have taken to improve the economic situations of
nonwhites and non‐Anglos. While not focusing primarily on issues of diversity and inclusion,
the overviews of resurgent cities below include some examples of pertinent initiatives.

10
Evidence on crime
Resurgent cities have done a much better job in reducing crime rates than the other peer
cities. While the average crime rate12 in 1975 was almost identical in the two groups, in 2007, the
crime rate in the average resurgent city was 17 percent lower (Table 6) than in the average
nonresurgent city. New Haven and Worcester went from having among the highest crime rates
among the comparison cities in 1975 to having among the lowest rates in 2007. In the resurgent
group, three cities had relatively high overall crime rates in 2007: Greensboro, Winston‐Salem,
and Grand Rapids.
Springfield’s relative position among the peer cities deteriorated. In 1975, its overall
crime rate was a little below average. In 2007, it was about 29 percent higher than the average
rate among resurgent cities and about 7 percent higher than among the other cities. Moreover,
the rate of violent crime in Springfield was the second highest among all the peer cities (behind
Flint, which had an exceptionally high prevalence of violent crime).
Resurgence in 10 Peer Cities
Having identified the resurgent cities and quantified key economic and social
differences between these cities and Springfield, the study now turns to case studies of
individual cities. It starts with a brief economic history of Springfield from 1960 to the present.
Similar accounts follow for each of the resurgent cities, focusing on their challenges and
economic development efforts. Figures 5 to 15 in the text highlight selected findings for each
city; Appendix Tables 1–6 contain detailed tables.
Readers who are interested only in an overview may wish to skip to the section on
“Lessons.” However, in doing so, they would miss fascinating stories of how individual cities
have dealt with their economic problems.
Springfield
Summary of challenges
Known as the “City of Firsts,” Springfield was for many years the center of a prosperous
two‐hundred‐mile industrial corridor in the Connecticut River Valley.13 Unfortunately, the city
has suffered a steep economic decline since the 1960s. The closures of the Springfield Armory14
in 1968 and the American Bosch metal fabrication factory15 in 1986 are just two examples of the
12 The crime rate is defined as total number of reported crimes per 1,000 population. 13 Forrant (2009). 14The United States Congress had decided to locate the federal armory in Springfield in 1794. 15 American Bosch opened in 1911 in Springfield’s North End. When the factory closed, 1,500 jobs were eliminated.
11
profound job losses in the city’s manufacturing sector. While some manufacturing plants
opened later on the outskirts of Springfield, these jobs are not as accessible to city residents.
Since the 1990s, the expansion in health care has filled some of the void produced by the
departure of industrial jobs, but the city continues to struggle with identifying and attracting
other potential sources of job growth within its borders. Springfield is home to several
important institutions of higher education, but has not made as much progress as many of its
peer cities in improving the educational attainment of its residents (Figure 5).
Springfield experienced a sharp decline in population from about 174,000 in 1960 to
152,000 in 1980. Since then, the number of residents has been relatively stable but their
demographic composition continues to change. As noted earlier, in 2005–07, whites accounted
for just over one‐half of Springfield’s population while Hispanics, the fastest‐growing segment,
represented one‐third.
Abundant Victorian houses provide charm to Springfield, which bears the nickname
“City of Homes.” Sadly, a number of these houses are currently unoccupied: the overall
residential vacancy rate rose to over 10 percent in 2005–07.16 Median family income and the
poverty rate present a dire picture of the city, even when compared with other cities that have
gone through similar deindustrialization processes.
In the past five years, Springfield has undertaken a number of local and regional initiatives
to revitalize its downtown and attract new investment. These efforts provide hope of future
economic progress.
A struggling city with hopes of change
With the opening of the Armory in the late 18th century, Springfield became the heart of
the metalworking manufacturing industry in the United States. Although signs of
manufacturing decline were already visible in the 1960s, “defense spending during the Korean
War rearmament boom and the Vietnam War allowed firms and workers to ignore their internal
and external problems.”17 During the latter half of the 1970s and in the 1980s, however, the city
was hit hard. As manufacturing firms moved oversees and to Southern states, Springfield
“hemorrhaged jobs at an alarming rate … as 45 percent of the city’s manufacturers closed.”18
The city was unable to redirect its manufacturing capabilities to other types of production (such
as telecommunications and computer equipment) that allowed other Massachusetts cities to
continue to prosper.
16 Although homeownership rates have been stable at around 50 percent, in the poorest area (Metro Center, Six
Corners, and South End) homeownership rates were just 12 percent in 2000. 17 Forrant, op. cit., p. 136. 18 Forrant, op. cit., p. 32.

12
The riverfront redevelopment projects of the 1980s—including the creation of the
Basketball Hall of Fame and the renovation of the downtown civic center—proved unsuccessful
in bringing the city back to its feet. By 1990, as the New England region was mired in a steep
and prolonged recession and Springfield retailers continued to vacate their downtown
locations, about one‐quarter of downtown commercial space lay vacant.19 According to a recent
account, corruption among public officials and the “failure of the region’s extensive network of
colleges and universities to contribute much time to strategizing over a solution to economic
decline”20 exacerbated the city’s problems and “caused residents … to become even more
disenchanted with city leaders.”21 In the 1990s, “it seemed that the best economic development
idea anyone could come up with for Springfield was casino gambling,”22 but the proposal was
rejected by the city’s residents. As the Urban Land Institute pointed out, “development projects
floundered, and corruption crept into segments of the public sector. Neighborhoods seemed to
turn inward rather than embracing the entire city and region.”23
In 2004, the dire condition of Springfield’s finances prompted the state to appoint a
Finance Control Board,24 which took over municipal spending decisions, focusing mainly on
bringing expenditures into line with revenues. The Control Board also worked on strengthening
the City’s administrative capacity, in preparation for resuming normal municipal operations
after the expiration of the Board’s term in mid‐2009.
Positive steps
Over the past decade, regional initiatives have become increasingly relevant in shaping
development plans. In 2000, Springfield partnered with Hartford, Connecticut, to market the
“Knowledge Corridor,” a name reflecting the numerous colleges and universities in their
vicinity. In 2004, the Pioneer Valley Planning Commission (PVPC)25 started overhauling the
earlier Plan for Progress, a blueprint for growth and development of the regional economy. The
plan established short‐term and long‐term milestones and promoted more collaboration among
business and civic leaders.26
19 Forrant, op. cit., p. 172. 20 Forrant, op. cit., p. 168. 21 Forrant, op. cit., p. 163. 22 “Paradise at a Price; The Economic Boom Has Mostly Skipped Western Massachusetts,” Boston Globe, November 22,
1998. 23 Urban Land Institute (2006). 24 The five‐member control board was set up by the Massachusetts legislature and named by the Governor. 25 Created in 1962, PVPC is a consortium of local governments in Hampden and Hampshire counties and is the
regional planning body for the Pioneer Valley region. 26“20 Years of Economic Development: Taking a Regional Approach,” BusinessWest, June 1, 2004.

13
Acknowledging their essential role in implementing workforce development programs
and in creating and attracting businesses, educational institutions have become more active
participants in economic renewal strategies. Springfield Technical Community College (STCC),
in particular, has been a major contributor.27 The Entrepreneurial Institute at STCC, created in
1996, provides entrepreneurship education for students of all ages,28 and the STCC Technology
Park has been successful in attracting tenants, incubating businesses, and providing technology
training.29 The park’s current plan calls for targeting companies in the biomanufacturing
industry.
Springfield‐based educational institutions such as Springfield College (SC) and
American International College (AIC) are committed to the overall wellbeing of the city of
Springfield and the neighborhoods where they are located. For example, both AIC and SC
belong to the State Street Alliance, a large collaboration of institutions and residents overseeing
the redevelopment of the major corridor running from downtown Springfield to points east. In
2009, the Carnegie Foundation for the Advancement of Teaching selected Springfield College as
one of 119 U.S. institutions of higher learning to receive its Community Engagement
classification. Springfield College was recognized for providing a curriculum that involves
students and faculty in addressing community needs, and for outreach and partnerships that
benefit both the community and the campus.
The University of Massachusetts has increased its involvement with the city in recent
years. Scientists from UMass Amherst—only 27 miles from Springfield—have conducted joint
projects with scientists at the Pioneer Valley Life Sciences Institute, a Springfield‐based
nonprofit organization dedicated to biomedical research. Researchers from the UMass
Dartmouth campus are collaborating with the private nonprofit organization MassINC to
develop a long‐term growth strategy for the city with input from the government and the
private and nonprofit sectors.
Based largely on a 2006 report by the Urban Land Institute, numerous revitalization
projects are underway in the downtown area. Springfield’s Union Station restoration is
intended to transform the station into a multimodal transportation hub for both train and bus
services. Various organizations with the support of the Massachusetts state government have
27 “Fueling the Region’s Economy,” BusinessWest, April 1, 2003. 28 The institute focuses on all aspects of entrepreneurship education, ranging from a two‐year associate degree to K‐8
elementary entrepreneur programs and student business incubation. 29 In 2001, STCC was selected by the U.S. Department of Commerce, Economic Development Administration as the
sole national winner of the Award for Excellence in Urban Economic Development.

14
come together to push for the restoration of rail service between Springfield and New Haven30
and, more generally, for improved connectivity and transportation access to Boston.
Most recently, five major employers have partnered with the city and with lenders to
promote homeownership in Springfield. The “Buy Springfield Now” initiative is modeled on a
program started in 2008 to provide homeownership incentives in Worcester.
Clearly, Springfield has intensified its economic development activities during the past
several years. The degree to which the emergent revitalization efforts translate into higher
employment and improved social indicators remains to be seen, particularly among the city’s
minority population. Furthermore, recession‐induced fiscal pressures challenge city
government as it reassumes the responsibilities temporarily ceded to the state‐sponsored
Control Board.
Each of the 10 resurgent cities has its own unique story of transformation. Following the
individual accounts is a section that discusses some of the common themes and approaches.
Evansville
Summary
Evansville is located on the north bank of the Ohio River and historically has been an
industrial and trade center for a large area in Indiana, Kentucky, and Illinois. Much has changed
since the 1950s when the city was known as the “Refrigerator Capital of the World.” In contrast
with other manufacturing cities in the comparison group, Evansville began to diversify its
economy relatively early. Although manufacturing continues to be an important component of
Evansville’s activities, the city has taken advantage of its strategic location and of improvements
in transportation systems. As a result, Evansville has been successful in attracting new
businesses, boosting tourism, and participating in international markets.
In 1960, Evansville ranked second to last among the 25 peer cities in median family
income, but as of 2005–07 the city ranked eighth highest. The share of residents with at least a
high school education increased by 43 percentage points from 1960 to 2005–07, the eighth
largest improvement among the comparison cities over that period. On the other hand, the
share of college graduates increased less than in the average peer city, and as of 2005–07 was
below the comparison cities average. Contrary to most of its peer cities, Evansville has not
experienced major changes in its racial and ethnic composition over the past half century. As of
2005–07, whites accounted for 86 percent of the city’s residents (Figure 6), while Hispanics made
up fewer than two percent.
30 http://www.pvpc.org/corridor/history.html.

15
An ongoing transformation
By the end of 1950s, Evansville was “gripped by a paralyzing economic slump.”31 In
1959, the election of a new mayor who served 12 years in office marked the beginning of a series
of initiatives that would sustain Evansville’s economy. Mayor Frank F. McDonald II started by
requesting a study about the cityʹs potential, and personally contacted businesses to persuade
them to settle in Evansville. During the 1960s, the city benefited from the construction of a civic
center, federal buildings, a community center, the state’s first enclosed mall, and the beginnings
of downtown renewal.32
In the early 1980s, the Metropolitan Evansville Chamber of Commerce launched an
aggressive economic development program that was successful in attracting large employers
such as T. J. Maxx, which built a large redistribution center in the Evansville enterprise zone.33
By the late 1980s, the expansion of the Evansville airport and an extensive downtown
revitalization were well along, and several industrial parks had opened.
The airport and the foreign‐trade zone continued to attract businesses in the 1990s.
Meanwhile, the University of Southern Indiana became the stateʹs fastest‐growing university,34
having spillover effects on housing construction and on commercial and retail trade. The
aggressive strategy to attract businesses to the area achieved one of its major triumphs when a
4,400‐employee Toyota truck plant opened close to Evansville in 1998. Tourism also has brought
new employment to Evansville, particularly with the opening and renovation of large
convention centers in the early 1990s and the Aztar riverboat casino in 1996, one of the city’s
largest employers.
Since the turn of the century, the city has paid particular attention to fostering growth in
technology sectors. In 2006, Innovation Pointe, a not‐for‐profit organization that incubates small
technological businesses, opened its doors. The University of Southern Indiana has partnered
with Innovation Pointe by providing young companies with educational and training
programs, student interns, and faculty mentors, and by holding some MBA classes in the
facility.
Working together
Local economic development organizations and, later on, regional organizations have
played an important role in targeting strategic sectors, attracting investment, and coordinating
31 “ʹMcDonald Eraʹ Lifted Evansville from Economic Slump,” Evansville Courier, 150 Years of History series, January 8,
1995. 32 Ibid. 33 “Quality of Life: The Common Denominator in Southwest Indiana,” Indiana Business, June 1985. 34 “Evansville: Cranes in the Air over Indianaʹs Third‐largest City,” Indiana Business Magazine, June 1, 2005.

16
with local actors. The Evansville Regional Economic Development Corporation,35 for instance,
has focused its activities on attracting new businesses, while retention and expansion activities
have continued to be handled by the local Chamber.36
In recent years, the city has needed to reorganize several of its economic development
institutions to avoid duplicating activities. In 2007, several organizations came together to form
the Growth Alliance for Greater Evansville (GAGE), a public‐private partnership focused on
economic development. GAGE has formed a separate Downtown Development Division in
addition to maintaining its broader focus on assisting businesses located in Evansville and
Vanderburgh Counties. The city’s commitment to attracting and retaining young professionals
is evident in the networking opportunities provided through Young Evansville Professionals,
chartered in 2001.
Fort Wayne
Summary
Fort Wayne, the second largest city in Indiana, “grew to become a city because of [its]
location on key transportation routes—first water, then rail—and … reached the pinnacle of
economic success because [it was] one of the important manufacturing cities of the industrial
Midwest.”37 Although Fort Wayne’s economy developed later than the economies of the largest
Midwestern cities, it ended up facing similar struggles as the rest of the so‐called Rust Belt.38
However, from the crisis a strong sense of collaboration among various stakeholders emerged
that allowed the city to recover and attract new businesses. The city has received the All‐
American City award from the National League of Cities three times, most recently in 2009.
In certain respects, Fort Wayne has shown greater stability than other cities in the peer
group. In the mid‐2000s, nearly 20 percent of Fort Wayne’s employed residents were still
working in manufacturing (Figure 7). Although its median family income declined from 115
percent to 89 percent of U.S. median family income between 1960 and 2005–07, Fort Wayne has
consistently had one of the highest income levels among the cities in the peer group. Fort
Wayne’s educational attainment has improved significantly over time, and has remained
relatively high, particularly in terms of the high school completion rate, which reached 87
35 The corporation was previously known as Vision 2000, then as Vision‐E. 36 “Economic Development: A Tale of LEDOs and REDOs,” Indiana Business, May 1992. 37 John Stafford, Director of the Community Research Institute at Indiana University‐Perdue University Fort Wayne.
“What Successful Cities Have to Say to Fort Wayne,” speech given to the Quest Club of Fort Wayne in March 2006. 38 As described by Teaford (1993), “During the decades following World War II urban Midwesterners faced the ugly
symptoms of aging. By the 1950s, 1960s, and 1970s [large Midwestern cities] had turned gray, and at the beginning of
the 1980s their feebleness was winning nationwide attention. They were the capitals of the rust belt, a decaying
industrial swath that was no longer the nation’s pride but instead had become a national problem.”

17
percent in 2005–07. From 1960 to the mid‐2000s, Fort Wayne’s population increased by more
than 50 percent, mostly as a result of a strategy of growth through land annexation.39 The racial
compositon of the city has not changed much over time, as whites still account for over three‐
fourths of the population. The Hispanic share, while rising, remains low compared with the
share in many other comparison cities.
From crisis to recovery
The economic recession of the early 1980s, a devastating flood in 1982, and the
shutdown of International Harvester, the largest employer in the city, ruined Fort Wayne’s
economy. By 1983, the unemployment rate had increased to 14.5 percent, much higher than the
national average. However, Fort Wayne managed to recover from the crisis sooner and more
decisively than other Midwestern cities.
By the end of 1986, Fort Wayne had succeded in attracting large investments. General
Motors started building a new $500‐million plant nearby; Burlington Air Express, the second‐
largest air freight company in the United States, established its national hub in Fort Wayne; and
large companies such as GE and ITT expanded their workforces in the city.40 Acknowledging
that the city was concentrating much of its economic activity in the automotive industry, Fort
Wayne financed a study in 1990 on ways to diversify its economy. Under the auspices of the
Fort Wayne‐Allen County Economic Development Alliance, founded in 1999, the city has
adopted a long‐term economic development strategy focused on seven sectors: advanced
manufacturing (including vehicle production); agroprocessing (food and nonfood products);
aerospace and non‐aerospace airport‐related development; communications and defense
contracting; financial services; life and materials sciences; and logistics.
“Wholehearted” economic development
One of the main drivers of the city’s success has been the collaboration between political
parties, the private and public sectors, labor and community leaders, and citizens in general.
Leadership from the Chamber of Commerce reportedly was important in attracting new
businesses and strengthening partnerships with different stakeholders.41 Fort Wayne’s efforts to
attract businesses and “buy jobs” through low‐interest financing, tax abatements, grants, and
job training programs were not unique, but “Fort Wayne [did] it so wholeheartedly, and with
such close cooperation between city officials and business, that the results [were] spectacular.”42
39 From 1960 to 2000, Fort Wayne more than doubled its land area. 40 “A Rust Belt City Takes on a Shine,” Fortune, November 10, 1986. 41 Fortune noted that Ian M. Rolland, one of the most prominent Indiana business leaders, “led an effort to turn the
moribund chamber of commerce into an aggressive, well‐financed pursuer of new business.” Ibid 42 Ibid.
18
MassINC portrays Fort Wayne as a success story in its study of Massachusetts gateway
cities.43 The report points to two initiatives in particular. First is the introduction of “corporate
style performance and accountability standards for all city operations” through a private sector
program known as Six Sigma, a data‐driven process for achieving quality that emphasizes
speed, accuracy, and continuous evaluation of performance.44 Second is Fort Wayne’s workforce
development program that is “bridging the digital divide and fostering a culture of learning.
The city is blanketing the entire municipality with a high‐speed broadband network—a
prerequisite for ‘connecting’ in the knowledge‐based economy.”
In light of continued employment declines in many of the Midwest’s traditional
manufacturing industries in the 2000s, Fort Wayne and other communities in northeast Indiana
increasingly are emphasizing workforce development for technology‐related job opportunities.
The Northeast Indiana Innovation Center (NIIC), founded in the late 1990s and devoted to
fostering high‐tech entrepreneurship, relocated to a facility adjacent to Indiana University‐
Purdue University Fort Wayne (IPFW) in 2005 and opened a new “Emerging Growth Center” in
2008. As part of a recent $20 million workforce development grant for northeast Indiana, the
Indianapolis‐based Lilly Foundation funded the creation of a wireless technology center at
IPFW to prepare workers for defense‐related jobs.45 The concentration of the NIIC facilities, the
IPFW and IVY Tech campuses, and the Certified Technology Park designation46 form the basic
elements around which an Allen County education‐technology cluster is expected to emerge.
Likewise, efforts such as the Young Leaders of Northeast Indiana provide a place for young
professionals to network, to participate actively in the community, and to develop leadership
skills.
Fort Wayne’s 2009 All‐American City award was based in part on the establishment of
the Refugee Resource Center to provide services to the city’s burgeoning immigrant and
refugee population. Funded in part by a federal government grant, the Center helps new
residents learn English and other skills, and gain access to health care and employment.
43 The Massachusetts Institute for A New Commonwealth (2007). 44 According to MassINC, in a short time, the city reduced water main replacement costs by 18 percent, cut pothole
response time by 86 percent, and slashed the waiting time for building permits from 51 days to 12 days. 45 http://homepages.indiana.edu/web/page/normal/10702.html and private communication with John Stafford, July
2009. 46 Designation as a Certified Tech Park allows for the local recapture of certain state and local tax revenues which can
then be invested in the development of the park.

19
Grand Rapids
Summary
Grand Rapids is one of the most vibrant cities in the Midwest, the second largest city in
Michigan, and the economic center of western Michigan. Once known as the “Furniture Capital
of the World,” Grand Rapids has diversified its economy both within and outside the
manufacturing sector. These restructuring measures have been essential in sustaining economic
growth and in providing flexibility during economic crises. The city’s remarkable private sector
philanthropy and public‐private partnerships have played major roles in financing its
redevelopment. To some extent, such institutions appear to have compensated for the lack of
other potential financiers: in 2005–07, Grand Rapids had the lowest share of residents working
in financial services of all the resurgent cities (Figure 8 and Tables 2 and 3).47
Grand Rapids has experienced considerable increases in population and educational
attainment since 1960. The number of city residents rose considerably with the expansion of the
city’s land area between 1960 and 1980, and then increased another 6 percent from 1980 to 2005–
07. Since 1960, Grand Rapids has consistently ranked among the top one‐third of the peer cities
in share of residents with a bachelor’s degree. Currently, almost 27 percent of the adult
residents of Grand Rapids have completed college. Notwithstanding the flow of new residents
and the creation of new jobs, Grand Rapids has not managed to match the national trends in
family income growth. Median family income in Grand Rapids has dropped from 107 percent
of the U.S. average in 1960 to 75 percent in 2005–07.
The National Civic League recognized the city’s qualities by selecting it as a finalist for
the All‐American City awards in 2003. The city’s development plans were praised as rooted in
community consensus. Thanks in large measure to private sector leadership and commitment,
Grand Rapids has been able to combine the atmosphere of a small city with the advantages of a
large metropolis.
Private sector key in Grand Rapids’ comeback
In the late 1970s, Grand Rapids was in bad shape, as furniture manufacturing relocated
to less expensive parts of the country, causing the city’s unemployment rate to spike to nearly
17 percent. Fortunately, the city was able to reinvigorate its economy by adapting and
diversifying.
47 The next lowest share is found in New Haven, where Yale University has been a major funder of development
projects.

20
The furniture industry modernized itself by shifting from residential to commercial
markets. Companies such as Meijer48 and Amway49 were retail industry pioneers in adapting to
the new economy. As its automotive industry shrank, the city was able to attract companies
such as GE Aviation Systems, an aerospace products company. The Grand Rapids economy
continues to rely on small business50 and on firms that have grown but remain rooted in the
city. As a result, the city was “one of the only manufacturing centers to grow during the
1990s.”51 The extent of diversification is visible in that the cityʹs 10 largest employers represent
nine industries,52 including health care, retail, insurance, office furniture, and automotive parts
manufacturing.
Since the mid‐1990s, Grand Rapids has worked to become a major player in the health
care industry. The first significant step was the founding of the Van Andel Institute.53 In 1999,
Grand Rapidsʹ major health care providers joined forces with Michigan State University and
Grand Valley State University to form the Medical Education and Research Center (GRMERC),
a consortium integrating clinical research, medical education, and health professions education.
A number of additional medical facilities and research institutions joined the Van Andel
Institute and GRMERC to form the “Medical Mile.”
Development of physical and human capital
Downtown redevelopment started with the creation of the Downtown Development
Authority in 1979, and has been an important contributor to attracting younger adults and new
businesses. Professionals increasingly see downtown as a desirable place to live. 54 In just the
past eight years, a new convention center, a sports arena, a medical institute, and a business
college campus have been constructed in Grand Rapids. The success of downtown
revitalization was made possible by public‐private partnerships and donations from the private
sector.55 Private investments have been viewed as providing risk‐sharing and know‐how to
public projects.56 Even in the midst of the current economic recession, downtown Grand Rapids
48 In 1963, Meijer opened a food and general merchandise store in Grand Rapids, marking the birth of the
supercenter, a concept that would grow into a retail phenomenon. 49 Founded in 1958, Amway is a multilevel marketing business and direct seller of health and beauty products that
now operates worldwide. 50 Eighty percent of businesses in Grand Rapids employ fewer than 30 people. See Barone (1998). 51 Ibid. 52 Ibid. 53 Jay Van Andel, one of the founders of Amway Corporation, founded the Van Andel Institute (VAI) in 1996. The
Institute focuses its research on the genetic and molecular origins of cancer and other diseases. 54 “At Home Downtown; Young Professionals, Empty Nesters Flock to Condos”, Grand Rapids Press, August 12, 2007. 55 “Minorities Demand Their Share of Cityʹs Prosperity; Grand Rapids Struggles with Diversity,” Detroit News, June
13, 2001. 56 “A Tale of Two Cities; Two Similar Michigan Towns Have Taken Differing Paths,” Grand Rapids Press, December
14, 2003.

21
has continued to thrive thanks to “dedicated local developers” who have promoted
“unprecedented investments in health care facilities.”57
Grand Rapids has benefited from working on long‐term development plans and from
coordination efforts across sectors. In 1992, the city launched “Voices & Visions,” a planning
process that involves a wide range of actors from the Grand Rapids City Commission to the
Grand Rapids Public Schools to the private sector. Links between the medical community and
universities, in particular, have been widely recognized as essential contributors to revitalizing
the downtown area. Retaining large employers has required coordinated efforts on the part of
the city (through tax abatements), the Chamber of Commerce (through The Right Place
planning programs) and training programs (provided by the Applied Technology Center).58 On
several occasions, the city and the Chamber of Commerce have partnered with the
Neighborhood Business Alliance (NBA) to work on economic development strategies.59 NBA is
made up of representatives from all 20 neighborhood associations, meeting monthly to
coordinate city‐wide services, share best practices, and advocate on issues affecting
neighborhood businesses and districts.
Greensboro
Summary
The economy of Greensboro, North Carolina’s third largest city, used to center on the
textile and furniture industries. As its manufacturing sector declined, the city shifted to new
activities related to services and high‐tech research and production. Although the textile and
tobacco industries continue to be an important part of Greensboro’s economic base, the city is
“capitalizing on the growth in its new target sectors: advanced manufacturing, aviation,
financial services and data centers, life sciences, and transportation and logistics.”60 Also, for
most of the past three decades, the cities of Greensboro, Winston‐Salem, and High Point—the
so‐called Piedmont Triad—have worked together on transportation, technology, and other
economic development initiatives. These regional efforts have had positive impacts on
Greensboro’s economy.
57 “Downtown Stands Tall; Construction at Historic High Despite Recession,” Grand Rapid Press, February 22, 2009. 58 The Right Place is a regional nonprofit economic development organization founded in 1985 and supported
through investments from the private and public sectors. The Applied Technology Center is located on the Grand
Rapids Community College downtown campus, and provides technical training and conference services. See
“Business Retention Deemed Crucial to Downtown Hopes,” Grand Rapids Business Journal, May 18, 1992. 59 “Ann Kassouni: Inside Track,” Grand Rapids Business Journal, May 12, 1997. 60 “100 Best Places to Live and Launch,” Fortune Small Business magazine, April 2008.

22
Greensboro’s population doubled between 1960 and 2005–07.61 Poverty rates remained
low and fairly stable from 1980 to 2000; as a result Greensboro ended this two‐decade period
with the lowest population poverty rate among the peer cities. Although the poverty rate
increased after 2000, it remained low relative to the rates in other peer cities. In terms of median
family income, Greensboro has experienced significant progress relative to other peer cities. For
the past half century, Greensboro has consistently had one of the highest rates of educational
attainment among peer cities (Figure 9), and its shares of high school and college graduates are
now above the national averages (Appendix Table 4)
Greensboro has promoted its attractive business climate and taken advantage of its
central location in the South Atlantic region. In 2007, the city had the lowest cost of doing
business according to the Forbes Magazine list of “Top 200 Places for Business and Careers,” and
in 2008 it was chosen among Fortune magazine’s “100 Best Places to Live and Launch.”
Steps toward a more diversified economy
As traditional manufacturing weakened, the city suffered but was able to diversify its
economy towards high‐tech manufacturing, financial services and insurance, aircraft
maintenance, software design, and product distribution.62 The opening in 1982 of the Piedmont
Triad International Airport terminal just west of Greensboro set off a building boom in the city.
In 1986, American Express chose Greensboro over 25 competing cities as the location for a large
service center; this was the biggest single employment expansion in the city since 1958. In 1987,
the Nussbaum Center for Entrepreneurship opened its doors in an old mill building to support
new or emerging nonretail businesses.
In the mid‐1990s, the Greensboro business community developed a strategy to attract
emerging high‐tech companies, building on the experience of bringing in a new microchip
manufacturing plant.63 By 2002 a “semiconductor cluster” of about 25 companies was thriving
near Piedmont Triad International Airport.64 FedEx expects to complete construction of its Mid‐
Atlantic air cargo hub later this year, adding some 1,500 jobs at the airport.
Greensboro’s educational network
The Greensboro News & Record recently noted that “universities are the primary players
in a key group that includes the [Guilford Technical Community College (GTCC),] public
61 Land area increased 115 percent from 1960 to 2000. 62 “Meet the Future Today,” News & Record, January 26, 1997. 63 “Area Chamber Thinking High‐tech,” News & Record, September 8, 1996. 64 “The Pursuit of Knowledge; 2022: A Vision of Technology and Education,” News & Record, June 8, 2002.

23
schools and business that will form tighter bonds as Greensboro rebuilds, supplanting the old
world dominated by businesses leaders who once met privately.”65
Parts of this educational network were already well established as of the 1990s. In 1996,
the Wall Street Journal praised Greensboro Community College’s job training curriculum, which
was redesigned with the help of area businesses and prepares students to perform high‐tech
jobs in auto mechanics, textiles, and other industries.66 In addition, Guilford Technical
Community College offers a Quick Jobs program that provides trainees with the basic skills
required to find employment.
Also in the mid‐1990s, business leaders joined forces with universities to foster high‐
tech production, building on North Carolina A&T State University’s “cutting‐edge research for
federal agencies such as NASA” and on the University of North Carolina at Greensboro‘s
(UNCG) “growing strength in the basic life sciences of biology and chemistry critical to such
industries as pharmaceuticals.”67 North Carolina State University, UNCG, and the other schools
in the region built the Triad Technology Center, becoming a “clearinghouse for research
projects, fostering collaboration among the schools and companies seeking help in designing
new products, testing them, or training workers.”68 In 2007, UNCG and North Carolina A&T
State University announced the creation of the joint research campus Gateway University
Research Park and the Joint School of Nanoscience and Nanoengineering.
Continuing adaptation
A 2000 report by the private consulting firm McKinsey & Company 69 concluded that
while Greensboro had enjoyed significant economic success over the past several decades and
was well positioned among similar‐sized cities in the Southeast, “the local economic base has
shifted and growth will most likely slow over the coming years.” Following the report’s
recommendations, a group of local charitable foundations created the not‐for‐profit
organization Action Greensboro to coordinate the development‐related activities of the cityʹs
numerous business and civic groups.70 Action Greensboro became a major player in
development, investing in numerous projects–including parks, job recruitment programs, and
downtown revitalization–and gauging the progress of the city.
65 “Rebuilding from Within; Knowledge, Innovation Form Base of Greensboro’s New Economy,” Greensboro News &
Record, April 13, 2008. 66 “GTCC Aids Economy, Wall Street Journal Says,” News & Record, November 27, 1996. 67 “The Pursuit of Knowledge; 2022: a Vision of Technology and Education,” News & Record, June 8, 2002. 68 Ibid. 69 McKinsey discussion report (2000). 70 In 2005 the Greensboro Partnership was formed to serve as an economic development umbrella, merging the board
of directors of the Greensboro Chamber of Commerce and the Greensboro Economic Development Alliance.
24
As anticipated in the McKinsey report, maintaining Greensboro’s economic progress
has proved harder in the 2000s.71 Referring to Greensboro as “relatively resilient” and “hardly a
Rust Belt sob story,” a local business publication noted that much of the city’s recent job growth
had been due to new retail and call center establishments that offered relatively low pay.72 To
attract better jobs, Greensboro is looking at aerospace technology as a new engine for its
economy. Honda Aircraft Company began building its new headquarters and R&D and
production facilities in Greensboro in 2007.
The city also has worked on downtown renewal. Since the renovation in 1998 of a 114‐
year‐old building—“the first thing that had been renovated downtown in 25 or 30 years” 73—the
rehabilitation of downtown has attracted business and residents. As of 2008, more than 1,200
people lived downtown, compared with only 500 four years earlier.74 Action Greensboro and
Downtown Greensboro Inc.75 continue to be active in the economic development of the urban
core.
Jersey City
Summary
Located on the west bank of the Hudson River across from Manhattan, Jersey City went
from being a heavily industrial city in 1960 to a major financial center in the 2000s. In addition
to Jersey City’s proximity to New York City, transportation system improvements and business
tax incentives encouraged a myriad of firms to locate in the city. The waterfront was revitalized,
numerous high‐rise buildings were constructed, and the population increased. As large
financial corporations moved some of their activities to Jersey City, the city became one of the
largest banking centers in the nation and received the moniker “Wall Street West.” As of 2005–
07, only 6 percent of the city‘s residents worked in manufacturing, the lowest share among the
peer cities. The recent sharp slowdown in the nation’s financial services sector and the prospect
of regulatory reform add some uncertainty to the outlook for Jersey City’s economic future, but
71 A 2003 report commissioned by Action Greensboro found that the city lagged similar Southeastern cities in
education, health, and social services employment. See “Benchmarks put city in midpack of regional peers;
Greensboro is developing an approach to better focus job recruitment,” Greensboro News & Record, September 30,
2003. Four years later, yet another study concluded that a massive loss of manufacturing jobs since 2000 had been
largely responsible for Greensboro falling behind some of its peers in average wage rates and growth in its tax base.
See “Numbers improve, but Greensboro still lags peer cities,” Business Journal, May 14, 2007. 72 “How Are We Doing?,” Business Journal, August 27, 2004. 73 “Greensboro, Always Great for Business,” US Airways Magazine, March 2008. 74 “Downtown Downturn?” News & Record, December 31, 2008. 75 This is the official nonprofit organization focusing entirely on downtown and more specifically on the Business
Improvement District (BID).

25
the city is hoping to continue to take advantage of its relatively lower cost structure (as
compared with New York City) in attracting businesses when the economy turns around.
Jersey City’s economic transformation over the last five decades has been impressive.
The city experienced the greatest improvement in educational attainment among the peer group
cities, going from ranking second lowest in educational attainment in 1960 to ranking second
highest in share of residents with a bachelor’s degree and tenth highest with a high school
diploma in the 2000s. Similarly, as of 2005–07, Jersey City had among the highest median family
incomes of the comparison cities. While the majority of comparison cities and the United States
as a whole experienced increased incidence of poverty, Jersey City’s population poverty rate
decreased in the last 30 years (Figure 10).
Jersey City is one of the most racially and ethnically diverse cities in the nation. As of
2005–07, whites accounted for only about one‐third of Jersey City’s population; African‐
Americans constituted close to 30 percent; and many of the remaining residents were Asian.
Slightly less than 30 percent of the total population of Jersey City was of Hispanic origin.
Middle Easterners are prominent in Jersey City: along with the Detroit area and Paterson (NJ),
Jersey City is among the top U.S. locations in the share of population that is of Arab ancestry.76
A study of 100 American cities by the Boston‐based Initiative for a Competitive Inner
City found that Jersey City had experienced one of the highest growth rates in inner‐city small
business jobs from 1995 to 2002.77 In comparison with the other “Big Six” urban centers in the
state of New Jersey (Camden, Trenton, Paterson, Newark, and Elizabeth), The New York Times
cited Jersey City as “the only one to experience a true renaissance.”78
From manufacturing city to “ʹWall Street West”
During the pre‐World War II era, Jersey City was a thriving manufacturing center with
an efficient transportation system and an active waterfront. However, in the 1950s the economy
started to stumble, as the manufacturing sector declined and railroad tracks were abandoned.
Private‐sector employment plummeted more than 20 percent from 1950 to 1975,79 and continued
to drop until the early‐1980s. Job and population declines were accompanied by corruption
scandals and soaring crime rates.
76 This information is drawn from a variety of sources that differ somewhat in their definitions of the Arab
population. According to the 2000 Census, Arabs were one of 33 ancestry groups with a U.S. population of over 1
million. See U.S. Census Bureau, “The Arab Population: 2000,” Census 2000 Brief, issued December 2003. 77 Initiative for a Competitive Inner City (ICIC) (2005). 78 “A City Whose Time Has Come Again; After Years of Deprivation, Jersey City, an Old Industrial Powerhouse, Is
Remaking Itself,” New York Times, April 30, 2000. 79 http://www.jcedc.org/Pages/25‐52economic.pdf.

26
The first areas to be revitalized were the ones “most ravaged by poverty and decay
during the decades after World War II.”80 The mid‐1980s construction on abandoned waterfront
property of the Newport Development, a $2.5‐billion mixed‐use community, is widely credited
with kicking off Jersey City redevelopment. Except for recessionary periods in the early 1990s
and late 2000s, high‐rise buildings continued to spread, and financial and other professional
services jobs continued to increase.
Investors were attracted to Jersey City because of its proximity to New York City and its
relative affordability compared with the skyrocketing real estate costs in Manhattan. However,
the city arguably would not have become “the crown jewel of development”81 or attracted large
financial services companies (including Merrill Lynch, Goldman Sachs, and Morgan Stanley)
had it not also worked on providing good infrastructure, reducing crime and corruption, and
offering business tax incentives.
Since the early twentieth century Jersey City has been connected to Manhattan through
the PATH train system. Ferries and several bus services also have provided easy access to New
York City. In the early 2000s, the transportation system was improved further with the
construction of a $2.2 billion light rail system aimed at relieving the increasing congestion along
the Hudson River waterfront.
From the mid‐1990s to 2006, robberies and murders dropped by over 35 percent in
Jersey City. 82 Although the city had become known for corruption, after former Mayor Gerald
McCann was indicted in 1991, “the systematic graft that had characterized doing business in
Jersey City decreased dramatically.”83 Although Jersey City’s transformation began with
McCann, his successor, Mayor Bret Schundler, is praised for being “largely responsible for the
metamorphosis of the urban center into today’s dynamic metropolis.”84
In 1987, about one‐third of Jersey City was designated by the state of New Jersey as an
Urban Enterprise Zone (UEZ),85 to be administered by the Jersey City Economic Development
Corporation (JCED), a nonprofit organization that functions as a liaison between developers
and the city. In addition to the sales tax incentives offered through the UEZ Program, the city
took advantage of state Business Employment Incentive Program (BEIP) grants. Because the
size of these grants was determined by the amount of the employer’s income tax withholdings
80 “Stepping Out of Manhattanʹs Shadow,” New York Times, November 21, 2004. 81 “Hot Spots for Development,” New Jersey Business, March 2008. 82 “Jersey City Grows, But Not Everywhere,” Associated Press Newswires, March 4, 2006. 83“A Tale of Two Cities,” NJBIZ, August 26, 2002. 84“Jersey City: Americaʹs Golden Door,” New Jersey Business, January 1, 1999. 85 State tax revenues generated by UEZ businesses are dedicated to economic development projects within the zone.
Businesses participating in the UEZ Program are allowed to charge one‐half the standard sales tax rate on certain
purchases.
27
for new hires, the program was especially attractive for businesses locating high‐paying jobs in
New Jersey.86
Economic development away from the waterfront
In the first wave of “corporate migration”87 to Jersey City, prosperity did not spread
beyond the waterfront into the inland neighborhoods where most city residents live. 88 But over
the past decade, Jersey City has begun to see development of “the new middle‐class housing,
name‐brand retail stores, trendy restaurants, and galleries needed to lure new residents and
provide jobs for existing ones.”89 The city issued over 2,000 residential building permits in 2004,
up from only about 300 a decade earlier.90 Neighborhoods are working with the city in
implementing their own economic development projects. Residents of one of Jersey City’s
poorest neighborhoods, the Martin Luther King Drive, not only participated actively in writing
their development plan, but also controlled its implementation, through a neighborhood
development corporation (NDC). The plan received national and statewide awards and
recognition for its innovative use of community outreach and implementation.91
A remaining challenge is improving the public school system. Like schools in many
other densely populated urban areas, Jersey City schools have “a history of being strained by
overcrowding, underfunding, high dropout rates and a multitude of other problems faced by
districts that serve large numbers of disadvantaged children.”92
New Haven
Summary
New Haven, Connecticut’s third largest city and home to Yale University, has struggled
during the past 50 years, as have most old manufacturing cities. However, the city has shown
signs of economic transformation since the early 1990s, when Yale began to take an active role
in local development. Close to 40 percent of employed New Haven residents work in the
education, health care, and social assistance sectors (Figure 11), and the biomedical sector has
emerged as a growing driver of the city’s economy.
86 See http://www.state.nj.us/njbusiness/financing/incentive/beip_brrag.shtml. 87“How Wall Street West Was Won — Jersey City Emerges as One of the Nationʹs Hottest Real Estate Markets,” Star‐
Ledger Newark, September 17, 2000. 88 Ibid. 89 Ibid. 90 “Jersey City Grows, But Not Everywhere,” Associated Press Newswires, March 4, 2006. 91 http://www.smartgrowthgateway.org/case_mlk.shtml. 92 “Stepping Out of Manhattanʹs Shadow,” New York Times, November 21, 2004.

28
One of New Haven’s major strengths is its highly educated population. The share of
college graduates in the adult population was 31 percent in 2005–07, above the national average
and 10 percentage points higher than the average of comparison cities. In the 2000s, population
and relative median family income have finally begun to reverse the declining trends
experienced since the 1960s.
New Haven has attempted to balance its efforts at economic development with policies
to provide affordable housing for residents of modest means. The Housing Authority of the
City of New Haven is committed to subsidizing 30 percent of all rental units in the city.93 Not
surprisingly, therefore, the poverty rate in New Haven remains high—24 percent in 2005–07.
And despite the sharp reduction in overall crime from 1975 to 2000, New Haven’s violent crime
rate is the highest among the resurgent cities.
New Haven’s racial and ethnic composition has changed dramatically in the past half
century. Whites accounted for 85 percent of the city’s population in 1960, but make up less than
one‐half today. In 2005–07, New Haven was 37 percent black and 24 percent Hispanic.
Yale University’s changing role
During the early 1980s, the industrial base of New Haven continued to erode, as major
manufacturers closed factories or reduced employment. These developments were similar to
those of other old industrial cities around the country, but they contrasted with the experience
of other Connecticut urban areas where employment was increasing.94 In addition, although
Yale had always played a major role in New Haven, the university tended to isolate itself from
the city’s economic troubles. Real estate developer and gubernatorial candidate Joel Schiavone
commented, “Yale did what Yale does best: retreat inside its walls and lock its doors.”95
City economic development officials, corporations, and Yale University joined efforts for
the first time in the mid‐1980s to try to enhance New Havenʹs service‐sector employment. One
result was “New Haven 1990,” a marketing proposal that grew out of conversations among
development, business, and neighborhood representatives, and with experts from other cities
that had undertaken similar initiatives.96
93 www.hud.gov/offices/pih/programs/ph/mtw/newhaven.cfm. 94 As noted in the New York Times article “New Haven Planning Science Park to Stem Job Losses,” July 20, 1980, “ In
Stamford, employment continued to grow rapidly in corporate headquarters. Bridgeportʹs metalworking companies
were operating at full capacity, and new capital was flowing into primary metals plants in Waterbury. Insurance and
finance companies were hiring steadily in Hartford, precipitating construction.” 95 “Focusing on Private Redevelopment, Not Public Urban Renewal,” Washington Post, October 29, 1989 96 These cities included Baltimore, Boston, and Indianapolis.

29
In 1991, Yale reached a formal agreement with the city that “some have viewed as
historic.”97 The University agreed to pay the city $1.2 million a year (an amount equivalent to
over 5 percent of the municipal budget) in recognition of fire protection services, and to put its
golf course on the property tax rolls (yielding about $350,000 a year in tax revenue). Under the
agreement, Yale also agreed to spend $50,000 annually for five years to fund “The Center for the
City,” an organization aimed at tapping business, government, and other resources to attack the
cityʹs social problems. Yaleʹs initiatives also included funding the following: $12.25 million to
redevelop four deteriorating blocks in the cityʹs retail center; investment in a face‐lift for the
Broadway shopping strip; $5 million to create a venture capital fund aimed at luring
biotechnology companies to the Science Park incubator; $2,000 a year offered for 10 years to any
Yale employee who buys a house in the city; and the resources to renovate four vacant
storefronts on Park Street to house a Yale police substation and several student programs. 98 In
short, a major historical account of the city noted, “Few major initiatives on any front–public
education, neighborhood development, arts and culture, downtown commerce–would fail to
attract Yale’s comment or concern in the 1990s.”99
By the mid‐1990s, New Haven’s economy seemed to be on a firmer footing. Biomedical
industry and other projects developed in the city, accompanied by an “explosion of interest in
the cityʹs art and music scene and the infusion of ambitious new immigrants, which … boosted
the cityʹs cosmopolitan appeal.”100
In partnership with Yale University and the business community, the city of New Haven
launched an Economic Development Corporation in February 2008. A primary mission of this
organization is to operate as a one‐stop center to attract new businesses and to retain existing
businesses.
Continuing challenges in spreading opportunity
A continuing theme in New Haven is the need to spread the benefits of economic
resurgence to more neighborhoods and members of the community. Despite Yale’s continued
involvement, its success and interest in alleviating New Haven’s most serious social problems
have been called into question. Historian Douglas Rae has pointed out that Yale “[has]
produce[d] no miracles in public education, and most of its faculty [have] express[ed] little if
any enthusiasm for solving urban problems.” 101
97 “Elm City Bows Under Urban Pressures,” Business Journal‐Hartford, January 28, 1991. 98 These initiatives were promoted by Richard C. Levin, a Yale economist who lived in New Haven for 23 years and
became the university’s president in 1993. 99 Rae (2003) p. 431. 100” New Haven Has an Attitude, a New One,” New York Times October 23, 1994. 101 Rae, op. cit.
30
One set of recent initiatives concerns life sciences education. Local universities and
businesses are working with the city’s public schools to develop curricula and materials, and to
provide teacher training related to biotechnology. The state of Connecticut recently matched
$1.5 million in funding provided by private biotechnology and pharmaceutical companies for
the “Biobus,” a state‐of‐the‐art mobile laboratory that takes biotechnology education on the
road.”102
Other efforts relate to supporting small and minority‐owned businesses. The city’s Small
Business Initiative (SBI), established in 1999, provides loans, façade grants, technical assistance,
and shelter market construction opportunities.103 The Small Business Enterprise Construction
Opportunity Initiative, approved in 2001, states the city’s preference to do business with small
business contractors. In addition, school construction projects are required to employ small
contractors for at least 10 percent of the construction value of all new school construction.
Similarly, the City of New Haven’s Commission on Equal Opportunity administers a local
ordinance intended to increase minority, female, and apprentice work at federal, state and city‐
assisted job sites.
Peoria
Summary
One of the oldest communities in Illinois, Peoria is located along the Illinois River in the
largely agricultural area between Chicago and St. Louis. Peoria has long been seen as the
prototypical American city and thus has been used as a test market for products, services, and
public opinion polling. Throughout much of the 20th century, the city developed as a “classic
one‐company town” with Caterpillar as its economic engine. Even though Caterpillar remains
the area’s single largest employer and 16 percent of city residents continue to work in the
manufacturing sector, Peoria has shifted gears towards becoming a more technology‐based
economy.
Peoria was the only city in the peer group to experience rising median family income
relative to the U.S. median during the period 1960 to 1980 (Figure 12). After 1980, Peoria’s
median family income eroded for awhile, but then eventually stabilized in the 2000s. As of
2005–07, Peoria had the second highest median family income among the peer cities, as well as
the second lowest poverty rate. Peoria also showed one of the largest improvements in
educational attainment among the comparison cities from 1960 to the mid‐2000s.
102 http://www.cityofnewhaven.com/economicdevelopment/pdfs/officialStatement07.pdf. 103 http://www.cityofnewhaven.com/smallbusiness/LoanProgram.asp.

31
The transformation of a one‐company town: Phase I
Created through the merger of two farm tractor companies in the early 20th century,
Caterpillar expanded to become the worldʹs largest manufacturer of construction and mining
equipment, diesel and natural gas engines, and industrial gas turbines. Acknowledging that
further diversification was needed to sustain Peoria’s economy, a group of civic leaders created
the Economic Development Council for the Peoria Area (EDC) in 1981. The EDC attracted new
companies to the area, helped retain existing companies, and worked to ensure that the entire
region was involved in economic development strategies.104 After going through rough times
during the recessions of the early 1980s, community leaders, Peoria’s mayor, and the private
sector (including Caterpillar) joined forces to strengthen the EDC. Mayor Jim Maloof, elected in
1985, was characterized as “a very effective force [who] came at a time Peoria needed to rebuild
its community psyche.”105
Growth in the retail and service sectors reduced Peoria’s dependence on Caterpillar to
some extent, but the firm continued to be the main driver of economic activity in the 1990s.106
Local commentators pointed to a number of obstacles to executing development projects and
attracting businesses to Peoria. According to a newspaper account from the early 1990s, the city
still relied on “an ‘archaic’ long‐term economic development plan from the 1970s.”107 Some
developers complained about City Hall’s bureaucracy and stringent building standards. A
former member of the Downtown Redevelopment Commission mentioned that “part of the
problem with the cityʹs previous plans has been an inability to turn them into reality.”108 One of
the leaders of riverfront development blamed “a lack of continuing strong, intelligent and
decisive leadership in both the public and private sectors.”109
Accelerated progress in Peoria
Fortunately, the turn of the century brought forth local and regional initiatives that
accelerated Peoria’s economic transformation. In 2001, the associate dean of the University of
Illinois College of Medicine led an effort on the part of local medical centers, universities, and
104 “Development Group Changes with Times[:] EDC Has Led Efforts to Attract, Retain Jobs During Past 15 Years,”
Peoria Journal Star, July 7, 1996. 105 Ibid. 106 “Make No Mistake About It: This is a Caterpillar Town,” Peoria Journal Star, September 28, 2002. 107 “A Hotly Competitive Future; If Peoria Wobbles, Smaller Communities Will Pick Up the Economic Pieces,” Peoria
Journal Star, July 24, 1991. 108 “Should Peoria Dust Off Those Old Plans?—As the City Debates What Should Be Done with the Marriott Hotel
Space, Some Local Leaders Encourage a Look Toward the Past,” Peoria Journal Star, March 29, 2009. 109 Ibid.

32
the National Center for Agricultural Utilization Research110 to develop a bioscience strategy
that would build on the various institutionsʹ expertise.111 The following year, Caterpillar and
other local businesses and civic leaders formed a membership organization called Peoria Next
to promote technology‐centered development for the city. Through activities such as
networking meetings and business incubation, Peoria Next has built up a “knowledge
community network” to foster and sustain an intellectual creative class.112 One early mark of
success, growing out of research conducted at Caterpillar, was the founding of battery
developer Firefly Energy Inc., co‐winner of the 2007 Wall Street Journal Technology Innovation
Award.
In 2003, the Peoria City Council passed an ordinance creating the 773‐acre Peoria
Medical and Technology District. A commission of representatives from the neighborhoods,
businesses, and anchor institutions (Bradley University, Methodist Medical Center, OSF Saint
Francis Medical Center, the University of Illinois College of Medicine at Peoria, and the
National Center for Agricultural Utilization Research) developed a comprehensive master plan
for the Med‐Tech District, naming it “Renaissance Park.” As a result of the many new medical
infrastructure and research facilities being built in the district, Peoria is gaining recognition as a
“major medical powerhouse.”113 Aside from health care facilities, other large downtown projects
in the 2000s have included a new museum complex,114 renovation and expansion of the Peoria
Civic Center, and an upgrade to the zoo.115
Two major projects are improving Peoria’s transportation infrastructure, which had
become a major source of concern for manufacturers and distributors. The stateʹs $460 million
overhaul of Interstate 74 provided Peoria better highway system access, and the construction of
a new terminal at the Peoria International Airport is expected to be completed in 2010. In an
effort to coordinate resources and develop regional strategies, various economic development
organizations formed the Heartland Partnership,116 which provides a forum for identifying
110 The National Center for Agricultural Utilization Research is the largest of the four U.S. Department of Agriculture
regional research labs. 111“Will It Play? As the Loss of Manufacturing Jobs Continues to Corrode the Local Economy, Peoria Is Turning to
High‐Tech R&D Startups to Polish its Rust Belt Image,” Crainʹs Chicago Business, December 8, 2003. 112 “Make No Mistake About It: This Is a Caterpillar Town,” Peoria Journal Star, September 28, 2002. 113“Powerful Medicine —Local Health‐Care Community Continues to Take Economy to New Heights,” Peoria Journal
Star, October 14, 2006. 114 The $100 million Museum Square is a joint venture between Lakeview Museum and its partners, and Caterpillar. 115 “On Fertile Ground —New Faces See Peoria Turning Corner,” Peoria Journal Star, January 25, 2004. 116 The partners are Heartland Capital Network, Peoria Next, EDC, Peoria Area Chamber of Commerce, and the
Illinois Regional Port District.

33
regional issues and recommending actions to be considered by the Economic Development
Council for Central Illinois and the Peoria Area Chamber of Commerce.117
Peoria relies on long‐term planning to sustain its success. The Peoria Civic Federation,
primarily comprised of the leaders of the region’s largest employers, sponsored the Greater
Peoria Vision 2020, which was released in 2005 after a two‐year planning process. Several
community councils oversee the implementation of various regional master plan areas such as
quality of life, economic revitalization, youth and education, and leadership. In 2009, the city of
Peoria sought community input on the updated Comprehensive Plan,118 which develops an
overall vision for Peoria’s growth and development over the next 10 to 20 years.
Providence
Summary
Historically, Rhode Island’s capital, Providence, was an important manufacturing and
textile center, and was known as the capital of the jewelry making industry in the United States.
After World War II, the city fell into a downward spiral, losing population and jobs. As mills
closed and retailers moved to the suburbs, organized crime and corruption became entrenched
in the city. The poor condition of Providence’s finances prevented the city from taking part in
the sorts of revitalization programs that many cities around the country undertook during the
1970s. Fortunately, starting in the early 1980s, a series of major rehabilitation projects
transformed Providence, enabling its successful promotion as the “Renaissance City.” The
downtown area was renovated, attracting residents, artists, and visitors.
The population of Providence had started to shrink in the 1940s. The city experienced
particularly heavy population losses from 1960 to 1980 as some 50,000 more residents left the
city than migrated in. Providence’s rehabilitation projects and a large influx of Hispanics finally
reversed the declining population trend. The city, known for its Irish and Italian heritage, was
36 percent Hispanic as of 2005–07 (Figure 13).
The Renaissance City has made considerable improvements in educational attainment,
both in absolute terms and relative to comparison cities. The share of the adult population with
at least a high school education has more than doubled in the last 50 years, while the share that
finished college increased from below 7 percent in 1960 to 29 percent in 2005–07. When ranked
by share of college graduates, Providence improved from 12th among the comparison cities in
1960 to sixth in 2005–07. Despite these successes, the city still faces significant challenges, chiefly
concerning poverty and diversity issues.
117 http://www.heartlandpartnership.org/. 118 Peoria began the process of rewriting its Comprehensive Plan in March 2007, the first complete rewrite since 1991.

34
The rebirth of Providence
Sharp employment declines in the textile industry and the relocation of retailers in the
1960s produced further deterioration in Providence’s economy, which had been struggling since
the 1940s. As factories closed and population fled the city, construction came almost to a halt.
One study notes “the only major building program undertaken by the city in the 1950s and the
1960s was the construction of seven low‐income housing projects … and housing facilities for
the elderly.”119
In 1974, Vincent Cianci was elected as mayor. Although controversial, Cianci brought
energy and a strong presence to the city and led Providence to carry out ambitious projects.
During Cianci’s first decade in office, tax breaks, federal investment, and collaboration with the
business sector resulted in the construction of new hotels, the restoration of Union Station, and
the renovation of movie theaters.
In 1975, the Providence Foundation, a nonprofit organization comprising the chief
executive officers and top managers of some of the region’s leading businesses, was formed to
“create, plan and facilitate feasible downtown development projects.”120 Thanks to the
Foundation, important downtown projects (the Civic Center, the Majestic Theater, and two
hospitals) were executed in the 1970s. After Cianci left office, 121 the private sector—led by the
Providence Foundation, the Greater Providence Chamber of Commerce, and corporate
leaders—was instrumental in pursuing development initiatives.122
Two projects started in the early 1990s were essential in reconnecting downtown to the
rest of the city and in developing the waterfront, which is at the core of Providence’s attractions.
With the support of federal funding, railroad tracks running through the downtown area were
relocated underground. In addition, the two rivers that cross the city came back to life thanks to
the removal of the “widest bridge of the world” that had covered them for 50 years.
Cianci was reelected as mayor in the mid‐1990s, and he worked to establish tax
incentives to attract artists to live downtown and a loan program to help in launching
restaurants.123 The creation of the arts and entertainment district in 1996 was the lynchpin in the
cultural revival of the city.124 Providence’s success became “the talk of Americaʹs urban planners
and cultural observers, its virtues touted … on the front page of USA Today, and in an essay on
119 Orr and West (2002). 120 Leazes and Motte (2004). 121 In 1984, Cianci resigned after facing assault charges. 122 Marrion and West, op. cit., p. 404. 123 Marrion and West, op. cit., p. 406. 124 “Success of R.I. Arts District Encourages Plans in Md.; Incentives for Artists Also Boost Economy,” Baltimore Sun,
May 19, 2001.

35
architecture in the New York Times.”125 More recent projects in the downtown area have included
the construction of a new convention center and the Providence Place shopping mall. The
relocation of route 195, scheduled to be completed by 2012, will add more space to downtown
and improve the city’s transportation system.126
Alliances with foundations and nonprofits
Providence has benefited from collaborative and flexible relationships with foundations
and nonprofits. Using a revolving‐loan fund dedicated to economic revival, mixed‐income
housing, and an expanded arts district, the Rhode Island Foundation contributed $9 million in
2001 for the creation of the Downcity Partnership Inc., aimed at reviving Providence’s
downtown.127 The Providence Foundation and the City of Providence were partners in the
initiative. In 2004, the Downcity Partnership program was transferred to the Providence
Revolving Fund, a community‐based, nonprofit lending corporation established in 1980. The
Revolving Fundʹs resources are targeted to specific historic neighborhoods and primarily serve
low‐to‐moderate income families.
Community development corporations (CDCs) and other nonprofit organizations have
spearheaded housing, education, and training programs that serve as complements to
commercial redevelopment. Thanks to CDCs, “the cityʹs supply of affordable and decent
housing seems to be growing.”128 The New York headquartered Local Initiatives Support
Corporation (LISC) selected Providence as one of six demonstration sites129 for neighborhood
revitalization programs with the participation of local CDCs, the city, and the community. The
Providence Plan, a not‐for‐profit joint venture of the City of Providence, the State of Rhode
Island, the academic community, and the private sector, focuses on children’s well‐being,
workforce development, and community building. Its successful programs include Ready to
Learn Providence, YouthBuild Providence, and the Local Learning Partnership. In 1997, the
Pew Partnership for Civic Change selected Providence as one of 10 cities to participate in the
Pew Civic Entrepreneur Initiative, a nationwide project to train a diverse group of citizens to
play a greater role in decision‐making in their communities.130
In summary, Providence has been able to build on its numerous assets, including its
riverfront, historic buildings, and prestigious educational institutions—Brown University, the
Rhode Island School of Design, and Johnson and Wales Universityʹs famous culinary institute.
125 “What Rhode Island Needs Now,” Providence Journal, August 24, 1999. 126 The relocation will open access to more than 60 acres of land for riverfront development. 127 “Diamond Next to the Rough,” Providence Journal‐Bulletin, August 12, 2001 128 “Conversation with Barbara Karlin, Advocate for Neighborhoods,” Providence Journal‐Bulletin, April 18, 2000. 129 The other five sites are Indianapolis, Milwaukee, the Twin Cities, the Bay Area, and Washington, DC. 130 The Pew Partnership invited applications from more than 70 cities with populations between 150,000 and 450,000.

36
The city has become a tourist destination and a trendy place to live.131 However, challenges
remain. Most jobs created by the retail, accommodation, and arts and entertainment industries
are in low‐wage occupations; Providence’s distressed neighborhoods have not benefited fully
from the city’s renaissance; and the fraction of the population living in poverty remains quite
high. The city also is challenged by the need to provide adequate services to the rapidly
increasing minority population. According to the American Community Survey, nearly half of
Providence residents speak a language other than English at home. Of these foreign‐language
speakers, one‐third consider their English language skills to be poor.
Winston‐Salem
Summary
Winston‐Salem, long recognized for its tobacco industry, is now known internationally
for high tech and for being a pioneer in improving connectivity throughout the city. After
Winston‐Salem suffered a wave of job losses in the 1980s, universities and public‐private
partnerships contributed to the development of new industries. Regional alliances have been a
central part of the city’s development, as Winston‐Salem works closely with Greensboro and
High Point to draw businesses and support start‐ups.
In 2004, Winston‐Salem was selected by Partners for Livable Communities132 as one of
the 30 “Most Livable Communities,” based on its “creativity and ability to prepare for the new
economy.”133 Winston‐Salem was also named one of the world’s “Most Intelligent
Communities” in 2008, in a list drawn up by the Intelligent Community Forum.134 In 2006, the
city was included among “America’s 50 Hottest Cities” for business relocation or expansion,135
and in 2009 Forbes Magazine ranked the Winston‐Salem metropolitan area as the 18th best place
in the United States for business and careers.
Winston‐Salem’s land area has more than tripled and its population almost doubled
since 1960. Median family income as a share of the national average fell less than the shares of
the other comparison cities, and Winston‐Salem’s educational attainment has remained among
the highest when compared with similar cities (Figure 14).
131 “Smaller Is Better in New Urban Revival,” USA TODAY, August 16, 1999. 132 Founded in 1977, Partners for Livable Communities is a nonprofit leadership organization that promotes quality of
life, economic development, and social equity. 133 “Recent Award Recognizes City’s Achievements,” Winston‐Salem Journal, May 29, 2004. 134 For a city to be on the list, it has to excel in one of the following factors: broadband connectivity, knowledge
workforce, digital inclusion, innovation, and marketing and advocacy. 135 Expansion Management magazine asked over 80 prominent site location consultants to list their top city choices for
relocating and expanding companies, taking into consideration such factors as the business climate, work force
quality, operating costs, incentive programs, and ease of working with local political and economic development
officials.

37
From tobacco to high‐tech
The tobacco industry has gone through a deep transformation over the past two
decades, as has Winston‐Salem’s economy. Declining cigarette consumption and market
competition136 have adversely affected the R. J. Reynolds Tobacco Company (RJR), producer of
the famous Camel cigarettes and formerly Winston‐Salem’s largest employer. In the late 1980s,
Winston‐Salem suffered a series of employment losses as some of its major employers closed,
went bankrupt, or relocated.137 These job losses motivated the creation in 1987 of Winston‐Salem
Business Inc. (WSBI), an economic development nonprofit organization that has been recruiting
new businesses to Winston‐Salem and Forsyth County. Since its formation, WSBI has assisted
over 110 companies that together brought more than 10,000 jobs to the target area.
In 1991, the Winston‐Salem Chamber of Commerce developed the Blueprint for
Technology, which included initiatives for K‐12 public education.138 The Blueprint shifted the
city’s business focus from traditional manufacturing to technology‐based activities. In 1995, the
Piedmont Triad Research Park (PTRP), an urban‐based, mixed‐use technology research park,
was inaugurated in downtown Winston‐Salem. Among the park’s earliest occupants were the
Wake Forest University Health Sciences Department of Physiology and Pharmacology and a
team of researchers from Winston‐Salem State University.
In the mid‐1990s, Wake Forest University began to work on a plan to connect its medical
school and undergraduate campuses with a high‐speed network.139 Together, the university, the
Winston‐Salem Chamber of Commerce, local government, and other institutions pursued
projects to improve the city’s connectivity. The process resulted in the creation in 1997 of
WinstonNet,140 a nonprofit community technology initiative whose goal is “bridging the digital
divide.” Thanks to various public and private partnerships including Wireless Winston,
Idealliance, and the Piedmont Triad Entrepreneurial Network, nearly 90 percent of households
in Winston‐Salem subscribed to broadband as of 2008. 141
By the late 1990s, Winston‐Salem was better prepared to face job losses when R.J.
Reynolds Tobacco announced further layoffs and U.S. Airways closed its local maintenance
136 “Changing Times; A Dynamic Decade in the Triad,” News & Record, July 17, 1995. 137 Reynolds Tobaccoʹs parent company, RJR Nabisco, moved its headquarters from Winston‐Salem to Atlanta; AT&T
shut down its local operations; and McLean Trucking Company filed for bankruptcy. 138 The Chamber of Commerce contracts with the local school system to provide business partners that connect the
work world with the education world. The Chamber has also established a 42‐member Education Business Council to
engage the business community in increasing the high school graduation rate in the Winston‐Salem schools. 139 http://www.intelligentcommunity.org. 140 http://www.winstonnet.org/about/history.html. 141 http://www.intelligentcommunity.org.

38
center.142 Rising employment in health care and banking had offset many of the ongoing losses
of tobacco‐related jobs.143 The university‐affiliated hospital surpassed RJR as the city’s largest
employer and, as the home of two large regional banks, Winston‐Salem became the 11th‐largest
banking center in the country, just behind Boston.
Major business openings and expansions in the 2000s have included a Dell plant,144 a
U.S. Airways call center, and the Pepsi Customer Service Center.145 Local media reports
attributed these successes in part to city and state tax incentives and workforce training offered
by Forsyth Technical Community College.146 To help support smaller business development, the
Winston Works task force, formed by the Chamber of Commerce, launched a campaign to
encourage companies to dedicate at least one percent of their discretionary spending to local
suppliers.147
Reviving Winston‐Salem’s downtown area
The city has intensified its focus on downtown revitalization in recent years. In 2002, the
Winston‐Salem Alliance, a private economic‐development group, announced plans to invest $40
million in downtown development projects, and Wake Forest University revealed plans to
expand its Piedmont Triad Research Park.148 The Downtown Winston‐Salem Partnership, a
member and advocacy organization, is the lead organization implementing the Downtown Plan
developed in 2007. Part of the revitalization plan includes the Restaurant Row Program,149
introduced by the city with federal and state support to help recruit and finance new eateries.
The plan also calls for promoting Winston‐Salem as the “City of the Arts”150 and for attracting
businesses in the design industry.
142 “Forsyth Looks Beyond RJR Cuts; a Healthy Economy Should Help the County to Take the Layoffs in Stride Say
Business People,” Greensboro News & Record, December 15, 1998. 143 Between 1988 and 1998, R.J. Reynoldsʹ share of the city taxes levy dropped from 18 percent to 6 percent, and the
size of its local workforce fell by half. See The Economist (1999). 144 Lobbying by more than 100 Triad officials persuaded the General Assembly to provide more than $200,000 in
incentives for each job created at the Dell plant. “We’ve Got Dell: Alliance Site Best Suited to Plant’s Timetable,
Company Says; Local Officials Celebrate End of a ‘Very Aggressive’ Pursuit; Hiring Is Expected to Begin in April;
Assembly Plant Could Have 1,500 Workers in 5 Years,” Winston‐Salem Journal, December 23, 2004. 145 The Chamber helped form a Regional Call Center Group where representatives of many of the Triad’s call centers
meet to discuss issues and concerns and to work together on finding employees and solve other common problems. 146 “Triad Keeps US Airways Call Center Jobs, to Gain 300 More,” Triangle Business Journal, Wednesday, January 26,
2005. 147 “Increase Local Purchases, Businesses Urged; ‘Don’t Pass the Buck’ Drive Meant to Aid Triad Economy,” Winston‐
Salem Journal, February 14, 2004. 148 “A Shot in the Arm; Downtown Renewal to Get $39.5 Million Boost from Private Development Group,” Winston‐
Salem Journal, November 22, 2002. 149 http://www.dwsp.org/development_projects/restaurant_row.php. 150 “Going Forward with Arts Center Sends Right Signal for the Future,” Winston‐Salem Journal, February 15, 2009.

39
Worcester
Summary
As the third largest city in New England151 and geographically the closest resurgent city
to Springfield, Worcester historically has been a major industrial center and a transportation
hub, but has also struggled to acquire its own identity independent of Boston. Worcester missed
the economic boom that some other cities in Massachusetts experienced in 1980s. Fortunately,
the city was able to reposition itself as an important center for the biotechnology industry by the
1990s. With its 11 colleges and universities and major transportation improvements, the “City
of the Seven Hills” has been able to attract new businesses and to make progress on reversing
its earlier population declines.
Worcester’s accomplishments have gained nationwide recognition. The city won the
National Civic League All‐American city award in 2000 after a long hiatus. In 2008, Worcester
ranked 38th among Fortune Small Businesses’ “100 Best Places to Live and Launch, “152 and in
2009 the Worcester metropolitan statistical area was selected as one of Forbes’ most livable cities.
Worcester has done better than the average comparison city in terms of improving
educational attainment. The share of population with a college degree or more jumped from
only 7 percent in 1960, similar to the comparison group average, to 28 percent in 2005–07, seven
percentage points higher than average. In addition, Worcester went from having the fifth
highest crime rate in 1975 to tied (with New Haven) for the fifth lowest in 2007 (Figure 15 and
Appendix Table 6).
From manufacturing to life sciences
Worcester had many planned development projects in the 1980s that were supposed to
represent the largest investments in the city since World War II. However, with the exception of
a few important projects, including the Centrum and the Massachusetts Biotechnology Research
Park, most expectations were unfulfilled.153 A lack of leadership among local officials and
difficulties in obtaining financing have been widely cited as two of the factors responsible for
the missed opportunities of the 1980s.
151 Worcester had historically been the second largest city in New England, but the 2000 Census showed that
Providence’s population exceeded that of Worcester. 152 The ranking is based on indicators that include tax rates, job growth, number of parks and arts venues, health
infrastructure, average temperatures, percentage of startups, population growth, crime rates, and housing costs, as
well as interviews with entrepreneurs, local officials, and business experts. 153 A Business Worcester article commented that “more than a half‐dozen major projects were proposed for Downtown
Worcester in the mid‐1980s. Not one has been built yet. Some will never be built.” “Downtown Worcester: Missed
Opportunities,” December 25, 1989.

40
The creation of the Massachusetts Biotechnology Research Park, home of the
Massachusetts Biotechnology Research Institute (MBRI), was the beginning of the
biotechnology era in Worcester. The center has been characterized as “perhaps the most
successful biotech real estate development in the nation.”154 A Boston Globe article noted that the
MBRI “model of a public‐private partnership and grass‐roots support to create companies and
jobs is being adopted as far away as Scotland and as nearby as Maryland.” 155 The Chamber of
Commerce and the University of Massachusetts Medical Center156 played key roles in forming
the MBRI back in 1984. The MBRI, the strong educational base of the city,157 and low living costs
relative to those in the Boston area attracted biotech firms to the Worcester area.
Despite the biotechnology industry boom, the city had to readapt its development
approach because biotech companies often employ only small numbers of workers and take a
long time to achieve profitability. In 1998, the MBRI changed its name to Massachusetts
Biomedical Initiatives, as it launched efforts to attract medical devices companies that could
become an important source of jobs.
Missteps as well as successes
In the mid‐1990s, Worcester launched a marketing campaign to change its “old mill city”
image. At the same time, thanks to the partnership between various governmental entities, the
city started the renovation of Union Station, which had been shuttered for three decades.
Eventually, frequent commuter rail service was established between Worcester and Boston.
Another transformative transportation project, begun in 1995, was the building of a limited‐
access connector road that gave the city direct access to the Massachusetts Turnpike in 2007.158
Some of the city’s other investment initiatives begun in the 1990s have been less
successful. The 1996 expansion of the airport which “had been an off‐and‐on operation ever
since it opened in 1946”159 has failed to live up to its promise. The construction of Worcester
Common Outlets mall in the downtown area was a misstep as well. The outlet mall opened in
1994, replacing another mall that had been in disuse for a decade. However, most retailers left
within just a few years of its opening.
154 “Worcester’s Mass. Biotech Park Starts Building,” MASS HIGH TECH, November 30, 1992. 155 “High Tech to Biotech in Roxbury; Former Digital Plant to House Laboratories; Emerging Business,” Boston Globe,
August 7, 1994. 156 The medical school was funded in 1962 and became one of the top schools in the country. 157 Higher education institutions include UMass Medical School, Worcester Polytechnic Institute, Clark University,
College of the Holy Cross, and the Tufts University Veterinary School, among others. 158 For more detailed discussion of the significance of these transportation projects, see Worcester Regional Research
Bureau, Inc (2008). 159 Southwick (1998).

41
Worcester has continued to engage in significant economic development programs in
the 2000s. The Massachusetts College of Pharmacy and Health Sciences located its Worcester
campus downtown in 2005. The city is working on yet another project in the Common Outlets
location—this time, a mixed‐use development with retail, office, entertainment, and housing
space. The nonprofit organization Choose Worcester, founded in 2007, aims to attract new
businesses and help businesses that are already in the city to grow.
Wide‐ranging roles for colleges and universities
Finally, although universities have long been an important asset to Worcester, they have
become more closely integrated with the cityʹs economic development during the last decade.
The UniverCity Partnership was formed in 2005 to adopt strategies allowing higher education
institutions to participate in economic growth by improving local purchasing, employment, real
estate development, business incubation, and workforce development. 160 Among its current
efforts, the city is looking to attract more technology firms through the Worcester Polytechnic
Institute (WPI) Venture Forum.
Universities also have become engaged in community projects. For instance, WPI has
worked with the Worcester Business Development Corporation on turning useless brownfields
into attractive, multi‐purpose landscapes. The University Park Partnership (UPP), the result of
long‐standing collaboration between Clark University and its surrounding community, focuses
on neighborhood revitalization. 161
Lessons from the Resurgent Cities
As these accounts illustrate, city resurgence can take place regardless of the region of the
country or composition of the population. Some cities in the Northeast and Midwest have made
noteworthy recoveries from declines in manufacturing, while other cities in the same and
adjacent states have not. The successes have included places such as Fort Wayne and Evansville
with low minority shares, but also places such as Jersey City, New Haven, and Providence
where—as in Springfield—non‐Hispanic whites make up less than one‐half of the total
population.162 Fewer resurgent city residents are employed in manufacturing than in the past,
but manufacturing continues to account for between 6 percent (Jersey City) and 20 percent (Fort
Wayne) of city resident employment. In many of the resurgent cities—especially those along the
160 “Town‐Gown Partners Are Ready to Move,” Worcester Telegram & Gazette, April 10, 2005. 161 Clark students and faculty work and conduct research for UPP organizations, such as the Main South CDC. In
addition, many faculty and staff—including Clarkʹs current president—have become neighborhood residents. 162 In 2000, Jersey City ranked among the ten highest cities and Fort Wayne among the 10 lowest cities nationally in
terms of minority population share (defined according to individuals who classified themselves as Hispanic, a race
other than white, or both). See Berube (2003). Another study in the same volume notes that Greensboro and
Providence were among the 18 “’hypergrowth new Latino destinations.” See Suro and Singer (2003).

42
East Coast—both the health care sector and the education sector are important sources of jobs
for city residents.
These patterns suggest that Springfield faces no inherently insurmountable barriers to
resurgence. Nonetheless, to be relatively successful among its peer group, Springfield needs a
major focus on improving employment opportunities for city residents so as to raise their
incomes and reduce the incidence of poverty. To accomplish these objectives, Springfield must
remove barriers that prevent city residents from filling job openings and must attract more jobs
to the city and to parts of the surrounding area that are accessible to city residents.
While the stories from cities with higher incomes and lower poverty rates than
Springfield’s vary in some respects, they share common elements that provide useful lessons to
nonresurgent cities. Most notably, they illustrate that resurgence requires decades of sustained,
collaborative efforts on the part of governments, business groups, and nonprofit institutions. It
also requires the ability to imagine radical changes to the city and its economy—as well as
continued refinements—to ensure that important objectives are being met even as economic
conditions change. A successful transition to a knowledge‐based economy requires considerable
focus on human capital—both building up the skills of residents and attracting and retaining
well‐educated newcomers. Finally, some of the cities with sizeable minority populations have
decided in recent years to increase their focus on initiatives related to public schools, affordable
housing, and small businesses. Others appear likely to take steps along these same lines in an
effort to spread the benefits of their economic progress.
Leadership and collaboration
The stories of resurgence involve leadership on the part of key institutions or
individuals, as well as collaboration among the various constituencies with an interest in
economic development. In these success stories, the instigators of city revitalization recognized
that it was in their own interest to prevent further deterioration in the local economy. They
started by taking responsibility for bringing about improvement. Collaboration became
necessary because economic transformation is complex, and because outsiders—such as state
and national governments, foundations, and businesses that are potential sources of new jobs—
often require proof of joint efforts in order to contribute to the city’s development.
In the cases of Evansville and Providence, the turnarounds could be traced to municipal
economic development initiatives in the early to mid‐1960s. In both cases, however, energetic
city mayors implemented their visions with the support of outside resources. In Evansville the
Chamber of Commerce worked aggressively to attract large employers, and in Providence a
nonprofit foundation worked together with business executives to gain consensus on

43
downtown development projects. For both cities, the ongoing commitments of business and
nonprofit groups provided critical continuity when new mayors came into office.
Resurgent cities have actively promoted themselves. Although institutional
arrangements have varied across cities and over time, the more successful cities now typically
have a private, nonprofit organization heading economic development efforts. Such
organizations collaborate closely with local Chambers of Commerce and other
nongovernmental entities, but they have broader mandates. Economic development
organizations have institutionalized relationships with city government, usually in the form of
funding and representation on the board of directors. The Fort Wayne‐Allen County Economic
Development Alliance, which provides assistance to companies seeking to locate or expand
operations in Fort Wayne or Allen County, includes a city and a county employee working in‐
house.
Institutions of higher education have often played key roles in city resurgence. As noted,
New Haven’s redevelopment came about only after Yale University joined a city marketing
effort in the 1980s. Yale’s subsequent involvement with New Haven has taken various other
forms, including making substantial payments in lieu of property taxes, renovating university‐
owned downtown commercial properties, providing venture funding for biotechnology,
offering incentives to induce employees to purchase homes in the city, and financing efforts to
attack the city’s social and educational problems. Worcester, on the other hand, is an example
of a city with many colleges and universities, but no single dominant institution. There, a
special partnership was formed in the mid‐2000s to provide the city’s colleges and universities
roles and responsibilities in local economic development. In addition to the kinds of
involvement that Yale has had in New Haven, selected Worcester institutions have found
unique ways to contribute to the community. These have included locating new campuses in
the downtown area, working on brownfield remediation, and providing their expertise to
community organizations.
Many of the resurgent cities have also tapped into grant monies on the local and
national levels. Grand Rapids and Providence have benefited greatly from nearby private
philanthropies. Providence also has reached out to out‐of‐region nonprofits to help with
affordable housing and diversity initiatives. In addition to the examples noted for the
individual cities, other sources indicate that a number of national foundations focus on the
types of problems that the comparison group cities have in common. For instance, a recent
study points to “the Kauffman Foundation’s support of entrepreneurs and new businesses, the
Annie E. Casey Foundation’s focus on how economic and workforce development affects the
well‐being of children and families, the Surdna Foundation’s new work on ‘weak‐market’ cities,

44
and the Charles Stewart Mott Foundation’s interest in sectoral workforce and economic
development strategies.” 163
The resurgent cities offer examples on how to coordinate with regional and
neighborhood players. Unlike the situation in New England, counties in the Midwest and South
are important governmental entities, and regional efforts are the norm there. Nonetheless,
regional economic development organizations have sometimes carved out specific bodies to
focus on city concerns. For example, the Growth Alliance for Greater Evansville formed a
separate Downtown Development Division. Similarly, Greensboro had long benefited from
collaboration with the other cities in the Piedmont Triad, but in 2001 formed a nonprofit
organization to coordinate the economic development efforts of the city’s business and civic
groups. In Grand Rapids, the Neighborhood Business Alliance works with the Chamber of
Commerce on economic development strategies. A Jersey City development corporation
operating in one of the city’s poorest areas has received national recognition for involving the
community in implementing economic planning.
Recreating city infrastructure and economies
Like Springfield, all of the cities under review had locational advantages that made them
prosper in the industrial era. Many were well located for both water and rail transportation,
which proved important in getting delivery of raw materials and in supplying finished goods to
market. Over the course of the last several decades, the resurgent cities have focused on
modernizing their transportation and communications infrastructures by expanding regional
airports, improving roads, and building high‐speed broadband networks. Such infrastructure
improvements have been important draws for both manufacturing and nonmanufacturing
firms. Providence offers perhaps the most dramatic example of infrastructure makeovers to
reconnect the downtown area with the rest of the city and to redevelop the waterfront area.
The stories of resurgence involve more than modernizing infrastructure and industries.
Some cities not only built on their traditional strengths, but also succeeded in creating business
clusters virtually from scratch. For example, Grand Rapids set out in the 1990s to become a
major center for health care in an initiative that has resulted in the creation of medical facilities
and research institutions to form the “Medical Mile.” Likewise, Peoria decided to focus on
health care and medical technology and is now gaining recognition as a “major medical
powerhouse.” Winston‐Salem, once known internationally only for tobacco, chose to emphasize
Internet connectivity and has gained renown for creativity and intelligence. Jersey City built up
a finance cluster starting from a 1960 base that was not much larger than Springfield’s. In
163 See McGahey and Vey (2008). pp. 22–23.

45
hindsight, this growth strategy for Jersey City may seem obvious, given its proximity to New
York City. However, another nearby city in the comparison group, Paterson, did not seize its
similar locational advantage.
The resurgent cities have also illustrated the need to adapt to changing circumstances.
In some cases, a given development strategy proved successful in some respects, but not others.
For example, working with the Chamber of Commerce and the University of Massachusetts,
Worcester established the Massachusetts Biotechnology Research Institute to attract biotech
companies. The city later broadened its focus to include medical devices companies so as to
increase the job‐creation potential of its life sciences cluster. In other cases, development
projects had to be scrapped or radically overhauled. Worcester abandoned a failed shopping
mall in favor of a mixed‐use project that includes office and residential space.
Another striking feature of resurgent cities’ stories is the need for continuing
innovations in overall development strategy. In the 1980s, Fort Wayne adapted to the shutdown
of its largest employer by attracting investments on the part of other large companies. More
recently, however, the city’s focus has been on becoming a stronger player in high‐tech
entrepreneurship. Greensboro succeeded in attracting service jobs, but is now actively
recruiting higher paying employers. Peoria realized in the 1990s that building up its retail and
service sectors was insufficient to bring about the desired rate of economic growth. The city
turned to new strategies centered on medical research, technology, and entrepreneurship.
Developing human capital
During the 1980s and 1990s, “buying jobs” was a key part of economic development
activities in the resurgent cities. For example, Fort Wayne aggressively used low‐interest
financing and tax abatements to attract new business activity. To the present day, Jersey City
benefits from state tax incentives, and Greensboro competes in part based on its low cost of
doing business relative to other cities in the nation.
With the continued transition to a knowledge‐based economy, development strategies
increasingly have emphasized improvements to human capital. As the resurgent cities
demonstrate, institutions of higher education can play a broader role beyond educating
students in degree and certificate programs. Greensboro offers the most comprehensive role
model among the comparison cities. There, community colleges provide courses related to
fundamental job skills, and universities partner with businesses in developing innovative
products and skills related to areas such as pharmaceuticals and nanotechnology. Another
useful model is New Haven, where local universities, private industry, and state government
have collaborated to disseminate biotech‐related education in the public schools by providing
teacher training, assistance in curriculum design, and a mobile laboratory facility.

46
Another aspect of developing human capital is attracting talent. As noted, employer‐
sponsored home buying programs have been used in New Haven and Worcester, and
Springfield recently launched such an initiative. Other examples include efforts to appeal to
young professionals and entrepreneurs, such as the networking organizations that exist in
Peoria and Worcester, and the vibrant arts district in Providence.
Extending prosperity to disadvantaged and minority neighborhoods
Despite their overall successes, the resurgent cities continue to struggle with extending
prosperity to a broader share of their populations. Except for Fort Wayne, all had poverty rates
exceeding 17 percent as of 2005–07. In fact, poverty remains more prevalent in Providence and
New Haven than in a half‐dozen of the cities in the nonresurgent list (Akron, Allentown,
Bridgeport, Rockford, South Bend, and Waterbury).
Some of the resurgent cities have implemented distinct efforts to improve opportunities
for their poor and minority residents, and to narrow the differences between the haves and the
have‐nots. Although they are separate initiatives, these programs often adopt approaches
similar to those used to generate prosperity more generally. Most importantly, they involve
collaborations. As noted, The Providence Plan to promote children’s well‐being, workforce
development, and community building is a joint venture of the City of Providence, the State of
Rhode Island, the academic community, and local businesses. In Jersey City, the success of
economic development plans in poor neighborhoods that were not benefiting from the
riverfront area boom required community involvement in shaping local economic plans and
controlling their implementation.
Next Steps for Springfield
No research study is capable of laying out the agenda for Springfield. This one has
attempted to lay out reasonable aspirations for the city, and to add to the available information
concerning the economic development approaches tried by Springfield’s peer cities.
On the one hand, the message is a positive one. Nothing about Springfield’s past or
present industry mix, demographic composition, or geography prevents the city from becoming
as successful as the 10 resurgent cities that started in similar circumstances a half century ago.
On the other hand, this report aims to challenge Springfield’s various constituencies.
The hope is that they will compare their actions with those taken by their counterparts in other
cities and, in doing so, will come up with some fresh ideas about how to deal with lingering
challenges. Rather than ending with recommendations, therefore, the study offers Springfield
residents, businesses, city government, and other organizations the following discussion
questions in connection with the case studies from resurgent peer cities:

47
How might the lessons from the resurgent cities be adapted to suit Springfield’s
situation?
What specific local groups might collaborate or form to promote and implement the
revitalization of Springfield?
What similar economic development efforts have been tried in Springfield?
o For those that have had some success, how could they be improved or
expanded?
o For those that have had limited success or have fizzled, what prevented the
achievement of their goals?
Have the efforts made on behalf of the revitalization of Springfield aimed high
enough, and have they had the support they needed?
Which economic development efforts from the resurgent cities have not been tried in
Springfield?
o Which are worth further consideration?
o What is the most promising action plan?
What next steps should individuals or groups who are inspired by the successes of
the resurgent cities take to re‐energize Springfield’s economy and community?

References
Barone, Michael. 1998. “A City Where Business and Philanthropy Flourish.” American Enterprise
9(5).
Berube, Alan. 2003. “Racial and Ethnic Change in the Nation’s Largest Cities.” In Redefining
Urban & Suburban America: Evidence from Census 2000, Volume 1, ed. Bruce J. Katz and Robert E.
Lang. Washington DC: Brookings Institution Press.
Browne, Lynn, and DeAnna Green with Marques Benton, Prabal Chakrabarti, Yolanda
Kodrzycki, Ana Patricia Muñoz, David Plasse , and Richard Walker. 2009. “Towards a More
Prosperous Springfield, Massachusetts: Project Introduction and Motivation.” Federal Reserve
Bank of Boston Community Affairs Discussion Paper No. 01. Boston: Federal Reserve Bank of
Boston. Available at
http://www.bos.frb.org/commdev/pcadp/2009/pcadp0901.pdf
De la Cruz, Patricia, and Angela Brittingham. 2003. “The Arab Population: 2000.” Census 2000
Brief. Washington, DC: U.S. Census Bureau.
Forrant, Robert. 2009. Metal Fatigue: American Bosch and the Demise of Metalworking in the
Connecticut River Valley. New York: Baywood Publishing Company.
Fox, Radhika, and Miriam Axel‐Lute. 2008. “To Be Strong Again: Renewing the Promise in
Smaller Industrial Cities.” PolicyLink. Available at
https://www.policyarchive.org/bitstream/handle/10207/13689/ToBeStrongAgain.pdf?sequence=
2.
Furdell, Kimberly, and Harold Wolman. 2006. “Toward Understanding Urban Pathology:
Creating a Typology of ‘Weak Market’ Cities.” George Washington Institute of Public Policy
Working Paper No. 021. Washington, DC: The George Washington University.
Available at http://www.gwu.edu/~gwipp/papers/wp021.pdf.
Initiative for a Competitive Inner City (ICIC). 2005. “State of the Inner City Economies: Small
Businesses in the Inner City.” Washington, DC: The Office of Advocacy of the U.S. Small
Business Administration. Available at
http://www.sba.gov/advo/research/rs260tot.pdf.
Kneebone, Elizabeth. 2009. “Job Sprawl Revisited: The Changing Geography of Metropolitan
Employment.” Metropolitan Policy Program at Brookings. Washington, DC: The Brookings
Institution. Available at
http://www.brookings.edu/~/media/Files/rc/reports/2009/0406_job_sprawl_kneebone/20090406_
jobsprawl_kneebone.pdf.
Leazes, Francis J., and Mark T. Motte. 2004. Providence, the Renaissance City. Boston:
Northeastern University Press.
McGahey, Richard M. 2008. “Regional Economic Development in Theory and Practice.” In
Retooling for Growth: Building a 21st Century Economy in America’s Older Industrial Areas, ed.
48

Richard M. McGahey and Jennifer S. Vey, 3–31. Washington, DC: Brookings Institution Press.
Available at
http://www.brookings.edu/~/media/Files/Press/Books/2008/retoolingforgrowth/retoolingforgro
wth_chapter.pdf.
McKinsey & Company discussion report. 2000. “Building Consensus for Greensboro’s Future.”
Available at
http://www.actiongreensboro.org/reports/McKinsey1.pdf.
Mieszkowski, Peter, and Edwin S. Mills. 1993. “The Causes of Metropolitan Suburbanization.”
Journal of Economic Perspectives 7(3): 135–147.
Muro, Mark, John Schneider, David Warren, Eric McLean‐Shinaman, Rebecca Sohmer,
Benjamin Forman, with Dana Ansel and Greg Leiserson. 2007. “Reconnecting Massachusetts
Gateway Cities: Lessons Learned and an Agenda for Renewal.” Boston: Massachusetts Institute
for a New Commonwealth. Available at
http://www.massinc.org/fileadmin/researchreports/gateway_cities/gateway_cities_full.pdf.
Orr, Marion, and Darrell M. West. 2002. “Citizens’ Views on Urban Revitalization: The Case of
Providence, Rhode Island.” Urban Affairs Review 37(3): 397–419.
Rae, Douglas. 2003. City: Urbanism and Its End. New Haven, CT: Yale University Press.
Southwick, Albert B. 1998. 150 Years of Worcester: 1948‐1998. Worcester, MA: Chandler House
Press.
Suro, Roberto, and Audrey Singer. 2003. “Changing Patterns of Latino Growth in Metropolitan
America.” In Redefining Urban & Suburban America: Evidence from Census 2000, ed. Bruce J. Katz
and Robert E. Lang, 181‐210. Washington DC: Brookings Institution Press.
Teaford, Jon C. 1993. Cities of the Heartland. The Rise and Fall of the Industrial Midwest.
Bloomington: Indiana University Press.
Urban Land Institute. 2006. “Springfield Massachusetts, Strategies for a Sustainable City.”
Washington, DC: Urban Land Institute. Available at
http://www.springfieldcityhall.com/COS/fileadmin/reports/SpringfieldMA06v6_lores.pdf.
Wolman, Harold, Edward W. Hill, and Kimberly Furdell. 2000. “Evaluating the Success of
Urban Success Stories: Is Reputation a Guide to Best Practice?” Housing Policy Debate 15(4): 965–
997.
Worcester Regional Research Bureau. 2008. “What’s Up with Downtown Worcester? Prospects
for Revitalization.” Report 08‐08. Worcester, MA: The Worcester Regional Research Bureau.
Available at http://www.wrrb.org/documents/WRRB‐08‐08.pdf.
49

50

Figure 2
Source: U.S. Bureau of the Census. County and City Data Book (1960).
Figure 3
0
10
20
30
40
50
60Waterbury
Flint
Gary
Bridgeport
Paterson
Rockford
Akron
Allentown
Rochester
Youngstown
Erie
South Ben
d
Worcester
Dayton
Winston‐Salem
Grand Rapids
Providen
ce
Springfield
Jersey City
Fort W
ayne
Peo
ria
New
Haven
Syracuse
Evansville
Hartford
Green
sboro
Share of employed residents working in manufacturing , 1960
Resurgent cities
Percent
250000
300000
350000
Population, 1960
Source: U.S. Bureau of the Census. County and City Data Book (1960).
0
10
20
30
40
50
60Waterbury
Flint
Gary
Bridgeport
Paterson
Rockford
Akron
Allentown
Rochester
Youngstown
Erie
South Ben
d
Worcester
Dayton
Winston‐Salem
Grand Rapids
Providen
ce
Springfield
Jersey City
Fort W
ayne
Peo
ria
New
Haven
Syracuse
Evansville
Hartford
Green
sboro
Share of employed residents working in manufacturing , 1960
Resurgent cities
Percent
0
50000
100000
150000
200000
250000
300000
350000
Rochester
Akron
Jersey City
Dayton
Syracuse
Providen
ce
Flint
Worcester
Gary
Grand Rapids
Springfield
Youngstown
Hartford
Fort W
ayne
Bridgeport
New
Haven
Paterson
Evansville
Erie
South Ben
d
Rockford
Green
sboro
Winston‐Salem
Allentown
Waterbury
Peo
ria
Population, 1960
Resurgent cities
51

Figure 4
23
25
27
29
Population poverty rate
Springfield
Average other cities
Percent
60
70
80
90
100
110
120
1960 1980 2000 2005–07
Median family income as a share of U.S. median
Springfield
Averageresurgent cities
Average other cities
Source: U.S. Bureau of the Census. County and City Data Book (1960), Decennial Census (1980 and 2000), A i C it S (2005 2007)
15
17
19
21
23
25
27
29
1980 2000 2005–07
Population poverty rate
Springfield
Average other cities
Averageresurgent cities
Percent
60
70
80
90
100
110
120
130
1960 1980 2000 2005–07
Population as a percentage of 1960 population
Springfield
Average resurgent cities
Average other cities
Percent
60
70
80
90
100
110
120
1960 1980 2000 2005–07
Median family income as a share of U.S. median
Springfield
Averageresurgent cities
Average other cities
American Community Survey (2005–2007). 52

Figure 5
Source: U.S. Bureau of the Census. County and City Data Book (1960), Decennial Census (1980 and 2000), American Community Survey (2005–2007).
30
40
50
60
70
80
90
1960 1980 2000 2005–07
Share of population 25 years and older completing at least high school: comparison of Springfield to averages of peer cities
Springfield Average Resurgent Cities Average Other Cities
Percent
20
25
30
Share of population 25 years and older with college degree or more: comparison of Springfield to averages of peer citiesPercent
Source: U.S. Bureau of the Census. County and City Data Book (1960), Decennial Census (1980 and 2000), American Community Survey (2005–2007).
30
40
50
60
70
80
90
1960 1980 2000 2005–07
Share of population 25 years and older completing at least high school: comparison of Springfield to averages of peer cities
Springfield Average Resurgent Cities Average Other Cities
Percent
5
10
15
20
25
30
1960 1980 2000 2005–07
Share of population 25 years and older with college degree or more: comparison of Springfield to averages of peer cities
Springfield Average Resurgent Cities Average Other Cities
Percent
53
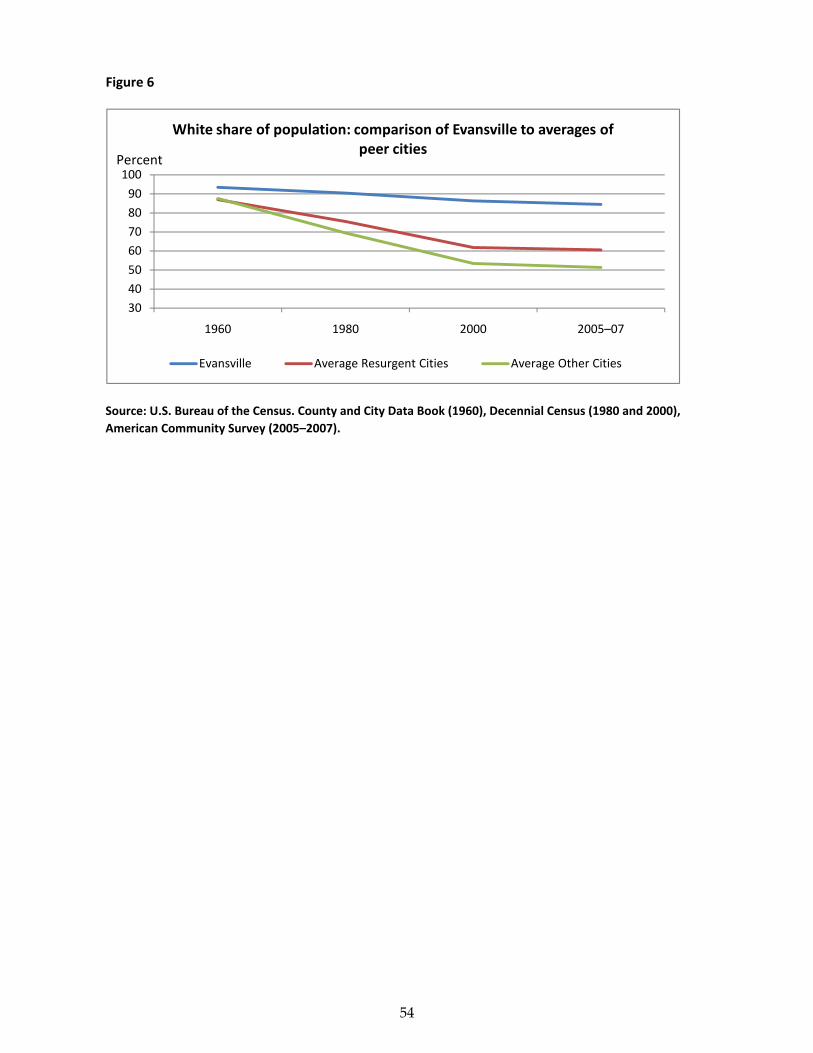
Figure 6
Source: U.S. Bureau of the Census. County and City Data Book (1960), Decennial Census (1980 and 2000), American Community Survey (2005–2007).
30
40
50
60
70
80
90
100
1960 1980 2000 2005–07
White share of population: comparison of Evansville to averages of peer cities
Evansville Average Resurgent Cities Average Other Cities
Percent
54
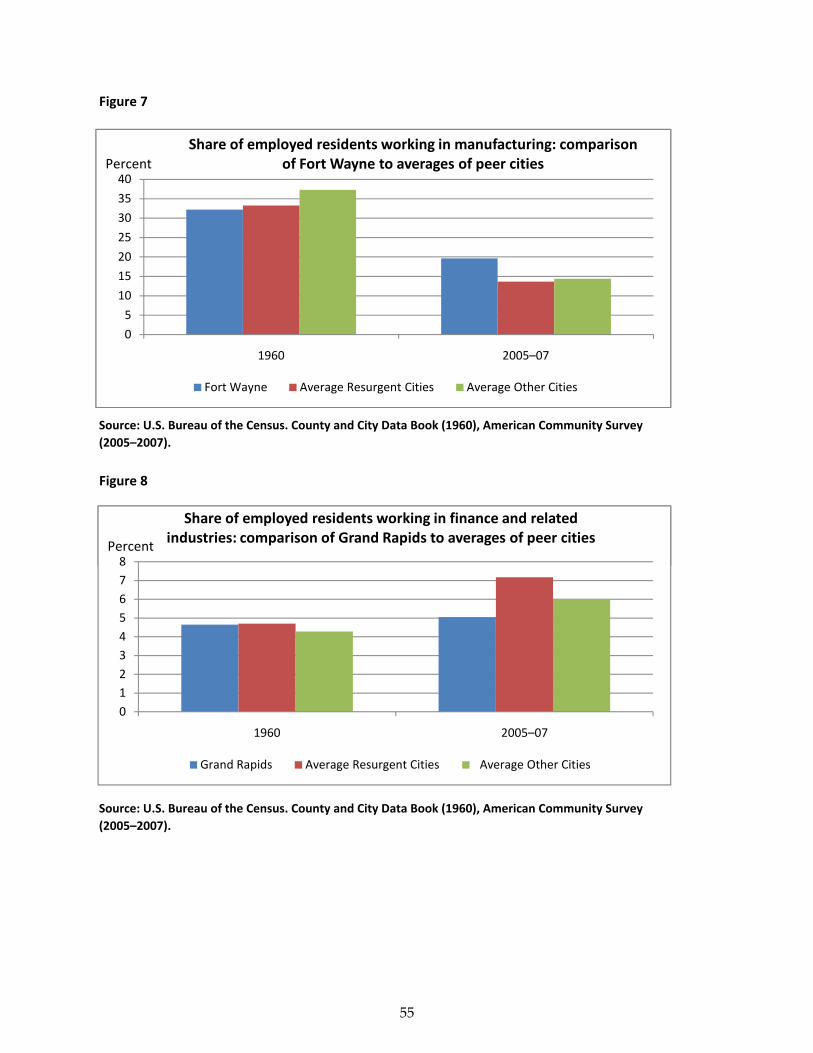
Figure 7
Figure 8
Source: U.S. Bureau of the Census. County and City Data Book (1960), American Community Survey (2005–2007).
0
5
10
15
20
25
30
35
40
1960 2005–07
Share of employed residents working in manufacturing: comparison of Fort Wayne to averages of peer cities
Fort Wayne Average Resurgent Cities Average Other Cities
Percent
8
Share of employed residents working in finance and related industries: comparison of Grand Rapids to averages of peer cities
Percent
Source: U.S. Bureau of the Census. County and City Data Book (1960), American Community Survey (2005–2007).
0
5
10
15
20
25
30
35
40
1960 2005–07
Share of employed residents working in manufacturing: comparison of Fort Wayne to averages of peer cities
Fort Wayne Average Resurgent Cities Average Other Cities
Percent
0
1
2
3
4
5
6
7
8
1960 2005–07
Share of employed residents working in finance and related industries: comparison of Grand Rapids to averages of peer cities
Grand Rapids Average Resurgent Cities Average Other Cities
Percent
55

Figure 9
Figure 10
Source: U.S. Bureau of the Census. County and City Data Book (1960), Decennial Census (1980 and 2000), American Community Survey (2005‐07).
25
30
Population poverty rate: comparison of Jersey City to averages of peer citiesPercent
5
10
15
20
25
30
35
40
1960 1980 2000 2005–07
Share of population 25 years and older with college degree or more: comparison of Greensboro to averages of peer cities
Greensboro Average Resurgent Cities Average Other Cities
Percent
Source: U.S. Bureau of the Census. County and City Data Book (1960), Decennial Census (1980 and 2000), American Community Survey (2005–2007).
10
15
20
25
30
1980 2000 2005–07
Population poverty rate: comparison of Jersey City to averages of peer cities
Jersey City Average Resurgent Cities Average Other Cities
Percent
5
10
15
20
25
30
35
40
1960 1980 2000 2005–07
Share of population 25 years and older with college degree or more: comparison of Greensboro to averages of peer cities
Greensboro Average Resurgent Cities Average Other Cities
Percent
56
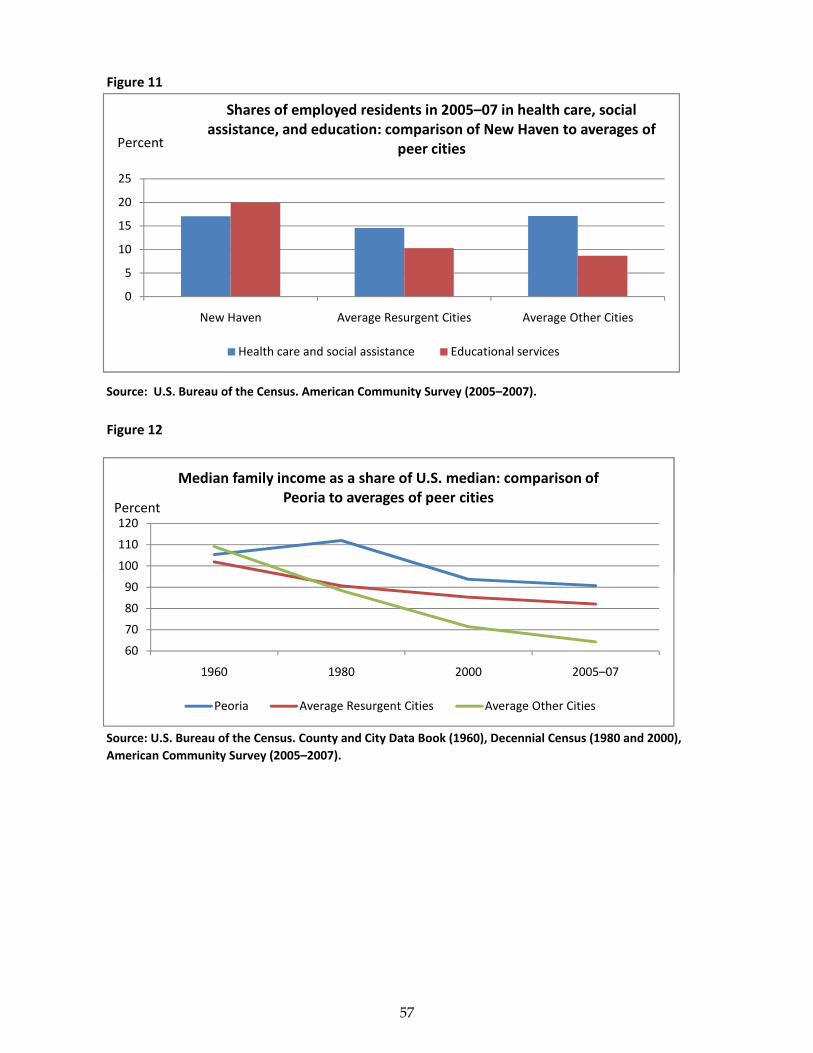
Figure 11
Source: U.S. Bureau of the Census. American Community Survey (2005–2007).
Figure 12
0
5
10
15
20
25
New Haven Average Resurgent Cities Average Other Cities
Shares of employed residents in 2005–07 in health care, social assistance, and education: comparison of New Haven to averages of
peer cities
Health care and social assistance Educational services
Percent
100
110
120
Median family income as a share of U.S. median: comparison of Peoria to averages of peer cities
Percent
Source: U.S. Bureau of the Census. County and City Data Book (1960), Decennial Census (1980 and 2000), American Community Survey (2005–2007).
0
5
10
15
20
25
New Haven Average Resurgent Cities Average Other Cities
Shares of employed residents in 2005–07 in health care, social assistance, and education: comparison of New Haven to averages of
peer cities
Health care and social assistance Educational services
Percent
60
70
80
90
100
110
120
1960 1980 2000 2005–07
Median family income as a share of U.S. median: comparison of Peoria to averages of peer cities
Peoria Average Resurgent Cities Average Other Cities
Percent
57

Figure 13
Figure 14
Source: U.S. Bureau of the Census. County and City Data Book (1960), Decennial Census (1980 and 2000), American Community Survey (2005–2007).
0
5
10
15
20
25
30
35
40
1980 2000 2005–07
Hispanic share of population: comparison of Providence to averages of peer cities
Providence Average Resurgent Cities Average Other Cities
Percent
25
30
35
Share of population 25 years and older with college degree or more: comparison of Winston‐Salem to averages of peer cities
Percent
Source: U.S. Bureau of the Census. County and City Data Book (1960), Decennial Census (1980 and 2000), American Community Survey (2005–2007).
0
5
10
15
20
25
30
35
40
1980 2000 2005–07
Hispanic share of population: comparison of Providence to averages of peer cities
Providence Average Resurgent Cities Average Other Cities
Percent
0
5
10
15
20
25
30
35
1960 1980 2000 2005–07
Share of population 25 years and older with college degree or more: comparison of Winston‐Salem to averages of peer cities
Winston‐Salem Average Resurgent Cities Average Other Cities
Percent
58

Figure 15
Source: U.S. Bureau of the Census. County cand City Data Book (1975); U.S. Department of Justice, Federal Bureau of Investigation. Crime in the United States, 2007.
0
20
40
60
80
100
120
1975 2007
Crime rate (total number of crimes per 1000 residents): comparison of Worcester to averages of peer cities
Worcester Average Resurgent Cities Average Other Cities
59

Table 1 Key Economic Indicators for Springfield and Peer‐Group Cities, 1960 to 2005–07
1960 2005–07 1960 2005–07 1980 2005–07
1960 2005–07
Evansville 93.6 76.9 25 8 12.2 17.8 5.6 141,543 113,627 80.3 yes
Fort Wayne 114.7 89.4 4 3 11.0 13.9 2.9 161,776 249,830 154.4 yes
Grand Rapids 107.2 75.2 10 11 13.5 21.9 8.4 177,313 193,671 109.2 yes
Greensboro 103.3 87.8 19 4 12.8 18.7 5.9 119,574 237,423 198.6 yes
Jersey City 105.1 80.1 17 6 21.2 17.4 ‐3.8 276,101 234,914 85.1 yes
New Haven 103.6 71.9 18 13 23.2 24.0 0.8 152,048 123,507 81.2 no
Peoria 105.3 90.7 16 2 12.3 16.9 4.7 103,162 111,351 107.9 yes
Providence 89.6 70.2 26 14 20.4 27.2 6.9 207,498 170,220 82.0 no
Winston‐Salem 93.9 85.6 24 5 16.4 18.6 2.2 111,135 213,889 192.5 yes
Worcester 102.5 92.4 20 1 14.4 18.3 3.9 186,587 165,965 88.9 no
Springfield 105.9 65.2 13 18 17.8 27.7 9.9 174,463 148,136 84.9 noAkron 114.2 69.0 5 16 15.0 21.4 6.4 290,351 200,172 68.9 yes
Allentown 106.9 67.1 11 17 11.7 22.3 10.6 108,347 108,900 100.5 no
Bridgeport 105.7 76.8 15 9 20.4 19.2 ‐1.2 156,748 130,748 83.4 no
Dayton 110.7 58.9 8 21 20.8 29.6 8.8 262,332 146,762 55.9 yes
Erie 101.3 69.5 22 15 13.4 24.3 10.8 138,440 100,393 72.5 yes
Flint 112.0 55.5 7 23 16.9 33.2 16.3 196,940 108,304 55.0 yes
Gary 106.1 56.7 12 22 20.4 33.2 12.8 178,320 86,723 48.6 yes
Hartford 105.8 51.0 14 26 25.2 31.5 6.3 162,178 118,655 73.2 no
Paterson 97.9 63.3 23 19 25.2 24.5 ‐0.7 143,663 142,443 99.2 no
Rochester 112.4 54.8 6 24 17.5 30.0 12.5 318,611 199,697 62.7 no
Rockford 121.3 78.7 1 7 10.3 20.2 9.9 126,706 147,794 116.6 yes
South Bend 118.1 73.5 2 12 12.1 21.6 9.5 132,445 98,516 74.4 yes
Syracuse 110.4 59.0 9 20 18.4 30.7 12.3 216,038 139,896 64.8 no
Waterbury 115.5 76.0 3 10 14.1 18.8 4.7 107,130 108,554 101.3 no
Youngstown 101.6 52.9 21 25 18.2 29.6 11.4 166,689 68,592 41.1 no
All cities 106.3 71.1 16.7 23.6 6.8 173,698 148,795 91.7
Resurgent cities 101.9 82.0 15.7 19.5 3.7 163,674 181,440 118.0
Other cities 109.1 64.3 17.3 26.1 8.8 179,963 128,393 75.2
Source: U.S. Bureau of the Census. County and City Data Book (1960), American Community Survey (2005–2007).
Rank (1=highest) Percent
Average
More than 10%
expansion in land area,
1960 to 2000
Percentage
point change
1980 to
2005–07
2005–07 as a
percentage of
1960
Resurgen
t cities
Other cities
Median family income Population Poverty Rate Population
Percent of U.S. median
60

ManufacturingRetail and
wholesale tradeEducational services
Finance, insurance, and real estate All Other*
Evansville 30.6 22.1 4.6 3.9 38.8
Fort Wayne 32.2 21.1 4.2 5.5 37.0
Grand Rapids 34.8 21.3 4.7 4.6 34.6
Greensboro 29.5 20.2 7.0 5.9 37.3
Jersey City 33.2 15.4 3.3 6.9 41.2
New Haven 31.5 16.3 9.3 3.7 39.2
Peoria 32.0 21.3 4.1 4.6 38.0
Providence 34.5 16.8 6.1 3.7 39.0
Winston‐Salem 36.2 15.5 6.6 3.5 38.3
Worcester 37.9 18.6 5.7 4.7 33.0
Springfield 33.9 19.8 4.2 6.2 35.9All cities 38.4 17.9 4.8 4.3 34.7
Resurgent cities** 33.2 18.9 5.6 4.7 37.6
Other cities** 41.6 17.3 4.2 4.0 32.8
* Agriculture and mining; Construction; Transportation and utilities; Other services; and Public administration.
** None of the averages for the resurgent cities is statistically significantly different from the averages for the other cities.
Source: U.S. Bureau of the Census. County and City Data Book (1960).
Table 2 Employment by SIC Industry, 1960 (percentages of total city resident employment)Resurgen
t cities
Average
61

Health care and social
assistanceManufac‐turing
Retail trade
Educational services
Leisure and
hospitality
Professional and business
servicesFinancial activities
Other services All Other*
Evansville 11.9 16.3 14.3 5.7 11.4 8.9 6.0 6.1 19.4
Fort Wayne 14.5 19.6 11.1 7.2 9.7 8.1 6.2 4.3 19.2
Grand Rapids 14.4 18.1 11.6 8.7 9.9 9.6 5.0 5.2 17.5
Greensboro 12.1 12.5 12.4 11.2 10.1 9.0 8.2 3.3 21.2
Jersey City 12.7 6.4 8.7 7.2 7.6 13.5 14.3 4.7 25.0
New Haven 17.1 9.9 10.2 20.0 8.3 8.6 5.1 5.7 15.2
Peoria 16.3 15.8 10.8 8.9 10.5 9.7 6.3 5.4 16.3
Providence 14.8 15.0 10.8 12.6 12.5 8.5 6.5 4.3 14.9
Winston‐Salem 15.7 11.8 10.9 9.7 9.9 9.5 7.9 4.8 19.7
Worcester 16.0 11.2 12.8 11.6 9.3 9.1 6.3 5.1 18.7
Springfield 19.1 12.5 10.2 8.8 9.0 7.4 6.9 5.0 21.0
All cities 16.1 14.4 11.9 9.3 9.9 8.6 6.0 5.0 18.9
Resurgent cities 14.5** 13.7 11.4 10.3 9.9 9.5** 7.2** 4.9 18.7
Other cities 17.1** 14.8 12.2 8.7 9.9 8.1** 5.2** 5.0 19.0
*Natural resources; Construction; Wholesale trade; Transportation, warehousing, and utilities; Information; and Government.
Source: U.S. Bureau of the Census. American Community Survey (2005–2007).
Table 3 Employment by NAICS Industry, 2005–07 (percentages of total city resident employment)
Average
** Average for resurgent cities is statistically significantly different from the average for the other cities in Healthcare and social
assistance; Professional and business services; and Financial activities.
Resurgen
t cities
62

1960 2005–07 1960 2005–07 1960 2005–07
Evansville 93.4 86.1 6.6 11.7 0.0 2.2
Fort Wayne 92.6 78.4 7.2 15.5 0.2 6.1
Grand Rapids 91.7 68.5 8.0 21.1 0.3 10.4
Greensboro 74.0 52.6 25.8 39.7 0.2 7.6
Jersey City 86.5 35.5 13.3 28.7 0.2 35.9
New Haven 85.1 45.7 14.5 36.8 0.4 17.6
Peoria 90.5 67.8 9.3 26.7 0.2 5.4
Providence 94.2 50.3 5.4 15.6 0.4 34.1
Winston‐Salem 62.9 55.0 37.1 34.7 0.0 10.3
Worcester 98.8 79.7 1.1 9.0 0.1 11.3
Springfield 92.3 52.4 7.5 22.4 0.2 25.1All cities 87.4 56.4 12.5 30.6 0.2 13.0
Resurgent cities** 87.0 62.0 12.8 24.0 0.2 14.1
Other cities** 87.6 52.9 12.3 34.7 0.2 12.4
Source: U.S. Bureau of the Census. American Community Survey (2005–2007).
Table 5 Hispanic population (percent of total residents)1980 2005–07
Evansville 0.5 1.5
Fort Wayne 2.2 6.8
Grand Rapids 3.2 16.4
Greensboro 0.8 6.5
Jersey City 18.6 27.7
New Haven 8.0 24.0
Peoria 1.4 2.9
Providence 5.8 36.0
Winston‐Salem 0.8 12.2
Worcester 4.3 17.7
Springfield 9.1 33.6All cities 6.2 17.1
Resurgent cities* 4.5 15.2
Other cities** 7.3 18.3
** Neither for the resurgent cities is statistically significantly different from the averages for the other cities.
Source: U.S. Bureau of the Census. Decennial Census (1980), American Community Survey (2005–2007).
** None of the averages for the resurgent cities is statistically significantly different from the averages for
the other cities.
Note: In 2005–07, entries show the number of white‐alone and black‐alone populations as a percent of
total single‐race population, with all other and mixed races as the residual.
Table 4 Race (percent of population***)
All Other*
Resurgen
t cities
Resurgen
t cities
Average
Average
White Black
*Asian; American Indian and Alaska Native; Native Hawaiian and Other Pacific Islander; or some other race.
63

Table 6
1975Total Total Violent *
Evansville 63.9 50.7 4.5
Fort Wayne 76.7 43.7 3.1
Grand Rapids 76.1 62.5 9.7
Greensboro 67.4 71.8 9.7
Jersey City 70.0 38.3 10.1
New Haven 128.6 42.6 10.4
Peoria 103.7 46.1 0.0
Providence 83.6 53.2 5.6
Winston‐Salem 80.0 62.8 7.6
Worcester 111.5 43.0 8.7
Springfield 83.5 66.3 13.7All cities 86.5 57.7 9.0
Resurgent cities** 86.2 51.5 6.9
Other cities** 86.8 61.7 10.3
*Violent crime includes murder, rape, aggravated assault, and robbery.
Crime rate (number of crimes per 1000 population)
Source: U.S. Bureau of the Census. County and City Data Book (1975 and 2000); U.S. Department
of Justice, Federal Bureau of Investigation. Crime in the United States, 2007.
Average
Resurgen
t cities
2007
**Averages for the resurgent cities are statistically significantly different from the averages for the
other cities in 2007 at the 90% level of confidence.
64

Appendix Table 1Population and Resident Manufacturing Employment Shares for Springfield and Peer‐Group Cities, 1960 to 1980(in order of manufacturing share in 1960)
City State Region 1960 1970 1980 1960 1970 1980Waterbury CT Northeast 107,130 108,033 103,266 51.7 39.9 40.5
Gary IN Midwest 178,320 175,249 151,953 50.5 46.8 42.9
Flint MI Midwest 196,940 193,380 159,611 50.5 43.8 42.2
Bridgeport CT Northeast 156,748 156,546 142,546 45.0 38.0 39.9
Paterson NJ Northeast 143,663 144,830 137,970 44.7 36.0 43.6
Rockford IL Midwest 126,706 147,205 139,712 44.6 40.6 38.1
Akron OH Midwest 290,351 275,425 237,177 44.0 38.4 29.5
Allentown PA Northeast 108,347 109,521 103,758 41.7 37.2 35.7
Rochester NY Northeast 318,611 295,011 241,741 41.2 38.5 34.5
Youngstown OH Midwest 166,689 139,702 115,436 41.0 36.4 30.6
Erie PA Northeast 138,440 129,220 119,123 40.2 38.1 34.0
South Bend IN Midwest 132,445 125,802 109,727 39.4 30.0 26.4
Worcester MA Northeast 186,587 176,603 161,799 37.9 28.9 27.2
Dayton OH Midwest 262,332 243,459 203,371 36.4 32.7 22.6
Winston‐Salem NC South 111,135 132,901 131,885 36.2 31.5 27.2
Grand Rapids MI Midwest 177,313 197,534 181,843 34.8 28.5 27.6
Providence RI Northeast 207,498 179,223 156,804 34.5 29.2 31.7
Springfield MA Northeast 174,463 163,886 152,319 33.9 27.7 28.1Jersey City NJ Northeast 276,101 260,350 223,532 33.2 29.4 25.4
Fort Wayne IN Midwest 161,776 177,738 172,196 32.2 30.2 26.0
Peoria IL Midwest 103,162 126,964 124,160 32.0 28.2 26.3
New Haven CT Northeast 152,048 137,715 126,109 31.5 21.5 23.1
Syracuse NY Northeast 216,038 197,270 170,105 31.3 22.5 20.6
Evansville IN Midwest 141,543 138,690 130,496 30.6 30.1 26.1
Hartford CT Northeast 162,178 158,017 136,392 30.1 21.1 24.1
Greensboro NC South 119,574 144,245 155,642 29.5 26.6 25.4
Population Manufacturing Industry Share
Note: In this table, the shaded rows provide data for resurgent cities, and the unshaded rows provide data for Springfield and the other
remaining cities.
Source: U.S. Bureau of the Census. County and City Data Book (1960 and 1970), Decennial Census (1980).
65

Appendix Table 2Population, 1960 to 2005‐07City 1960 1980 2000 2005‐07Akron 290,351 237,177 217,074 200,172
Allentown 108,347 103,758 106,632 108,900
Bridgeport 156,748 142,546 139,529 130,748
Dayton 262,332 203,371 166,179 146,762
Erie 138,440 119,123 103,717 100,393
Evansville 141,543 130,496 121,582 113,627
Flint 196,940 159,611 124,943 108,304
Fort Wayne 161,776 172,196 205,727 249,830
Gary 178,320 151,953 102,746 86,723
Grand Rapids 177,313 181,843 197,800 193,671
Greensboro 119,574 155,642 223,891 237,423
Hartford 162,178 136,392 121,578 118,655
Jersey City 276,101 223,532 240,055 234,914
New Haven 152,048 126,109 123,626 123,507
Paterson 143,663 137,970 149,222 142,443
Peoria 103,162 124,160 112,936 111,351
Providence 207,498 156,804 173,618 170,220
Rochester 318,611 241,741 219,773 199,697
Rockford 126,706 139,712 150,115 147,794
South Bend 132,445 109,727 107,789 98,516
Springfield 174,463 152,319 152,082 148,136Syracuse 216,038 170,105 147,306 139,896
Waterbury 107,130 103,266 107,271 108,554
Winston‐Salem 111,135 131,885 185,776 213,889
Worcester 186,587 161,799 172,648 165,965
Youngstown 166,689 115,436 82,026 68,592
Source: U.S. Bureau of the Census. County and City Data Book (1960), Decennial Census (1980 and 2000), American Community Survey (2005–2007).
66

Appendix Table 3Median family income and population poverty rate*
Level ($2007)City 1960 1980 2000 2005‐07 2005‐07 1980 2000 2005‐07Akron 114.2 90.5 78.7 69.0 41,649 15.0 17.5 21.4
Allentown 106.9 97.2 74.6 67.1 40,492 11.7 18.5 22.3
Bridgeport 105.7 83.8 79.1 76.8 46,340 20.4 18.4 19.2
Dayton 110.7 76.8 69.9 58.9 35,544 20.8 23.0 29.6
Erie 101.3 91.0 72.8 69.5 41,962 13.4 18.8 24.3
Evansville 93.6 91.4 82.1 76.9 46,422 12.2 13.7 17.8
Flint 112.0 100.8 62.8 55.5 33,528 16.9 26.4 33.2
Fort Wayne 114.7 98.3 90.0 89.4 53,977 11.0 12.5 13.9
Gary 106.1 97.8 64.4 56.7 34,262 20.4 25.8 33.2
Grand Rapids 107.2 94.8 88.4 75.2 45,404 13.5 15.7 21.9
Greensboro 103.3 98.2 100.3 87.8 53,016 12.8 12.3 18.7
Hartford 105.8 70.5 54.1 51.0 30,805 25.2 30.6 31.5
Jersey City 105.1 80.9 83.2 80.1 48,387 21.2 18.6 17.4
New Haven 103.6 75.3 71.8 71.9 43,404 23.2 24.4 24.0
Paterson 97.9 71.9 70.8 63.3 38,225 25.2 22.2 24.5
Peoria 105.3 111.9 93.7 90.7 54,762 12.3 18.8 16.9
Providence 89.6 75.1 64.1 70.2 42,392 20.4 29.1 27.2
Rochester 112.4 86.2 62.5 54.8 33,095 17.5 25.9 30.0
Rockford 121.3 109.6 90.8 78.7 47,491 10.3 14.0 20.2
South Bend 118.1 94.9 78.0 73.5 44,400 12.1 16.7 21.6
Springfield 105.9 83.4 72.5 65.2 39,371 17.8 23.1 27.7Syracuse 110.4 83.3 66.0 59.0 35,646 18.4 27.3 30.7
Waterbury 115.5 91.7 84.5 76.0 45,898 14.1 16.0 18.8
Winston‐Salem 93.9 89.1 93.1 85.6 51,668 16.4 15.2 18.6
Worcester 102.5 91.0 85.9 92.4 55,778 14.4 17.9 18.3
Youngstown 101.6 85.1 61.3 52.9 31,948 18.2 24.8 29.6
Source: U.S. Bureau of the Census. County and City Data Book (1960), Decennial Census (1980 and 2000), American Community Survey (2005–2007).
Population poverty rate(percent)Percent of U.S. median
Median family income
* U.S. median family income was $60,374 (in 2007 inflation‐adjusted dollars), and the U.S. poverty rate was
13.3 percent in 2005‐07.
67

Appendix Table 4
City 1960 1980 2000 2005‐07 1960 1980 2000 2005‐07Akron 40.9 62.4 80.0 84.6 6.9 12.5 18.0 19.3
Allentown 36.1 59.7 72.7 76.5 6.3 10.9 15.4 16.7
Bridgeport 32.4 50.7 65.0 72.0 4.7 8.7 12.2 13.6
Dayton 38.2 59.3 75.1 78.0 5.8 10.4 14.4 14.7
Erie 41.6 64.8 79.9 84.5 6.4 11.3 17.4 18.2
Evansville 39.1 61.1 80.7 82.3 6.0 11.2 16.7 16.7
Flint 41.0 60.5 74.5 80.0 5.9 9.2 11.3 12.0
Fort Wayne 47.4 68.7 83.2 86.8 7.7 13.3 19.4 24.7
Gary 36.0 55.0 72.7 81.3 5.1 7.6 10.1 11.7
Grand Rapids 40.6 67.1 78.0 80.9 7.4 16.4 23.8 26.9
Greensboro 48.4 68.6 84.3 85.4 12.9 24.6 33.9 35.2
Hartford 34.5 50.8 60.8 66.5 6.1 11.9 12.4 12.8
Jersey City 28.4 51.2 72.6 81.3 4.2 11.7 27.5 34.4
New Haven 38.2 60.9 73.6 80.1 9.3 19.8 27.1 30.9
Paterson 24.0 42.4 58.5 67.6 3.8 6.2 8.2 8.5
Peoria 40.0 69.6 82.8 87.6 7.1 19.4 28.0 32.1
Providence 32.7 53.4 65.8 72.4 6.8 15.7 24.4 29.4
Rochester 34.5 58.0 73.0 77.3 6.4 13.9 20.1 21.6
Rockford 43.1 66.8 77.8 79.5 7.7 14.9 19.8 18.8
South Bend 45.6 65.6 77.7 80.6 9.3 14.7 20.3 22.4
Springfield 41.8 63.5 73.4 74.4 6.4 11.8 15.4 17.5Syracuse 43.5 63.6 76.2 78.9 10.7 17.9 23.2 24.0
Waterbury 34.7 55.4 71.7 78.8 4.5 9.4 13.9 14.5
Winston‐Salem 42.2 62.2 80.2 83.9 12.1 21.9 30.3 30.4
Worcester 39.9 62.6 76.7 83.5 7.2 14.8 23.3 28.2
Youngstown 34.5 56.0 73.2 77.1 4.7 7.3 9.7 10.4
High school diploma or higher Bachelor's degree or higher
Educational Attainment * (percent of population 25 years and older)
* U.S. percent of population 25 years and older with high school diploma or higher was 84 percent and
the percent with bachelor's degree or higher was 27 percent in 2005‐07.Source: U.S. Bureau of the Census. County and City Data Book (1960), Decennial Census (1980 and 2000), American Community Survey (2005–2007).
68

Appendix Table 5A. Race*(percent of total population**)
City 1960 1980 2000 2005‐07 1960 1980 2000 2005‐07 1960 1980 2000 2005‐07Akron 86.9 76.8 68.6 65.8 13.0 22.2 29.1 31.3 0.1 1.0 2.3 2.9
Allentown 99.2 93.5 75.2 66.7 0.7 3.1 8.1 10.5 0.1 3.4 16.6 22.8
Bridgeport 90.1 68.9 47.7 47.2 9.8 21.0 32.6 35.3 0.1 10.1 19.7 17.5
Dayton 78.1 62.1 54.4 53.5 21.8 36.9 43.9 44.7 0.1 1.1 1.7 1.7
Erie 95.1 89.2 82.5 80.9 4.8 9.7 14.5 15.0 0.1 1.1 3.0 4.0
Evansville 93.4 90.4 87.4 86.1 6.6 8.8 11.1 11.7 0.0 0.8 1.5 2.2
Flint 82.3 56.2 42.7 41.6 17.5 41.4 55.0 55.6 0.2 2.4 2.3 2.8
Fort Wayne 92.6 83.2 77.2 78.4 7.2 14.6 17.8 15.5 0.2 2.2 5.0 6.1
Gary 61.1 25.2 12.1 10.8 38.8 70.8 85.5 86.4 0.1 4.0 2.4 2.7
Grand Rapids 91.7 80.9 69.5 68.5 8.0 15.7 21.1 21.1 0.3 3.3 9.4 10.4
Greensboro 74.0 65.7 56.5 52.6 25.8 33.0 38.0 39.7 0.2 1.3 5.5 7.6
Hartford 84.5 50.3 29.3 30.4 15.3 33.9 40.2 39.6 0.2 15.8 30.4 30.0
Jersey City 86.5 57.1 36.1 35.5 13.3 27.7 30.1 28.7 0.2 15.2 33.8 35.9
New Haven 85.1 62.1 45.2 45.7 14.5 31.9 38.9 36.8 0.4 6.0 15.9 17.6
Paterson 85.1 50.9 32.8 25.7 14.7 34.1 35.1 31.5 0.2 15.0 32.1 42.8
Peoria 90.5 81.5 70.8 67.8 9.3 16.7 25.3 26.7 0.2 1.8 3.9 5.4
Providence 94.2 81.2 58.1 50.3 5.4 11.8 15.5 15.6 0.4 7.0 26.5 34.1
Rochester 92.4 69.5 50.2 49.3 7.4 25.8 40.1 42.2 0.2 4.7 9.7 8.5
Rockford 95.7 84.3 74.7 72.3 4.2 13.2 17.8 20.1 0.1 2.5 7.5 7.6
South Bend 90.1 79.5 68.0 65.2 9.8 18.3 25.3 25.6 0.1 2.2 6.7 9.2
Springfield 92.3 76.1 58.5 52.4 7.5 16.6 21.9 22.4 0.2 7.4 19.6 25.1Syracuse 94.3 81.3 66.7 63.9 5.2 15.7 26.3 28.9 0.5 3.0 7.0 7.3
Waterbury 93.3 83.5 69.7 70.1 6.6 11.6 16.9 19.0 0.1 4.8 13.4 10.9
Winston‐Salem 62.9 59.0 56.5 55.0 37.1 40.2 37.7 34.7 0.0 0.8 5.9 10.3
Worcester 98.8 93.9 79.8 79.7 1.1 2.9 7.1 9.0 0.1 3.2 13.1 11.3
Youngstown 80.9 64.4 52.2 50.1 19.0 33.3 44.9 47.5 0.1 2.2 2.9 2.4* U.S. population was 76 percent white, 13 percent black and 11 percent of all other races in 2005‐07.
Source: U.S. Bureau of the Census. County and City Data Book (1960); Decennial Census (1980 and 2000); American Community Survey (2005‐07).
**In 1960 and 1980, table entries show the numbers of whites, blacks, and all other races as a percent of the population. "All other" refers
to Asian, American Indian and Alaska Native, Native Hawaiian and other Pacific Islander, or some other race. Starting in 2000 respondents
could report more than one race. In 2000 and 2005‐07, table entries show the numbers of white‐ alone and black‐alone populations as a
percent of total single‐race population, with all other and mixed races as the residual. There was a sharp increase in the "other race"
population in the 1980 Census, reflecting the addition of a question on Hispanic origin, an increased propensity for Hispanics not to identify
themselves as white, and a change in editing procedures to accept reports of "other race" for respondents who wrote in Hispanic entries
such as Mexican, Cuban, or Puerto Rican. In 1970, such responses in the other race category were reclassified and tabulated as white.
All other BlackWhite
69

(percent of total population**)
City 2000 2005-07 2000 2005-07 2000 2005-07Akron 68.3 64.6 28.8 31.1 2.9 4.3
Allentown 66.9 54.6 6.6 9.2 26.5 36.2
Bridgeport 32.9 26.2 31.0 34.5 36.0 39.2
Dayton 53.7 52.7 44.0 44.6 2.3 2.7
Erie 80.9 78.5 14.2 14.7 4.9 6.8
Evansville 86.9 85.4 10.6 11.6 2.5 3.0
Flint 41.8 40.5 54.1 55.4 4.0 4.1
Fort Wayne 75.0 75.5 17.5 15.3 7.5 9.1
Gary 10.1 9.1 84.9 86.0 5.0 4.9
Grand Rapids 64.6 61.2 20.6 20.8 14.7 18.0
Greensboro 54.7 49.7 37.8 39.6 7.6 10.7
Hartford 18.8 17.2 38.3 38.2 42.9 44.5
Jersey City 25.1 24.8 28.3 27.0 46.6 48.2
New Haven 37.2 34.6 37.2 35.9 25.6 29.5
Paterson 14.0 11.4 33.5 30.5 52.5 58.1
Peoria 69.9 66.8 24.9 26.6 5.1 6.7
Providence 49.0 42.5 13.1 13.7 38.0 43.8
Rochester 46.4 42.2 38.7 41.2 15.0 16.6
Rockford 70.5 64.0 17.5 20.0 12.0 16.0
South Bend 65.3 61.7 24.8 25.2 9.8 13.1
Springfield 50.9 42.5 20.4 21.8 28.7 35.7Syracuse 64.9 60.5 25.4 27.9 9.7 11.7
Waterbury 60.4 53.4 15.7 17.8 23.9 28.9
Winston‐Salem 53.4 51.2 37.1 34.6 9.5 14.2
Worcester 73.4 67.9 6.7 8.4 20.0 23.7
Youngstown 50.7 45.9 43.9 46.9 5.4 7.2
American Community Survey (2005‐07).
White Black All other
B. Race of Non‐Hispanic Population*
Source: U.S. Bureau of the Census. Decennial Census (2000);
*U.S. non‐Hispanic white‐alone population accounted for 68 percent of the total
single‐race population and non‐Hispanic black‐alone for 12 percent of the total
single‐race population in 2005‐07.
** Table entries show the number of non‐Hispanic white‐alone and non‐Hispanic
black‐alone populations as a percent of the total single‐race population, with all
other and mixed races as the residual.
70

C. Hispanic population* (percent of total population)
1980 2000 2005‐07Akron 0.6 1.2 1.7
Allentown 5.1 24.4 34.6
Bridgeport 18.7 31.9 33.3
Dayton 0.9 1.6 1.8
Erie 1.1 4.4 5.4
Evansville 0.5 1.1 1.5
Flint 2.5 3.0 3.5
Fort Wayne 2.2 5.8 6.8
Gary 7.1 4.9 4.8
Grand Rapids 3.2 13.1 16.4
Greensboro 0.8 4.4 6.5
Hartford 20.5 40.5 41.1
Jersey City 18.6 28.3 27.7
New Haven 8.0 21.4 24.0
Paterson 28.7 50.1 55.3
Peoria 1.4 2.5 2.9
Providence 5.8 30.0 36.0
Rochester 5.4 12.8 13.6
Rockford 2.9 10.2 13.9
South Bend 2.4 8.5 10.8
Springfield 9.1 27.2 33.6Syracuse 1.7 5.3 6.0
Waterbury 6.7 21.8 27.1
Winston‐Salem 0.8 8.6 12.2
Worcester 4.3 15.1 17.7
Youngstown 3.3 5.2 6.8
*The share of Hispanic population in the U.S. was 15 percent in 2005‐07.
American Community Survey (2005–2007).Source: U.S. Bureau of the Census. Decennial Census (1980 and 2000),
71

Appendix Table 6Crime Rate* (number of crimes per 1,000 population)
Total Violent**Akron 87.4 NA 57.8 7.5
Allentown 58.2 53.8 57.7 8.1
Bridgeport 96.7 62.6 59.4 11.6
Dayton 133.5 95.9 77.6 10.3
Erie 46.7 36.9 35.5 5.3
Evansville 63.9 49.8 50.7 4.5
Flint 125.9 83.5 86.1 23.6
Fort Wayne 76.7 60.2 43.7 3.1
Gary 77.2 55.8 55.0 6.9
Grand Rapids 76.1 69.4 62.5 9.7
Greensboro 67.4 71.3 71.8 9.7
Hartford 136.4 84.2 69.2 11.3
Jersey City 70.0 52.2 38.3 10.1
New Haven 128.6 76.7 42.6 10.4
Paterson 89.1 41.9 39.5 10.0
Peoria 103.7 NA 46.1 0.0
Providence 83.6 81.0 53.2 5.6
Rochester 88.3 77.1 65.9 11.4
Rockford 76.2 NA 73.4 13.5
South Bend 88.7 83.9 73.5 7.7
Springfield 83.5 81.8 66.3 13.7Syracuse 69.5 58.1 52.9 10.3
Waterbury 70.6 NA 56.8 3.6
Winston‐Salem 80.0 94.7 62.8 7.6
Worcester 111.5 51.4 43.0 8.7
Youngstown 60.5 75.4 60.3 10.0
* U.S. total crime and violent crime rates were 37.3 and 4.7, respectively, in 2007.
**Violent crime includes murder, rape, aggravated assault and robbery.
20071975 2000City
Source: U.S. Bureau of the Census. County cand City Data Book (1975 and 2000); U.S. Department of Justice, Federal Bureau of Investigation. Crime in the United States, 2007.
72