reindeer pasture biomass assessment using satellite remote sensing
TRANSCRIPT

Reindeer Pasture Biomass Assessment Using Satellite Remote SensingAuthor(s): Alfred Colpaert, Jouko Kumpula and Mauri NieminenSource: Arctic, Vol. 56, No. 2 (Jun., 2003), pp. 147-158Published by: Arctic Institute of North AmericaStable URL: http://www.jstor.org/stable/40513049 .
Accessed: 15/06/2014 15:45
Your use of the JSTOR archive indicates your acceptance of the Terms & Conditions of Use, available at .http://www.jstor.org/page/info/about/policies/terms.jsp
.JSTOR is a not-for-profit service that helps scholars, researchers, and students discover, use, and build upon a wide range ofcontent in a trusted digital archive. We use information technology and tools to increase productivity and facilitate new formsof scholarship. For more information about JSTOR, please contact [email protected].
.
Arctic Institute of North America is collaborating with JSTOR to digitize, preserve and extend access to Arctic.
http://www.jstor.org
This content downloaded from 185.44.78.76 on Sun, 15 Jun 2014 15:45:45 PMAll use subject to JSTOR Terms and Conditions

ARCTIC VOL 56, NO. 2 (JUNE 2003) P. 147-158
Reindeer Pasture Biomass Assessment Using Satellite Remote Sensing ALFRED COLPAERT,1 JOUKO KUMPULA2 and MAURI NIEMINEN2
(Received 27 February 2001; accepted in revised form 23 August 2002)
ABSTRACT. The present state of reindeer winter and summer pastures in northern Finland has been mapped using field sampling, remote sensing, and GIS . The winter pasture inventory was made during 1 995-96 and the summer pasture inventory during 1 997- 98. Winter pastures can be divided into ground lichen and arboreal lichen pastures. Autumn pastures, including pastures with grasses, dwarf shrubs, and mushrooms, were also mapped and added to the inventory of winter pastures. Summer and winter pastures partly overlap, but the main pasture areas are clearly distinct from each other. Major summer feeding areas are marshes, mires and river meadows, and mountain birch woodland. Biomass data were obtained by volumetric calculations of lichens and standard samples of the green parts of summer fodder plants. The results show that the most abundant lichen resources are found in the northern part of the management area, while the most abundant summer pasture resources prevail in the middle and southern parts. The overall accuracy of the winter pasture mosaic is 88%, with a Kappa coefficient of 0.84. The overall accuracy of the summer pasture mosaic is 84%, with a Kappa coefficient of 0.81.
Key words: reindeer, Rangifer tarandus tarandus L., pasture mapping, Landsat-5, summer pastures, winter pastures, lichens
RÉSUMÉ. On a cartographie l'état actuel des pâturages d'hiver et des estives du renne dans le nord de la Finlande à l'aide de
l'échantillonnage sur le terrain, de la télédétection et du SIG. L'inventaire des pâturages d'hiver a été réalisé au cours de 1995- 1996 et celui des estives au cours de 1997-1998. Les premiers peuvent être divisés en pâturages à lichens terricoles et en pâturages à lichens corticoles. Les pâturages d'automne, incluant ceux comprenant des herbages graminés, des arbustes nains et des
champignons, ont également été cartographies et ajoutés à l'inventaire des pâturages d'hiver. Ces derniers et les estives se chevauchent en partie, mais leurs zones principales sont nettement séparées. Les zones majeures de broutage utilisées en été sont les marais, les bourbiers et les prairies riveraines, ainsi que la forêt-parc de bouleau fontinal. Les données de biomasse ont été obtenues par calcul volumétrique des lichens et des échantillons normalisés de la partie verte des plantes fourragères d'été. Les résultats montrent que les ressources lichéniques les plus abondantes se trouvent dans la partie nord de la zone de gestion, tandis
que les ressources d' estives les plus abondantes sont concentrées dans la partie médiane et plus au sud. La précision d'ensemble de la mosaïque des pâturages d'hiver est de 88 %, avec un coefficient de Kappa de 0,84, tandis que celle de la mosaïque des estives est de 84 %, avec un coefficient de Kappa de 0,81.
Mots clés: renne, Rangifer tarandus tarandus L., cartographie de pâturages, Landsat-5, estives, pâturages d'hiver, lichens
Traduit pour la revue Arctic par Nésida Loyer.
INTRODUCTION
The Finnish reindeer {Rangifer tarandus tarandus L.) is a semidomesticated Rangifer species. It is closely related to the wild Fennoscandian and Siberian mountain and forest reindeer and the North American caribou. Reindeer are physiologically and ecologically well adapted to Arctic conditions (McEwan and Whitehead, 1970; Miller, 1978). During winter, reindeer sustain themselves on lichens, grasses, and shrubs, of which ground and arboreal lichens can be said to be the most critical for survival (Andreyev, 1977; Helle and Saastamoinen, 1979; Helle, 1984; Helle and Tarvainen, 1984; Kojola et al., 1995, 1998). During summer, reindeer graze selectively on many different plant species (Skogland, 1978).
The Finnish reindeer does not show the typical migratory behaviour seen in wild reindeer and caribou. Through
domestication and selection, the Finnish reindeer has become sedentary, having a home range of only 300-600 km2, although lack of food can trigger movement over consider- able distances (Kumpula and Nieminen, 1992).
Reindeer are a unique source of livelihood for many families in the North because they can survive under harsh conditions, using resources that otherwise would be of limited economic use. Reindeer are also an integral part of northern Finland's cultural heritage and therefore one of its major tourist attractions. Finnish reindeer herding is regulated by the Reindeer Management Law of 1932 (revised in 1948 and 1990), which restricts free grazing of reindeer to northern Finland (Fig. 1) (Poronhoitolakie- sityksentarkistamistyöryhmä, 1988;Poronhoitolaki, 1990).
The reindeer management area is divided into 56 dis- tricts, with a total area of 123 000 km2. These districts vary in size from 600 km2 to 5700 km2. Fences or natural
1 University of Oulu, Department of Geography, P.O. Box 3000, FIN-90014, University of Oulu, Finland; [email protected] 2 Finnish Game and Fisheries Research Institute, Reindeer Research, FIN-99910 Kaamanen, Finland
© The Arctic Institute of North America
This content downloaded from 185.44.78.76 on Sun, 15 Jun 2014 15:45:45 PMAll use subject to JSTOR Terms and Conditions

148 • A. COLPAERT et al.
FIG. 1 . The Finnish reindeer management area. Lines show boundaries of major vegetation zones, middle boreal (MB), northern boreal (NB), and oro-arctic (OA).
borders restrict movement between districts, but reindeer graze freely within the area they belong to. Because of their sedentary character and free grazing habit, reindeer tend to trample and overgraze lichen pastures during sum- mer and autumn.
A reindeer management district, or paliskunta, as it is called in Finnish, is a co-operative unit with a legal status. These districts are represented in the Reindeer Herders Association, which is funded by the Finnish government (Huttu-Hiltunen et al., 1990; Paliskuntain yhdistys, 2002). Reindeer are owned privately, but managed collectively. Earmarks are used to confirm ownership, and collective roundups for marking, counting, and slaughter provide a framework of trust and partnership. Each district has a fixed reindeer quota, set by the Ministry of Agriculture and Forestry. This quota depends upon the size of the area, and the quality and quantity of winter pastures, which can restrict the number of reindeer to be kept during winter (the number left after the autumn culling season). The number of reindeer per district can vary from less than 1000 to about 12000.
The quota for the whole reindeer management area during the inventory period was 220000, and the present
quota stands at 203 000. The number of reindeer is about 300000 after the calving season, but after the culling season it is only about 200 000, well within the quota limit.
In 1977, there were about 7000 reindeer owners, both Finnish and Saami, but the number has decreased steadily; at present, it is about 6000. Reindeer ownership varies from tens to several hundreds of reindeer, and 50% of all owners have less than 10 reindeer (Kemppainen et al., 1997). The importance of reindeer ownership increases towards the north, and the highest numbers of animals per owner and per family are found in the Saami home area (Fig. 1). There are 1 100 Saami reindeer owners, who have a total of 62 000 reindeer, which is 86.5% of all reindeer in the Saami area, and about 30% of all Finnish reindeer (Kemppainen and Nieminen, 2001). When compared with the Norwegian and Swedish reindeer herding situations, Finnish reindeer husbandry differs in at least two ways: first, reindeer husbandry is sedentary, with a rigid district system; second, reindeer ownership is not an exclusive Saami right. Finnish reindeer herding, thought to have been introduced by the Saami people, can be said to be at least 250-300 years old (Poronhoitolakiesityksen tarkistamistyöryhmä, 1988).
Although still close to nature, reindeer herding has undergone major changes since the Second World War. The introduction of snowmobiles in the 1960s was the start of a complex process of socioeconomic change in the reindeer herding community (Pelto, 1973). The introduc- tion of modern livestock management practices (such as parasite control, calf-slaughtering, and supplementary feed- ing) and government subsidies for fences and other infra- structure have transformed reindeer herding into reindeer management (Nieminen et al., 1980; Helle et al., 1990; Kemppainen et al., 1997; Kemppainen and Nieminen, 2001). These changes, together with favourable weather conditions (especially during winter), caused an unprec- edented increase in reindeer stock during the 1980s (Fig. 2). Severe winter conditions such as ice crusting and deep snow can induce major disaster for wild reindeer populations (Tyler, 1987). Wild reindeer and caribou try to avoid areas with a snow cover exceeding 60 cm (LaPerriere and Lent, 1977). Helle (1979) found that in the Kuusamo area, a snow cover of about 50 cm did not cause problems for reindeer. As the Finnish district system restricts migra- tion, reindeer may have to dig through 80 to 100 cm of snow during winters with excessive snow. Favourable and unfavourable weather conditions seem to occur in cycles linked to the North Atlantic Oscillation (NAO) phenom- enon (Helle et al., 2001). However, it is not entirely clear to what extent the negative effects of snow and ice are countered by supplementary feeding.
Reindeer numbers culminated during the Chernobyl disaster, when animals could not be slaughtered because of low demand for reindeer meat. At that time lichen pastures were already severely depleted, but the extra animals increased the pressure on winter and summer ranges to the extent that reindeer stock and carcass weight began to
This content downloaded from 185.44.78.76 on Sun, 15 Jun 2014 15:45:45 PMAll use subject to JSTOR Terms and Conditions

REINDEER PASTURE BIOMASS ASSESSMENT • 149
FIG. 2. Development of the Finnish reindeer herd, 1959-99 (Source: The Association of Finnish Reindeer Herding Co-operatives).
decline (Kumpula and Nieminen, 1992; Kojola et al., 1995; Kumpula et al., 1998, 2002).
At present, lichen ranges are severely depleted in many districts, and supplementary feeding increasingly com- pensates for natural winter fodder. Increased costs, to- gether with declining output, are of major concern to the reindeer herding community. Conflicting forms of land use, like forestry, tourism, artificial lakes, traffic, and nature conservation, also influence the possibilities of reindeer herding. These developments led to the demand for a thorough inventory of both winter and summer pastures. Satellite remote sensing has been shown to be a valid data source for reindeer pasture inventory in Fennoscandia (T0mmervik and Lauknes, 1987; Rantanen et al., 1989; Johansen and T0mmervik, 1990; Käyhkö and Pellikka, 1994; Colpaert et al., 1995). The present article deals with the inventory of the winter and summer pastures of the Finnish reindeer management area in 1995-98. The main goal of the study was to produce a reference database to facilitate better management.
REINDEER PASTURES
Pasture use by reindeer has a well-defined seasonal cycle of rotation between winter and summer pastures. Migration between the summer and winter pasture areas does not necessarily mean movement over large distances, as these pasture types can usually be found within the same area. (Spring and fall are less clearly defined, since they depend on weather and pasture conditions, and may be considered subsets of winter. The term "spring" refers to the time between March and May, when there is still a permanent cover of snow, but daylight is increasing and melting of snow starts. The term "winter" is used for the darker and colder period from October/November to March.)
The start of the reindeer year is the calving period, which falls just before the beginning of the growing season in the month of May. This timing gives newborn calves the opportunity to use the short Arctic summer to its full extent. Reindeer are browsers, feeding on more than 90
different plant species (Warenberg et al., 1997). Pastures preferred by reindeer during the beginning of summer are mire, fens, and river meadows, where the animals feed on fresh sedges (Carex sp.), Equisetum sp., Menyanthes trifoliata and other soft green plants. Birch (Betula sp.) and willow (Salix sp.) thickets are also favoured during the beginning of summer, when the leaves are still young and soft. Clear-cut areas and other treeless areas growing herbs and grasses are important all summer.
At the beginning of autumn, reindeer move into submesic and mesic forest areas to feed on mushrooms (Boletus sp.) and grasses. Wire grass (Deschampsia flexuosa) is espe- cially important, as it remains green long after summer, even after the first snow has fallen. Wire grass usually occurs in regenerating clear-cut and young forest, thereby compensating partly for the loss of mature forest due to forestry operations.
During winter, reindeer move to lichen pastures (Cladina spp. and Cladonia uncialis), where they dig lichens from under the snow. At the beginning of spring, cycles of melting and refreezing can form an ice crust on top of the snow cover and reindeer have to migrate again to pastures with arboreal lichens (Alectoria sp. and Bryoria sp.). These arboreal lichens, found in mature spruce and pine forests, can be browsed by reindeer from the lowest branches. Reindeer also forage on arboreal lichens that accumulate on the snow cover after being detached by strong wind (litter fall and blowdown).
Grazing pressure is not distributed evenly over the reindeer management area. Total reindeer density is much higher in the north than in the south (Fig. 3). This disparity is caused by two factors. First, agriculture and forestry are much more intensive in the south, which restricts the extent of reindeer herding. Second, the amount of ground lichens is much greater in the north, allowing more rein- deer to be kept during winter.
STUDY AREA
The Finnish reindeer management area is bordered by Sweden, Norway, and Russia. Northern Finland is part of the Precambrian Fennoscandian shield. The highest moun- tains in the north go up to 1000 m, but usually fjells reach only about 500 m above sea level. Most of the area is characterized by low, gently undulating relief. Poor drain- age and a cool, humid climate have made wetlands com- mon, especially in the southern part of the reindeer management area, where mires and fens can cover over 50% of the area (Lappalainen, 1996).
The climate is moderated by the Gulf Stream, which keeps the Norwegian coast ice-free all year round. Snow is present for six months in the north and five months in the coastal areas in the south. Temperatures can be as low as -50°C, but usually winter temperatures vary between - 10° and -30°C. Summer temperatures can go up to +30°C, but gener- ally vary between +10° and +20°C. Annual precipitation is
This content downloaded from 185.44.78.76 on Sun, 15 Jun 2014 15:45:45 PMAll use subject to JSTOR Terms and Conditions

150 • A. COLPAERT et al.
FIG. 3. Number of reindeer per km2 land area after culling in 1998.
about 500-600 mm, but local anomalies occur with less than 400 mm (Alalammi, 1987).
Most of the area is part of the middle and northern boreal forest zone (Fig. 1). Dominant tree species are pine and spruce, with birch as the most abundant deciduous species. The spruce and pine tree line in the north defines the oro-arctic zone. This zone is characterized by moun- tain birch forests and treeless mountaintops.
MATERIALS AND METHODS
Autumn and Winter Pastures
On the basis of our previous experiences and the size of the area, we decided to use Landsat 5 Thematic Mapper (TM) images for the inventory. In theory, 10 full Landsat TM images would cover the whole study area. Preferably these images should be obtained during the same year. However, the short summer (June -August) and the fre- quent occurrence of clouds made this impossible. In total, we had to use 22 full and quarter scenes acquired during different years. Most of the images dated from 1987 to 1994, but three older images acquired in 1984 had to be
FIG. 4. Field sites used in (A) winter pasture inventory and (B) summer pasture inventory.
used to cover some gaps and cloudy areas. All except three images were cloudless. The inventory was done in two phases. The oldest images were used for the northern part, and the newer images for the southern part of the study area. The fieldwork was done during the summers of 1995 and 1996. The sites were selected by the field teams during the campaign, as there were no previous data on the location of the different pasture types. The location of field sites was randomized in order to get an even spatial distribution, limiting spatial autocorrelation. However, the road network controlled randomness to some degree (Fig. 4). A field site is a homogeneous area, representing a certain land use/cover type, with a size of at least two hectares. From 60 to 140 sites were visited per reindeer herding district, depending on its size. Of the total 5392 sites visited, half were located on ground lichen pastures (Cladina sp. and Cladonia uncialis), while the other half were located on clear-cut areas, swamps and mires, de- ciduous forests, mixed forests, spruce forests, bare mountaintops, and some marginal classes (sand and fields). At each site, we measured the length of the living part of the ground lichens and estimated the coverage percentage. Other details included were forest type, age, tree species, amount of arboreal lichens, amount of wire grass, and soil material. The position of the site was obtained with a Trimble GPS receiver averaging 100 measurements. Re- gression-based equations were used to estimate lichen, wire grass, and accessible arboreal lichen biomass. Rein- deer lichen biomass {Cladina sp. and Cladonia uncialis) was measured as in Kumpula et al. (2000):
LBM = (0.6134-LOLH) + (0.000038075 -LC2LH2) [1]
where LBM = lichen biomass kg/ha (dry mass), LC = average reindeer lichen coverage percentage, and LH = average length of living part of reindeer lichen (mm).
Wire grass (Deschampsiaflexuosa) was measured follow- ing Mattila and Helle (1978) and Sulkava and Helle (1975):
This content downloaded from 185.44.78.76 on Sun, 15 Jun 2014 15:45:45 PMAll use subject to JSTOR Terms and Conditions
REINDEER PASTURE BIOMASS ASSESSMENT • 151
I Original Classificatori | . i . ,
i
i i . , I
I Treeless area on mineral land | | Forest on mineral land | Treeless mire Pine mire - - J--
- i ~ I ~ I ~ I . ZI I Z3 I ^ i » | Peat I | Mineral | | Peat | Mineral | Peat | Mineral | | Peat | | Mineral |
I I I I 1 I l I I Change | | OK | | Change | | OK | OK | Uncertain | | OK | | Uncertain | i i i i | Treeless mire I | Pine mire | | Nibble | | Nibble |
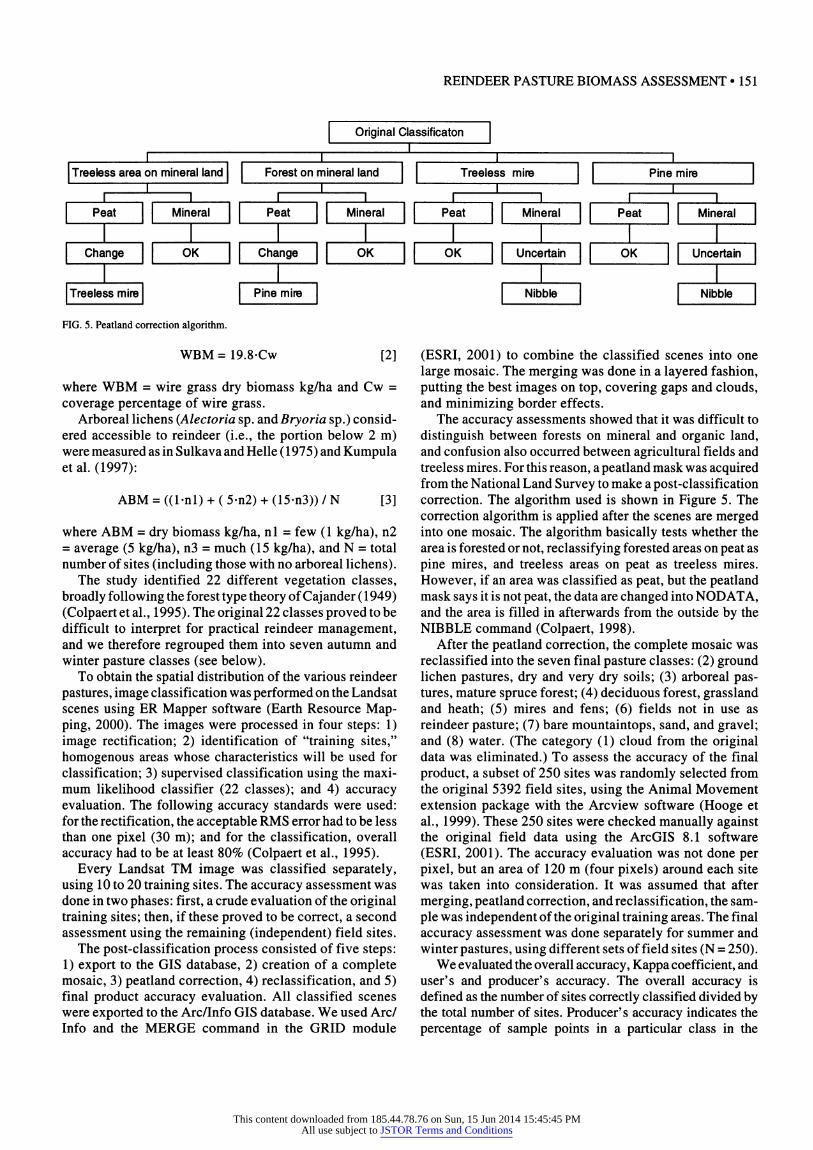
FIG. 5. Peatland correction algorithm.
WBM = 19.8-Cw [2]
where WBM = wire grass dry biomass kg/ha and Cw = coverage percentage of wire grass.
Arboreal lichens (Alectoria sp. and Bryoria sp.) consid- ered accessible to reindeer (i.e., the portion below 2 m) were measured as in Sulkava and Helle ( 1 975) and Kumpula et al. (1997):
ABM = ((1-nl) + ( 5-n2) + (15-n3)) / N [3]
where ABM = dry biomass kg/ha, nl = few (1 kg/ha), n2 = average (5 kg/ha), n3 = much (15 kg/ha), and N = total number of sites (including those with no arboreal lichens).
The study identified 22 different vegetation classes, broadly following the forest type theory of Caj ander ( 1 949) (Colpaert et al., 1995). The original 22 classes proved to be difficult to interpret for practical reindeer management, and we therefore regrouped them into seven autumn and winter pasture classes (see below).
To obtain the spatial distribution of the various reindeer pastures, image classification was performed on the Landsat scenes using ER Mapper software (Earth Resource Map- ping, 2000). The images were processed in four steps: 1) image rectification; 2) identification of "training sites," homogenous areas whose characteristics will be used for classification; 3) supervised classification using the maxi- mum likelihood classifier (22 classes); and 4) accuracy evaluation. The following accuracy standards were used: for the rectification, the acceptable RMS error had to be less than one pixel (30 m); and for the classification, overall accuracy had to be at least 80% (Colpaert et al., 1995).
Every Landsat TM image was classified separately, using 10 to 20 training sites. The accuracy assessment was done in two phases: first, a crude evaluation of the original training sites; then, if these proved to be correct, a second assessment using the remaining (independent) field sites.
The post-classification process consisted of five steps: 1) export to the GIS database, 2) creation of a complete mosaic, 3) peatland correction, 4) reclassification, and 5) final product accuracy evaluation. All classified scenes were exported to the Arc/Info GIS database. We used Arc/ Info and the MERGE command in the GRID module
(ESRI, 2001) to combine the classified scenes into one large mosaic. The merging was done in a layered fashion, putting the best images on top, covering gaps and clouds, and minimizing border effects.
The accuracy assessments showed that it was difficult to distinguish between forests on mineral and organic land, and confusion also occurred between agricultural fields and treeless mires. For this reason, a peatland mask was acquired from the National Land Survey to make a post-classification correction. The algorithm used is shown in Figure 5. The correction algorithm is applied after the scenes are merged into one mosaic. The algorithm basically tests whether the area is forested or not, reclassifying forested areas on peat as pine mires, and treeless areas on peat as treeless mires. However, if an area was classified as peat, but the peatland mask says it is not peat, the data are changed into NOD ATA, and the area is filled in afterwards from the outside by the NIBBLE command (Colpaert, 1998).
After the peatland correction, the complete mosaic was reclassified into the seven final pasture classes: (2) ground lichen pastures, dry and very dry soils; (3) arboreal pas- tures, mature spruce forest; (4) deciduous forest, grassland and heath; (5) mires and fens; (6) fields not in use as reindeer pasture; (7) bare mountaintops, sand, and gravel; and (8) water. (The category (1) cloud from the original data was eliminated.) To assess the accuracy of the final product, a subset of 250 sites was randomly selected from the original 5392 field sites, using the Animal Movement extension package with the Arcview software (Hooge et al., 1999). These 250 sites were checked manually against the original field data using the ArcGIS 8.1 software (ESRI, 2001). The accuracy evaluation was not done per pixel, but an area of 120 m (four pixels) around each site was taken into consideration. It was assumed that after merging, peatland correction, and reclassification, the sam- ple was independent of the original training areas. The final accuracy assessment was done separately for summer and winter pastures, using different sets of field sites (N = 250).
We evaluated the overall accuracy, Kappa coefficient, and user's and producer's accuracy. The overall accuracy is defined as the number of sites correctly classified divided by the total number of sites. Producer's accuracy indicates the percentage of sample points in a particular class in the
This content downloaded from 185.44.78.76 on Sun, 15 Jun 2014 15:45:45 PMAll use subject to JSTOR Terms and Conditions
152-A.COLPAERTetal.
reference data that were correct in the classified image. User's accuracy is the percentage of sample points that the classified image predicts to be in a particular class that the reference data verify as correct. The Kappa statistic (KHAT) indicates how the classification compares to randomly as- signing values to each test site (Earth Resource Mapping, 1999). The Kappa coefficient is defined as:
(overall accuracy - expected accuracy) (1 - expected accuracy)
Ground lichen biomass values were calculated for every site in each district using equation [ 1 ] . The average biomass values were calculated for every pasture type (as defined in the field) within each district. For wire grass and arboreal lichen biomass calculations, equations [2] and [3] were used, but in this case values were averaged for groups of neighbouring districts (also called earmark districts), as the number of values (observations) per district was too small to calculate a valid average for each.
Summer Pastures
The summer pasture inventory was made in 1997 and 1998. As summer pastures differ greatly from winter pastures in both rate of growth and number of species, a different field inventory method was used. A field site is defined as an area of at least two hectares. The centre of the site was marked and its position obtained with a Trimble GPS receiver, using the average of 100 measurements. A central line 140 m long was drawn through this point, extending 70 m on either side of the point. Five circles, each 4 m in diameter, were situated at 35 m intervals along the central line, three on one side and two on the other. Within each circle, two vegetation grids (1 x 1 m) were analyzed, making a total of ten grids per field site. The coverage (%) of 32 reindeer fodder species and groups of species were evaluated, as well as other details, such as percentage of bare soil. The green parts of fodder species were collected from two 1 x 1 x 1.5 m plots for biomass estimation. In addition to the vegetation grid data, general site information was acquired, such as mire type, forest type, or tree species. The mire typology followed the system of Laine and Vasander (1996). As the collection of biomass samples is a slow process, fewer sites could be visited than during the winter pasture inventory. Sites were selected randomly beforehand using the results of the winter pasture inventory, and they cover the different bio- climatic vegetation zones evenly (Kalliola, 1973). We used six mire vegetation zones, based upon the Finnish mire type zones of Ruuhijärvi (1988). The mire and bio- climatic zones were digitized and stored in the GIS data- base. The field campaign moved always from south to north. In this way, differences in climate and growing season could be compensated for. As mires and fens are most important summer pastures, half of all inventory sites were located on mires and fens, and half on mineral soils.
The biomass samples were dried for 16 hours at +105°C and weighed to calculate the average biomass of five different fodder plant groups: 1) leaves of deciduous trees, 2) sedges, 3) grasses and hay, 4) herbs, and 5) shrubs.
For every pasture type, the total coverage and biomass per hectare was calculated by bio-climatic and mire zone. The final classification scheme consisted of a total of 19 classes; nine mire classes, one peat mining area class, seven forest types, mountain heath, and bare mountaintops. Like the winter pasture classification, the summer pasture classes were reclassified into 1 1 main classes (numbers derive from colour codes: 1) = rich mire pasture; 2 = moderate mire pasture; 3 = poor mire pasture; 5 = bare mountaintops; 10 = peat mining areas; 35 = mountain heath land; 41 = clear-cut areas; 42 = deciduous forest; 43 = mountain birch woodland; 46 = mixed forest; and 47 = spruce forest.
The image classification of the summer pastures used the following approach: the pasture classes on mineral soils were assumed to be identical to those of the winter pasture classification and were therefore not classified. This made it possible to concentrate the image processing on the mire pasture types, as these are considered to be among the most important sources of summer fodder. We used the same 22 Landsat 5 TM images used for the winter pasture inventory.
The classification started by separating the mineral and organic areas, using the peatland mask already used in the winter pasture classification. The peatland mask was used to remove everything but the mires. After this step, the image classification method was identical to that used for the winter pasture classification. Because the mask was used at the beginning of the classification, there was no need for post-classification corrections. The original 32 mire types were reduced to nine mire types plus the peat- mining area class. The classes were based on the relative richness in reindeer summer fodder, and could be reduced into three major classes: rich, moderate, and poor in reindeer summer fodder.
An accuracy test was performed upon every single scene, which after approval was exported to the Arc/Info GIS database. The scenes were put together as a mosaic in the same way as the winter pasture scenes. A final accuracy evaluation was performed on the complete summer pasture mosaic using the method described for the winter pastures.
The total area of every pasture class by reindeer herding district is given by the GIS system. The total biomass for each district can easily be calculated by multiplying aver- age biomass (kg/ha) by the total area of this class (ha). By summing the total biomass of all classes, we get the total biomass estimate for each district.
RESULTS AND DISCUSSION
The overall accuracy of the winter pasture mosaic is 88% (confidence limits 82-92%) with a Kappa coefficient of
This content downloaded from 185.44.78.76 on Sun, 15 Jun 2014 15:45:45 PMAll use subject to JSTOR Terms and Conditions

REINDEER PASTURE BIOMASS ASSESSMENT • 153
TABLE 1. User's accuracy of winter pastures (%), N = 250. 1
User-classified Reference 2 3 4 5 6 7
2 87.84 6.76 4.05 1.35 100.00 3 4.29 94.29 1.43 100.00 4 1.33 12.00 85.33 1.33 100.00 5 20.00 10.00 70.00 100.00 6 11.76 88.24 100.00 7 100.00 100.00 8 100.00 100.00
1 Code numbers for autumn and winter pasture classes: 2 = Ground lichen pastures, dry and very dry soils; 3 = Arboreal pastures, mature spruce forest; 4 = Deciduous forest, grassland and heath; 5 = Mires and fens; 6 = Fields (not in use as reindeer pasture); 7 = Bare mountaintops, sand, and gravel; 8 = Water.
TABLE 2. Producer's accuracy of winter pastures (%), N = 250. 1
Producer-classified Reference 2 3 4 5 6 7
2 91.55 5.95 4.41 11.11 3 4.23 78.57 1.47 4 1.41 10.71 94.12 11.11 5 2.82 1.19 77.78 6 2.38 100.00 7 100.00 8 1.19
100.00 100.00 100.00 100.00 100.00 100.00
1 Code numbers for autumn and winter pasture classes: 2 = Ground lichen pastures, dry and very dry soils; 3 = Arboreal pastures, mature spruce forest; 4 = Deciduous forest, grassland and heath; 5 = Mires and fens; 6 = Fields (not in use as reindeer pasture); 7 = Bare mountaintops, sand, and gravel; 8 = Water.
TABLE 3. User's accuracy of summer pastures (%), N = 250. l
User-classified Reference 1 2 3 5 41 42 43 45 46 47
1 69.77 18.60 11.63 100.00 2 9.43 81.13 7.55 1.89 100.00 3 22.73 77.27 100.00 5 100.00 100.00 41 87.50 5.00 7.50 100.00 42 100.00 100.00 43 100.00 100.00 45 25.00 75.00 100.00 46 5.88 88.24 5.88 100.00 47 16.67 83.33 100.00
1 Colour-code numbers for summer pasture classes: 1 = Rich mire pasture; 2 = Moderate mire pasture; 3 = Poor mire pasture; 5 = Bare mountaintops; 41 = Clear-cut areas; 42 = Deciduous forest; 43 = Mountain birch woodland; 35 = Mountain heath land; 46 = Mixed forest; and 47 = Spruce forest.
TABLE 4. Producer's accuracy of summer pastures (%), N = 250. l
Producer-classified Reference 1 2 3 5 41 42 43 45 46 47
1 85.71 14.29 19.23 2 14.29 76.79 15.38 2.56 3 8.93 65.38 5 100.00 41 89.74 10.53 8.33 42 89.47 43 100.00 45 2.56 100.00 46 5.13 83.33 11.76 47 8.33 88.24
100.00 100.00 100.00 100.00 100.00 100.00 100.00 100.00 100.00 100.00
1 Colour-code numbers for summer pasture classes: 1 = Rich mire pasture; 2 = Moderate mire pasture; 3 = Poor mire pasture; 5 = Bare mountaintops; 41 = Clear-cut areas; 42 = Deciduous forest; 43 = Mountain birch woodland; 35 = Mountain heath land; 46 = Mixed forest; and 47 = Spruce forest.
0.84. The user's and producer's accuracies for winter are shown in Tables 1 and 2. The overall accuracy of the summer pasture mosaic is 84% (confidence limits 80-88%), with a Kappa coefficient of 0.81. The user's and producer's accu- racies for summer are shown in Tables 3 and 4.
We also compared the present classification with the figures given by the official Finnish Forestry Inventory (Mattila, 1996; Tomppo et al., 2001) (Table 5). The main source of difference is the fact that the official forest inventory uses eight forest development classes, while our
This content downloaded from 185.44.78.76 on Sun, 15 Jun 2014 15:45:45 PMAll use subject to JSTOR Terms and Conditions

154 • A. COLPAERT et al.
TABLE 5. Total pasture area (km2) according to the official forest inventory (VMI8) and the reindeer winter pasture inventory (Classification). (VMI8 source: Tomppo et al., 2001.)
VMI8 % Classification %
Lichen pasture 13262 11.9 17729 15.4 Mires and fens 41587 37.3 39814 34.6 Wire grass pastures 18704 16.8 18358 16.0 Mature spruce forest 6343 5.7 8687 7.6 Mature pine forest 9475 8.5 15615 13.6 Other 22108 19.8 14830 12.9
111479 100.0 115033 100.0
inventory had only three (clear-cut, young, and mature). This produced differences in the mature pine class, and to a lesser extent, in the mature spruce class. Our inventory shows more lichen pastures, possibly because the official inventory does not classify the treeless areas of Lapland in the same rigorous way as the forested areas of Finland. Another reason could be the use of slightly older images for our inventory. The difference in total area is difficult to explain, but it is possibly due to the fact that the official inventory removed built-up areas, roads, and the like. The figures seem, however, to agree very well, considering that in an area of this size, minor changes in the mosaic, filtering, etc. produce noticeable changes in the total pixels assigned to any pasture type.
The results of the classification show that of the total area (123 000 km2), 6% is covered by water (excluding small streams and ponds), 71% is covered by forest, and 23% is covered by treeless mires and fens, bare mountaintops, mountain heath, and mountain birch wood- land. Most of the ground lichen pastures are found in the northern herding districts. Of the total forested area, 35% is mature forest, 54% is young growth forest, and 1 1% is clear-cut and seedling stands. Mature forests with arboreal lichens are scarce except in national parks and nature reserves (7.6% mature spruce forest in Table 5). Forestry practices such as drainage, clear-cutting, and replanting have greatly changed the ecosystem that reindeer use. A considerable proportion of total forest area consists of young growth forest and regenerating clear-cut areas, which in our classification are called wire grass pastures (16% in Table 5). Ground lichen pastures have been damaged by forestry practices, but to a lesser extent than the arboreal lichen pastures. Damage to ground lichen pastures is mostly due to overgrazing and partly to the use of off-road vehicles (total ground and arboreal lichen pasture is 36.6%; Table 5). Figure 6 shows the final pasture map. The original 22 classes are combined into four pas- ture groups and four marginal classes (water, sand, and agricultural fields).
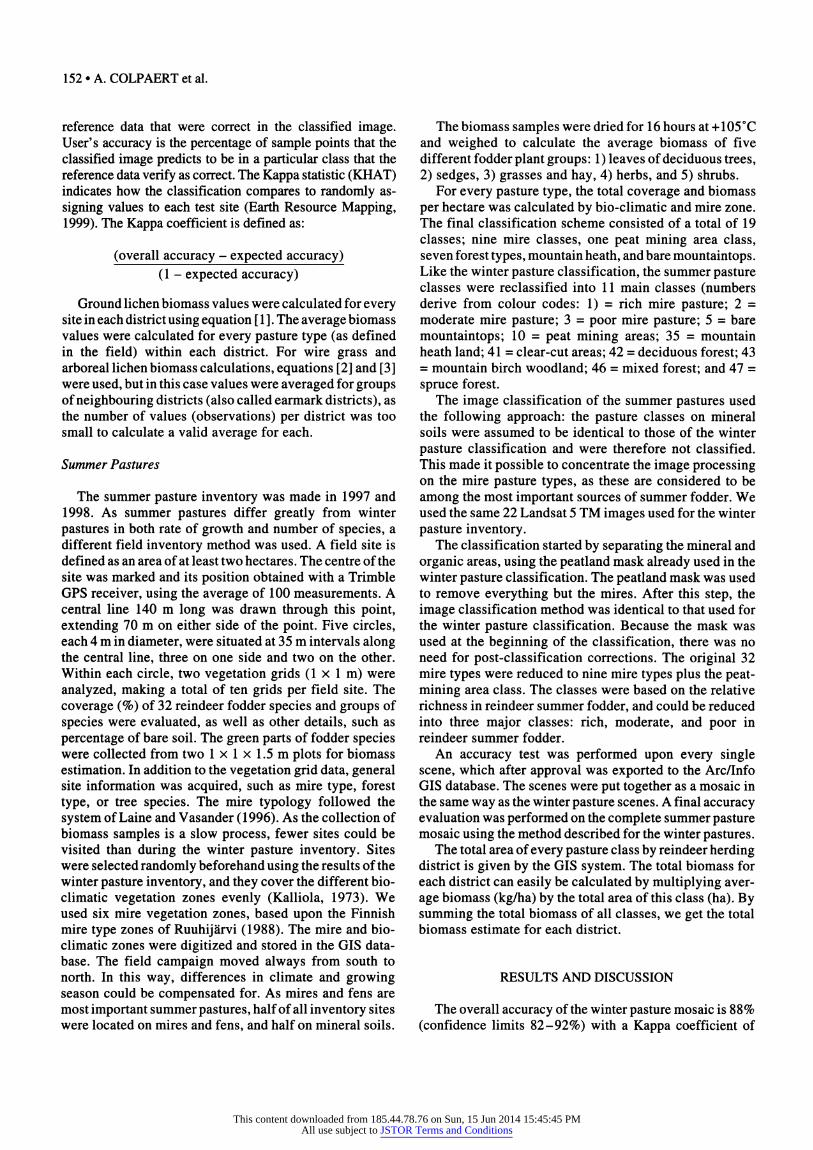
To allow lichen recovery, a lichen biomass of 1000 kg/ ha would be the minimum condition (Kumpula et al., 2000). However, only 19% of the districts meet this con- dition. It is estimated that about ten hectares of moderate condition lichen pasture is needed per reindeer (Kumpula et al., 2000). This would mean an average minimal biomass
of 10000 kg lichen per reindeer. When we consider both reindeer density and availability of lichen resources, it is clear that the situation is critical in many districts (Fig. 7). One also must keep in mind that these figures are gross figures, and the amount available per reindeer cannot be consumed entirely, as this would mean total depletion of pasture resources.
Supplementary feeding with commercial feed and hay compensates nowadays for the obvious lack of suitable winter pastures. At present all districts practice supple- mentary feeding during winter, whether in corrals under controlled conditions or in the forest, allowing the animals to use both natural and supplementary feed (Nieminen and Autto, 1989). Snow depth and hardness are major factors influencing winter fodder resources. Snow conditions vary from winter to winter, so in the long run reindeer can be assumed to use the available area evenly. This is shown by the fact that the lichen cover has been preserved only in enclosures, which cannot be grazed at all. Snow cover is therefore assumed not to affect the present inventory.
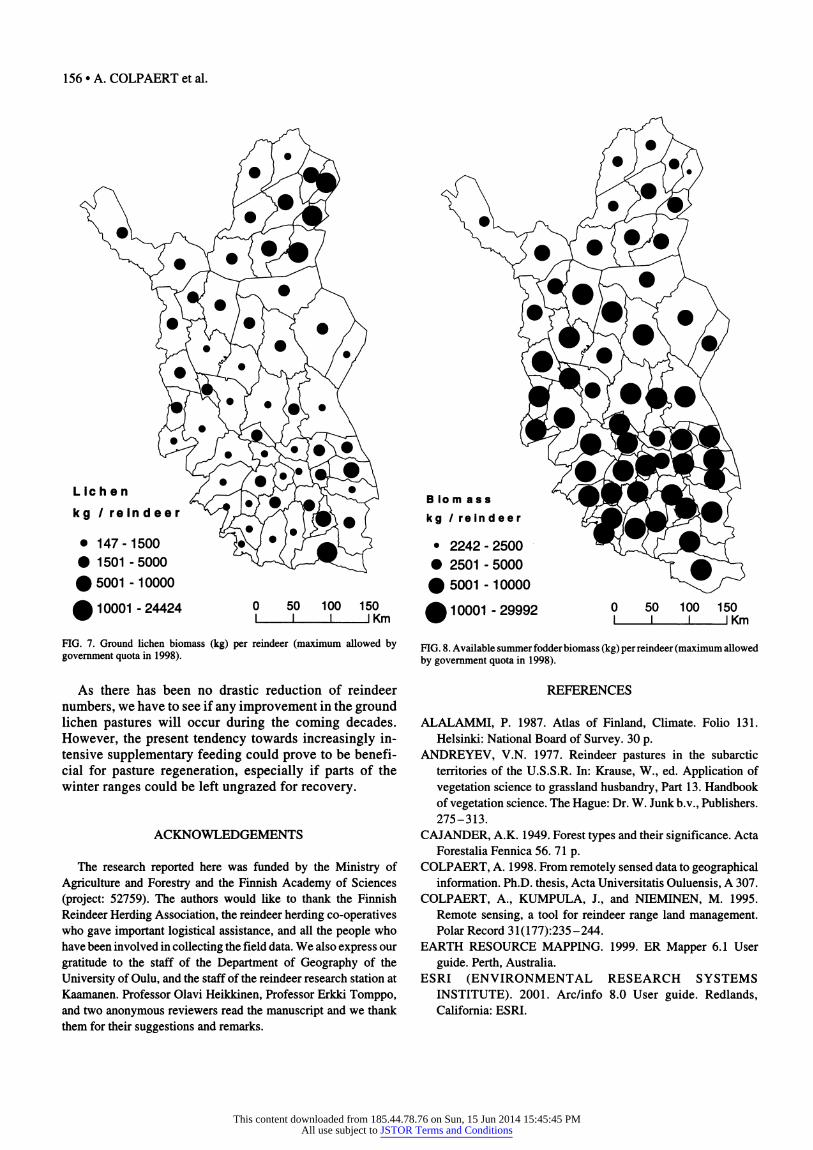
Winter pastures are critical for the survival of reindeer under natural conditions; summer pastures, on the con- trary, are important for regaining strength during the beginning of summer and producing meat and fat to pre- pare for the coming winter (Kojola et al., 1995; Kumpula et al., 1998, 2000, 2002; Kumpula, 2000). The inventory clearly shows that summer pastures are most abundant in the southern districts and least abundant in the northern areas (Fig. 8). Also because of climatic conditions, the summer pastures of the north are poorer and have fewer suitable mires and fens. During our field observations, we saw signs of overgrazing of summer pastures in parts of the northern mountainous districts. For example, reindeer frequently browse mountain birch stands during the begin- ning of summer, producing characteristic "apple tree for- ests." Heavy grazing during the summer can inhibit regeneration of these mountain birch forests, and thus promote the increase of mountain heath (Lehtonen and Heikkinen, 1995).
CONCLUSIONS
The results gave good estimates of the amount of pas- ture and natural fodder in each district. However, the pasture area or biomass values cannot be considered abso- lute values. First of all, the amount of biomass is affected by the state of the growing season and weather conditions. Evaluation of the lichen coverage percentage is affected by illumination and moisture conditions. These facts do not diminish the value of the inventory, and the results can be used in many ways. For example, the Finnish army and foresters use pasture maps to minimize inconvenience to reindeer herding caused by their activities. The results of the project also provide a sound database for studying the interactions between pasture resources and productivity of reindeer stock (Kumpula et al., 1998, 2000, 2002).
This content downloaded from 185.44.78.76 on Sun, 15 Jun 2014 15:45:45 PMAll use subject to JSTOR Terms and Conditions

REINDEER PASTURE BIOMASS ASSESSMENT • 155
FIG. 6. Winter pastures of the Finnish reindeer management area in 1998.
Reindeer winter pastures /J'WM^ik^
I 26 60 76 100 km
Mp^M^ MMMM | University of Oulu, department of geograph'
FGFRL reindeer research
This content downloaded from 185.44.78.76 on Sun, 15 Jun 2014 15:45:45 PMAll use subject to JSTOR Terms and Conditions
156 • A. COLPAERT et al.
Llcl"n /reindeer ^dw^P^ kg /reindeer ^/r^-V^X Hw. a (
• 147-1500 ¿•S' */V(Ì ivj^ • 1501 -5000 ^vVA¿__^^^ 05001 -10000
10001-24424 0 50 100 150 I I I I Km
FIG. 7. Ground lichen biomass (kg) per reindeer (maximum allowed by government quota in 1998).
•Ti* r © •k#'
Biomass ^vBrJJP ^^i^Mfc ^^r kg /reindeer K-S^R^mAlé^^I^^C • 2242-2500 ^1- (¿J^t^A • 2501 - 5000 ^L i^S 0 5001 - 10000 ^^//
10001-29992 ° 50 10° 150 I I I I Km
FIG. 8. Available summer fodder biomass (kg) per reindeer (maximum allowed by government quota in 1998).
As there has been no drastic reduction of reindeer numbers, we have to see if any improvement in the ground lichen pastures will occur during the coming decades. However, the present tendency towards increasingly in- tensive supplementary feeding could prove to be benefi- cial for pasture regeneration, especially if parts of the winter ranges could be left ungrazed for recovery.
ACKNOWLEDGEMENTS
The research reported here was funded by the Ministry of Agriculture and Forestry and the Finnish Academy of Sciences (project: 52759). The authors would like to thank the Finnish Reindeer Herding Association, the reindeer herding co-operatives who gave important logistical assistance, and all the people who have been involved in collecting the field data. We also express our gratitude to the staff of the Department of Geography of the University of Oulu, and the staff of the reindeer research station at Kaamanen. Professor Olavi Heikkinen, Professor Erkki Tomppo, and two anonymous reviewers read the manuscript and we thank them for their suggestions and remarks.
REFERENCES
ALALAMMI, P. 1987. Atlas of Finland, Climate. Folio 131. Helsinki: National Board of Survey. 30 p.
ANDREYEV, V.N. 1977. Reindeer pastures in the subarctic territories of the U.S.S.R. In: Krause, W., ed. Application of vegetation science to grassland husbandry, Part 13. Handbook of vegetation science. The Hague: Dr. W. Junkb.v., Publishers. 275-313.
CAJ ANDER, A.K. 1949. Forest types and their significance. Acta Forestalia Fennica 56. 71 o.
COLPAERT, A. 1998. From remotely sensed data to geographical information. Ph.D. thesis, Acta Universitatis Ouluensis, A 307.
COLPAERT, A., KUMPULA, J., and NIEMINEN, M. 1995. Remote sensing, a tool for reindeer range land management. Polar Record 31(177):235-244.
EARTH RESOURCE MAPPING. 1999. ER Mapper 6.1 User guide. Perth, Australia.
ESRI (ENVIRONMENTAL RESEARCH SYSTEMS INSTITUTE). 2001. Arc/info 8.0 User guide. Redlands, California: ESRI.
This content downloaded from 185.44.78.76 on Sun, 15 Jun 2014 15:45:45 PMAll use subject to JSTOR Terms and Conditions

REINDEER PASTURE BIOMASS ASSESSMENT • 157
HELLE, T. 1979. Lumipeite porojen laidunnuksen säätelijänä Kuusamossa. (The role of snow in the feeding behaviour of the semidomesticated reindeer in Kuusamo, Northeastern Finland.) In: Viramo, J., ed. Studies on the natural environment of the Kuusamo district, northeastern Finland. Acta Universitatis Ouluensis, A 68:130-134.
. 1984. Foraging behaviour of the semi-domestic reindeer (Rangifer tarandus L.) in relation to snow in Finnish Lapland. Reports of the Kevo Subarctic Research Station 19: 35 -47.
HELLE, T., and SAASTAMOINEN, L. 1979. The winter use of food resources of semi-domestic reindeer in northern Finland. Communicationes Instituti Forestalis Fenniae 95(1): 1-26.
HELLE, T., and TARVAINEN, L. 1984. Determination of the winter digging period of semi-domestic reindeer in relation to snow conditions and food resources. Reports of the Kevo Subarctic Research Station 19:49-56.
HELLE, T., KILPELA, S., and AIKIO, P. 1990. Lichen ranges, animal densities and production in Finnish reindeer management. Rangifer, Special Issue (3):115-121.
HELLE, T., KOJOLA, I., and TIMONEN, M. 2001. Lumipeitteen vaikutus Käsivarren porolukuihin: mikä on Pohjois-Atlantin säävaihtelun (NAO) merkitys? (Impact of snow cover on the reindeer population in Käsivarsi, NW Finland: Is North Atlantic weather oscillation (NAO) involved?) Summary in English. Suomen Riista 47:75-85.
HOOGE, P.N., EICHENLAUB, W., and SOLOMON, E. 1999. The animal movement program. Anchorage: U.S. Geological Survey, Alaska Biological Science Center.
HUTTU-HILTUNEN, V., KOIVUPERA, N., and NIEMINEN, M. 1990. Reindeer husbandry in Finland. Rovaniemi: The Association of Reindeer Herding Cooperatives. 22 p.
JOHANSEN, B.E., and T0MMERVIK, H. 1990. Mapping winter pastures for reindeer in Karasjok, northern Norway using Landsat 5-TM data. Rangifer, Special Issue (4):51.
KALLIOLA, R. 1973. Suomen kasvimaantiede. (The vegetation geography of Finland.) Helsinki: WSOY.
KÄYHKÖ, J., and PELLIKKA, P. 1994. Remote sensing of the impact of reindeer grazing on vegetation in northern Fennoscandia using SPOT XS data. Polar Research 13(1):1 15- 124.
KEMPPAINEN, J., and NIEMINEN, M. 2001 . Poronhoito Suomen saamelaisalueella. (Reindeer herding in the Finnish Saami area.) Poromies 1:23-28.
KEMPPAINEN, J., NIEMINEN, M., and REKILÄ, V. 1997. Poronhooidonkuva. (Socio-economic state of reindeer herding.) Helsinki: Riista- ja Kalatutkimus. 142 p.
KOJOLA, L, HELLE, T., NISKANEN, M., and AIKIO, P. 1995. Effects of lichen biomass on winter diet, body mass and reproduction of semi-domesticated reindeer Rangifer t. tarandus in Finland. Wildlife Biology l(l):33-38.
KOJOLA, I., HELLE, T., HUHTA, E., and MVA, A. 1998. Foraging conditions, tooth wear and herbivore body reserves: A study of female reindeer. Oecologia 117:26-30.
KUMPULA, J. 2000. Winter grazing of reindeer in woodland lichen pasture: Effect of lichen availability on the condition of reindeer. Small Ruminant Research 1992:1-10.
KUMPULA, J., andNIEMINEN, M. 1992. Pastures, calf production and carcass weights of reindeer calves in the Oraniemi co- operative, Finnish Lapland. Rangifer 12(2):93-104.
KUMPULA, J., COLPAERT, A., and NIEMINEN, M. 1997. Suomen poronhoitoalueen talvilaidunvarat. (The winter pasture resources of the Finnish reindeer management area.) English abstract. Kala- ja Riistaraportteja 93. 42 p.
. 1998. Reproduction and productivity of semidomesticated reindeer in northern Finland. Canadian Journal of Zoology 76:269-277.
. 2000. Condition, potential recovery rate, and productivity of lichen {Cladonia spp.) ranges in the Finnish reindeer management area. Arctic 53(2): 152- 160.
. 2002. Productivity factors of the Finnish semi-domesticated reindeer (R. t. tarandus) stock during the 1990's. Rangifer 22(1):3-12.
LAINE, J., and VASANDER, H. 1996. Ecology and vegetation gradient of peatlands. In: Vasander, H., ed. Peatlands of Finland. Helsinki: Finnish Peatland Society. 10-19.
LaPERRIERE, A.J., and LENT, P.C. 1977. Caribou feeding sites in relation to snow characteristics in northeastern Alaska. Arctic 30(2): 101 -108.
LAPP ALAINEN, E. 1 996. Peatlands and peat resources in Finland. In: Vasander, H., ed. Peatlands of Finland. Helsinki: Finnish Peatland Society. 36-38.
LEHTONEN, J., and HEIKKINEN, R.K. 1995. On the recovery of mountain birch after Epirrita damage in Finnish Lapland, with a particular emphasis on reindeer grazing. Ecoscience 2(4): 349-356.
MATTILA, E. 1996. Porojen talvilaitumet Suomessa poron- hoitoalueen etelä- ja keskiosissa 1990-luvun alussa. (Reindeer winter pastures in the southern and middle parts of the Finnish reindeer management area in beginning of the 1990s.) Folia Forestalia(4):337-357.
MATTILA, E., and HELLE, T. 1978. Keskeisen poronhoitoalueen talvilaidunten arviointi. (Winter pasture inventory of the middle reindeer management area.) Folia Forestalia 358:1-31.
McEWAN, E.H., and WHITEHEAD, P.E. 1970. Seasonal changes in the energy and nitrogen intake in reindeer and caribou. Canadian Journal of Zoology 48:905-913.
MILLER, D.R. 1978. Seasonal changes in the feeding behavior of barren-ground caribou on the taiga winter range. In: Geist, V., and Walter, F., eds. The behaviour of ungulates and its relation to management. Calgary, Alberta: The University of Calgary. 744-755.
NIEMINEN, M., and AUTTO, P. 1989. Porojen laitumet jaruokinta poronhoitovuonna 1986-87. 2. rehut ja ruokinta. (Reindeer pastures and supplementary feeding in the year 1986-87.) Poromies 56(2):38 -43.
NIEMINEN, M., TIMISJÄRVI, J., and LAITINEN, M. 1980. The effects of antiparasitic treatment on the condition of semi- domesticated reindeer (Rangifer tarandus). Reports of the Kevo Subarctic Research Station 16:23-26.
PALISKUNTAIN YHDISTYS. 2002. The Reindeer Herders' Association, http://www.paliskunnat.fi/. Accessed 1 June 2002.
This content downloaded from 185.44.78.76 on Sun, 15 Jun 2014 15:45:45 PMAll use subject to JSTOR Terms and Conditions
158 • A. COLPAERT et al.
PELTO, P. 1973. The snowmobile revolution: Technology and social change in the Arctic. Menlo Park, California: Cummings Publishing Company. 223 p.
PORONHOITOLAKI. 1990. Reindeer Herding Act. Helsinki. Available in Finni«h Ç'vf»/ii«hnnHFna1iehî»thttîv//w'x/'x/ fînipv fî
PORONHOITOLAKIESITYKSEN TARKISTAMISTYÖR- YHMÄ. 1988. Poronhoitolakiesityksen tarkistamistyöryhmän muistio. (Report of the Reindeer Management Act Evaluation Commission.) Helsinki: Maajametsätalousministeriö, No. 2021/ 042 MMM 1987. 106 d.
RANTANEN, M., TOMPPO, E., NENONEN, S., and NIEMINEN, M. 1989. Paliskuntien inventointi kaukokartoitusta käyttäen, loppuraportti. (Inventory of reindeer herding districts using remote sensing.) Research report. Rovaniemi, Finland: Finnish Game and Fisheries Research Institute. 61 p.
RUUHIJÄRVI, R. 1988. Atlas of Finland. Folio 143. Helsinki: National Board of Survey.
SKOGLAND, T. 1978. Characteristics of the snow cover and its relationship to wild mountain reindeer (Rangifer tarandus tarandus L.) feeding strategies. Arctic and Alpine Research 10(3):560-580.
SULKAVA, S., and HELLE, T. 1975. Range ecology of the domesticated reindeer in the Finnish coniferous forest area. In: Luick, J.R., Lent, D.C., Klein, D.R., and White, R.G., eds. Proceedings of the First International Reindeer/Caribou Symposium, Fairbanks, Alaska. Biological Papers of the University of Alaska, Special Number 1:108-121.
T0MMERVIK, H., and LAUKNES, L. 1987. Mapping of reindeer ranges in the Kautokeino area, northern Norway, by use of Landsat-TM data. Rangifer 7(2):2- 14.
TOMPPO, E., HENTTONEN, H., and TUOMAINEN, T. 2001. Valakunnan metsien 8 inventoinnin menetelmä ja tuloksen metsäkeskuksittain Pohjois-suomessa 1992-94 sekä tulokset Etelä-Suomessa 1986-92jakokomaassa 1986-94. (Methods and results of the 8th national forest inventory.) Metsätieteen aikakauskirja (lB):99-248.
TYLER, N. 1987. Natural limitation of the abundance of the High Arctic Svalbard reindeer. PhD dissertation, University of Cambridge. Cambridge. England. 321 n.
WARENBERG, K., DANELL, O., GAARE, E., and NIEMINEN, M. 1997. Porolaudunten kasvillisuus. (Vegetation of reindeer pastures.) Landbruksforlaget. Troms0, Norway: Nordic Council for Reindeer Research. 1 12 p.
This content downloaded from 185.44.78.76 on Sun, 15 Jun 2014 15:45:45 PMAll use subject to JSTOR Terms and Conditions