regolith-landform and mineralogical mapping of the white ...€¦ · certificate of originality i...
TRANSCRIPT
Regolith-landform and mineralogical mapping of the White Dam Prospect,
eastern Olary Domain, South Australia, using integrated remote sensing and
spectral techniques.
Ian Christopher Lau
December 2004
Thesis submitted as fulfilment of the
requirements for the degree of Doctorate of Philosophy
The University of Adelaide, Australia

I C Lau Certificate of Originality
- i -
Certificate of Originality
I hereby declare that this submission is of my own work and that, to the best of my
knowledge and belief, contains no material previously published or written by another
person, unless it has been acknowledged accordingly. I have endeavoured to perform
the research encapsulated in this document from my own ideas and investigations. I
give consent for this thesis to be loaned or photocopied, However, ask for
acknowledgement when the original ideas, data or figures contained within this thesis
are used.
Ian Christopher Lau, December 2004

- ii -

I C Lau Abstract
- iii -
Abstract
The research contained within this thesis was directed at examining the spectral
properties of regolith-dominated terrains using airborne and proximal hyperspectral
instruments. The focus of the investigation was to identify the mineralogy of the regolith and
determine if surficial materials were indicative of the underlying bedrock in the regolith-
dominated terrain of the eastern Olary Domain, South Australia. The research area was
constrained to a 250 km2 area around the Cu-Au mineralisation of the White Dam Prosect.
Integrated remote sensing, using airborne hyperspectral datasets (HyMap), Landsat
imagery and gamma-ray spectroscopy data, was performed to map regolith-landforms and
extract information on surficial materials. Detailed calibration of the HyMap dataset, using a
modified model-based/empirical line calibration technique, was required prior to information
extraction.
The White Dam area was able to be divided into: alluvial regolith-dominated; in situ
regolith-dominated; and bedrock-dominated terrains, based on mineralogical interpretations
of the regolith, using the remotely sensed hyperspectral data. Alluvial regions were
characterised by large abundances of vegetation and soils with a hematite-rich mineralogy.
Highly weathered areas of in situ material were discriminated by the presence of goethite and
kaolinite of various crystallinities, whereas the bedrock-dominated regions displayed white
mica-/muscovite-rich mineralogy. Areas flanking bedrock exposures commonly consisted of
shallow muscovite-rich soils containing regolith carbonate accumulations.
Traditional mineral mapping processes were performed on the HyMap data and were
able to extract endmembers of regolith and other surficial materials. The Mixture Tuned
Matched Filter un-mixing process was successful at classifying regolith materials and
minerals. Spectral indices performed on masked data were effective at identifying the key
regolith mineralogical features of the HyMap imagery and proved less time consuming than
un-mixing processes. Processed HyMap imagery was able to identify weathering halos,
highlighted in mineralogical changes, around bedrock exposures.
Proximal spectral measurements and XRD analyses of samples collected from
the White Dam Prospect were used to create detailed mineralogical dispersion maps of the
surface and costean sections. Regolith materials of the logged sections were found to
correlate with the spectrally-derived mineral dispersion profiles. The HyLogger drill core
scanning instrument was used to examine the mineralogy of the fresh bedrock, which
contrasted with the weathering-derived near-surface regolith materials. The overall outcomes
of the thesis showed that hyperspectral techniques were useful for charactering the
mineralogy of surficial materials and mapping regolith-landforms.
Acknowledgements
- iv -
Acknowledgements
Formally I would like to thank Professor Pat James for his help in getting
this project started and providing a source of funding. Appreciation goes to The
Adelaide University, the Department of Geology and Geophysics and CRC LEME, for
putting up the cash for me to perform this work. I would also like to acknowledge the
guidance and aid provided by Dr. Alan Mauger on the remote sensing and spectral side
of the thesis. A big thank you must go to Dr. Graham Heinson who had the misfortune
of having to read a larger proportion of the draft documents than anyone else. I have
greatly appreciated Graham’s guidance on the academic issues and the provision of
scientific ideas, from a geophysical point of view. Big thanks to Steve Hill who also
inspired me and stimulated me in many ways (with regard to regolith science) and
taught me how to map, no thanks for not picking us up when we were hitch-hiking on
the Barrier Highway.
Along the way I have seeked aid from other academics and industry geologists
who I would like to formally thank. This includes Megan Lewis, Bertram Ostendorf
from Soil and Water, Martin Williams, Yvonne Bone, Karin Barovich and Vic Gostin
from the Geology Department, Vicki Stamoulis, Andrew Shearer, Alistair Crooks, Steve
Hore, Stuart Robinson, Colin Conor, Wolfgang Preiss, John Keeling, Andy Burtt, Fabs,
Miles and Simmo from PIRSA. The use of facilities and equipment at PIRSA during
the early stages of the project was greatly appreciated. Cheers Swanny for showing us
FAB and introduced us to Olary. I am extremely grateful to the landowners of the
Olary region, especially the Trelors, the Shearers for allowing me access to their
property. A special thanks goes to Andy for his kind use of his quarters and homestead,
as well as his excellent hospitality. I must say that you showed me another side of the
countryside that I have grown to greatly appreciate.
I would like to thank the assistance I received from industry companies and
organisations, MIMEX, Polymetals, EXCO Resources, Challenger Geological Services,
with special thanks to Mark Raven, Ben and Rob Fitzpatrick of CSIRO Land and Water
for letting me mess up their XRD lab. Of great help in times of need were the staff of
CSIRO Exploration and Mining, which included Rob Hewson, Tom Cudahy, Cindy
Ong, Peter Mason, Jon Huntington, Melissa Quigley, Keith Scott (for coming out to the
costeans and having a look) and Phil Conor. I am greatly indebted to Tom for showing
me his passion for remote sensing. Thank you Peter Hausknecht and Brigette Martini of
HyVista.

I C Lau Acknowledgements
- v -
Along the course of my travels to Perth I met many fantastic people at the
ARRC building and would like to thank Ravi Anand, Dale Longman, Cajetan Phang,
Erick Ramanaidou, and Helena Hink for their help and hospitality. Thank you to Brian
Pashley and Colin Pain for the scanning of my regolith map, I will pay the bill soon. I
would also like to acknowledge Angelo Varetarsi for his work on a poster presented at
BHEI 2003 and the one that got lost at Heathrow on the way to IGARSS 03.
The Mawson Laboratories have become somewhat of a home during the past 4
years and I would like to acknowledge the people who give the place some character,
and give some aid when required. Cheers to John Stanley, Maria Lekis, Carolyn
Marshal, Yvonne Phillip, Sherry Proffers and Iain Florence for their assistance, and to
all the other Alderman Tea-goers for their cake and chit-chat.
Along the journey I have seen many people come and go, some falling along the
wayside. I would like to thank them all for their friendship and aid that they have been
to myself and my family. Thanks Sheena, Amy and Charlotte; Aaron, Pip and Samuel,
Karen and Aija, Linda, Hash, Brian, Robert, Beau and Anna; Rob, Phil, Lachlan, Chris,
Ben, Greg, Kate, Tania, Freddy, Sean, Anna, Alana and other SIG/ RS people, Mark T,
Brett T, Andrew, Peter, Bernd, Rolf, Amy, Pledgie, Huddles, Selina, Jo, Rebeka. Nick
and Mel, Yvette, Scott & Kirsty. Thanks to the wonderful people of CARES SA.
The most gratitude must go to my poor long suffering family who have had to
vicariously undertake a PhD. My humblest apologies to the love of my life, Tes, who
during the last three years has turned me into a complete person, while at the same time
duelling my mistress, that is Research, for the attention she deserves. I couldn’t have
completed this long journey without your support and love.
As for the rest of my family, you deserve a pat on the back as well, for helping
us financially, emotionally, nutritionally, and horticulturally. Thanks for the support
and loving care that you have provided. Xanthe and Imogen, I thank you for being the
little angels that making coming home so beautiful and worthwhile.
A special acknowledgement goes to the memory of my grandfather, who taught
me so many values about life (especially money and mushrooms).
And to those I forgot (because you weren’t in my email address book), cheers,
you’ve been rad. Thank-you again to Graham, Karen, Linda, Hash, Aaron and Graham,
you will never have to read about HS-RS of RLUs using RGB TCCs again.
Table of Contents
- vi -
Table of Contents
Certificate of Originality.......................................................................... i Abstract .................................................................................................. iii Acknowledgements................................................................................. iv Table of Contents ................................................................................... vi List of Figures......................................................................................... xi List of Tables ........................................................................................xxv List of Appendices ............................................................................. xxvii Definition of Terms and Acronyms used: ......................................... xxix Chapter 1 Introduction ..............................................................1 Significance and Aims of Research ........................................................ 1 Methods of Investigation......................................................................... 2 Outline of Thesis...................................................................................... 3 Chapter 2 Background Basement Geology of the Study Area 4 Regional Setting....................................................................................... 4 Basement Geology ................................................................................... 8
THE WILLYAMA SUPERGROUP ....................................................................10 Curnamona Group ...............................................................................................10 Wiperaminga Subgroup of the Curnamona Group................................................10 Ethiudna Subgroup the Curnamona Group...........................................................10 Strathearn Group .................................................................................................11 Saltbush and Mount Howden Subgroups..............................................................12 IGNEOUS ROCKS .............................................................................................12 Basso Suite..........................................................................................................12 The Lady Louise Suite.........................................................................................12 POST WILLYAMA LITHOLOGIES ..................................................................13 The Poodla Igneous Suite ....................................................................................13 Bimbowrie Suite..................................................................................................13 Pegmatites ...........................................................................................................13 ADELAIDEAN AND CAMBRIAN ....................................................................14
Structure and Deformation................................................................... 15 Shear Zones .........................................................................................................16
Mineralisation........................................................................................ 17 Examples of Mineralisation Under Cover: Portia and Kalkaroo ...........................19 Epigenetic Ironstones: Wilkins, and Green and Gold ...........................................19
White Dam Local Geology .................................................................... 20 Lithostratigraphy of the White Dam Area ............................................................20 Structure of the White Dam Prospect ...................................................................22 Exploration and Mineralisation of the White Dam Prospect .................................24
Chapter 3 Background Regolith Geology of the Study Area.25 Introduction........................................................................................... 25
Regolith definition...............................................................................................25
I C Lau List of Figures
- vii -
The Weathering of Rocks and their Associated Mineralogy............... 26 Weathering in the White Dam Region ................................................................. 27
The Regolith Profile............................................................................... 27 Regolith Profiles of the Olary Domain................................................................. 27
Post-Cambrian Regolith and Landscape-History of the Olary Domain................................................................................................................ 29
The Effect of European Settlement on the Landscape .......................................... 31 Nomenclature and Description of Regolith Horizons in the Curnamona Province............................................................................. 31
Alluvial sediments............................................................................................... 31 Aeolian sediments ............................................................................................... 32 Regolith Carbonate Accumulations ..................................................................... 33 Colluvial sediments ............................................................................................. 34 Vegetation and its Use as a Surrogate for Regolith-Landforms ............................ 37
Geomorphology and Location of the Area of study............................. 39 Detailed Overview of the Field Area ................................................................... 42
Chapter 4 Remote Sensing Background .................................49 Introduction ........................................................................................... 49 Part 1 Electromagnetic Radiation Theory and the Interaction with Materials ................................................................................................ 49 Background on Electromagnetic Radiation ......................................... 49 Electronic and Molecular Processes: The Principles of Spectral Absorption ............................................................................................. 52
Electronic processes –Visible and Near Infrared (VNIR) Spectral Features (0.4 - 1.3 µm) ............................................................................................................... 53 Vibrational Processes –Shortwave Infrared (SWIR) Spectral Features (1.3 - 2.5 µm) ..................................................................................................................... 55
Interaction of Electromagnetic Radiation with Surfaces .................... 58 Depth of penetration of incident Electromagnetic Radiation ................................ 59 Microphytic Vegetation Crusts and Surface Coatings .......................................... 60
Interaction of Electromagnetic Radiation with the Atmosphere ........ 60 Interactions of Electromagnetic Radiation with Minerals .................. 64
Silicates............................................................................................................... 64 Fe-/Mg-OH Minerals........................................................................................... 65 Carbonates .......................................................................................................... 67 Sulphates............................................................................................................. 69 Micas .................................................................................................................. 70 White Micas........................................................................................................ 70 Smectite .............................................................................................................. 72 Kaolin Minerals................................................................................................... 72 Oxides and Hydroxides ....................................................................................... 74 Sulphides............................................................................................................. 76
Spectral Properties of Fresh and Weathered Rocks ............................ 76 Interaction of Electromagnetic Radiation with Vegetation................. 77
Spectral Properties of Vegetation in the Visible-Near Infrared Region................. 78 Spectral Properties of Vegetation in the Shortwave Infrared Region .................... 78 Vegetation Spectral Libraries .............................................................................. 79 Vegetation of the Olary Region ........................................................................... 80

Table of Contents
- viii -
Mineral Mixtures and their Spectral Response ................................... 80 Spectral Properties of Soils and the Mixing of Materials ......................................81
Part 2 Remote Sensing Instrumentation .............................................. 82 Remote Sensor Design Basics ............................................................... 83 Multispectral Sensors............................................................................ 86
Landsat ................................................................................................................86 ASTER................................................................................................................90
Hyperspectral Sensors .......................................................................... 92 Early Hyperspectral Sensors ................................................................................92 Airborne Imaging Spectrometer (AIS ) and the Airborne Visible/Infrared Imaging Spectrometer (AVIRIS) .......................................................................................93 AMS and Hyperspectral Mapper (HyMap) ..........................................................93 Hyperion Hyperspectral space borne imager ........................................................94 Operational Airborne Research Spectrometer (OARS) Line Profiler ....................95
Proximal Hyperspectral Spectrometers ............................................... 95 Portable Infrared Mineral Analyser (PIMA).........................................................96 ASD FieldSpec Full Range Pro............................................................................97 The CSIRO HyLogger .........................................................................................98 Comparison of the Hyperspectral Sensors used in this Study ...............................99
Part 3 Aerial Gamma-Ray Spectroscopy ............................................102 Introduction..........................................................................................102 Gamma-ray Spectroscopy Theory.......................................................102
Potassium ..........................................................................................................104 Thorium.............................................................................................................104 Uranium ............................................................................................................105 Potassium, Thorium and Uranium in the Regolith..............................................106
Gamma-Ray Spectroscopy Survey Techniques. .................................107 Flight Height .....................................................................................................107 Correction and Calibration of Gamma-Ray Data................................................109 Vegetation and Moisture....................................................................................109 Cosmic Radiation ..............................................................................................109
Chapter 5 Mineralogy of the regolith....................................110 Part 1 Sampling of the White Dam Prospect ......................................110
Surface Samples ................................................................................................110 White Dam Prospect Costeans ...........................................................................110 Costean Descriptions .........................................................................................114 Costean Sample Collection ................................................................................116 Part 2 Sample Preparation and Measurement .....................................................119
Part 3 Results and Data Analysis of Surface Samples........................120 ASD Spectral Analyses of Surface Samples.......................................................120 XRD Analysis of Surficial Materials..................................................................132
Part 4 Results and Data Analysis of Subsurface Samples..................142 Spectral Analysis of the Costean Samples..........................................................142 WDTR01 - Thick Transported Cover.................................................................142 WDTR02...........................................................................................................149 WDTR04 –Amphibolite Dominated Section......................................................155 WDTR05 –Thick Profiles of Transported Cover ................................................160 WDTR06 – Regolith Carbonate Dominated Shallow Section.............................164 Conclusions of the ASD Measurement of White Dam Prospect Costeans...........169
I C Lau List of Figures
- ix -
XRD Analyses of the Costean Profiles .............................................................. 170 Part 5 Analysis of the Drill Core with the HyLogger ........................ 181
Introduction....................................................................................................... 181 Interpretation..................................................................................................... 182 Shallow Holes ................................................................................................... 184 Deep Holes........................................................................................................ 188 Mineralogical Analyses of the Near-Surface Regolith and the Fresh Basement using the HyLogger and ASD Instruments......................................................... 189
Part 6 Results and Data Analysis of HyMap Imagery....................... 196 HyMap Mineralogical Maps .............................................................................. 196
Part 6 Integration of Mineralogical Results and Interpretations of the Regolith Mineralogy of the White Dam Prospect .............................. 202 Chapter 6 Remote Sensing of the Regolith ...........................206 Landsat Dataset analysis ..................................................................... 207
Landsat Pre-processing...................................................................................... 207 Landsat Processing and Information Extraction ................................................. 208 Directed Principal Component Analysis (DPCA)............................................... 214 Summary of Multispectral Imagery for Remote Sensing of the White Dam Area.......................................................................................................................... 216
Hyperspectral Image Processing ........................................................ 217 Pre-processing ................................................................................................... 217 Atmospheric Correction-Theory........................................................................ 218 Spectral Subsetting ............................................................................................ 222 Pre processing of the HyMap Imagery Part1-Atmospheric correction ................ 222 Comparison of HyMap data with ASD data....................................................... 229 Pre processing of the HyMap Imagery Part 2-Geocorrection and Image Cleanup.......................................................................................................................... 232 Information Extraction and Spectral Un-mixing ................................................ 234 Mixture Tuned Match Filtering using Combined Endmembers .......................... 243 Information Extraction of the HyMap Imagery using Spectral Indices ............... 256
Analysis of Airborne Gamma-Ray Survey Sata over the White Dam Region................................................................................................... 284
Pre-processing ................................................................................................... 284 Image Presentation and Information Extraction ................................................. 284
Chapter 7 Mapping the Regolith ...........................................292 Introduction ......................................................................................... 292 Previous Regional Regolith Studies in the Curnamona Province ..... 293
Landscape and Climate...................................................................................... 293 Vegetation......................................................................................................... 294 Land Use........................................................................................................... 294
Methods and Datasets.......................................................................... 294 Map production................................................................................................. 295 Ortho-Photography............................................................................................ 296 HyMap Imagery ................................................................................................ 301 Landsat.............................................................................................................. 303 Radiometrics ..................................................................................................... 304 Digital Elevation Model .................................................................................... 305 Fieldwork and Ground Survey........................................................................... 306
Table of Contents
- x -
Regolith-Landform Mapping Results .................................................307 Mapping scheme................................................................................................307 Regolith-landform Unit Descriptions .................................................................307 The Spectral characteristics of RLU’s from the White Dam Regolith-landform Map. ..................................................................................................................317
Summary of the Regolith-Landforms of the White Dam Area..........320 Chapter 8 Conclusions.........................................................321 Regolith-Landform Mapping ..............................................................321
Comparison to Previous Regolith studies in the Olary Domain ..........................321 Regolith-Landform Map Creation Method.........................................................322 Regolith-Landform Maps in Mineral Exploration ..............................................323 Application of Regolith-Landform Mapping to other Landscapes ......................323
Remote Sensing of the Regolith ...........................................................323 Regolith Mapping using Radiometrics ...............................................................324 Multispectral Remote Sensing ...........................................................................324 Hyperspectral Remote Sensing and Mineral Mapping of the Regolith................324 Interpretations of the Remotely Sensed Data......................................................325 Surficial Mineralogy of the White Dam Prospect ...............................................326 Subsurface Predictions from the Remotely Sensed Data.....................................327 Subsurface Mineralogy of the White Dam Prospect ...........................................328
Final Conclusions of the Remotely Sensed Regolith-Landform Mapping................................................................................................329 References.............................................................................................330
I C Lau List of Figures
- xi -
List of Figures
Figure 2.1 Simplified map of the Curnamona Province showing the major groups of lithologies, topographic information and boundaries of domains and sub-regions. The Curnamona Province extends further to the north than shown on the map. The field area of the research is shown by the grey northeast orientated rectangle in the lower central portion of the map. The geology is overlayed on a true-colour Landsat TM image. ...............................................................................................6
Figure 2.2 Regional geological map of the Olary Domain, showing the location of the major inliers. The extent of the area of investigation is shown by the grey northeast orientated rectangle in the central portion of the map. Homesteads, mineral occurrences and major landmarks are shown for reference. The approximate location of the boundary between the Olary and Broken Hill Domains is shown in blue.....................................................................................................7
Figure 2.3 Time-space table of the lithostratigraphy and major events of the Olary Domain, in the Palaeoproterozoic and Mesoproterozoic (based on Conor 2003). ...9
Figure 2.4 Summary of the lithology and mineralogy of the White Dam Prospect area (summarised from Cordon 1998; Bargmann 1999; Chubb 1999; Busutill & Bargmann 2003).................................................................................................. 21
Figure 2.5 Structure and basement lithology of the (a) White Dam Prospect area and (b) in cross-section, interpreted from drill hole and geophysical data (from Busutill & Bargmann 2003).................................................................................................. 23
Figure 3.1 Comparison of the idealised Yilgarn regolith profile with field observations
of regolith profiles from the OlD (idealised regolith profile from Robertson & Butt 1997, soil horizon nomenclature from Chartres 1981). Photographic inserts of samples or regolith and fresh rock materials include samples from the White Dam Prospect. ............................................................................................................. 28
Figure 3.2 Morphologies of RCAs in the Curnamona Province, demonstrate variations through the profile and laterally. This can be linked to the regolith materials and the landform setting, and such regolith-landforms can be used to predict the presence of RCAs (adapted from McQueen et al. 1999)....................................... 34
Figure 3.3 An example of banded vegetation on an ortho-photograph of the White Dam alluvial plain. Sheetflow extends from the elevated region in the west, downslope to the east. Note the reduction of the clarity of the vegetation bands to the east of the fence line (a) due to greater herbivore grazing to the east............................... 35
Figure 3.4 Example of banded vegetation from the White Dam alluvial plain, in the OlD; (a) vegetation band looking upslope. The total length is approximately 30 m long by up to 3 m wide.; (b) along the contour band, showing the accumulation of vegetation litter and the increased surface roughness within the grove. The microtopography is not evident from the photographs, demonstrating the subtleness of the landform when viewed from the ground. The groves at this location were dominated by Maireana pyramidata. .................................................................... 36
Figure 3.5 Generalised vegetation toposequence for the White Dam area. Vegetation species vary with differing regolith materials and position in the landscape. Once the vegetation associations of different regolith-landforms have been established, they can be used as surrogates in the regolith-landform mapping process (adapted from Hill 2000). .................................................................................................. 38
Figure 3.6 Map showing the main features of the region of investigation discussed in the text. The region can be subdivided in to two regions, the southern areas are bedrock-dominated with extensive outcrops of slightly weathered saprolite, while

List of Figures
- xii -
the northern areas are regolith-dominated. In the northern regions the bedrock exposures are generally smaller and more intensely weathered. The central region of the study area is dominated by transported materials and alluvial landforms. ...40
Figure 3.7 Digital elevation model of the study area generated from data supplied by PIRSA. The original elevation data was derived photogrammetrically and used to ortho-rectify the aerial photography in the production of ortho-photographic images. The northwestern corner of the data was not covered by the original dataset and was filled with MIMEX geophysical survey elevation data of higher resolution. The mosaiced portion has a slightly higher overall elevation and produces a slight discontinuity where the overlap occurs. An association of topography can be seen with the broad classifications described in Figure 3.6, with the southern areas of higher topographic relief associated with slightly weathered bedrock, the flat central regions with plains of alluvial materials and the northern region with low hills of highly weathered saprolite. .............................................41
Figure 3.8 Low lying area, and rise (background) that is dominated by colluvial-sheetflow processes (CHer). Abundant quartz material occurs on the surface of the erosional plain (CHep)-foreground and middle distance), which is dissected by recent channelling (Aed). Note (a) the vegetation banks have been planted by landowners in attempt to reduce erosion by limiting overland flow. In the foreground a shallow rill, containing less quartz lag, is starting to develop. Behind this feature is an erosional channel, which is down-cutting through the PSA (b) and underlying palaeosoil. ..........................................................................................44
Figure 3.9 View from a topographically elevated position across colluvial-dominated landscape. The material in the foreground consists of colluvial ‘float’, derived from underlying basement subcrop. The cobble-sized clasts occur on an erosional rise (Cer), which has a concave slope profile and in the middle distance, sheetwash material become the dominant surface material (CHer). In the far middle distance the landform has less relief, forming a depositional region (CHpd, which is flanked by a CHer in the far distance. Materials shedding off of the erosional rises are transported by sheet-wash processes downslope to the CHpd, where they accumulate. A drainage depression (Aed) parallel to slope originates on the rise (Cer) and terminates in the region of lowest relief (CHpd). A variety of vegetation types occur in the region and, although sparse, can aid the interpretation of the regolith-landforms. (a) A bluebush chenopod (Maireana sp.) occurs at the limit of the colluvial cobbles, making the approximate boundary of the two regolith-landform units. On the depositional plain (b) a Dodonaea sp. occurs on the clayey soils. On the colluvial slopes (c) various low grasses and forbs colonise between the cobbles...........................................................................................................45
Figure 3.10 A drainage depression (Aed) between two low hills that have exposures of saprolite at the crests (SSel). A regolith toposequence occurs downslope of colluvial material (Cel), which is flanked by sheetwash deposits on the lower slopes (CHer). Variations in the vegetation communities highlight the change in landforms and regolith materials. (a) Atriplex vesicaria occurs on the colluvial materials, whereas (b) Maireana sp. occurs on the lower portion of the slope. In the middle distance a saddle between the two low hills is mantled by quartzose sheetflow materials. In the foreground (c) cryptograms cover a larger portion of the exposed surface of the (a) colluvial cobbles (light green colouration). (d) The soil immediately adjacent to the bedrock exposures is dark-red, which contrasts with the yellow-brown material partially covering the downslope float and sheetwash. ...........................................................................................................46
Figure 3.11 View from a low rise of exposed Willyama Supergroup bedrock colonised by (a) Acacia aneura and (e) low grasses between the rocks, which are (d) coated

I C Lau List of Figures
- xiii -
by a cryptogram cover (green lichen). The downslope materials consists of sheetflood sediments of red-brown quartzose sands and lithic gravels (CHer) colonised by (c) Atriplex vesicaria. The region further downslope is colonised by (b) Alectryon oleifolius (western rosewood), which typically occurs in regions containing near-surface regolith carbonate accumulations. In the far distance is an alluvial plain (Aap) in the lowest lying parts of the toposequence. ....................... 47
Figure 4.1 Propagation of EM energy as a wave. Wavelength is defined by the distance
between the crests of the waves, the amplitude is the height of the waves and frequency is the number of oscillations through a point on the wave for a period of time (adapted from Avery & Berlin (1992)). Note that electric and magnetic fields are always orthogonal. ......................................................................................... 50
Figure 4.2 Electromagnetic spectrum of radiation. The visible region has been expanded to display the corresponding wavelengths of reflected colours seen by the human eye (Table 4.1) (Adapted from Nave 2003)......................................... 51
Figure 4.3 Interaction of electromagnetic energy with the surficial layers of a material occurs with the top 50 µm. (ii) Reflection occurs from grain surfaces. (iii) A transparent mineral may transmit EMR where it is reflected by the material below, (i) or the energy may reflect off of the bottom of the crystal structure. Each of these processes will influence the nature of the electromagnetic energy recorded by the sensor. ........................................................................................................... 53
Figure 4.4 Electron shift between orbital shells created by the absorption of incident electromagnetic radiation. The subsequent excitation and emission of EMR is seen as crystal field absorptions (CFA), as shown in Figure 4.6................................... 54
Figure 4.5 Ligand charge transfer caused by an absorption of a photon of energy, resulting in the shift in paired electrons within the complex. The spectral effects of the transfer can be seen Figure 4.6....................................................................... 54
Figure 4.6 Crystal field absorption (CFA) and charge transfer absorption (CTA) features of hematite and goethite for samples collected from the White Dam area. All spectra are displayed with the continuum removed and stacked for comparison. The lower spectra show the spectral variation that occurs with different iron-oxide mineralogy. The goethite measurements show a deeper CFA at longer wavelengths and shorter wavelengths for the CTA and charge transfer shoulder (CTS). ................................................................................................................. 55
Figure 4.7 Vibrational energy level diagram (a) from Hunt (1991), showing the fundamental vibrations of water molecules and their associated overtone and combination frequencies. The lower portion of the figure (b) demonstrates the spectral features of the molecular processes (from Cudahy et al. 2002)................ 57
Figure 4.8 Scattering effects of EM radiation showing the effects of (a) rough and (b) smooth surfaces. (c) The process of diffuse scattering on a smooth surface (specular scattering) demonstrates the reflection of incident light in all directions. (d) Other processes involve refraction/transmission, absorption and emission of EM radiation. ...................................................................................................... 59
Figure 4.9 Pathways of EM radiation emitted from the sun to the instrument. Satellite imagery has the greatest distance for EM radiation to travel whereas field spectrometers use solar radiation that only passes though the atmosphere once.... 61
Figure 4.10 Absorption bands of atmospheric gases between 1.0 and 2.5 µm showing the gases in Table 4.2. The atmospheric gases have major effects on the EM wavelengths received from the sun, causing some areas to be almost opaque. (modified from Prata, F. 2004 (pers. comm.))...................................................... 62

List of Figures
- xiv -
Figure 4.11 Transmission spectrum of the narrow water absorption bands of atmospheric water, demonstrating the amount of EM radiation passing through the ‘atmospheric windows’ in the 0.9 to 3.0 µm region. .............................................63
Figure 4.12 Hyperspectral Mapper (HyMap) uncorrected (radiance at sensor) spectra from the Olary Domain. The characteristic spectral shape is due to the interactions of the solar irradiance spectrum with aerosols in a semi-arid environment. Distinguishable absorptions due to gases in Table 4.3 are shown. ........................63
Figure 4.13 Spectral responses of feldspars and quartz, demonstrating the high reflectance and lack of strong features useful for the discrimination of these minerals (70 - 85 % for 0.8 – 2.5 µm wavelengths). .............................................65
Figure 4.14 Spectral responses of common Fe- and Mg-bearing minerals. Fe-OH minerals are characterised by 2.25 µm absorption features, whereas Mg-OH minerals have features in the 2.3 µm region. The presence of ferric and ferrous ions are identified by the presence of absorption features in the 1.0 µm region and lower reflectance in the VNIR. ............................................................................67
Figure 4.15 Spectral responses of common carbonate minerals. Carbonate ions are influenced by the bound cation. The wavelength of the broad asymmetric carbonate feature increases from Fe to Mg to Ca cations. .....................................68
Figure 4.16 Spectral responses of common sulphur bearing minerals. Sulphates possess sharp characteristic absorptions in the NIR and short wavelengths of the SWIR due to their multiple hydroxyl and water bonds on the molecules. ..............................69
Figure 4.17 Spectral responses of common alumino-silicate minerals. Aluminosilicate minerals are characterised by the presence of 2.2 µm Al-OH and 1.4 µm OH absorption............................................................................................................71
Figure 4.18 Spectral responses of common kaolin minerals. Kaolins are also aluminosilicate minerals but display doublet absorptions at 1.4 µm and 2.16-2.2 µm. These features can be used to determine the crystallinity of the mineral kaolinite (Figure 4.19). ........................................................................................73
Figure 4.19 Kaolinite crystallinity parameters relating to the 2.16-2.18 µm features of the hull quotient spectrum. Crystallinity is calculated using the formula: (2.184/2.19 µm – ((2.16/2.177 µm) - (2.184/2.19 µm)) of hull quotient removed data. The spectra are from samples from the White Dam area, measured using an ASD FieldSpec Pro FR (figure adapted from Pontual et al. 1997). .......................74
Figure 4.20 Spectral responses of common Fe-bearing oxides and hydroxides, active in the VNIR wavelength regions. These minerals are characterised by CTS and CFA features, as shown in Figure 4.6. ..........................................................................75
Figure 4.21 Average vegetation spectra of dry and healthy grass. Dry grass has a similar spectrum as semi-arid chenopods in the SWIR regions. Spectra have been taken from the IGCP-264 Library and the unit of measurements are wavelength in micrometres and reflectance %. (adapted from Lewis 1999). ...............................79
Figure 4.22 Comparison of whiskbroom, pushbroom and line profile sensors. Line profilers collect a swath of one pixel in a similar manner as geophysical sensors whereas imagers collect a swath as the platform travels in a forward direction. Whishkbroom scanners possess a fore optic, such as a mirror, that sweeps from side to side and collects information along the swath as the platform travels forward, whereas a pushbroom scanner possess an array of detectors that collect the whole swath without the need of a rotating mirror. The draw back is that each pixel that is being imaged requires a detector for each band of the EM spectrum being collected. This results in hyperspectral pushbroom sensors being complicated instruments, consisting of tens of thousands of detectors. .................84
Figure 4.23 Comparison of a selection of the commonly used remote sensing sensors with particular emphasis on spectral sensor (adapted from Mauger 2003). A wide

I C Lau List of Figures
- xv -
range of the EM spectrum is used by different instruments, from short wavelength radiation by gamma-ray spectrometers to long wavelengths by radar. Some sensors cover a wide range of the EM spectrum, from the near UV to the TIR, but do so with large bandwidths and few bands. Satellite-borne systems typically have a lower spatial resolution and SNR than airborne systems. Not shown in this Figure are the new generation of high spatial resolution satellite-borne sensors with 1-2 m panchromatic and 4 m multispectral capabilities. ....................................... 85
Figure 4.24 Landsat TM full-width half-maximum bandwidths in µm. Clay and Fe-oxide spectra from ASD measurements of a saprolite sample collected from a costean over the White Dam Prospect. USGS spectral library used for green vegetation spectra (Clark 1993). .......................................................................... 88
Figure 4.25 Band passes of the 14 ASTER channels, which include 3 VNIR, 6 SWIR and 5 TIR. Note the missing MIR region between 2.5 – 8 µm............................. 91
Figure 4.26 The PIMA instrument has the approximate dimensions of 0.30 m x 0.15 m x 0.15 m. The spectrometer is used world-wide in mining and mineral exploration applications. The instrument operates in the SWIR region only and takes approximately 45 seconds to record a quick spectrum, to over five minutes for measurement of dark samples. ............................................................................. 96
Figure 4.27 ASD FieldSpec instrument with the high intensity contact probe, containing the fibre optic and halogen light source housed in the contact probe. The instrument is approximately 0.50 m x 0.45 m x 15 m. and requires a light source and reference plate. In this example soil samples are measured in a pertri dish placed on the vertically mounted contact probe.................................................... 98
Figure 4.28 HyLogger instrument as of late 2003, showing the mounting frame for the sensor, x-y core tray table, conveyor belt and control unit (adapted from Syddell 2004). An updated table and mounting frame has been produced since this picture that includes side panels to reduce incident light from other sources and a temperature controlled compartment for the sensor to reduce drift. ...................... 99
Figure 4.29 Comparison of HyMap data with PIMA and ASD FieldSpec spectra of material from the kaolinised saprolite around the White Dam reservoir. The HyMap instrument is unable to delineate fine features with 128 bands but still has the overall spectral shape, whereas the results from PIMA instrument is compatible with the ASD but does not have coverage in the VNIR region (0.35 - 1.3 µm). The ASD FieldSpec is able to measure a greater number of samples per hour in the laboratory but requires an external light source and is three times the size of the PIMA, making it less portable. A spectrum of halloysite from the 189 band HyLogger is also shown as a comparison........................................................... 100
Figure 4.30 Typical gamma-ray energy spectrum showing the photopeaks of the radioisotopes and daughter products used in radiometrics. Also shown are the four main count windows used to calculate the abundances of the radioelements (after Foote 1968). ...................................................................................................... 103
Figure 4.31 The variation of potassium signal with flight height (from Grasty et al. 1984). As the sensor altitude increases the signal received from the ground sources decreases. It is also important to note that atmospheric and cosmic sources may contribute a larger portion of the signal with increased altitude.......................... 108
Figure 4.32 Demonstration of the size of the ground area examined by an airborne gamma-ray instrument. Decreased flying height will decrease the size of the ground area surveyed. The footprint of the survey of a gamma-ray spectrometer is relatively large and overlap can occur when surveys are conducted with close line spacing. ............................................................................................................. 108

List of Figures
- xvi -
Figure 5.1 Sample localities across the White Dam area. The small transparent circles represent sites where a GPS measurement and site descriptions were recorded. The filled circles represent sites where photographs were taken and the large transparent circles represent sites where a sample was collected and spectral measurements were............................................................................................111
Figure 5.2 Sample points overlain on the White Dam Prospect 1:2 000 Regolith-Landform Map compiled by Brown & Hill (2003), displaying the costean locations (red font) with respect to the regolith-landform units. Arrow shows the orientation of Figure 5.4. Surface soil samples (black font) increase in numerical order from left to right and to the south. ..............................................................................112
Figure 5.3 (a) Digital elevation model generated from points measured with a differential global positioning system (DGPS) over the White Dam Prospect. (b) A NW-SE topographic profile. (c) A three dimensional perspective image of the topography, looking towards the east. ................................................................113
Figure 5.4 An oblique air photograph looking east-southeast over the White Dam Prospect area, taken of July 2003, after recent rainfall. The six north-south orientated costeans can be seen in the middle distance. The northeast flowing creek occupies the foreground. Bright patches in the distance and left portion of the photograph are ponded water on the depositional landforms.........................114
Figure 5.5 North orientated view of costean WDTR05, excavated over the White Dam Prospect in June 2003. The east-northeast trending alluvial channel occurs in the background. The bench level is approximately 2.5 m and the base of the costean is 6 m from the surface. The scale bar in the middle distance is 2 m in length. ......115
Figure 5.6 Sections of the five analysed costeans from the White Dam Prospect showing the regolith stratigraphy, regolith carbonate morphology, extent and style of the ferruginisation and the colour of the materials sampled. Vertical: Horizontal=1...........................................................................................................................117
Figure 5.7 Example of sample spacing from the costeans excavated over the White Dam Prospect. Samples were collected laterally every 10 m in profiles with 0.25 m vertical spacing. Infill sampling was performed at a lateral distance of 5 m if there a significant change in the overlying transported materials or saprolith occurred...........................................................................................................................119
Figure 5.8 Spectral plots demonstrating the correction of the ASD FieldSpec measurements for variations between detector regions. The dashed spectra represent the corrected data using the ‘D-step’ ENVI plug-in developed by CSIRO MMTG. .............................................................................................................120
Figure 5.9 Collective ASD measurements of the soil-grid samples. Each group of ten spectra represent a west to east traverse. Samples were collected 50 m apart. WD01 represents the most northwestern sample and WD70 was collected in the southeastern corner of the grid. The lithic fragments found in the samples WD68 and WD70 are shown in (viii). ...........................................................................122
Figure 5.10 Surface mineralogical distribution over the White Dam Prospect, interpolated from ASD measurements and analyses of soil samples. Saprolite is exposed in the SE corner of the area and displays high-interpreted abundances of hematiteTSA, as does the central portion of the area, which corresponds to the surface projected mineralisation outline (not shown). The area above mineralisation also displays a higher abundance (although, still small) of chlorite/epidoteTSG related spectral features. These highs are associated with the NE trending alluvial erosional depression and could be a collection of transported ferromagnesian minerals derived from the outcrop upslope to the south.............124
Figure 5.11 Comparison of Fe-oxide IntensityTSG and Munsell colour measurements of the surface soil samples from the White Dam Prospect. The saprolite displayed

I C Lau List of Figures
- xvii -
Yellowish red/reddish brown colouration, which corresponded to low Fe-oxide IntensitiesTSG, whereas the alluvial regions displayed higher intensities and were associates with dark red coloured samples. Yellowish red coloured samples roughly correlated with moderate value areas for the Fe-oxide Intensity IndexTSG........................................................................................................................... 126
Figure 5.12 Surface mineralogical distribution over the White Dam Prospect, interpolated from ASD measurements and analysis of soil samples. Comparisons of Al-OH related wavelength features and minerals. Overall, the abundance maps display minor to high correlations...................................................................... 128
Figure 5.13 Distribution of surface samples used in the quantitative XRD analysis. Circles represent surface-grid soil samples and boxes represent costean samples collected within 100 mm of the surface.............................................................. 133
Figure 5.14 Spectra corresponding to XRD samples in Table 5.1 and Table 5.2. Spectra in plot (a) are surface samples collected from the 50 x 50 m grid. Plots (b) and (c) are from surface samples from costeans WDTR04 and WDTR06 respectively. The continuum removed plots all have very similar VNIR and SWIR features, with only small variations observable in the 1.9 µm spectral region due to differences in water abundances. ............................................................................................. 135
Figure 5.15 Surface distribution of minerals over the White Dam Prospect interpolated from quantitative XRD analysis for (i) mica/illite, (ii) orthoclase, (iii) kaolinite, (iv) smectite and (v) albite of soil samples. Abundances are in percent, with dark areas having a low abundance and light areas a high abundance. The blue dots indicate where samples were used in the gridding process. ............................................. 137
Figure 5.16 Surface distribution of minerals over the White Dam Prospect interpolated from quantitative XRD analysis for (i) amphibole, (ii) calcite, (iii) quartz, and (iv) hematite soil samples. Abundances are in percent, with dark areas having a low abundance and light areas a high abundance. The blue dots indicate where samples were used in the gridding process. ..................................................................... 138
Figure 5.17 WDTR01 gridded mineralogical abundances sections, calculated from spectral measurements collected from costean samples. The Fe-oxide mineralogy and related indices correlate with the transported and in situ materials. Similarly, the kaolin mineralogy and the features related to Al-OH are associated with different regolith materials. Sections denoted ‘ASD” are mineral abundances, whereas ‘TSG” denotes an index calculation based on absorption feature depths. Due to the gridding technique used, anomalous regions in the interpolated regions between the sampled profiles are more uncertain and should be treated classified accordingly. ..................................................................................................... 145
Figure 5.18 Profile WDTR01 E (6449192 mN) showing the gypsiferous minerals occurring 1 m below the surface. ....................................................................... 147
Figure 5.19 Photograph of profile WDTR01C (6449212 mN), showing the lithic gravels ~1.5 m below the surface. WDTR01 occurred in the northern region, away from the exposed bedrock and has a thicker succession of transported materials overlying saprolite and in situ pedolith materials, which occur ~4m below the surface (not shown). The YB unit displays the greatest variation of thickness when compared in all the costeans. ............................................................................. 148
Figure 5.20 Weathering of the in situ materials to pedolith in the lower-northern end of WDTR02 (profile A). The shelf (at the top of the photograph) occurred 2.75 m below the surface and the floor of the costean (shown at the bottom of the photograph) occurred at 3.75 m below the surface. The green-yellow material in the lower portion of the costean contained high abundances of Fe2+ goethite and nontronite and jarosite, interpreted from the spectral measurements................... 150

List of Figures
- xviii -
Figure 5.21 WDTR02 ASD result. Mineralogical (ASD) and calculated parameters from The Spectral Geologist (TSG)............................................................................151
Figure 5.22 WDTR04 ASD result. Mineralogical (ASD) and calculated parameters from The Spectral Geologist (TSG)............................................................................157
Figure 5.23 Carbonate absorption features of observed in samples collected from indurated horizons in WDTR04. Sample E1 collected from the Red-Brown Pedal Layer and contains no traces of regolith carbonate, whereas E2 has a low reflectance in the 2.4 µm region related to the 2.5 µm calcite feature. E1 and E2 contain montmorillonite and display a large, broad absorption at 1.9 µm, due to water. E3 and E4 were collected from the indurated regolith carbonate hardpan and show slight absorption peaks at 2.28 µm, which could be related to carbonate. CD4 and A9 possessed very strong calcite absorptions, as well as a kaolinite doublet at 2.16 - 2.2 µm, with A9 featuring the 2.5 µm calcite feature. A sample of goethititic saprolite collected below the hardpan (A10) did not display calcite absorptions like A9, although the low reflectance in the NIR related to Fe2+ is observed. ...........................................................................................................159
Figure 5.24 WDTR05 ASD result. Mineralogical (ASD) and calculated parameters from The Spectral Geologist (TSG)............................................................................161
Figure 5.25 Albitic intrusion hosting Fe-tourmaline veins, in WDTR06, profile “E” (grid reference 6449082 mN). Photograph was taken of the costean eastern face...........................................................................................................................166
Figure 5.26 WDTR06 ASD result. Mineralogical (ASD) and calculated parameters from The Spectral Geologist (TSG)............................................................................167
Figure 5.27 Quantitative XRD results from selected profiles of costean WDTR06. The intervals of depth are not to scale. ......................................................................171
Figure 5.28 Quantitative XRD results from selected profiles of costean WDTR04. The intervals of depth are not to scale. ......................................................................176
Figure 5.29 Profiles of the quantitative XRD results from the costeans WDTR01, WDTR05 and WDTR02. The intervals of depth are not to scale. ......................178
Figure 5.30 Location of the diamond drill holes analysed by the HyLogger core scanner (a). Perspective view (b) and 3D drill hole projections (c) of the White Dam Prospect.............................................................................................................183
Figure 5.31 TSG scatter plot of depth versus SWIR mineralogy for the upper 10 m of WD16................................................................................................................186
Figure 5.32 HyLogger profile of (a) WD DD 19 and (b) WD DD 15. ........................193 Figure 5.33 ASD profiles from (a) quartzo-felspathic derived saprolite and (b) mafic
derived saprolite. Samples were collected in 0.25 m intervals down the profile, through the topsoil, transported material and pedolith, into the saprolite. The thickness of the transported cover over the quartzo-felspathic derived saprolite is thicker than the mafic saprolite. An increase in kaolinite crystallinity can be seen down the profile (a) as the samples become less weathered. In the mafic profile (b) the abundance of kaolinite decreases with depth in the saprolite (green spectra) corresponding to the top of the saprolite/pedolith material being more weathered than the saprock.................................................................................................194
Figure 5.34 HyMap surface mineralogical maps of Fe-minerals (iii, iv, vii), carbonate and green vegetation (viii). (i) Shows the distribution of pixels used in the analysis and gridding process over a HyMap TCC and (v) displays the ortho-imagery with the surface sample collection points that were measured with the ASD FieldSpec, and the 1:2000 Regolith-Landform boundaries (courtesy of Brown & Hill 2003). The location of the north-south orientated costeans are shown in red. Ratios of spectral parameters (ii &vi) display a slight correlation to the colour of the surficial

I C Lau List of Figures
- xix -
materials. ‘HyMap’ refers to the abundance of the mineral, whereas ‘TSG’ are calculated from TSA algorithms. ....................................................................... 197
Figure 5.35 HyMap surface mineralogical maps of aluminium hydroxide minerals and associated parameters. The waste spoils from the diamond drill holes can be seen to display variations in mineralogy, from phengitic (ii) to having more chlorite/epidote (iii). ‘HyMap’ refers to the abundance of the mineral, whereas ‘TSG’ are calculated from TSA algorithms........................................................ 200
Figure 5.36 Profile summarising the spectral properties of the regolith materials collected from the costeans at the White Dam Prospect. (a, b, c) A HyMap spectra from a pixel in a PSA dominated region of the White Dam Prospect is shown at the top of the profile as a comparison. Characteristic features were identified for each of the different regolith horizons, allowing the mapping of saprolite, in situ pedolith and three types of transported materials. Differentiation of the in situ materials (g - p) was able to be performed. See text for a detailed explanation of the figure. .......................................................................................................... 205
Figure 6.1 Comparison of raw and Log Residual (LR) corrected Landsat TM data over
the White Dam area. A greater variation between bands can be seen in the LR image, which had a lower amount of correlation between bands than the raw data........................................................................................................................... 210
Figure 6.2 (i) High-oblique and (ii) low-angle images of the 60 m resolution thermal band of Landsat TM, draped over a DEM of the White Dam area. The white rectangle represents the area of the HyMap coverage. Image is presented without illumination effects and displays higher values on slopes with a northeastern aspect, reflecting the orientation of the sun at the time of acquisition (mid-morning). Densely vegetated regions display a lower thermal value then areas of exposed basement and lag dominated terrains. Note the sub-horizontal line striping in (i) from instrument noise. .............................................................................. 212
Figure 6.3 Landsat TM RGB 741 false colour composite (FCC) of the southern portion of the White Dam area, showing the ability of a simple band combination to highlight different materials and features. .......................................................... 213
Figure 6.4 Landsat TM FCC of ratios TM5/TM4 TM4/TM3 TM5/TM7 (RGB) demonstrating the ability to differentiate in situ regolith (Fe-rich) from transported materials (vegetated and clayey regions). Saprolite is displayed as bright red-pink areas. Vegetation had a blue-green colour and areas of bare soil or clays, with minor vegetation cover, were dark blue. ............................................................ 214
Figure 6.5 Band ratio results of selected band ratios of Landsat TM imagery over the White Dam area................................................................................................. 215
Figure 6.6 Directed Principal Components Analysis and ratio composite image (RGB: DPCA2 TM5/TM4, TM7+TM1) of Landsat TM data, highlighting regolith materials. Red were clay-rich areas, bright greens were Willyama Supergroup-derived saprolite, blues correspond to the Adelaidean metasediments, the badlands/erosional region and areas containing abundant lithic and quartz gravel lags.................................................................................................................... 216
Figure 6.7 Flowchart of pre-processing steps............................................................. 218 Figure 6.8 Comparisons of (a) Raw HyMap and (b) scaled reflectance results for
HyCorr-only processing kaolinititic material from a dam wall (dotted spectra) and a pixel of the canopy of an eucalyptus camaldulensis (black spectra). For reference ASD spectra of green vegetation (red spectra) and kaolinised-goethitic saporolite (green) are shown. Notice large positive spikes in the 1.1 µm and 1.3 µm regions and noise in the NIR regions. A CO2 feature had not been corrected sufficiently at 2.05 µm. The lower spectrum is displayed with the continuum removed. (c)
List of Figures
- xx -
HyCorr + EFFORT scaled reflectance spectrum of kaolinititic material from a dam wall. The lower spectrum is displayed with the continuum removed. The wavelengths of both spectra were in micrometres (µm). Notice the flat shape between 0.9 µm and 2.1 µm, the vegetation feature at 0.7 µm and the exaggerated kaolinite doublet at 2.2 µm.................................................................................223
Figure 6.9 Sample collection site of the dark-target material for empirical line calibration of the HyMap imagery......................................................................226
Figure 6.10 Comparison of co–registered pixels from adjacent HyMap swaths corrected by the HyCorr + ASD Gains method. The dashed spectrum is an ASD FieldSpec measurement of samples collected from the corresponding pixel area. ...............227
Figure 6.11 HyMap spectral responses and corresponding ASD measurements of samples collected from around the White Dam swaths, used to validate the atmospheric correction. The ASD spectra have been resampled to HyMap wavelengths (from 2151 to 128 bands)...............................................................230
Figure 6.12 HyMap spectral responses and corresponding ASD measurements of samples collected from around the White Dam swaths, used to validate the atmospheric correction. The ASD spectra have been resampled to HyMap wavelengths (from 2151 to 128 bands)...............................................................231
Figure 6.13 WD001 swath showing (upper) corrected and (lower) uncorrected cross-track data. ..........................................................................................................233
Figure 6.14 Diagrammatic representation of the ‘hourglass’ processing technique of mineral map production, using un-mixing techniques. The term comes from the decrease in data, and corresponding file size, through the processing steps. .......234
Figure 6.15 Information extraction flowchart, detailing the un-mixing techniques used on the HyMap Imagery. .....................................................................................235
Figure 6.16 Combined SWIR endmember spectra, extracted from the HyMap imagery...........................................................................................................................238
Figure 6.17 Combined SWIR endmember spectra, extracted from the HyMap imagery...........................................................................................................................239
Figure 6.18 Combined SWIR and VNIR endmember spectra, extracted from the HyMap imagery. ............................................................................................................240
Figure 6.19 Combined VNIR endmember spectra, extracted from the HyMap imagery...........................................................................................................................241
Figure 6.20 Northern White Dam HyMap MTMF results of the VNIR endmembers showing the dominant features consisting of materials identified as hematite and soil. Areas of dark outcrop were mapped under the road and shadow endmembers (green and brown pixels). Highly weathered saprolite corresponded to goethite...........................................................................................................................246
Figure 6.21 Southern White Dam HyMap MTMF results of the VNIR endmembers showing the dominant features, consisting of hematitic and soil materials. Areas of dark outcrop were mapped under the road and shadow endmembers (green and brown pixels). Highly weathered saprolite corresponded to goethite. ................247
Figure 6.22 Northern White Dam HyMap MTMF results of the vegetation endmembers of the VNIR and SWIR. The Highlighted with blue arrows are the direction of watercourses. The red classification represents areas identified to possess absorption features in the 2.25-2.40 µm region, possibly related to chlorite or carbonate minerals. ............................................................................................248
Figure 6.23 Southern White Dam HyMap MTMF results of the vegetation endmembers of the VNIR and SWIR. The red classification represents areas identified to possess absorption features in the 2.25-2.40 µm region, possibly related to chlorite or carbonate minerals. The pixellated nature of the results reflects the mixed nature of the HyMap data...................................................................................249
I C Lau List of Figures
- xxi -
Figure 6.24 Northern White Dam HyMap MTMF results of the SWIR endmembers showing the dominant regolith materials. Highly weathered saprolite corresponded to high crystalline kaolinite (blue pixels). Regolith carbonate associated with weathered saprolite was classified by the cyan areas, while a second endmember displays a more restricted distribution for RCAs (red pixels). Soil areas reflect alluvial areas (brown), whereas muscovite-rich soils (apple green) classified sheetflow dominated areas with shallow soils. Dark, aspectral outcrops were mapped as shadow (in dark green)..................................................................... 250
Figure 6.25 Southern White Dam HyMap MTMF results of the SWIR endmembers showing the materials in the MacDonald Ranges are less-weathered than the northern regolith-dominated area. RCAs (cyan) were associated with the Willyama Supergroup rocks, whereas the Adelaidean rocks were mapped as shadow (dark green). The shear zone in the Kalabity Shearzone Ranges region was mapped as possessing Fe-Al-OH absorption features. Badlands were mapped as soil (brown), whereas the soils mantling Willyama Supergroup rocks were mapped as muscovite-rich (apple green). ........................................................................ 251
Figure 6.26 Northern White Dam HyMap MTMF results of the SWIR endmembers showing the dominant regolith materials. Highly weathered saprolite corresponded to the endmember identified as low crystalline kaolinite (orange pixels). The Kaolin endmember (purple) mapped channels draining from weathered bedrock areas, mapped as Muscovite-Phengite (brown pixels). Weathered materials around the muscovite-phengite outcrops were mapped as very low crystalline kaolinite (cyan). Soils around these regions were also identified (muscovite Fe-rich) as red areas. ................................................................................................................. 254
Figure 6.27 Southern White Dam HyMap MTMF results of the SWIR endmembers showing the bedrock mineralogy of the MacDonald Ranges, showing the less weathered saprolite (Muscovite-Phengite, brown areas) and low crystalline kaolinite (cyan pixels) of the more highly weathered areas. Channels containing lithic materials were mapped as muscovite-phengite (linear features trending north from the MacDonald Ranges). ........................................................................... 255
Figure 6.28 Spectral Indices flowchart showing the sequence of processing required to extract mineral information from the HyMap data. ............................................ 256
Figure 6.29 Results of the two vegetation indices showing the distribution of green, photosynthetic vegetation (green areas, corresponding to the Leaf/Surface Index) and areas of dominantly dry or woody tissue (brown areas, corresponding to the Cellulose Index, and representing arid vegetation and heavily grazed plants). Notice the north-northwest linear edges across the swaths representing fence lines........................................................................................................................... 258
Figure 6.30 Fe-oxide Abundance image (left) and HyMap TCC (bands 16 10 3 RGB-right) from an area near MacDonald Hill. Saprolite (i) and the dark areas adjacent to creeks (iv) in the Abundance image are masked-out vegetation. The areas flanking the saprolite exposures (ii) (iii) display the highest Fe-oxide Abundances. Erosional depressions draining from exposures and creeks display moderate abundances. ....................................................................................................... 261
Figure 6.31 Fe-oxide Abundance and Mg-OH/RCA Abundance distributions from indices. Note the association of Fe-oxides with drainage features and alluvial regions, whereas the Mg-OH/RCA distribution is correlated with low rises and shallow soil areas flanking saprolite exposures. The Fe-oxide Abundance shows considerable differences .................................................................................... 262
Figure 6.32 Fe-oxide Abundance image (left) and HyMap TCC (bands 16 10 3 RGB-right) from an area east of Bulloo Creek Homestead, in an alluvial dominated region. Dark areas (i) adjacent to creeks, which were masked out in the
List of Figures
- xxii -
Abundance image. Saprolite exposures (ii) and alluvial landforms display the moderate-high Fe-oxide Abundances. ................................................................265
Figure 6.33 Hematite:Goethite Ratio of a sheetflow and subcropping basement area of calc-silicate derived saprolite, which is dissected by an alluvial channel. (ii) The clayey material adjacent to the channel displayed a higher hematite proportion than the areas where the (i) colluvial cover was thinnest and goethite was more prominent. .........................................................................................................266
Figure 6.34 Hematite:Goethite Ratio of the materials in the northern part of the White Dam alluvial plain, showing the higher proportion of goethite in the swampy regions and associated with the sheetflow-dominated slopes flanking basement subcrop in the left side of the image. The sediments of the alluvial plain displayed a higher proportion of hematite, shown in blue. .................................................267
Figure 6.35 Hematite:Goethite Ratio showing the contrasting difference in the mineralogy of (i) the badlands, (ii) the colluvial regions flanking the Adelaidean exposures and alluvial-dominated regions in the far left of the images, which have a intermediate mineralogy (green areas).............................................................268
Figure 6.36 Distribution map of Al-OH Abundance (apple green) with overlays of Kaolinite (dark green) and White Mica (blue and red). The White Micas are differentiated by their mineralogy, with Al-poor micas having a more phengitic mineralogy.........................................................................................................270
Figure 6.37 Al-OH Abundance image from shallow soil areas to the north of the MacDonald Ranges. Isolated inliers high abundances relating to basement subcrop occur in the lower portion of the images are not flanked by erosional depressions as seen in the left and central areas of the images, which drain into the upper of the two channels. .....................................................................................................272
Figure 6.38 Al-OH Abundance image of an area to the west of the Wilkins Prospect (high area in the lower right part of the images), showing the masked vegetated areas and sheetflow-dominated areas that were colonised by chenopods (grey areas in TCC), which displayed low abundances. The basement exposures in the upper and right parts of the images, relating to shear zones, have high abundances. .....273
Figure 6.39 Al-OH Abundance of the alluvial dominated region on the southern area of the White Dam floodplain, showing the clayey areas having high abundances. (iii) Areas of shallow soils, vegetation and sheetflow-dominated landforms adjacent to the channel and alluvial regions display low abundances. The low abundances reflect the underlying lithology of this region and mantling PSA materials. .......275
Figure 6.40 Kaolinite Abundance demonstrating the high abundance haloes around bedrock exposures, related to weathering of the eroded materials.......................276
Figure 6.41 Dispersion of high Kaolinite Abundances (iii) down slope and in (iv) erosional depressions draining from weathered Adelaidean bedrock exposures in the topographically elevated MacDonald Hill Region. .......................................276
Figure 6.42 Low Kaolinite Abundances in the channels eroding from the central portion of the Kalibity Inlier. Figure shows the low abundances at the central area of saprolite exposures and high abundances at the fringes of the dispersion of eroded materials. Vegetation masking has removed information from prominent regolith-landform features, such as (iv) and alluvial fan and (iii) a drainage depression adjacent to bedrock exposures............................................................................277
Figure 6.43 White Mica Abundance image showing the Al-poor characteristics of the channel and different exposures of saprolite.......................................................279
Figure 6.44 White Mica Abundance images of an area of shallow soil cover in the vicinity of a fence line, showing the effects of vegetation on the ratio. Note the (ii) dispersion of intermediate materials in the drainage feature. The area in the left
I C Lau List of Figures
- xxiii -
part of the image shows an intermediate to Al-poor mineralogy, whereas the more vegetated area has abundances reflecting a more Al-rich mineralogy. ................ 280
Figure 6.45 Mg-OH/RCA Abundance Index showing an interpreted distribution of regolith carbonate in the MacDonald Ranges region. Ground truthing of the region found abundant hardpan RCAs in the sheetflow dominated landforms that flanked the basement exposures. .................................................................................... 282
Figure 6.46 HyMap spectra of a regolith carbonate-rich soil from a rabbit warren and a calcite spectra from the USGS Reference Library, showing a slight absorption in the 2.34 µm region. This feature was used in the Mg-OH/Carbonate Index to map the distribution of regolith-carbonate and mafic materials.................................. 283
Figure 6.47 Supervised classification results performed on the ternary radiometric data, displayed in colours corresponding to the RGB image. ...................................... 286
Figure 6.48 Ternary K eTh eU RGB image of the combined radiometric dataset of the White Dam area. The upper section of the image was from a MIM airborne survey.......................................................................................................................... 288
Figure 6.49 Individual pseudocolour radiometric channels, hill-shaded and draped over a DEM. K and eTh display similar distributions, whereas eU contains a higher level of noise and is less coherent. ..................................................................... 289
Figure 6.50 Oblique perspective view of a ternary K eTh eU (RGB) image of the White Dam area draped over a DEM. Draped imagery was useful for showing the relationship between regolith materials and units to landforms. Low hills and erosional rises were found to be related to saprolite exposures or subcrop with shallow soil mantles. ......................................................................................... 291
Figure 7.1 Comparison of the spatial resolution of various remote sensing datasets over
the White Dam Prospect. The group of black pixels on the western edge of the area represents a group of trees in an alluvial channel. The trees are still visible in the 30 m Landsat and ASTER data, although it is difficult to distinguish RLU boundaries at this scale. Note the mis-registration of the ASTER VNIR and SWIR data. . Ortho-photography data was resampled from the original (i) 1.25 m resolution with (ii) 5 and (iii) 10 m, for comparison to (iv) 5 m HyMap imagery and the low-resolution space-borne data (v-ix). The low-resolution data consist of (v) panchromatic band of Landsat ETM+ (15 m), (vi) ASTER VNIR, (vii) Landsat ETM+ TCC, (viii) ASTER SWIR (30 m) and (ix) ASTER TIR data.................. 297
Figure 7.2 A (a) raw and (b) contrast stretched ortho-photography of the Wilkins Cu-Au Prospect. The topography of the area increases to the south, with the Willyama Supergroup derived saprolite exposed on a low hill in the southern portion of the images. The enhanced image allows for better discrimination of regolith features, especially the change in vegetation communities with different landforms......... 298
Figure 7.3 Differential vegetation abundances on neighbouring paddocks in ortho-photography (1.25 m) (a) and Landsat ETM+ Panchromatic (15 m) data (b), making the identification of unit boundaries across these regions difficult. The ability of the datasets to resolve spatial features is similar at this scale. .............. 300
Figure 7.4 Examples of linear vegetation banding from the ortho-photography of the White Dam area. The distance between the bands increases downslope (a) and the degree of cohesiveness of the banding decreases as flow vectors become less constrained by the gradient. Grazing differences between paddocks (b) noticeable in the image on the right has influenced the process of overland flow, causing differences in the patterning either side of this feature. The central sheetwash fan displayed a greater abundance of quartzose surface gravels than the fan immediately to the northwest. The two fans are flanked by alluvial depressions that carry shed material along the direction of decreasing slope (northeast) ....... 300

List of Figures
- xxiv -
Figure 7.5 Perspective view of a De-correlation stretched HyMap image of bands 2336.9 nm, 2167.9 nm and 868.2 nm RGB of the whole five swaths. Basement exposures and areas of shallowly buried bedrock are bright green, due to high Al-OH absorptions, whereas ferruginous and vegetated areas are blue. ...................302
Figure 7.6 Regolith-landform mapping using MNF 123 RGB over the White Dam Prospect.............................................................................................................302
Figure 7.7 Ortho-photography showing human influenced areas (Fm1) and alluvial swamps (Aaw1). The bright square areas in (a) are quarries used to construct surfaced roads. The parallel, dark northeast trending linear features are the Barrier Highway and railway. The areas adjacent to these features influence the regolith-landforms and break the continuity of units. The Aaw1 in (b) surrounds a large dam. The construction of the dam has changed the flow of minor channels in the region and created an ephemeral swamp. ...........................................................308
Figure 7.8 1:100 000 scale White Dam Regolith-landform map.................................309 Figure 7.9 Ortho-photographic representations of interpreted RLUs in the White Dam
area; (a) swampy depressions on a depositional plain; (b) bedrock-dominated regions with erosional depressions; (c) alluvial fan; (d) alluvial plain; (e) alluvial channel; (f) overbank deposits and weathered saprolite......................................312
Figure 7.10 Ortho-photography representations of interpreted Regolith-landform units for the White Dam area: (a) aeolian material represented by groupings of trees; and (b) sheetflow-dominated regions forming outwash fans. ....................................314
Figure 7.11 Averaged HyMap spectra of highly weathered saprolite areas. The spectra show minor vegetation features in the VNIR and short wavelengths of the SWIR regions...............................................................................................................317
Figure 7.12 Averaged HyMap spectra of alluvial regolith-landforms. These RLUs are all influenced by vegetation features to various degrees, with Aaw and ACa units the containing the highest abundances of green vegetation. The other alluvial RLUs display SWIR features characteristic of soils from the OlD......................318
Figure 7.13 Averaged HyMap spectra of aeolian, anthropogenic, sheetwash and colluvial RLUs. Aeolian RLUs are characterised by strands of trees colonising the well drained sandy soils, which results in a strong vegetation feature in the VNIR and short wavelengths of the SWIR. The spectra response of anthropogenic RLUs are highly variable due to the wide variety of materials, such as vegetation, RCA, asphalt, kaolinitic saprolite and so on. The average spectrum displays a low albedo and strong vegetation features, with only minor soil, kaolinite and RCA spectral features. This was due to the large area of highway and railway features dominating the average spectra for this RLU. Sheetwash and colluvial areas were characterised by minimal vegetation, or if vegetation was colonising these RLUs it was typically a woody chenopod with minimal spectral features in the VNIR. Hematite-goethite spectral features were observable in the VNIR and a strong 2.2 µm absorption related to muscovite and clay minerals........................................319
Figure VI.1 ASTER RGB TCC coverage of White Dam area. The data consists of a
mosaic of three 60x60km scenes. The southwestern portion of the HyMap swath area is partly obscured by minor cloud coverage. ...........................................xxxvii
Figure VII.1 Example of contrast stretching of Landsat TM band 5, over the White Dam region. Top image is displayed with the full range of DNs, whereas the bottom image has the contrast stretched over the range of DN of 46 - 85. Bare soil areas and regions of quartz lag have a high reflectance whereas vegetated areas appear dark. ..................................................................................................................xliv

I C Lau List of Tables
- xxv -
List of Tables
Table 2.1 Comparisons of the geological features of the Willyama Inliers (summarised from Willis et al. 1983; Laing 1996; and Robertson et al. 1998). ...........................5
Table 2.2 Lithostratigraphic comparisons of the Willyama Supergroup from the OlD and BHD from Conor (2000); Conor (in prep. 2004) with the informal lithostratigraphy of Clarke et al. (1986) and Carpentaria Exploration Company Pty Ltd et al. (1988). The informal units were often a description of the appearance of the rocks rather than a classification featuring units with similar genetic origins. ...8
Table 2.3 Timing of Neoproterozoic and Cambrian events affecting the OlD post the Olarian Orogeny. ................................................................................................. 17
Table 3.1 Timing of Phanerozoic events in the OlD (after Stevens et al. 1986 and
references therein). .............................................................................................. 30 Table 3.2 Summary of the common vegetation species of the Curnamona Province
(after Hill 2000; Hill & Hill 2003). ...................................................................... 38 Table 4.1 Characteristics of light observed by the human eye. Commonly, remote
sensing instruments acquire EM radiation at 0.45 µm, 0.5 µm and 0.65 µm corresponding to blue-green-red colours and are integrated into combinations to produce other colours, such as cyan, magenta, yellow and white. ........................ 52
Table 4.2 Diagnostic absorptions of the water molecule from fundamental frequencies (from Hunt & Salisbury 1970). These fundamental wavelengths are not measured by most spectral instruments used in remote sensing. It is the overtone and combinations that are measured as shown in Figure 4.7. ...................................... 58
Table 4.3 Atmospheric gases and their corresponding absorption bands in the NIR and SWIR. ................................................................................................................. 62
Table 4.4 Mineralogical information available from the various regions of the EM spectrum utilised by remote sensing instruments (after Gabell 1986). .................. 64
Table 4.5 Common sulphide minerals that display spectral features in the VNIR-SWIR regions. ............................................................................................................... 76
Table 4.6 Comparison of technical parameters of various remote-sensing platforms.... 87 Table 4.7 Information on the regolith composition found in the band regions of Landsat
TM (adapted from Podwysocki et al. 1985 and Wilford & Creasey 2002)............ 89 Table 4.8 GERIS-63 specification characteristics of the November/December 1987
mission (after Lee et al. 1990). ............................................................................ 93 Table 4.9 HyMap survey and instrument specifications and the spectral characteristics
of the 4 detector arrays of the HyMap instrument (from Cocks et al. 1998).......... 94 Table 4.10 Hyperion and ALI specifications ............................................................... 95 Table 4.11 Specifications of the ASD FieldSpec FR instrument. ................................. 97 Table 4.12 Comparison of the spectral instruments used in this project. .................... 101 Table 4.13 Recommended windows for geophysical surveying as cited by the
International Atomic Energy Agency (IAEA 1979; IAEA 1991; Grasty et al. 1991)................................................................................................................. 104
Table 4.14 Radioelement concentrations of various materials and minerals (Dickson & Scott 1992). ....................................................................................................... 105
Table 5.1 Quantitative XRD results for samples collected from the surface around the
location of 460230 mE 6449100 mN. ................................................................ 134

List of Tables
- xxvi -
Table 5.2 Quantitative XRD results for samples collected from the surface around the location of 460180 mE 6449080 mN. Spectral plots of some of the samples corresponding to the XRD samples of Table 5.1 and Table 5.2 are shown in Figure 5.14. ..................................................................................................................134
Table 5.3 Diamond drill holes over the White Dam Prospect selected for HyLogger analysis. Location of the drill holes is shown in Figure 5.30..............................183
Table 5.4 HyLogger Interpretation of Kaolinitic Saprolite Profile from WD19. ........190 Table 5.5 HyLogger Interpretation of Mafic Saprolite Profile from WD15. ...............191 Table 5.6 ASD Interpretation of a Kaolinitic Saprolite Profile. ..................................191 Table 5.7 ASD Interpretation of a Mafic Saprolite Profile. ........................................192 Table 6.1 Summary of the individual band characteristics of Landsat TM Olary scene.
..........................................................................................................................209 Table 6.2 Description of the results from selected Landsat TM band ratio combinations
that were useful for highlighting features in imagery of White Dam area. ..........215 Table 6.3 Combined SWIR endmembers from the White Dam HyMap dataset..........242 Table 6.4 Combined VNIR endmembers from the White Dam HyMap dataset..........242 Table 6.5 Description of the Spectral Indices used in the extraction of information from
the HyMap imagery. ..........................................................................................257 Table 6.6 Vegetation indices trialled on the HyMap imagery for the creation of
vegetation masks. ..............................................................................................257 Table 6.7 Radiometric classification descriptions and class colours. ..........................285 Table VI.1 Band ratio combinations used for information extraction in ASTER
imagery. Ratios denoted with * are from Crowther (2002). ............................xxxvi Table VI.2 ASTER gains for SWIR bands extracted from the .HDF files of scenes
covering the White Dam area..........................................................................xxxix Table VI.3 ASTER band ratios and the features that they attempt to highlight. .............xl
I C Lau List of Appendices
- xxvii -
List of Appendices
Appendix I The Spectral Geologist (TSG) Scalars ................... i Appendix II Quantitative XRD Results- ................................. iii Part 1 Clay Fraction Analysis ................................................................iii Part 2 XRD Analysis on Bulk Samples.................................................. iv Appendix III Diamond Drill Hole Spectral Logs................... vii Deep Holes..............................................................................................vii
WD029 (From 61 m to 201 m) ............................................................................vii WD31 (From 61 m to 185 m) ..............................................................................vii WD61 (From 104 to 177 m) ...............................................................................viii WD69 (From 69 - 147 m) ...................................................................................viii WD71 (From 85 m to 157 m) .............................................................................viii WD111 (pre-collared at 150.233 m, bottom of hole at 464.909 m)........................ ix WD176 (Depth of hole 115 - 278 m) .................................................................... ix WD191 (Depth of hole 144 - 198 m) ..................................................................... x WD193 (136 - 191 m) ........................................................................................... x WD194 (149 - 198 m) ........................................................................................... x WD 195 (137 - 196 m) .......................................................................................... x
Appendix IV Munsell Soil Measurements of Selective Costean Samples..................................................................................... xii Appendix V TSG Costean ASD Spectral Profile Analyses Interpretations ..........................................................................xv WDTR01A ............................................................................................. xv WDTR01B............................................................................................ xvii WDTR01C ..........................................................................................xviii WDTR01D ............................................................................................ xix
Summary............................................................................................................. xx WDTR01E.............................................................................................. xx WDTR01F............................................................................................. xxi WDTR05A ........................................................................................... xxii WDTR05B...........................................................................................xxiii WDTR05C .......................................................................................... xxiv WDTR04A ........................................................................................... xxv WDTR04B........................................................................................... xxvi WDTR04BC....................................................................................... xxvii WDTR04C ........................................................................................ xxviii WDTR04CD........................................................................................ xxix WDTR04D ........................................................................................... xxx WDTR04E........................................................................................... xxxi WDTR02A ......................................................................................... xxxii Appendix VI ASTER Data Processing ...............................xxxiv Background Information on ASTER Processing............................ xxxiv
Multispectral Pre-Processing .......................................................................... xxxiv
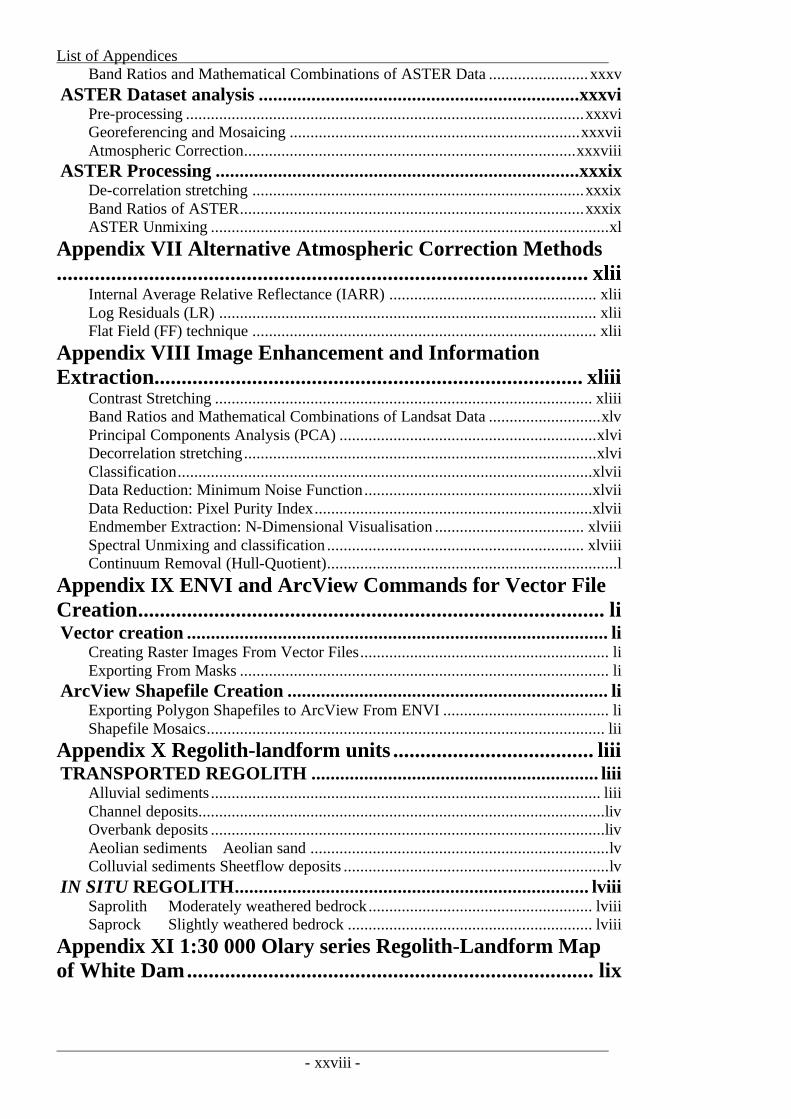
List of Appendices
- xxviii -
Band Ratios and Mathematical Combinations of ASTER Data ........................xxxv ASTER Dataset analysis ...................................................................xxxvi
Pre-processing ................................................................................................xxxvi Georeferencing and Mosaicing ......................................................................xxxvii Atmospheric Correction................................................................................xxxviii
ASTER Processing ............................................................................xxxix De-correlation stretching ................................................................................xxxix Band Ratios of ASTER...................................................................................xxxix ASTER Unmixing ................................................................................................xl
Appendix VII Alternative Atmospheric Correction Methods.................................................................................................. xlii
Internal Average Relative Reflectance (IARR) .................................................. xlii Log Residuals (LR) ........................................................................................... xlii Flat Field (FF) technique ................................................................................... xlii
Appendix VIII Image Enhancement and Information Extraction............................................................................... xliii
Contrast Stretching ........................................................................................... xliii Band Ratios and Mathematical Combinations of Landsat Data ...........................xlv Principal Components Analysis (PCA) ..............................................................xlvi Decorrelation stretching.....................................................................................xlvi Classification....................................................................................................xlvii Data Reduction: Minimum Noise Function.......................................................xlvii Data Reduction: Pixel Purity Index...................................................................xlvii Endmember Extraction: N-Dimensional Visualisation .................................... xlviii Spectral Unmixing and classification .............................................................. xlviii Continuum Removal (Hull-Quotient)......................................................................l
Appendix IX ENVI and ArcView Commands for Vector File Creation...................................................................................... li Vector creation ........................................................................................ li
Creating Raster Images From Vector Files............................................................ li Exporting From Masks ......................................................................................... li
ArcView Shapefile Creation ................................................................... li Exporting Polygon Shapefiles to ArcView From ENVI ........................................ li Shapefile Mosaics................................................................................................ lii
Appendix X Regolith-landform units ..................................... liii TRANSPORTED REGOLITH ............................................................ liii
Alluvial sediments .............................................................................................. liii Channel deposits..................................................................................................liv Overbank deposits ...............................................................................................liv Aeolian sediments Aeolian sand ........................................................................lv Colluvial sediments Sheetflow deposits ................................................................lv
IN SITU REGOLITH.......................................................................... lviii Saprolith Moderately weathered bedrock...................................................... lviii Saprock Slightly weathered bedrock ........................................................... lviii
Appendix XI 1:30 000 Olary series Regolith-Landform Map of White Dam........................................................................... lix
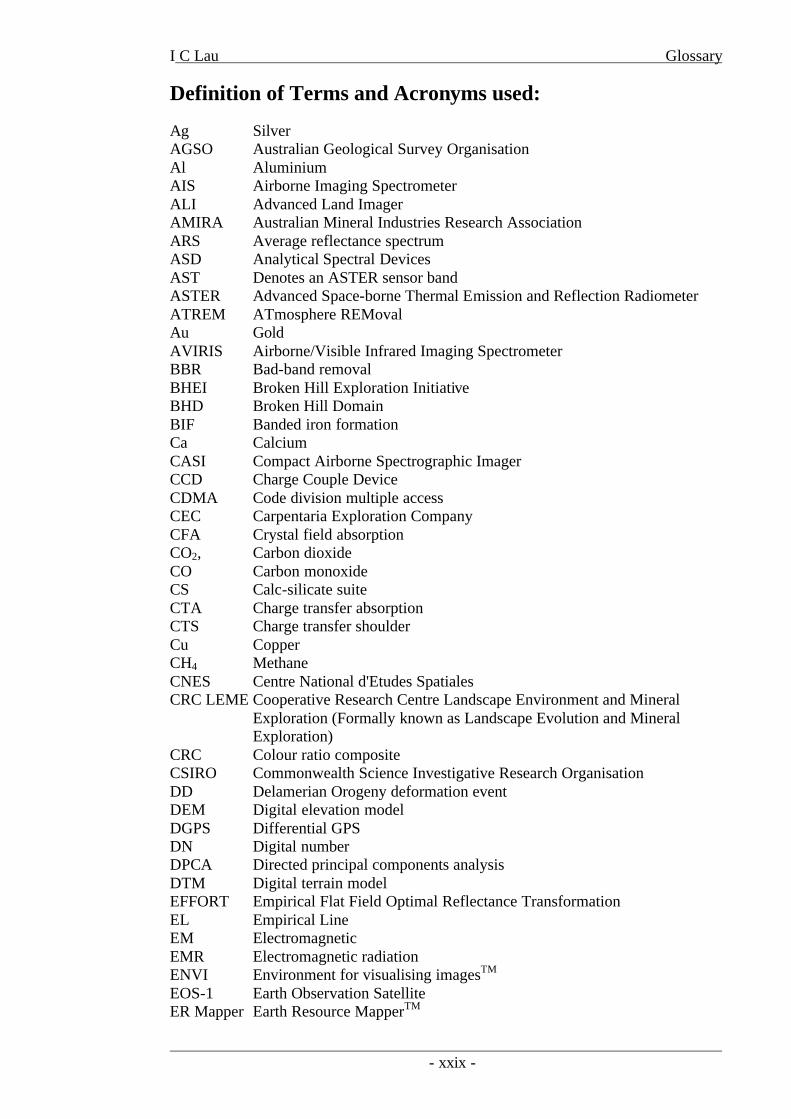
I C Lau Glossary
- xxix -
Definition of Terms and Acronyms used:
Ag Silver AGSO Australian Geological Survey Organisation Al Aluminium AIS Airborne Imaging Spectrometer ALI Advanced Land Imager AMIRA Australian Mineral Industries Research Association ARS Average reflectance spectrum ASD Analytical Spectral Devices AST Denotes an ASTER sensor band ASTER Advanced Space-borne Thermal Emission and Reflection Radiometer ATREM ATmosphere REMoval Au Gold AVIRIS Airborne/Visible Infrared Imaging Spectrometer BBR Bad-band removal BHEI Broken Hill Exploration Initiative BHD Broken Hill Domain BIF Banded iron formation Ca Calcium CASI Compact Airborne Spectrographic Imager CCD Charge Couple Device CDMA Code division multiple access CEC Carpentaria Exploration Company CFA Crystal field absorption CO2, Carbon dioxide CO Carbon monoxide CS Calc-silicate suite CTA Charge transfer absorption CTS Charge transfer shoulder Cu Copper CH4 Methane CNES Centre National d'Etudes Spatiales CRC LEME Cooperative Research Centre Landscape Environment and Mineral
Exploration (Formally known as Landscape Evolution and Mineral Exploration)
CRC Colour ratio composite CSIRO Commonwealth Science Investigative Research Organisation DD Delamerian Orogeny deformation event DEM Digital elevation model DGPS Differential GPS DN Digital number DPCA Directed principal components analysis DTM Digital terrain model EFFORT Empirical Flat Field Optimal Reflectance Transformation EL Empirical Line EM Electromagnetic EMR Electromagnetic radiation ENVI Environment for visualising imagesTM EOS-1 Earth Observation Satellite ER Mapper Earth Resource MapperTM
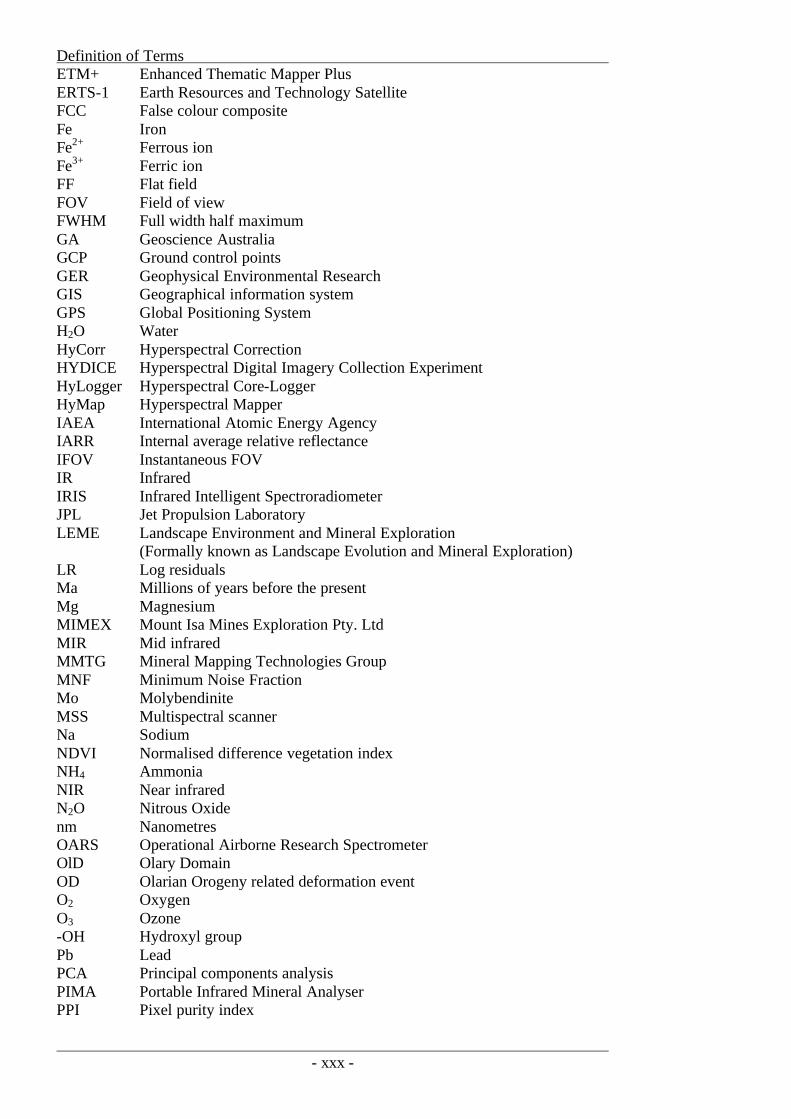
Definition of Terms
- xxx -
ETM+ Enhanced Thematic Mapper Plus ERTS-1 Earth Resources and Technology Satellite FCC False colour composite Fe Iron Fe2+ Ferrous ion Fe3+ Ferric ion FF Flat field FOV Field of view FWHM Full width half maximum GA Geoscience Australia GCP Ground control points GER Geophysical Environmental Research GIS Geographical information system GPS Global Positioning System H2O Water HyCorr Hyperspectral Correction HYDICE Hyperspectral Digital Imagery Collection Experiment HyLogger Hyperspectral Core-Logger HyMap Hyperspectral Mapper IAEA International Atomic Energy Agency IARR Internal average relative reflectance IFOV Instantaneous FOV IR Infrared IRIS Infrared Intelligent Spectroradiometer JPL Jet Propulsion Laboratory LEME Landscape Environment and Mineral Exploration
(Formally known as Landscape Evolution and Mineral Exploration) LR Log residuals Ma Millions of years before the present Mg Magnesium MIMEX Mount Isa Mines Exploration Pty. Ltd MIR Mid infrared MMTG Mineral Mapping Technologies Group MNF Minimum Noise Fraction Mo Molybendinite MSS Multispectral scanner Na Sodium NDVI Normalised difference vegetation index NH4 Ammonia NIR Near infrared N2O Nitrous Oxide nm Nanometres OARS Operational Airborne Research Spectrometer OlD Olary Domain OD Olarian Orogeny related deformation event O2 Oxygen O3 Ozone -OH Hydroxyl group Pb Lead PCA Principal components analysis PIMA Portable Infrared Mineral Analyser PPI Pixel purity index
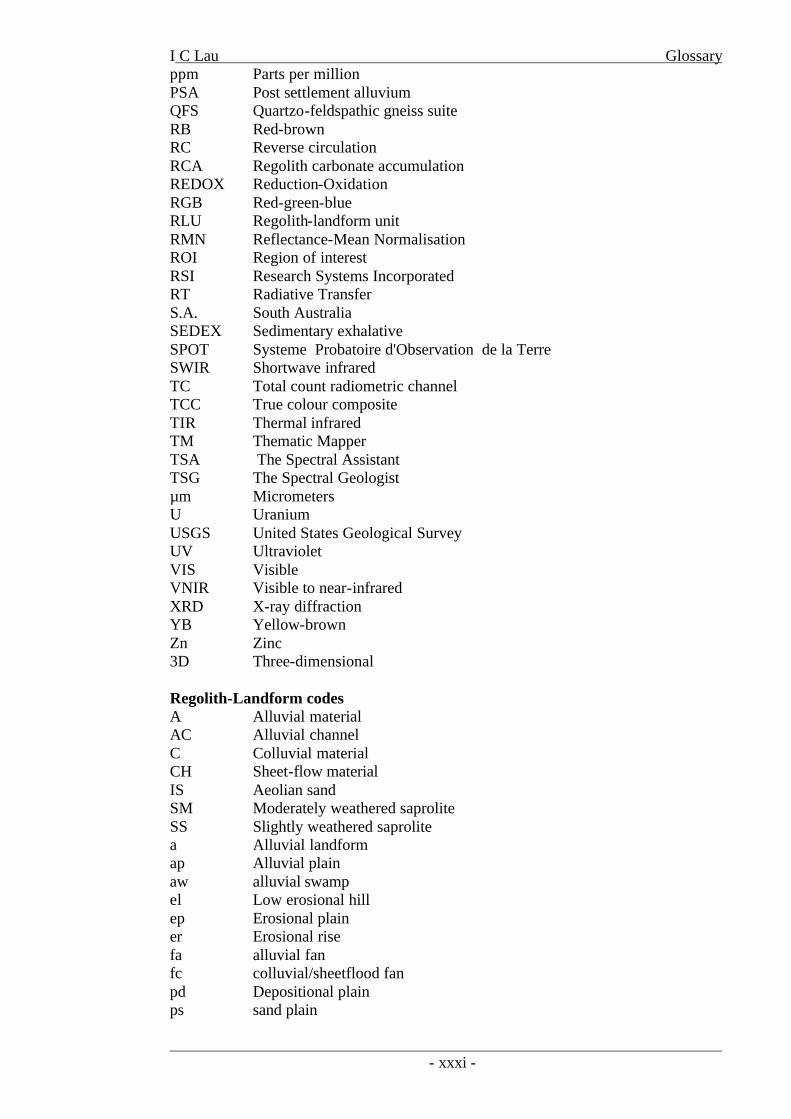
I C Lau Glossary
- xxxi -
ppm Parts per million PSA Post settlement alluvium QFS Quartzo-feldspathic gneiss suite RB Red-brown RC Reverse circulation RCA Regolith carbonate accumulation REDOX Reduction-Oxidation RGB Red-green-blue RLU Regolith-landform unit RMN Reflectance-Mean Normalisation ROI Region of interest RSI Research Systems Incorporated RT Radiative Transfer S.A. South Australia SEDEX Sedimentary exhalative SPOT Systeme Probatoire d'Observation de la Terre SWIR Shortwave infrared TC Total count radiometric channel TCC True colour composite TIR Thermal infrared TM Thematic Mapper TSA The Spectral Assistant TSG The Spectral Geologist µm Micrometers U Uranium USGS United States Geological Survey UV Ultraviolet VIS Visible VNIR Visible to near-infrared XRD X-ray diffraction YB Yellow-brown Zn Zinc 3D Three-dimensional Regolith-Landform codes A Alluvial material AC Alluvial channel C Colluvial material CH Sheet-flow material IS Aeolian sand SM Moderately weathered saprolite SS Slightly weathered saprolite a Alluvial landform ap Alluvial plain aw alluvial swamp el Low erosional hill ep Erosional plain er Erosional rise fa alluvial fan fc colluvial/sheetflood fan pd Depositional plain ps sand plain

- xxxii -