registration costs and voter turnout: evidence from a...
TRANSCRIPT
Registration Costs and Voter Turnout: Evidence
from a Natural Experiment
Rachana Bhatt, Evgenia Dechter and Richard Holden∗
December 3, 2015
Abstract
We exploit a natural experiment in Massachusetts in 2012 to estimate the causal
effect of lowering voter registration costs on: voter registration, turnout and voting
behavior in presidential elections. Both a within Massachusetts specification and a
cross-state specification (utilizing Vermont, Maine and New Hampshire data) find a
statistically significant effect on voter registration and turnout that is of a material
magnitude. However, conditional on registration we find no material difference
in turnout. Finally, we find a large treatment effect on Democrat voteshare. Our
results highlight the importance of voter registration costs for electoral participation,
especially for citizens from lower socioeconomic backgrounds.
∗Bhatt: [email protected]. Dechter: University of New South Wales. email:[email protected]. Holden: University of New South Wales. email: [email protected] acknowledges support from the Australian Research Council (ARC) Future FellowshipFT130101159.
1 Introduction
Since at least Hegel it has been recognized that, in a large electorate, the probability
of being pivotal in an election is small.1 Some estimates put the chance at around one
in 89,000 in a US Congressional election (Mulligan and Hunter (2003)). There may be
other benefits of voting such as fulfilling a sense of civic duty, but Hegel’s calculus still
suggests than even relatively small costs of voting can have a material effect on turnout.
Of course, in the United States, one cannot vote if one is not registered.2 Getting voters
to the polls is thus a two-part problem: they must be registered and, conditional on that,
they must decide to turnout.
From both a practical and a policy standpoint the questions of what affects turnout
and how this varies by demographics are very important, and, as we will discuss be-
low, a large literature has addressed these questions. There has been significantly less
attention paid to the determinants of the registration of voters. This is despite the per-
ceived importance of resigtration, as reflecting in the National Voter Registration Act of
1993 (“NVRA”). Moreover, there are large differences in registration based on socioeco-
nomic, racial, and other demographic factors that are well known to be associated with
voting preferences. Thus, registration per se can have a significant affect on electoral
outcomes and on the degree of representation of various groups within the electorate.
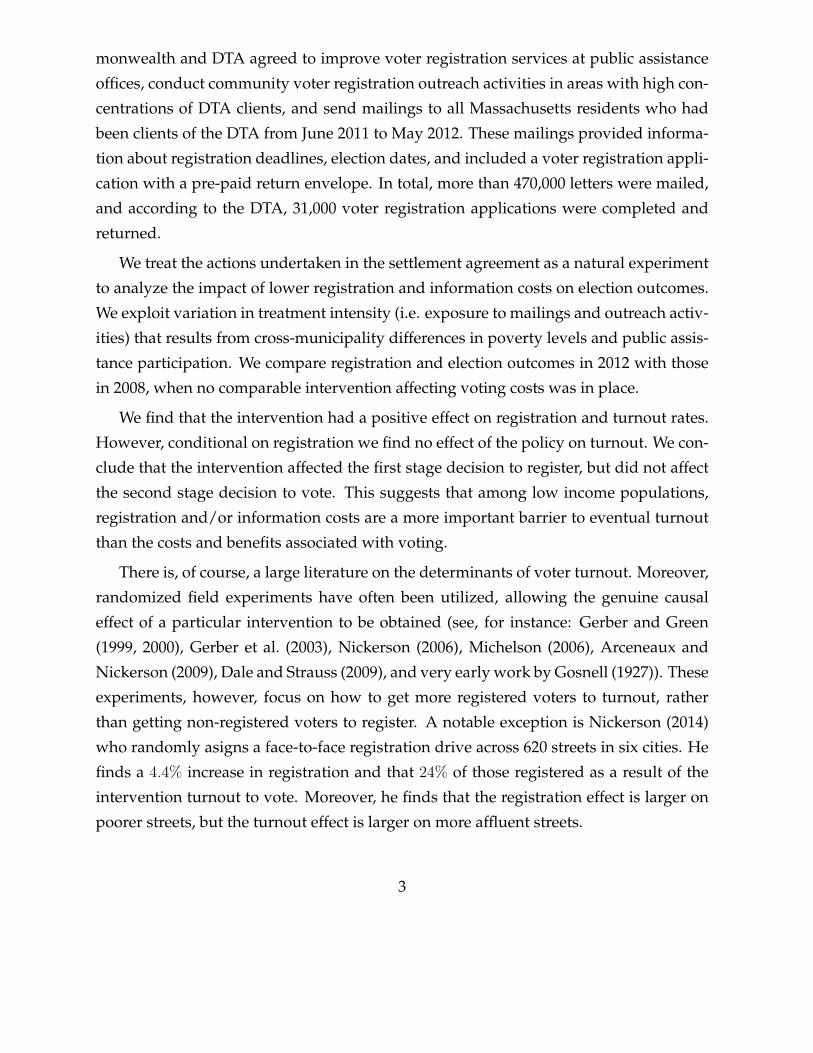
Figures 1 and 2 show the differences in registration and turnout conditional on reg-
istration across income and schooling levels in the United States. There are large differ-
ences in registration rates. Lower socioeconomic status is associated with low registra-
tion rates. However, conditional on registration the differences in voting bahavior are
much smaller.
The relative paucity of causal evidence3 on voter registration is, perhaps, because it is
1For example, Buchanan (1974) cites a translation of Hegel in 1821 as writing: “As for popular suffrage,it may be further remarked that especially in large states it leads inevitably to electoral indifference, sincethe costing of the single quote is of no significance where there is a multitude of electors. Even if of votingqualifications highly valued and esteemed by those who are entitled to, they still do not enter the pollingbooth. As the result of an institution of this kind is more likely to be opposite of what was intended;election actually falls into the power of a few, of a caucus, and so the particular and contingent interestwhich is precisely what was to have been neutralized.”
2The one exception is North Dakota.3As we discuss below, a notably recent exception is a field experiment by Nickerson (2014)
1
difficult to randomly register voters and hence uncover the causal effect or registration
drives. To circumvent this difficulty, we exploit a natural experiment in Massachusetts in
2012 which allow us to observe an exogenous decrease in the costs of voter registration
and increase in information about registration.
On May 15, 2012 the Secretary of the Commonwealth of Massachusetts and the Mas-
sachusetts Department of Transitional Assistance (DTA) were sued for failing to comply
with the NVRA requirements in public assistance offices. On July 5th 2012, a settle-
ment agreement was reached between the parties involved in the court filing. The Com-
2
monwealth and DTA agreed to improve voter registration services at public assistance
offices, conduct community voter registration outreach activities in areas with high con-
centrations of DTA clients, and send mailings to all Massachusetts residents who had
been clients of the DTA from June 2011 to May 2012. These mailings provided informa-
tion about registration deadlines, election dates, and included a voter registration appli-
cation with a pre-paid return envelope. In total, more than 470,000 letters were mailed,
and according to the DTA, 31,000 voter registration applications were completed and
returned.
We treat the actions undertaken in the settlement agreement as a natural experiment
to analyze the impact of lower registration and information costs on election outcomes.
We exploit variation in treatment intensity (i.e. exposure to mailings and outreach activ-
ities) that results from cross-municipality differences in poverty levels and public assis-
tance participation. We compare registration and election outcomes in 2012 with those
in 2008, when no comparable intervention affecting voting costs was in place.
We find that the intervention had a positive effect on registration and turnout rates.
However, conditional on registration we find no effect of the policy on turnout. We con-
clude that the intervention affected the first stage decision to register, but did not affect
the second stage decision to vote. This suggests that among low income populations,
registration and/or information costs are a more important barrier to eventual turnout
than the costs and benefits associated with voting.
There is, of course, a large literature on the determinants of voter turnout. Moreover,
randomized field experiments have often been utilized, allowing the genuine causal
effect of a particular intervention to be obtained (see, for instance: Gerber and Green
(1999, 2000), Gerber et al. (2003), Nickerson (2006), Michelson (2006), Arceneaux and
Nickerson (2009), Dale and Strauss (2009), and very early work by Gosnell (1927)). These
experiments, however, focus on how to get more registered voters to turnout, rather
than getting non-registered voters to register. A notable exception is Nickerson (2014)
who randomly asigns a face-to-face registration drive across 620 streets in six cities. He
finds a 4.4% increase in registration and that 24% of those registered as a result of the
intervention turnout to vote. Moreover, he finds that the registration effect is larger on
poorer streets, but the turnout effect is larger on more affluent streets.
3
Another strand of literature considers what proportion of (newly) registered voters
turnout to vote. Papers that utilize variation in legal rules over time or across political
jurisdications yield varied estimates. For instance Martinez and Hill (1999) find that
very few such registrants vote, while Brown et al. (1999), Mitchell and Wlezien (1995),
and Timpone (1998) find large effect. Other papers find more intermediate effects (see,
for instance: Knack (1995) and Ansolabehere and Konisky (2006)). These wide range
of estimates are unsurprising given that election law changes are typically not random,
and thus selection and treatment effects are conflated.4
We contribute to both strands of literature. Our results provide evidence on the “reg-
istration elasticity” of lowering both the direct and informational costs of voter regis-
tration. Because we have plausibly causal estimates we also speak to efficacy of the
ultimate goal of registration–getting people to vote. The fact that, conditional on reg-
istration, turnout is not materially different suggests that the registration margin is a
particularly important driver of overall electoral participation.
Finally, our results speak in part to the impact of voter-ID laws, such as those that
have been recently enacted in several states and whose constitutionality is still to be de-
termined by the United States Supreme Court. In an economic sense, voter-ID laws are
an increase in the cost of voter registration. Those without a valid ID would need to ob-
tain one which involves both financial and transaction costs. Whatever the benefits–in
terms of reduced electoral fraud–maybe be, our results suggest that those additional reg-
istration costs have a significant negative effect on registration and turnout. Moreover,
our results suggest that this skews disproportionately by voting intention. We return to
this is our concluding remarks.
The paper proceeds as follows. Section 2 details the facts surround the Massachusetts
suit and settlement and Section 3 describes the data. Section 4 is the heart of the paper,
where we artciulate our empirical strategy and report the results. Section 5 contains
some concluding remarks.
4Another series of papers utilize plausibly exogenous shifts in information to asses the effect of in-formation on turnout. Stromberg (2004) finds that areas with a higher share of radio ownership, whereinformation about elections would have been broadcast, had higher voter turnout during the 1920s-1930s.On the other hand, Gentzkow (2006) finds that substitution away from media outlets with higher levelsof political coverage reduces turnout. Lassen (2005) finds that individuals that are more informed aboutthe issues being voted on are more likely to vote.
4
2 The natural experiment
The National Voter Registration Act of 19935–also known as the “Motor Voter Act” was
designed to increase voter registration by requiring state governments to offer voter reg-
istration to eligible persons under a variety of circumstances: notably, if such a person
applies for or renews a driver’s license, or receives public assistance.
Specifically, The NVRA requires, inter alia, that all public assistance offices in all states
offer clients the opportunity to register to vote with every new or renewal application
for benefits and change-of-address transaction (NVRA Section 7, 1993).
On May 15, 2012 the Secretary of the Commonwealth of Massachusetts and the Mas-
sachusetts Department of Transitional Assistance (“DTA”) were sued for failing to com-
ply with the NVRA requirements in Massachusetts public assistance offices. The DTA
administers Supplemental Security Income (“SSI”), Public Assistance, and Supplemen-
tal Nutrition Assistance Program (“SNAP”, i.e. food stamps).
On July 5th 2012, a settlement agreement was reached under which he Common-
wealth and DTA agreed to improve voter registration services at public assistance of-
fices, conduct community voter registration outreach activities in areas with high con-
centrations of DTA clients, and send mailings to all Massachusetts residents who had
been clients of the DTA from June 2011 to May 2012. These mailings provided informa-
tion about registration deadlines, election dates, and included a voter registration appli-
cation with a pre-paid return envelope. In total, more than 470,000 letters were mailed,
and according to the DTA, 31,000 voter registration applications were completed and
returned.
We treat the actions undertaken in the settlement agreement as a natural exper-
iment in lowering registration and information costs. We exploit variation in treat-
ment intensity–specifically exposure to mailings and outreach activities that results from
cross-municipality differences in poverty levels and public assistance participation. We
examine registration and election outcomes in 2012 and 2008, when no comparable pol-
icy affecting registration costs was in place.
542 U.S.C. §§1973gg - 1973gg-10
5
3 Data
There are two main components of our data: (i) registration, turnout and voting behav-
ior, and (ii) demographic and poverty indicators.
The voter registration and turnout data come come from the relevant state depart-
ments of Election Services. In Massachusetts we have 351 municipalities in 14 counties
and observe the number of registered voters in February and (end of) October 2012 (and
also 2008), the number of voters who vote for each presidential and vice-presidential
candidate in 2008 and 2012.
In Vermont we have 233 municipalities in 14 counties with registration data in March
and November), and 2008 and 2012 presidential/vice-presidential voting behavior. In
New Hampshire we have 240 municipalities in 10 counties with registration data in
January and November, along with 2008 and 2012 presidential/vice-presidential voting
behavior. Finally, in Maine we have 490 municipalities in 16 counties, with registration
data in June and November, and 2008 and 2012 presidential/vice-presidential voting
behavior.
The demographic and poverty indicators are drawn from the American Community
Survey (ACS). We use the 2005-2009 5 Year sample as estimates for 2008 and the 2007-
2011 5 Year sample as estimates for 2012. Demographic data include: percent female,
percent black, percent Hispanic, Median Age, population over 18 years old, proportion
with with BA degree or more, proportion with less than high school education, and the
proportion of the population who lived in different county one year ago.
Our constructed sample excludes municipalities with high (above 50%) reported
margin of error in the population variable. These mostly include very small munici-
palities. Therefore, our final dataset includes 350 municipalities in Massachusetts, 233
municipalities in Vermont, 463 municipalities in Maine and 233 municipalities in New
Hampshire.
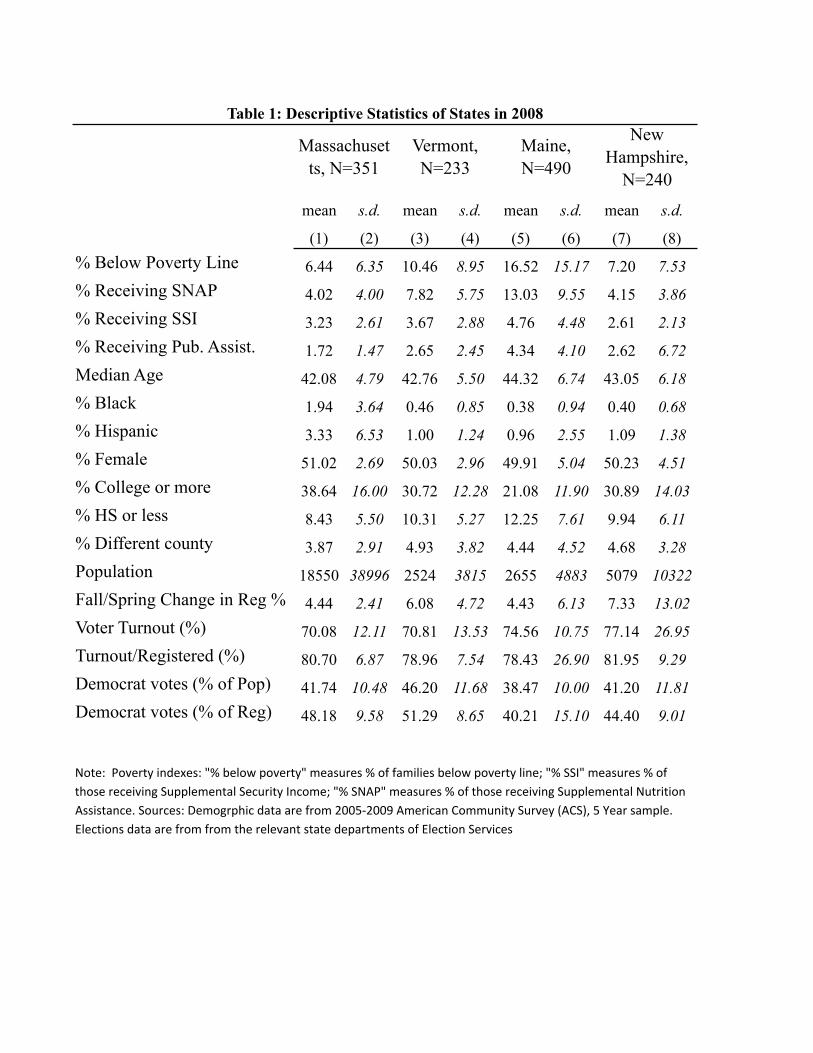
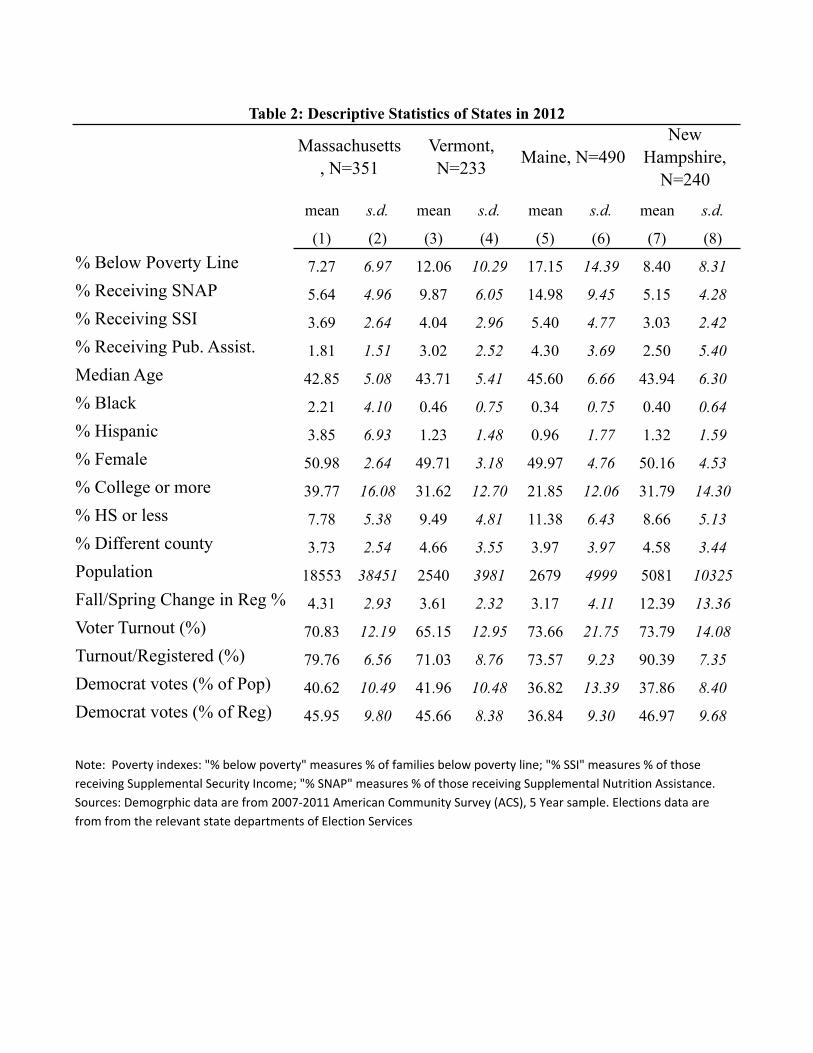
The ACS data include various poverty indicators which serve as a proxy for treat-
ment in our setting. In particular, we observe: (i) percent receiving Supplemental Secu-
rity Income (SSI) (largely: aged, blind, or disabled), (ii) percent receiving Public Assis-
tance (PA) (general assistance and TANF), (iii) percent receiving Supplemental Nutrition
6

Assistance (SNAP) (food stamp benefits), and (iv) percent below the federal poverty line.
[Table 1 and 2 here]
Tables 1 and 2 contain descriptive statistics of these data by state, for 2008 and 2012.
4 Empirical strategy and results
4.1 Empirical strategy
Our analysis uses two empirical approaches to identify the effect of settlement agree-
ment on registration and voting outcomes. Under both strategies we consider three de-
pendent variables of interest: (i) the change in registration rates, (ii) voter turnout, and
(iii) the Democratic voteshare. First, we analyse the relative outcomes in 2008 and 2012,
before and after the settlement, in Massachusetts municipalities based on their exposure
to the settlement actions which we measure using a range of poverty indicators. If the
settlement actions were effective, we should see larger changes in registration and vot-
ing behaviour in municipalities with higher proportions of DTA recipients. Second, we
compare changes in elections behaviour in Massachusetts municipalities with changes
in comparison states of Maine, New Hampshire and Vermont. These estimates are ro-
bust to Massachusetts specific shocks and differential trends in registration and voting
behaviour between Massachusetts and comparison states.
4.1.1 Within Massachusetts analysis
We evaluate changes in registration and voting behaviour across Massachusetts munic-
ipalities. There is a sufficient variability in poverty indicators across municipalities that
we have enough variation for the estimations.6 Our identification strategy relies on the
assumption that, if there were no settlement agreement, poverty rates or concentration
of public assistance recipients in differentmunicipalities should not lead to differential
6Percent of public assistance recipients (% receiving SSI + % receiving Public Assistance) ranges be-tween 0% and 21% in 2008 and between 0% and 24% in 2012. Below poverty line rates are in the 0%-35%range in 2008 and in 0%-38% range in 2012. Proportion of SNAP recipients is in 0%-30% range in 2008and in 0%-33% range in 2012.
7
changes in registration and voting behavior.
The first strategy is to compare 2008 outcomes (pre DTA settlement/treatment) with
2012 outcomes (post DTA settlement/treatment) in Massachusetts at the municipality
level. This has the virtue of being a clean test of the treatment effect of a lowering of
voter registration and information costs. A potential drawback, however, is that it does
not account for other factors occurring across states that could affect registration and
turnout.
Our specifications control for a range of other socioeconomic factors that may af-
fect voting behaviour. The estimations control for average age, proportion of women,
proportions of blacks and hispanics, proportions of individual with low and high edu-
cation (less than high school and college degree or higher), proportion of inter-county
movers (such move requires a new voter registration). The estimations also include
county dummy variables to control for any ballot differences at the county level.
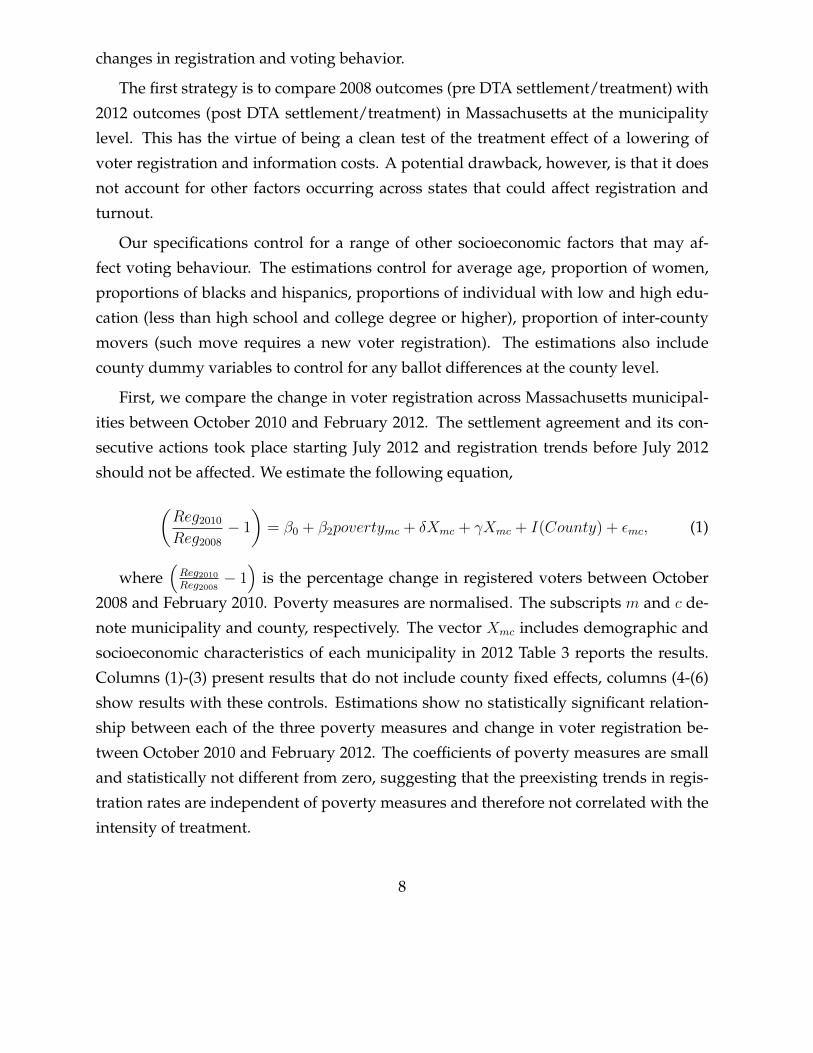
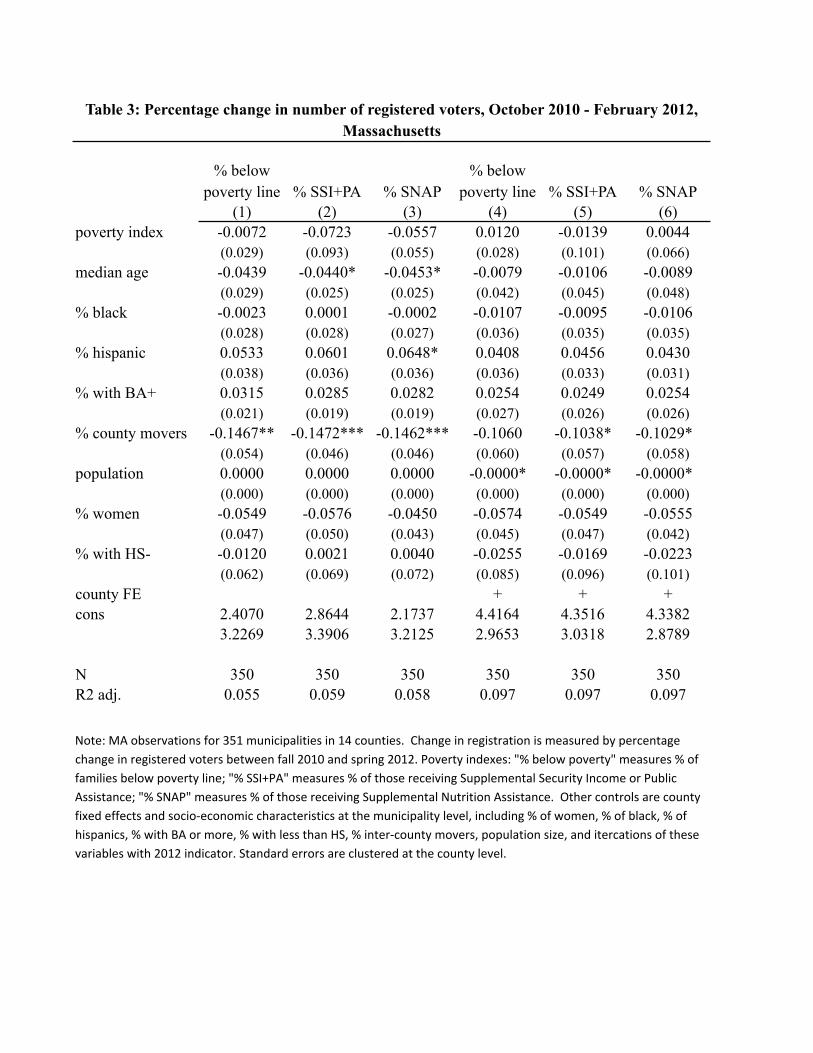
First, we compare the change in voter registration across Massachusetts municipal-
ities between October 2010 and February 2012. The settlement agreement and its con-
secutive actions took place starting July 2012 and registration trends before July 2012
should not be affected. We estimate the following equation,
(Reg2010Reg2008
− 1
)= β0 + β2povertymc + δXmc + γXmc + I(County) + εmc, (1)
where(
Reg2010Reg2008
− 1)
is the percentage change in registered voters between October
2008 and February 2010. Poverty measures are normalised. The subscripts m and c de-
note municipality and county, respectively. The vector Xmc includes demographic and
socioeconomic characteristics of each municipality in 2012 Table 3 reports the results.
Columns (1)-(3) present results that do not include county fixed effects, columns (4-(6)
show results with these controls. Estimations show no statistically significant relation-
ship between each of the three poverty measures and change in voter registration be-
tween October 2010 and February 2012. The coefficients of poverty measures are small
and statistically not different from zero, suggesting that the preexisting trends in regis-
tration rates are independent of poverty measures and therefore not correlated with the
intensity of treatment.
8
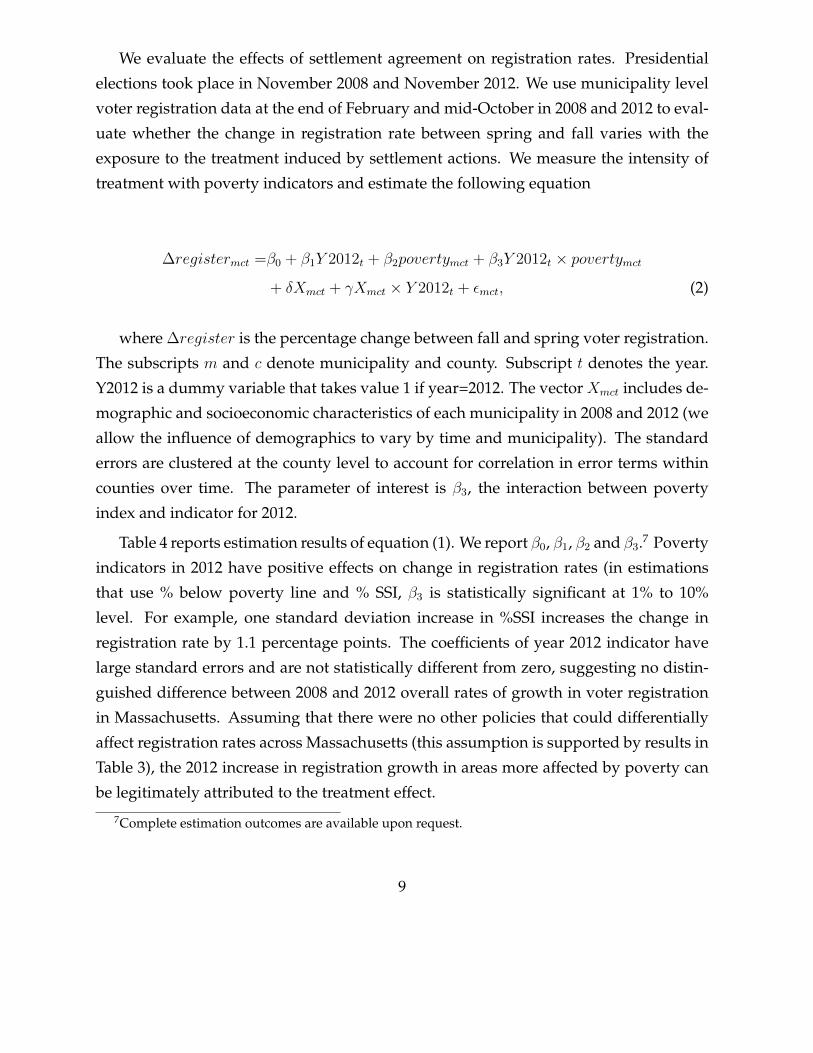
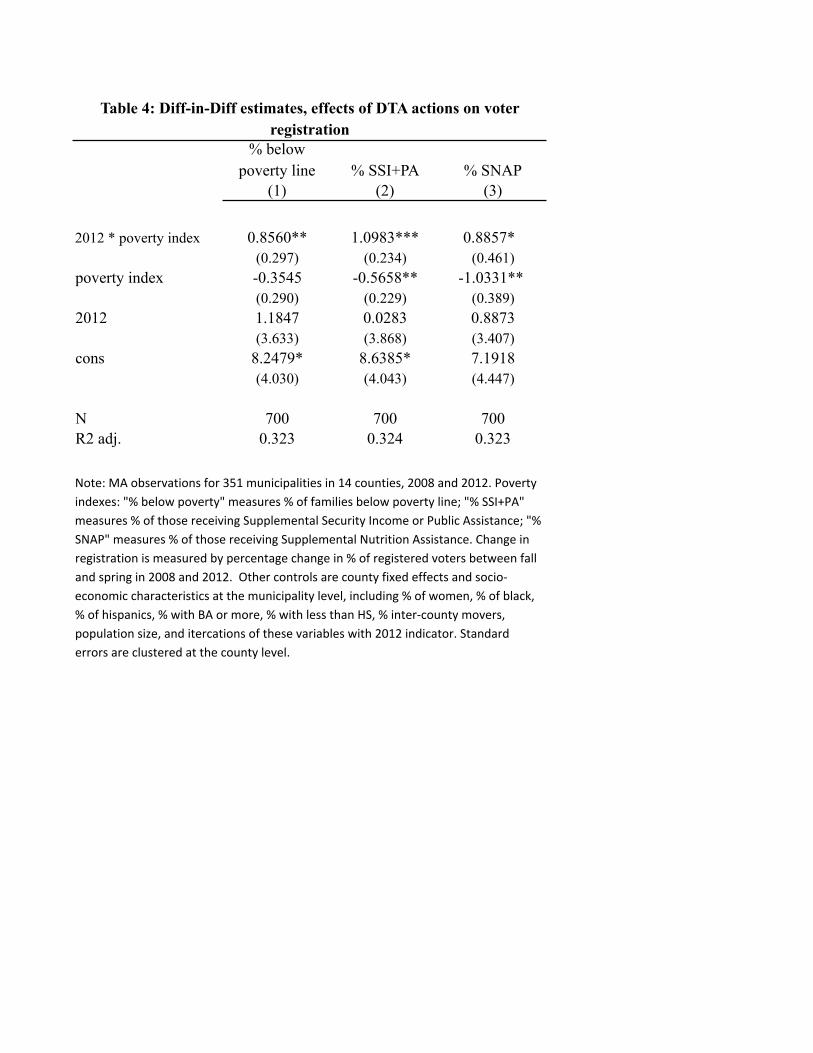
We evaluate the effects of settlement agreement on registration rates. Presidential
elections took place in November 2008 and November 2012. We use municipality level
voter registration data at the end of February and mid-October in 2008 and 2012 to eval-
uate whether the change in registration rate between spring and fall varies with the
exposure to the treatment induced by settlement actions. We measure the intensity of
treatment with poverty indicators and estimate the following equation
∆registermct =β0 + β1Y 2012t + β2povertymct + β3Y 2012t × povertymct
+ δXmct + γXmct × Y 2012t + εmct, (2)
where ∆register is the percentage change between fall and spring voter registration.
The subscripts m and c denote municipality and county. Subscript t denotes the year.
Y2012 is a dummy variable that takes value 1 if year=2012. The vector Xmct includes de-
mographic and socioeconomic characteristics of each municipality in 2008 and 2012 (we
allow the influence of demographics to vary by time and municipality). The standard
errors are clustered at the county level to account for correlation in error terms within
counties over time. The parameter of interest is β3, the interaction between poverty
index and indicator for 2012.
Table 4 reports estimation results of equation (1). We report β0, β1, β2 and β3.7 Poverty
indicators in 2012 have positive effects on change in registration rates (in estimations
that use % below poverty line and % SSI, β3 is statistically significant at 1% to 10%
level. For example, one standard deviation increase in %SSI increases the change in
registration rate by 1.1 percentage points. The coefficients of year 2012 indicator have
large standard errors and are not statistically different from zero, suggesting no distin-
guished difference between 2008 and 2012 overall rates of growth in voter registration
in Massachusetts. Assuming that there were no other policies that could differentially
affect registration rates across Massachusetts (this assumption is supported by results in
Table 3), the 2012 increase in registration growth in areas more affected by poverty can
be legitimately attributed to the treatment effect.
7Complete estimation outcomes are available upon request.
9
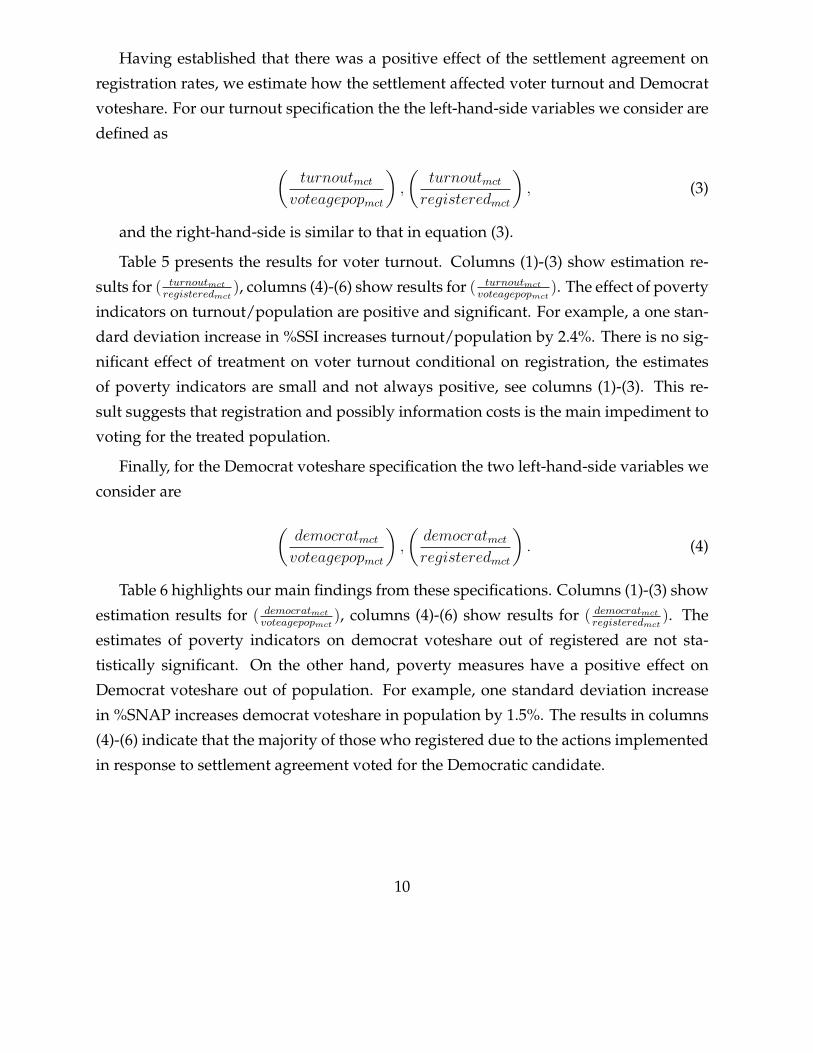
Having established that there was a positive effect of the settlement agreement on
registration rates, we estimate how the settlement affected voter turnout and Democrat
voteshare. For our turnout specification the the left-hand-side variables we consider are
defined as
(turnoutmct
voteagepopmct
),
(turnoutmct
registeredmct
), (3)
and the right-hand-side is similar to that in equation (3).
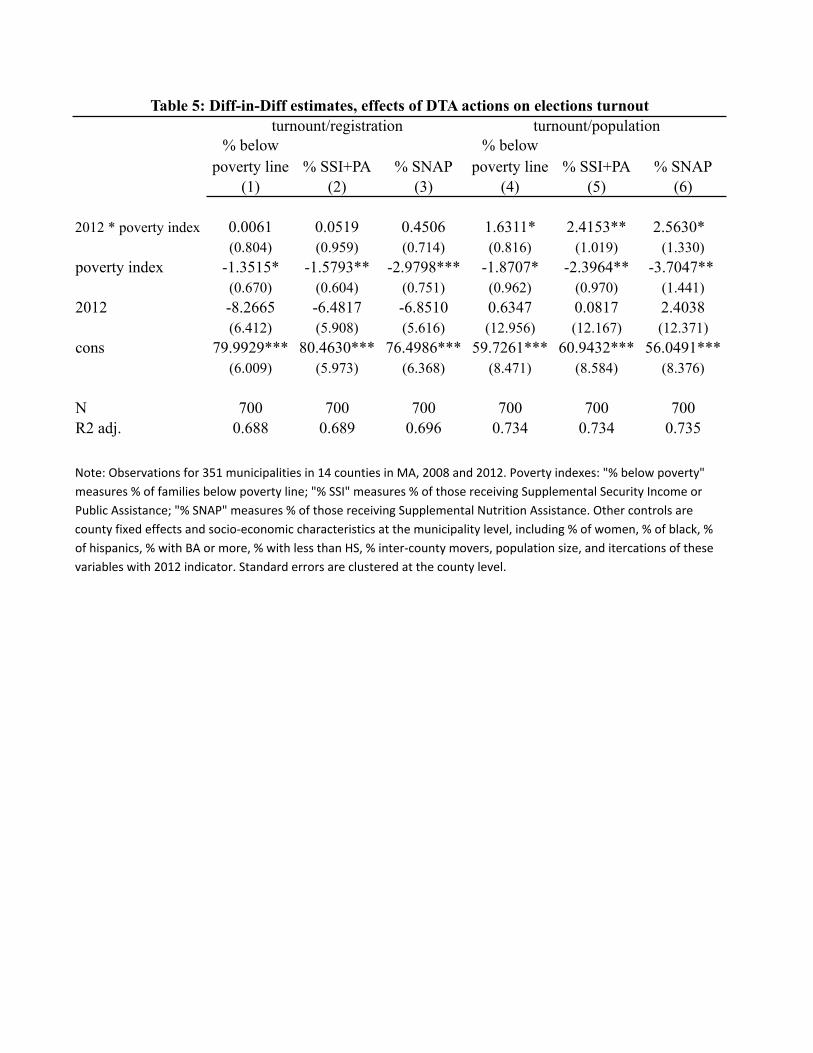
Table 5 presents the results for voter turnout. Columns (1)-(3) show estimation re-
sults for ( turnoutmct
registeredmct), columns (4)-(6) show results for ( turnoutmct
voteagepopmct). The effect of poverty
indicators on turnout/population are positive and significant. For example, a one stan-
dard deviation increase in %SSI increases turnout/population by 2.4%. There is no sig-
nificant effect of treatment on voter turnout conditional on registration, the estimates
of poverty indicators are small and not always positive, see columns (1)-(3). This re-
sult suggests that registration and possibly information costs is the main impediment to
voting for the treated population.
Finally, for the Democrat voteshare specification the two left-hand-side variables we
consider are
(democratmct
voteagepopmct
),
(democratmct
registeredmct
). (4)
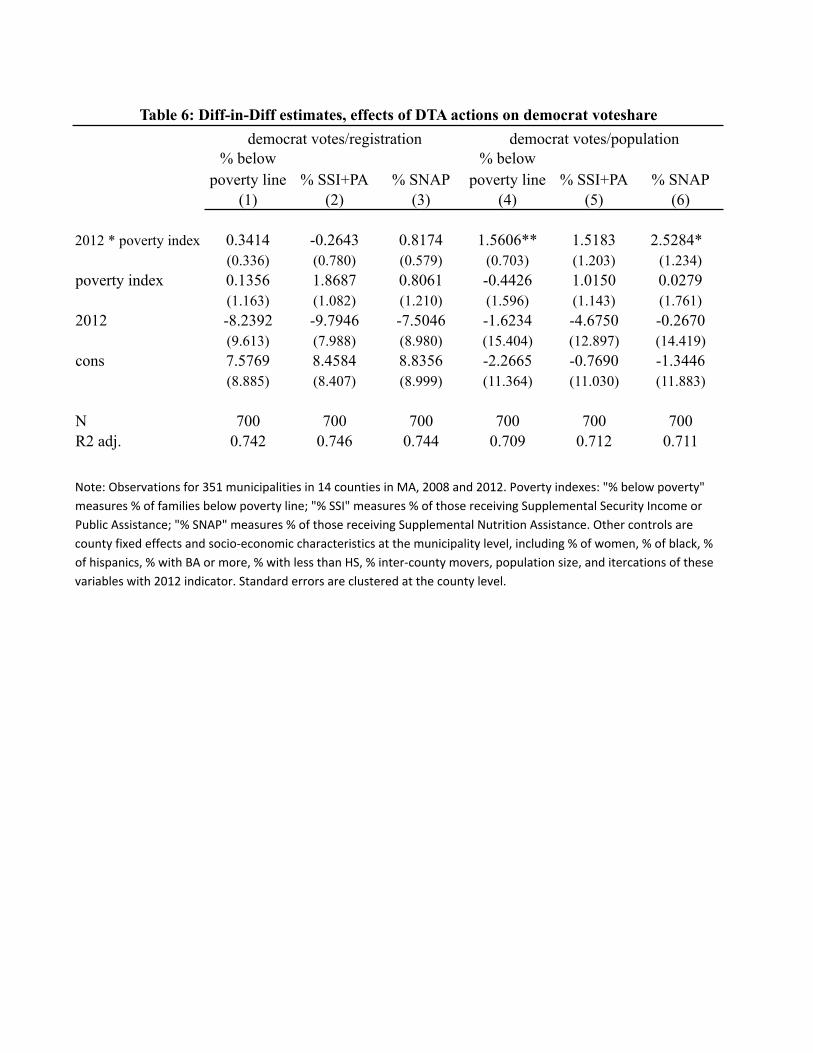
Table 6 highlights our main findings from these specifications. Columns (1)-(3) show
estimation results for ( democratmct
voteagepopmct), columns (4)-(6) show results for ( democratmct
registeredmct). The
estimates of poverty indicators on democrat voteshare out of registered are not sta-
tistically significant. On the other hand, poverty measures have a positive effect on
Democrat voteshare out of population. For example, one standard deviation increase
in %SNAP increases democrat voteshare in population by 1.5%. The results in columns
(4)-(6) indicate that the majority of those who registered due to the actions implemented
in response to settlement agreement voted for the Democratic candidate.
10
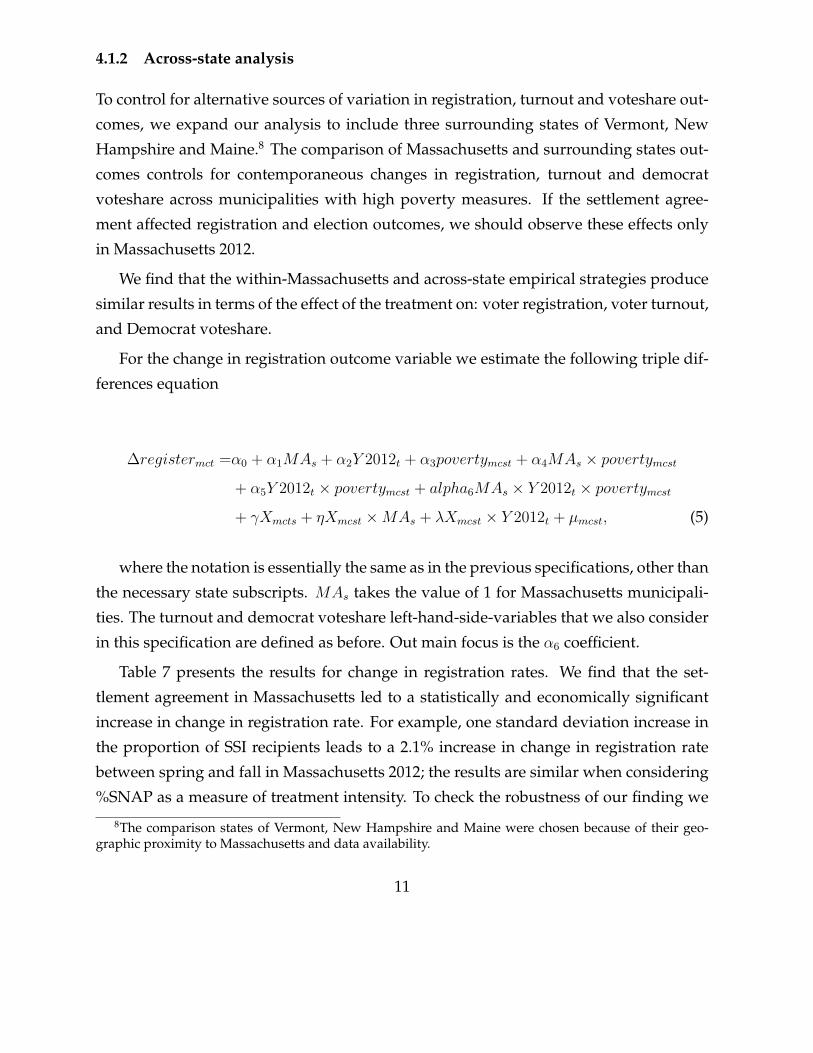
4.1.2 Across-state analysis
To control for alternative sources of variation in registration, turnout and voteshare out-
comes, we expand our analysis to include three surrounding states of Vermont, New
Hampshire and Maine.8 The comparison of Massachusetts and surrounding states out-
comes controls for contemporaneous changes in registration, turnout and democrat
voteshare across municipalities with high poverty measures. If the settlement agree-
ment affected registration and election outcomes, we should observe these effects only
in Massachusetts 2012.
We find that the within-Massachusetts and across-state empirical strategies produce
similar results in terms of the effect of the treatment on: voter registration, voter turnout,
and Democrat voteshare.
For the change in registration outcome variable we estimate the following triple dif-
ferences equation
∆registermct =α0 + α1MAs + α2Y 2012t + α3povertymcst + α4MAs × povertymcst
+ α5Y 2012t × povertymcst + alpha6MAs × Y 2012t × povertymcst
+ γXmcts + ηXmcst ×MAs + λXmcst × Y 2012t + µmcst, (5)
where the notation is essentially the same as in the previous specifications, other than
the necessary state subscripts. MAs takes the value of 1 for Massachusetts municipali-
ties. The turnout and democrat voteshare left-hand-side-variables that we also consider
in this specification are defined as before. Out main focus is the α6 coefficient.
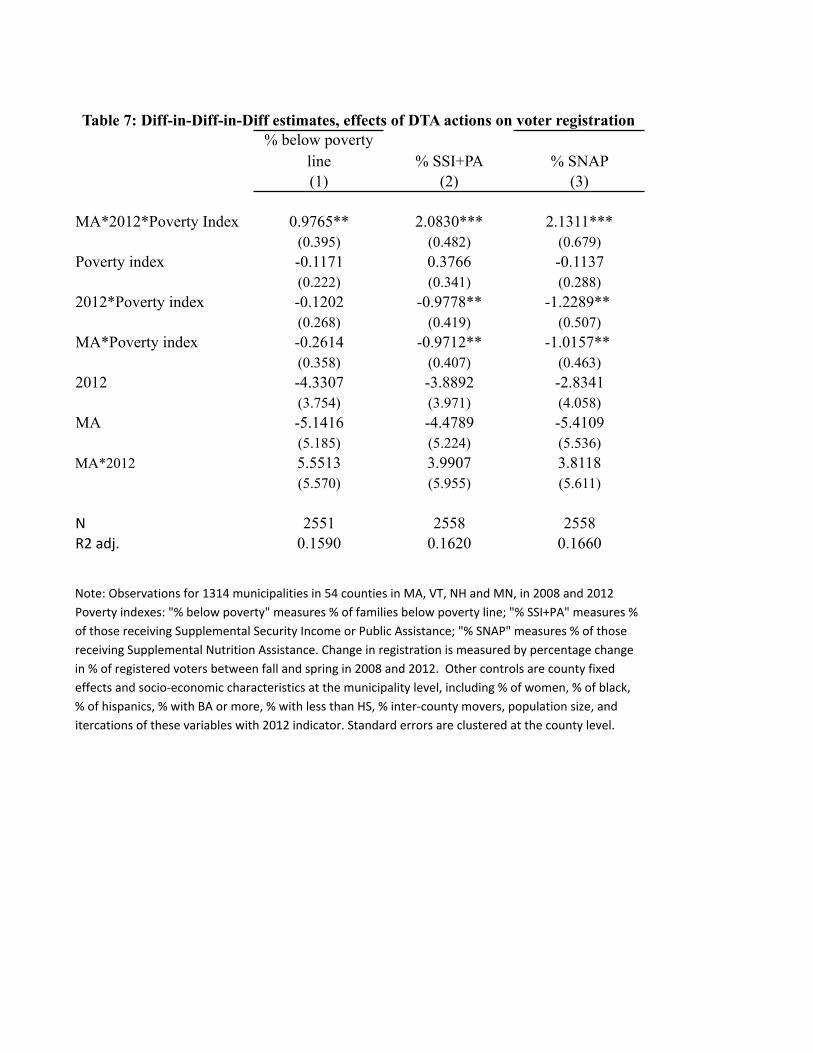
Table 7 presents the results for change in registration rates. We find that the set-
tlement agreement in Massachusetts led to a statistically and economically significant
increase in change in registration rate. For example, one standard deviation increase in
the proportion of SSI recipients leads to a 2.1% increase in change in registration rate
between spring and fall in Massachusetts 2012; the results are similar when considering
%SNAP as a measure of treatment intensity. To check the robustness of our finding we
8The comparison states of Vermont, New Hampshire and Maine were chosen because of their geo-graphic proximity to Massachusetts and data availability.
11
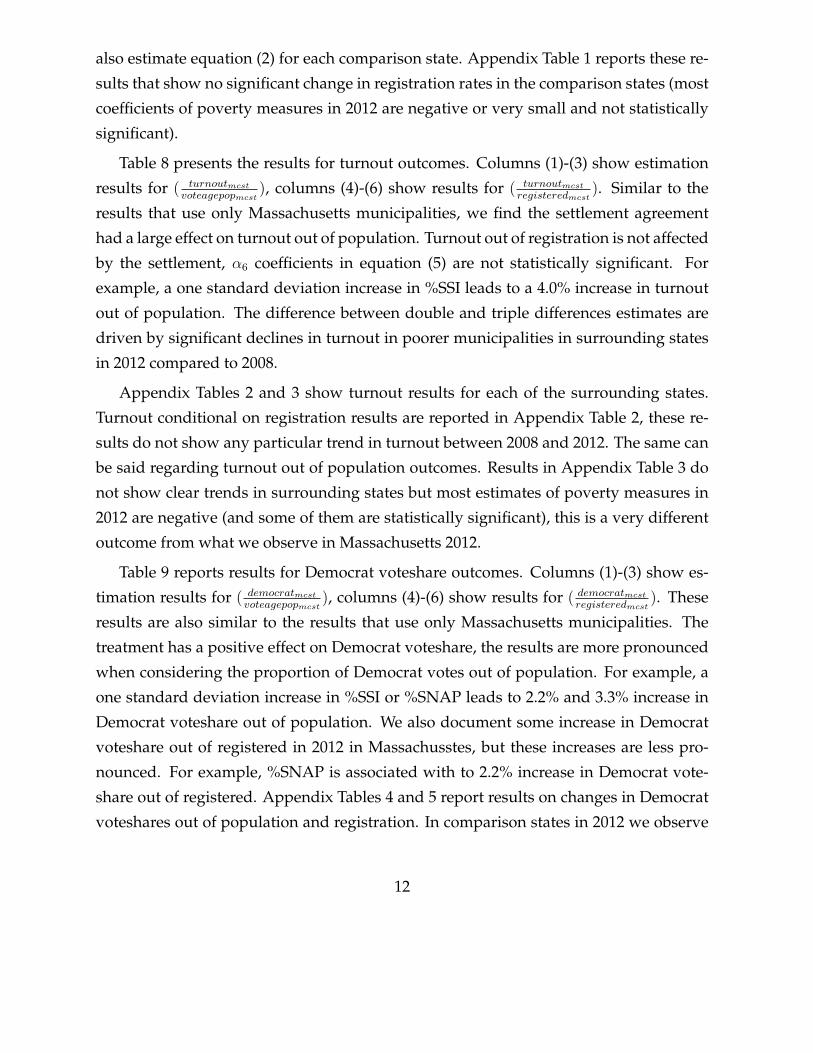
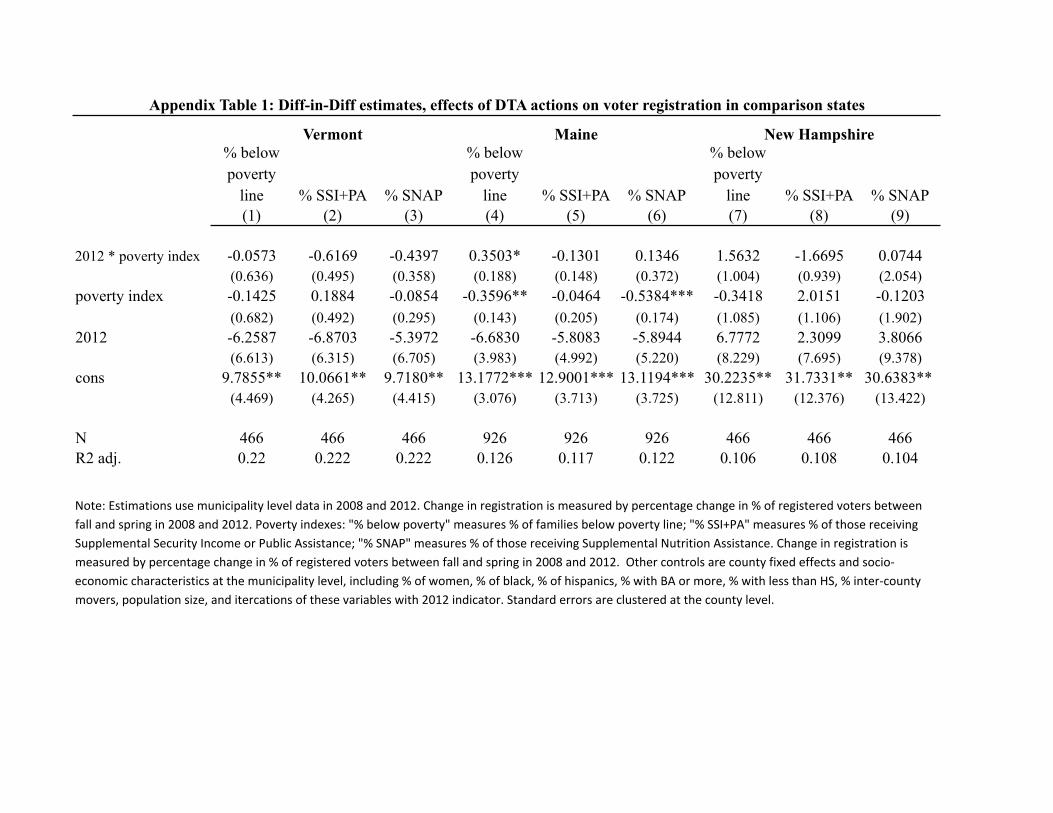
also estimate equation (2) for each comparison state. Appendix Table 1 reports these re-
sults that show no significant change in registration rates in the comparison states (most
coefficients of poverty measures in 2012 are negative or very small and not statistically
significant).
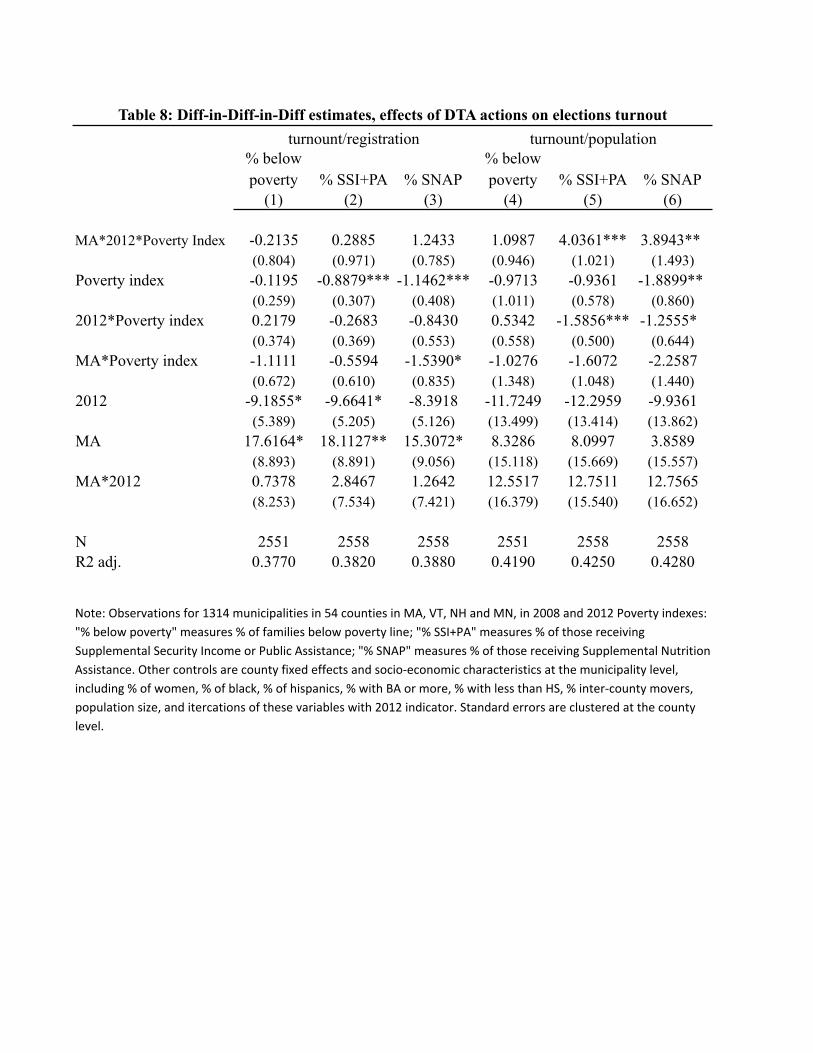
Table 8 presents the results for turnout outcomes. Columns (1)-(3) show estimation
results for ( turnoutmcst
voteagepopmcst), columns (4)-(6) show results for ( turnoutmcst
registeredmcst). Similar to the
results that use only Massachusetts municipalities, we find the settlement agreement
had a large effect on turnout out of population. Turnout out of registration is not affected
by the settlement, α6 coefficients in equation (5) are not statistically significant. For
example, a one standard deviation increase in %SSI leads to a 4.0% increase in turnout
out of population. The difference between double and triple differences estimates are
driven by significant declines in turnout in poorer municipalities in surrounding states
in 2012 compared to 2008.
Appendix Tables 2 and 3 show turnout results for each of the surrounding states.
Turnout conditional on registration results are reported in Appendix Table 2, these re-
sults do not show any particular trend in turnout between 2008 and 2012. The same can
be said regarding turnout out of population outcomes. Results in Appendix Table 3 do
not show clear trends in surrounding states but most estimates of poverty measures in
2012 are negative (and some of them are statistically significant), this is a very different
outcome from what we observe in Massachusetts 2012.
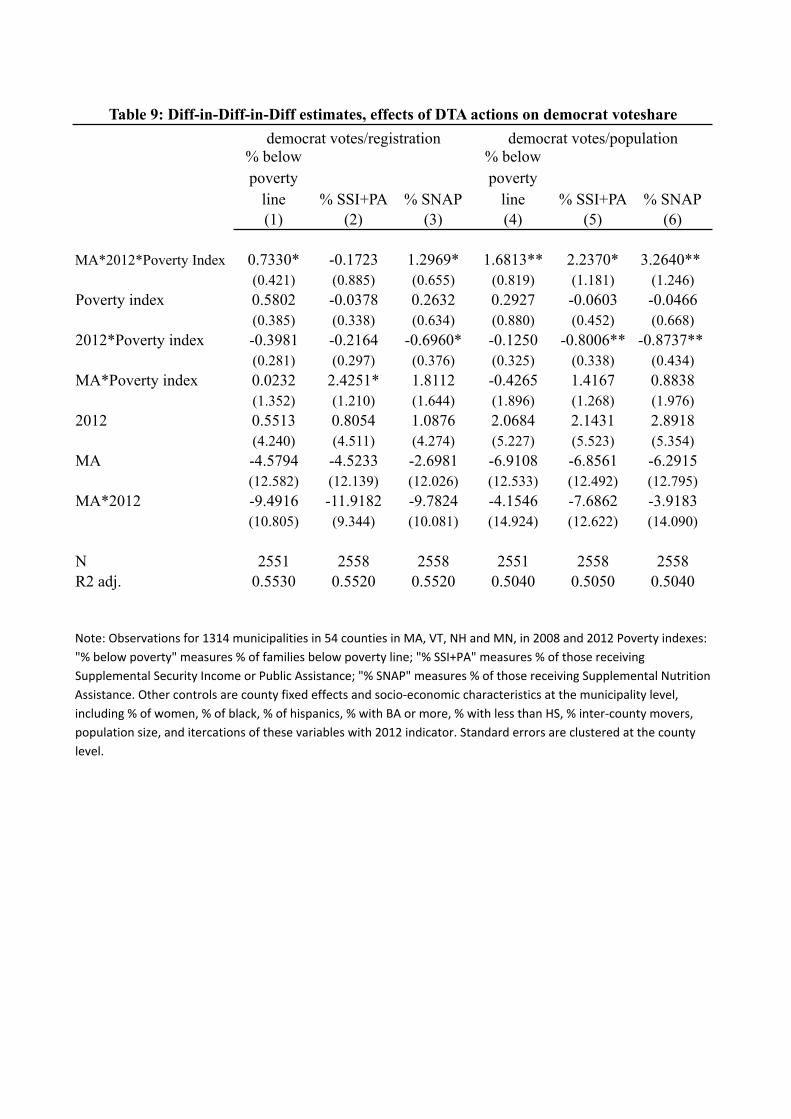
Table 9 reports results for Democrat voteshare outcomes. Columns (1)-(3) show es-
timation results for ( democratmcst
voteagepopmcst), columns (4)-(6) show results for ( democratmcst
registeredmcst). These
results are also similar to the results that use only Massachusetts municipalities. The
treatment has a positive effect on Democrat voteshare, the results are more pronounced
when considering the proportion of Democrat votes out of population. For example, a
one standard deviation increase in %SSI or %SNAP leads to 2.2% and 3.3% increase in
Democrat voteshare out of population. We also document some increase in Democrat
voteshare out of registered in 2012 in Massachusstes, but these increases are less pro-
nounced. For example, %SNAP is associated with to 2.2% increase in Democrat vote-
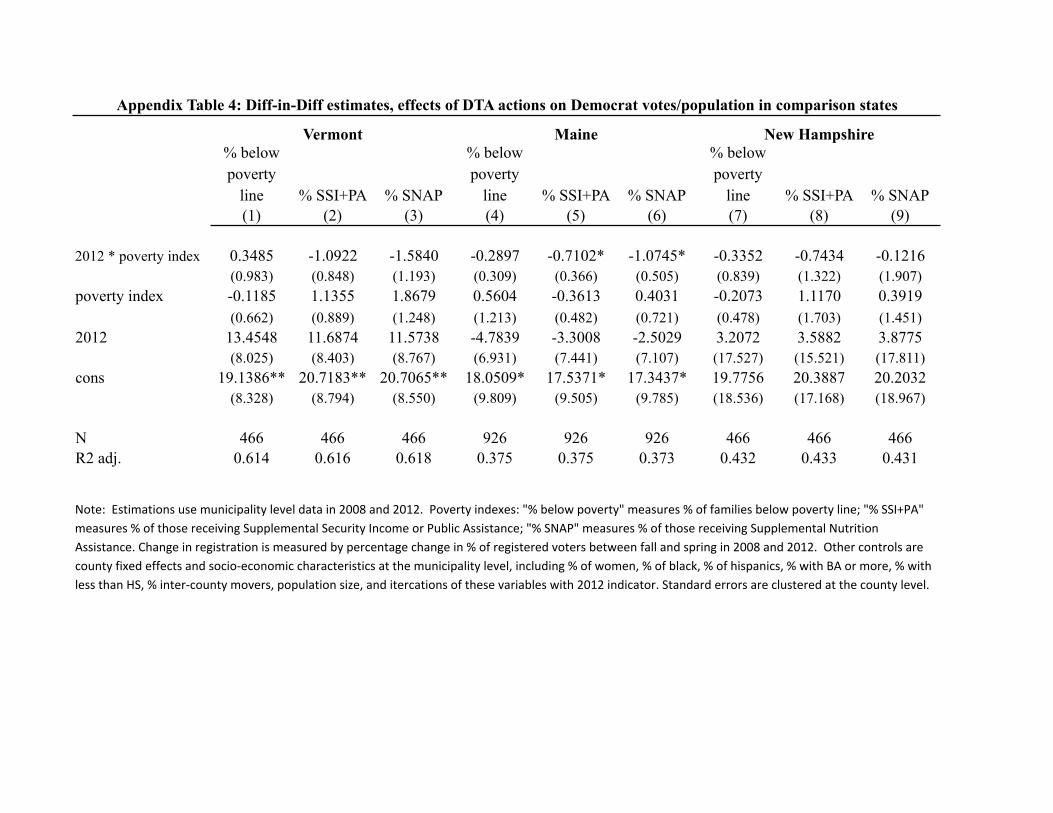
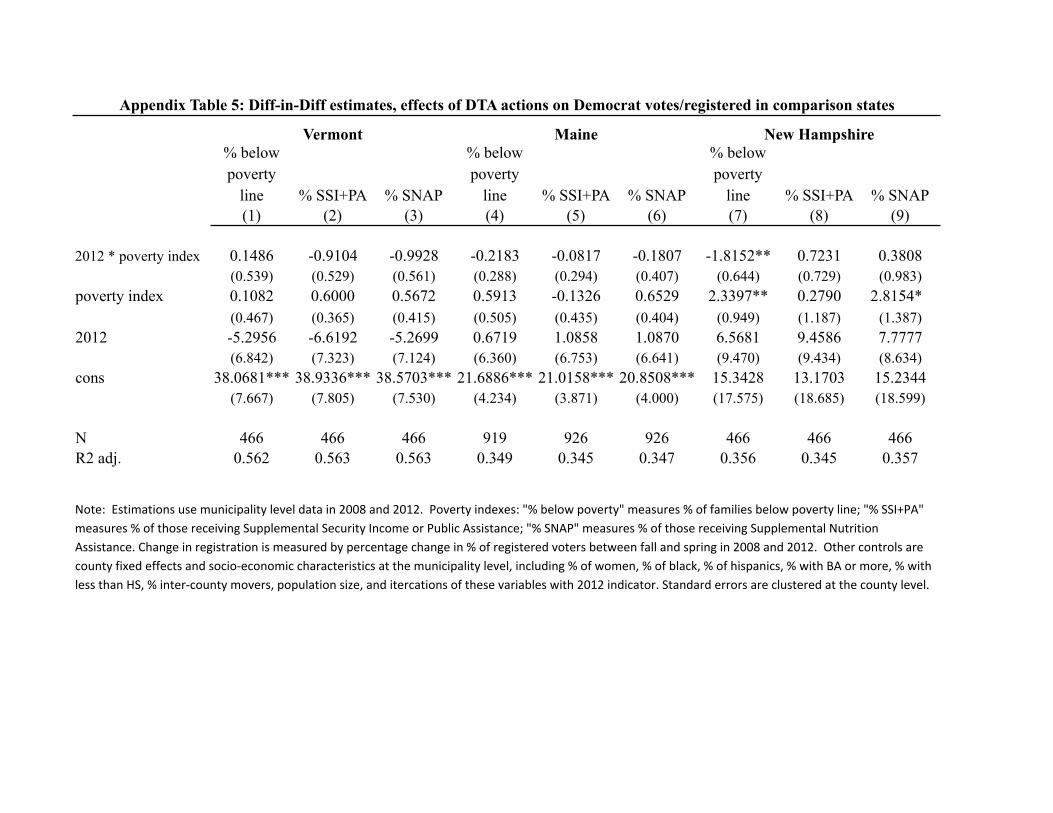
share out of registered. Appendix Tables 4 and 5 report results on changes in Democrat
voteshares out of population and registration. In comparison states in 2012 we observe
12
declines in Democrat votes out of population in all specifications, some of these are sta-
tistically significant at the 10% level. Democrat votes out of registered do not show any
pronounced trend in surrounding states in 2012 compared to 2008.
5 Concluding remarks
Our empirical results point to the importance of voter registration costs for electoral
participation–especially for lower socioeconomic-status citizens.
The main contribution of our paper is to obtain plausibly causal inferences about
the impact of lowering registration costs. Precisely because such costs are amenable to
policy interventions to lower them, and because of the importance of voting, our results
highlight a significant role for potential policy interventions.
Our findings also suggest that field experiments on registration rather than turnout
may be particularly valuable in providing confirmatory evidence and also broader find-
ings than are possible from a given natural experiment. As we mentioned earlier, Nick-
erson (2014) is a notable, but somewhat lonely example of a voter registration field ex-
periment on registration.
A final, but less upbeat observation is that there are policies which raise, rather than
lower, registration costs. Voter identification laws, for example, can most usefully be
seen as an increase the registration costs. Voters need to obtain not only a valid registra-
tion, but also a driver’s license or other government-issued ID.
The courts, including the United States Supreme Court, are in the midst of assessing
the constitutionality of such voter ID laws. The empirical evidence assembled in this
paper suggests that, whatever else they do, such laws materially reduce actual voting,
and that there is a partisan skew to this reduction.
13
References
Ansolabehere, Stephen and David M. Konisky, “The Introduction of Voter Registra-
tion and Its Effect on Turnout,” Political Analysis, 2006, 14, 83–100.
Arceneaux, Kevin and David W. Nickerson, “Who is Mobilized to Vote? A Re-Analysis
of Seven Randomized Field Experiments,” American Journal of Political Science, 2009, 53
(1), 1–16.
Brown, Robert D., Robert A. Jackson, and Gerald C.Wright, “Registration, turnout,
and state party systems,” Political Research Quarterly, 1999, 52 (3), 463–479.
Buchanan, James M., “Hegel on the Calculus of Voting,” Public Choice, 1974, 177 (1),
99–101.
Dale, Allison and Aaron Strauss, “Don’t Forget to Vote: Text Message Reminders as a
Mobilization Tool,” American Journal of Political Science, 2009, 53 (4), 787–804.
Gentzkow, Matthew, “Television and Voter Turnout,” Quarterly Journal of Economics,
August 2006, CXXI (3), 931–972.
Gerber, Alan S. and Donald P. Green, “Does Canvassing Increase Voter Turnout: A
Field Experiment,” Proceedings of the National Academy of Sciences, 1999, 96 (19), 10939–
10942.
and , “The effects of canvassing, direct mail, and telephone contact on voter
turnout: A field experiment,” American Political Science Review, 2000, 94 (3), 653–663.
, , and Ron Shachar, “Voting May be Habit Forming: Evidence from a Randomized
Field Experiment,” American Journal of Political Science, 2003, 47 (3), 540–550.
Gosnell, Harold F., Getting-Out-the-Vote: An Experiment in the Stimulation of Voting,
Chicago, IL: University of Chicago Press, 1927.
Knack, Stephen, “Does “motor voter” work? Evidence from state-level data,” Journal of
Politics, 1995, 57 (3), 796–811.
14
Lassen, D.D., “The Effect of Information on Voter Turnout: Evidence from a Natural
Experiment,” American Journal of Political Science, 2005, XLIX, 103–118.
Martinez, Michael D. and David Hill, “Did Motor Voter Work?,” American Politics
Quarterly, 1999, 27, 296–315.
Michelson, Melissa R., “Mobilizing the Latino Youth Vote: Some Experimental Re-
sults,” Social Science Quarterly, 2006, 87 (5), 1188–1206.
Mitchell, Glenn E. and Christopher Wlezien, “The impact of legal constraints on voter
registration, turnout, and the composition of the American electorate,” Political Behav-
ior, 1995, 17 (2), 179–202.
Mulligan, Casey B. and Charles G. Hunter, “The Empirical Frequency of a Pivotal
Vote,” Public Choice, 2003, 116 (1-2), 31–54.
Nickerson, David W., “Volunteer Phone Calls Can Increase Turnout,” American Politics
Research 34(3):271-292., 2006, 34 (3), 271–292.
, “Do Voter Registration Drives Increase Participation? For Whom and When?,” Jour-
nal of Politics, 2014, forthcoming.
Stromberg, David, “Radio’s Impact on Public Spending,” Quarterly Journal of Economics,
2004, CXIX, 189–221.
Timpone, Richard J., “Structure, behavior, and voter turnout in the United States,”
American Political Science Review 92(1):145–58., 1998, 92 (1), 145–158.
15
mean s.d. mean s.d. mean s.d. mean s.d.
(1) (2) (3) (4) (5) (6) (7) (8)% Below Poverty Line 6.44 6.35 10.46 8.95 16.52 15.17 7.20 7.53% Receiving SNAP 4.02 4.00 7.82 5.75 13.03 9.55 4.15 3.86% Receiving SSI 3.23 2.61 3.67 2.88 4.76 4.48 2.61 2.13% Receiving Pub. Assist. 1.72 1.47 2.65 2.45 4.34 4.10 2.62 6.72Median Age 42.08 4.79 42.76 5.50 44.32 6.74 43.05 6.18% Black 1.94 3.64 0.46 0.85 0.38 0.94 0.40 0.68% Hispanic 3.33 6.53 1.00 1.24 0.96 2.55 1.09 1.38% Female 51.02 2.69 50.03 2.96 49.91 5.04 50.23 4.51% College or more 38.64 16.00 30.72 12.28 21.08 11.90 30.89 14.03% HS or less 8.43 5.50 10.31 5.27 12.25 7.61 9.94 6.11% Different county 3.87 2.91 4.93 3.82 4.44 4.52 4.68 3.28Population 18550 38996 2524 3815 2655 4883 5079 10322Fall/Spring Change in Reg % 4.44 2.41 6.08 4.72 4.43 6.13 7.33 13.02Voter Turnout (%) 70.08 12.11 70.81 13.53 74.56 10.75 77.14 26.95Turnout/Registered (%) 80.70 6.87 78.96 7.54 78.43 26.90 81.95 9.29Democrat votes (% of Pop) 41.74 10.48 46.20 11.68 38.47 10.00 41.20 11.81Democrat votes (% of Reg) 48.18 9.58 51.29 8.65 40.21 15.10 44.40 9.01
Note: Poverty indexes: "% below poverty" measures % of families below poverty line; "% SSI" measures % of those receiving Supplemental Security Income; "% SNAP" measures % of those receiving Supplemental Nutrition Assistance. Sources: Demogrphic data are from 2005-‐2009 American Community Survey (ACS), 5 Year sample. Elections data are from from the relevant state departments of Election Services
Massachusetts, N=351
Vermont, N=233
Maine, N=490
New Hampshire,
N=240
Table 1: Descriptive Statistics of States in 2008
mean s.d. mean s.d. mean s.d. mean s.d.
(1) (2) (3) (4) (5) (6) (7) (8)% Below Poverty Line 7.27 6.97 12.06 10.29 17.15 14.39 8.40 8.31% Receiving SNAP 5.64 4.96 9.87 6.05 14.98 9.45 5.15 4.28% Receiving SSI 3.69 2.64 4.04 2.96 5.40 4.77 3.03 2.42% Receiving Pub. Assist. 1.81 1.51 3.02 2.52 4.30 3.69 2.50 5.40Median Age 42.85 5.08 43.71 5.41 45.60 6.66 43.94 6.30% Black 2.21 4.10 0.46 0.75 0.34 0.75 0.40 0.64% Hispanic 3.85 6.93 1.23 1.48 0.96 1.77 1.32 1.59% Female 50.98 2.64 49.71 3.18 49.97 4.76 50.16 4.53% College or more 39.77 16.08 31.62 12.70 21.85 12.06 31.79 14.30% HS or less 7.78 5.38 9.49 4.81 11.38 6.43 8.66 5.13% Different county 3.73 2.54 4.66 3.55 3.97 3.97 4.58 3.44Population 18553 38451 2540 3981 2679 4999 5081 10325Fall/Spring Change in Reg % 4.31 2.93 3.61 2.32 3.17 4.11 12.39 13.36Voter Turnout (%) 70.83 12.19 65.15 12.95 73.66 21.75 73.79 14.08Turnout/Registered (%) 79.76 6.56 71.03 8.76 73.57 9.23 90.39 7.35Democrat votes (% of Pop) 40.62 10.49 41.96 10.48 36.82 13.39 37.86 8.40Democrat votes (% of Reg) 45.95 9.80 45.66 8.38 36.84 9.30 46.97 9.68
Note: Poverty indexes: "% below poverty" measures % of families below poverty line; "% SSI" measures % of those receiving Supplemental Security Income; "% SNAP" measures % of those receiving Supplemental Nutrition Assistance. Sources: Demogrphic data are from 2007-‐2011 American Community Survey (ACS), 5 Year sample. Elections data are from from the relevant state departments of Election Services
Massachusetts, N=351
Vermont, N=233 Maine, N=490
New Hampshire,
N=240
Table 2: Descriptive Statistics of States in 2012
% below poverty line % SSI+PA % SNAP
% below poverty line % SSI+PA % SNAP
(1) (2) (3) (4) (5) (6)poverty index -0.0072 -0.0723 -0.0557 0.0120 -0.0139 0.0044
(0.029) (0.093) (0.055) (0.028) (0.101) (0.066)median age -0.0439 -0.0440* -0.0453* -0.0079 -0.0106 -0.0089
(0.029) (0.025) (0.025) (0.042) (0.045) (0.048)% black -0.0023 0.0001 -0.0002 -0.0107 -0.0095 -0.0106
(0.028) (0.028) (0.027) (0.036) (0.035) (0.035)% hispanic 0.0533 0.0601 0.0648* 0.0408 0.0456 0.0430
(0.038) (0.036) (0.036) (0.036) (0.033) (0.031)% with BA+ 0.0315 0.0285 0.0282 0.0254 0.0249 0.0254
(0.021) (0.019) (0.019) (0.027) (0.026) (0.026)% county movers -0.1467** -0.1472*** -0.1462*** -0.1060 -0.1038* -0.1029*
(0.054) (0.046) (0.046) (0.060) (0.057) (0.058)population 0.0000 0.0000 0.0000 -0.0000* -0.0000* -0.0000*
(0.000) (0.000) (0.000) (0.000) (0.000) (0.000)% women -0.0549 -0.0576 -0.0450 -0.0574 -0.0549 -0.0555
(0.047) (0.050) (0.043) (0.045) (0.047) (0.042)% with HS- -0.0120 0.0021 0.0040 -0.0255 -0.0169 -0.0223
(0.062) (0.069) (0.072) (0.085) (0.096) (0.101)county FE + + +cons 2.4070 2.8644 2.1737 4.4164 4.3516 4.3382
3.2269 3.3906 3.2125 2.9653 3.0318 2.8789
N 350 350 350 350 350 350R2 adj. 0.055 0.059 0.058 0.097 0.097 0.097
Table 3: Percentage change in number of registered voters, October 2010 - February 2012, Massachusetts
Note: MA observations for 351 municipalities in 14 counties. Change in registration is measured by percentage change in registered voters between fall 2010 and spring 2012. Poverty indexes: "% below poverty" measures % of families below poverty line; "% SSI+PA" measures % of those receiving Supplemental Security Income or Public Assistance; "% SNAP" measures % of those receiving Supplemental Nutrition Assistance. Other controls are county fixed effects and socio-‐economic characteristics at the municipality level, including % of women, % of black, % of hispanics, % with BA or more, % with less than HS, % inter-‐county movers, population size, and itercations of these variables with 2012 indicator. Standard errors are clustered at the county level.
% below poverty line % SSI+PA % SNAP
(1) (2) (3)
2012 * poverty index 0.8560** 1.0983*** 0.8857* (0.297) (0.234) (0.461)
poverty index -0.3545 -0.5658** -1.0331** (0.290) (0.229) (0.389)
2012 1.1847 0.0283 0.8873(3.633) (3.868) (3.407)
cons 8.2479* 8.6385* 7.1918(4.030) (4.043) (4.447)
N 700 700 700R2 adj. 0.323 0.324 0.323
Table 4: Diff-in-Diff estimates, effects of DTA actions on voter registration
Note: MA observations for 351 municipalities in 14 counties, 2008 and 2012. Poverty indexes: "% below poverty" measures % of families below poverty line; "% SSI+PA" measures % of those receiving Supplemental Security Income or Public Assistance; "% SNAP" measures % of those receiving Supplemental Nutrition Assistance. Change in registration is measured by percentage change in % of registered voters between fall and spring in 2008 and 2012. Other controls are county fixed effects and socio-‐economic characteristics at the municipality level, including % of women, % of black, % of hispanics, % with BA or more, % with less than HS, % inter-‐county movers, population size, and itercations of these variables with 2012 indicator. Standard errors are clustered at the county level.
% below poverty line % SSI+PA % SNAP
% below poverty line % SSI+PA % SNAP
(1) (2) (3) (4) (5) (6)
2012 * poverty index 0.0061 0.0519 0.4506 1.6311* 2.4153** 2.5630* (0.804) (0.959) (0.714) (0.816) (1.019) (1.330)
poverty index -1.3515* -1.5793** -2.9798*** -1.8707* -2.3964** -3.7047** (0.670) (0.604) (0.751) (0.962) (0.970) (1.441)
2012 -8.2665 -6.4817 -6.8510 0.6347 0.0817 2.4038(6.412) (5.908) (5.616) (12.956) (12.167) (12.371)
cons 79.9929*** 80.4630*** 76.4986*** 59.7261*** 60.9432*** 56.0491***(6.009) (5.973) (6.368) (8.471) (8.584) (8.376)
N 700 700 700 700 700 700R2 adj. 0.688 0.689 0.696 0.734 0.734 0.735
Table 5: Diff-in-Diff estimates, effects of DTA actions on elections turnoutturnount/registration turnount/population
Note: Observations for 351 municipalities in 14 counties in MA, 2008 and 2012. Poverty indexes: "% below poverty" measures % of families below poverty line; "% SSI" measures % of those receiving Supplemental Security Income or Public Assistance; "% SNAP" measures % of those receiving Supplemental Nutrition Assistance. Other controls are county fixed effects and socio-‐economic characteristics at the municipality level, including % of women, % of black, % of hispanics, % with BA or more, % with less than HS, % inter-‐county movers, population size, and itercations of these variables with 2012 indicator. Standard errors are clustered at the county level.
% below poverty line % SSI+PA % SNAP
% below poverty line % SSI+PA % SNAP
(1) (2) (3) (4) (5) (6)
2012 * poverty index 0.3414 -0.2643 0.8174 1.5606** 1.5183 2.5284* (0.336) (0.780) (0.579) (0.703) (1.203) (1.234)
poverty index 0.1356 1.8687 0.8061 -0.4426 1.0150 0.0279(1.163) (1.082) (1.210) (1.596) (1.143) (1.761)
2012 -8.2392 -9.7946 -7.5046 -1.6234 -4.6750 -0.2670(9.613) (7.988) (8.980) (15.404) (12.897) (14.419)
cons 7.5769 8.4584 8.8356 -2.2665 -0.7690 -1.3446(8.885) (8.407) (8.999) (11.364) (11.030) (11.883)
N 700 700 700 700 700 700R2 adj. 0.742 0.746 0.744 0.709 0.712 0.711
Table 6: Diff-in-Diff estimates, effects of DTA actions on democrat votesharedemocrat votes/registration democrat votes/population
Note: Observations for 351 municipalities in 14 counties in MA, 2008 and 2012. Poverty indexes: "% below poverty" measures % of families below poverty line; "% SSI" measures % of those receiving Supplemental Security Income or Public Assistance; "% SNAP" measures % of those receiving Supplemental Nutrition Assistance. Other controls are county fixed effects and socio-‐economic characteristics at the municipality level, including % of women, % of black, % of hispanics, % with BA or more, % with less than HS, % inter-‐county movers, population size, and itercations of these variables with 2012 indicator. Standard errors are clustered at the county level.
% below poverty line % SSI+PA % SNAP(1) (2) (3)
MA*2012*Poverty Index 0.9765** 2.0830*** 2.1311***(0.395) (0.482) (0.679)
Poverty index -0.1171 0.3766 -0.1137(0.222) (0.341) (0.288)
2012*Poverty index -0.1202 -0.9778** -1.2289** (0.268) (0.419) (0.507)
MA*Poverty index -0.2614 -0.9712** -1.0157** (0.358) (0.407) (0.463)
2012 -4.3307 -3.8892 -2.8341(3.754) (3.971) (4.058)
MA -5.1416 -4.4789 -5.4109(5.185) (5.224) (5.536)
MA*2012 5.5513 3.9907 3.8118(5.570) (5.955) (5.611)
N 2551 2558 2558R2 adj. 0.1590 0.1620 0.1660
Table 7: Diff-in-Diff-in-Diff estimates, effects of DTA actions on voter registration
Note: Observations for 1314 municipalities in 54 counties in MA, VT, NH and MN, in 2008 and 2012 Poverty indexes: "% below poverty" measures % of families below poverty line; "% SSI+PA" measures % of those receiving Supplemental Security Income or Public Assistance; "% SNAP" measures % of those receiving Supplemental Nutrition Assistance. Change in registration is measured by percentage change in % of registered voters between fall and spring in 2008 and 2012. Other controls are county fixed effects and socio-‐economic characteristics at the municipality level, including % of women, % of black, % of hispanics, % with BA or more, % with less than HS, % inter-‐county movers, population size, and itercations of these variables with 2012 indicator. Standard errors are clustered at the county level.
% below poverty % SSI+PA % SNAP
% below poverty % SSI+PA % SNAP
(1) (2) (3) (4) (5) (6)
MA*2012*Poverty Index -0.2135 0.2885 1.2433 1.0987 4.0361*** 3.8943** (0.804) (0.971) (0.785) (0.946) (1.021) (1.493)
Poverty index -0.1195 -0.8879*** -1.1462*** -0.9713 -0.9361 -1.8899** (0.259) (0.307) (0.408) (1.011) (0.578) (0.860)
2012*Poverty index 0.2179 -0.2683 -0.8430 0.5342 -1.5856*** -1.2555* (0.374) (0.369) (0.553) (0.558) (0.500) (0.644)
MA*Poverty index -1.1111 -0.5594 -1.5390* -1.0276 -1.6072 -2.2587(0.672) (0.610) (0.835) (1.348) (1.048) (1.440)
2012 -9.1855* -9.6641* -8.3918 -11.7249 -12.2959 -9.9361(5.389) (5.205) (5.126) (13.499) (13.414) (13.862)
MA 17.6164* 18.1127** 15.3072* 8.3286 8.0997 3.8589(8.893) (8.891) (9.056) (15.118) (15.669) (15.557)
MA*2012 0.7378 2.8467 1.2642 12.5517 12.7511 12.7565(8.253) (7.534) (7.421) (16.379) (15.540) (16.652)
N 2551 2558 2558 2551 2558 2558R2 adj. 0.3770 0.3820 0.3880 0.4190 0.4250 0.4280
Table 8: Diff-in-Diff-in-Diff estimates, effects of DTA actions on elections turnoutturnount/registration turnount/population
Note: Observations for 1314 municipalities in 54 counties in MA, VT, NH and MN, in 2008 and 2012 Poverty indexes: "% below poverty" measures % of families below poverty line; "% SSI+PA" measures % of those receiving Supplemental Security Income or Public Assistance; "% SNAP" measures % of those receiving Supplemental Nutrition Assistance. Other controls are county fixed effects and socio-‐economic characteristics at the municipality level, including % of women, % of black, % of hispanics, % with BA or more, % with less than HS, % inter-‐county movers, population size, and itercations of these variables with 2012 indicator. Standard errors are clustered at the county level.
% below poverty
line % SSI+PA % SNAP
% below poverty
line % SSI+PA % SNAP(1) (2) (3) (4) (5) (6)
MA*2012*Poverty Index 0.7330* -0.1723 1.2969* 1.6813** 2.2370* 3.2640** (0.421) (0.885) (0.655) (0.819) (1.181) (1.246)
Poverty index 0.5802 -0.0378 0.2632 0.2927 -0.0603 -0.0466(0.385) (0.338) (0.634) (0.880) (0.452) (0.668)
2012*Poverty index -0.3981 -0.2164 -0.6960* -0.1250 -0.8006** -0.8737** (0.281) (0.297) (0.376) (0.325) (0.338) (0.434)
MA*Poverty index 0.0232 2.4251* 1.8112 -0.4265 1.4167 0.8838(1.352) (1.210) (1.644) (1.896) (1.268) (1.976)
2012 0.5513 0.8054 1.0876 2.0684 2.1431 2.8918(4.240) (4.511) (4.274) (5.227) (5.523) (5.354)
MA -4.5794 -4.5233 -2.6981 -6.9108 -6.8561 -6.2915(12.582) (12.139) (12.026) (12.533) (12.492) (12.795)
MA*2012 -9.4916 -11.9182 -9.7824 -4.1546 -7.6862 -3.9183(10.805) (9.344) (10.081) (14.924) (12.622) (14.090)
N 2551 2558 2558 2551 2558 2558R2 adj. 0.5530 0.5520 0.5520 0.5040 0.5050 0.5040
Table 9: Diff-in-Diff-in-Diff estimates, effects of DTA actions on democrat votesharedemocrat votes/registration democrat votes/population
Note: Observations for 1314 municipalities in 54 counties in MA, VT, NH and MN, in 2008 and 2012 Poverty indexes: "% below poverty" measures % of families below poverty line; "% SSI+PA" measures % of those receiving Supplemental Security Income or Public Assistance; "% SNAP" measures % of those receiving Supplemental Nutrition Assistance. Other controls are county fixed effects and socio-‐economic characteristics at the municipality level, including % of women, % of black, % of hispanics, % with BA or more, % with less than HS, % inter-‐county movers, population size, and itercations of these variables with 2012 indicator. Standard errors are clustered at the county level.
% below poverty
line % SSI+PA % SNAP
% below poverty
line % SSI+PA % SNAP
% below poverty
line % SSI+PA % SNAP(1) (2) (3) (4) (5) (6) (7) (8) (9)
2012 * poverty index -0.0573 -0.6169 -0.4397 0.3503* -0.1301 0.1346 1.5632 -1.6695 0.0744(0.636) (0.495) (0.358) (0.188) (0.148) (0.372) (1.004) (0.939) (2.054)
poverty index -0.1425 0.1884 -0.0854 -0.3596** -0.0464 -0.5384*** -0.3418 2.0151 -0.1203(0.682) (0.492) (0.295) (0.143) (0.205) (0.174) (1.085) (1.106) (1.902)
2012 -6.2587 -6.8703 -5.3972 -6.6830 -5.8083 -5.8944 6.7772 2.3099 3.8066(6.613) (6.315) (6.705) (3.983) (4.992) (5.220) (8.229) (7.695) (9.378)
cons 9.7855** 10.0661** 9.7180** 13.1772*** 12.9001*** 13.1194*** 30.2235** 31.7331** 30.6383** (4.469) (4.265) (4.415) (3.076) (3.713) (3.725) (12.811) (12.376) (13.422)
N 466 466 466 926 926 926 466 466 466R2 adj. 0.22 0.222 0.222 0.126 0.117 0.122 0.106 0.108 0.104
Vermont Maine New Hampshire
Appendix Table 1: Diff-in-Diff estimates, effects of DTA actions on voter registration in comparison states
Note: Estimations use municipality level data in 2008 and 2012. Change in registration is measured by percentage change in % of registered voters between fall and spring in 2008 and 2012. Poverty indexes: "% below poverty" measures % of families below poverty line; "% SSI+PA" measures % of those receiving Supplemental Security Income or Public Assistance; "% SNAP" measures % of those receiving Supplemental Nutrition Assistance. Change in registration is measured by percentage change in % of registered voters between fall and spring in 2008 and 2012. Other controls are county fixed effects and socio-‐economic characteristics at the municipality level, including % of women, % of black, % of hispanics, % with BA or more, % with less than HS, % inter-‐county movers, population size, and itercations of these variables with 2012 indicator. Standard errors are clustered at the county level.

% below poverty
line % SSI+PA % SNAP
% below poverty
line % SSI+PA % SNAP
% below poverty
line % SSI+PA % SNAP(1) (2) (3) (4) (5) (6) (7) (8) (9)
2012 * poverty index 0.7484* -0.0090 -0.5398 0.4193 -0.1276 0.1525 0.4295 1.6372** 0.9459(0.376) (0.510) (0.607) (0.471) (0.304) (0.477) (1.028) (0.677) (1.716)
poverty index -0.5667 -1.2784*** -2.1569*** -0.2594 -0.9498** -1.7421*** 0.2614 -1.9522* -1.3904(0.422) (0.385) (0.510) (0.326) (0.325) (0.406) (1.135) (0.885) (1.471)
2012 -19.0274** -18.7434** -14.1282** -9.2191 -9.9253* -9.6019* 16.1893** 16.3966* 16.3408* (6.861) (7.054) (6.536) (5.675) (5.148) (5.031) (6.985) (7.651) (7.515)
cons 77.8528*** 76.3130*** 76.2425*** 66.8550*** 67.0687*** 67.6326*** 38.9582 37.8678 37.5498(6.512) (6.554) (6.665) (6.003) (5.736) (5.895) (24.861) (25.719) (26.080)
N 466 466 466 926 926 926 466 466 466R2 adj. 0.459 0.466 0.485 0.188 0.2 0.211 0.234 0.239 0.235
Appendix Table 2: Diff-in-Diff estimates, effects of DTA actions on voter turnout/registered in comparison states
Vermont Maine New Hampshire
Note: Estimations use municipality level data in 2008 and 2012. Poverty indexes: "% below poverty" measures % of families below poverty line; "% SSI+PA" measures % of those receiving Supplemental Security Income or Public Assistance; "% SNAP" measures % of those receiving Supplemental Nutrition Assistance. Change in registration is measured by percentage change in % of registered voters between fall and spring in 2008 and 2012. Other controls are county fixed effects and socio-‐economic characteristics at the municipality level, including % of women, % of black, % of hispanics, % with BA or more, % with less than HS, % inter-‐county movers, population size, and itercations of these variables with 2012 indicator. Standard errors are clustered at the county level.

% below poverty
line % SSI+PA % SNAP
% below poverty
line % SSI+PA % SNAP
% below poverty
line % SSI+PA % SNAP(1) (2) (3) (4) (5) (6) (7) (8) (9)
2012 * poverty index 0.7848 -0.5084 -1.6239 -0.0050 -1.6852*** -1.7608* 3.2805* -0.8154 0.9776(1.353) (1.474) (1.679) (0.640) (0.491) (0.957) (1.738) (2.039) (2.123)
poverty index -0.7755 -0.2067 0.1970 -0.8166 -1.3893* -2.4121* -4.3337*** -0.5108 -6.0579***(1.078) (1.835) (1.808) (1.367) (0.760) (1.216) (0.997) (2.105) (1.769)
2012 10.0640 9.4530 11.6567 -28.3524 -26.6737 -24.7400 15.7475 11.2614 15.4708(11.862) (12.116) (12.246) (17.715) (17.260) (18.208) (36.127) (31.845) (35.000)
cons 45.9737*** 45.8346*** 46.2557*** 65.8889*** 67.4037*** 68.0113*** 43.8910* 47.7933** 43.0201* (10.592) (10.811) (10.831) (16.194) (17.314) (17.206) (22.711) (19.959) (22.684)
N 466 466 466 926 926 926 466 466 466R2 adj. 0.529 0.529 0.53 0.283 0.301 0.308 0.445 0.431 0.446
Appendix Table 3: Diff-in-Diff estimates, effects of DTA actions on voter turnout/population in comparison states
Vermont Maine New Hampshire
Note: Estimations use municipality level data in 2008 and 2012. Poverty indexes: "% below poverty" measures % of families below poverty line; "% SSI+PA" measures % of those receiving Supplemental Security Income or Public Assistance; "% SNAP" measures % of those receiving Supplemental Nutrition Assistance. Change in registration is measured by percentage change in % of registered voters between fall and spring in 2008 and 2012. Other controls are county fixed effects and socio-‐economic characteristics at the municipality level, including % of women, % of black, % of hispanics, % with BA or more, % with less than HS, % inter-‐county movers, population size, and itercations of these variables with 2012 indicator. Standard errors are clustered at the county level.
% below poverty
line % SSI+PA % SNAP
% below poverty
line % SSI+PA % SNAP
% below poverty
line % SSI+PA % SNAP(1) (2) (3) (4) (5) (6) (7) (8) (9)
2012 * poverty index 0.3485 -1.0922 -1.5840 -0.2897 -0.7102* -1.0745* -0.3352 -0.7434 -0.1216(0.983) (0.848) (1.193) (0.309) (0.366) (0.505) (0.839) (1.322) (1.907)
poverty index -0.1185 1.1355 1.8679 0.5604 -0.3613 0.4031 -0.2073 1.1170 0.3919(0.662) (0.889) (1.248) (1.213) (0.482) (0.721) (0.478) (1.703) (1.451)
2012 13.4548 11.6874 11.5738 -4.7839 -3.3008 -2.5029 3.2072 3.5882 3.8775(8.025) (8.403) (8.767) (6.931) (7.441) (7.107) (17.527) (15.521) (17.811)
cons 19.1386** 20.7183** 20.7065** 18.0509* 17.5371* 17.3437* 19.7756 20.3887 20.2032(8.328) (8.794) (8.550) (9.809) (9.505) (9.785) (18.536) (17.168) (18.967)
N 466 466 466 926 926 926 466 466 466R2 adj. 0.614 0.616 0.618 0.375 0.375 0.373 0.432 0.433 0.431
Appendix Table 4: Diff-in-Diff estimates, effects of DTA actions on Democrat votes/population in comparison states
Vermont Maine New Hampshire
Note: Estimations use municipality level data in 2008 and 2012. Poverty indexes: "% below poverty" measures % of families below poverty line; "% SSI+PA" measures % of those receiving Supplemental Security Income or Public Assistance; "% SNAP" measures % of those receiving Supplemental Nutrition Assistance. Change in registration is measured by percentage change in % of registered voters between fall and spring in 2008 and 2012. Other controls are county fixed effects and socio-‐economic characteristics at the municipality level, including % of women, % of black, % of hispanics, % with BA or more, % with less than HS, % inter-‐county movers, population size, and itercations of these variables with 2012 indicator. Standard errors are clustered at the county level.
% below poverty
line % SSI+PA % SNAP
% below poverty
line % SSI+PA % SNAP
% below poverty
line % SSI+PA % SNAP(1) (2) (3) (4) (5) (6) (7) (8) (9)
2012 * poverty index 0.1486 -0.9104 -0.9928 -0.2183 -0.0817 -0.1807 -1.8152** 0.7231 0.3808(0.539) (0.529) (0.561) (0.288) (0.294) (0.407) (0.644) (0.729) (0.983)
poverty index 0.1082 0.6000 0.5672 0.5913 -0.1326 0.6529 2.3397** 0.2790 2.8154* (0.467) (0.365) (0.415) (0.505) (0.435) (0.404) (0.949) (1.187) (1.387)
2012 -5.2956 -6.6192 -5.2699 0.6719 1.0858 1.0870 6.5681 9.4586 7.7777(6.842) (7.323) (7.124) (6.360) (6.753) (6.641) (9.470) (9.434) (8.634)
cons 38.0681*** 38.9336*** 38.5703*** 21.6886*** 21.0158*** 20.8508*** 15.3428 13.1703 15.2344(7.667) (7.805) (7.530) (4.234) (3.871) (4.000) (17.575) (18.685) (18.599)
N 466 466 466 919 926 926 466 466 466R2 adj. 0.562 0.563 0.563 0.349 0.345 0.347 0.356 0.345 0.357
Appendix Table 5: Diff-in-Diff estimates, effects of DTA actions on Democrat votes/registered in comparison states
Vermont Maine New Hampshire
Note: Estimations use municipality level data in 2008 and 2012. Poverty indexes: "% below poverty" measures % of families below poverty line; "% SSI+PA" measures % of those receiving Supplemental Security Income or Public Assistance; "% SNAP" measures % of those receiving Supplemental Nutrition Assistance. Change in registration is measured by percentage change in % of registered voters between fall and spring in 2008 and 2012. Other controls are county fixed effects and socio-‐economic characteristics at the municipality level, including % of women, % of black, % of hispanics, % with BA or more, % with less than HS, % inter-‐county movers, population size, and itercations of these variables with 2012 indicator. Standard errors are clustered at the county level.