regional land transport programme
TRANSCRIPT
2012/2015
Regional Land Transport Programme
TABLE OF CONTENTS
1
Chairman’s Foreword 3Transport in Auckland 4
1 Understanding the Regional Land Transport Programme 6
2 Auckland’s Transport Challenges 8
2.1 Meeting demand 8
2.2 What the transport system needs to provide 10
3 One System Approach 14
3.1 Auckland’s transport network elements 14
3.2 Towards a One System approach 19
3.3 Working together 22
4 Statement of Priorities 24
4.1 Support greater integration between land use and transport 24
4.2 Improvetheefficiencyandeffectivenessoftheregion’stransportnetworks 25
4.3 Make best use of the existing transport system 26
4.4 Improve transport safety and reduce the adverse impacts from transport on the surrounding environment 30
4.5 Howthepriorityfocusareasareusedtorankprojectsandactivities 32
5 2012/15 Programme Overview 33
5.1 Majorprojects 34
5.2 Activitiesofinter-regionalsignificance 37
5.3 Futureactivitiesofnationalorregionalsignificance2015/16to2017/18 37
6 Funding Plan 39
6.1 Overview 39
6.2 Fundingrequirements 40
6.3 Fundingchallenges 43
7 Monitoring and Review 44
8 Detailed Funding Requests 46
Appendix 1: Legislative Requirements 61Appendix 2: Strategic Context 65Appendix 3: Prioritisation Process 68Appendix 4: Variation to this RLTP 73Appendix 5: Road Policing Activities 75Glossary 77

22012/15 Regional Land Transport Programme
The highlights of this RLTP include electrification of the rail network, purchase of electric trains, planning and detailed design of the City Rail Link, completion of the Western Ring Route, integrated ticketing, and the Auckland-Manukau Eastern Transport Initiative. In addition to these large capital works, of significance is a series of active transport initiatives, safety programmes and optimisation of the transport network to ensure best use is made of existing and new investment.
Funding is always an issue and it is likely that not all the projects and programmes in this RLTP will be able to be fully funded. Initial indicators are that between $1.7b and $2.4b per annum is required over the next 10 years to fund activities proposed in this RLTP. The funding levels available through current sources will not be sufficient to enable this programme to be fully funded and there will be a requirement to prioritise projects.
Mark Ford
Chairman, Auckland Transport
The success of Auckland, New Zealand’s largest and fastest growing city and home to over one third of New Zealand’s population, is vital to New Zealand’s long-term prospects. Auckland is anticipated to grow to almost 2.3m people by 2051 – around 70 per cent of all the growth expected to take place in New Zealand over this period. As a result of this growth, the demand for travel is expected to increase by around 50 per cent for person trips each day over current levels while freight and commercial trips generated by this growth is expected to more than double.
The establishment of the Auckland Council on 1 November 2010 enabled Auckland to speak with one voice and the Mayor’s vision is for Auckland to be the world’s most liveable city. The Auckland Plan is setting the strategic direction for how this will be achieved.
Transport is a key enabler and shaper of this growth. This Regional Land Transport Programme (RLTP) sets out and prioritises the transport projects and services that facilitate people accessing jobs, recreation and education, and for goods to reach their markets.
The projects and programmes in this RLTP generally have a 10-year or shorter timeframe. However, the RLTP provides for investigations towards projects, such as an additional Waitemata Harbour Crossing and improved inter-regional transport and airport connections, which extend beyond this RLTP.
Chairman’s Foreword
3
Transport in Auckland – Where we’re headed
and recreational opportunities. Easier mobility will enable daily life and business to run more efficiently and profitably. Aucklanders will have more certainty and be able to plan their journeys with confidence wherever they happen to live or work across the city.
A co-ordinated approach is essential
An important focus for Auckland Transport over the past year has been to work towards a One System approach for planning and developing the transport networks. This co-ordinated approach involves delivering more consistent levels of service across the region and more closely integrated management across all transport modes – cars, buses, ferries, trains, trucks, walking and cycling. In addition to the immediate projects described in this programme, Auckland Transport is also looking to the region’s longer-term transport needs, at how best to provide for them, and will continue to work closely with the Auckland Council to implement the first Auckland Plan. The Plan includes a long-term vision and strategic objectives for how the transport system needs to be developed to serve the requirements of a rapidly growing Auckland.
The Regional Land Transport Programme (RLTP) sets out a co-ordinated programme of work over the next three years. The programme supports Auckland Transport’s mission to deliver effective and integrated transport solutions that contribute to a vibrant, prosperous Auckland.
Transport strongly influences economic outcomes
As New Zealand’s largest urban centre, and home to one third of all New Zealanders, Auckland is crucial to national prosperity and economic growth. Auckland’s success as New Zealand’s major commercial centre is also critical to the country’s long-term prospects. The city’s transport network is therefore a key component of any plan for the future.
Efficient transport corridors are the undisputed arteries of national and international trade. The Ports of Auckland, Auckland Airport, and the region’s motorway, arterial road, rail and public transport networks are fundamental to an internationally competitive Auckland.
Despite increased investment over the past 10 years, a significant shift is still needed to improve Auckland’s transport system. An integrated transport system planned, developed and operated as One System, will provide effective choices and connections within Auckland, inter-regionally and internationally. Sustained growth in the use of public transport over the next 30 years is necessary to free up our motorways and arterials for freight, commercial and other trips vital to the economy that cannot use public transport.
Transport enhances the city’s liveability
Realistic transport choices mean faster and more reliable travel times and, ultimately, a healthier and more liveable environment. A city which offers a range of quality transport options will be more attractive to residents, visitors, business investment and migrants. The transport improvements outlined in this programme will enhance access to jobs, and social, educational
MOVING AROUND AUCKLAND MORE
EASILY AND EFFICIENTLY, PARTICULARLY
TO AND FROM KEY BUSINESS
LOCATIONS SUCH AS THE PORT, AIRPORT
AND CITY CENTRE, WILL ENHANCE
BUSINESS EFFICIENCY.
42012/15 Regional Land Transport Programme

How projects are prioritised
The Regional Land Transport Programme is required by legislation to state the transport priorities for the next six years and order by priority all planned activities for the next three years. The process used to prioritise activities is discussed in chapter 4. Four priority focus areas have been identified that, when addressed, will contribute to fulfilling the transport expectations set out in the Auckland Plan, the Government Policy Statement on land transport funding and the Regional Land Transport Strategy.
1. Support the integration between land use and transport
2. Improve the efficiency and effectiveness of the region’s transport networks
3. Maintain and make best use of the existing transport system
4. Improve transport safety and reduce the adverse impacts from transport on the surrounding environment
These areas help to determine how each activity we are seeking funding for will fit into the plans for developing Auckland as a truly international city. Proposed priority activities include completing the state highway network and improving regional arterials; further development of public transport; protecting key transport routes; and upgrading walking and cycling facilities.
Key priorities for this programme
• Electrification of Auckland’s passenger rail network, including the purchase of new electric trains
• Progressing the City Rail Link
• Progressing construction of the Waterview connection as the final link in the Western Ring Route
• Advocate for an increase in road policing resources for the region to match population growth, targeting drink/drugged driver control, local urban intersection and rural speed enforcement, safety camera technology, and road safety education in schools
• Continuing construction of the Auckland-Manukau Eastern Transport Initiative (AMETI), and investigation of an East-West Link between AMETI and the Western Ring Route
• Constructing the Tiverton/Wolverton route
• Delivering integrated ticketing (HOP) for public transport
• Continuing improvements to walking and cycling infrastructure, including further progress on the regional cycle network
• Commencing preliminary works for improved passenger transport to the international airport, including route protection for the airport rail loop and road access improvements
• Investigation of the additional Waitemata Harbour Crossing
Funding is a significant challenge for the region
We have a structured system for prioritising the capital programme, but funding continues to be a significant challenge that Auckland Transport will need to address. This Regional Land Transport Programme sets out the funding required to maintain and develop Auckland’s transport system over the next decade. It highlights the need to broaden the funding base to enable timely completion of vital infrastructure projects and the delivery of transport service improvements.
5

the National Land Transport Programme. The focus of the RLTP, therefore, is on the priorities within each activity class.
Putting the RLTP in context
The first RLTP was produced in 2009 by the former Auckland Regional Transport Authority. This second RLTP has been prepared under the same legislation, but reflects a number of changes that have occurred since 2009. The most significant change has been the new governance structure in Auckland in late 2010. This has reduced the number of agencies in the region responsible for transport matters and all key parties are represented on the Auckland Transport Board.
Preparation of the RLTP has also considered:
• A new Government Policy Statement on land transport funding (GPS)
• The new Auckland Plan, which was adopted by the Auckland Council in March 2012
• The Auckland Council’s Long-term Plan
• The development of a new Integrated Transport Plan (ITP), which is being prepared by Auckland Transport concurrently with this RLTP
• A new Regional Land Transport Strategy (RLTS).
Further detail on the strategic context for this RLTP, including these plans and strategies, is contained in Appendix 2.
The RLTP development process
Auckland Transport prepared a draft RLTP in February 2012. The draft was issued for public consultation in combination with the Auckland Council’s draft Long-term Plan.
930 submissions were received on the draft RLTP. 128 submitters presented at hearings held in April 2012.
What is the Regional Land Transport Programme?
This Regional Land Transport Programme (RLTP) has been prepared by Auckland Transport. The programme lists planned transport activities in Auckland for the next three years in a prioritised order. It is also intended to provide the basis of requests for government funding through the NZ Transport Agency (NZTA).
Why is an RLTP necessary?
Auckland Transport is required to prepare a RLTP every three years. It covers all land transport activities undertaken in the Auckland region by NZTA state highways and Auckland Transport, and also includes the Regional Land Transport Strategy (RLTS) work undertaken by Auckland Council. The RLTP includes all land transport modes – trains, trucks, cars, ferries, buses, walking and cycling except rail track responsibilities.
The legislative requirements relating to the Auckland RLTP are contained in the Land Transport Management Act 2003 (LTMA).The key provisions are set out in Appendix 1, together with an assessment of how the RLTP complies with section 15 of the LTMA.
Although the RLTP assigns priorities to different land transport activities, the overall amount of funding available for each major activity class is determined by the Auckland Council, through the Long-term Plan process, and by the NZTA, through
THE REGION’S NEW GOVERNANCE
STRUCTURE HAS ENABLED
AUCKLAND TRANSPORT TO PREPARE
A PROGRAMME ALIGNED WITH
REGIONAL PRIORITIES.
62012/15 Regional Land Transport Programme
Understanding the Regional Land Transport Programme
1
The matters raised in submissions were considered and Auckland Transport has since made a number of amendments that have been incorporated into this final programme, as outlined below.
The final RLTP will be submitted to NZTA, which will then prepare a National Land Transport Programme (NLTP), which will allocate government funding through the National Land Transport Fund (NLTF). An activity that is not included in the RLTP may not be included in the NLTP.
Changes to the programme since the draft RLTP
The programme has changed since the draft document, with projects entering and leaving the first three years of the programme. The main reasons for the changes are outlined below.
Changes following consultation
In response to submissions made on the draft document, some new projects have been added and alterations made to existing projects. For example:
• There is additional funding in the first three years of the programme for the Albany Highway improvement project to reduce the construction period
• Provide additional funding for land acquisitions to support designations; and,
• Increase the allocation for seal extensions.
Reduced funding envelope provided
The amount of the funding available to Auckland Transport has decreased since the publication of the draft RLTP, due to a combination of factors:
• In order to meet the funding requirements of the Auckland Council’s Long-term Plan, annual infrastructure funding from Auckland Council has been reduced by three per cent from 2013/14 onwards
• The inclusion of more projects which do not attract an NZTA subsidy has reduced the amount of the total funding available
• Expectations of the likely amount of NZTA subsidy have also reduced given that NZTA revenues are not as high as indicated when the draft document was released.
These factors together have resulted in a decrease of nearly $60 million in funds available for new works in the next three years than was the case when the RLTP was produced.
Changes to meet Auckland Council’s recommendations
In order to give better local representation to transport projects, the final RLTP provides for the Long-term Plan recommendation that an allocation of $95.9 million be made to fund Local Board transport initiatives over the next 10 years.
Programming changes
In this final programme, allowances have been made for projects that were not completed in the last programme and for additional funding being committed to existing priorities such as AMETI. Auckland Transport’s funding is fixed, reductions in the size of the funding allocation and additional projects entering into the programme inevitably mean that other projects will be delayed.
7

While transport is not an end in itself, an effective and efficient transport system is critical to the economic prosperity and liveability of a city. Auckland’s continued growth and development presents a range of challenges that will influence the way future transport investment decisions are made. This chapter outlines some of these key challenges.
2.1 MEETING DEMAND
Auckland is expected to account for around 75 per cent of New Zealand’s projected population growth over this period. See figure 2.1.
This growth in population will be accompanied by continued growth in economic activity within the Auckland region, and in the upper North Island as a whole.
AUCKLAND’S POPULATION IS
EXPECTED TO GROW BY ALMOST
ONE MILLION PEOPLE OVER THE
NEXT 40 YEARS, AND TO REACH
APPROXIMATELY 2.3 MILLION BY 2051.
3.5
3.0
2.5
2.0
1.5
1.0
0.5
0.0
Rest of New Zealand
Popu
lati
on
(Mill
ions
)
Auckland
Growth to 2051 2006
Figure 2.1: Projected population growth 2006 to 2051
82012/15 Regional Land Transport Programme
Auckland’s Transport Challenges2
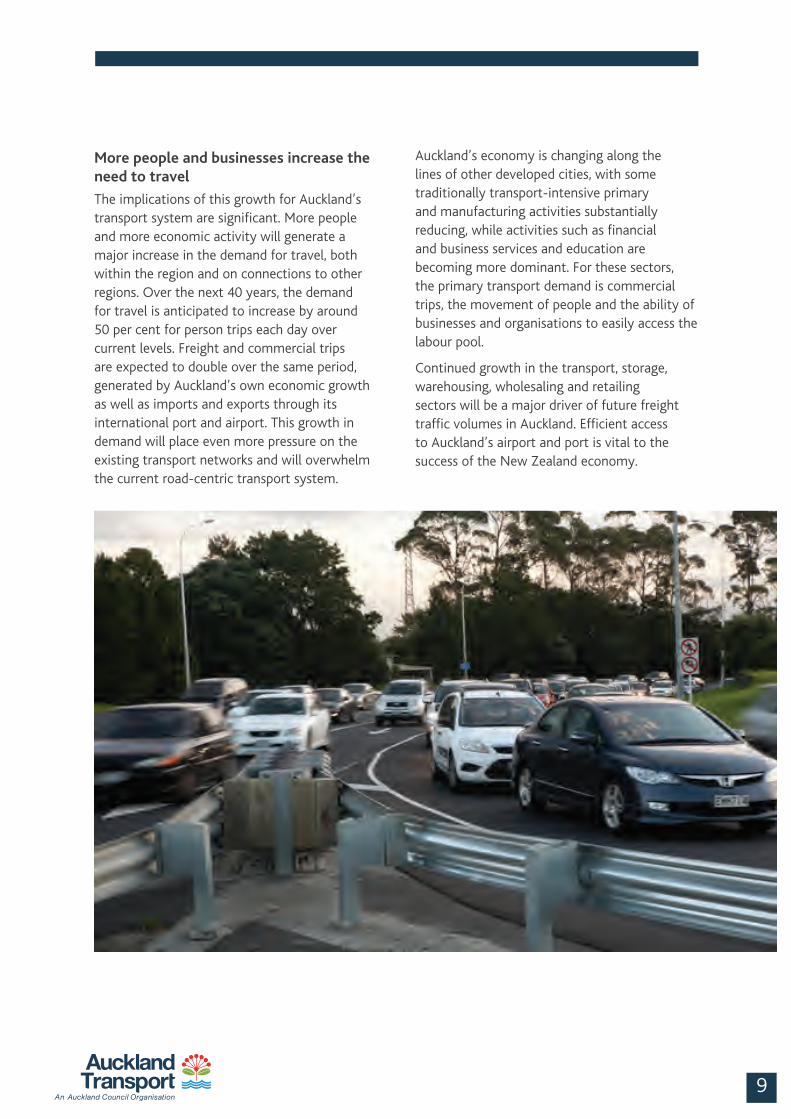
Auckland’s economy is changing along the lines of other developed cities, with some traditionally transport-intensive primary and manufacturing activities substantially reducing, while activities such as financial and business services and education are becoming more dominant. For these sectors, the primary transport demand is commercial trips, the movement of people and the ability of businesses and organisations to easily access the labour pool.
Continued growth in the transport, storage, warehousing, wholesaling and retailing sectors will be a major driver of future freight traffic volumes in Auckland. Efficient access to Auckland’s airport and port is vital to the success of the New Zealand economy.
More people and businesses increase the need to travel
The implications of this growth for Auckland’s transport system are significant. More people and more economic activity will generate a major increase in the demand for travel, both within the region and on connections to other regions. Over the next 40 years, the demand for travel is anticipated to increase by around 50 per cent for person trips each day over current levels. Freight and commercial trips are expected to double over the same period, generated by Auckland’s own economic growth as well as imports and exports through its international port and airport. This growth in demand will place even more pressure on the existing transport networks and will overwhelm the current road-centric transport system.
9
2.2 WHAT THE TRANSPORT SYSTEM NEEDS TO PROVIDE
The challenge for the transport system is to respond to these changes. It needs to support economic development opportunities in the region and contribute to the accessibility and efficiency of business activities and employment.
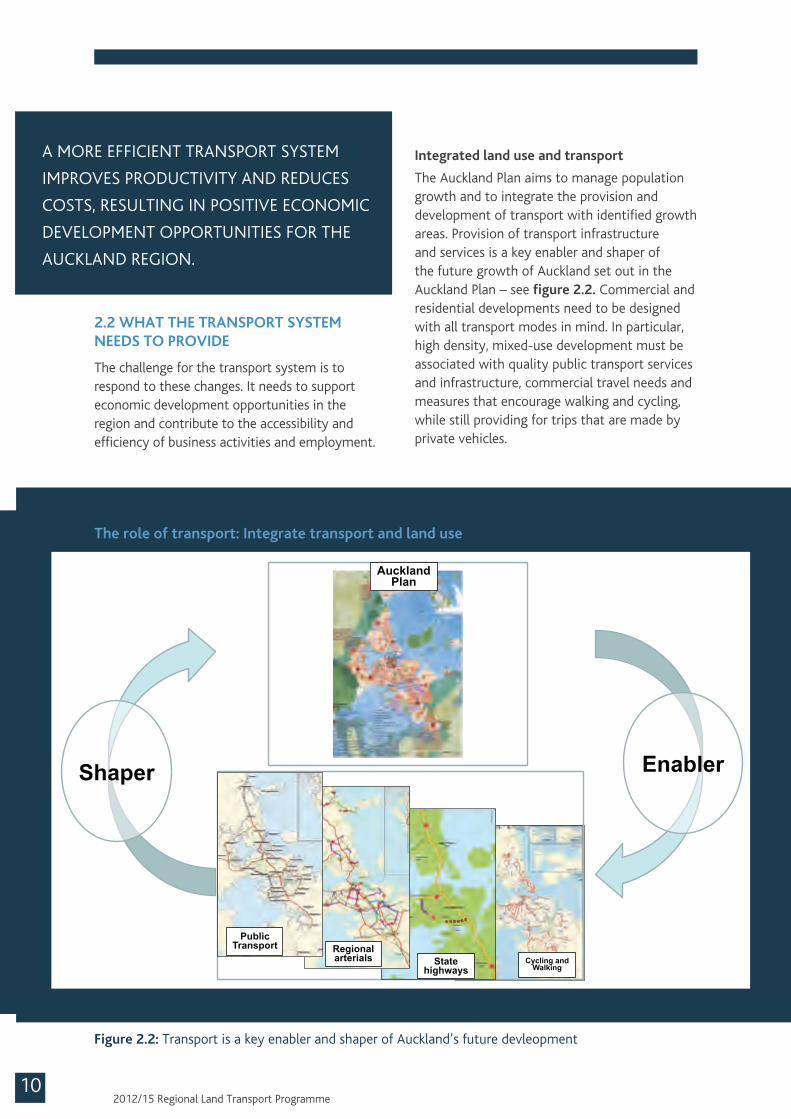
Integrated land use and transport
The Auckland Plan aims to manage population growth and to integrate the provision and development of transport with identified growth areas. Provision of transport infrastructure and services is a key enabler and shaper of the future growth of Auckland set out in the Auckland Plan – see figure 2.2. Commercial and residential developments need to be designed with all transport modes in mind. In particular, high density, mixed-use development must be associated with quality public transport services and infrastructure, commercial travel needs and measures that encourage walking and cycling, while still providing for trips that are made by private vehicles.
A MORE EFFICIENT TRANSPORT SYSTEM
IMPROVES PRODUCTIVITY AND REDUCES
COSTS, RESULTING IN POSITIVE ECONOMIC
DEVELOPMENT OPPORTUNITIES FOR THE
AUCKLAND REGION.
Figure 2.2: Transport is a key enabler and shaper of Auckland’s future devleopment
The Role of Transport Integrate Transport & Land Use
Enabler Shaper
Public Transport
State highways
Regional arterials Cycling and
Walking
Auckland Plan
102012/15 Regional Land Transport Programme
The role of transport: Integrate transport and land use
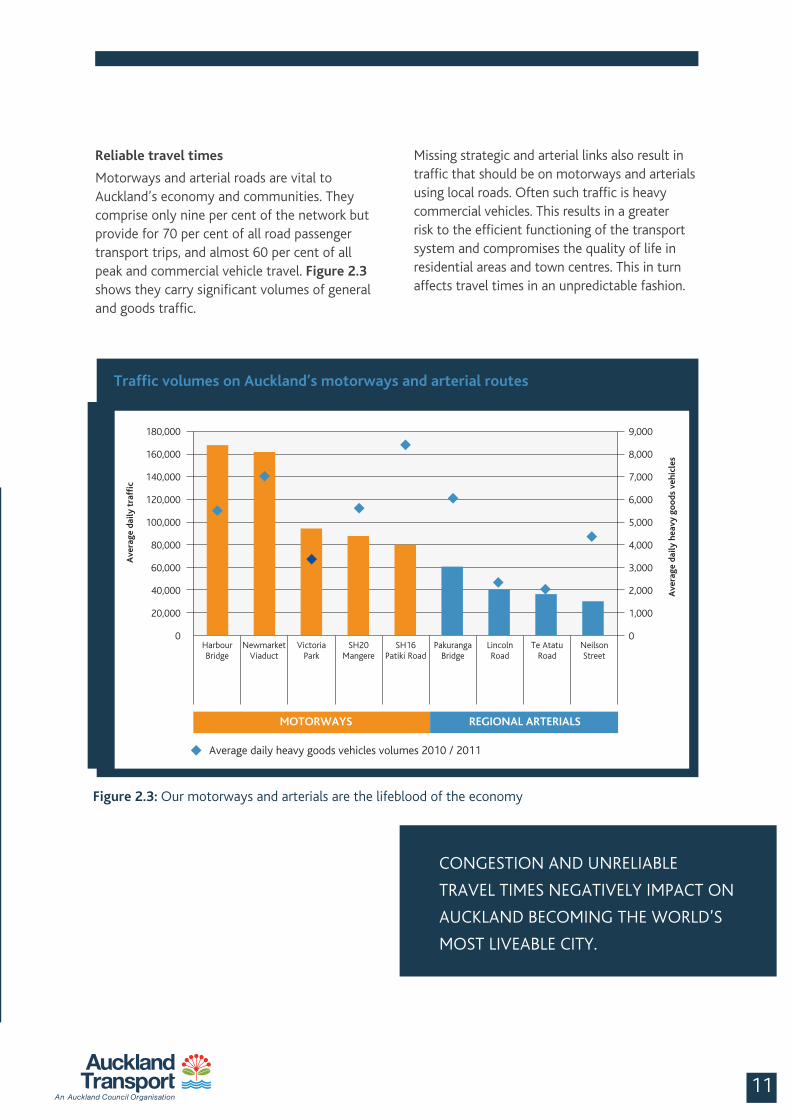
Missing strategic and arterial links also result in traffic that should be on motorways and arterials using local roads. Often such traffic is heavy commercial vehicles. This results in a greater risk to the efficient functioning of the transport system and compromises the quality of life in residential areas and town centres. This in turn affects travel times in an unpredictable fashion.
Reliable travel times
Motorways and arterial roads are vital to Auckland’s economy and communities. They comprise only nine per cent of the network but provide for 70 per cent of all road passenger transport trips, and almost 60 per cent of all peak and commercial vehicle travel. Figure 2.3 shows they carry significant volumes of general and goods traffic.
CONGESTION AND UNRELIABLE
TRAVEL TIMES NEGATIVELY IMPACT ON
AUCKLAND BECOMING THE WORLD’S
MOST LIVEABLE CITY.
Figure 2.3: Our motorways and arterials are the lifeblood of the economy
180,000
160,000
140,000
120,000
100,000
80,000
60,000
40,000
20,000
0
9,000
8,000
7,000
6,000
5,000
4,000
3,000
2,000
1,000
0
Ave
rage
dai
ly t
raffi
c
Harbour Bridge
Newmarket Viaduct
Victoria Park
SH20 Mangere
SH16 Patiki Road
Pakuranga Bridge
Lincoln Road
Te Atatu Road
Neilson Street
Ave
rage
dai
ly h
eavy
go
ods
veh
icle
s
MOTORWAYS REGIONAL ARTERIALS
Average daily heavy goods vehicles volumes 2010 / 2011
Traffic volumes on Auckland’s motorways and arterial routes
11
Safer roads
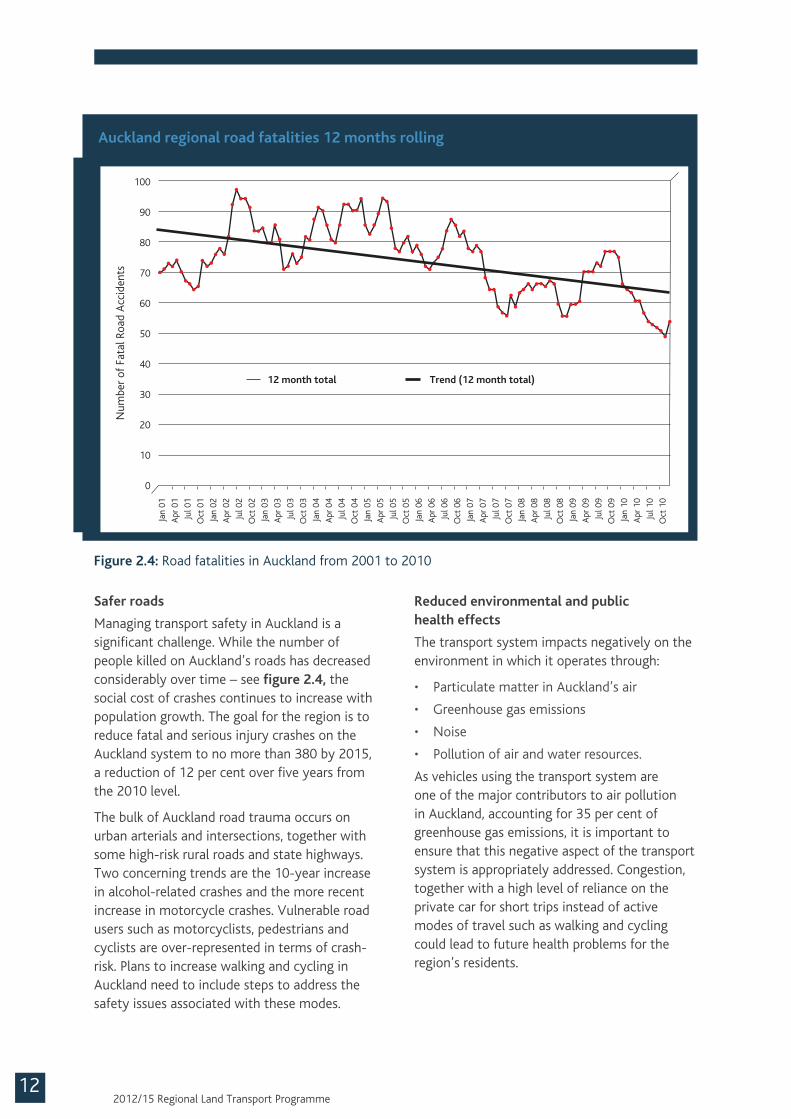
Managing transport safety in Auckland is a significant challenge. While the number of people killed on Auckland’s roads has decreased considerably over time – see figure 2.4, the social cost of crashes continues to increase with population growth. The goal for the region is to reduce fatal and serious injury crashes on the Auckland system to no more than 380 by 2015, a reduction of 12 per cent over five years from the 2010 level.
The bulk of Auckland road trauma occurs on urban arterials and intersections, together with some high-risk rural roads and state highways. Two concerning trends are the 10-year increase in alcohol-related crashes and the more recent increase in motorcycle crashes. Vulnerable road users such as motorcyclists, pedestrians and cyclists are over-represented in terms of crash-risk. Plans to increase walking and cycling in Auckland need to include steps to address the safety issues associated with these modes.
Reduced environmental and public health effects
The transport system impacts negatively on the environment in which it operates through:
• Particulate matter in Auckland’s air
• Greenhouse gas emissions
• Noise
• Pollution of air and water resources.
As vehicles using the transport system are one of the major contributors to air pollution in Auckland, accounting for 35 per cent of greenhouse gas emissions, it is important to ensure that this negative aspect of the transport system is appropriately addressed. Congestion, together with a high level of reliance on the private car for short trips instead of active modes of travel such as walking and cycling could lead to future health problems for the region’s residents.
100
90
80
70
60
50
40
30
20
10
0
Figure 2.4: Road fatalities in Auckland from 2001 to 2010
Auckland regional road fatalities 12 months rollingJa
n 01
Apr
01
Jul 0
1
Oct
01
Jan
02
Apr
02
Jul 0
2
Oct
02
Jan
03
Apr
03
Jul 0
3
Oct
03
Jan
04
Apr
04
Jul 0
4
Oct
04
Jan
05
Apr
05
Jul 0
5
Oct
05
Jan
06
Apr
06
Jul 0
6
Oct
06
Jan
07
Apr
07
Jul 0
7
Oct
07
Jan
08
Apr
08
Jul 0
8
Oct
08
Jan
09
Apr
09
Jul 0
9
Oct
09
Jan
10
Apr
10
Jul 1
0
Oct
10
Num
ber
of F
atal
Roa
d A
ccid
ents
12 month total Trend (12 month total)
122012/15 Regional Land Transport Programme
This growth is essential for the economic prosperity and liveability of Auckland because public transport has the ability to move more people more efficiently than any other mode, freeing up motorways and arterial roads for freight, commercial and other trips that cannot use public transport and are essential to the economy and social needs.Sustained growth in public transport
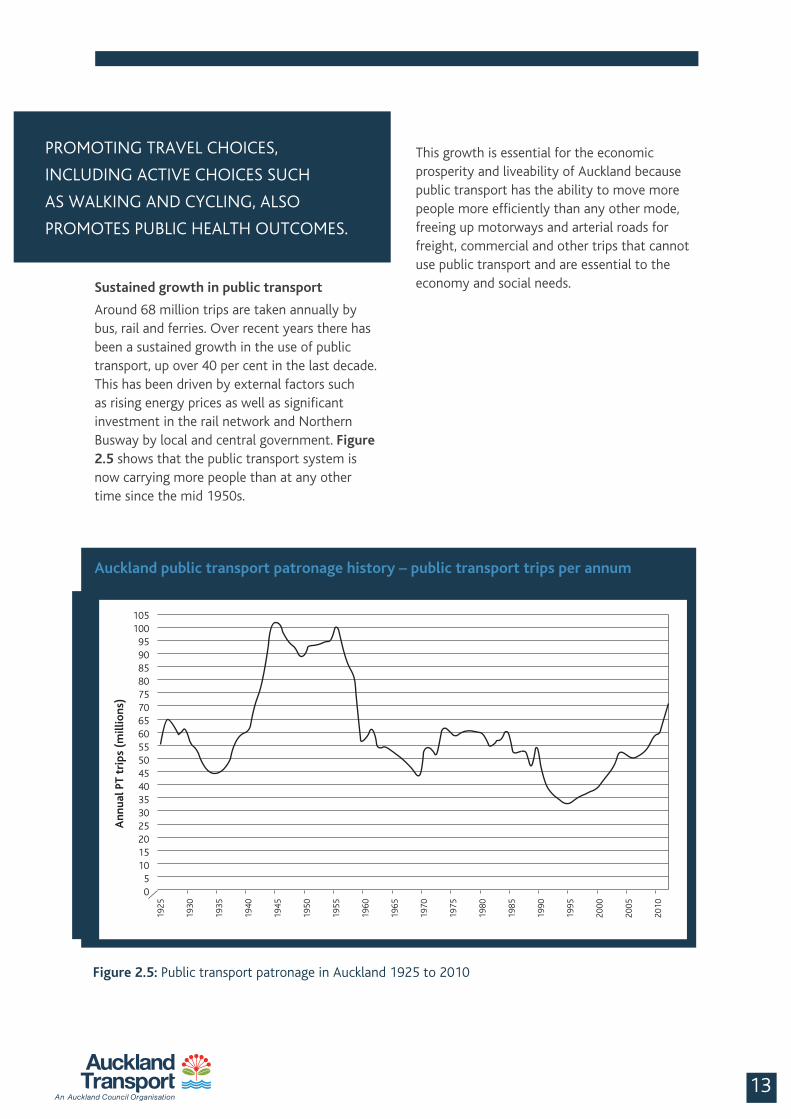
Around 68 million trips are taken annually by bus, rail and ferries. Over recent years there has been a sustained growth in the use of public transport, up over 40 per cent in the last decade. This has been driven by external factors such as rising energy prices as well as significant investment in the rail network and Northern Busway by local and central government. Figure 2.5 shows that the public transport system is now carrying more people than at any other time since the mid 1950s.
PROMOTING TRAVEL CHOICES,
INCLUDING ACTIVE CHOICES SUCH
AS WALKING AND CYCLING, ALSO
PROMOTES PUBLIC HEALTH OUTCOMES.
Figure 2.5: Public transport patronage in Auckland 1925 to 2010
Auckland public transport patronage history – public transport trips per annum
1925
1930
1935
1940
1945
1950
1955
1960
1965
1970
1975
1980
1985
1990
1995
2000
2005
2010
Ann
ual P
T tr
ips
(mill
ions
)
105 100
95 90 85 80 75 70 65 60 55 50 45 40 35 30 25 20 15 10
5 0
13
3.1 AUCKLAND’S TRANSPORT NETWORK ELEMENTS
The effective development and management of Auckland’s transport system requires the integration of its network elements: physical, functional and operational.
The most common perception of the transport system is its network of physical infrastructure – the roads (state highways, arterial roads and local roads), rail lines, stations, Northern Busway and its stations, wharves, footpaths and cycleways. But in addition to the physical transport network, the transport system includes a number of functional elements. These include the movement of freight, business traffic, school and university students, commuters, recreational and social users, which in turn support a local sense of place and community.
Overlaying the physical and functional networks are operational networks:
• Traffic management (including signal coordination, incident management, real-time journey information)
• Public transport services (rail, bus and ferry)
• Public transport systems (integrated ticketing, fares, information and marketing).
The cornerstones of Auckland’s transport network are the strategic and regional arterial road and rail networks, the public transport networks and the walking and cycling networks.
These networks are shown in Figure 3.1. Figure 3.2 shows the major elements of Auckland’s public transport network, which includes the Rapid Transit Network (RTN) comprising the rail system and Northern Busway and the Quality Transit Network (QTN) comprising key ferry and bus routes. The map also shows proposed future extensions to this network. Figure 3.3 shows the regional cycle network, including existing and proposed future facilities. Figure 3.4 shows the regional freight network, including freight development areas.
142012/15 Regional Land Transport Programme
One System Approach3

Figure 3.1: Auckland’s strategic and regional arterial road and rail networks
Auckland’s strategic and arterial road and rail networks
15
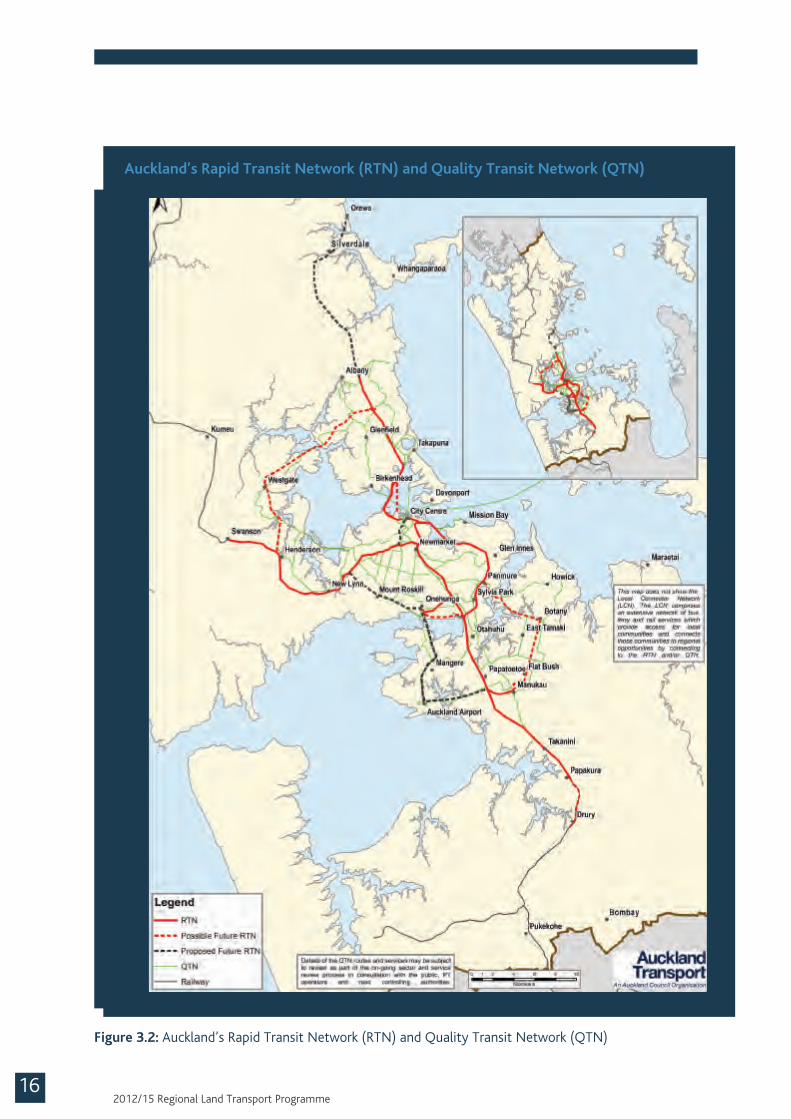
Figure 3.2: Auckland’s Rapid Transit Network (RTN) and Quality Transit Network (QTN)
Auckland’s Rapid Transit Network (RTN) and Quality Transit Network (QTN)
162012/15 Regional Land Transport Programme

Figure 3.3: Auckland’s regional cycle network
Auckland’s regional cycle network
17
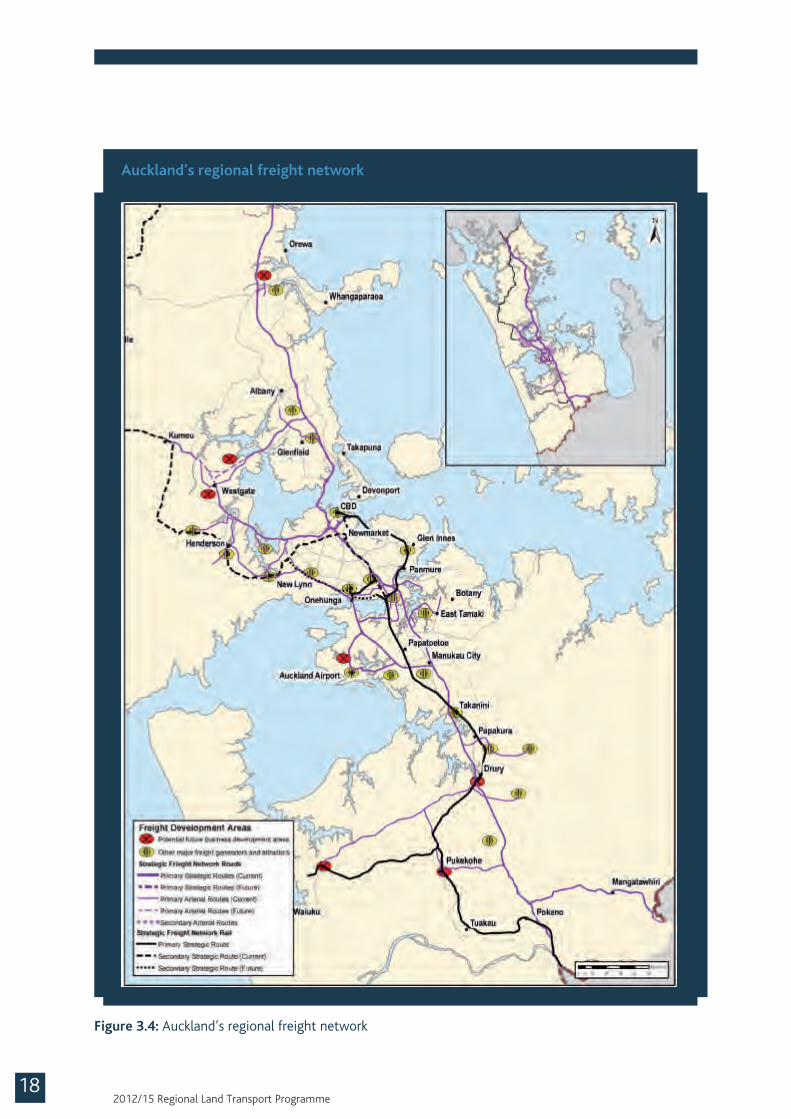
Figure 3.4: Auckland’s regional freight network
Auckland’s regional freight network
182012/15 Regional Land Transport Programme
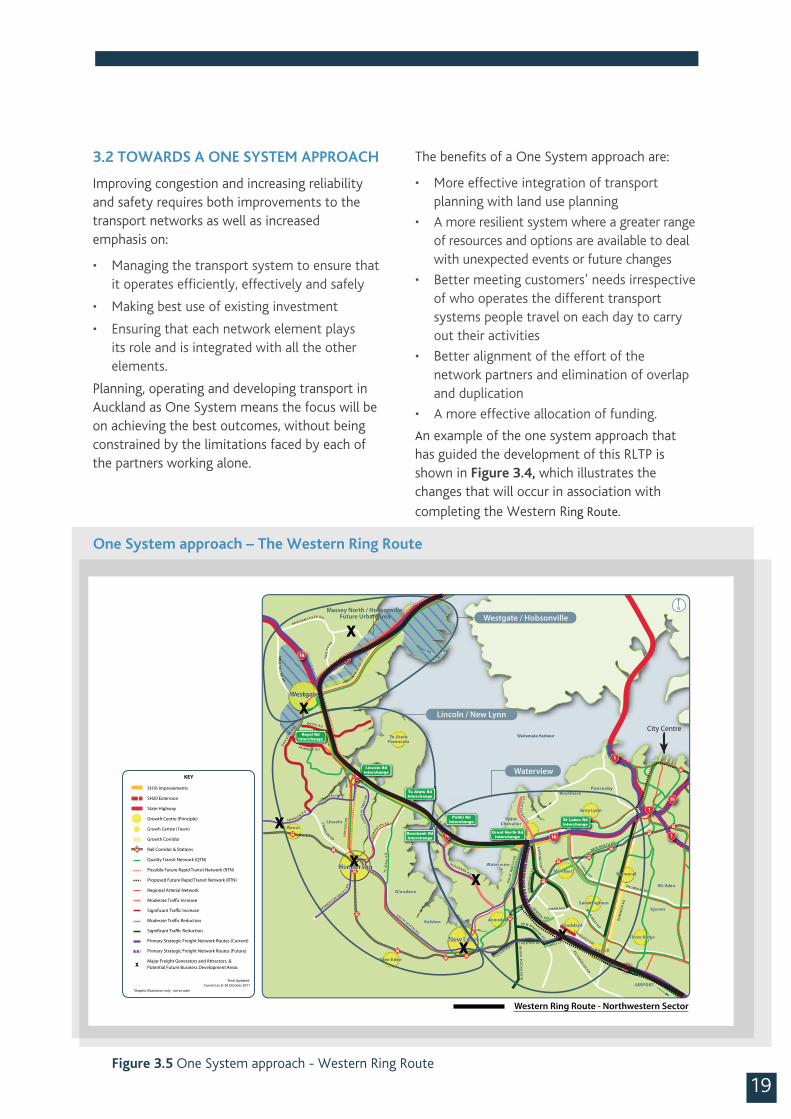
The benefits of a One System approach are:
• More effective integration of transport planning with land use planning
• A more resilient system where a greater range of resources and options are available to deal with unexpected events or future changes
• Better meeting customers’ needs irrespective of who operates the different transport systems people travel on each day to carry out their activities
• Better alignment of the effort of the network partners and elimination of overlap and duplication
• A more effective allocation of funding.
An example of the one system approach that has guided the development of this RLTP is shown in Figure 3.4, which illustrates the changes that will occur in association with completing the Western Ring Route.
3.2 TOWARDS A ONE SYSTEM APPROACH
Improving congestion and increasing reliability and safety requires both improvements to the transport networks as well as increased emphasis on:
• Managing the transport system to ensure that it operates efficiently, effectively and safely
• Making best use of existing investment
• Ensuring that each network element plays its role and is integrated with all the other elements.
Planning, operating and developing transport in Auckland as One System means the focus will be on achieving the best outcomes, without being constrained by the limitations faced by each of the partners working alone.
One System approach – The Western Ring Route
Figure 3.5 One System approach - Western Ring Route
19
SW
AN
SON R D
LIN
CO
LN R
D
ED
MONTON R D
HE NDE R S ON VALLE Y RD
G R E AT NOR TH R D
GR
EAT
NO
RTH
RD
BLO
CK
HO
USE
BAY
RD
R ICHAR
DSON R D
DO
MIN
ION
RD
NE W NOR T H R D
MT ALBE R T R D
R OS E B ANK R D
R OYAL R D
S C OTT R D
HOB S ONVILLE
RD
B R IG HAM C R E E K R D
TR
IG R
OAD
B ALMOR AL R D
CA
RR
ING
TO
N R
D
OWAIR A K A AVE
NE W WINDS OR R D
MAIOR O S T
W O LVE R TON S T T IV E R TON R D
WO
OD
WA
RD
RD
S T LUKE S R D
HE NDO
N AV E
DO
N B
UC
K RD
T R IAN G LE R D
S TODDAR D R D
PT C
HE
VA
L IER R D
TE A
TAT
U R
D
UNI V E R S AL DR
CEN
TRA
L PA
RK
DR
S WANS ON RD
ALDE R MAN DR
FR
ED
TAYLO
R D
R
KEY
SH16 Improvements
SH20 Extension
State Highway
Growth Centre (Principle)
Growh Centre (Town)
Growth Corridor
Rail Corridor & Stations
Quality Transit Network (QTN)
Possible Future Rapid Transit Network (RTN)
Proposed Future Rapid Transit Network (RTN)
Regional Arterial Network
Moderate Tra�c Increase
Signi�cant Tra�c Increase
Moderate Tra�c Reduction
Signi�cant Tra�c Reduction
Primary Strategic Freight Network Routes (Current)
Primary Strategic Freight Network Routes (Future)
Major Freight Generators and Attractors, &Potential Future Business Development Areas
Final Updated Current as at 20 October 2011
*Graphic Illustration only - not to scale
x
Te AtatuPeninsula
Lincoln
Henderson
Glendene
Kelston
PointChevalier
Waterview
Avondale
Mt Albert
Sandringham
Three Kings
Epsom
Mt Eden
WestmerePonsonby
Waitemata Harbour
Westgate
AIRPORT
Mt Roskill
Stoddard
New Lynn
Balmoral
Grey Lynn
Glen Eden
Ranui
Westgate / Hobsonville
Lincoln / New Lynn
Waterview
Massey North / Hobsonville Future Urban Area
Te Atatu RdInterchange
Lincoln RdInterchange
Patiki RdInterchange
Rosebank RdInterchange
R D
T
Royal RdInterchange
Great North RdInterchange
St Lukes RdInterchange
Western Ring Route - Northwestern Sector
N
16
1
InIntI16
16 16
LLLEEERR
18
1
1
16
20
x
x
x
x
x
x
x
City Centre

Tiverton Road-Wolverton Connection: Capacity improvements to provide better connectivity between New Lynn town centre and SH 20.
Great North Road: Reduced traffic demands following the SH 20 Waterview project will result in improved flows and enable extension of bus priorities.
Dominion Road: Reduced traffic demands following the SH 20 Waterview project will enable a stronger focus on public transport connections between the city centre and the airport, and the southern opportunity area; and on separate cycling facilities.
Auckland-Manukau Eastern Transport Initiative
The One System approach will also result in a higher level of integration between different transport modes to enable growth, facilitate economic development and establish thriving, liveable communities and town centres. An example of this is the Auckland-Manukau Eastern Transport Initiative (AMETI), which is illustrated in Figure 3.6.
The AMETI improvements will allow faster and more efficient public transport services, and improved walking and cycling facilities. These improvements are expected to reduce pressure on private car use in the area which, together with new and improved road links, will allow the road network to move people and goods more efficiently, and with greater reliability. Key elements are:
New urban busway: A high-quality separated busway is proposed linking Panmure and Botany via Pakuranga along Lagoon Drive, Pakuranga Road, and Ti Rakau Drive. The South Eastern
Arterial road improvements associated with the Western Ring Route development:
Other examples of NZTA, Auckland Transport and KiwiRail working in partnership and co-ordinating projects to achieve the benefits of a one system approach are:
Hobsonville Road: The significant reduction in traffic resulting from the opening of the extension of SH18 motorway has freed up capacity on this road, which has enabled a greater focus on access to land use development in the area, and provided opportunities to allocate road space to public transport, walking and cycling.
Lincoln Road: Improvements to the motorway interchange are being made in conjunction with the SH16 improvement scheme. This will create additional capacity at the interchange with SH16, and provide capacity improvements for all modes on Lincoln Road allowing more efficient and reliable movement of people and goods between Henderson and the city centre.
Te Atatu Road: Junction improvements, widening and the addition of bus priorities are proposed to improve capacity and reduce peak period congestion.
STEP CHANGE IMPROVEMENTS CAN BE
ACHIEVED WHEN THE ORGANISATIONS
RESPONSIBLE FOR THE TRANSPORT SYSTEM
WORK TOGETHER IN PARTNERSHIP WITH
COMMON OBJECTIVES AND A COMMON
PROGRAMME – A ONE SYSTEM APPROACH.
THE AMETI IMPROVEMENTS WILL ALLOW FASTER AND MORE EFFICIENT PUBLIC
TRANSPORT SERVICES, COMMERCIAL TRAFFIC AND IMPROVED WALKING AND
CYCLING FACILITIES SERVING ONE OF THE FASTEST GROWING AREAS OF AUCKLAND.
202012/15 Regional Land Transport Programme

21
Panmure Basin Ta
maki River
Pakuranga Creek
Tamaki River
Half Moon Bay
Marina
Tamaki E
stuary
Pt England
Wai-o-Taiki Bay
Pakuranga
Burswood
St Johns
Sunnyhills
Farm Cove
Stonefields
Mt Wellington
Pt England Reserve
Pigeon Mountain
Cinemas
Highland Park Shopping Centre
Howick Historical
Village
Mt Wellington Domain
Hamlins Hill
Remuera Golf Course
Pakuranga Health Camp
School
Howick & Eastern
Bus Depot
Ti RakauPark
Lloyd Elsmore
Park
SEH Retirement
Village
Pt England Primary
Glen Innes Primary
St Pius School
Glen Taylor School
Pakuranga College
Tamaki Primary and Intermediate
Stanhope Rd Primary
Bailey Rd School
Tamaki College
St Johns Theological
College
Mt Carmel School
Auckland University
Tamaki Campus
Glen Innes Intermediate
1
Sylvia Park Shopping
Centre
H
I
10
G
F
C
LAGOON DRIVE
A Quarry Link Road New link to Pilkington Road
B Panmure - Glen Innes New local road link Mt Wellington Highway - Merton Road
C Panmure Station New bus / rail interchange
D New Panmure Intersection Roundabout replacement, urban realm improvements
E Ellerslie-Panmure Highway Bus, cycle, pedestrian improvements
F New Panmure Bridge Bus, pedestrian and cycle facility
G Reeves Road flyover
H Sylvia Park Bus Interchange and route improvements
I Mt Wellington/South Eastern Improvements
A
El New road
l Busway Stage 1
l Busway Stage 2
l Existing road with improvements
ELLERSLIE-PANMURE HWY
PAKURANGA ROAD
TI RAKAU DRIVE
D
MTWELLINGTON HWY
B
10
One System approach – AMETI
the proposed urban busway on Lagoon Drive, Pakuranga Road, and Ti Rakau Drive. The new bridge will provide a wide shared-use path for improved pedestrian and cycle connections.
Panmure Bus / Rail Interchange: A new interchange between the South Eastern Busway and rail station at Panmure will enable passengers to interchange between bus and rail much more efficiently than currently and will provide a landmark station for Panmure.
New development around the station will help encourage new growth and investment in Panmure town centre.
Busway is responding to growth by providing significant improvements to passenger transport services in this part of Auckland and increasing travel choices for east Auckland.
Accelerated transport solutions: The transport stakeholders in the region will jointly consider mechanisms to accelerate transport solutions in the AMETI package of projects and an East-West Link between AMETI and SH20.
Panmure Bridge: Development of a new bridge for buses, pedestrians and cyclists alongside the existing three-lane vehicle bridge. The new bridge will ensure continuous connectivity of
Figure 3.6: One System approach: AMETI
3.3 WORKING TOGETHER
The primary responsibility for developing, operating and maintaining Auckland’s land transport system lies with three organisations – Auckland Transport, NZTA and KiwiRail. Good progress has been made in adopting a One System approach. Significant agreements have been reached – such as the establishment of the Joint Traffic Operations Centre at Smales Farm to integrate the management of traffic operations across state highways and local roads. Progress to date has been marked by the following agreements:
• Partnering Charter for Transport Operations (NZTA and Auckland Transport) outlining a partnership for joint operation of the road network
• Relationship Plan (NZTA and Auckland Transport) describing how the two organisations will work together.
The three organisations are also working collaboratively with the port and airport companies; and with Northland, Waikato and Bay of Plenty councils as part of the Upper North Island Strategic Alliance.
Auckland Transport is also committed to working with utilities, the Auckland Council and Local Boards to ensure that its activities in the road corridor are closely coordinated with other projects, and to enable opportunities for local improvements, such as town centre rejuvenation projects, to be integrated into project design wherever possible.
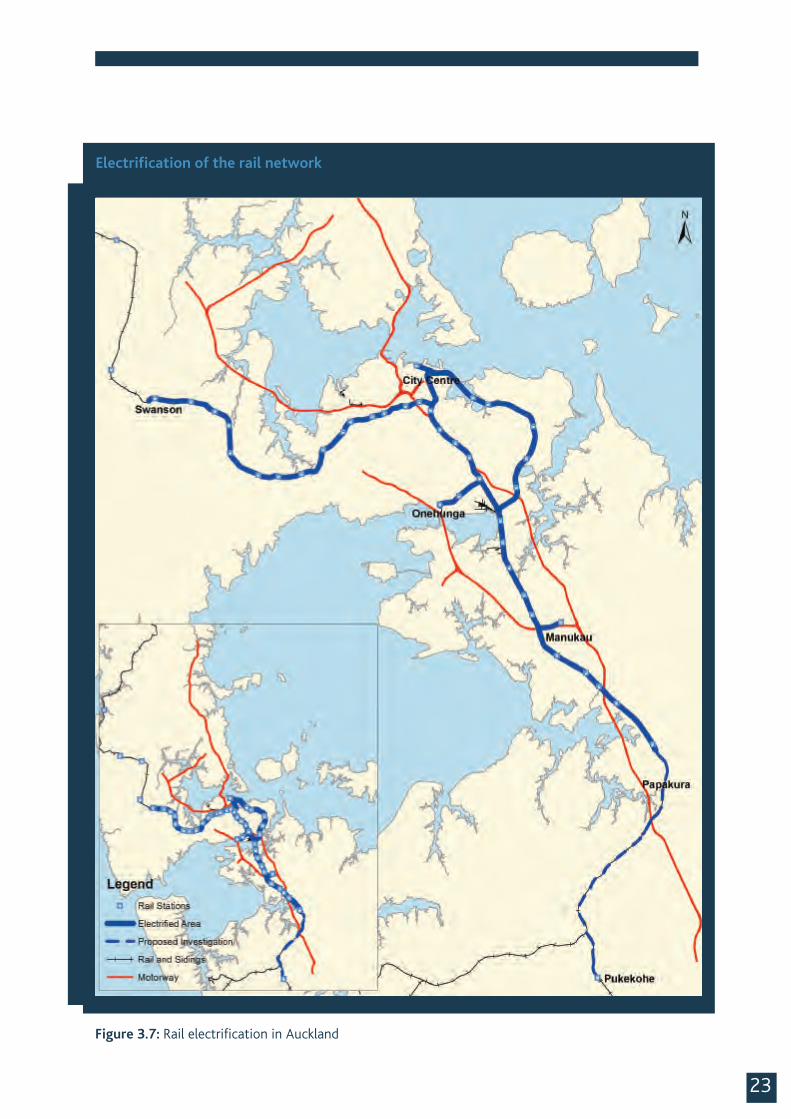
Electrification of the rail network
Figure 3.7 shows the rail network to be electrified. Double tracking the rail network, upgrades to a number of key rail stations, the Onehunga and Manukau rail links, the purchase of electric trains and the electrification of the rail network are underpinning a rail renaissance in Auckland.
These improvements are expected to improve accessibility and allow the road network to move people and goods more efficiently, and with greater reliability.
Panmure roundabout: Replacement of the Panmure roundabout with a new signalised intersection will improve the functionality of the intersection for all road users including pedestrians. Mountain Road will be redirected to Jellicoe Road from the roundabout.
AMETI Link Road: This road will connect Mt Wellington Highway with Morrin Road passing under the Ellerslie-Panmure Highway and Mountain Road. This will reduce vehicle numbers using the roundabout, allowing the roundabout to be replaced with a signalised intersection. In turn, Jellicoe Road will become a quieter local street with enhanced pedestrian connections between the Panmure town centre and rail station. The new link road will also allow for improved freight connections.
Cycling and Walking: Cycling and walking improvements feature in most parts of the AMETI project and will generally be designed to the highest standard. Opportunities for Travel Demand Management measures, including improved school and workplace travel plans, are also being investigated to maximise the benefits bought by the AMETI changes.
Sylvia Park bus lanes: New bus lanes are being provided from Mt Wellington Highway at Sylvia Park Road alongside the rail line and linking into Sylvia Park Shopping Centre. This will better integrate bus services with the rail station and help facilitate further growth of Sylvia Park as a metropolitan centre.
Reeves Road flyover: A new flyover above Reeves Road will connect Pakuranga Highway to the Waipuna Bridge, reducing vehicle travel times by avoiding two sets of signals at the Ti Rakau Drive-Pakuranga Highway intersection and Ti Rakau Drive-South Eastern Arterial intersection. This will allow opportunities for future redevelopment of the Pakuranga Town Centre. These opportunities are being explored by Auckland Council and Auckland Transport in partnership.
222012/15 Regional Land Transport Programme
23
Figure 3.7: Rail electrification in Auckland
Electrification of the rail network
The key areas of investment for the Auckland transport system over the period of this RLTP are listed below.
4.1 SUPPORT GREATER INTEGRATION BETWEEN LAND USE AND TRANSPORT
Integrated transport and land use
Land use/transport integration will involve multimodal projects supporting the development of mixed-use, high-density centres and growth areas identified in the Auckland Plan such as Northern Strategic Growth Area (NorSGA) and Flat Bush. The connection between the transport improvement project programme and new land use areas will be strengthened.
Improved city centre accessibility
The City Centre Masterplan’s vision for Auckland’s city centre is as a world-class economic hub, a visitor draw card and the main regional destination for workers, students and residents that will attract businesses and customers. Improving accessibility to the city
The Land Transport Management Act (LTMA) requires the RLTP to include a statement of transport priorities for the region over the next six years, and to determine the order of priority of all planned activities for the next three years. This has been achieved by developing a prioritisation framework to guide the planned investment in transport in the region, and by evaluating each activity in terms of its strategic fit, effectiveness and efficiency. The resulting prioritisation process is described in Appendix 3.
Areas of priority focus include:
• Support greater integration between land use and transport
• Improve the efficiency and effectiveness of the region’s transport networks
• Make best use of the existing transport system
• Improve transport safety and reduce the adverse impacts from transport on the surrounding environment.
242012/15 Regional Land Transport Programme
Statement of Priorities4
25
centre is crucial to achieving this vision and critical to lifting entire region’s (and therefore the country’s) economic performance.
The City Rail Link has been identified as a key transport priority in the Auckland Plan to significantly improve access to the city centre and support its continued growth and development. Auckland Transport intends to seek a designation to construct and operate the City Rail Link, including acquiring any necessary land over time, and will have financial responsibility for the project.
In addition to progressing the City Rail Link, key investment areas over the next three years are:
• Shared space expansion on Federal Street and Lorne Street
• Streetscape upgrades
• Progressing the boulevarding of Quay Street.
Auckland-Manukau Eastern Transport Initiative, a significant aspect of the RLTP
The first stage of the Auckland-Manukau Eastern Transport Initiative (AMETI) is a significant part of this RLTP. AMETI is a partnership project between the Auckland Council, Auckland Transport, NZTA and KiwiRail that delivers a multi-modal network for the Tamaki coastal edge.
The first stage, AMETI Panmure, delivers increased passenger transport, demand management and economic opportunities for local communities. It includes a road link between Mt Wellington and Tainui Road, replacement of the Panmure roundabout with a new intersection, and progressing a busway along Lagoon Drive.
Corridor protection
Planning and route protection for important future transport corridors and modes is critical in New Zealand’s largest and fastest growing city. In addition to the City Rail Link, corridor protection will be advanced for:
• An additional Waitemata Harbour Crossing for general traffic and public transport
• A dedicated rapid transit corridor between Auckland Airport and the city centre
• Future extensions to the rail network for passengers and freight.
Provision is also needed to enable land purchases to support route protection where necessary.
4.2 IMPROVE THE EFFICIENCY AND EFFECTIVENESS OF THE REGION’S TRANSPORT NETWORKS
Improving Auckland’s public transportOver the past decade significant improvements to Auckland’s public transport network have resulted in substaintial patronage gains, freeing up congested roads for business, freight and other trips that cannot use public transport.
To fulfil transport’s role as a key enabler of the Auckland Plan’s vision, it is imperative that this momentum be maintained. Several key regional links in the public transport network need to be investigated, protected, completed and/or upgraded to improve the performance of passenger transport. It is vital that the development of those projects, which integrate and enhance the system as a whole, is prioritised.
Among the projects in this category are:
• The City Rail Link, which will release capacity at Britomart and improve the penetration of the rail network in the city centre. This will be of benefit to the city centre and to region as a whole, as it will improve the accessibility of the region to the city centre, and stimulate
AUCKLAND 20-YEAR VISION –
ECONOMIC HUB, VISITOR MAGNET,
DYNAMIC WORLD-CLASS CITY.
economic development in the city centre and town centres on the rail network. It will also provide the capacity to enable further improvements to the coverage and frequency of the region’s rail network
• Completing AMETI to enable a step change improvement in passenger services to an area currently with one of the lowest uptakes of public transport in the region
• Strategic park-and-ride facilities to improve accessibility to bus, rail and ferry services
• Progressively rolling out bus priority measures across the network
• Extending passenger ferry facilities, especially within the inner harbour where the demand will justify providing services
• On-going service enhancements to improve the frequency, integration and penetration of public transport services
• Route protection for strategic new links in the RTN including the rail link to the airport.
Completing the state highway networkCompletion of the Waterview section of the Western Ring Route is programmed for 2016. The motorway network will continue to be upgraded, including further capacity improvements to fully complete the Western Ring Route. The pace of motorway development is expected to slightly reduce once the Western Ring Route is in place.
Major projects include upgrading the Auckland Airport access and a new link between SH20, SH1 and East Tamaki. SH1 between Puhoi and Wellsford will be progressively upgraded as part of the government’s Roads of National Significance (RoNS) programme.
Improving Auckland’s arterialsThe arterial network has been well maintained but not sufficiently developed and managed to meet growing travel demands. The full benefits of the investment being made in the motorway network cannot be fully realised unless the arterial network is improved to cater for the additional traffic entering and leaving the motorway network.
In line with the One System approach outlined in Chapter 3, the RLTP includes activities aimed at strengthening the role of the motorway network as the major carrier of through traffic, including freight and commercial trips. This needs to be done in conjunction with upgrading the arterial network to:
• Better cater for shorter distance traffic movement
• Feed traffic onto and accept traffic from the motorway network
• Give priority to public transport, freight and high occupancy vehicles and provide walking/ cycling facilities
• Support higher density town centre development and Auckland Council’s strategic land use objectives.
4.3 MAKE BEST USE OF THE EXISTING TRANSPORT SYSTEM
Further development of public transport
Electrifying the rail network and introducing new electric trains represents a significant milestone. By providing Auckland with a high-quality modern passenger rail network with trains running at 10-minute intervals (or less) during peak periods this investment will bring the existing system up to a first-world level of service and will make the train service in Auckland a viable alternative to thousands more commuters.
The introduction of integrated ticketing using the HOP electronic smart cards will assist in:
• Streamlining the operation of Auckland’s public transport system and facilitating easy, convenient transfers between services and operators
THE WATERVIEW SECTION OF THE
WESTERN RING ROUTE WILL ENABLE
A MOTORWAY CONNECTION TO BE
DEVELOPED BETWEEN ALBANY AND
MANUKAU AS AN ALTERNATIVE TO
STATE HIGHWAY 1.
262012/15 Regional Land Transport Programme
MANY ARTERIALS DO NOT PRESENTLY
FULFIL THEIR FUNCTION IN THE ROAD
NETWORK AS MAJOR MOVERS OF
PEOPLE, GOODS AND SERVICES.
27
• Providing valuable user information to Auckland Transport and the operators for improving the system’s quality and effectiveness.
The key public transport development projects planned for this RLTP cycle include:
• Introducing new electric trains to the Auckland passenger rail network
• Completing the upgrade of Auckland’s train stations
• Route protection, planning and detailed design of the City Rail Link
• Implementation of integrated ticketing across the public transport network
• Comprehensive reviews of bus services in West Auckland, Hibiscus Coast, Papakura/Manurewa/ Great South Road, Mangere and Otara, and the Eastern isthmus, including the establishment of ‘b.lines’ on key arterials (15-minute minimum frequency 7am-7pm weekdays, with higher frequencies during peak periods).
Auckland Transport is currently reviewing its Regional Public Transport Plan. This review will result in a much simplified all-day, seven-days-a-week bus network of fewer routes, generally operating more frequently than currently. The new network will largely remove duplication between services (especially where bus routes duplicate the rail network), but this will require more customers to transfer between connecting services. An integrated fare structure (in addition to integrated ticketing) will need to be introduced so that transfer journeys do not incur a fare penalty. The new network is intended to be introduced over a three-year period, alongside implementing the new nationwide procurement regime known as the Public Transport Operating Model (PTOM).
Auckland Transport is analysing the implications of the network plan review for operational and infrastructure funding, stakeholder engagement and community consultation, marketing and customer information, and transitional issues.
These improvements will free up the motorways and arterial roads for freight, commercial and other trips that cannot use public transport but are essential for the economic and social development of Auckland.
Improving intersections
The on-going initiative to integrate the management of the motorway and arterial networks to optimise their overall effectiveness will be continued. Traffic signals will be coordinated along arterial routes throughout Auckland.
The traffic signal optimisation programme will identify key intersections which are underperforming. A series of intersection improvements will be undertaken to address this issue, enabling additional network capacity at relatively low cost, ensuring value for money and supporting economic growth and productivity and safety outcomes.
Optimising road network performance
In addition to upgrading the arterial road network, optimising its performance is also a key area of focus. This includes a consistent approach to determining the appropriate allocation of scarce road space amongst all road users, including public and private transport, freight and commercial trips, cyclists and pedestrians and ensuring new land use occurs at safe and planned positions.
Maintaining the network
The funding proposals included in this RLTP for maintenance, operations and renewals are based on maintaining the current levels of service being provided by the transport assets of the region, while recognising that areas of higher density and transport demand need to be prioritised ahead of lower volume parts of the network.
Planning for lifecycle asset management
Auckland Transport endeavours to manage the transport network to deliver the agreed levels of service in the most cost-effective and sustainable manner over the life cycle of the assets. The lifecycle management plans that will ensure achieving these objectives are described in the Asset Management Plans for the transport network.
Achieving a balance between planned and reactive maintenance
The operational and maintenance strategy is a balance between planned and reactive maintenance to find the optimal maintenance mix. Asset renewals restore the level of service delivered by an asset to its original level, or close to it, by replacing
or repairing the worn components. The renewal strategy ensures the timing and renewal solutions are right and optimised.
A comprehensive approach is needed
The amalgamation of Auckland’s local road controlling authorities into a single organisation has provided an opportunity for a more comprehensive approach to asset management. A review of service levels, maximising the use of the existing assets and new initiatives in sustainability are some of the areas that will need careful consideration. These opportunities are being explored further in order to incorporate them in the near future into long-term plans.
Enhancing efficiency of the regional freight network
A programme of measures for facilitating the movement of freight by all modes in the region will be developed and implemented in the period following the approval of the Integrated Transport Plan. This will help to reduce congestion for freight movements in key corridors.
282012/15 Regional Land Transport Programme
Key projects that will assist freight traffic include improvements to Neilson Street and arterial route optimisation. Progress on the East-West Link between AMETI and SH20 at Onehunga will also lead to longer-term improvements to freight reliability.
Work currently initiated and progressed by the NZTA, KiwiRail, the Ministry of Transport and the regional councils of Auckland, Northland, Bay of Plenty and Waikato focuses on developing a freight strategy for the upper North Island. A Memorandum of Understanding has been signed by all parties and it is envisaged that future regional freight plans will be consistent with the outcomes proposed in this study.
Identifying high productivity motor vehicle (HPMV) routes
The Vehicle Dimension and Mass (VDM) Rule Amendment which came into force in 2010 introduced a new permit regime for heavy motor vehicles to operate above the maximum mass limit of 44 tonnes when carrying divisible loads on approved routes – high productivity motor vehicles (HPMVs).
Auckland Transport has worked with NZTA and the heavy transport sector to identify heavy transport routes which are likely to be the subject of HPMV permit applications. The approach taken has been to use the state highway network as the backbone of the HPMV network and to identify the necessary linkages on the local network to heavy transport origins and destinations such as ports, quarries, steel mills and other major freight generators and/or attractors. Most of the routes identified are either existing overweight routes or are already carrying significant volumes of heavy vehicles.
Assessments of the structural strength of bridges have been undertaken on most of these routes. This analysis indicates that most of the structures can safely carry heavy vehicles with gross loads of up to 62 tonnes. The appropriateness or otherwise of each specific HPMV application will depend on the actual axle configuration of the vehicle, the proposed gross and axle weights and the economics of the proposal, and will be specific to each application.
Following completion of the structural investigation, the appropriateness of upgrading some of the weaker structures will be considered so as to remove constraints on the network.
Upgrading walking and cycling facilities
Walking and cycling facilities will continue to be upgraded to:
• Improve the ‘walkability’ of the planned high density activity centres and accessibility by bicycle
• Encourage walking and cycling to school
• Further develop the planned regional cycle network for longer distance and recreational travel.
The priority active transport projects planned for this RLTP cycle include (but are not limited to):
• Ensuring travel planning and travel demand management is an integral part of infrastructure projects including the Albany Highway, AMETI and New Lynn
• Cycling infrastructure projects for:
- Rosedale Road in the north
- The Harbour Bridge, the Waterview Connection, Hobson Bay and Beach Road in the central area
- Improving cycling links from the Northwestern Cycleway to the city centre
- AMETI in central and east
- Universal Drive in the west
- Mahia Road, Great South Road, Puhinui Road and Chapel Road in the south
• New footpaths
• City centre pedestrian and cycle improvements
• Continuing school safety travel plans with a focus on road safety and mode share.
Specific funding allocations in this RLTP for footpath and cycleway development and construction total $37.5 million for the 2012-15 period, with a further $80.5 million programmed for years 4-10. In addition, approximately $52 million in walking and cycling improvements will
29
be incorporated into road infrastructure projects over the 2012-15 period, delivering an additional of 52.5km of cycleways, footpaths or shared paths. This includes the construction of 6.8km of shared paths as part of the AMETI project, at a cost of $20 million.
4.4 IMPROVE TRANSPORT SAFETY AND REDUCE THE ADVERSE IMPACTS FROM TRANSPORT ON THE SURROUNDING ENVIRONMENT
Improving road safety
The Auckland Safe System approach requires road designers to take more responsibility for building a safer network by managing crash forces to a level that does not result in death or serious injury. A focus of the 2012/15 Auckland road safety programme therefore is a greater investment in safety engineering on local roads along with a focus on speed management. High-risk routes and locations on the transport network have been prioritised through crash reduction studies for improvements such as:
• Intersection upgrades
• Speed re-zoning
• Lighting and visibility improvements
• Larger demonstration projects, including mixed-use arterials such as Tamaki Drive.
Targeting high-risk users, areas and routes
High-risk communities and road users have also been prioritised for education and enforcement improvements. Specific reductions in crash risk will be targeted at high-risk urban intersections and arterials, high-risk rural roads and state highways. There will also be a special focus on pedestrians, cyclists, motorcyclists, young drivers, drink/drugged driving, older road users and commercial vehicles.
For this RLTP cycle, the key safety activities include:
• Targeting regional and local safety education programmes to reduce crash risk among drink/drug-influenced drivers, young drivers, pedestrians, motorcyclists, cyclists, motorway drivers and high-risk local communities
• Implementing a safety improvements programme on high-risk rural state highways
• Implementing demonstration safety projects on high-risk urban arterials and rural roads
302012/15 Regional Land Transport Programme

31
• Completing Tamaki Drive safety improvements to reduce crash risk
• Increased road policing enforcement and safety improvements at high-risk urban intersections, including use of red light cameras. Developing a safe-system road assessment programme for local roads
• Developing a regional speed management policy for high-risk urban and rural roads
• Implementing an annual crash reduction studies programme at high-risk local road sites
• Implementing safety improvements at high-risk sites and schools for pedestrians and cyclists
• Enhancing enforcement of heavy and commercial vehicle safety.
A number of these activities are the responsibility of the New Zealand Police. Appendix 5 contains an assessment of the relationship of Police activities to this RLTP.
Improving the environmental performance of Auckland’s transport system
A number of initiatives in this programme will assist in improving the environmental performance of Auckland’s transport system, through lower energy use and reduced emissions.
Key activities and projects that will contribute to emissions reduction include:
• Public transport service improvements
• Electrification of the rail network
• Travel demand management measures
• Integrated land use and transport planning
• Provision for walking and cycling activities
• Street light and traffic signal optimisation.
Extending travel demand management programmes
Developing and implementing school and workplace travel plans will prioritise those areas where the potential benefits are highest, e.g. areas with proposed infrastructure improvements close to congested parts of the network.
Parking supply, management and pricing will be better integrated with land use and transport policy to ensure it supports Auckland Council’s master and area plans. Parking ratios for new developments will be standardised and applied consistently.
The Auckland Regional Parking Strategy will be progressively implemented in high-density town centres and corridors accompanied by the development of comprehensive parking management plans to better integrate parking supply and management with broader land use and transport policy objectives.

4.5 HOW THE PRIORITY FOCUS AREAS ARE USED TO RANK PROJECTS AND ACTIVITIES
The four priority focus areas discussed above are used as the basis of Auckland Transport’s prioritisation and project ranking system.
First, all projects and activities which are already committed to by contract or planning agreement, existing bus, train and rail services and essential maintenance and renewals are given highest priority for available funding.
Remaining activities are then ranked based on three criteria: strategic fit, effectiveness and economic efficiency.
• The strategic fit of the issue or problem being addressed – is this issue identified considered of high significance by the priority focus areas?
• The effectiveness of the proposed solution in addressing the issue identified and in delivering priority focus areas
• The economic efficiency (or benefit/cost ratio) of the proposed solution.
Each project is rated High, Medium or Low (H, M or L) for each of the three factors resulting in a profile (e.g. HHM).
There are often other factors that influence project timing, including interdependencies with other actions that make implementation urgent, or opportunities to work more efficiently by combining activities. These factors are considered during the programming of projects over the three-year period.
Auckland Transport’s prioritisation layers
The prioritisation layering system is summarised below to create a programme of Auckland Transport’s projects. The system is outlined in more detail in Appendix 3 Prioritisation Process.
322012/15 Regional Land Transport Programme
Auckland Transport’s prioritisation layers
Meet legal requirements
Support and enable Auckland Plan
Optimise available NZTA funds
Balance contract size and location
Integrate with other work (e.g. KiwiRail electrification, NZTA Waterview)
Special interest requirements
Priority rating index: • Strategic fit • Transport effectiveness • Economic efficiency
• Multiple requests
33
2012/15 Programme Overview5

5.1 MAJOR PROJECTS
The following table summarises the major transport projects planned for the current RLTP cycle.
Project Description
Electrification of Auckland’s rail network and purchase of electric trains
Electrification of Auckland’s rail system is under way. A modern electrified rail system has significant performance advantages over the current and even new diesel systems for urban rail operations, including better acceleration between stations and the ability to operate high-frequency trains through tunnels. In addition, electric trains provide environmental benefits such as improved air quality and reduced noise and air vibration, so they are compatible with the intensified development along rail corridors envisaged by the Auckland Plan. Electrification will enable fast, reliable journeys at 10-minute frequencies and is expected to attract 17 million passengers to rail by 2016. It will also future-proof the Auckland rail network and enable the development of the City Rail Link. Auckland Transport will continue to work with KiwiRail to ensure delivery of this project, critical for the continued growth of Auckland. Auckland Transport has signed a contract with CAF (Spanish train manufacturer) to provide Auckland with a new fleet of electric trains.
City Rail Link The decision to electrify the rail network has allowed work to begin on route protection, planning and detailed design of the City Rail Link, an underground connection between Britomart and the Western Line at Mt Eden.
The City Rail Link is the highest transport priority in the Auckland Plan, and its benefits will extend well beyond the city centre. It will allow higher train frequencies across the entire rail network, as well as providing new stations in the heart of the city centre and future extensions to an electrified network such as to the airport. Overall, this project will increase the accessibility of the city centre, New Zealand’s largest concentration of economic activity, to more than half a million people within 30 minutes’ travel time by rail, which is completely free of road congestion. This will release substantial economic benefits for Auckland’s city centre and growth centres.
The City Rail Link is a significant project for which funding will be required from beyond the usual land transport sources. It is not intended that the City Rail Link be funded through the National Land Transport Fund, and a government share, if any, is expected to be from separate Crown funding.
Integrated Ticketing The implementation of an integrated ticketing system will be completed early in this RLTP cycle, allowing public transport users to access all services across different modes and providers using the same ticket. This will be accompanied by a simplified fare system that will make travel around Auckland easier.
Western Ring Route The completion of the SH20 Waterview Connection will provide a complete alternative to State Highway 1 from Manukau through to Albany. The 5.5km Waterview project is for a combined tunnel and surface option, which is being developed as a Road of National Significance (RoNS) and funded through the current transport budget at about $1.4b. The completion of the Western Ring Route will improve transport links for Aucklanders and businesses and provide more reliable travel times to Auckland Airport.
342012/15 Regional Land Transport Programme
35
Project Description
AMETI – The Auckland-Manukau Eastern Transport Initiative
AMETI is a major project that will deliver increased passenger transport, demand management and economic development opportunities for the south-east metropolitan Auckland region. The first stage of the project will include the Panmure Transport Plan to support business and residential growth planned for Glen Innes, Panmure, Mt Wellington and Sylvia Park. This will be achieved by improving roads, bus lanes, walking and cycling, the addition of a pedestrian/cycle lane on the Panmure Bridge, and improvements from Panmure through to Pakuranga and along Ti Rakau Drive, including a dedicated busway that will form part of Auckland’s Rapid Transit Network.
Planning will also be advanced on a new East-West Link that will provide a strategic connection between AMETI and the Western Ring Route (SH20) at Onehunga. It will provide improved freight access to the rail freight hub at Metroport, and major employment areas such as East Tamaki and Penrose.
Other arterial road upgrades
In addition to AMETI, improvements are planned for the following arterial roads:
• Dominion Road
• Tiverton/Wolverton Street
• Albany Highway
• Redoubt Road/Mill Road.
Walking and cycling projects
Key projects over the next three years will provide for dedicated walking and cycling facilities including the Central Motorway Junction/SH16, Beach Road in the city centre and the Waterview connection. Continued development of the key regional cycle network links are also provided for along arterial roads including Rosedale Road, connections to public transport interchanges in Manukau and feeder or greenway links connecting parks and residential streets including the Domain.
Land Use/transport integration
Projects to facilitate planned growth in new development areas to give effect to the Auckland Plan. This includes projects that support mixed-use development in new areas such as Hobsonville, Massey North and Flat Bush.
Passenger Transport Service Improvements
Alongside the Integrated Ticketing and City Rail Link progress, Passenger Transport Service improvements will be implemented. Fare reviews to align with the Nationally adopted Public Transport Operating Model (PTOM), route optimisation to increase service frequency and deliver regionally consistent services and simplified passenger transport network removing duplicate services, thus delivering value for money with a fully integrated public transport network.
Network Optimisation
Continue the implementation of an optimised transport network. This involves a regional and consistent approach to traffic signal optimisation, implementing High Productivity Motor Vehicle routes, providing real time information for both road users and public transport users, integrating regional arterial networks with the State Highway network (a One System approach).
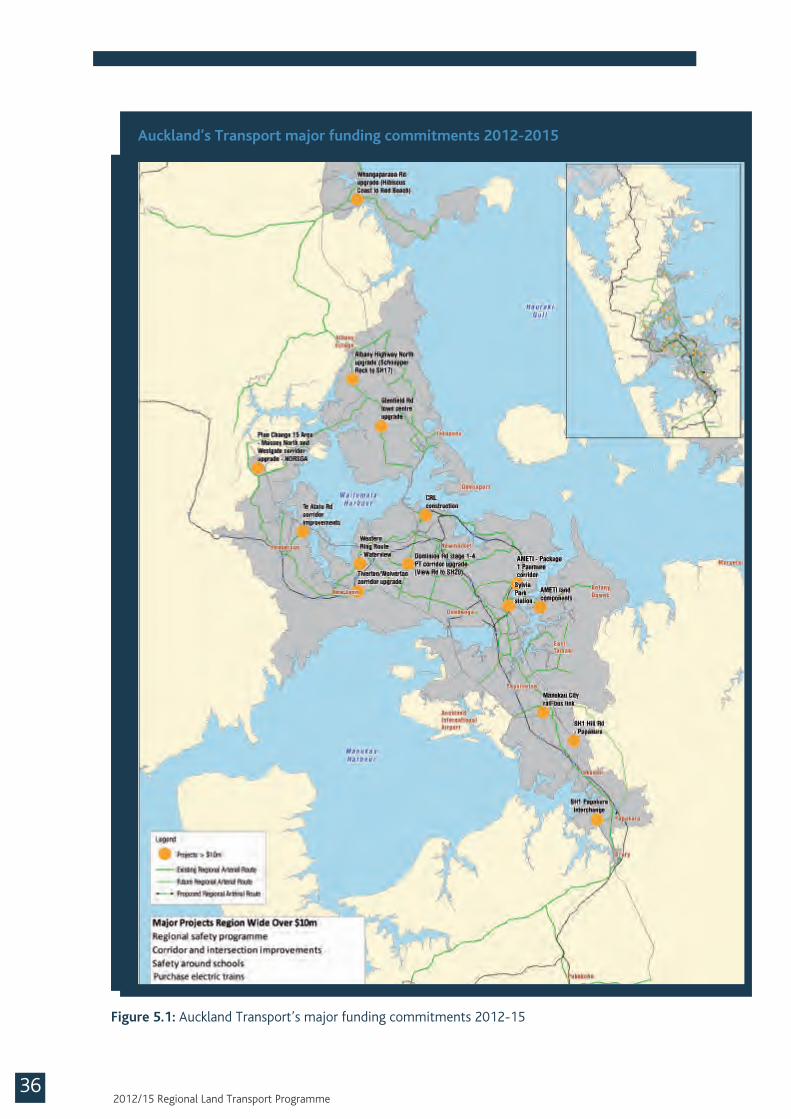
Figure 5.1: Auckland Transport’s major funding commitments 2012-15
Auckland’s Transport major funding commitments 2012-2015
362012/15 Regional Land Transport Programme
37
5.2 ACTIVITIES OF INTER-REGIONAL SIGNIFICANCE
The following activities included in this RLTP are considered to be of inter-regional significance:
• Routes for HPMVs to facilitate freight flows between Auckland and other regions, particularly in the upper North Island
• Developing the Puhoi to Wellsford state highway as a RoNS, linking Auckland and Northland
• Maintaining and developing rail links to other regions, including investigating the future role of rail to Northland.
Although outside the Auckland region, the continued development of the Waikato Expressway is also an important project that will have a significant impact on the economic performance of Auckland and the upper North Island.
5.3 FUTURE ACTIVITIES OF NATIONAL OR REGIONAL SIGNIFICANCE 2015/16 to 2017/18
The Land Transport Management Act requires the RLTP to provide an indication of any nationally or regionally significant activities that are likely to be recommended for inclusion in
the National Land Transport Programme (NLTP) over the three financial years following this RLTP period (i.e. 2015/16 to 2017/18). The following activities, which, subject to funding availability, are likely to be recommended for inclusion in the 2015/16 to 2017/18 period are:
• The City Rail Link
• Puhoi to Wellsford motorway connection
• Additional Waitemata Harbour Crossing (investigation)
• Advanced Traffic Management Systems Stage V (HNO)
• Further development of cycleways along state highway corridors
• Busway extension Albany to Hibiscus Coast (designation)
• South-west airport multi-modal corridor (early stages only)
• Southdown to Avondale rail corridor
• Botany to Manukau RTN (investigation)
• Henderson to Albany RTN (investigation)
• Red light camera installation
• Mill Road.
The Auckland Plan’s priority transport projects for 2011-41 are illustrated in Figure 5.2.

Figure 5.2: Auckland Plan’s priority transport projects 2011-2041
Auckland’s priority transport projects 2011-2041
382012/15 Regional Land Transport Programme
39
6.1 OVERVIEW
Indications are that between $1.7 and $2.4 billion per year will be required over the next 10 years to fund the activities put forward in this RLTP and address the various challenges identified in the Auckland Plan.
At present, transport activities in Auckland are funded from the Auckland Council (in line with its Long-term Plan), NZTA funding from the National Land Transport Fund (NLTF), separate Crown funding for rail investment, and direct user charges (e.g. parking revenues and public transport fares).
Current funding arrangements are insufficient
The current policy framework of the Auckland Plan and the RLTS outlines an aspirational vision and includes a number of significant transport investments for Auckland which will clearly not be easily achieved within current funding arrangements.
THE FUNDING LEVELS AVAILABLE
THROUGH CURRENT SOURCES WILL NOT
BE SUFFICIENT TO ENABLE THE ENTIRE
PROGRAMME TO BE FUNDED.
THE FUNDING GAP IS LIKELY TO BE
PARTICULARLY SEVERE FOR PUBLIC
TRANSPORT INFRASTRUCTURE AND
LOCAL ROAD INFRASTRUCTURE.
Funding Plan6

Planning and collaboration are vital
While there will continue to be pressure on funding to deliver all the projects required, the region must be able to fund the right projects at the right time. This will require careful strategic planning, clear prioritisation and a high level of agreement between Central Government and Auckland as a whole.
The funding base needs expanding
While the focus of this programme is on setting priorities for how the existing funding via the NLTP should be allocated, Auckland Transport will support opportunities to broaden the funding base for transport, to enable the region’s strategic priorities to be progressed within a reasonable timeframe.
This chapter presents an analysis of the funding requirements arising from this programme, an outline of the funding challenges facing Auckland Transport, and a summary of alternative funding options that could be explored.
6.2 FUNDING REQUIREMENTS
The RLTP provides details of Auckland’s funding applications to the National Land Transport Fund (NLTF) for the 2012/13, 2013/14 and 2014/15 years. The RLTP recognises that funding from the NLTF and Auckland Council is constrained and that not all eligible projects identified in the programme will receive funding from these sources.
The main points emerging from Figure 6.1 Forecast funding requirements 2012/13 to 2021/22 are outlined below:
• Spending on new and improved state highway infrastructure continues to remain significant. This is subject to NZTA
Forecast funding requirements for the activities in this RLTP over the next 10 years
Figure 6.1 Forecast funding requirements 2012/13 to 2021/22
402012/15 Regional Land Transport Programme
THE AFFORDABILITY OF THE OVERALL
RLTP WILL BE DETERMINED BY OUR
ABILITY TO ACCESS ALTERNATIVE
FUNDING FOR THE NON-FUNDED
ASPECTS OF THE PROGRAMME.
0
500
1000
1500
2000
2500
13 14 15 16 17 18 19 20 21 22
Fund
ing
($m
)
Financial Year
City Rail Link
Infrastructure State Highways
Maintenance & Renewal State Highways
Infrastructure Local Roads
Maintenance & Renewal Local Roads
PT Infrastructure
PT Services including electric trains
Walking & Cycling
Road Safety Promotions
Transport Planning
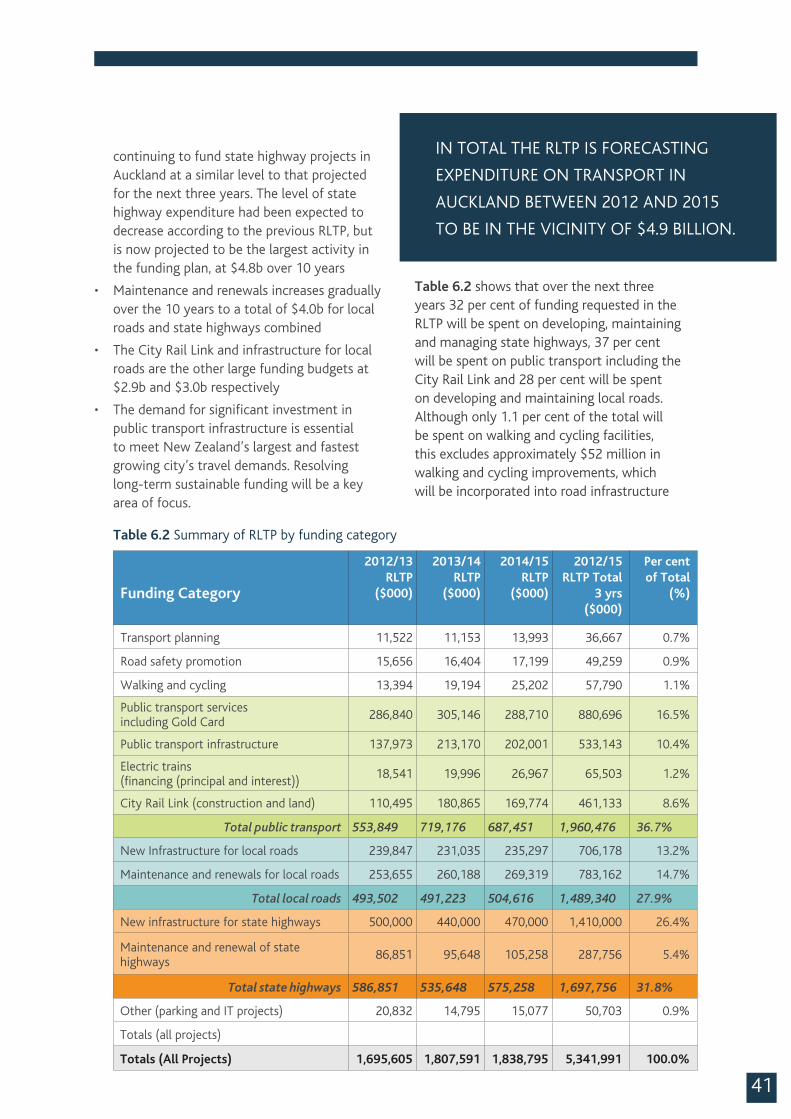
41
Funding Category
2012/13 RLTP
($000)
2013/14 RLTP
($000)
2014/15 RLTP
($000)
2012/15 RLTP Total
3 yrs ($000)
Per cent of Total
(%)
Transport planning 11,522 11,153 13,993 36,667 0.7%
Road safety promotion 15,656 16,404 17,199 49,259 0.9%
Walking and cycling 13,394 19,194 25,202 57,790 1.1%
Public transport services including Gold Card
286,840 305,146 288,710 880,696 16.5%
Public transport infrastructure 137,973 213,170 202,001 533,143 10.4%
Electric trains (financing (principal and interest))
18,541 19,996 26,967 65,503 1.2%
City Rail Link (construction and land) 110,495 180,865 169,774 461,133 8.6%
Total public transport 553,849 719,176 687,451 1,960,476 36.7%
New Infrastructure for local roads 239,847 231,035 235,297 706,178 13.2%
Maintenance and renewals for local roads 253,655 260,188 269,319 783,162 14.7%
Total local roads 493,502 491,223 504,616 1,489,340 27.9%
New infrastructure for state highways 500,000 440,000 470,000 1,410,000 26.4%
Maintenance and renewal of state highways
86,851 95,648 105,258 287,756 5.4%
Total state highways 586,851 535,648 575,258 1,697,756 31.8%
Other (parking and IT projects) 20,832 14,795 15,077 50,703 0.9%
Totals (all projects)
Totals (All Projects) 1,695,605 1,807,591 1,838,795 5,341,991 100.0%
continuing to fund state highway projects in Auckland at a similar level to that projected for the next three years. The level of state highway expenditure had been expected to decrease according to the previous RLTP, but is now projected to be the largest activity in the funding plan, at $4.8b over 10 years
• Maintenance and renewals increases gradually over the 10 years to a total of $4.0b for local roads and state highways combined
• The City Rail Link and infrastructure for local roads are the other large funding budgets at $2.9b and $3.0b respectively
• The demand for significant investment in public transport infrastructure is essential to meet New Zealand’s largest and fastest growing city’s travel demands. Resolving long-term sustainable funding will be a key area of focus.
IN TOTAL THE RLTP IS FORECASTING
EXPENDITURE ON TRANSPORT IN
AUCKLAND BETWEEN 2012 AND 2015
TO BE IN THE VICINITY OF $4.9 BILLION.
Table 6.2 shows that over the next three years 32 per cent of funding requested in the RLTP will be spent on developing, maintaining and managing state highways, 37 per cent will be spent on public transport including the City Rail Link and 28 per cent will be spent on developing and maintaining local roads. Although only 1.1 per cent of the total will be spent on walking and cycling facilities, this excludes approximately $52 million in walking and cycling improvements, which will be incorporated into road infrastructure
Table 6.2 Summary of RLTP by funding category
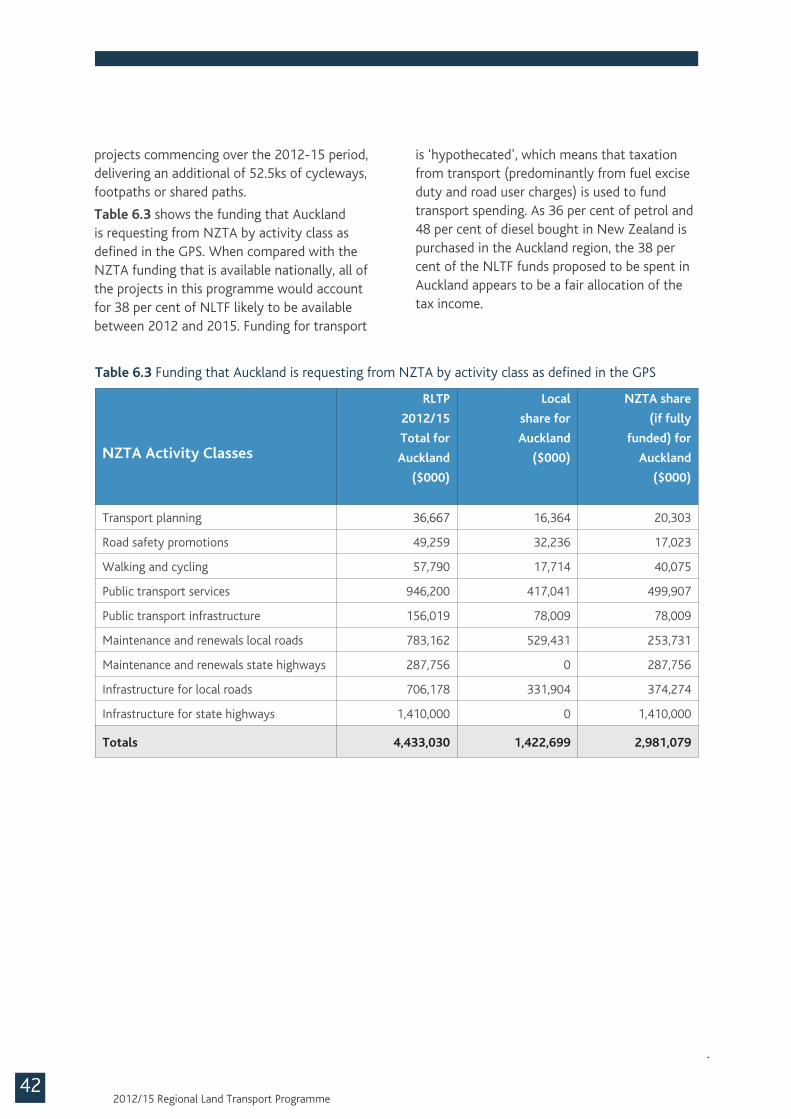
NZTA Activity Classes
RLTP
2012/15
Total for
Auckland
($000)
Local
share for
Auckland
($000)
NZTA share
(if fully
funded) for
Auckland
($000)
Transport planning 36,667 16,364 20,303
Road safety promotions 49,259 32,236 17,023
Walking and cycling 57,790 17,714 40,075
Public transport services 946,200 417,041 499,907
Public transport infrastructure 156,019 78,009 78,009
Maintenance and renewals local roads 783,162 529,431 253,731
Maintenance and renewals state highways 287,756 0 287,756
Infrastructure for local roads 706,178 331,904 374,274
Infrastructure for state highways 1,410,000 0 1,410,000
Totals 4,433,030 1,422,699 2,981,079
Table 6.3 Funding that Auckland is requesting from NZTA by activity class as defined in the GPS
projects commencing over the 2012-15 period, delivering an additional of 52.5ks of cycleways, footpaths or shared paths.
Table 6.3 shows the funding that Auckland is requesting from NZTA by activity class as defined in the GPS. When compared with the NZTA funding that is available nationally, all of the projects in this programme would account for 38 per cent of NLTF likely to be available between 2012 and 2015. Funding for transport
is ‘hypothecated’, which means that taxation from transport (predominantly from fuel excise duty and road user charges) is used to fund transport spending. As 36 per cent of petrol and 48 per cent of diesel bought in New Zealand is purchased in the Auckland region, the 38 per cent of the NLTF funds proposed to be spent in Auckland appears to be a fair allocation of the tax income.
422012/15 Regional Land Transport Programme
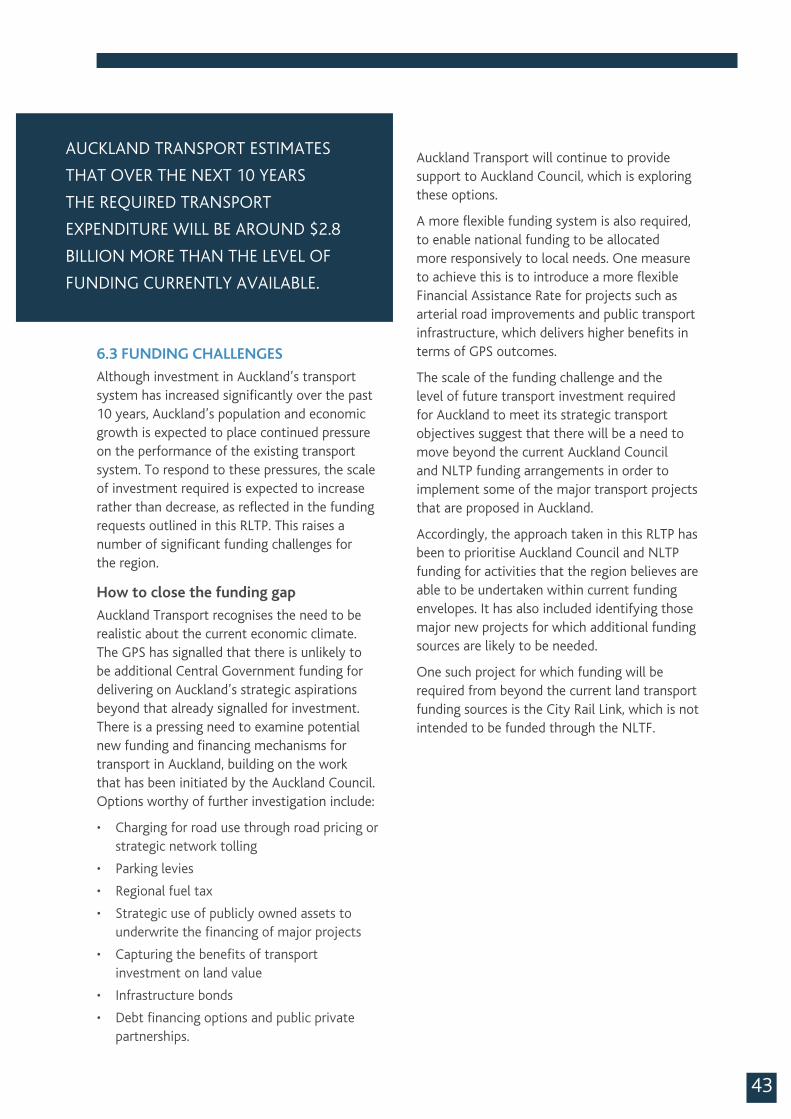
43
6.3 FUNDING CHALLENGES
Although investment in Auckland’s transport system has increased significantly over the past 10 years, Auckland’s population and economic growth is expected to place continued pressure on the performance of the existing transport system. To respond to these pressures, the scale of investment required is expected to increase rather than decrease, as reflected in the funding requests outlined in this RLTP. This raises a number of significant funding challenges for the region.
How to close the funding gap
Auckland Transport recognises the need to be realistic about the current economic climate. The GPS has signalled that there is unlikely to be additional Central Government funding for delivering on Auckland’s strategic aspirations beyond that already signalled for investment. There is a pressing need to examine potential new funding and financing mechanisms for transport in Auckland, building on the work that has been initiated by the Auckland Council. Options worthy of further investigation include:
• Charging for road use through road pricing or strategic network tolling
• Parking levies
• Regional fuel tax
• Strategic use of publicly owned assets to underwrite the financing of major projects
• Capturing the benefits of transport investment on land value
• Infrastructure bonds
• Debt financing options and public private partnerships.
Auckland Transport will continue to provide support to Auckland Council, which is exploring these options.
A more flexible funding system is also required, to enable national funding to be allocated more responsively to local needs. One measure to achieve this is to introduce a more flexible Financial Assistance Rate for projects such as arterial road improvements and public transport infrastructure, which delivers higher benefits in terms of GPS outcomes.
The scale of the funding challenge and the level of future transport investment required for Auckland to meet its strategic transport objectives suggest that there will be a need to move beyond the current Auckland Council and NLTP funding arrangements in order to implement some of the major transport projects that are proposed in Auckland.
Accordingly, the approach taken in this RLTP has been to prioritise Auckland Council and NLTP funding for activities that the region believes are able to be undertaken within current funding envelopes. It has also included identifying those major new projects for which additional funding sources are likely to be needed.
One such project for which funding will be required from beyond the current land transport funding sources is the City Rail Link, which is not intended to be funded through the NLTF.
AUCKLAND TRANSPORT ESTIMATES
THAT OVER THE NEXT 10 YEARS
THE REQUIRED TRANSPORT
EXPENDITURE WILL BE AROUND $2.8
BILLION MORE THAN THE LEVEL OF
FUNDING CURRENTLY AVAILABLE.
the RLTP provides a prioritised list of all the agreed transport activities and projects with the funding available for the first three years of the implementation strategy. The evaluation of the outcomes achieved from a specific project will be undertaken by Auckland Transport in accordance with the monitoring framework to be outlined in the forthcoming ITP and assessed against the outcomes set in the Auckland Plan, Government Policy Statement and Auckland Transport’s Statement of Intent. A schematic representation of the framework and the outcomes to be achieved from monitoring and evaluation is provided in Figure 7.1 below.
Monitoring of the implementation of the RLTP does not indicate whether the funding is actually achieving the targets set in the Auckland Plan. It only provides the input that is necessary to enable Auckland Transport to determine the extent to which the funded programme has been delivered. The ITP will develop a series of key performance indicators (KPIs), which will measure changes in transport system performance as a result of the investment. Further information on how these KPIs will be used for evaluation purposes can be found in the ITP, which will be published shortly after the RLTP.
The responsibility for implementing the RLTP falls on a number of different agencies, including Auckland Transport, Auckland Council, and the Highway and Network Operations department of the NZTA. A key role for Auckland Transport will be to coordinate the actions of these organisations and to review progress towards implementing the activities outlined in this RLTP.
The RLTP supports the forthcoming Auckland Integrated Transport Plan (ITP) in that it provides the programme of activities and projects that will be funded in the coming planning period. Defining what will be monitored and evaluated in each of the two is therefore essential to avoid duplication. The Organisation for Economic Coorperation and Development (OECD) defines performance monitoring as “the continuous process of collecting and analysing data to compare how well a project, program, or policy is being implemented against expected results”. Evaluation, on the other hand, is defined as the “judgement of interventions according to their results, impacts and needs they aim to satisfy”. In contrast to performance monitoring, evaluation is concerned with assessments of the success or failure of specific programmes and projects in achieving their stated goals.
The ITP will define the broad transport implementation strategy for the region while
442012/15 Regional Land Transport Programme
Monitoring and Review7
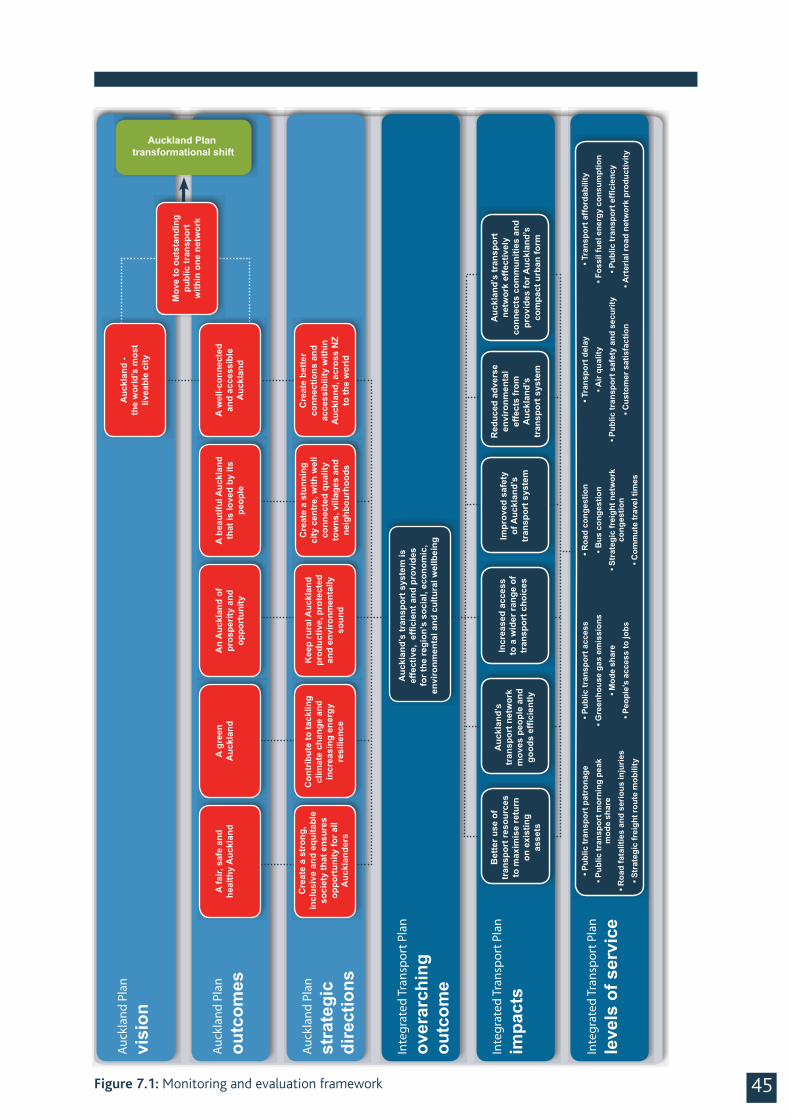
45Figure 7.1: Monitoring and evaluation framework
Auck
land
Pla
n ou
tcom
es
Auck
land
Pla
n st
rate
gic
di
rect
ions
Inte
grat
ed T
rans
port
Pla
n ov
erar
chin
g
outc
ome
Auck
land
Pla
n vi
sion
Auckland Plan transformational shift
Mov
e to
out
stan
ding
pu
blic
tran
spor
t w
ithin
one
net
wor
k
Inte
grat
ed T
rans
port
Pla
n im
pact
s
Inte
grat
ed T
rans
port
Pla
n le
vels
of s
ervi
ce
Cre
ate
bette
r co
nnec
tions
and
ac
cess
ibili
ty w
ithin
A
uckl
and,
acr
oss
NZ
to
the
wor
ld
Auc
klan
d -
the
wor
ld’s
mos
tliv
eabl
e ci
ty
A be
autif
ul A
uckl
and
that
is lo
ved
by it
s pe
ople
Cre
ate
a st
unni
ng
city
cen
tre,
with
wel
l co
nnec
ted
qual
ity
tow
ns, v
illag
es a
nd
neig
hbou
rhoo
ds
An
Auc
klan
d of
pr
ospe
rity
and
oppo
rtun
ity
Kee
p ru
ral A
uckl
and
prod
uctiv
e, p
rote
cted
an
d en
viro
nmen
tally
so
und
A gr
een
A
uckl
and
Con
trib
ute
to ta
cklin
g cl
imat
e ch
ange
and
in
crea
sing
ene
rgy
resi
lienc
e
A fa
ir, s
afe
and
heal
thy
Auc
klan
d
Cre
ate
a st
rong
, in
clus
ive
and
equi
tabl
e so
ciet
y th
at e
nsur
es
oppo
rtun
ity fo
r all
Auc
klan
ders
A w
ell-c
onne
cted
an
d ac
cess
ible
A
uckl
and
Auc
klan
d’s
tran
spor
t sys
tem
is
for t
he re
gion
’s s
ocia
l, ec
onom
ic,
envi
ronm
enta
l and
cul
tura
l wel
lbei
ng
Bet
ter u
se o
f tr
ansp
ort r
esou
rces
to
max
imis
e re
turn
on
exi
stin
g as
sets
Incr
ease
d ac
cess
to
a w
ider
rang
e of
tr
ansp
ort c
hoic
es
Impr
oved
saf
ety
of
Auc
klan
d’s
tran
spor
t sys
tem
Red
uced
adv
erse
en
viro
nmen
tal
effe
cts
from
A
uckl
and’
s tr
ansp
ort s
yste
m
Auc
klan
d’s
tran
spor
t ne
twor
k ef
fect
ivel
y co
nnec
ts c
omm
uniti
es a
nd
prov
ides
for A
uckl
and’
s co
mpa
ct u
rban
form
• Pub
lic tr
ansp
ort p
atro
nage
• Pub
lic tr
ansp
ort m
orni
ng p
eak
mod
e sh
are
• Roa
d fa
talit
ies
and
serio
us in
jurie
s• S
trat
egic
frei
ght r
oute
mob
ility
• Pub
lic tr
ansp
ort a
cces
s• G
reen
hous
e ga
s em
issi
ons
• Mod
e sh
are
• Peo
ple’
s ac
cess
to jo
bs
• Roa
d co
nges
tion
• Bus
con
gest
ion
• Str
ateg
ic fr
eigh
t net
wor
k co
nges
tion
• Com
mut
e tr
avel
tim
es
• Tra
nspo
rt d
elay
• Air
qual
ity• P
ublic
tran
spor
t saf
ety
and
secu
rity
• Cus
tom
er s
atis
fact
ion
• Tra
nspo
rt a
fford
abili
ty• F
ossi
l fue
l ene
rgy
cons
umpt
ion
• Art
eria
l roa
d ne
twor
k pr
oduc
tivity
Auc
klan
d’s
tr
ansp
ort n
etw
ork
mov
es p
eopl
e an
d
Phase: refers to the stage of development: Invest. = Investigation Des. = Design Const. = Construction Land Purch. = Land Purchase
Phase cost ($) 2012/13, 2013/14, 2014/15:
This is the amount of money being requested for the identified activity and phase for that particular year in the RLTP. In the instances where the cell is blank or contains a zero, no amount of money was indicated.
Year 4-10 cost: The amount of money being requested for all phases in years 4 to 10 of the RLTP. The accumulation of the total 3 year phase costs and the year 4-10 costs equals the total 10-year cost.
Profile: The prioritisation profile assigned to the activity based on AT’s prioritisation process (refer to Appendix 3).
The first letter represents the project’s strategic fit
The second letter represents the project’s effectiveness
The third letter represents the project’s efficiency
Together the three letters create the profile High = H Medium = M Low = LSome of the activities listed in the tables (for example, footpath and cycleway development, and road renewals, maintenance and operations) provide for a single region-wide funding allocation that covers a large number of individual projects. The detailed allocations for these activity classes will be published as part of the annual budgets for Auckland Transport.
The following tables show the funding requests for the Auckland Regional Land Transport Programme 2012-15.
Not all the activities shown in the detailed tables are expected to receive subsidy from NZTA. However, (apart from KiwiRail’s activities) it is a programme of all land transport projects and activities that are proposed to be carried out in Auckland over the next three years.
The RLTP represents Auckland’s bid to NZTA for transport funding. NZTA will consider whether to include Auckland Transport’s activities in the National Land Transport Programme. Auckland Transport has estimated the funding it will receive from NZTA in its budget, however this funding cannot be guaranteed and must applied for in individual detailed applications. Consequently, there are no financial implications of this RLTP, however when detailed applications for funding are made and the NZTA decides whether to support individual applications for subsidy, there are significant financial implications.
Where the efficiency (benefit / cost ratio) of a project has not been progressed or included in the application, an approximation of the likely Benefit to Cost Ratio (BCR) has been considered. When further knowledge becomes available it is likely that the profile and therefore regional priority of the project will change.
The tables (and headings) below use the following abbreviations and terms:Approved organisations
Auckland Transport – AT Auckland Council – AC NZTA Highway and Network Operations (state
highways) – HNO
462012/15 Regional Land Transport Programme
Detailed Funding Requests8
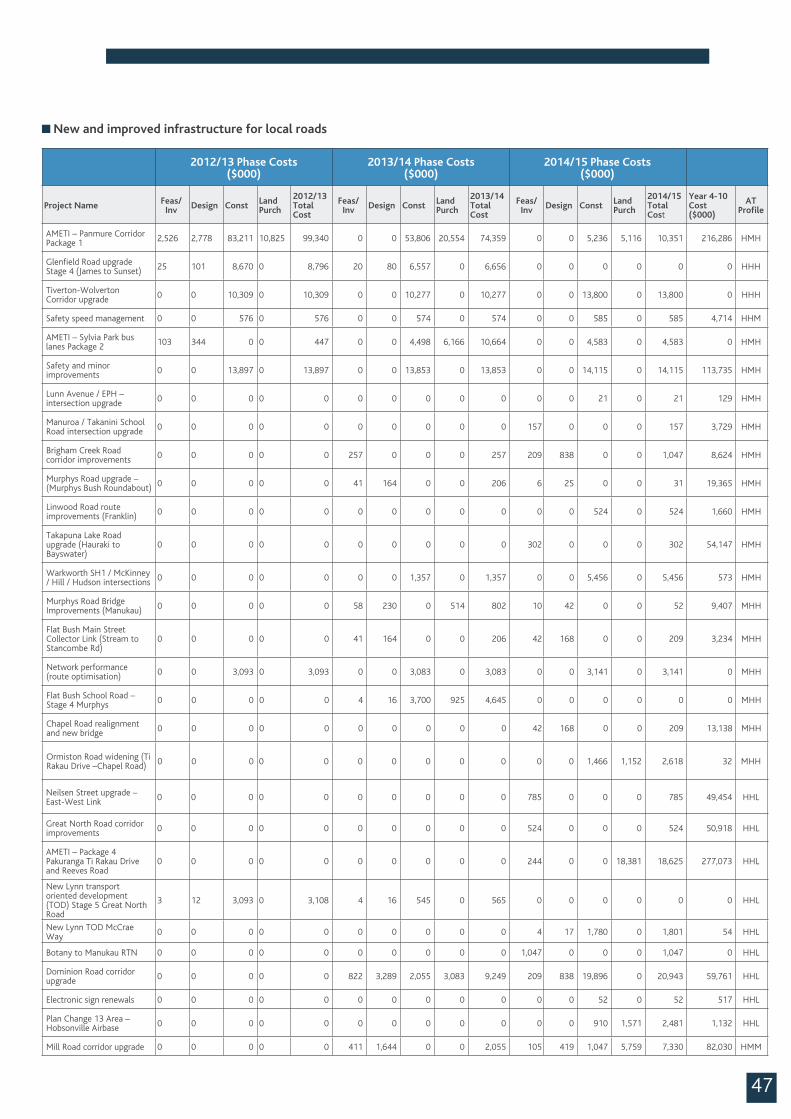
47
2012/13 Phase Costs ($000)
2013/14 Phase Costs ($000)
2014/15 Phase Costs ($000)
Project Name Feas/Inv Design Const Land
Purch
2012/13 Total Cost
Feas/Inv Design Const Land
Purch
2013/14 Total Cost
Feas/Inv Design Const Land
Purch
2014/15 Total Cost
Year 4-10 Cost ($000)
AT Profile
AMETI – Panmure Corridor Package 1 2,526 2,778 83,211 10,825 99,340 0 0 53,806 20,554 74,359 0 0 5,236 5,116 10,351 216,286 HMH
Glenfield Road upgrade Stage 4 (James to Sunset) 25 101 8,670 0 8,796 20 80 6,557 0 6,656 0 0 0 0 0 0 HHH
Tiverton-Wolverton Corridor upgrade 0 0 10,309 0 10,309 0 0 10,277 0 10,277 0 0 13,800 0 13,800 0 HHH
Safety speed management 0 0 576 0 576 0 0 574 0 574 0 0 585 0 585 4,714 HHM
AMETI – Sylvia Park bus lanes Package 2 103 344 0 0 447 0 0 4,498 6,166 10,664 0 0 4,583 0 4,583 0 HMH
Safety and minor improvements 0 0 13,897 0 13,897 0 0 13,853 0 13,853 0 0 14,115 0 14,115 113,735 HMH
Lunn Avenue / EPH – intersection upgrade 0 0 0 0 0 0 0 0 0 0 0 0 21 0 21 129 HMH
Manuroa / Takanini School Road intersection upgrade 0 0 0 0 0 0 0 0 0 0 157 0 0 0 157 3,729 HMH
Brigham Creek Road corridor improvements 0 0 0 0 0 257 0 0 0 257 209 838 0 0 1,047 8,624 HMH
Murphys Road upgrade – (Murphys Bush Roundabout) 0 0 0 0 0 41 164 0 0 206 6 25 0 0 31 19,365 HMH
Linwood Road route improvements (Franklin) 0 0 0 0 0 0 0 0 0 0 0 0 524 0 524 1,660 HMH
Takapuna Lake Road upgrade (Hauraki to Bayswater)
0 0 0 0 0 0 0 0 0 0 302 0 0 0 302 54,147 HMH
Warkworth SH1 / McKinney / Hill / Hudson intersections 0 0 0 0 0 0 0 1,357 0 1,357 0 0 5,456 0 5,456 573 HMH
Murphys Road Bridge Improvements (Manukau) 0 0 0 0 0 58 230 0 514 802 10 42 0 0 52 9,407 MHH
Flat Bush Main Street Collector Link (Stream to Stancombe Rd)
0 0 0 0 0 41 164 0 0 206 42 168 0 0 209 3,234 MHH
Network performance (route optimisation) 0 0 3,093 0 3,093 0 0 3,083 0 3,083 0 0 3,141 0 3,141 0 MHH
Flat Bush School Road – Stage 4 Murphys 0 0 0 0 0 4 16 3,700 925 4,645 0 0 0 0 0 0 MHH
Chapel Road realignment and new bridge 0 0 0 0 0 0 0 0 0 0 42 168 0 0 209 13,138 MHH
Ormiston Road widening (Ti Rakau Drive –Chapel Road) 0 0 0 0 0 0 0 0 0 0 0 0 1,466 1,152 2,618 32 MHH
Neilsen Street upgrade – East-West Link 0 0 0 0 0 0 0 0 0 0 785 0 0 0 785 49,454 HHL
Great North Road corridor improvements 0 0 0 0 0 0 0 0 0 0 524 0 0 0 524 50,918 HHL
AMETI – Package 4 Pakuranga Ti Rakau Drive and Reeves Road
0 0 0 0 0 0 0 0 0 0 244 0 0 18,381 18,625 277,073 HHL
New Lynn transport oriented development (TOD) Stage 5 Great North Road
3 12 3,093 0 3,108 4 16 545 0 565 0 0 0 0 0 0 HHL
New Lynn TOD McCrae Way 0 0 0 0 0 0 0 0 0 0 4 17 1,780 0 1,801 54 HHL
Botany to Manukau RTN 0 0 0 0 0 0 0 0 0 0 1,047 0 0 0 1,047 0 HHL
Dominion Road corridor upgrade 0 0 0 0 0 822 3,289 2,055 3,083 9,249 209 838 19,896 0 20,943 59,761 HHL
Electronic sign renewals 0 0 0 0 0 0 0 0 0 0 0 0 52 0 52 517 HHL
Plan Change 13 Area – Hobsonville Airbase 0 0 0 0 0 0 0 0 0 0 0 0 910 1,571 2,481 1,132 HHL
Mill Road corridor upgrade 0 0 0 0 0 411 1,644 0 0 2,055 105 419 1,047 5,759 7,330 82,030 HMM
New and improved infrastructure for local roads
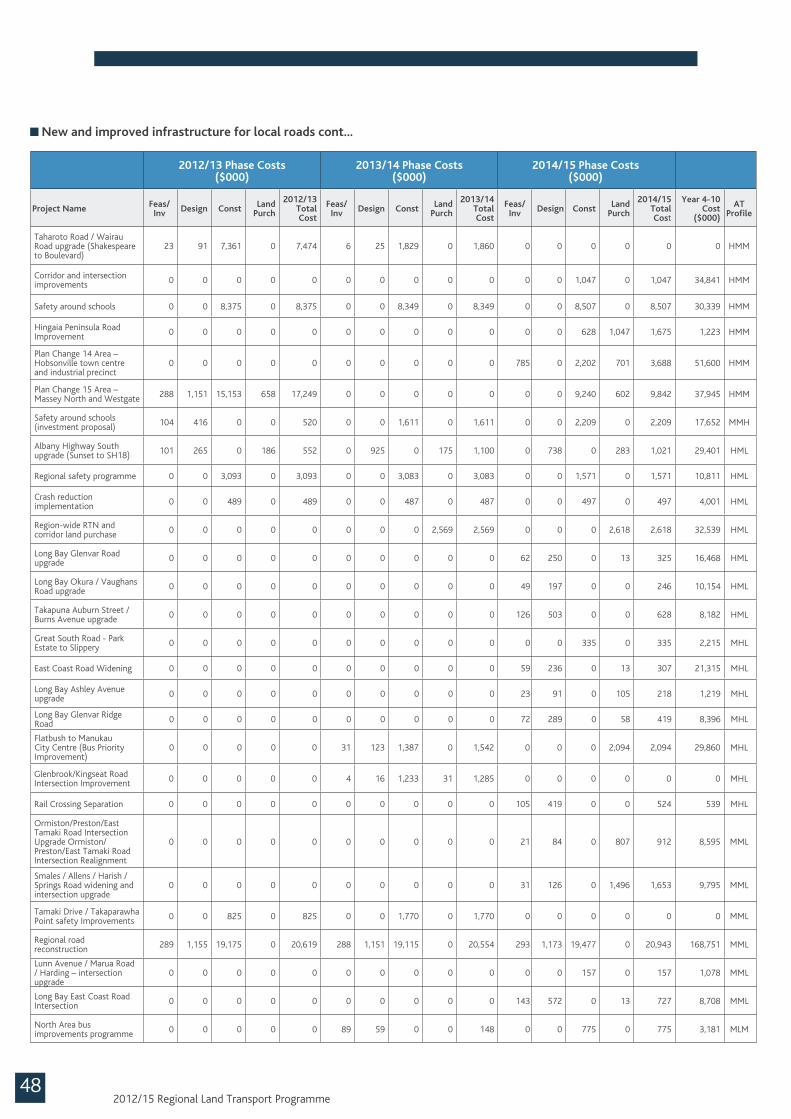
482012/15 Regional Land Transport Programme
2012/13 Phase Costs ($000)
2013/14 Phase Costs ($000)
2014/15 Phase Costs ($000)
Project Name Feas/Inv Design Const Land
Purch
2012/13 Total Cost
Feas/Inv Design Const Land
Purch
2013/14 Total Cost
Feas/Inv Design Const Land
Purch
2014/15 Total Cost
Year 4-10 Cost
($000)
AT Profile
Taharoto Road / Wairau Road upgrade (Shakespeare to Boulevard)
23 91 7,361 0 7,474 6 25 1,829 0 1,860 0 0 0 0 0 0 HMM
Corridor and intersection improvements 0 0 0 0 0 0 0 0 0 0 0 0 1,047 0 1,047 34,841 HMM
Safety around schools 0 0 8,375 0 8,375 0 0 8,349 0 8,349 0 0 8,507 0 8,507 30,339 HMM
Hingaia Peninsula Road Improvement 0 0 0 0 0 0 0 0 0 0 0 0 628 1,047 1,675 1,223 HMM
Plan Change 14 Area –Hobsonville town centre and industrial precinct
0 0 0 0 0 0 0 0 0 0 785 0 2,202 701 3,688 51,600 HMM
Plan Change 15 Area – Massey North and Westgate 288 1,151 15,153 658 17,249 0 0 0 0 0 0 0 9,240 602 9,842 37,945 HMM
Safety around schools (investment proposal) 104 416 0 0 520 0 0 1,611 0 1,611 0 0 2,209 0 2,209 17,652 MMH
Albany Highway South upgrade (Sunset to SH18) 101 265 0 186 552 0 925 0 175 1,100 0 738 0 283 1,021 29,401 HML
Regional safety programme 0 0 3,093 0 3,093 0 0 3,083 0 3,083 0 0 1,571 0 1,571 10,811 HML
Crash reduction implementation 0 0 489 0 489 0 0 487 0 487 0 0 497 0 497 4,001 HML
Region-wide RTN and corridor land purchase 0 0 0 0 0 0 0 0 2,569 2,569 0 0 0 2,618 2,618 32,539 HML
Long Bay Glenvar Road upgrade 0 0 0 0 0 0 0 0 0 0 62 250 0 13 325 16,468 HML
Long Bay Okura / Vaughans Road upgrade 0 0 0 0 0 0 0 0 0 0 49 197 0 0 246 10,154 HML
Takapuna Auburn Street / Burns Avenue upgrade 0 0 0 0 0 0 0 0 0 0 126 503 0 0 628 8,182 HML
Great South Road - Park Estate to Slippery 0 0 0 0 0 0 0 0 0 0 0 0 335 0 335 2,215 MHL
East Coast Road Widening 0 0 0 0 0 0 0 0 0 0 59 236 0 13 307 21,315 MHL
Long Bay Ashley Avenue upgrade 0 0 0 0 0 0 0 0 0 0 23 91 0 105 218 1,219 MHL
Long Bay Glenvar Ridge Road 0 0 0 0 0 0 0 0 0 0 72 289 0 58 419 8,396 MHL
Flatbush to Manukau City Centre (Bus Priority Improvement)
0 0 0 0 0 31 123 1,387 0 1,542 0 0 0 2,094 2,094 29,860 MHL
Glenbrook/Kingseat Road Intersection Improvement 0 0 0 0 0 4 16 1,233 31 1,285 0 0 0 0 0 0 MHL
Rail Crossing Separation 0 0 0 0 0 0 0 0 0 0 105 419 0 0 524 539 MHL
Ormiston/Preston/East Tamaki Road Intersection Upgrade Ormiston/Preston/East Tamaki Road Intersection Realignment
0 0 0 0 0 0 0 0 0 0 21 84 0 807 912 8,595 MML
Smales / Allens / Harish / Springs Road widening and intersection upgrade
0 0 0 0 0 0 0 0 0 0 31 126 0 1,496 1,653 9,795 MML
Tamaki Drive / Takaparawha Point safety Improvements 0 0 825 0 825 0 0 1,770 0 1,770 0 0 0 0 0 0 MML
Regional road reconstruction 289 1,155 19,175 0 20,619 288 1,151 19,115 0 20,554 293 1,173 19,477 0 20,943 168,751 MML
Lunn Avenue / Marua Road / Harding – intersection upgrade
0 0 0 0 0 0 0 0 0 0 0 0 157 0 157 1,078 MML
Long Bay East Coast Road Intersection 0 0 0 0 0 0 0 0 0 0 143 572 0 13 727 8,708 MML
North Area bus improvements programme 0 0 0 0 0 89 59 0 0 148 0 0 775 0 775 3,181 MLM
New and improved infrastructure for local roads cont...
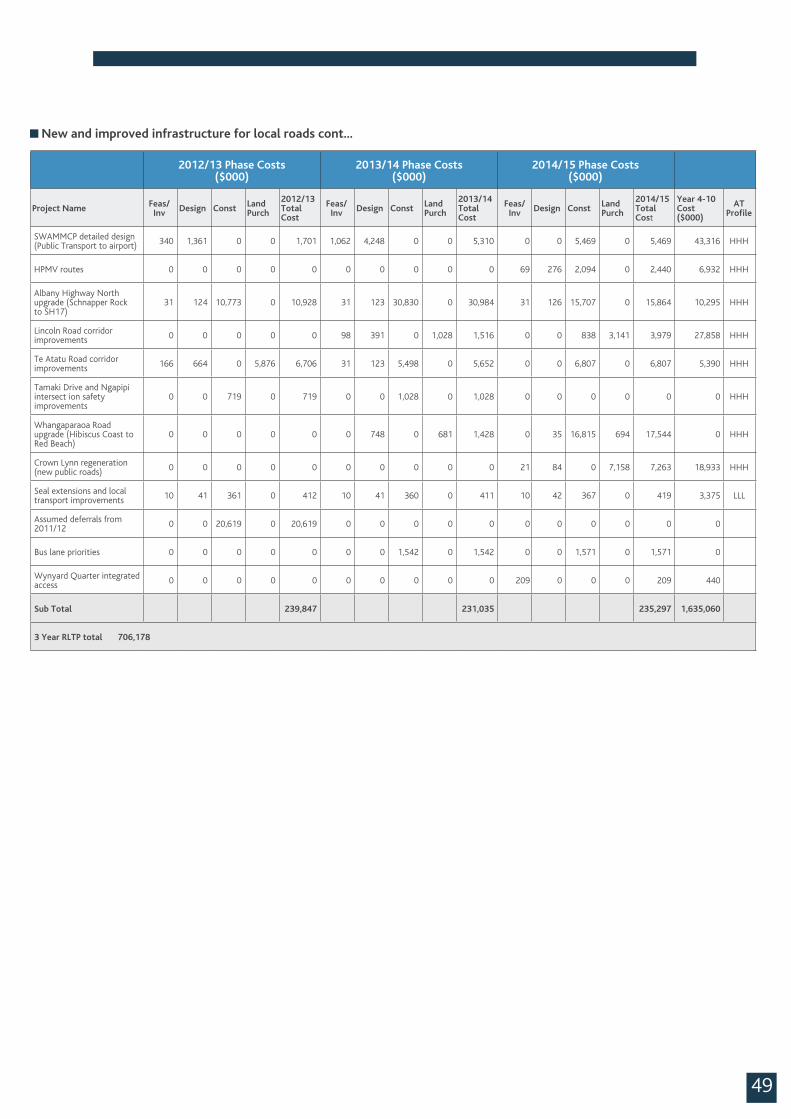
49
2012/13 Phase Costs ($000)
2013/14 Phase Costs ($000)
2014/15 Phase Costs ($000)
Project Name Feas/Inv Design Const Land
Purch
2012/13 Total Cost
Feas/Inv Design Const Land
Purch
2013/14 Total Cost
Feas/Inv Design Const Land
Purch
2014/15 Total Cost
Year 4-10 Cost ($000)
AT Profile
SWAMMCP detailed design(Public Transport to airport) 340 1,361 0 0 1,701 1,062 4,248 0 0 5,310 0 0 5,469 0 5,469 43,316 HHH
HPMV routes 0 0 0 0 0 0 0 0 0 0 69 276 2,094 0 2,440 6,932 HHH
Albany Highway North upgrade (Schnapper Rock to SH17)
31 124 10,773 0 10,928 31 123 30,830 0 30,984 31 126 15,707 0 15,864 10,295 HHH
Lincoln Road corridor improvements 0 0 0 0 0 98 391 0 1,028 1,516 0 0 838 3,141 3,979 27,858 HHH
Te Atatu Road corridor improvements 166 664 0 5,876 6,706 31 123 5,498 0 5,652 0 0 6,807 0 6,807 5,390 HHH
Tamaki Drive and Ngapipi intersect ion safety improvements
0 0 719 0 719 0 0 1,028 0 1,028 0 0 0 0 0 0 HHH
Whangaparaoa Road upgrade (Hibiscus Coast to Red Beach)
0 0 0 0 0 0 748 0 681 1,428 0 35 16,815 694 17,544 0 HHH
Crown Lynn regeneration (new public roads) 0 0 0 0 0 0 0 0 0 0 21 84 0 7,158 7,263 18,933 HHH
Seal extensions and local transport improvements 10 41 361 0 412 10 41 360 0 411 10 42 367 0 419 3,375 LLL
Assumed deferrals from 2011/12 0 0 20,619 0 20,619 0 0 0 0 0 0 0 0 0 0 0
Bus lane priorities 0 0 0 0 0 0 0 1,542 0 1,542 0 0 1,571 0 1,571 0
Wynyard Quarter integrated access 0 0 0 0 0 0 0 0 0 0 209 0 0 0 209 440
Sub Total 239,847 231,035 235,297 1,635,060
3 Year RLTP total 706,178
New and improved infrastructure for local roads cont...
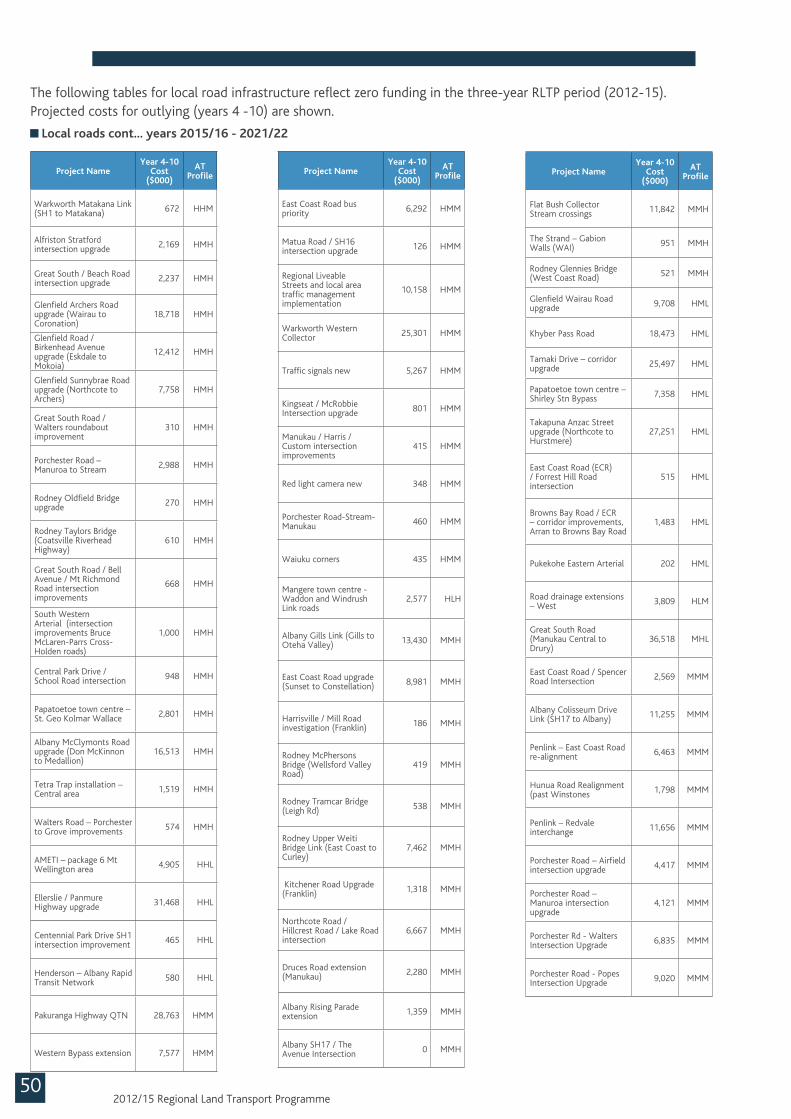
Local roads cont... years 2015/16 - 2021/22
The following tables for local road infrastructure reflect zero funding in the three-year RLTP period (2012-15). Projected costs for outlying (years 4 -10) are shown.
Project NameYear 4-10
Cost ($000)
AT Profile
Warkworth Matakana Link (SH1 to Matakana) 672 HHM
Alfriston Stratford intersection upgrade 2,169 HMH
Great South / Beach Road intersection upgrade 2,237 HMH
Glenfield Archers Road upgrade (Wairau to Coronation)
18,718 HMH
Glenfield Road / Birkenhead Avenue upgrade (Eskdale to Mokoia)
12,412 HMH
Glenfield Sunnybrae Road upgrade (Northcote to Archers)
7,758 HMH
Great South Road / Walters roundabout improvement
310 HMH
Porchester Road – Manuroa to Stream 2,988 HMH
Rodney Oldfield Bridge upgrade 270 HMH
Rodney Taylors Bridge (Coatsville Riverhead Highway)
610 HMH
Great South Road / Bell Avenue / Mt Richmond Road intersection improvements
668 HMH
South Western Arterial (intersection improvements Bruce McLaren-Parrs Cross-Holden roads)
1,000 HMH
Central Park Drive / School Road intersection 948 HMH
Papatoetoe town centre – St. Geo Kolmar Wallace 2,801 HMH
Albany McClymonts Road upgrade (Don McKinnon to Medallion)
16,513 HMH
Tetra Trap installation – Central area 1,519 HMH
Walters Road – Porchester to Grove improvements 574 HMH
AMETI – package 6 Mt Wellington area 4,905 HHL
Ellerslie / Panmure Highway upgrade 31,468 HHL
Centennial Park Drive SH1 intersection improvement 465 HHL
Henderson – Albany Rapid Transit Network 580 HHL
Pakuranga Highway QTN 28,763 HMM
Western Bypass extension 7,577 HMM
502012/15 Regional Land Transport Programme
Project NameYear 4-10
Cost ($000)
AT Profile
East Coast Road bus priority 6,292 HMM
Matua Road / SH16 intersection upgrade 126 HMM
Regional Liveable Streets and local area traffic management implementation
10,158 HMM
Warkworth Western Collector 25,301 HMM
Traffic signals new 5,267 HMM
Kingseat / McRobbie Intersection upgrade 801 HMM
Manukau / Harris / Custom intersection improvements
415 HMM
Red light camera new 348 HMM
Porchester Road-Stream-Manukau 460 HMM
Waiuku corners 435 HMM
Mangere town centre - Waddon and Windrush Link roads
2,577 HLH
Albany Gills Link (Gills to Oteha Valley) 13,430 MMH
East Coast Road upgrade (Sunset to Constellation) 8,981 MMH
Harrisville / Mill Road investigation (Franklin) 186 MMH
Rodney McPhersons Bridge (Wellsford Valley Road)
419 MMH
Rodney Tramcar Bridge (Leigh Rd) 538 MMH
Rodney Upper Weiti Bridge Link (East Coast to Curley)
7,462 MMH
Kitchener Road Upgrade (Franklin) 1,318 MMH
Northcote Road / Hillcrest Road / Lake Road intersection
6,667 MMH
Druces Road extension (Manukau) 2,280 MMH
Albany Rising Parade extension 1,359 MMH
Albany SH17 / The Avenue Intersection 0 MMH
Project NameYear 4-10
Cost ($000)
AT Profile
Flat Bush Collector Stream crossings 11,842 MMH
The Strand – Gabion Walls (WAI) 951 MMH
Rodney Glennies Bridge (West Coast Road) 521 MMH
Glenfield Wairau Road upgrade 9,708 HML
Khyber Pass Road 18,473 HML
Tamaki Drive – corridor upgrade 25,497 HML
Papatoetoe town centre – Shirley Stn Bypass 7,358 HML
Takapuna Anzac Street upgrade (Northcote to Hurstmere)
27,251 HML
East Coast Road (ECR) / Forrest Hill Road intersection
515 HML
Browns Bay Road / ECR – corridor improvements, Arran to Browns Bay Road
1,483 HML
Pukekohe Eastern Arterial 202 HML
Road drainage extensions – West 3,809 HLM
Great South Road (Manukau Central to Drury)
36,518 MHL
East Coast Road / Spencer Road Intersection 2,569 MMM
Albany Colisseum Drive Link (SH17 to Albany) 11,255 MMM
Penlink – East Coast Road re-alignment 6,463 MMM
Hunua Road Realignment (past Winstones 1,798 MMM
Penlink – Redvale interchange 11,656 MMM
Porchester Road – Airfield intersection upgrade 4,417 MMM
Porchester Road – Manuroa intersection upgrade
4,121 MMM
Porchester Rd - Walters Intersection Upgrade 6,835 MMM
Porchester Road - Popes Intersection Upgrade 9,020 MMM
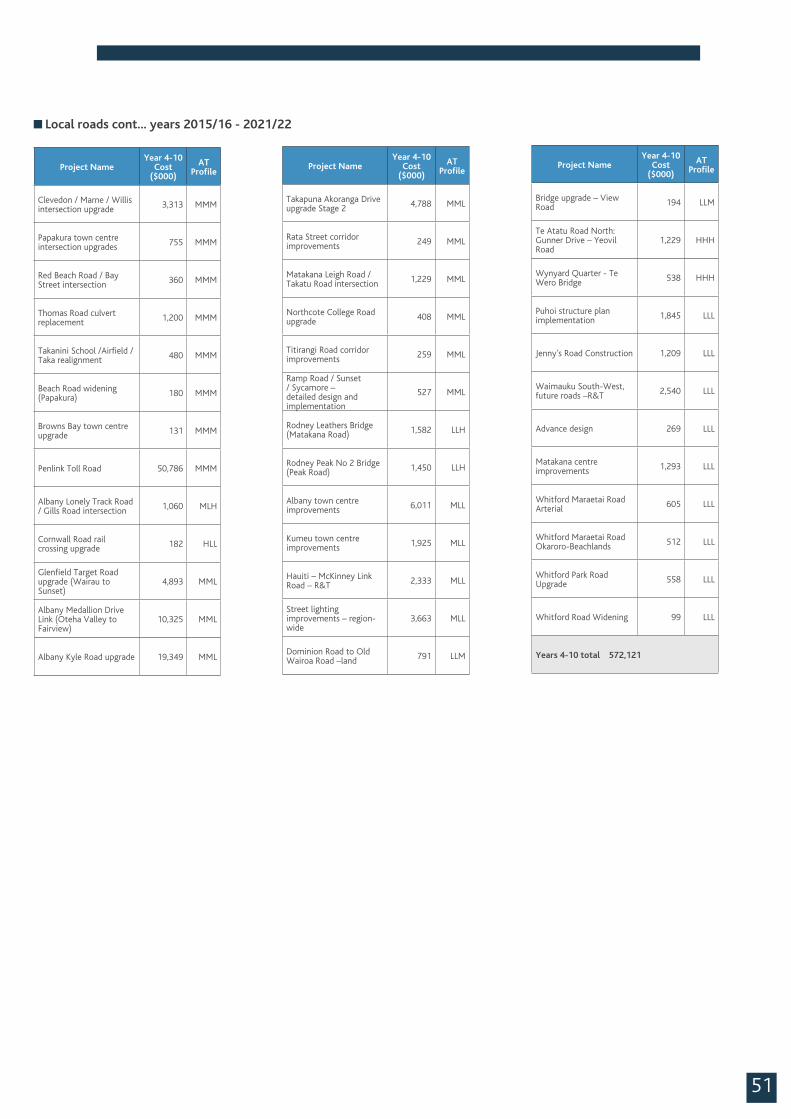
51
Local roads cont... years 2015/16 - 2021/22
Project NameYear 4-10
Cost ($000)
AT Profile
Clevedon / Marne / Willis intersection upgrade 3,313 MMM
Papakura town centre intersection upgrades 755 MMM
Red Beach Road / Bay Street intersection 360 MMM
Thomas Road culvert replacement 1,200 MMM
Takanini School /Airfield / Taka realignment 480 MMM
Beach Road widening (Papakura) 180 MMM
Browns Bay town centre upgrade 131 MMM
Penlink Toll Road 50,786 MMM
Albany Lonely Track Road / Gills Road intersection 1,060 MLH
Cornwall Road rail crossing upgrade 182 HLL
Glenfield Target Road upgrade (Wairau to Sunset)
4,893 MML
Albany Medallion Drive Link (Oteha Valley to Fairview)
10,325 MML
Albany Kyle Road upgrade 19,349 MML
Project NameYear 4-10
Cost ($000)
AT Profile
Takapuna Akoranga Drive upgrade Stage 2 4,788 MML
Rata Street corridor improvements 249 MML
Matakana Leigh Road / Takatu Road intersection 1,229 MML
Northcote College Road upgrade 408 MML
Titirangi Road corridor improvements 259 MML
Ramp Road / Sunset / Sycamore – detailed design and implementation
527 MML
Rodney Leathers Bridge (Matakana Road) 1,582 LLH
Rodney Peak No 2 Bridge (Peak Road) 1,450 LLH
Albany town centre improvements 6,011 MLL
Kumeu town centre improvements 1,925 MLL
Hauiti – McKinney Link Road – R&T 2,333 MLL
Street lighting improvements – region-wide
3,663 MLL
Dominion Road to Old Wairoa Road –land 791 LLM
Project NameYear 4-10
Cost ($000)
AT Profile
Bridge upgrade – View Road 194 LLM
Te Atatu Road North: Gunner Drive – Yeovil Road
1,229 HHH
Wynyard Quarter - Te Wero Bridge 538 HHH
Puhoi structure plan implementation 1,845 LLL
Jenny's Road Construction 1,209 LLL
Waimauku South-West, future roads –R&T 2,540 LLL
Advance design 269 LLL
Matakana centre improvements 1,293 LLL
Whitford Maraetai Road Arterial 605 LLL
Whitford Maraetai Road Okaroro-Beachlands 512 LLL
Whitford Park Road Upgrade 558 LLL
Whitford Road Widening 99 LLL
Years 4-10 total 572,121
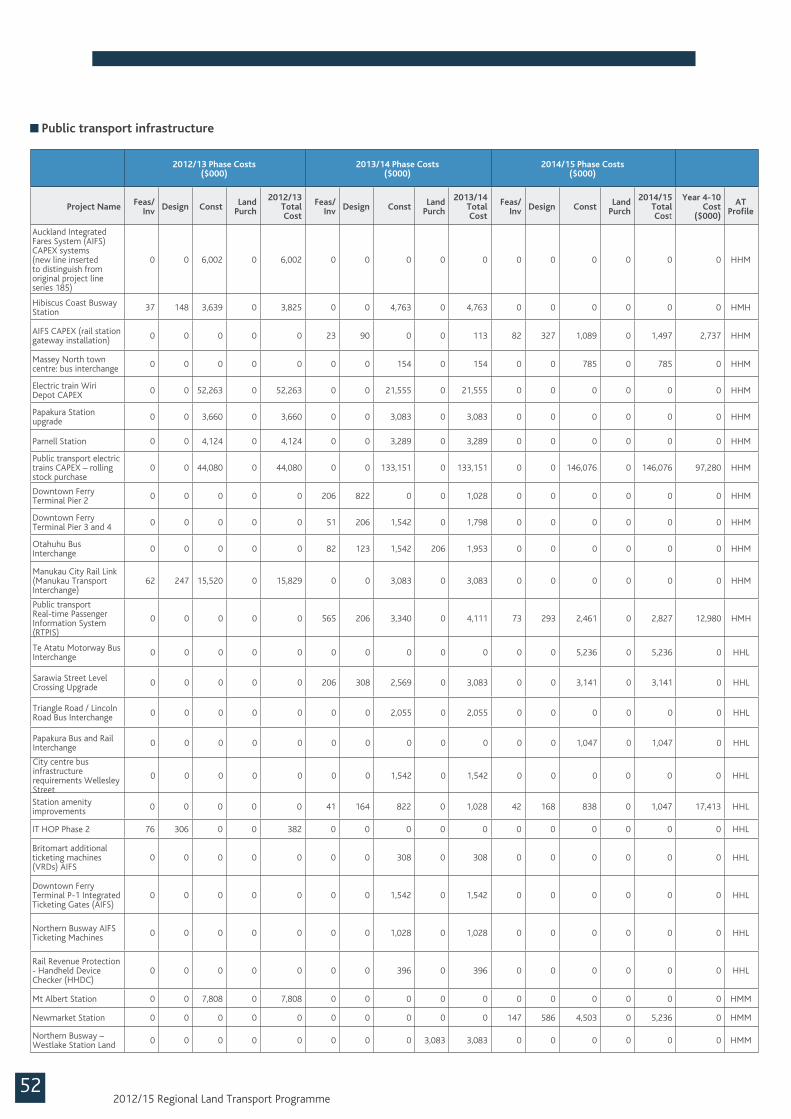
2012/13 Phase Costs ($000)
2013/14 Phase Costs ($000)
2014/15 Phase Costs ($000)
Project Name Feas/Inv Design Const Land
Purch
2012/13 Total Cost
Feas/Inv Design Const Land
Purch
2013/14 Total Cost
Feas/Inv Design Const Land
Purch
2014/15 Total Cost
Year 4-10 Cost
($000)
AT Profile
Auckland Integrated Fares System (AIFS) CAPEX systems (new line inserted to distinguish from original project line series 185)
0 0 6,002 0 6,002 0 0 0 0 0 0 0 0 0 0 0 HHM
Hibiscus Coast Busway Station 37 148 3,639 0 3,825 0 0 4,763 0 4,763 0 0 0 0 0 0 HMH
AIFS CAPEX (rail station gateway installation) 0 0 0 0 0 23 90 0 0 113 82 327 1,089 0 1,497 2,737 HHM
Massey North town centre: bus interchange 0 0 0 0 0 0 0 154 0 154 0 0 785 0 785 0 HHM
Electric train Wiri Depot CAPEX 0 0 52,263 0 52,263 0 0 21,555 0 21,555 0 0 0 0 0 0 HHM
Papakura Station upgrade 0 0 3,660 0 3,660 0 0 3,083 0 3,083 0 0 0 0 0 0 HHM
Parnell Station 0 0 4,124 0 4,124 0 0 3,289 0 3,289 0 0 0 0 0 0 HHM
Public transport electric trains CAPEX – rolling stock purchase
0 0 44,080 0 44,080 0 0 133,151 0 133,151 0 0 146,076 0 146,076 97,280 HHM
Downtown Ferry Terminal Pier 2 0 0 0 0 0 206 822 0 0 1,028 0 0 0 0 0 0 HHM
Downtown Ferry Terminal Pier 3 and 4 0 0 0 0 0 51 206 1,542 0 1,798 0 0 0 0 0 0 HHM
Otahuhu Bus Interchange 0 0 0 0 0 82 123 1,542 206 1,953 0 0 0 0 0 0 HHM
Manukau City Rail Link (Manukau Transport Interchange)
62 247 15,520 0 15,829 0 0 3,083 0 3,083 0 0 0 0 0 0 HHM
Public transport Real-time Passenger Information System (RTPIS)
0 0 0 0 0 565 206 3,340 0 4,111 73 293 2,461 0 2,827 12,980 HMH
Te Atatu Motorway Bus Interchange 0 0 0 0 0 0 0 0 0 0 0 0 5,236 0 5,236 0 HHL
Sarawia Street Level Crossing Upgrade 0 0 0 0 0 206 308 2,569 0 3,083 0 0 3,141 0 3,141 0 HHL
Triangle Road / Lincoln Road Bus Interchange 0 0 0 0 0 0 0 2,055 0 2,055 0 0 0 0 0 0 HHL
Papakura Bus and Rail Interchange 0 0 0 0 0 0 0 0 0 0 0 0 1,047 0 1,047 0 HHL
City centre bus infrastructure requirements Wellesley Street
0 0 0 0 0 0 0 1,542 0 1,542 0 0 0 0 0 0 HHL
Station amenity improvements 0 0 0 0 0 41 164 822 0 1,028 42 168 838 0 1,047 17,413 HHL
IT HOP Phase 2 76 306 0 0 382 0 0 0 0 0 0 0 0 0 0 0 HHL
Britomart additional ticketing machines (VRDs) AIFS
0 0 0 0 0 0 0 308 0 308 0 0 0 0 0 0 HHL
Downtown Ferry Terminal P-1 Integrated Ticketing Gates (AIFS)
0 0 0 0 0 0 0 1,542 0 1,542 0 0 0 0 0 0 HHL
Northern Busway AIFS Ticketing Machines 0 0 0 0 0 0 0 1,028 0 1,028 0 0 0 0 0 0 HHL
Rail Revenue Protection - Handheld Device Checker (HHDC)
0 0 0 0 0 0 0 396 0 396 0 0 0 0 0 0 HHL
Mt Albert Station 0 0 7,808 0 7,808 0 0 0 0 0 0 0 0 0 0 0 HMM
Newmarket Station 0 0 0 0 0 0 0 0 0 0 147 586 4,503 0 5,236 0 HMM
Northern Busway –Westlake Station Land 0 0 0 0 0 0 0 0 3,083 3,083 0 0 0 0 0 0 HMM
Public transport infrastructure
522012/15 Regional Land Transport Programme
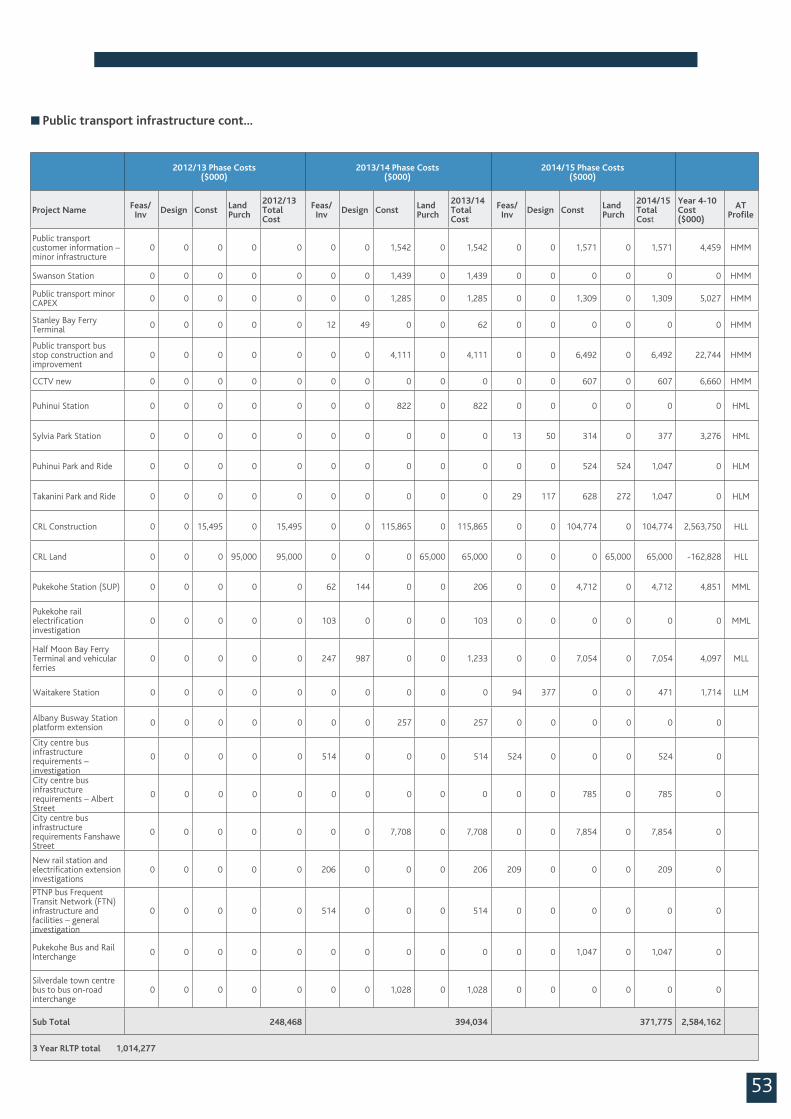
53
Public transport infrastructure cont...
2012/13 Phase Costs ($000)
2013/14 Phase Costs ($000)
2014/15 Phase Costs ($000)
Project Name Feas/Inv Design Const Land
Purch
2012/13 Total Cost
Feas/Inv Design Const Land
Purch
2013/14 Total Cost
Feas/Inv Design Const Land
Purch
2014/15 Total Cost
Year 4-10 Cost ($000)
AT Profile
Public transport customer information – minor infrastructure
0 0 0 0 0 0 0 1,542 0 1,542 0 0 1,571 0 1,571 4,459 HMM
Swanson Station 0 0 0 0 0 0 0 1,439 0 1,439 0 0 0 0 0 0 HMM
Public transport minor CAPEX 0 0 0 0 0 0 0 1,285 0 1,285 0 0 1,309 0 1,309 5,027 HMM
Stanley Bay Ferry Terminal 0 0 0 0 0 12 49 0 0 62 0 0 0 0 0 0 HMM
Public transport bus stop construction and improvement
0 0 0 0 0 0 0 4,111 0 4,111 0 0 6,492 0 6,492 22,744 HMM
CCTV new 0 0 0 0 0 0 0 0 0 0 0 0 607 0 607 6,660 HMM
Puhinui Station 0 0 0 0 0 0 0 822 0 822 0 0 0 0 0 0 HML
Sylvia Park Station 0 0 0 0 0 0 0 0 0 0 13 50 314 0 377 3,276 HML
Puhinui Park and Ride 0 0 0 0 0 0 0 0 0 0 0 0 524 524 1,047 0 HLM
Takanini Park and Ride 0 0 0 0 0 0 0 0 0 0 29 117 628 272 1,047 0 HLM
CRL Construction 0 0 15,495 0 15,495 0 0 115,865 0 115,865 0 0 104,774 0 104,774 2,563,750 HLL
CRL Land 0 0 0 95,000 95,000 0 0 0 65,000 65,000 0 0 0 65,000 65,000 -162,828 HLL
Pukekohe Station (SUP) 0 0 0 0 0 62 144 0 0 206 0 0 4,712 0 4,712 4,851 MML
Pukekohe rail electrification investigation
0 0 0 0 0 103 0 0 0 103 0 0 0 0 0 0 MML
Half Moon Bay Ferry Terminal and vehicular ferries
0 0 0 0 0 247 987 0 0 1,233 0 0 7,054 0 7,054 4,097 MLL
Waitakere Station 0 0 0 0 0 0 0 0 0 0 94 377 0 0 471 1,714 LLM
Albany Busway Station platform extension 0 0 0 0 0 0 0 257 0 257 0 0 0 0 0 0
City centre bus infrastructure requirements – investigation
0 0 0 0 0 514 0 0 0 514 524 0 0 0 524 0
City centre bus infrastructure requirements – Albert Street
0 0 0 0 0 0 0 0 0 0 0 0 785 0 785 0
City centre bus infrastructure requirements Fanshawe Street
0 0 0 0 0 0 0 7,708 0 7,708 0 0 7,854 0 7,854 0
New rail station and electrification extension investigations
0 0 0 0 0 206 0 0 0 206 209 0 0 0 209 0
PTNP bus Frequent Transit Network (FTN) infrastructure and facilities – general investigation
0 0 0 0 0 514 0 0 0 514 0 0 0 0 0 0
Pukekohe Bus and Rail Interchange 0 0 0 0 0 0 0 0 0 0 0 0 1,047 0 1,047 0
Silverdale town centre bus to bus on-road interchange
0 0 0 0 0 0 0 1,028 0 1,028 0 0 0 0 0 0
Sub Total 248,468 394,034 371,775 2,584,162
3 Year RLTP total 1,014,277
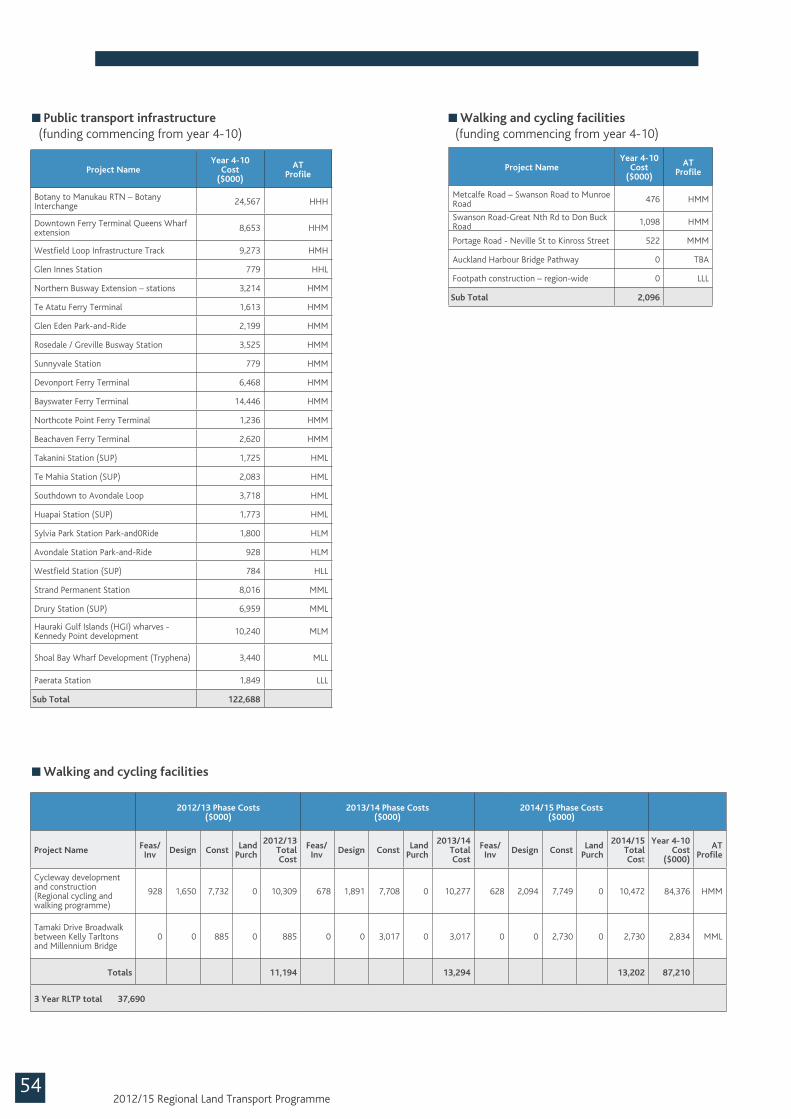
Walking and cycling facilities
Public transport infrastructure (funding commencing from year 4-10)
Walking and cycling facilities (funding commencing from year 4-10)
2012/13 Phase Costs ($000)
2013/14 Phase Costs ($000)
2014/15 Phase Costs ($000)
Project Name Feas/Inv Design Const Land
Purch
2012/13 Total Cost
Feas/Inv Design Const Land
Purch
2013/14 Total Cost
Feas/Inv Design Const Land
Purch
2014/15 Total Cost
Year 4-10 Cost
($000)
AT Profile
Cycleway development and construction (Regional cycling and walking programme)
928 1,650 7,732 0 10,309 678 1,891 7,708 0 10,277 628 2,094 7,749 0 10,472 84,376 HMM
Tamaki Drive Broadwalk between Kelly Tarltons and Millennium Bridge
0 0 885 0 885 0 0 3,017 0 3,017 0 0 2,730 0 2,730 2,834 MML
Totals 11,194 13,294 13,202 87,210
3 Year RLTP total 37,690
Project NameYear 4-10
Cost($000)
ATProfile
Botany to Manukau RTN – Botany Interchange 24,567 HHH
Downtown Ferry Terminal Queens Wharf extension 8,653 HHM
Westfield Loop Infrastructure Track 9,273 HMH
Glen Innes Station 779 HHL
Northern Busway Extension – stations 3,214 HMM
Te Atatu Ferry Terminal 1,613 HMM
Glen Eden Park-and-Ride 2,199 HMM
Rosedale / Greville Busway Station 3,525 HMM
Sunnyvale Station 779 HMM
Devonport Ferry Terminal 6,468 HMM
Bayswater Ferry Terminal 14,446 HMM
Northcote Point Ferry Terminal 1,236 HMM
Beachaven Ferry Terminal 2,620 HMM
Takanini Station (SUP) 1,725 HML
Te Mahia Station (SUP) 2,083 HML
Southdown to Avondale Loop 3,718 HML
Huapai Station (SUP) 1,773 HML
Sylvia Park Station Park-and0Ride 1,800 HLM
Avondale Station Park-and-Ride 928 HLM
Westfield Station (SUP) 784 HLL
Strand Permanent Station 8,016 MML
Drury Station (SUP) 6,959 MML
Hauraki Gulf Islands (HGI) wharves - Kennedy Point development 10,240 MLM
Shoal Bay Wharf Development (Tryphena) 3,440 MLL
Paerata Station 1,849 LLL
Sub Total 122,688
Project NameYear 4-10
Cost($000)
ATProfile
Metcalfe Road – Swanson Road to Munroe Road 476 HMM
Swanson Road-Great Nth Rd to Don Buck Road 1,098 HMM
Portage Road - Neville St to Kinross Street 522 MMM
Auckland Harbour Bridge Pathway 0 TBA
Footpath construction – region-wide 0 LLL
Sub Total 2,096
542012/15 Regional Land Transport Programme
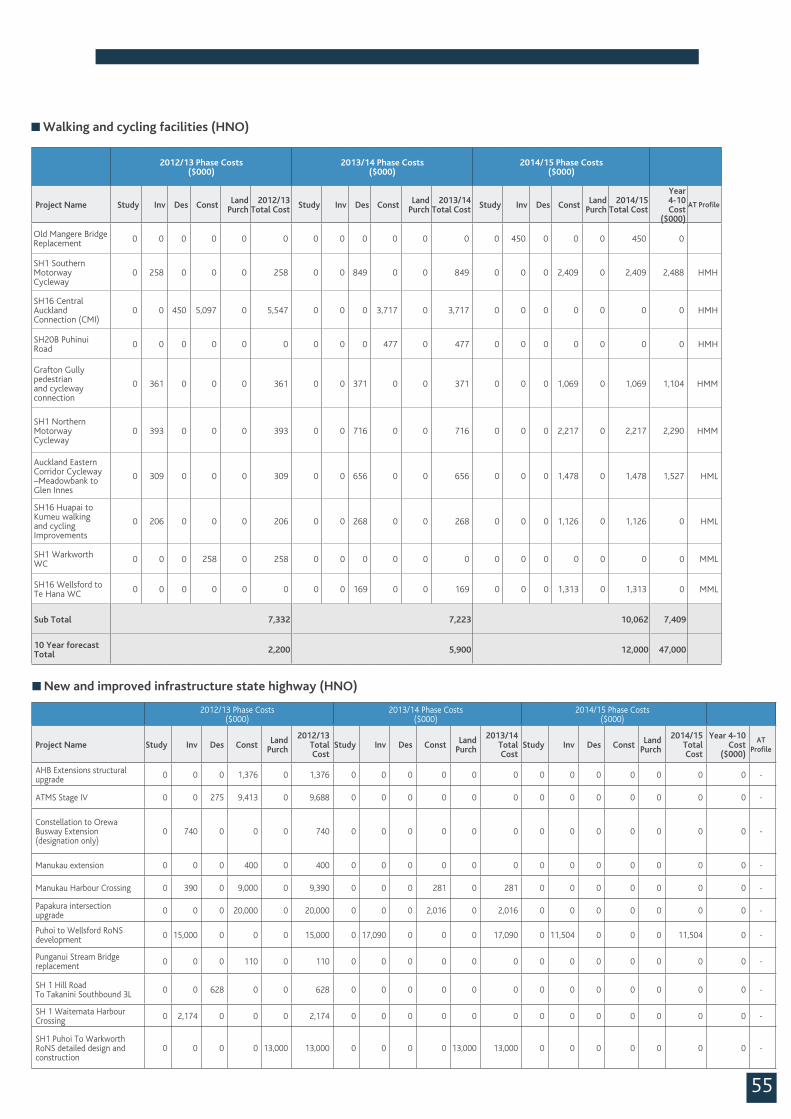
Walking and cycling facilities (funding commencing from year 4-10)
55
Walking and cycling facilities (HNO)
2012/13 Phase Costs ($000)
2013/14 Phase Costs ($000)
2014/15 Phase Costs ($000)
Project Name Study Inv Des Const LandPurch
2012/13Total Cost Study Inv Des Const Land
Purch2013/14
Total Cost Study Inv Des Const LandPurch
2014/15Total Cost
Year 4-10 Cost
($000)
AT Profile
Old Mangere Bridge Replacement 0 0 0 0 0 0 0 0 0 0 0 0 0 450 0 0 0 450 0
SH1 Southern Motorway Cycleway
0 258 0 0 0 258 0 0 849 0 0 849 0 0 0 2,409 0 2,409 2,488 HMH
SH16 Central Auckland Connection (CMI)
0 0 450 5,097 0 5,547 0 0 0 3,717 0 3,717 0 0 0 0 0 0 0 HMH
SH20B Puhinui Road 0 0 0 0 0 0 0 0 0 477 0 477 0 0 0 0 0 0 0 HMH
Grafton Gully pedestrian and cycleway connection
0 361 0 0 0 361 0 0 371 0 0 371 0 0 0 1,069 0 1,069 1,104 HMM
SH1 Northern Motorway Cycleway
0 393 0 0 0 393 0 0 716 0 0 716 0 0 0 2,217 0 2,217 2,290 HMM
Auckland Eastern Corridor Cycleway –Meadowbank to Glen Innes
0 309 0 0 0 309 0 0 656 0 0 656 0 0 0 1,478 0 1,478 1,527 HML
SH16 Huapai to Kumeu walking and cycling Improvements
0 206 0 0 0 206 0 0 268 0 0 268 0 0 0 1,126 0 1,126 0 HML
SH1 Warkworth WC 0 0 0 258 0 258 0 0 0 0 0 0 0 0 0 0 0 0 0 MML
SH16 Wellsford to Te Hana WC 0 0 0 0 0 0 0 0 169 0 0 169 0 0 0 1,313 0 1,313 0 MML
Sub Total 7,332 7,223 10,062 7,409
10 Year forecast Total 2,200 5,900 12,000 47,000
New and improved infrastructure state highway (HNO)
2012/13 Phase Costs ($000)
2013/14 Phase Costs ($000)
2014/15 Phase Costs ($000)
Project Name Study Inv Des Const LandPurch
2012/13Total Cost
Study Inv Des Const LandPurch
2013/14Total Cost
Study Inv Des Const LandPurch
2014/15Total Cost
Year 4-10 Cost
($000)
AT Profile
AHB Extensions structural upgrade 0 0 0 1,376 0 1,376 0 0 0 0 0 0 0 0 0 0 0 0 0 -
ATMS Stage IV 0 0 275 9,413 0 9,688 0 0 0 0 0 0 0 0 0 0 0 0 0 -
Constellation to Orewa Busway Extension (designation only)
0 740 0 0 0 740 0 0 0 0 0 0 0 0 0 0 0 0 0 -
Manukau extension 0 0 0 400 0 400 0 0 0 0 0 0 0 0 0 0 0 0 0 -
Manukau Harbour Crossing 0 390 0 9,000 0 9,390 0 0 0 281 0 281 0 0 0 0 0 0 0 -
Papakura intersection upgrade 0 0 0 20,000 0 20,000 0 0 0 2,016 0 2,016 0 0 0 0 0 0 0 -
Puhoi to Wellsford RoNS development 0 15,000 0 0 0 15,000 0 17,090 0 0 0 17,090 0 11,504 0 0 0 11,504 0 -
Punganui Stream Bridge replacement 0 0 0 110 0 110 0 0 0 0 0 0 0 0 0 0 0 0 0 -
SH 1 Hill Road To Takanini Southbound 3L 0 0 628 0 0 628 0 0 0 0 0 0 0 0 0 0 0 0 0 -
SH 1 Waitemata Harbour Crossing 0 2,174 0 0 0 2,174 0 0 0 0 0 0 0 0 0 0 0 0 0 -
SH1 Puhoi To Warkworth RoNS detailed design and construction
0 0 0 0 13,000 13,000 0 0 0 0 13,000 13,000 0 0 0 0 0 0 0 -
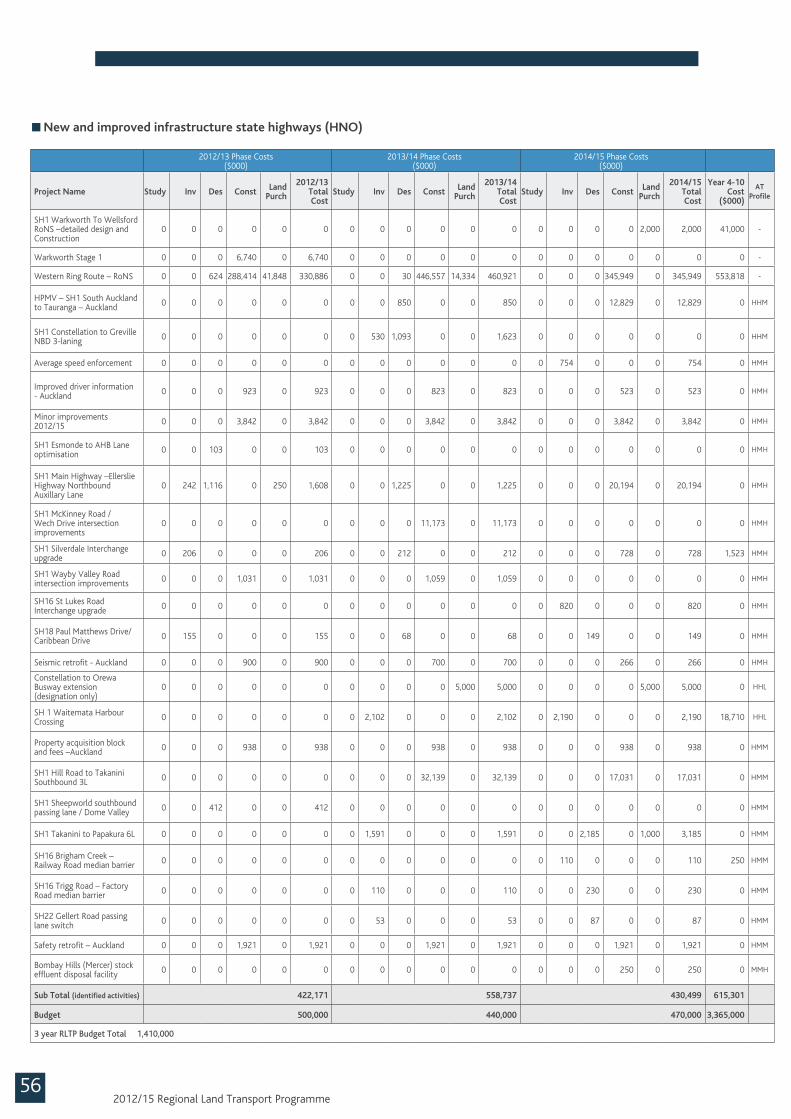
New and improved infrastructure state highways (HNO)
562012/15 Regional Land Transport Programme
2012/13 Phase Costs ($000)
2013/14 Phase Costs ($000)
2014/15 Phase Costs ($000)
Project Name Study Inv Des Const LandPurch
2012/13Total Cost
Study Inv Des Const LandPurch
2013/14Total Cost
Study Inv Des Const LandPurch
2014/15Total Cost
Year 4-10 Cost
($000)
AT Profile
SH1 Warkworth To Wellsford RoNS –detailed design and Construction
0 0 0 0 0 0 0 0 0 0 0 0 0 0 0 0 2,000 2,000 41,000 -
Warkworth Stage 1 0 0 0 6,740 0 6,740 0 0 0 0 0 0 0 0 0 0 0 0 0 -
Western Ring Route – RoNS 0 0 624 288,414 41,848 330,886 0 0 30 446,557 14,334 460,921 0 0 0 345,949 0 345,949 553,818 -
HPMV – SH1 South Auckland to Tauranga – Auckland 0 0 0 0 0 0 0 0 850 0 0 850 0 0 0 12,829 0 12,829 0 HHM
SH1 Constellation to Greville NBD 3-laning 0 0 0 0 0 0 0 530 1,093 0 0 1,623 0 0 0 0 0 0 0 HHM
Average speed enforcement 0 0 0 0 0 0 0 0 0 0 0 0 0 754 0 0 0 754 0 HMH
Improved driver information - Auckland 0 0 0 923 0 923 0 0 0 823 0 823 0 0 0 523 0 523 0 HMH
Minor improvements 2012/15 0 0 0 3,842 0 3,842 0 0 0 3,842 0 3,842 0 0 0 3,842 0 3,842 0 HMH
SH1 Esmonde to AHB Lane optimisation 0 0 103 0 0 103 0 0 0 0 0 0 0 0 0 0 0 0 0 HMH
SH1 Main Highway –Ellerslie Highway Northbound Auxillary Lane
0 242 1,116 0 250 1,608 0 0 1,225 0 0 1,225 0 0 0 20,194 0 20,194 0 HMH
SH1 McKinney Road / Wech Drive intersection improvements
0 0 0 0 0 0 0 0 0 11,173 0 11,173 0 0 0 0 0 0 0 HMH
SH1 Silverdale Interchange upgrade 0 206 0 0 0 206 0 0 212 0 0 212 0 0 0 728 0 728 1,523 HMH
SH1 Wayby Valley Road intersection improvements 0 0 0 1,031 0 1,031 0 0 0 1,059 0 1,059 0 0 0 0 0 0 0 HMH
SH16 St Lukes Road Interchange upgrade 0 0 0 0 0 0 0 0 0 0 0 0 0 820 0 0 0 820 0 HMH
SH18 Paul Matthews Drive/ Caribbean Drive 0 155 0 0 0 155 0 0 68 0 0 68 0 0 149 0 0 149 0 HMH
Seismic retrofit - Auckland 0 0 0 900 0 900 0 0 0 700 0 700 0 0 0 266 0 266 0 HMH
Constellation to Orewa Busway extension (designation only)
0 0 0 0 0 0 0 0 0 0 5,000 5,000 0 0 0 0 5,000 5,000 0 HHL
SH 1 Waitemata Harbour Crossing 0 0 0 0 0 0 0 2,102 0 0 0 2,102 0 2,190 0 0 0 2,190 18,710 HHL
Property acquisition block and fees –Auckland 0 0 0 938 0 938 0 0 0 938 0 938 0 0 0 938 0 938 0 HMM
SH1 Hill Road to Takanini Southbound 3L 0 0 0 0 0 0 0 0 0 32,139 0 32,139 0 0 0 17,031 0 17,031 0 HMM
SH1 Sheepworld southbound passing lane / Dome Valley 0 0 412 0 0 412 0 0 0 0 0 0 0 0 0 0 0 0 0 HMM
SH1 Takanini to Papakura 6L 0 0 0 0 0 0 0 1,591 0 0 0 1,591 0 0 2,185 0 1,000 3,185 0 HMM
SH16 Brigham Creek – Railway Road median barrier 0 0 0 0 0 0 0 0 0 0 0 0 0 110 0 0 0 110 250 HMM
SH16 Trigg Road – Factory Road median barrier 0 0 0 0 0 0 0 110 0 0 0 110 0 0 230 0 0 230 0 HMM
SH22 Gellert Road passing lane switch 0 0 0 0 0 0 0 53 0 0 0 53 0 0 87 0 0 87 0 HMM
Safety retrofit – Auckland 0 0 0 1,921 0 1,921 0 0 0 1,921 0 1,921 0 0 0 1,921 0 1,921 0 HMM
Bombay Hills (Mercer) stock effluent disposal facility 0 0 0 0 0 0 0 0 0 0 0 0 0 0 0 250 0 250 0 MMH
Sub Total (identified activities) 422,171 558,737 430,499 615,301
Budget 500,000 440,000 470,000 3,365,000
3 year RLTP Budget Total 1,410,000
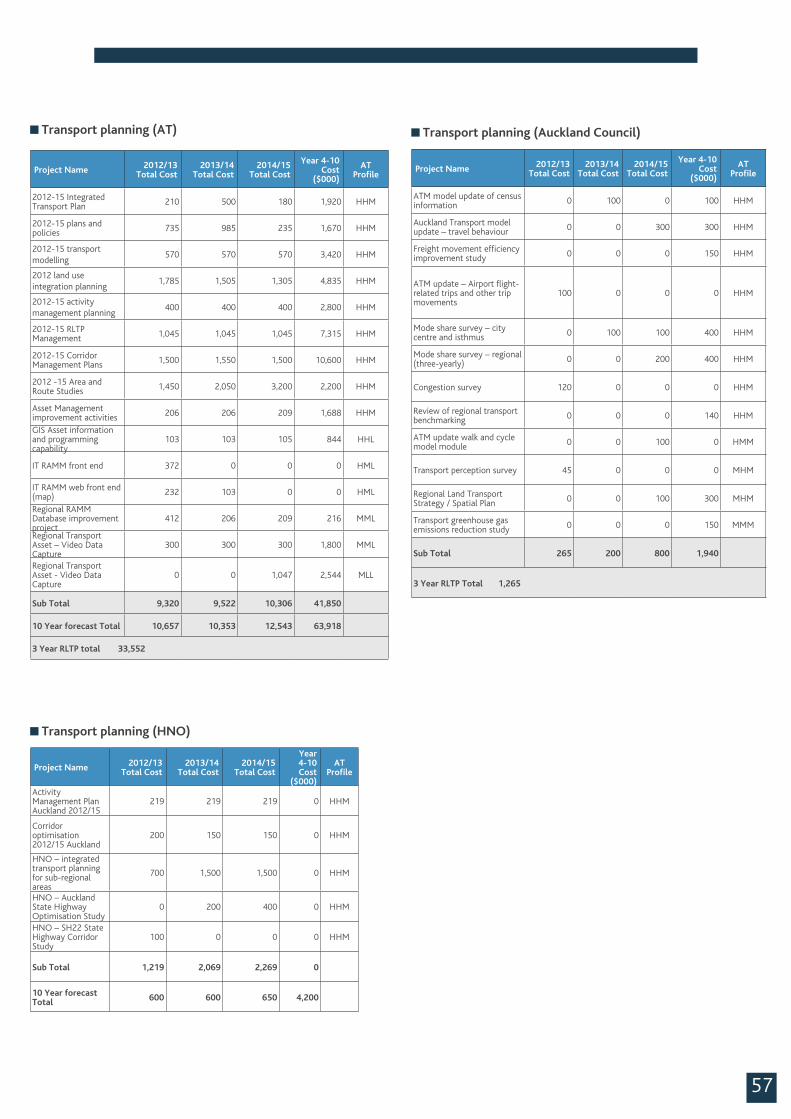
57
Transport planning (AT)
Project Name 2012/13 Total Cost
2013/14 Total Cost
2014/15 Total Cost
Year 4-10 Cost
($000)
AT Profile
2012-15 Integrated Transport Plan 210 500 180 1,920 HHM
2012-15 plans and policies 735 985 235 1,670 HHM
2012-15 transport modelling
570 570 570 3,420 HHM
2012 land use integration planning
1,785 1,505 1,305 4,835 HHM
2012-15 activity management planning
400 400 400 2,800 HHM
2012-15 RLTP Management 1,045 1,045 1,045 7,315 HHM
2012-15 Corridor Management Plans 1,500 1,550 1,500 10,600 HHM
2012 -15 Area and Route Studies 1,450 2,050 3,200 2,200 HHM
Asset Management improvement activities 206 206 209 1,688 HHM
GIS Asset information and programming capability
103 103 105 844 HHL
IT RAMM front end 372 0 0 0 HML
IT RAMM web front end (map) 232 103 0 0 HML
Regional RAMM Database improvement project
412 206 209 216 MML
Regional Transport Asset – Video Data Capture
300 300 300 1,800 MML
Regional Transport Asset - Video Data Capture
0 0 1,047 2,544 MLL
Sub Total 9,320 9,522 10,306 41,850
10 Year forecast Total 10,657 10,353 12,543 63,918
3 Year RLTP total 33,552
Transport planning (HNO)
Project Name 2012/13Total Cost
2013/14Total Cost
2014/15Total Cost
Year 4-10 Cost
($000)
AT Profile
Activity Management Plan Auckland 2012/15
219 219 219 0 HHM
Corridor optimisation 2012/15 Auckland
200 150 150 0 HHM
HNO – integrated transport planning for sub-regional areas
700 1,500 1,500 0 HHM
HNO – Auckland State Highway Optimisation Study
0 200 400 0 HHM
HNO – SH22 State Highway Corridor Study
100 0 0 0 HHM
Sub Total 1,219 2,069 2,269 0
10 Year forecast Total 600 600 650 4,200
Transport planning (Auckland Council)
Project Name 2012/13Total Cost
2013/14Total Cost
2014/15Total Cost
Year 4-10 Cost
($000)
AT Profile
ATM model update of census information 0 100 0 100 HHM
Auckland Transport model update – travel behaviour 0 0 300 300 HHM
Freight movement efficiency improvement study 0 0 0 150 HHM
ATM update – Airport flight-related trips and other trip movements
100 0 0 0 HHM
Mode share survey – city centre and isthmus 0 100 100 400 HHM
Mode share survey – regional (three-yearly) 0 0 200 400 HHM
Congestion survey 120 0 0 0 HHM
Review of regional transport benchmarking 0 0 0 140 HHM
ATM update walk and cycle model module 0 0 100 0 HMM
Transport perception survey 45 0 0 0 MHM
Regional Land Transport Strategy / Spatial Plan 0 0 100 300 MHM
Transport greenhouse gas emissions reduction study 0 0 0 150 MMM
Sub Total 265 200 800 1,940
3 Year RLTP Total 1,265
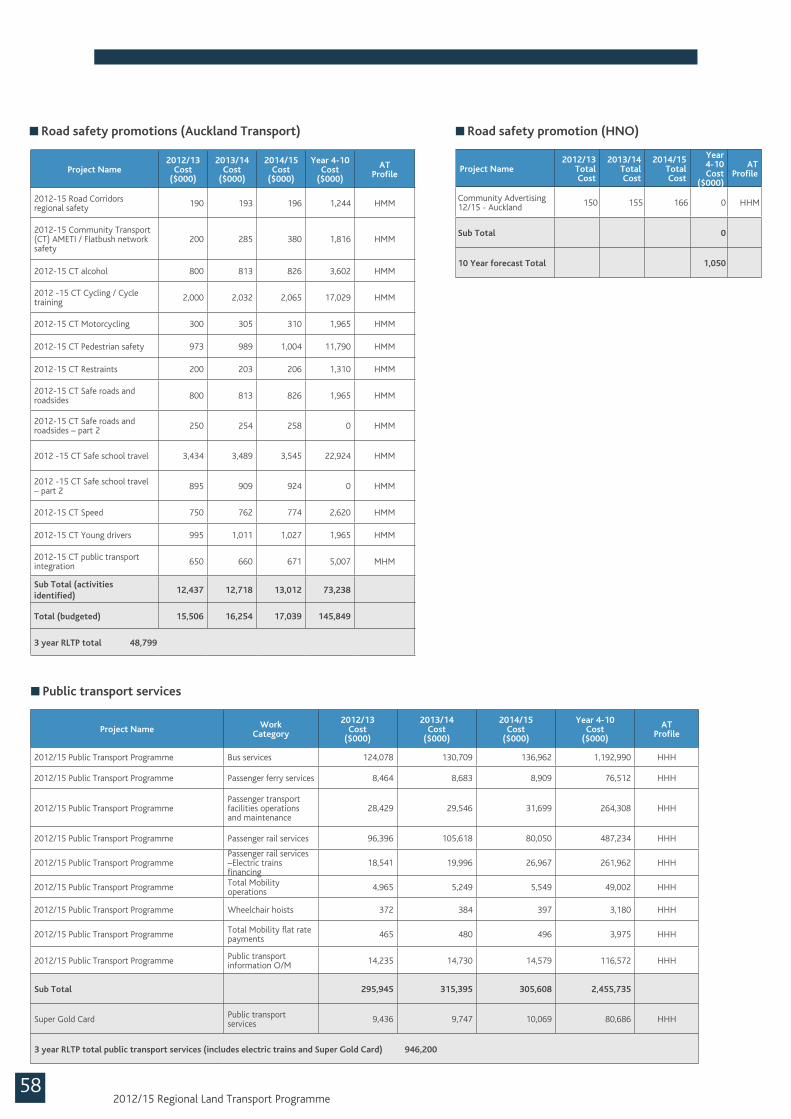
582012/15 Regional Land Transport Programme
Road safety promotion (HNO)
Project Name2012/13
Total Cost
2013/14Total Cost
2014/15Total Cost
Year 4-10 Cost
($000)
AT Profile
Community Advertising 12/15 - Auckland 150 155 166 0 HHM
Sub Total 0
10 Year forecast Total 1,050
Public transport services
Project Name Work Category
2012/13 Cost
($000)
2013/14 Cost
($000)
2014/15 Cost
($000)
Year 4-10 Cost
($000)
ATProfile
2012/15 Public Transport Programme Bus services 124,078 130,709 136,962 1,192,990 HHH
2012/15 Public Transport Programme Passenger ferry services 8,464 8,683 8,909 76,512 HHH
2012/15 Public Transport Programme Passenger transport facilities operations and maintenance
28,429 29,546 31,699 264,308 HHH
2012/15 Public Transport Programme Passenger rail services 96,396 105,618 80,050 487,234 HHH
2012/15 Public Transport Programme Passenger rail services –Electric trains financing
18,541 19,996 26,967 261,962 HHH
2012/15 Public Transport Programme Total Mobility operations 4,965 5,249 5,549 49,002 HHH
2012/15 Public Transport Programme Wheelchair hoists 372 384 397 3,180 HHH
2012/15 Public Transport Programme Total Mobility flat rate payments 465 480 496 3,975 HHH
2012/15 Public Transport Programme Public transport information O/M 14,235 14,730 14,579 116,572 HHH
Sub Total 295,945 315,395 305,608 2,455,735
Super Gold Card Public transport services 9,436 9,747 10,069 80,686 HHH
3 year RLTP total public transport services (includes electric trains and Super Gold Card) 946,200
Road safety promotions (Auckland Transport)
Project Name2012/13
Cost ($000)
2013/14 Cost
($000)
2014/15 Cost
($000)
Year 4-10 Cost
($000)
AT Profile
2012-15 Road Corridors regional safety 190 193 196 1,244 HMM
2012-15 Community Transport (CT) AMETI / Flatbush network safety
200 285 380 1,816 HMM
2012-15 CT alcohol 800 813 826 3,602 HMM
2012 -15 CT Cycling / Cycle training 2,000 2,032 2,065 17,029 HMM
2012-15 CT Motorcycling 300 305 310 1,965 HMM
2012-15 CT Pedestrian safety 973 989 1,004 11,790 HMM
2012-15 CT Restraints 200 203 206 1,310 HMM
2012-15 CT Safe roads and roadsides 800 813 826 1,965 HMM
2012-15 CT Safe roads and roadsides – part 2 250 254 258 0 HMM
2012 -15 CT Safe school travel 3,434 3,489 3,545 22,924 HMM
2012 -15 CT Safe school travel – part 2 895 909 924 0 HMM
2012-15 CT Speed 750 762 774 2,620 HMM
2012-15 CT Young drivers 995 1,011 1,027 1,965 HMM
2012-15 CT public transport integration 650 660 671 5,007 MHM
Sub Total (activities identified)
12,437 12,718 13,012 73,238
Total (budgeted) 15,506 16,254 17,039 145,849
3 year RLTP total 48,799
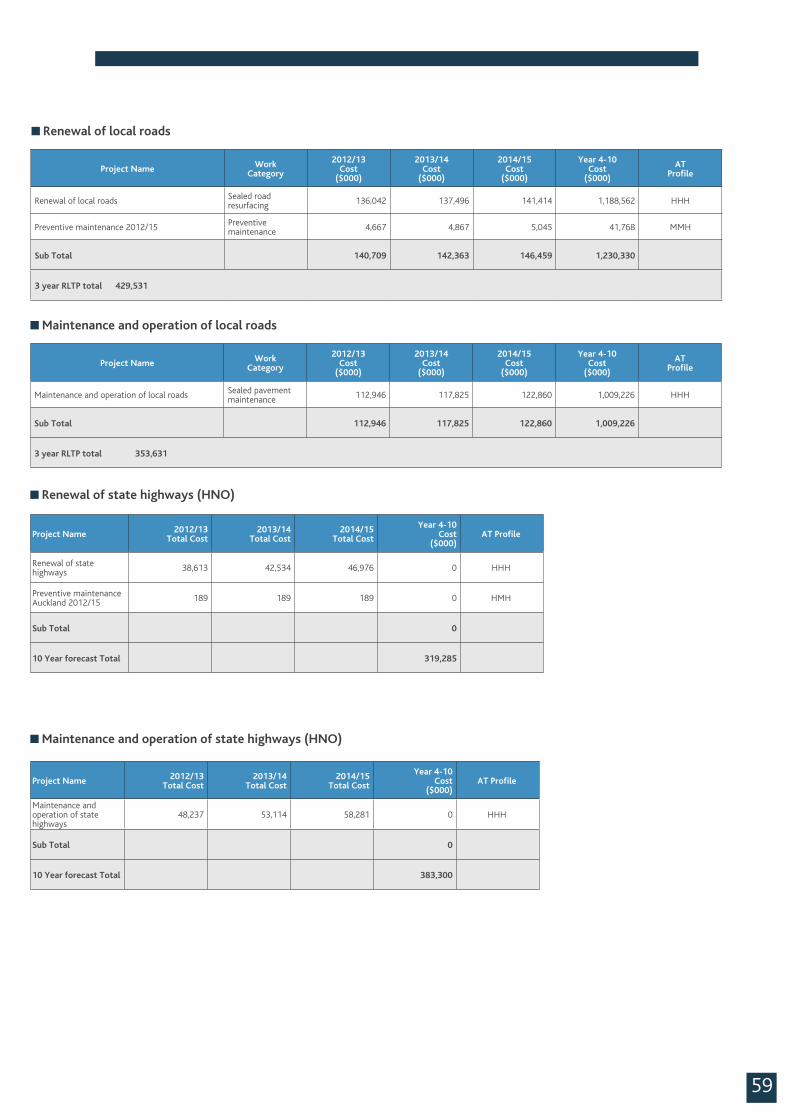
59
Maintenance and operation of local roads
Renewal of state highways (HNO)
Maintenance and operation of state highways (HNO)
Project Name 2012/13Total Cost
2013/14Total Cost
2014/15Total Cost
Year 4-10 Cost
($000)AT Profile
Renewal of state highways 38,613 42,534 46,976 0 HHH
Preventive maintenance Auckland 2012/15 189 189 189 0 HMH
Sub Total 0
10 Year forecast Total 319,285
Project Name 2012/13Total Cost
2013/14Total Cost
2014/15Total Cost
Year 4-10 Cost
($000)AT Profile
Maintenance and operation of state highways
48,237 53,114 58,281 0 HHH
Sub Total 0
10 Year forecast Total 383,300
Renewal of local roads
Project Name Work Category
2012/13 Cost
($000)
2013/14 Cost
($000)
2014/15 Cost
($000)
Year 4-10 Cost
($000)
ATProfile
Renewal of local roads Sealed road resurfacing 136,042 137,496 141,414 1,188,562 HHH
Preventive maintenance 2012/15 Preventive maintenance 4,667 4,867 5,045 41,768 MMH
Sub Total 140,709 142,363 146,459 1,230,330
3 year RLTP total 429,531
Project Name Work Category
2012/13 Cost
($000)
2013/14 Cost
($000)
2014/15 Cost
($000)
Year 4-10 Cost
($000)
ATProfile
Maintenance and operation of local roads Sealed pavement maintenance 112,946 117,825 122,860 1,009,226 HHH
Sub Total 112,946 117,825 122,860 1,009,226
3 year RLTP total 353,631
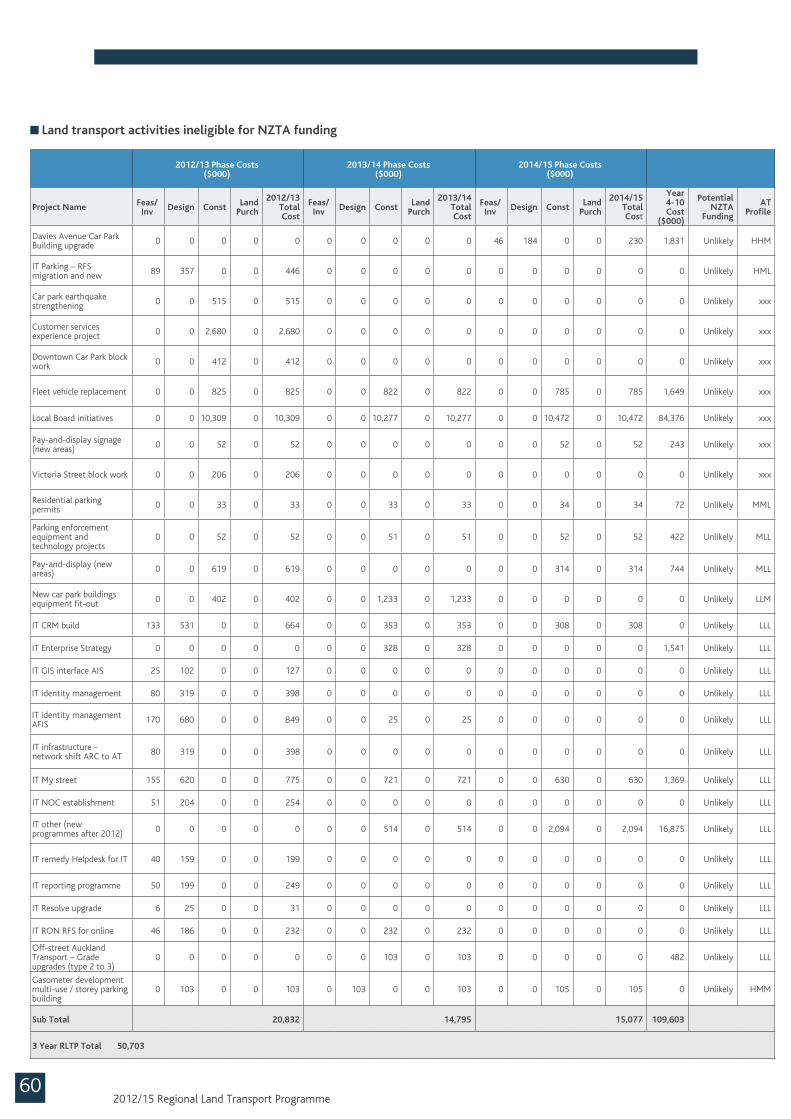
602012/15 Regional Land Transport Programme
Land transport activities ineligible for NZTA funding
2012/13 Phase Costs ($000)
2013/14 Phase Costs ($000)
2014/15 Phase Costs ($000)
Project Name Feas/Inv Design Const Land
Purch
2012/13 Total Cost
Feas/Inv Design Const Land
Purch
2013/14 Total Cost
Feas/Inv Design Const Land
Purch
2014/15 Total Cost
Year 4-10 Cost
($000)
Potential NZTA
Funding
AT Profile
Davies Avenue Car Park Building upgrade 0 0 0 0 0 0 0 0 0 0 46 184 0 0 230 1,831 Unlikely HHM
IT Parking – RFS migration and new 89 357 0 0 446 0 0 0 0 0 0 0 0 0 0 0 Unlikely HML
Car park earthquake strengthening 0 0 515 0 515 0 0 0 0 0 0 0 0 0 0 0 Unlikely xxx
Customer services experience project 0 0 2,680 0 2,680 0 0 0 0 0 0 0 0 0 0 0 Unlikely xxx
Downtown Car Park block work 0 0 412 0 412 0 0 0 0 0 0 0 0 0 0 0 Unlikely xxx
Fleet vehicle replacement 0 0 825 0 825 0 0 822 0 822 0 0 785 0 785 1,649 Unlikely xxx
Local Board initiatives 0 0 10,309 0 10,309 0 0 10,277 0 10,277 0 0 10,472 0 10,472 84,376 Unlikely xxx
Pay-and-display signage (new areas) 0 0 52 0 52 0 0 0 0 0 0 0 52 0 52 243 Unlikely xxx
Victoria Street block work 0 0 206 0 206 0 0 0 0 0 0 0 0 0 0 0 Unlikely xxx
Residential parking permits 0 0 33 0 33 0 0 33 0 33 0 0 34 0 34 72 Unlikely MML
Parking enforcement equipment and technology projects
0 0 52 0 52 0 0 51 0 51 0 0 52 0 52 422 Unlikely MLL
Pay-and-display (new areas) 0 0 619 0 619 0 0 0 0 0 0 0 314 0 314 744 Unlikely MLL
New car park buildings equipment fit-out 0 0 402 0 402 0 0 1,233 0 1,233 0 0 0 0 0 0 Unlikely LLM
IT CRM build 133 531 0 0 664 0 0 353 0 353 0 0 308 0 308 0 Unlikely LLL
IT Enterprise Strategy 0 0 0 0 0 0 0 328 0 328 0 0 0 0 0 1,541 Unlikely LLL
IT GIS interface AIS 25 102 0 0 127 0 0 0 0 0 0 0 0 0 0 0 Unlikely LLL
IT identity management 80 319 0 0 398 0 0 0 0 0 0 0 0 0 0 0 Unlikely LLL
IT identity management AFIS 170 680 0 0 849 0 0 25 0 25 0 0 0 0 0 0 Unlikely LLL
IT infrastructure - network shift ARC to AT 80 319 0 0 398 0 0 0 0 0 0 0 0 0 0 0 Unlikely LLL
IT My street 155 620 0 0 775 0 0 721 0 721 0 0 630 0 630 1,369 Unlikely LLL
IT NOC establishment 51 204 0 0 254 0 0 0 0 0 0 0 0 0 0 0 Unlikely LLL
IT other (new programmes after 2012) 0 0 0 0 0 0 0 514 0 514 0 0 2,094 0 2,094 16,875 Unlikely LLL
IT remedy Helpdesk for IT 40 159 0 0 199 0 0 0 0 0 0 0 0 0 0 0 Unlikely LLL
IT reporting programme 50 199 0 0 249 0 0 0 0 0 0 0 0 0 0 0 Unlikely LLL
IT Resolve upgrade 6 25 0 0 31 0 0 0 0 0 0 0 0 0 0 0 Unlikely LLL
IT RON RFS for online 46 186 0 0 232 0 0 232 0 232 0 0 0 0 0 0 Unlikely LLL
Off-street Auckland Transport – Grade upgrades (type 2 to 3)
0 0 0 0 0 0 0 103 0 103 0 0 0 0 0 482 Unlikely LLL
Gasometer development multi-use / storey parking building
0 103 0 0 103 0 103 0 0 103 0 0 105 0 105 0 Unlikely HMM
Sub Total 20,832 14,795 15,077 109,603
3 Year RLTP Total 50,703
61
Appendix 1: Legislative Requirements

(i) contributes to the aim of achieving an affordable, integrated, safe, responsive, and sustainable land transport system; and
(ii) contributes to each of the following:
(A) assisting economic development:
(B) assisting safety and personal security:
(C) improving access and mobility:
(D) protecting and promoting public health:
(E) ensuring environmental sustainability; and
(iii) is consistent with the relevant GPS and the Auckland regional land transport strategy; and
(c) take into account any –
(i) national land transport strategy; and
(ii) national energy efficiency and conservation strategy; and
(iii) relevant national policy statement and any relevant regional policy statements or plans that are for the time being in force under the Resource Management Act 1991; and
(iv) relevant regional public transport plan; and
(v) likely funding from any source.
17 Form and content of Auckland Transport’s regional land transport programmes
(1) Auckland Transport’s regional land transport programme must contain, for the 3 financial years to which the programme relates,—
(a) the following activities and combinations of activities that Auckland Transport decides to include in the programme:
(i) activities or combinations of activities proposed by Auckland Transport or the
governing body of the Auckland Council; and
(ii) activities or combinations of activities relating to State highways in the region that are proposed by the Agency; and
(iii) activities or combinations of activities, other than those relating to State highways, that the Agency may propose for Auckland and that it wishes to see included in the programme; and
The legislative requirements for Auckland RLTP are contained in the Land Transport Management Act 2003. The key provisions are set out below.
12 Overview of regional land transport programmes
(1) A regional land transport programme allows approved organisations and the Agency to recommend funding for land transport activities or combinations of activities from the national land transport fund that will contribute to –
(a) a region’s outcomes that are identified in the relevant regional land transport strategy; and
(b) any outcomes, objectives and impacts identified by the Crown in any national land transport strategy or the relevant GPS.
(2) Regional land transport programmes, which are prepared by regional transport committees (or, in the case of Auckland, Auckland Transport), include –
(a) proposed activities and combinations of activities for 3 financial years; and
(b) an indication of significant activities for the following 3 financial years; and
(c) a 10-year financial forecast.
13 Responsibility for preparing and approving regional land transport programmes
(2) Every 3 financial years, Auckland Transport, in the case of Auckland, must –
(a) prepare an Auckland regional land transport programme; and
(b) approve the Auckland regional land transport programme by a date appointed by the Agency.
15 Core requirements of regional land transport programmes prepared by Auckland Transport
Auckland Transport must, in preparing an Auckland regional land transport programme, –
(a) be satisfied that the Auckland regional land transport programme –
622012/15 Regional Land Transport Programme
63
(3) The programme must also include –
(a) a statement of transport priorities for the region for the 6 financial years from the start of the programme; and
(b) a list of each activity or combination of activities that have been started but are not yet completed; and
(c) an identification of those activities or combinations of activities (if any) that have interregional significance; and
(d) an explanation of the proposed action if it is proposed that an activity or combination of activities be varied, suspended, or abandoned; and
(e) an indication of any nationally or regionally significant activities that are likely to be recommended for inclusion in the national land transport programme over the 3 financial years following the programme; and
(f) a financial forecast of revenue and expenditure on activities for the 10 financial years from the start of the programme; and
(g) a description of how monitoring will be undertaken to assess implementation of the programme; and
(h) a summary of the consultation carried out in the preparation of the programme; and
(i) a summary of the policy relating to significance adopted by Auckland Transport under section
106(2); and
(j) any other relevant matters.
(4) To include activities or combinations of activities in a national land transport programme, the programme must be in the form and contain the detail that the Agency prescribes in writing to Auckland Transport.
(5) The assessment under subsection (1) (d) must be in a form and contain the detail required by Auckland Transport, taking account of any prescription made by the Agency under subsection (4).
(b) any activities or combinations of activities that are proposed by the governing body of the Auckland Council or any other approved organisation to be –
(i) included in the programme; and
(ii) fully funded from sources other than the national land transport fund; and
(c) the order of priority, as determined by Auckland Transport, of the activities or combinations of activities that it decides to include in the programme under paragraph (a); and
(d) an assessment of each activity or combination of activities, prepared in accordance with subsection (5) by the organisation that proposed the activity or combination of activities under paragraph (a), which must include –
(i) the objective or objectives to be achieved; and
(ii) an estimate of the total cost and the cost for each year; and
(iii) the expected duration; and
(iv) any proposed sources of funding (including, but not limited to, the national land transport fund, tolls, funding from approved organisations, and contributions from other parties); and
(v) any other relevant information; and
(e) an assessment of each activity or combination of activities, prepared in accordance with subsection (6) by the approved organisation that proposed the activity or combination of activities under paragraph (b), which must include –
(i) an estimate of the total cost and the cost for each year; and
(ii) the expected duration.
(2) The programme must contain assessments by Auckland Transport of
(a) how the programme complies with section 15; and
(b) the relationship of Police activities or combinations of Police activities to the programme.
(h) the New Zealand Historic Places Trust; and
(i) the New Zealand Railways Corporation; and
(j) representative groups of land transport users and providers (including representative groups of coastal shipping users and providers); and
(k) affected communities; and
(l) Māori of the region; and
(m) the public in the region.
(2) If consulting the Auckland Council, a regional land transport committee or Auckland Transport must consult both the governing body and each affected local board of the Council.
(6) The assessment under subsection (1) (e) must be in a form and contain the detail required by Auckland Transport.
18 Consultation requirements
(1) When preparing a regional land transport programme, a regional transport committee or Auckland Transport (as the case may require) must consult –
(a) every affected regional council; and
(ab) the Auckland Council, if affected; and
(b) every affected territorial authority; and
(c) every affected approved public organisation; and
(d) the Agency; and
(e) the Commissioner; and
(f) affected district health boards; and
(g) the Accident Compensation Corporation; and
Assessment of compliance with section 15The following table contains an assessment of how this RLTP complies with section 15 of the LTMA, as required by section 17 (2) (a).
LTMA requirement Assessment
(a) be satisfied that the Auckland regional land transport programme—(i) contributes to the aim of achieving an affordable, integrated, safe, responsive, and sustainable land transport system; and(ii) contributes to each of the following:(A) assisting economic development:(B) assisting safety and personal security:(C) improving access and mobility:(D) protecting and promoting public health:(E) ensuring environmental sustainability; and(iii) is consistent with the relevant GPS and the Auckland regional land transport strategy; and
As noted in Chapter 1, this RLTP and the prioritisation process it contains has been based on the 2010 RLTS, which has taken the overall aim and objectives of the LTMA (section 15 (a) (i) and (ii)) into account in its preparation. For example, the RLTS includes objectives which match those in subsection (ii). By implementing the key strategic direction set in the RLTS, the RLTP therefore contributes to these aims and objectives.
The importance of the GPS and RLTS as strategic references for this RLTP is recognised in Chapter 1. The prioritisation process has used both the GPS and the RLTS as key reference points, in addition to the Auckland Plan. This RLTP is consistent with the GPS by indicating which activities are likely to receive government funding under current GPS.
(c) take into account any—(i) national land transport strategy; (ii) national energy efficiency and conservation strategy; (iii) relevant national policy statement and any relevant regional policy statements or plans that are for the time being in force under the Resource Management Act 1991;(iv) relevant regional public transport plan; (v) likely funding from any source.
There is no national land transport strategy as defined in the LTMA. The national energy efficiency and conservation strategy and the regional policy statement and plans were addressed through the RLTS process, which this RLTP is consistent with. The public transport activities included in this plan are consistent with the public transport policies and service proposals described in the current Auckland Regional Public Transport Plan. The funding plan (Chapter 6) includes an assessment of the likely funding available for transport in the region during the period covered by this RLTP.
642012/15 Regional Land Transport Programme
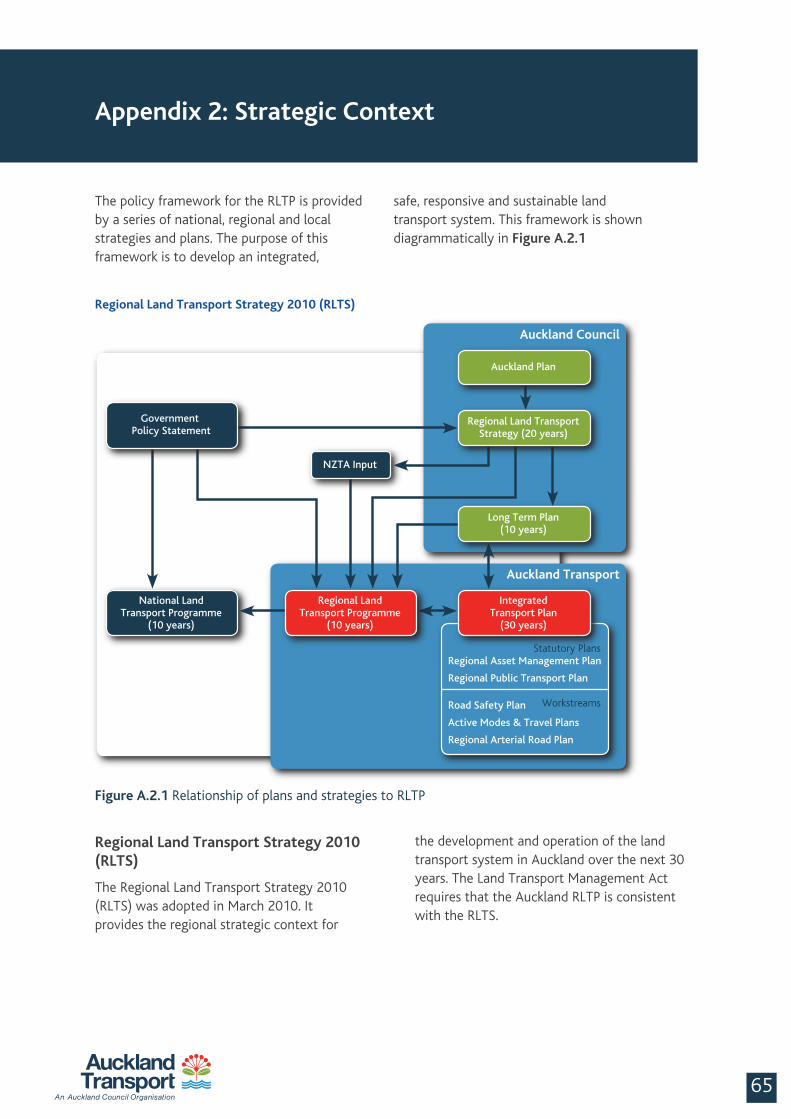
65
Regional Land Transport Strategy 2010 (RLTS)
The Regional Land Transport Strategy 2010 (RLTS) was adopted in March 2010. It provides the regional strategic context for
Appendix 2: Strategic Context
Figure A.2.1 Relationship of plans and strategies to RLTP
The policy framework for the RLTP is provided by a series of national, regional and local strategies and plans. The purpose of this framework is to develop an integrated,
Regional Land Transport Strategy 2010 (RLTS)
safe, responsive and sustainable land transport system. This framework is shown diagrammatically in Figure A.2.1
the development and operation of the land transport system in Auckland over the next 30 years. The Land Transport Management Act requires that the Auckland RLTP is consistent with the RLTS.
National LandTransport Programme
(10 years)
Regional Asset Management Plan
Regional Public Transport Plan
Road Safety Plan
Active Modes & Travel Plans
Regional Arterial Road Plan
IntegratedTransport Plan
(30 years)
Statutory Plans
Auckland Transport
Auckland Council
YesNo
yesNoNo Yes
Workstreams
Auckland Plan
Regional LandTransport Programme
(10 years)
Government Policy Statement
Activity Submitted
Discretionary Activity
Committed Activity
Profile strategic fit andeffectiveness as ‘High’
for all activitiesRank above discretionary
activities
Rank abovediscretionary
activities
Committed Activity
Profile efficiency
Rank activities based on scoring system and AucklandTransport’s project prioritisation layers
NZTA Input
Long Term Plan(10 years)
Regional Land TransportStrategy (20 years)
Profile strategicfit and
effectiveness
Generic profilestrategic fit
andeffectiveness
The RLTS 2010 sets out the objectives and outcomes for Auckland’s transport system over the next 30 years, as summarised in the following table.
Objective Main outcomes
Assisting economic development improved regional and interregional freight efficiency
Assisting safety and personal security improved transport system safety
Improving access and mobility improved public transport (PT) accessibility for all
Protecting and promoting public healthreduced exposure to the negative impacts of transport pollution on human health
increased walking and cycling
Ensuring environmental sustainability reduced greenhouse gas emissions from the transport network
Integrate transport and land use supportive of the RGS and ARPS
improved public transport links to and between identified higher density growth centres
Achieving economic efficiency improved value for money from transport investment
The GPS acknowledges the need for an efficient and effective transport system in Auckland as a key link to national economic growth, and identifies three focus areas for the land transport sector:
1. Increasing economic growth and productivity as the primary objective of land transport expenditure. This will include a focus on:• Progressing the Roads of National Significance• Investing in the state highway network• Getting Auckland’s transport to work more
effectively• Making quality investment in public transport• Improving local roading• Investing in walking and cycling• Viewing networks from a national perspective• Promoting integrated planning.
2. Value for money – this is critical as it determines the level of benefits realised from transport investment
3. Road safety – the majority of road deaths and serious injuries are avoidable and can be reduced or prevented by implementing the Safer Journeys Strategy1 and action plans.
Auckland Plan
The Auckland Plan is prepared by the Auckland Council, and sets a long-term (20-30 year) strategy that contributes to Auckland’s social, economic, environmental and cultural wellbeing. It is primarily required to determine how Auckland will grow and develop in the future, and to identify the existing and future locations of critical infrastructure facilities, including transport.
Development of strategic priorities
To contribute to these objectives and outcomes, the RLTS developed a policy hierarchy approach to improving transport in Auckland. This consists of first evaluating region-wide activities which can affect the demand for transport before considering increases to the capacity of the transport system. This approach led to the development of the following six strategic priorities:
• Support and contribute to a compact and contained urban system consisting of centres, corridors and rural settlements
• Implement behaviour change programmes
• Continue major investment in rail, bus and ferry infrastructure and service improvements
• Improve the operation of existing roads, especially regional arterials
• Construct limited additional road capacity
• Reduce the impacts of transport on the natural environment and communities.
Government Policy Statement on land transport funding (GPS)
The GPS sets out the Government’s outcomes and investment priorities for the land transport sector. It also describes the future level of transport funding that will be provided by the Government via the NLTF. The current GPS was issued in 2011. It covers the financial period 2012/13 to 2017/18, and provides indicative figures from 2018/19 to 2021/22.
662012/15 Regional Land Transport Programme
1. Launched in March 2010, the strategy outlines its vision for achieving the long-term goal for road safety in New Zealand

67
and KiwiRail to deliver an integrated One System approach to developing and operating Auckland’s transport system. At the strategic level, the ITP 2012-42 has a 30-year horizon to reflect the Auckland Plan and RLTS. While not a statutory document, it is an essential delivery mechanism for transport in the Auckland region.
Its key purpose is to:• Provide the strategic context and framework
for prioritising and integrating transport activities from different agencies
• Bridge the gap between long-term outcomes sought by the Auckland Plan and RLTS and the shorter term focus of the RLTP
• Indicate how the key actions and activities can be implemented together, their affordability and how risks can be managed
• Provide Auckland Council, NZTA and other key stakeholders with a clear picture of the preferred approach for implementing the Auckland Plan (and RLTS)
• Create confidence for funding the RLTP based on the above stakeholders support for the ITP.
The ITP will reflect the One System approach discussed in chapter 4, with a focus on developing an indicative 30-year funding plan. It will be completed by 30 June 2012 and will reflect the strategic directions of the Auckland Plan and the new GPS. Work already undertaken on the ITP informs the strategic sections of this RLTP.
The Government is considering whether the Auckland Plan will ultimately replace the RLTS as the key strategic document for transport in Auckland. If this comes about it will further highlight the value of the ITP in bridging the gap between the long-term strategic approach of the Auckland Plan and the short-to-medium term tactical focus of the RLTP.
Treaty responsibilities
Auckland Transport acknowledges its responsibilities to te Tiriti o Waitangi Treaty of Waitangi and expects that transport plans and programmes will contribute to Māori aspirations and wellbeing. Auckland Transport recognises Māori cultural values and perspectives and is developing its partnership with Māori.
The Auckland Plan sets out a development strategy, which assumes a significant amount of growth within the current Auckland urban area, with a strong emphasis on centre-based growth. It also identifies a number of priority growth areas where public infrastructure development, including transport, is expected to be focused.
The Auckland Plan identifies the need for a transformational shift in public transport, with a target to double the number of public transport trips over the next decade. This requires continued investment in the rapid transit and quality transit networks supporting intensification of centres, corridors and future urban areas. The Auckland Plan also includes developing the City Rail Link as the major transport priority for Auckland.
Long-term Plan
The Auckland Council has prepared its Long-term Plan 2012-2022 concurrently with the RLTP. The Long-term Plan sets out all the proposed activities and expenditures for the council and its subsidiaries over the next 10 years, including proposed expenditure on Auckland Transport’s activities.
This RLTP provides detail for the higher-level budget figures provided in the Long-term Plan (with the exception of state highways activities that are not funded by the Auckland Council).
Asset Management Plan
The purpose of the Asset Management Plan is to manage the asset portfolio in the most cost-effective and sustainable manner to meet the levels of service required from the network. This plan provides details of the programmes and projects for inclusion in the Long Term Plan (LTP) and the Regional Land Transport Programme (RLTP).
In fulfilling this purpose the Asset Management Plan defines the levels of service, identifies risks and mitigating measures, develops life cycle management strategies and identifies long-term financial needs of the network.
Integrated Transport Plan
Parallel with developing this RLTP, Auckland Transport is preparing an Integrated Transport Plan (ITP). The ITP integrates key strategies, tactical plans, programmes and project packages developed by Auckland Transport, NZTA, Auckland Council
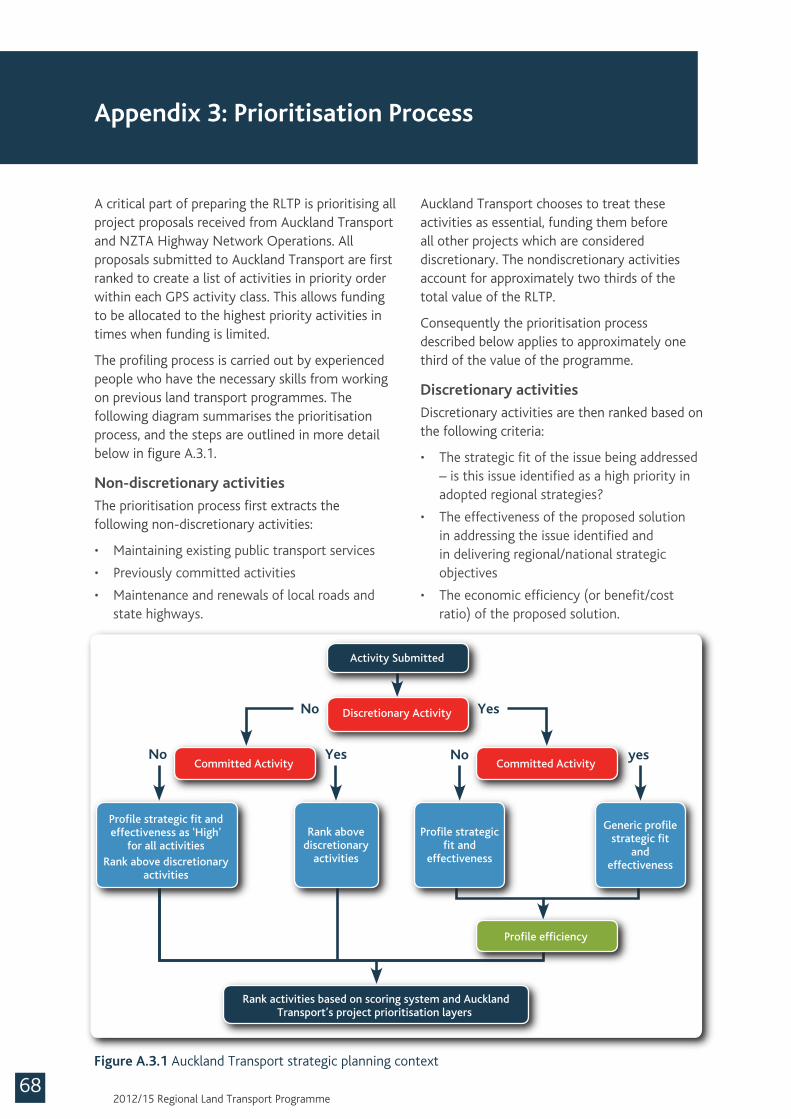
Auckland Transport chooses to treat these activities as essential, funding them before all other projects which are considered discretionary. The nondiscretionary activities account for approximately two thirds of the total value of the RLTP.
Consequently the prioritisation process described below applies to approximately one third of the value of the programme.
Discretionary activities
Discretionary activities are then ranked based on the following criteria:
• The strategic fit of the issue being addressed – is this issue identified as a high priority in adopted regional strategies?
• The effectiveness of the proposed solution in addressing the issue identified and in delivering regional/national strategic objectives
• The economic efficiency (or benefit/cost ratio) of the proposed solution.
A critical part of preparing the RLTP is prioritising all project proposals received from Auckland Transport and NZTA Highway Network Operations. All proposals submitted to Auckland Transport are first ranked to create a list of activities in priority order within each GPS activity class. This allows funding to be allocated to the highest priority activities in times when funding is limited.
The profiling process is carried out by experienced people who have the necessary skills from working on previous land transport programmes. The following diagram summarises the prioritisation process, and the steps are outlined in more detail below in figure A.3.1.
Non-discretionary activities
The prioritisation process first extracts the following non-discretionary activities:
• Maintaining existing public transport services
• Previously committed activities
• Maintenance and renewals of local roads and state highways.
Figure A.3.1 Auckland Transport strategic planning context
682012/15 Regional Land Transport Programme
National LandTransport Programme
(10 years)
Regional Asset Management Plan
Regional Public Transport Plan
Road Safety Plan
Active Modes & Travel Plans
Regional Arterial Road Plan
IntegratedTransport Plan
(30 years)
Statutory Plans
Auckland Transport
Auckland Council
YesNo
yesNoNo Yes
Workstreams
Auckland Plan
Regional LandTransport Programme
(10 years)
Government Policy Statement
Activity Submitted
Discretionary Activity
Committed Activity
Profile strategic fit andeffectiveness as ‘High’
for all activitiesRank above discretionary
activities
Rank abovediscretionary
activities
Committed Activity
Profile efficiency
Rank activities based on scoring system and AucklandTransport’s project prioritisation layers
NZTA Input
Long Term Plan(10 years)
Regional Land TransportStrategy (20 years)
Profile strategicfit and
effectiveness
Generic profilestrategic fit
andeffectiveness
Appendix 3: Prioritisation Process
69
• An overall High rating for the strategic fit factor only requires a High against one priority
• A Medium rating requires a Medium against one priority
• All others are Low.
Effectiveness
Effectiveness is the extent to which the proposed activity addresses the issue identified in the strategic fit criteria and also whether a thorough investigation of potential solutions has been undertaken.
• A High rating can be obtained if the project matches the criteria listed below
• If the project is part way towards matching the criteria listed below then a Medium rating is given.
Efficiency
The efficiency of an activity is based on the benefit/cost ratio (BCR). It is reported to one decimal place. At the time of writing, the profile relationship for the efficiency is:
• High: BCR ≥ 4.0
• Medium: 2.0 ≤ BCR < 4.0
• Low: 1.0 ≤ BCR < 2.0
Ranking schemes and creation of the programme
Finally, in order to prioritise projects with the same profile, a points system is used. Points are awarded based on the degree to which projects meet the criteria of the strategic focus areas, effectiveness and efficiency, in effect, giving a finer grain of detail to the High, Medium and Low prioritisation system.
It is important to note that the GPS 2012 targets are explicitly taken account of in the prioritisation process through the development of the Statement of Priorities that informed this prioritisation process.
Auckland Transport’s prioritisation layers
The above system does not fully consider a number of important other factors and so must be considered as one of several prioritisation layers. The prioritisation layering system shown below is used to create a programme of Auckland
Where there are any external factors that influence project timing, any interdependencies with other actions that make implementation urgent, or opportunities to work more efficiently by combining activities, these factors are considered during the programming of specific projects to specific years.
Each project is rated High, Medium or Low (H, M or L) for each of the three factors resulting in a profile (e.g. HHM). Each element of the profiling system is explained in detail below.
Strategic fit
Strategic fit considers how the identified problem, issue or opportunity aligns with Auckland Council’s strategic investment direction, primarily contained in the Auckland Plan and the RLTS. The government’s investment priorities as detailed in the GPS 2012 have also been taken into account.
The following priority focus areas have been identified to respond and contribute to fulfilling the expectations set in these guiding strategic documents, and are discussed in more detail below:
1. Support the integration between land use and transport
2. Improve the connectivity and integration of the regions transport system.
3. Make best use of the existing transport system.
4. Improve transport safety and reduce the adverse impacts from transport on the surrounding environment.
These priority focus areas have been used to determine the strategic fit for each of the activities for which funding is sought. Ratings are allocated as follows:
• A High rating can be obtained if the project delivers an activity identified in the priority focus areas
• If the project is part way towards delivering an activity identified in the priority focus areas then a Medium rating is given
• All other projects score a Low.
The second step is then to allocate an overall rating for the strategic fit factor.
outcomes that enhance liveability along the corridor.
Examples of types of activity which could contribute to this priority focus area include:
• Public transport infrastructure projects and service improvements on QTN and RTN routes, which support land use as proposed in the Auckland Plan
• Road network improvements which support land use developments as proposed in the Auckland Plan
• Integrated transport assessment guidelines and studies
• Studies and investigations that will enable route protection for RTN and major road extensions and support land development as proposed in the Auckland Plan
• Area and sub-regional strategies that include corridor management plans as identified in the Auckland Plan
• Projects that develop shared spaces in support of place shaping and urban form.
Priority focus area 2: Improve the connectivity and integration of the region’s transport system
Auckland’s transport system fulfils a vital role in the movement of people and goods as well as encouraging and supporting the development of places, such as residential and business growth areas. The connectivity and integration of the transport system can be improved by ensuring that:
• The networks of the different transport modes are connected and integrated to function as a single system, i.e. the state highway network and regional arterial roads are integrated to function as One System
• Modal services are integrated to provide a seamless transport outcome.
Several key regional transport links still need to be investigated, protected, completed and/or upgraded in order to improve the transport system’s performance. For example, completion of the Western Ring Route, key interchange points on the identified RTN and QTN networks,
Transport’s projects:
1. Meet legal commitments, e.g. existing contracts, Auckland Council agreements
2. Support and enable Auckland Plan, e.g. building public transport capability in projected growth areas
3. Priority rating index:
• Strategic fit
• Transport effectiveness
• Economic efficiency
4. Optimising available NZTA funds – category allocation, spread of activity by funding class
5. Balancing contract size and location – few large contracts – limits spread of work and limits regional balance
6. Integrating other work (e.g. KiwiRail electrification, NZTA Waterview)
7. Special interest requirements – multiple requests.
Priority focus areas
The following priority focus areas have been used to determine the strategic fit for each of the activities for which funding is sought:
Priority focus area 1: Support the integration between land use and transport
This priority focus area promotes the development of an integrated multi-modal transport system that supports proposed growth and intensification in identified parts of the region, as set out in the Auckland Plan. An integrated approach will be enhanced by the use of a collaborative development and consenting process that is focussed on place-shaping outcomes as prioritised in the Auckland Plan. This must be led by the use of acceptable design principles and standards. The use of corridor management plans designed to cater for the specific needs of an individual road corridor will provide solutions that are both sensitive to the adjoining land uses as well as the movement priority of the roads in question. Such plans will enable the ability to prioritise between transport modes that will improve the efficiency and effectiveness of the corridor to move people and freight as well as achieve better design
60702012/15 Regional Land Transport Programme

6171
behaviour change programmes to change demand patterns.
Making the best use of existing infrastructure requires managing the demand for travel through providing alternatives where appropriate (such as walking, cycling, public transport and ride sharing), giving people information about alternative ways of meeting their travel needs, retrofitting existing infrastructure to accommodate public transport and active modes, educating transport users about the impacts resulting from their choices and encouraging them to use more efficient and sustainable modes.
Examples of types of activity which could contribute to this priority focus area include:
• Maintenance programmes, asset management plans and activity management plans
• travel demand management programmes such as travel planning and improvements to cycle and walking facilities
• Route optimisation activities, traffic signal coordination
• Management of road space to prioritise the movement of people, goods and services
• Public transport service reviews and system improvements such as shelters, provision of information and integrated ticketing systems
• Operation of the Traffic Management Unit
• Road renewal initiatives arising from innovative pavement management solution like long life surfacing that reduces whole of life cycle management cost
• Use of Recycled Asphalt Pavement (RAP) in existing resurfacing renewal programmes. RAP comes from millings off existing asphalt surfaces.
Priority focus area 4: Improve transport safety and reduce the adverse impacts from transport on the surrounding environment
Safety forms part of every endeavour of Auckland Transport. Improving transport
the AMETI project, the East-West Link from AMETI to Onehunga, and completion of the regional cycle network are all activities that will improve the transport system’s productivity and efficiency. System benefits will be improved when the benefits derived from improving individual modal networks enhances the connectivity and throughput of the total system. In this way the performance of the system becomes greater than the sum of the parts.
Examples of types of activity which could contribute to this priority focus area include:
• Projects that improve journey time reliability and easing of severe congestion on key routes
• Projects that improve productivity of key freight routes
• Arterial and local road network improvements that support productivity improvements of the RoNS and motorways
• Public transport infrastructure projects and service on the QTN and RTN routes which improve efficiency and effectiveness of the network and its connectivity
• Activity management plans to manage transport assets such as roads, passenger transport infrastructure and walking and cycling related plans
• Planning, protection and construction of missing links in the region’s road, public transport and walking and cycling networks.
Priority focus area 3: Make best use of the existing transport system
Both central and regional government have identified the need to improve the efficiency and effectiveness of the existing transport system by making best use of existing assets and resources before considering adding additional capacity. There are a number of ways in which this can be achieved, such as prioritising timely and effective road maintenance, improving and optimising traffic signalling at route and network level, integrating public transport services between modes, undertaking regular service reviews to analyse possible gaps, and implementing
722012/15 Regional Land Transport Programme
safety and security requires that the needs of all transport users are fully considered in the design, development and operation of the transport system and reflect best practice. Improving safety through actions that, for example, focus on identifying arterial roads and urban intersections that have a high crash risks, safety retrofitting and road redesign projects to ensure that people using the transport system are increasingly free of the possibility of being fatally injured or seriously injured are therefore seen as essential.
While the transport system contributes to the economic, cultural and social wellbeing of the community, it also negatively impacts on the environment and the health of residents, such as the impacts from vehicle emissions. Where possible, transport activities should seek to reduce the negative impacts on the environment and health.
Examples of types of activity which could contribute to this priority focus area include:
• Road safety initiatives arising from Safer Journeys including investigations using the High-Risk Intersections Guide and the High-Risk Rural Roads Guide
• Road safety initiatives arising from the Regional Road Safety Plan
• Crash reduction studies and safety audits
• Black spot investigation and remediation
• Programmes to increase personal security around public transport interchange points
• Activities that manage discharge of stormwater contaminants from roads
• Activities that increase the resilience and ability of the transport system to respond to climate change, natural disasters and energy price volatility
• Activities that encourage improvements in public health such as walking and cycling
• Road stormwater management initiatives arising from use environmentally sustainable and innovative products like Tetrtraps (catchpit pollutant management device) that treat stormwater at source and improve stormwater quality in receiving environments.
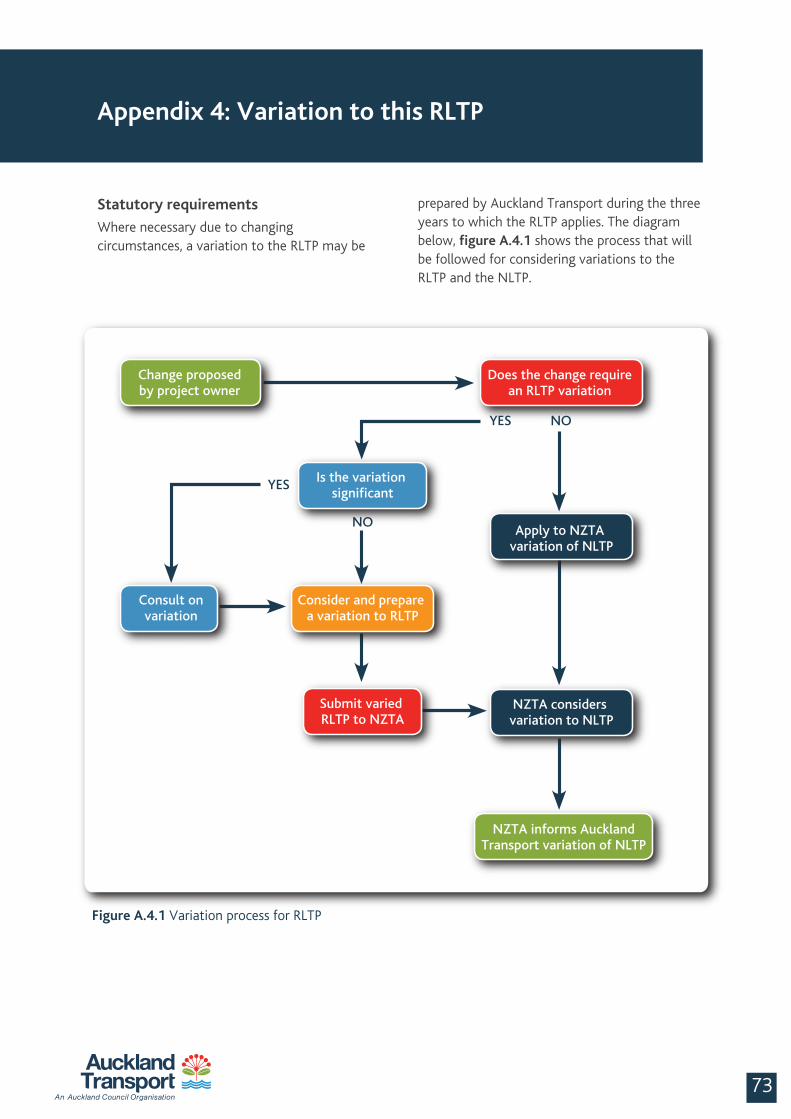
73
Statutory requirements
Where necessary due to changing circumstances, a variation to the RLTP may be
prepared by Auckland Transport during the three years to which the RLTP applies. The diagram below, figure A.4.1 shows the process that will be followed for considering variations to the RLTP and the NLTP.
Figure A.4.1 Variation process for RLTP
Appendix 4: Variation to this RLTP
NO
Change proposed by project owner
Is the variation significant
Does the change require an RLTP variation
Consult onvariation
Submit varied RLTP to NZTA
Apply to NZTA variation of NLTP
NZTA considers variation to NLTP
NZTA informs Auckland Transport variation of NLTP
YES
YES
NO
Consider and prepare a variation to RLTP
Section 106 (2) of the LTMA requires Auckland Transport to adopt a policy that determines significance in respect of variations made to the RLTP. Where a variation is considered to be significant in terms of the policy, the special consultative procedure (as provided in the Local Government Act 2002) must be applied.
Any variation that is deemed to be not significant may still be consulted on at the discretion of Auckland Transport, using the consultation principles contained in the Local Government Act.
Significance of variations policy
In deciding whether a proposed variation is significant or not, Auckland Transport will assess, as a guideline, whether or not the proposed variation meets the following thresholds:
• The inclusion of a construction phase for a new state highway project with a total activity or project cost greater than 10 per cent of the activity class New and Improved Infrastructure for State Highways in the RLTP
• Changes to the scope of an activity or project that increases expenditure in the relevant activity class in the RLTP by more than 10 per cent
• Changes to this significance of variations policy.
The following variations are examples of proposed variations which do not meet the threshold and therefore may be considered not significant:
• Replacement of an activity or project within a group of related activities or projects by another activity or project of the same or substantially similar type
• Cost changes that do not affect the scope of an activity or project.
When considering the significance of a variation, Auckland Transport will consider the following criteria:
• The extent to which Auckland Transport has responsibility for the relevant activity or project which is subject to the variation
• Whether the variation has already been consulted on under the LTMA or the Local Government Act 2002, in which case further consultation may be unnecessary
• The extent to which there is, or is likely to be, a change in the capacity of Auckland Transport to deliver its statutory objective, including giving effect to the RLTS (subject to specified legislative exceptions)
• Alignment with Auckland Transport’s plans and programme and the GPS
• The costs and benefits of the consultation process.
Auckland Transport will use the following procedures in considering future variations to the RLTP, and this policy on significance:
• Where possible, and if it is not contrary to the consultation principles of LGA, consultation will be carried out on an annual basis rather than for individual variations
• Final decisions on significance shall be made by Auckland Transport
• Auckland Transport will consider requests for variations promptly at its regular meetings and communicate its decision in writing to the applicant and NZTA
• If there is [net] benefit in consulting on a variation that is not significant then Auckland Transport may still consult and will determine the appropriate level of consultation
• Auckland Transport will consider asking an applicant of a significant variation to contribute to the cost of the special consultative procedure.
742012/15 Regional Land Transport Programme
75
(Howick, Manukau,Manurewa-Papakura and Franklin Wards). The Whau ward sits across both Auckland and Waitemata Police district boundaries.
Funding for road policing activities in the region has increased by eight per cent from 2008/09 to 2010/11 due primarily to an increase in the road policing hourly rate. Auckland Transport has sought the advice of road safety professionals via the RoadSafe Auckland steering group. In general, there is strong support in the region for increased drink/drugged driver control, speed enforcement on local urban and rural roads, safety cameras at intersections, and improved delivery of school road safety education.
Police district performance is measured in terms of key indicators including:
• Fatal and serious crash reduction
• Number of compulsory breath tests
• Mean average speeds and restraint use
• Visible enforcement and school road safety delivery
• Road safety action planning
• Attitude change from respondents in the annual Ministry of Transport’s public attitudes to road safety surveys.
Auckland Police District reported a 50 per cent increase in fatalities beyond their target for 2010/11. Waitemata Police District reported a 30 per cent decrease in fatalities below their target for 2010/11, and Counties Manukau Police District met the fatalities 2010/11 target.
Auckland Transport, in collaboration with RoadSafe Auckland and the New Zealand Police, recommends via the Regional Land Transport Programme that NZTA resource an increase in drink/drugged driver control, speed enforcement on both urban and rural local roads, safety cameras at intersections and the improved delivery of road safety education in schools by the NZ Police.
This chapter contains an assessment of the relationship of Police activities to the RLTP, as required by section 17 (2) (b) of the LTMA. Road policing in the Auckland region includes road safety education and enforcement activities funded by the NZTA and delivered by the NZ Police. These activities make up the majority of road safety funding in the Auckland region at $77 million in 2010/11.
Police activities cover both state highways and local roads and include:
• Speed enforcement
• Drinking and/or drugged driver control
• Motorcycle safety*
• Young driver safety*
• Restraint device (safety belt) control
• General visible road safety enforcement
• Commercial vehicle investigation and road user charges enforcement
• Crash attendance and investigation, and prosecutions
• Community service and school road safety education.
*note that speed enforcement, drink/drugged driver control and restraint activities were reduced to accommodate increases in the new activities of motorcycle safety and young driver safety in 2010/11.
These activities target road safety risk areas identified by local road safety action plans. These plans are informed by Police District Road Safety Assessments, the Auckland Regional Road Safety Plan and at a higher level the Safer Journeys Road Safety Strategy to 2020 and Road Policing to 2010 Strategy.
The activities are delivered by specialist police and general duties staff across the three police districts of Waitemata (Rodney, Albany, North Shore, Waitakere and Whau Wards), Auckland (Waitemata and Gulf, Albert-Eden-Roskill, Orakei, Maungakiekie-Tamaki Wards and Whau), and Counties Manukau
Appendix 5: Road Policing Activities
The benefits of funding police road safety enforcement have been established as significant, particularly for speed, drink/driving and safety belt enforcement. Internationally, the benefit / cost ratio for fully implemented best practice police enforcement of these areas has been demonstrated as between 5:1 and 10:1. Apart from the emotional and physical cost of crashes, the social cost of crashes in Auckland amounts to approximately $900 million a year.
Road policing staff as a whole for Auckland has increased by 1.3 FTEs (full-time staff equivalents) in the three-year period from 2008/09 to 2010/11 in the area of motorway traffic management.
762012/15 Regional Land Transport Programme
Auckland’s population for the next three years, from 2012/13 to 2014/15, is estimated to grow by five per cent to a total of 1,573,365 in 2015. As a result, Auckland Transport recommends an overall matching increase in road policing resources for the region of five per cent or 23 FTEs between 2012/13 and 2014/15, targeting drink/drugged driver control, local urban intersection and rural speed enforcement, safety camera technology and road safety education in schools.
77
Glossary
AC Auckland Council
AMETI Auckland-Manukau Eastern Transport Initiative
AT Auckland Transport
BCR Benefit to cost ratio
GPS Government Policy Statement on land transport funding
HNO NZTA Highways Network and Operations responsible for state highways
HPMV High productivity motor vehicles
ITP Auckland Integrated Transport Plan
KPIs Key performance indicators
LTMA Land Transport Management Act 2003
NLTF National Land Transport Fund
NLTP National Land Transport Programme
NorSGA Northern Strategic Growth Area
NZTA NZ Transport Agency
OECD Organisation for Economic Cooperation and Development
QTN Quality Transit Network (key bus and ferry routes)
RLTP Regional Land Transport Programme
RLTS Regional Land Transport Strategy
RoNS Roads of National Significance
RTN Rapid Transit Network (passenger rail and Northern Busway)
SH State highway
VDM Vehicle Dimension Mass