reducing online customer struggle -...
TRANSCRIPT
ReducingOnline custOmeR stRuggleFindings FROm ecOnsultancy’s custOmeR expeRience suRvey
august 2011
visibility
insight
answeRs
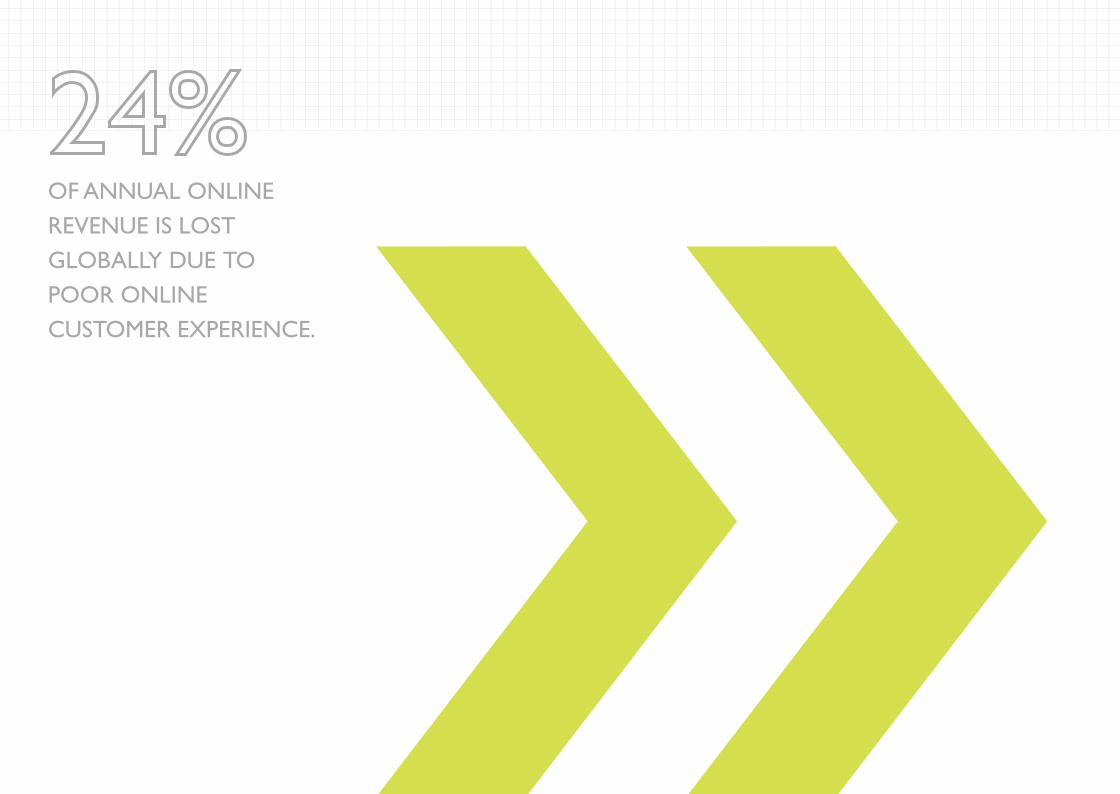
OF annual Online Revenue is lOst glObally due tO pOOR Online custOmeR expeRience.
we have all expeRienced custOmeR stRuggle Online.
We’ve all struggled online, whether it’s difficulty logging into a frequent flyer account, adding an item to a shopping cart, completing a financial transaction or navigating through a site. Yet these seemingly minor issues can have a huge and negative impact on a company’s bottom line.
Our goals in partnering with Econsultancy on this Reducing Online Customer Struggle Report were twofold: • To quantify the business impact of customer struggle • To understand how proactive ebusinesses are in finding customer experience issues and in responding to them
The study’s findings connect well with what Tealeaf has learned working with our customers over the last twelve years – that ebusinesses have much to gain from understanding the online customer experience. This is particularly true at the bottom of the sales funnel, where conversion rates should be highest. The survey results and additional analysis we share in this report will underscore the importance of online customer experience management, or CEM, which is about taking a disciplined approach to understanding how customers interact with your business online and removing the obstacles to their success. CEM is becoming an imperative in today’s multi-channel world, where customers expect seamless interactions whether those interactions are in-person, online, on the mobile web, calling in over the phone or some combination thereof.
3
A POOR OnlinE ExPERiEnCE HAS A SignifiCAnT BuSinESS iMPACT . . . . . . . . . . . . . . . . . . . . . . . . . . . . . . . . . . . . . . . . . . . . . . . . . . . . . . . . . . . . . . . . . . . . . . . . . . . . . . . . . . . . . . . . . .
ORgAnizATiOnS HAvE A liMiTEd undERSTAnding Of THE OnlinE CuSTOMER ExPERiEnCE . . . . . . . . . . . . . . . . . . . . . . . . . . . . . . . . . . . . . . . . . . . . . . . . . . . . . . . . . . . . . . . . . . . . . . . . . . . . . . . . . . . .
HElPing THOSE WHO HElP THEMSElvES . . . . . . . . . . . . . . . . . . . . . . . . . . . . . . . . . . . . . . . . . . . . . . . . . . . . . . . . . . . . . . . . . . . . . . . . . . . . . . . . . . .
COMPAniES HAvE THE lEAST undERSTAndingAT THE BOTTTOM Of THE OnlinE SAlES funnEl . . . . . . . . . . . . . . . . . . . . . . . . . . . . . . . . . . . . . . . . . . . . . . . . . . . . . . . . . . . . .
THE MOST COMMOn And SERiOuS iSSuES MAY BE diffiCulT TO find . . . . . . . . . . . . . . . . . . . . . . . . . . . . . . . . . . . . . . . . . . . . . . . . . . . . . . . . . . . . . . . . . . . . . . . . . . . . . . . . . . . . . . . . . . . . . . . . . . . . . . . . . . . . . . . . . . . . .
THE METHOdS uSEd TO undERSTAnd OnlinE CuSTOMER ExPERiEnCE ARE nOT AlWAYS THE MOST EffECTivE . . . . . . . . . . . . . . . . . . . . . . . . . . . . . . . . . . . . . . . . . . . . . . . . . . . . . . . . . . . . . . . . . . . . . . . . . . . . . . . . . . . . . . . . . . . . . . . . . . . . . . . . . . . . . . . . . . . . . . . . . . . . . . . . . . . . invESTMEnTS in OnlinE CHAnnElS ARE nOT MATCHEd BY invESTMEnTS in OnlinE CuSTOMER ExPERiEnCE . . . . . . . . . . . . . . . . . . . . . . . . . . . . . . . . . . . . . . . . . . . . . . . . . . . . . . . . . . . . . . . . . . . . . . . . . . . . . . . . . . . . . . . . . . . . . . . . .
MAnY ORgAnizATiOnS HAvE fAilEd TO AdOPT A MulTi-CHAnnEl APPROACH . . . . . . . . . . . . . . . . . . . . . . . . . . . . . . . . . . . . . . . . . . . . . . . . . . . . . . . . . . . . . . . . . . . . . . . . . . . . . . . . . . . . . . . . . . . . . . . . . . . . . . . . . . . .
COnCluSiOnS . . . . . . . . . . . . . . . . . . . . . . . . . . . . . . . . . . . . . . . . . . . . . . . . . . . . . . . . . . . . . . . . . . . . . . . . . . . . . . . . . . . . . . . . . . . . . . . . . . . . . . . . . . . . . . . . . . . . . . . . . . . . . . . . . . . . . . . . . . . . . . . . . .
PARTing THOugHTS fROM TEAlEAf . . . . . . . . . . . . . . . . . . . . . . . . . . . . . . . . . . . . . . . . . . . . . . . . . . . . . . . . . . . . . . . . . . . . . . . . . . . . . . . . . . . . . . . . . . . . .
METHOdOlOgY And RESPOndEnT PROfilES . . . . . . . . . . . . . . . . . . . . . . . . . . . . . . . . . . . . . . . . . . . . . . . . . . . . . . . . . . . . . . . . . . . . .
ABOuT ECOnSulTAnCY . . . . . . . . . . . . . . . . . . . . . . . . . . . . . . . . . . . . . . . . . . . . . . . . . . . . . . . . . . . . . . . . . . . . . . . . . . . . . . . . . . . . . . . . . . . . . . . . . . . . . . . . . . . . . . . . . . . . . . . . . . .
ABOuT TEAlEAf . . . . . . . . . . . . . . . . . . . . . . . . . . . . . . . . . . . . . . . . . . . . . . . . . . . . . . . . . . . . . . . . . . . . . . . . . . . . . . . . . . . . . . . . . . . . . . . . . . . . . . . . . . . . . . . . . . . . . . . . . . . . . . . . . . . . . . . . . . . . . . .
table OF cOntents
6
8
9
10
12
14
16
18
20
21
22
23
23
Key Findings:• Poor online user experience, coupled with a lack of insight about why customers are abandoning websites, is causing businesses to lose 24% of their annual online revenues. That equates to more than $50 billion lost in the uS1 and around £14 billion lost in the uK2 in the last year. • Companies have the least understanding about what is happening at the bottom of the online sales funnel, where they need it the most.
• Bad navigation / poor findability is by far the most common and most serious issue customers encounter on their websites, with more than half of respondents mentioning this.
• The most common methods used to understand online customer experience may not be the most effective ones. • despite the obvious benefits of integrating online and offline customer experiences, only 3% of respondents describe the multichannel experience they provide as “excellent.”
As the online channel becomes increasingly valuable to business, it is vital for organizations to ensure that the customer journey is as pain-free and seamless as possible. But what are ebusinesses doing to identify customer struggle? And what are the consequences of failure? The Reducing Customer Struggle Report, published by Econsultancy in association with Tealeaf, is based on a global online survey of almost 500 business professionals working for companies involved in e-commerce and e-business, primarily in the uS and European countries. The survey was conducted in March and April 2011. The survey data revealed that organizations have a long way to go in understanding the online customer experience and that that they have much to gain by doing so.
1 Estimate based on the value of US e-commerce sales in 2010 ($228 billion) published by comScore in February 2011.2 Estimate based on the figures from the IMRG Capgemini e-Retail Sales Index published in January 2011 - £58.5 billion were spent online in 2010.
executive summaRy
5
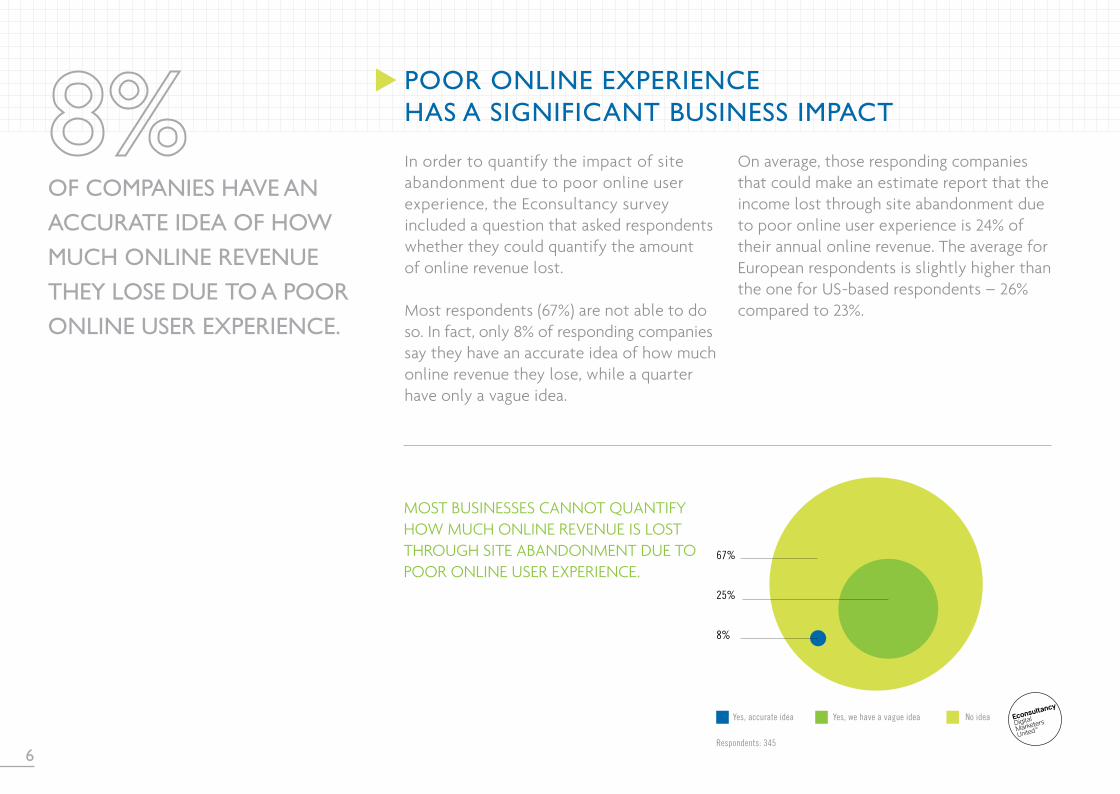
in order to quantify the impact of site abandonment due to poor online user experience, the Econsultancy survey included a question that asked respondents whether they could quantify the amount of online revenue lost. Most respondents (67%) are not able to doso. in fact, only 8% of responding companies say they have an accurate idea of how much online revenue they lose, while a quarter have only a vague idea.
OF cOmpanies have an accuRate idea OF hOw much Online Revenue they lOse due tO a pOOR Online useR expeRience.
pOOR Online expeRience has a signiFicant business impact
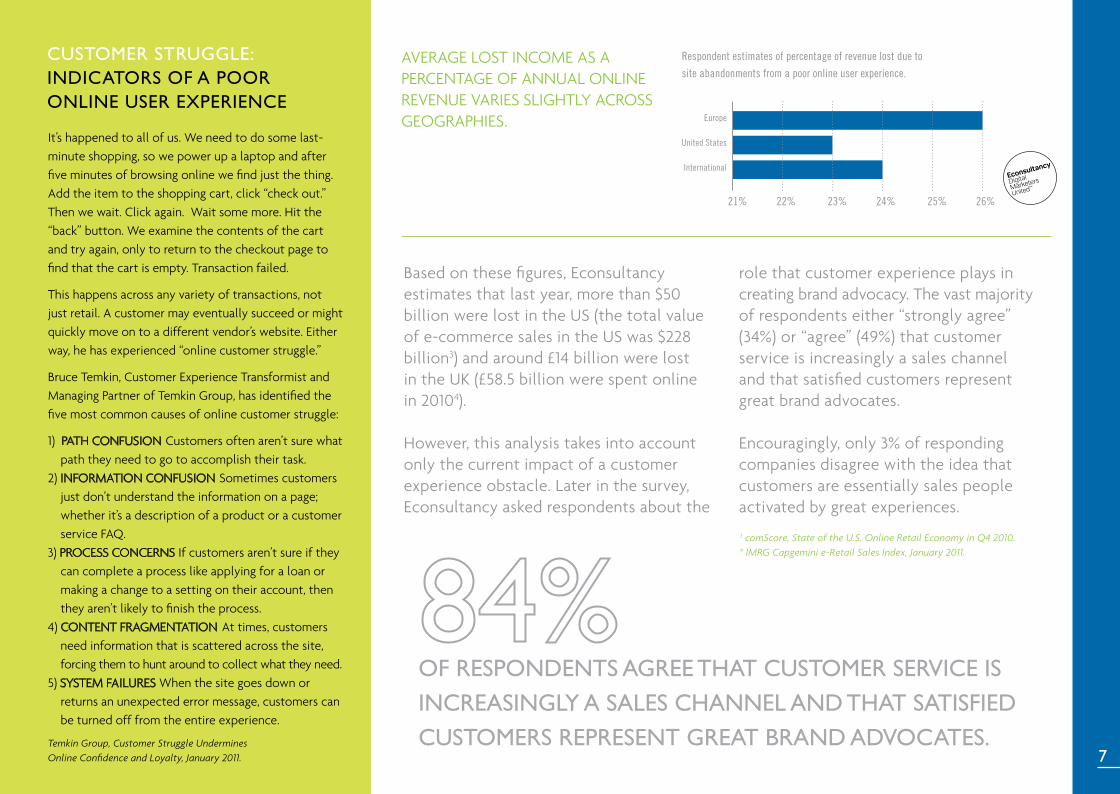
On average, those responding companies that could make an estimate report that the income lost through site abandonment due to poor online user experience is 24% of their annual online revenue. The average for European respondents is slightly higher than the one for uS-based respondents – 26% compared to 23%.
MOST BuSinESSES CAnnOT quAnTifY HOW MuCH OnlinE REvEnuE iS lOST THROugH SiTE ABAndOnMEnT duE TO POOR OnlinE uSER ExPERiEnCE.
6
67%
25%
8%
Yes, accurate idea Yes, we have a vague idea No idea
Respondents: 345
it’s happened to all of us. We need to do some last-minute shopping, so we power up a laptop and after five minutes of browsing online we find just the thing. Add the item to the shopping cart, click “check out.” Then we wait. Click again. Wait some more. Hit the “back” button. We examine the contents of the cart and try again, only to return to the checkout page to find that the cart is empty. Transaction failed.
This happens across any variety of transactions, not just retail. A customer may eventually succeed or might quickly move on to a different vendor’s website. Either way, he has experienced “online customer struggle.”
Bruce Temkin, Customer Experience Transformist and Managing Partner of Temkin group, has identified the five most common causes of online customer struggle:
1) PATH COnfuSiOn Customers often aren’t sure what path they need to go to accomplish their task.2) infORMATiOn COnfuSiOn Sometimes customers just don’t understand the information on a page; whether it’s a description of a product or a customer service fAq. 3) PROCESS COnCERnS if customers aren’t sure if they can complete a process like applying for a loan or making a change to a setting on their account, then they aren’t likely to finish the process. 4) COnTEnT fRAgMEnTATiOn At times, customers need information that is scattered across the site, forcing them to hunt around to collect what they need. 5) SYSTEM fAiluRES When the site goes down or returns an unexpected error message, customers can be turned off from the entire experience.
custOmeR stRuggle: indicatORs OF a pOOR Online useR expeRience
Temkin Group, Customer Struggle Undermines Online Confidence and Loyalty, January 2011.
Based on these figures, Econsultancy estimates that last year, more than $50 billion were lost in the uS (the total value of e-commerce sales in the uS was $228 billion3) and around £14 billion were lost in the uK (£58.5 billion were spent online in 20104).
However, this analysis takes into account only the current impact of a customer experience obstacle. later in the survey, Econsultancy asked respondents about the
7
Respondent estimates of percentage of revenue lost due to
site abandonments from a poor online user experience.
Europe
21% 22% 23% 24% 25% 26%
United States
International
OF RespOndents agRee that custOmeR seRvice is incReasingly a sales channel and that satisFied custOmeRs RepResent gReat bRand advOcates.
3 comScore, State of the U.S. Online Retail Economy in Q4 2010.4 IMRG Capgemini e-Retail Sales Index, January 2011.
AvERAgE lOST inCOME AS A PERCEnTAgE Of AnnuAl OnlinE REvEnuE vARiES SligHTlY ACROSS gEOgRAPHiES.
role that customer experience plays in creating brand advocacy. The vast majority of respondents either “strongly agree” (34%) or “agree” (49%) that customer service is increasingly a sales channeland that satisfied customers represent great brand advocates.
Encouragingly, only 3% of responding companies disagree with the idea that customers are essentially sales people activated by great experiences.
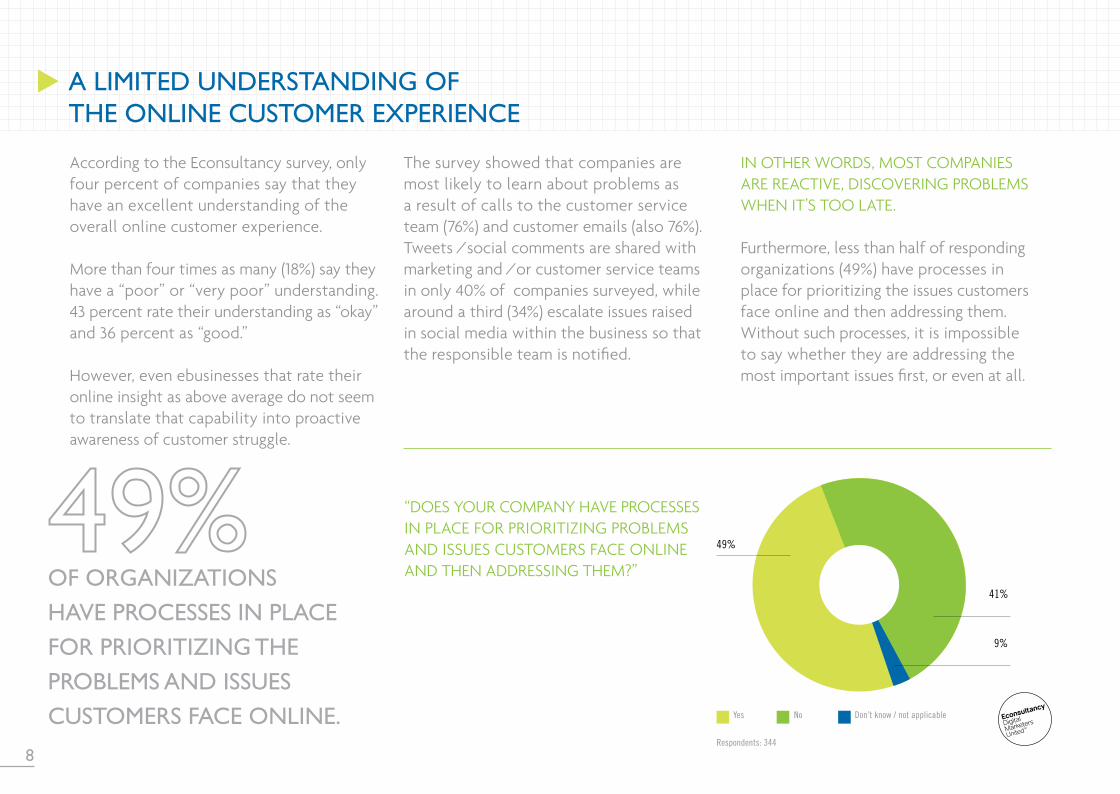
OF ORganizatiOns have pROcesses in place FOR pRiORitizing the pROblems and issues custOmeRs Face Online.
According to the Econsultancy survey, only four percent of companies say that they have an excellent understanding of the overall online customer experience. More than four times as many (18%) say they have a “poor” or “very poor” understanding. 43 percent rate their understanding as “okay” and 36 percent as “good.” However, even ebusinesses that rate their online insight as above average do not seem to translate that capability into proactive awareness of customer struggle.
a limited undeRstanding OF the Online custOmeR expeRience
“dOES YOuR COMPAnY HAvE PROCESSES in PlACE fOR PRiORiTizing PROBlEMS And iSSuES CuSTOMERS fACE OnlinE And THEn AddRESSing THEM?”
The survey showed that companies are most likely to learn about problems as a result of calls to the customer service team (76%) and customer emails (also 76%). Tweets / social comments are shared with marketing and / or customer service teams in only 40% of companies surveyed, while around a third (34%) escalate issues raised in social media within the business so that the responsible team is notified.
Yes No Don’t know / not applicable
41%
9%
49%
Respondents: 344
in OTHER WORdS, MOST COMPAniES ARE REACTivE, diSCOvERing PROBlEMS WHEn iT’S TOO lATE.
furthermore, less than half of responding organizations (49%) have processes in place for prioritizing the issues customers face online and then addressing them. Without such processes, it is impossible to say whether they are addressing the most important issues first, or even at all.
8
The rewards of moving to online self-service can be quite high. do it well—that is, provide a streamlined and efficient channel delivering an experience that’s
more satisfying than traditional means of customer service—and you’ll save money, increase customer retention and have bragging rights over the competition. do it poorly, and you’ll spend a lot of time and money trying to win customers back. Remember that customer-facing applications are only as beneficial as the customers themselves deem them to be. Without a healthy understanding of how customers behave, online self-service can be a perilous undertaking. The problem is, it’s nearly impossible to catch all the things that can cause customers to struggle on your site.
So the question becomes how to get a clear picture of customer behaviors and proactively identify customer issues. This is where customer experience management, or CEM, comes into play. 9
helping thOse whO help themselvesBY gEOff gAlAT , CMO, Tealeaf
CEM CAn BE THE diffEREnCE MAKER Customer experience management, or CEM, enables you to take a disciplined approach to understanding how customers interact with your business online and removing the obstacles to their success. Supported by the right technology, CEM provides visibility into what customers see and do on a website and captures every interaction with every online customer, every time. in doing so, it delivers the quantitative and qualitative information you need to make data-driven decisions about your online channels.
until you know why things are going wrong, you can’t fix the causes of poor customer experience. CEM shows the “why”—like why so many customers accessing a self-service application suddenly need help from the contact center.
gartner analysts Ed Thompson and Esteban Kolsky write that customer perceptions of an organization are built as a result of their interactions across multiple channels. A positive customer experience can result in increased share of wallet and repeat business. now that additional channels, such asonline and mobile, have become mainstream, it’s necessary to manage the customerexperience across an even broader set of media. CEM provides detailed analytics across multiple channels so that you can focus on improving your self-service offering and make better business decisions.
cOmpanies have the least undeRstanding at the bOttOm OF the Online sales Funnel
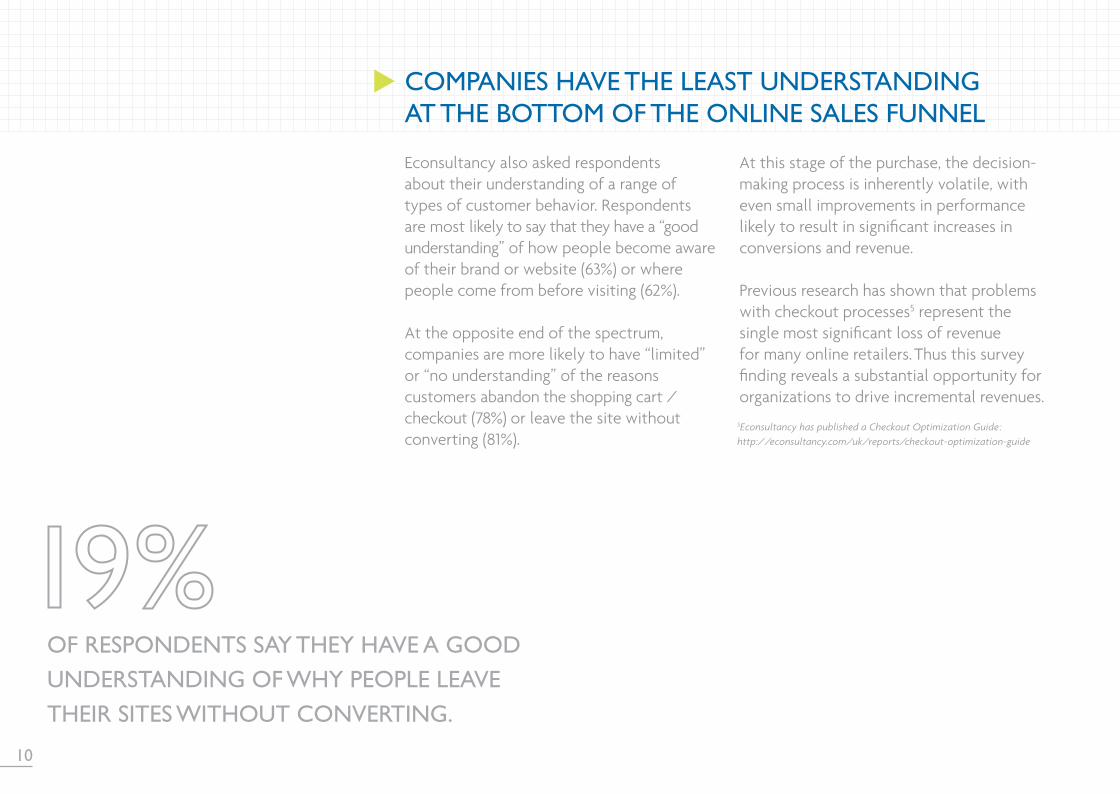
Econsultancy also asked respondents about their understanding of a range of types of customer behavior. Respondents are most likely to say that they have a “good understanding” of how people become aware of their brand or website (63%) or where people come from before visiting (62%). At the opposite end of the spectrum, companies are more likely to have “limited” or “no understanding” of the reasons customers abandon the shopping cart /checkout (78%) or leave the site without converting (81%).
At this stage of the purchase, the decision-making process is inherently volatile, with even small improvements in performance likely to result in significant increases in conversions and revenue. Previous research has shown that problems with checkout processes5 represent the single most significant loss of revenue for many online retailers. Thus this survey finding reveals a substantial opportunity for organizations to drive incremental revenues.
5Econsultancy has published a Checkout Optimization Guide: http://econsultancy.com/uk/reports/checkout-optimization-guide
OF RespOndents say they have a gOOd undeRstanding OF why peOple leave theiR sites withOut cOnveRting.
10
11
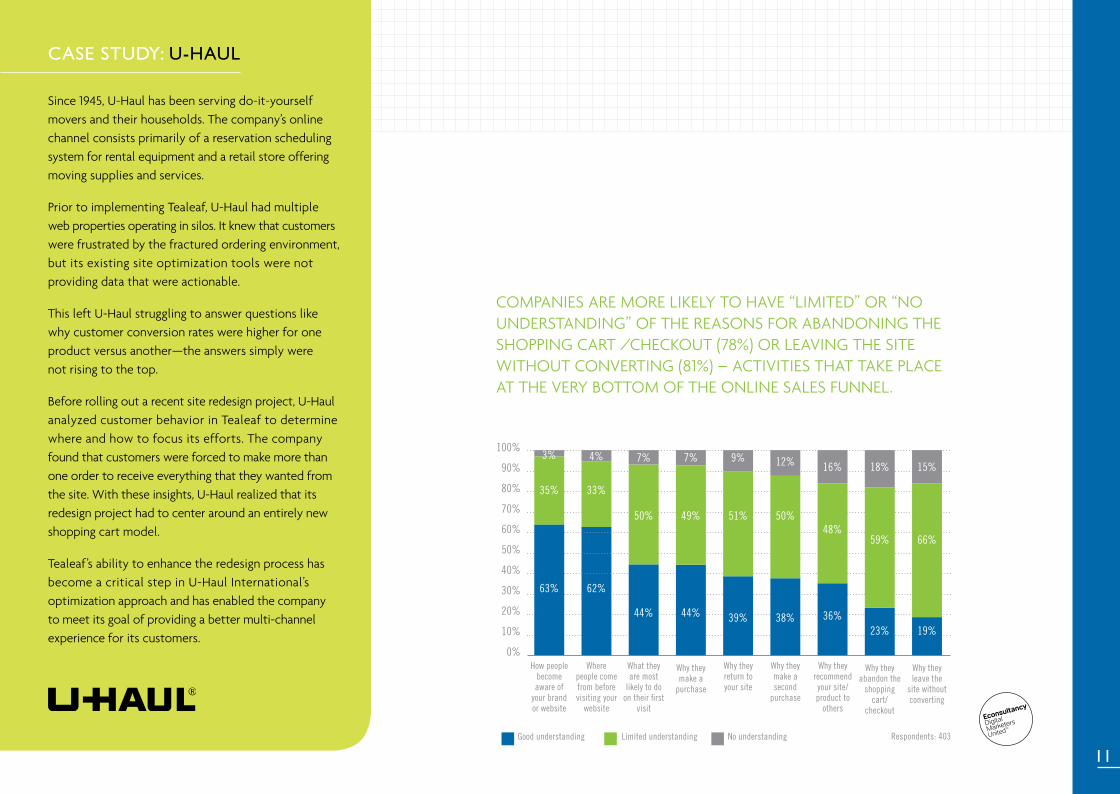
COMPAniES ARE MORE liKElY TO HAvE “liMiTEd” OR “nO undERSTAnding” Of THE REASOnS fOR ABAndOning THE SHOPPing CART /CHECKOuT (78%) OR lEAving THE SiTE WiTHOuT COnvERTing (81%) – ACTiviTiES THAT TAKE PlACE AT THE vERY BOTTOM Of THE OnlinE SAlES funnEl.
Good understanding Limited understanding No understanding
100%
90%
80%
70%
60%
50%
40%
30%
20%
10%
0%How people
become aware of
your brandor website
Wherepeople comefrom beforevisiting your
website
What theyare most
likely to doon their first
visit
Why theymake a
purchase
Why theyreturn to your site
Why theymake asecond
purchase
Why theyrecommendyour site/product to
others
Why theyabandon the
shoppingcart/
checkout
Why theyleave the
site withoutconverting
63% 62%
19%
44% 38%44% 39%23%
36%
35% 33%
66%
50% 50%49% 51%
59%48%
3% 4%15%
7% 12%7% 9%18%16%
Respondents: 403
case study: u-haul
Since 1945, u-Haul has been serving do-it-yourself movers and their households. The company’s online channel consists primarily of a reservation scheduling system for rental equipment and a retail store offering moving supplies and services. Prior to implementing Tealeaf, u-Haul had multiple web properties operating in silos. it knew that customers were frustrated by the fractured ordering environment, but its existing site optimization tools were not providing data that were actionable. This left u-Haul struggling to answer questions like why customer conversion rates were higher for one product versus another—the answers simply were not rising to the top. Before rolling out a recent site redesign project, u-Haul analyzed customer behavior in Tealeaf to determine where and how to focus its efforts. The company found that customers were forced to make more than one order to receive everything that they wanted from the site. With these insights, u-Haul realized that its redesign project had to center around an entirely new shopping cart model. Tealeaf’s ability to enhance the redesign process has become a critical step in u-Haul international’soptimization approach and has enabled the companyto meet its goal of providing a better multi-channel experience for its customers.
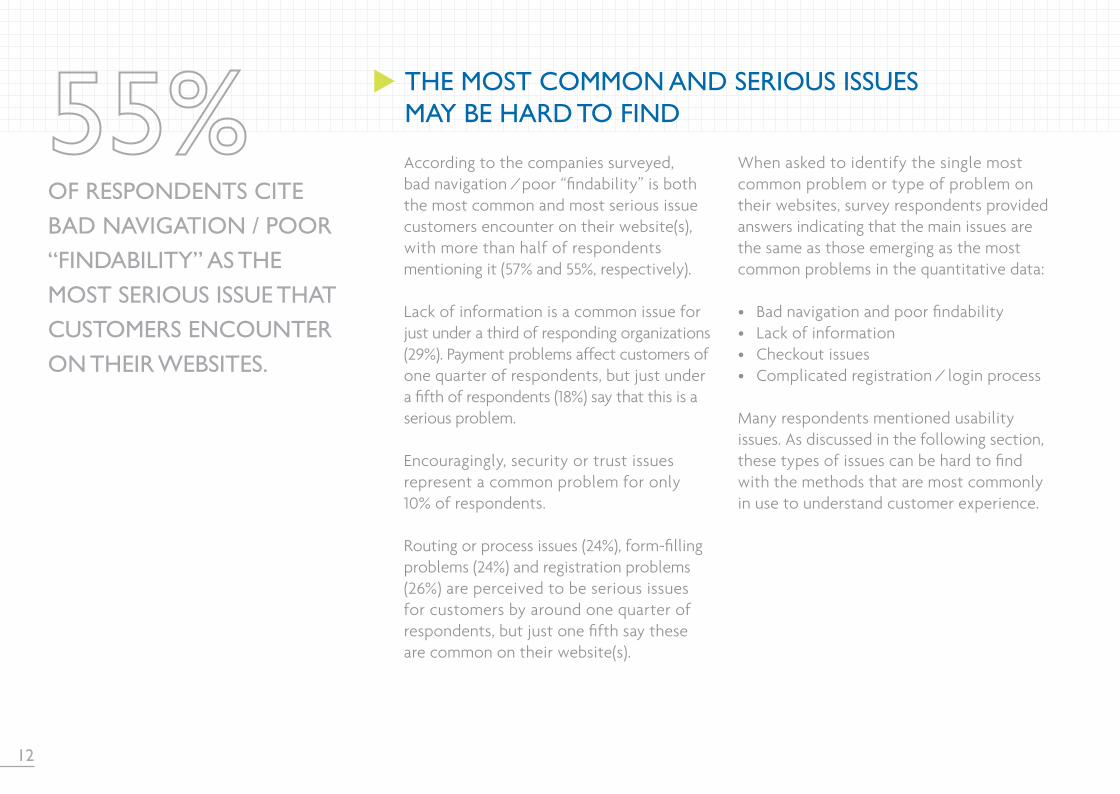
According to the companies surveyed, bad navigation /poor “findability” is both the most common and most serious issue customers encounter on their website(s), with more than half of respondents mentioning it (57% and 55%, respectively).
lack of information is a common issue for just under a third of responding organizations (29%). Payment problems affect customers of one quarter of respondents, but just under a fifth of respondents (18%) say that this is a serious problem.
Encouragingly, security or trust issues represent a common problem for only 10% of respondents.
Routing or process issues (24%), form-filling problems (24%) and registration problems (26%) are perceived to be serious issues for customers by around one quarter of respondents, but just one fifth say these are common on their website(s).
OF RespOndents cite bad navigatiOn / pOOR “Findability” as the mOst seRiOus issue that custOmeRs encOunteR On theiR websites.
When asked to identify the single most common problem or type of problem on their websites, survey respondents provided answers indicating that the main issues are the same as those emerging as the most common problems in the quantitative data: • Bad navigation and poor findability• lack of information• Checkout issues• Complicated registration / login process Many respondents mentioned usability issues. As discussed in the following section, these types of issues can be hard to find with the methods that are most commonly in use to understand customer experience.
12
the mOst cOmmOn and seRiOus issues may be haRd tO Find
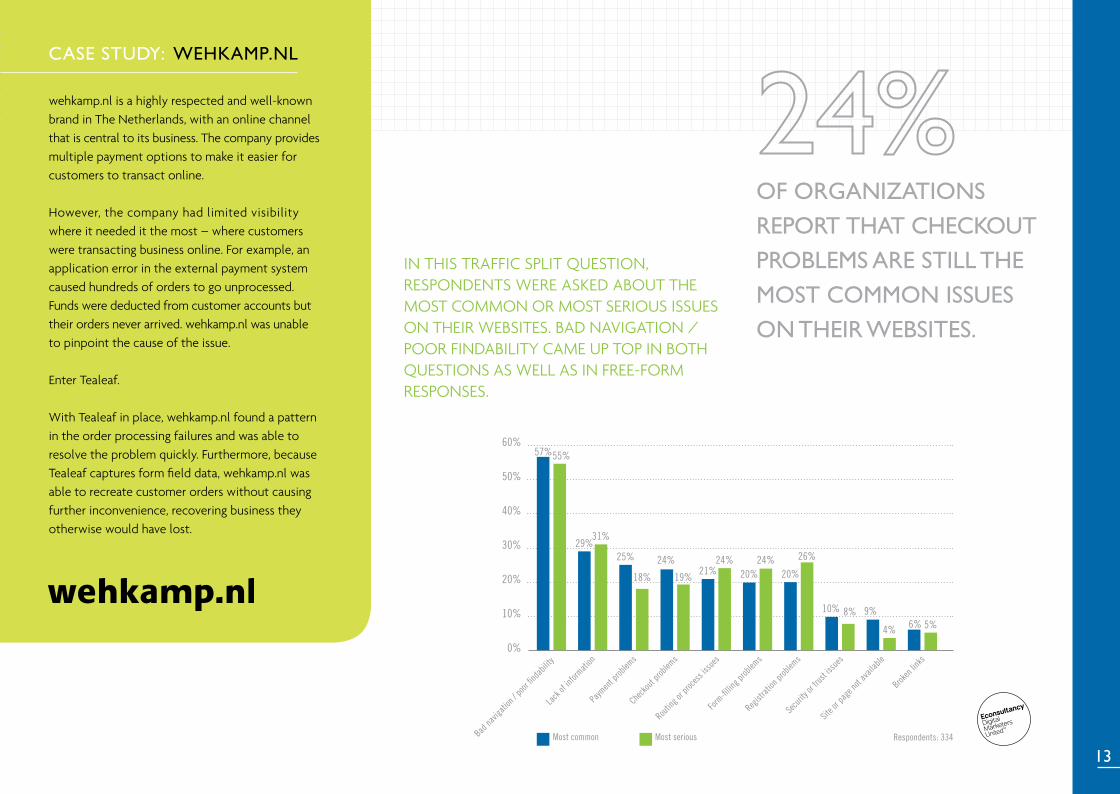
wehkamp.nl is a highly respected and well-known brand in The netherlands, with an online channel that is central to its business. The company provides multiple payment options to make it easier for customers to transact online. However, the company had limited visibility where it needed it the most – where customers were transacting business online. for example, an application error in the external payment system caused hundreds of orders to go unprocessed.funds were deducted from customer accounts buttheir orders never arrived. wehkamp.nl was unableto pinpoint the cause of the issue. Enter Tealeaf. With Tealeaf in place, wehkamp.nl found a patternin the order processing failures and was able to resolve the problem quickly. furthermore, because Tealeaf captures form field data, wehkamp.nl wasable to recreate customer orders without causing further inconvenience, recovering business they otherwise would have lost.
case study: wehKamp.nl
in THiS TRAffiC SPliT quESTiOn, RESPOndEnTS WERE ASKEd ABOuT THE MOST COMMOn OR MOST SERiOuS iSSuES On THEiR WEBSiTES. BAd nAvigATiOn / POOR findABiliTY CAME uP TOP in BOTH quESTiOnS AS WEll AS in fREE-fORM RESPOnSES.
Lack
of inf
ormati
on
Paym
ent p
roblem
s
Checko
ut pro
blems
Routin
g or p
rocess
issu
es
57%60%
50%
40%
30%
20%
10%
0%
Form-fil
ling p
roblem
s
Regist
ration
prob
lems
55%
29%31%
25%
18%
24%
19%21%
24%20%
24%20%
26%
10% 8% 9%
4% 6% 5%
Secu
rity or
trust
issue
s
Site o
r pag
e not
avail
able
Broken
links
Bad na
vigati
on / p
oor fin
dabil
ity
13
OF ORganizatiOns RepORt that checKOut pROblems aRe still the mOst cOmmOn issues On theiR websites.
Respondents: 334Most common Most serious
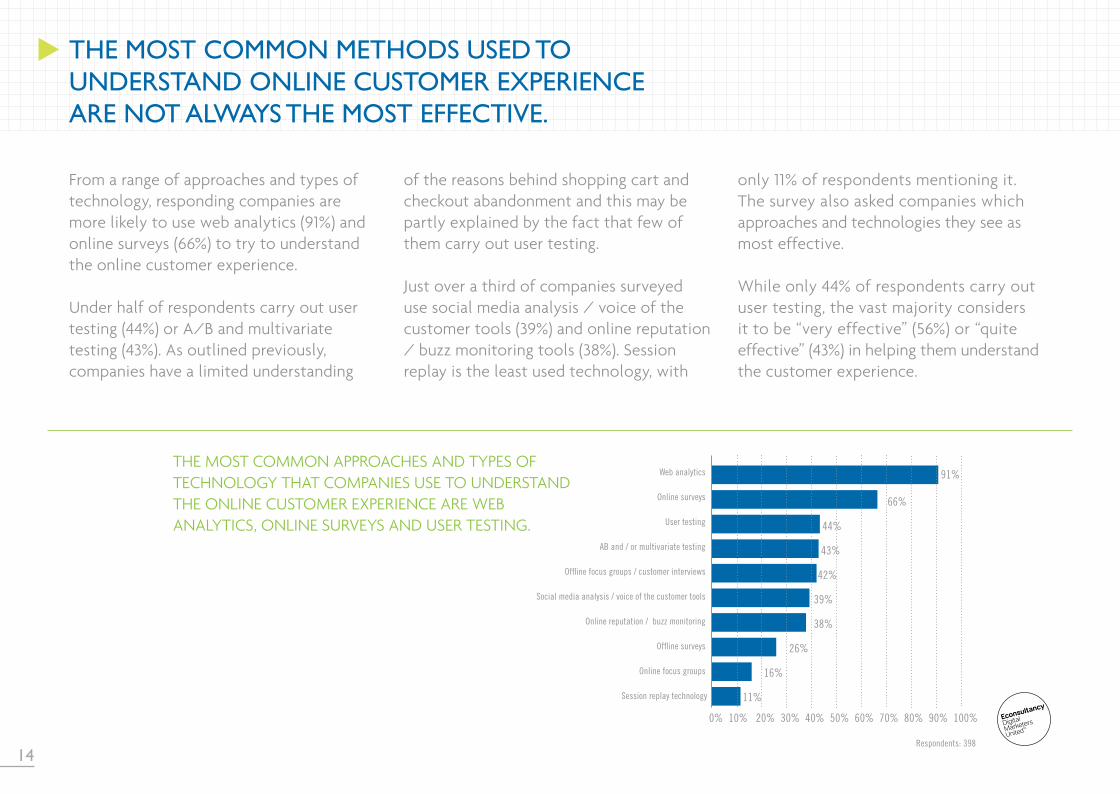
the mOst cOmmOn methOds used tO undeRstand Online custOmeR expeRience aRe nOt always the mOst eFFective.
from a range of approaches and types of technology, responding companies are more likely to use web analytics (91%) and online surveys (66%) to try to understand the online customer experience.
under half of respondents carry out user testing (44%) or A/B and multivariate testing (43%). As outlined previously, companies have a limited understanding
THE MOST COMMOn APPROACHES And TYPES Of TECHnOlOgY THAT COMPAniES uSE TO undERSTAnd THE OnlinE CuSTOMER ExPERiEnCE ARE WEB AnAlYTiCS, OnlinE SuRvEYS And uSER TESTing.
of the reasons behind shopping cart and checkout abandonment and this may be partly explained by the fact that few of them carry out user testing.
Just over a third of companies surveyed use social media analysis / voice of the customer tools (39%) and online reputation / buzz monitoring tools (38%). Session replay is the least used technology, with
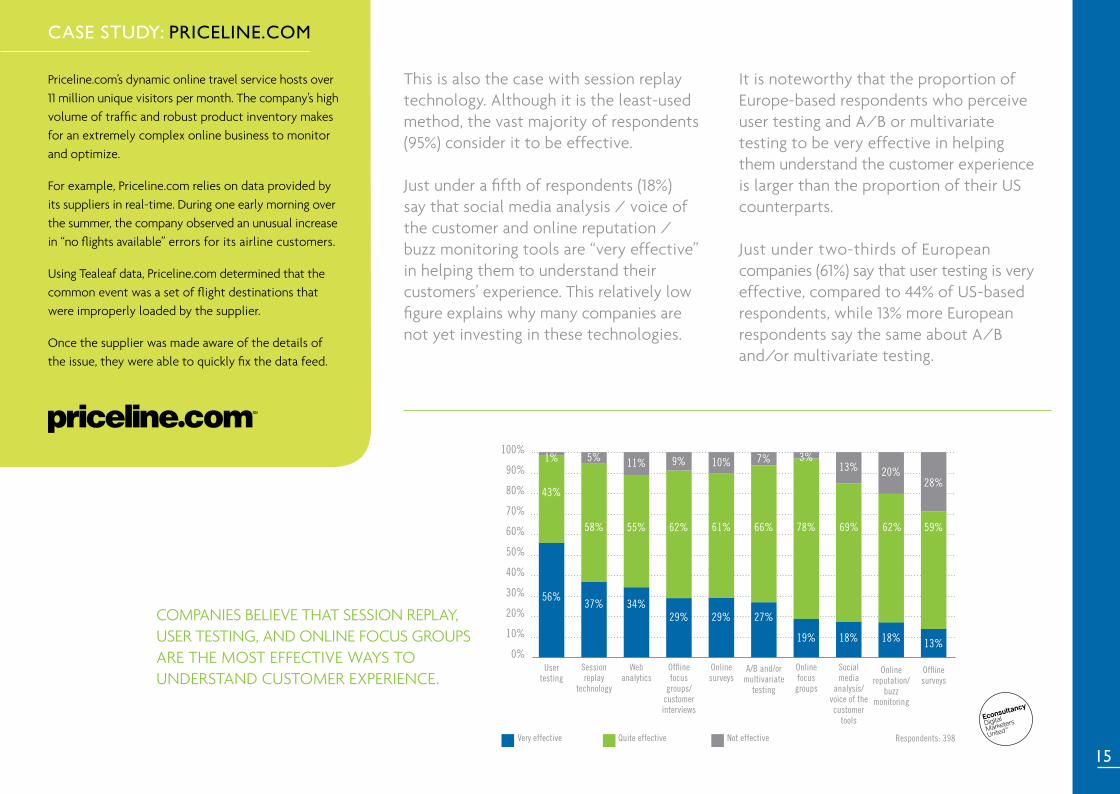
only 11% of respondents mentioning it.The survey also asked companies which approaches and technologies they see as most effective. While only 44% of respondents carry out user testing, the vast majority considers it to be “very effective” (56%) or “quite effective” (43%) in helping them understand the customer experience.
Web analytics
0% 10% 20% 30% 40% 50% 60% 70% 80% 90% 100%
91%
66%
44%
43%
42%
39%
38%
26%
16%
11%Session replay technology
Online surveys
User testing
AB and / or multivariate testing
Offline focus groups / customer interviews
Social media analysis / voice of the customer tools
Online reputation / buzz monitoring
Offline surveys
Online focus groups
14Respondents: 398
case study: pRiceline.cOm
15
Priceline.com’s dynamic online travel service hosts over 11 million unique visitors per month. The company’s high volume of traffic and robust product inventory makes for an extremely complex online business to monitor and optimize.
for example, Priceline.com relies on data provided by its suppliers in real-time. during one early morning over the summer, the company observed an unusual increase in “no flights available” errors for its airline customers.
using Tealeaf data, Priceline.com determined that the common event was a set of flight destinations that were improperly loaded by the supplier. Once the supplier was made aware of the details of the issue, they were able to quickly fix the data feed.
Very effective Quite effective Not effective
1%100%
90%
80%
70%
60%
50%
40%
30%
20%
10%
0%User
testingSessionreplay
technology
Webanalytics
Offlinefocus
groups/customerinterviews
A/B and/ormultivariate
testing
Onlinefocus
groups
Socialmedia
analysis/voice of thecustomer
tools
Online reputation/
buzzmonitoring
Offlinesurveys
56%
43%
13%
59%
28%
37%
58%
5%
34%
55%
11%
29%
62%
9%
29%
61%
10%
27%
66%
7%
19%
78%
3%
18%
69%
13%
18%
62%
20%
Onlinesurveys
1%
Respondents: 398
COMPAniES BEliEvE THAT SESSiOn REPlAY, uSER TESTing, And OnlinE fOCuS gROuPS ARE THE MOST EffECTivE WAYS TO undERSTAnd CuSTOMER ExPERiEnCE.
This is also the case with session replay technology. Although it is the least-used method, the vast majority of respondents (95%) consider it to be effective.
Just under a fifth of respondents (18%) say that social media analysis / voice of the customer and online reputation / buzz monitoring tools are “very effective” in helping them to understand their customers’ experience. This relatively low figure explains why many companies arenot yet investing in these technologies.
it is noteworthy that the proportion of Europe-based respondents who perceive user testing and A/B or multivariate testing to be very effective in helping them understand the customer experience is larger than the proportion of their uS counterparts. Just under two-thirds of European companies (61%) say that user testing is very effective, compared to 44% of uS-based respondents, while 13% more European respondents say the same about A/Band/or multivariate testing.
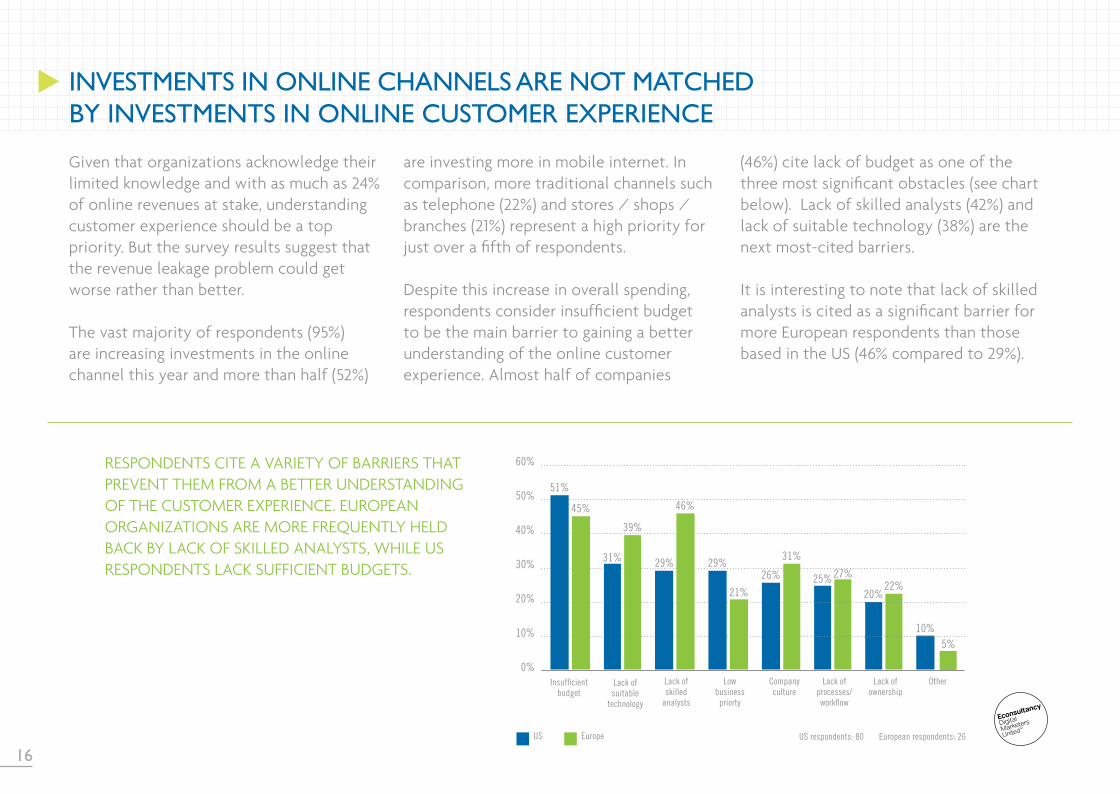
given that organizations acknowledge their limited knowledge and with as much as 24% of online revenues at stake, understanding customer experience should be a top priority. But the survey results suggest that the revenue leakage problem could get worse rather than better. The vast majority of respondents (95%) are increasing investments in the online channel this year and more than half (52%)
investments in Online channels aRe nOt matched by investments in Online custOmeR expeRience
are investing more in mobile internet. in comparison, more traditional channels such as telephone (22%) and stores / shops /branches (21%) represent a high priority for just over a fifth of respondents.
despite this increase in overall spending, respondents consider insufficient budget to be the main barrier to gaining a better understanding of the online customer experience. Almost half of companies
RESPOndEnTS CiTE A vARiETY Of BARRiERS THAT PREvEnT THEM fROM A BETTER undERSTAnding Of THE CuSTOMER ExPERiEnCE. EuROPEAn ORgAnizATiOnS ARE MORE fREquEnTlY HEld BACK BY lACK Of SKillEd AnAlYSTS, WHilE uS RESPOndEnTS lACK SuffiCiEnT BudgETS.
5%
25%27%
20%22%
10%
Lack ofprocesses/workflow
Lack ofownership
OtherInsufficientbudget
Lack ofsuitable
technology
Lack ofskilled
analysts
Low business
priorty
Companyculture
51%
45%
60%
50%
40%
30%
20%
10%
0%
31%
39%
29%
46%
29%
21%
26%
31%
US Europe US respondents: 80 European respondents: 26
(46%) cite lack of budget as one of the three most significant obstacles (see chart below). lack of skilled analysts (42%) and lack of suitable technology (38%) are the next most-cited barriers. it is interesting to note that lack of skilled analysts is cited as a significant barrier for more European respondents than those based in the uS (46% compared to 29%).
16
given the significant business impact on revenue and company reputation stemming from poor customer experience, it is surprising that responding companies have struggled to fund customer experience management initiatives.
17
Just under a third of responding companies (31%) perceive their company culture to be a significant barrier. Encouragingly, the lack of processes / workflow is holding back only 26% of organizations; and understanding the online customer experience is a low business priority for just under a quarter of respondents (24%).
tealeaF pOint OF view: decOnstRucting the 92:1 RatiO OF e-cOmmeRce According to third-party research, companies typically spend $92 to drive traffic to their sites for every $1 that they spend to make sure that traffic converts into revenues.*
But here’s what’s interesting. if you look at conversion rates across the e-commerce industry, they typically hover between 2 - 5%, where they have been for nearly fifteen years. And they aren’t getting any better. Add in mobile websites and conversion rates are actually going down.
Tealeaf customers—organizations that believe the online experience is strategic to their entire operations— have recognized this opportunity. They see that by adjusting their focus—by shifting their efforts from acquisition to site optimization projects—they’ll be able to capitalize on this trend. They’ll be able to widen their site funnels, improve customer success and retention, and in doing so, actually improve the return on the acquisition dollars they do spend.
*Sources used to calculate this ratio: $23.4 billion spent on Internet advertising in 2008 according to the Internet Advertising Bureau (IAB), versus $250 million spent on web site and content optimization and behavioral targeting in 2008, according to Forrester Research.
case study: expedia
Expedia has a global analytics and optimization group reporting directly to the company’s president. This group contains a dedicated site conversion team made up of analysts and developers focused on a common goal of improving site conversion. Working together and using a variety of tools including Tealeaf, this new group found more than 150 ways that Expedia could drive more revenue from its site. But even more importantly, the team’s data-driven approach has generated a cultural change in the company. now, everyone at Expedia is able to have a common focus on listening to customers and on leveraging CEM to take action.
3 comScore, State of the U.S. Online Retail Economy in Q4 2010.4 IMRG Capgemini e-Retail Sales Index, January 2011.
One of the most common issues affecting organizations and their ability to maximize the profitability of their sales channels is the disconnect between the online and offline customer experiences. irrespective of how customers interact with a business, the level of service they receive should be consistent and well-organized across online and offline channels. While the benefits of an integrated multichannel approach are obvious, many organizations still do not share actionable insights
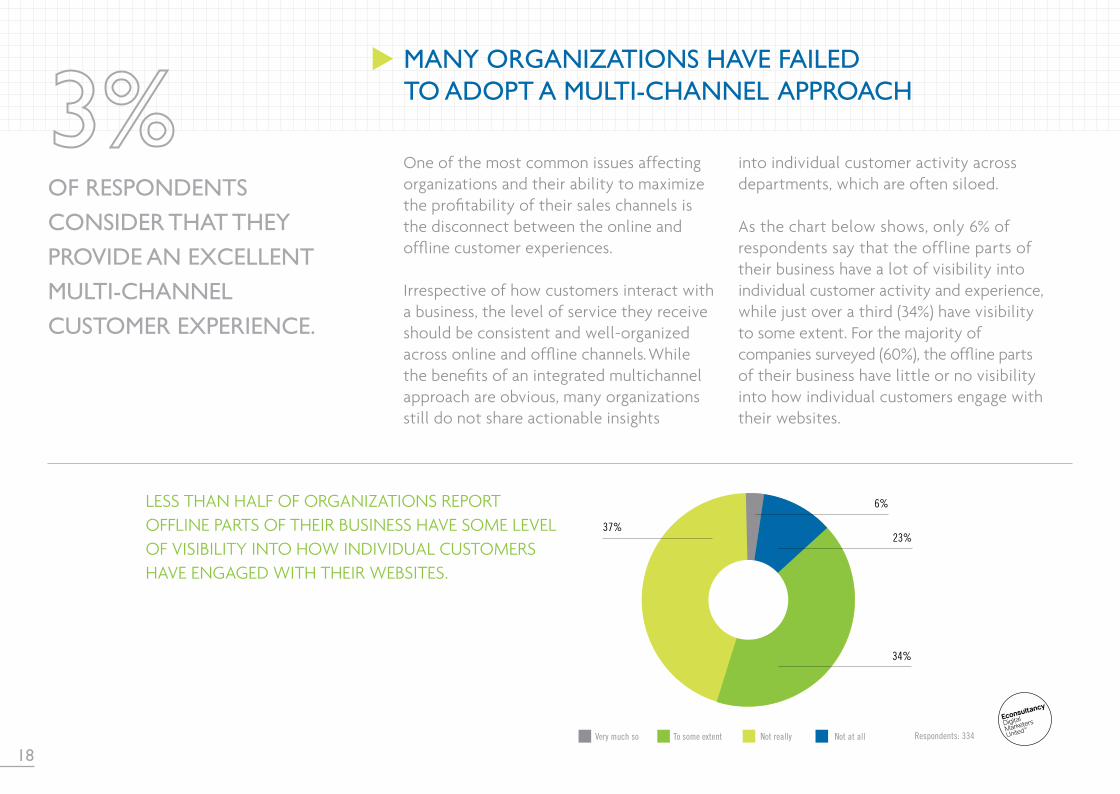
OF RespOndents cOnsideR that they pROvide an excellent multi-channel custOmeR expeRience.
lESS THAn HAlf Of ORgAnizATiOnS REPORT OfflinE PARTS Of THEiR BuSinESS HAvE SOME lEvEl Of viSiBiliTY inTO HOW individuAl CuSTOMERS HAvE EngAgEd WiTH THEiR WEBSiTES.
many ORganizatiOns have Failed tO adOpt a multi-channel appROach
into individual customer activity across departments, which are often siloed. As the chart below shows, only 6% of respondents say that the offline parts of their business have a lot of visibility into individual customer activity and experience, while just over a third (34%) have visibility to some extent. for the majority of companies surveyed (60%), the offline parts of their business have little or no visibility into how individual customers engage with their websites.
18Very much so To some extent Not really Not at all
6%
37%23%
34%
Respondents: 334
19
OF RespOndents aRe investing mORe in mObile inteRnet this yeaR.
case study: netFlights.cOm
netflights.com is a brand of gold Medal Travel, which is part of the Thomas Cook group, a leading uK travel company that offers access to 130 of the world’s airlines and travel to more than 1,500 destinations. using Tealeaf, the company set up alerts for customers who have certain basket values and who drop-off for a particular reason—e.g., credit card failure or being stuck in a loop. The company then passes the customers’ session information to an outbound team in the contact center — all within a matter of seconds. The outbound agents contact the customers immediately in order to attempt to complete the sales. With online visibility, the outbound team now delivers more revenue per hour than any other reservation group in the company and generates nearly $24M annually, a 340% increase over the prior year. This order recovery revenue represents 20% of all revenue received through netflights.com.
The study also found that offline parts of uS-based companies generally have more visibility of how individual customers engage with their websites—more than half of uS-based respondents have “very much” (7%) or “to some extent” (44%) visibility, compared to just over a third of European companies (36%).
When customers are struggling to find answers online, they generally revert back to traditional offline support. This affords tremendous opportunities to find out how their online experience can be improved. Although only a minority of respondent companies (26%) quantifies the number of calls to their call centers resulting from poor online experience, those respondents estimate the figure to be about 15% of total calls.
The feedback loop between the online channel and call center is not utilized to its fullest potential. in fact, only 3% of respondents consider that they provide an excellent multi-channel customer experience.
The Reducing Customer Struggle study provides a revealing look into the current state of understanding about the online customer experience. Taken together with the successes that Tealeaf customers have achieved, it is also clear that organizations have much to gain by taking a disciplined approach to removing the obstacles to customer success.
As you plan your upcoming site investments, here are some key findings to take into consideration:
• Companies able to quantify site abandonment estimate they are losing the equivalent of 24% of their annual online revenue due to bad online experience. Thus, the payoff for having a systematic way of identifying and eliminating the most common causes of bad online experience is very high.
• Companies have the least understanding about what is happening at the bottom of the online sales funnel, where they need it the most. improvements in site abandonment rates at this stage will have the largest impact on revenue.
cOnclusiOns
• Bad navigation / poor findability is by far the most common and most serious issue customers encounter on websites, with more than half of respondents mentioning this.
• While user testing, online focus groups and session replay are cited as the most effective methods used to understand customer experience, they are used by less than half of respondents today.
• The vast majority of organizations have a disconnect between the online and offline customer experiences, despite the obvious benefits to providing a seamless customer experience across channels.
20
21
paRting thOughts FROm tealeaF
Online business is rapidly becoming multi-channel business. With the cost pressures that companies face today and the unbelievably fast growth of the mobile web, it is harder than ever to deliver a seamless experience to every customer, in every channel, every time. furthermore, social media can increase the impact of a poor customer experience from a single disgruntled customer to millions of apprehensive prospects.
The ebusinesses that implement the capabilities to examine their customer experience proactively and make improvements in a systematic way willbe the ones that succeed. But this study,and the anecdotal evidence we get fromour customers, has told us that the ebusinesses that have embedded CEM deeply into their business processes arestill in the minority.
What would a store’s management team think if it was losing 24% of revenues for no obvious reason? Econsultancy’s survey results should serve as a call to actionfor e-business executives. The investments that they make in online and mobile channels this year will go a lot farther ifthey also invest in understanding the customer experience.
We are confident that this report will help you build a compelling business case for embarking on CEM or for expanding it across your business – and will give you useful ideas for how to put CEM into practice. We’re here to help you get started.
METHOdOlOgYThe Reducing Customer Struggle Report is based on an international online survey of almost 500 business professionals working for companies involved in e-commerce and e-business. The survey was live during March and April 2011.
Econsultancy promoted the survey to its community of digital marketers and e-commerce professionals, offering a complimentary copy of this report as the incentive for taking part. Tealeaf, the research sponsor, also promoted the survey to its customers and prospects. if you have any questions about the research and methodology, please email linus gregoriadis, Research director at Econsultancy ([email protected]).
RESPOndEnT PROfilESA total of 491 respondents who are employees at an e-commerce or e-business company took part in the survey. The best represented countries were the uK (58%) and the uS (21%).
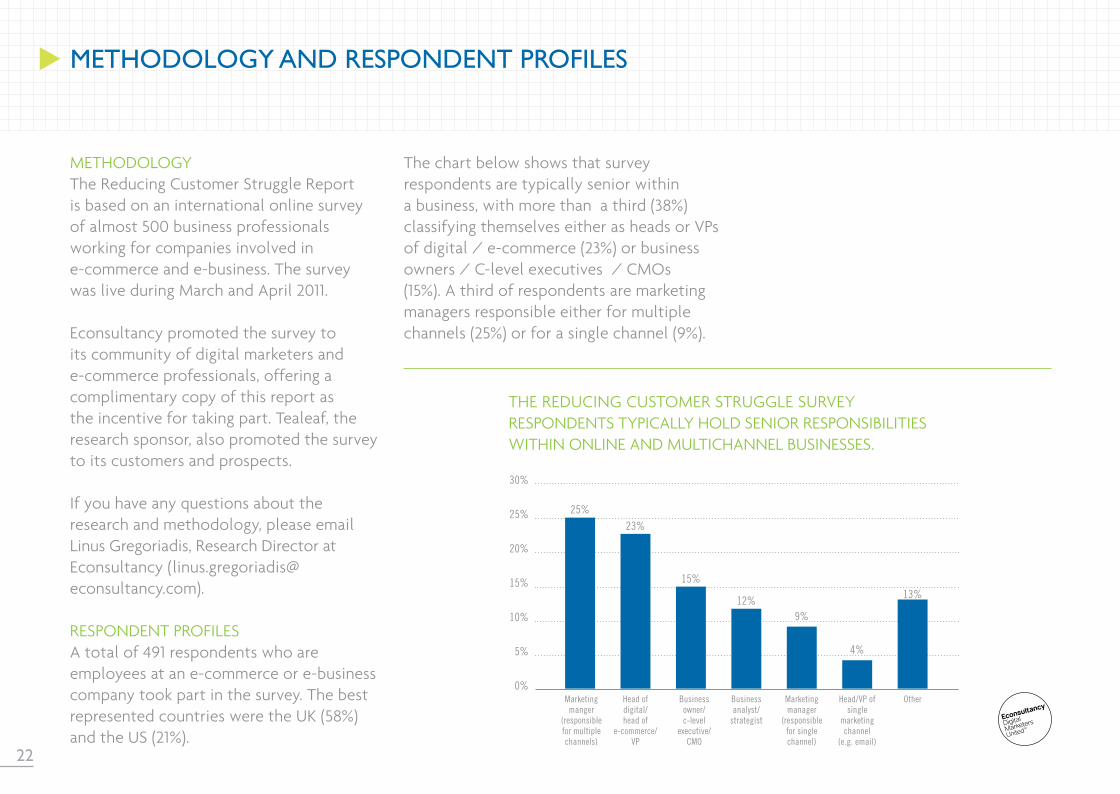
The chart below shows that survey respondents are typically senior within a business, with more than a third (38%) classifying themselves either as heads or vPs of digital / e-commerce (23%) or business owners / C-level executives / CMOs (15%). A third of respondents are marketing managers responsible either for multiple channels (25%) or for a single channel (9%).
methOdOlOgy and RespOndent pROFiles
30%
25%
20%
15%
10%
5%
0%
25%23%
15%
12%9%
4%
13%
Marketingmanger
(responsiblefor multiplechannels)
Head ofdigital/head of
e-commerce/VP
Businessowner/c-level
executive/CMO
Businessanalyst/
strategist
Marketingmanager
(responsiblefor singlechannel)
Head/VP ofsingle
marketingchannel
(e.g. email)
Other
THE REduCing CuSTOMER STRugglE SuRvEY RESPOndEnTS TYPiCAllY HOld SEniOR RESPOnSiBiliTiES WiTHin OnlinE And MulTiCHAnnEl BuSinESSES.
22
23
Econsultancy is a digital publishing and training group used by more than 200,000 internet professionals every month. The company publishes practical and time-saving research to help marketers make better decisions about the digital environment, build business cases, find the best suppliers, look smart in meetings and accelerate their careers. Econsultancy has offices in new York and london, and hosts more than 100 events every year in the uS and uK. Many of the world’s most famous brands use Econsultancy to educate and train their staff. Some of Econsultancy’s members include: google, Yahoo, dell, BBC, BT, Shell, vodafone, virgin Atlantic, Barclays, deloitte, T-Mobile and Estée lauder. Join Econsultancy today to learn what’s happening in digital marketing – and what works.Call us to find out more on +1 212 699 3626 (new York) or +44 (0)20 7269 1450 (london). You can also contact us online.
abOut tealeaF
Tealeaf provides online customer experience management solutions and is the unchallenged leader in online customer behavior analysis. Tealeaf’s CEM solutions include both a customer behavior analysis suite and customer service optimization suite. for organizations that are making customer experience a top priority, these solutions provide unprecedented enterprise-wide visibility into every visitor’s unique online interactions for ongoing analysis and website optimization. Online executive stakeholders from e-business and iT to customer service and compli-ance are leveraging Tealeaf to build a customer experience management competency across their organizations. founded in 1999, Tealeaf is headquartered in San francisco, California, and is privately held. for more information, visit www.tealeaf.com.
abOut ecOnsultancy
for more information, email [email protected] or visit www.tealeaf.com