recovery of trifluoroacetic acid from dilute aqueous...
TRANSCRIPT

A
fdbfs
K
1
dioadciRbat[sas
as
Recovery of trifluoroacetic acid from dilute aqueoussolutions by reactive distillation
Yogesh S. Mahajan, Ankur K. Shah, Ravindra S. Kamath,Nandkumar B. Salve, Sanjay M. Mahajani ∗
Department of Chemical Engineering, Indian Institute of Technology Bombay, Powai 400076, Mumbai, India
bstract
It is difficult to recover trifluoroacetic acid (TFA) from its dilute aqueous solutions by conventional techniques. This work investigates theeasibility of using reactive distillation to recover TFA through esterification with 2-propanol. A kinetic model is proposed based on batch reactor
ata. Experiments performed using reactive distillation in batch and continuous modes, show significant recovery. Independent column simulations,ased on kinetics and vapor–liquid equilibrium (VLE) developed in this work, agree well with our experimental results. The validated model isurther used to obtain suitable design and operating parameters to give nearly complete recovery. A complete process recovery process sheet isuggested based on the results obtained.; Rec
rubFitccaOt(Ewt[ta
eywords: Trifluoroacetic acid; Isopropyl trifluoroacetate; Reactive distillation
. Introduction
Reactive distillation (RD) is the combination of reaction andistillation in a single vessel. Advantages like improved selectiv-ty, increased conversion, better heat control, effective utilizationf reaction heat, scope for difficult separations and the avoid-nce of azeotropes can be realized by application of reactiveistillation [1]. Although this technology has been successfullyommercialized for the manufacture of certain bulk chemicals,ts potential as a separation tool has not been exploited in depth.eversible reactions such as esterification and acetalization cane looked upon as suitable candidates for this purpose [2]. Aceticcid has been successfully recovered from dilute aqueous solu-ions through esterification with methanol by employing RD3,4]. Other acids like lactic acid, adipic acid, mystiric acid,uccinic acid, chloroacetic acid, glycolic acid and trifluroaceticcid etc. can also be recovered from their dilute solutions in theame manner with a properly designed RD system.
In fine chemical industries, trifluoroacetic acid (TFA) findspplications as a reagent or as a catalyst. Post-reaction aqueoustreams contain typically 1–10% (w/w) acid. TFA is highly cor-
ier
alm
overy of chemicals
osive and toxic. It is harmful to human beings as it affects thepper respiratory tract, eyes and skin. Thus, it is outlawed fromeing disposed via the conventional effluent treatment methods.urthermore, being expensive, its disposal by neutralization
s not recommended. The quantity of the aqueous streams isoo large to be neglected despite their small gravimetric acidontent. Common industrial separation methods like distillationannot be utilized because the acid forms a maximum boilingzeotrope with water (20.6 wt.% water, boiling at 105.5 ◦C) [5].ne way of circumventing this bottleneck problem is to convert
he acid to useful products like isopropyl trifluoroacetateIPTFA) and separate IPTFA from the mixture by distillation.sters of trifluoroacetic acid are fine chemical intermediates,hich are used in the manufacture of pharmaceuticals, agricul-
ural chemicals, liquid crystals, dyes and industrial chemicals6]. IPTFA is used as a water scavenger and as a solvent inhe manufacture of various chemicals [7–10]. It is also useds an intermediate in the preparation of active molecules usedn pharmaceutical applications. The preparation of trifluoroac-tates by esterification of TFA with various alcohols and otheroutes of synthesis are described in various patents [6–12].
The esterification of trifluoroacetic acid (Fig. 1) in dilutequeous solutions is a very challenging task. The presence ofarge amounts of water, which itself is one of the products,
akes this reaction a potential candidate for RD. The simultane-

Nomenclature
C concentration of component (mol/m3)Ef activation energy of forward reaction (kJ mol−1)Eeq equilibrium activation energy (kJ mol−1)ID inner diameter of column (m)kf rate of reaction at any time t (l (gmol h−1)−1)kf0 rate of reaction at time t = 0 s (l (gmol h−1)−1)r rate of reaction (kmol s−1)R universal gas constant (8.314 J mol−1 K−1)T temperature (K)
ohiTta
niRitvut
2
2
rbieorptw
tag(stitowaacnttmmTc
c
2
otttiirailsa
2
Greek letterΘ objective function for optimization
us removal of ester may enhance the extent of conversion andence recovery. However, the boiling points of the componentsnvolved are very close to each other (IPA 82 ◦C, IPTFA 74 ◦C,FA 72 ◦C and water 100 ◦C) and the system is associated with
he presence of a minimum boiling azeotrope (IPA–water) andmaximum boiling azeotrope (TFA–water).
Considering the constraints stated above, there is a definiteeed to explore alternate methods for the recovery of TFA andf possible, convert it to a value added ester, in our case, IPTFA.D has a potential to achieve both these tasks together and
n the present work, we investigate feasibility of this processhrough experiments and simulations. The reaction kinetics andapor–liquid equilibrium (VLE) were determined separately andsed in RD column simulations to predict its performance andhese are compared with the experimental results.
. Batch kinetics
.1. Experimental procedure and analysis
The reaction was studied in a mechanically agitated, glasseactor of 5 × 10⁻⁴ m3 capacity. A constant-temperature oilath was used to control the temperature. The liquid volumen the reactor was maintained at 1.25 × 10⁻⁴ m3 in all the batchxperiments. The catalyst T-63, a cation-exchange resin, wasbtained from Thermax Ltd. (India) (properties: particle size
ange ∼0.3–1.2 mm, exchange capacity: 4.9 mequiv./dry g, tem-erature stability: upto 130 ◦C). Samples were withdrawn fromhe reactor at regular time intervals and were immediately cooledith ice to avoid further reaction. Analysis was performed byocpe
Fig. 1. Reaction scheme for the esterificat
59
itration using standard NaOH solution and phenolphthalein asn indicator. Samples were also analyzed using gas chromato-raph (GC-MAK-911) equipped with a flame ionization detectorFID). A 25 m long capillary column (BP-1, SGE) was used toeparate the components. The injector and detector were main-ained at 200 ◦C each. The oven temperature was kept at 68 ◦Cnitially and was increased further with a ramp rate of 30 ◦C/mino 98 ◦C and maintained there for 4 min. This facilitated best res-lution in least time. In few selected runs water concentrationas confirmed independently with the help of chromatographic
nalysis. A gas chromatograph (GC-MAK-911) equipped withthermal conductivity detector (TCD) with a 2 m long packed
olumn (PoraPak-Q, SGE) was used to separate the compo-ents with n-butanol as the standard. The injector and detectoremperatures were maintained at 200 ◦C and 150 ◦C, respec-ively and the oven temperature at 215 ◦C. It was found that all
ass balances matched to within 3%. Hence in all the experi-ents, titration was used to determine the concentration of TFA.he performance of the reaction was evaluated in terms of totalonversion of TFA as follows:
onversion (%) = moles of TFA reacted
moles of TFA charged× 100 (1)
.2. Results and discussion
Fig. 2 shows the effect of temperature and feed mole ratiof IPA to TFA on the conversion of TFA. It can be seen thathe rate of reaction, as expected, increases with an increase inemperature and mole ratio of IPA to TFA. It should be notedhat experiments carried out with T-63, showed no significantmprovement in the conversion (Fig. 3). Separate batch exper-ments were also conducted (10 wt.% TFA) with ion exchangeesin T-63 as the catalyst (0–25%, w/w of TFA) and this showednegligibly small increase in the conversion. This is not surpris-
ng as the water content of the reaction mixture is exceptionallyarge and moreover, TFA is a sufficiently strong acid to act as aelf-catalyst. Hence, all the further experiments in batch modend in the RD column were carried out without catalyst.
.3. Parameter estimation
A kinetic model for the esterification reaction is devel-
ped based on the reaction scheme given in Section 1. Aoncentration-based model was chosen as the reaction takeslace in dilute conditions. Eq. (2) gives the proposed kineticquation for the reacting system, where A, B, C and D represention of trifluoroacetic acid with IPA.

60
F at IPA/TFA mol. ratio of 10; (b) effect of mole ratio of IPA to TFA at 80 ◦C. (Initialc
Tt
r
k
K
T
m
Fht
Table 1Kinetic parameters with 95% confidence limits and residual sum of squares forthe proposed model
Parameter Value
kf0 (l (gmol h)−1) (3.66 ± 1.29) × 1012
Keq0 10000.0 ± 2395.9E (kJ mol−1) 96.82 ± 10.51EΘ
T
ig. 2. Batch kinetics without catalyst: (a) effect of temperature on conversiononcentration of TFA in water 5%, w/w.)
FA, IPA, IPTFA and water, respectively. The expressions forhe temperature dependencies are given by Eqs. (3) and (4):
= −kf
[CACB −
(1
Keq
)CCCD
](2)
f = kf0 exp
(− Ef
RT
)(3)
eq = Keq0exp
(−Eeq
RT
)(4)
he objective function to be minimized is expressed as
in Θ =∑
Data points
(Npredicted − Nexperimental)2 (5)
ig. 3. Effect of presence of catalyst on reaction of TFA with isopropyl alco-ol. TFA:water::10:90 (w/w); IPA:TFA::3:1 (mol/mol); catalyst T-63. Reactionemperature 50 ◦C; catalyst loading 25% of TFA (w/w).
iAps
f
eq (kJ mol−1) 20.0 ± 7.29.926 × 10−3
he optimization was performed using the batch reactor model
n Aspen Custom Modeler, a tool from the standard simulatorspen Engineering Suite. The values for the estimated kineticarameters and the sum of the squares of residuals (Θ) areummarized in Table 1. Fig. 4 displays the parity plot show-Fig. 4. The parity plot for concentration of TFA.
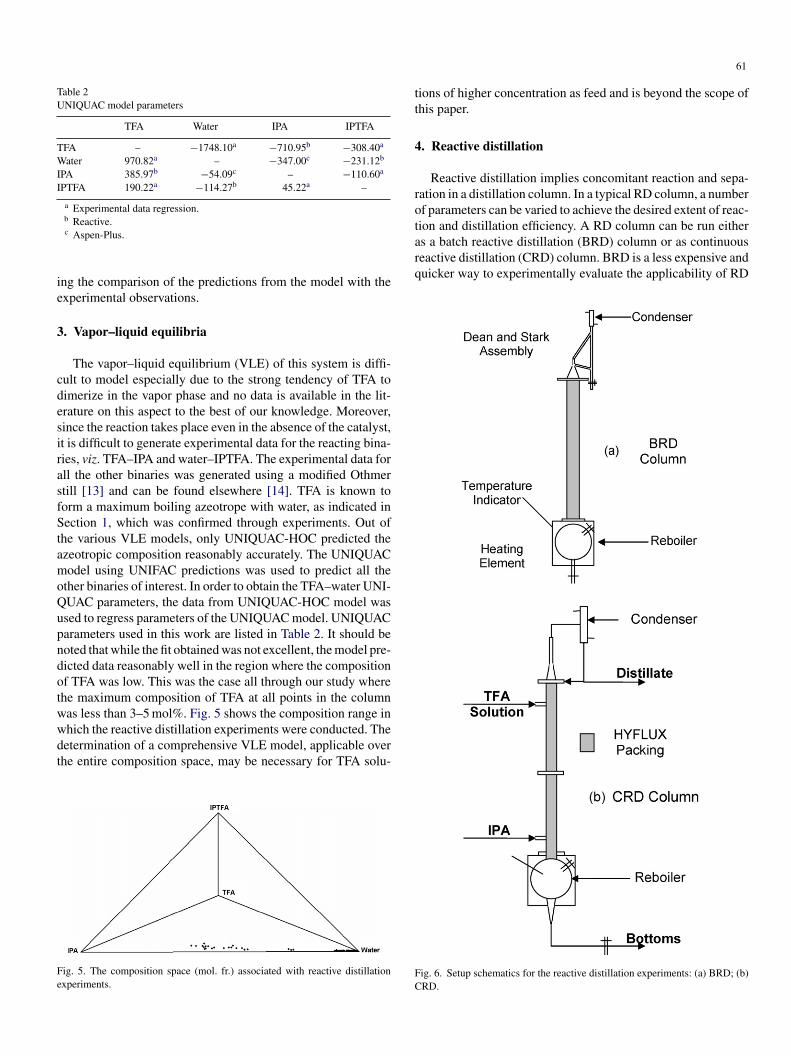
Table 2UNIQUAC model parameters
TFA Water IPA IPTFA
TFA – −1748.10a −710.95b −308.40a
Water 970.82a – −347.00c −231.12b
IPA 385.97b −54.09c – −110.60a
IPTFA 190.22a −114.27b 45.22a –
a Experimental data regression.
ie
3
cdesirasfStamoQupndotwwdt
Fe
tt
4
rotion and distillation efficiency. A RD column can be run eitheras a batch reactive distillation (BRD) column or as continuousreactive distillation (CRD) column. BRD is a less expensive andquicker way to experimentally evaluate the applicability of RD
b Reactive.c Aspen-Plus.
ng the comparison of the predictions from the model with thexperimental observations.
. Vapor–liquid equilibria
The vapor–liquid equilibrium (VLE) of this system is diffi-ult to model especially due to the strong tendency of TFA toimerize in the vapor phase and no data is available in the lit-rature on this aspect to the best of our knowledge. Moreover,ince the reaction takes place even in the absence of the catalyst,t is difficult to generate experimental data for the reacting bina-ies, viz. TFA–IPA and water–IPTFA. The experimental data forll the other binaries was generated using a modified Othmertill [13] and can be found elsewhere [14]. TFA is known toorm a maximum boiling azeotrope with water, as indicated inection 1, which was confirmed through experiments. Out of
he various VLE models, only UNIQUAC-HOC predicted thezeotropic composition reasonably accurately. The UNIQUACodel using UNIFAC predictions was used to predict all the
ther binaries of interest. In order to obtain the TFA–water UNI-UAC parameters, the data from UNIQUAC-HOC model wassed to regress parameters of the UNIQUAC model. UNIQUACarameters used in this work are listed in Table 2. It should beoted that while the fit obtained was not excellent, the model pre-icted data reasonably well in the region where the compositionf TFA was low. This was the case all through our study wherehe maximum composition of TFA at all points in the column
as less than 3–5 mol%. Fig. 5 shows the composition range inhich the reactive distillation experiments were conducted. Theetermination of a comprehensive VLE model, applicable overhe entire composition space, may be necessary for TFA solu-ig. 5. The composition space (mol. fr.) associated with reactive distillationxperiments.
FC
61
ions of higher concentration as feed and is beyond the scope ofhis paper.
. Reactive distillation
Reactive distillation implies concomitant reaction and sepa-ation in a distillation column. In a typical RD column, a numberf parameters can be varied to achieve the desired extent of reac-
ig. 6. Setup schematics for the reactive distillation experiments: (a) BRD; (b)RD.

62
fsmf
4
4
wwwSwMlitIF9ftbrto
4
idbBecmebtpA
F
talC
4
((was charged with a known quantity of IPA and heating wasstarted. Once the temperature profile was established, TFA andIPA were fed to the column at the desired flow rates at the spec-ified feed points. TFA solution is fed near the top of the column
Table 3The details of CRD experimental runs performed
Run no.
1 2 3 4
Reboiler duty (W),including heatlosses
200 175 150 100
Height of reactivesection (m)
1 2 2 2
TFA feed solution 5%(w/w) (g h−1)
1309.25 630.35 533.35 363.65
IPA feed (g h−1) 103.50 117.20 163.85 134.95Feed location (IPA,
TFA)3, 9 3, 17 3, 17 3, 17
IPA/TFA (mol/mol) 3 7 10 14Top flow rate (g h−1) 415 122 238 225Bottoms flow rate
(g h−1)995 615 443 273
Conversion (%) 14.64 38.50 48.99 57.50
Fig. 7. Variation of conversion with time for BRD runs.
or the process of interest. Fig. 6 shows the schematic of theetup used for the RD experiments in the batch and continuousodes. The next section describes the experimental procedure
or both BRD and CRD and the important results.
.1. Batch reactive distillation (BRD)
.1.1. BRD without catalystA typical BRD run was performed with 230 g TFA and 2070 g
ater (i.e. ∼10 wt.% TFA) and 1.4:1 molar ratio of IPA to TFA,ithout catalyst. The setup consists of a reboiler of 3 l capacityith a 1 m tall column (ID: 0.025 m) equipped with a Dean andtark assembly and condenser (Fig. 6a). The column is packedith non-reactive packings (Hyflux Packings, Evergreen Ltd.,umbai, India; NTSM = 8). As is seen in Fig. 7, even with this
ow molar ratio of IPA to TFA about 58% conversion was real-zed (Run 1 of Fig. 7). In order to further increase the conversion,hree successive runs were carried out with stepwise addition ofPA to the same reaction mixture (Runs 2–4, respectively ofig. 7, IPA to TFA mole ratio: 3:1) and conversion as high as1% was achieved. Complete conversion can be obtained byurther addition of IPA. Only traces of TFA were observed inhe condensate throughout the run as TFA forms a maximumoiling azeotrope with water and hence tends to remain in theeboiler. Thus, the results obtained in the batch reactive distilla-ion experiments clearly show the feasibility of RD for recoveryf TFA by esterification.
.1.2. BRD with catalyst packed in the columnAs mentioned before, the reaction was observed to be signif-
cantly fast even in the absence of a catalyst. However in RD,ue to high conversion, it is expected that self-catalysis may note effective even at lower concentration of TFA. Hence, selectedRD runs with catalyst were performed to identify the need ofxternal catalyst. In a typical BRD run, the reboiler of 500 mlapacity was charged with 10% TFA solution and IPA with 3:1olar ratio of IPA to TFA. The catalyst (4.1 g) was packed in
mbedded form in a column placed above the reaction vessel but
elow the Dean and Stark assembly. It should be recalled that dueo azeotrope formation, significant amount of water will also beresent at the catalyst site. Fig. 8 shows the conversion of TFA.bout 58% conversion of TFA has been realized which is aboutEOT
ig. 8. Conversion vs. time for the BRD run with catalyst packed in column.
he same as the case without catalyst reflecting that there is nopparent advantage of using catalyst because of the presence ofarge amount of water present. Hence, as discussed before, theRD runs were conducted without catalyst.
.2. Continuous reactive distillation
CRD experiments were conducted in a column of 0.051 mID), 2 m height (Fig. 6b), packed with non-reactive packingsHyflux Packings, Evergreen Ltd., Mumbai, India). The reboiler
rror in material balance (%)verall 2 1.5 2 2FA 0.5 3 4 3
63
baIiTsobast
isItiueueecmo
vw
Table 4Parameters used for simulation in the RadFrac and RateFrac models
Property RadFrac RateFrac
Property model UNIQUAC UNIQUACReflux ratio 0.5384 0.5133Reboiler duty (W) 102.5 102.5Stages 18 24Feed stage (TFA, IPA) 3, 17 4, 20Pressure (atm) 1 1Reactions (stages) 2–17 3–23Holdup (g) 0 0DC
tdFIcr
4
F(
ecause of the tendency of TFA to form a maximum boilingzeotrope with water which leads TFA to flow down the column.PA on the other hand is fed close to reboiler and being volatile,t flows in the upward direction facilitating good contact withFA. The top and bottom flow rates and compositions were mea-ured from time to time. When these were found to be constantver a period of time (>2 h), the overall and individual materialalances were verified. This, along with the establishment oftime invariant temperature profile indicated the attainment of
teady state (SS). Samples were withdrawn along the length ofhe column and analyzed as detailed in Section 2.1.
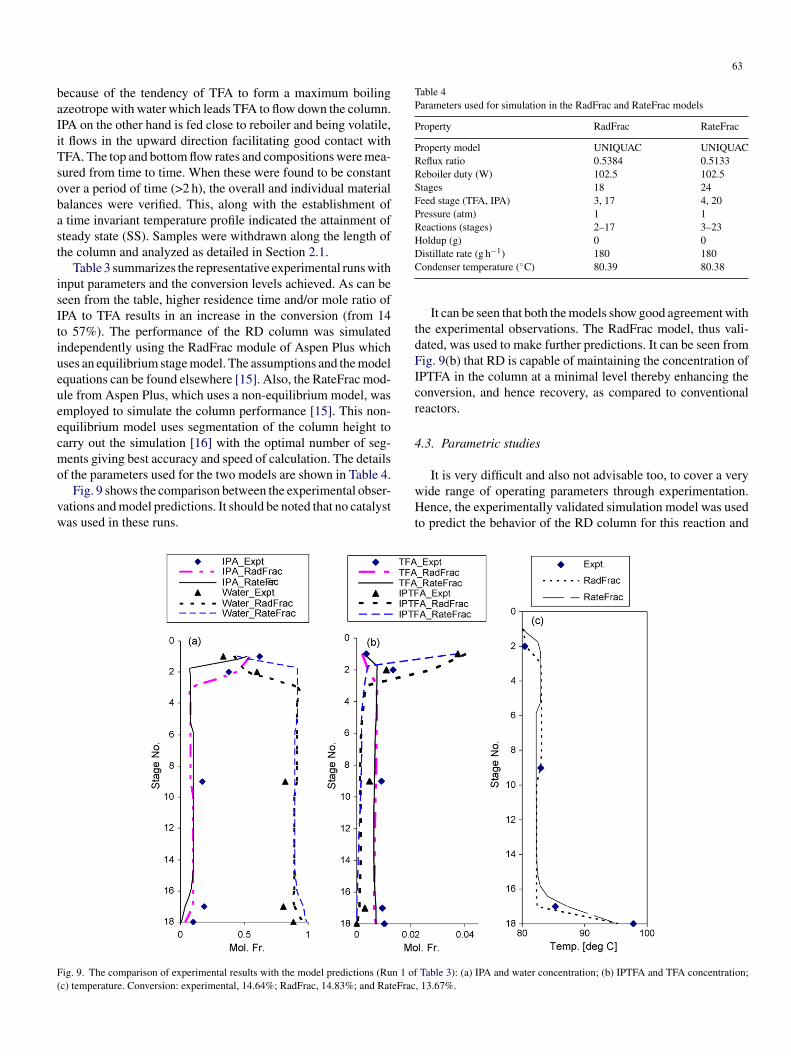
Table 3 summarizes the representative experimental runs withnput parameters and the conversion levels achieved. As can beeen from the table, higher residence time and/or mole ratio ofPA to TFA results in an increase in the conversion (from 14o 57%). The performance of the RD column was simulatedndependently using the RadFrac module of Aspen Plus whichses an equilibrium stage model. The assumptions and the modelquations can be found elsewhere [15]. Also, the RateFrac mod-le from Aspen Plus, which uses a non-equilibrium model, wasmployed to simulate the column performance [15]. This non-quilibrium model uses segmentation of the column height toarry out the simulation [16] with the optimal number of seg-ents giving best accuracy and speed of calculation. The details
f the parameters used for the two models are shown in Table 4.Fig. 9 shows the comparison between the experimental obser-
ations and model predictions. It should be noted that no catalystas used in these runs.
wHt
ig. 9. The comparison of experimental results with the model predictions (Run 1 ofc) temperature. Conversion: experimental, 14.64%; RadFrac, 14.83%; and RateFrac
istillate rate (g h−1) 180 180ondenser temperature (◦C) 80.39 80.38
It can be seen that both the models show good agreement withhe experimental observations. The RadFrac model, thus vali-ated, was used to make further predictions. It can be seen fromig. 9(b) that RD is capable of maintaining the concentration ofPTFA in the column at a minimal level thereby enhancing theonversion, and hence recovery, as compared to conventionaleactors.
.3. Parametric studies
It is very difficult and also not advisable too, to cover a veryide range of operating parameters through experimentation.ence, the experimentally validated simulation model was used
o predict the behavior of the RD column for this reaction and
Table 3): (a) IPA and water concentration; (b) IPTFA and TFA concentration;, 13.67%.

64
FT
tctdtf
4
tdcpnottvtstpf
4
apf3osf
4
rit
Fig. 11. The effect of TFA feed location on conversion with a 70-stage column.
ig. 10. The effect of number of stages on conversion. Base case is Run 4 ofable 3 (indicated by square).
o predict the conditions that may favor the maximum possibleonversion and hence the recovery. In a typical RD column,he number of reactive stages, relative feed locations, reboileruty and reflux ratio are the important parameters that dictatehe overall performance. Simulation results are discussed in theollowing sections.
.3.1. Effect of number of stagesOne way of obtaining conversion close to 100% is to increase
he reactive stages of the column thereby providing large resi-ence time and efficient separation. The experimental columnonsisted of 18 stages in all. In the simulation five stages wererovided for the rectifying and stripping sections each and theumber of stages in the middle reactive section was increasedne at a time. Fig. 10 shows that the conversion is very sensi-ive to the change in the number of stages. It can be observedhat as many as 70 total stages are required to achieve con-ersion of the order of 96.4%. Thus it is theoretically possibleo obtain 100% conversion at the cost of additional number oftages. This is obviously advantageous since the streams fromhe RD column would be essentially free of TFA and thus com-lete recovery would be achieved. Seventy stages were used forurther parametric studies.
.3.2. Effect of feed location of TFA and IPAThe feed location of the reactants influences the conversion,
s the reactive zone height would vary with a change in the feedoints. With the given number of stages and the location of IPAeed, as shown in Fig. 11, lowering the TFA feed below about0 stages decreases the conversion. A similar study was carriedut for IPA feed location. Typically for a column with total 70tages and TFA and IPA feeds at stages 9 and 67, respectivelyrom the top offers 96.64% recovery.
.3.3. Effect of reflux ratio and reboiler duty
For a column with a given number of stages, an increase ineboiler duty increases the vapor flow in the column therebyncreasing the liquid that is refluxed to the column. In this sys-em the water concentration is large and hence, the increase in
Fig. 12. Effect of reboiler duty: (a) IPA concentration; (b) conversion. Numberof stages: 70; reflux ratio: 0.75.
65
rchdcd
otiitdo
dTrod
FN
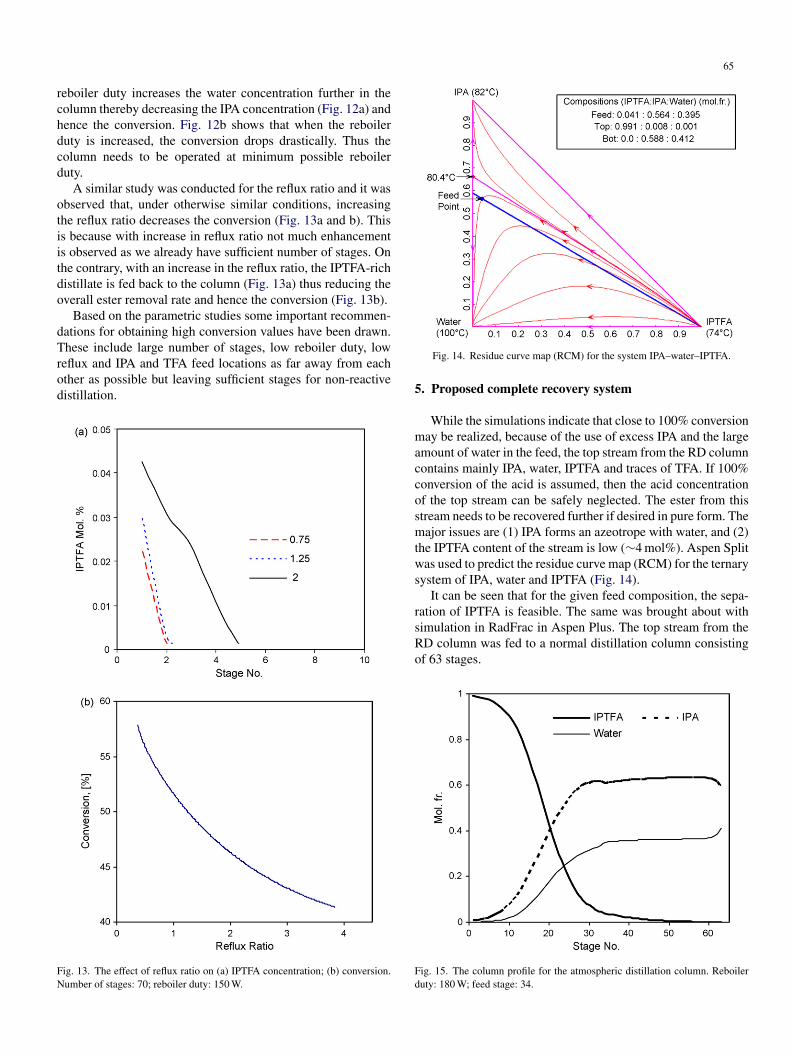
eboiler duty increases the water concentration further in theolumn thereby decreasing the IPA concentration (Fig. 12a) andence the conversion. Fig. 12b shows that when the reboileruty is increased, the conversion drops drastically. Thus theolumn needs to be operated at minimum possible reboileruty.
A similar study was conducted for the reflux ratio and it wasbserved that, under otherwise similar conditions, increasinghe reflux ratio decreases the conversion (Fig. 13a and b). Thiss because with increase in reflux ratio not much enhancements observed as we already have sufficient number of stages. Onhe contrary, with an increase in the reflux ratio, the IPTFA-richistillate is fed back to the column (Fig. 13a) thus reducing theverall ester removal rate and hence the conversion (Fig. 13b).
Based on the parametric studies some important recommen-ations for obtaining high conversion values have been drawn.
hese include large number of stages, low reboiler duty, loweflux and IPA and TFA feed locations as far away from eachther as possible but leaving sufficient stages for non-reactiveistillation.
ig. 13. The effect of reflux ratio on (a) IPTFA concentration; (b) conversion.umber of stages: 70; reboiler duty: 150 W.
5
maccosmtws
rsRo
Fd
Fig. 14. Residue curve map (RCM) for the system IPA–water–IPTFA.
. Proposed complete recovery system
While the simulations indicate that close to 100% conversionay be realized, because of the use of excess IPA and the large
mount of water in the feed, the top stream from the RD columnontains mainly IPA, water, IPTFA and traces of TFA. If 100%onversion of the acid is assumed, then the acid concentrationf the top stream can be safely neglected. The ester from thistream needs to be recovered further if desired in pure form. Theajor issues are (1) IPA forms an azeotrope with water, and (2)
he IPTFA content of the stream is low (∼4 mol%). Aspen Splitas used to predict the residue curve map (RCM) for the ternary
ystem of IPA, water and IPTFA (Fig. 14).It can be seen that for the given feed composition, the sepa-
ation of IPTFA is feasible. The same was brought about withimulation in RadFrac in Aspen Plus. The top stream from theD column was fed to a normal distillation column consistingf 63 stages.
ig. 15. The column profile for the atmospheric distillation column. Reboileruty: 180 W; feed stage: 34.

66
cp9aaatncTact
6
oIcrc
ItBety
A
Fai
R
[
[[[
[
Fig. 16. Proposed complete recovery system.
The feed location was optimized to be at the stage 34. Theolumn profile is shown in Fig. 15. It can be seen that it isossible to recover the ester almost completely. Recovery of9.1% is predicted through simulation. It should be noted thatvery high reflux ratio (131) is necessary. This is anticipated
s the IPTFA content of the feed stream itself is very small andhigh purity distillate is intended. The proposed flow sheet for
he complete recovery process is given in Fig. 16. It must beoted that the backward hydrolysis of IPTFA under uncatalysedonditions in the distillation column is assumed to be negligible.o suppress hydrolysis, if any, the distillation may be performedt reduced pressure which would reduce the temperature of theolumn. Further cost estimation may be performed to evaluatehe economic viability of this alternative.
. Conclusion
Reactive distillation is a promising tool for the recoveryf TFA from its dilute aqueous solution through formation of
PTFA, a useful intermediate. The studies on batch kinetics indi-ate a need to remove product of the reaction to surpass theeaction equilibrium limitations. The vapor–liquid equilibriumharacteristics are favorable for the effective in situ separation[
[
PTFA by distillation. Experiments performed in batch and con-inuous reactive distillation systems offer increased conversion.oth, equilibrium stage and non-equilibrium stage models canxplain the experimental data reasonably well. It was confirmedhrough simulation that a properly designed recovery system canield greater than 97% recovery.
cknowledgement
The authors would like to thank Prof. M.M. Sharma (FRS,NA) for introducing them to this interesting problem. Thanksre also due to Lupin Laboratory, India for supplying the chem-cals used in this work.
eferences
[1] R.S. Hiwale, N.V. Bhate, Y. Mahajan, S.M. Mahajani, Industrial applica-tions of reactive distillation: recent trends, Int. J. Chem. React. Eng. 2.(2004) (review R1).
[2] M. Sharma, S. Mahajani, Industrial application of reactive distillation (areview), in: K. Sundmacher, A. Kienle (Eds.), Reactive Distillation—Statusand Future Trends, Wiley–VCH, 2003, pp. 1–29.
[3] B. Saha B, S.P. Chopade, S. Mahajani, Recovery of dilute acetic acidthrough esterification in a reactive distillation column, Catal. Today 60(2000) 147–157.
[4] Z. Xu, A. Afacan, K. Chuang, Removal of acetic acid from water by cat-alytic distillation. Part 1. Experimental studies, Can. J. Chem. Eng. 77(1999) 676–681.
[5] Webref 1: http://www.solvaychemicals.com/product/datasheet/0,0,- EN-1000769,00.html, last accessed July 2006.
[6] L.A. Spangler, F. Abdesaken, J.A. Chong, US Patent 6,278,015, 2001.[7] K. Rossen, R. Volante, G. Ho, R. Farr, D. Mathre, US Patent 5,883,267,
1999.[8] I. Dorziotis, I. Houpis, K.K. Eng, US Patent 6,080,876, 2000.[9] C. Chen, L. Tan, R. Larsen, US Patent 6,140,515, 2000.10] K. Rossen, G. Ho, R.P. Volante, R.N. Farr, D. Mathre, US Patent 6,153,787,
2000.11] S. Grego, A. Checchin, G. Guglielmo, US Patent 4,916,256, 2001.12] J.A. Chong, F. Abdesaken, L. A. Spangler, US Patent 4,701,551, 2001.13] J.D. Raal and A.L. Muhlbauer, Phase equilibria: Measurement and Com-
putations, Taylor and Francis Publication, London, 1998.14] Y. Mahajan, PhD. Thesis, Department of Chemical Engineering, IIT-
Bombay, India, 2006.
15] R. Taylor, R. Krishna, Modeling reactive distillation, Chem. Eng. Sci. 55(2000) 5183–5229.16] J. Peng, S. Lextrait, T. Edgar, R. Eldridge, A comparison of steady-state
equilibrium and rate-based models for packed reactive distillation columns,Ind. Eng. Chem. Res. 41 (2002) 2735–2744.