industrial experience with object-oriented modelling...
TRANSCRIPT
INDUSTRIAL EXPERIENCE WITH OBJECT-ORIENTEDMODELLING
FCC Case Study
R. MADHUSUDANA RAO1, R. RENGASWAMY1,*, A. K. SURESH2 and K. S. BALARAMAN3
1Department of Chemical Engineering, Clarkson University, Potsdam, New York, USA2Department of Chemical Engineering, Indian Institute of Technology, Bombay, India3Research and Development, Chennai Petroleum Corporation Limited, Chennai, India
Process modelling and simulation have emerged as important tools for detailed study andanalysis of chemical processes. In activities such as design, optimization and control ofprocesses, realistic process models, which incorporate physics and chemistry of the
process in adequate detail, are becoming almost indispensable. Simulation studies also provideguidance in the development of new processes and can reduce both time and capitalinvestment. A difficulty with process models is that they are based on the state of knowledgeand simulation objectives defined at the time of their formulation. In addition, it is not easy tomodify process models to incorporate new knowledge as it becomes available and as new needsarise. There is a need, therefore, to use advanced modelling and simulation strategies such thatrefinements and additional capabilities can be incorporated in the model without dispropor-tionate additional effort. This work presents the framework of one such multipurpose processsimulator, MPROSIM, an object-oriented process modelling and simulation environment.Though considerable literature is available on process modelling from a subjective ortheoretical viewpoint, very little has been published on application of these ideas on complexindustrial-scale processes. This being the focus of the paper, a case study of an object-orientedmodel for automatic generation of a fluid catalytic cracking unit (FCCU) reactor=regenerator ispresented. The utility of the framework is illustrated by demonstrating how the model forFCCU could be fine-tuned both structurally and parametrically to represent the behaviour underchanging process operating conditions.
Keywords: FCCU; FCC model; object-oriented model; process modelling; MPROSIM.
INTRODUCTION
There is a greater need today than ever before to design andoperate chemical processes with a high degree of under-standing. This need arises from several factors: an incessantdemand for higher quality yields and better products; anincreasingly competitive environment that forces plants tobe operated in an optimal manner; variable raw materialquality; stringent environmental and safety regulations; anincreased level of automation arising out of the abovefactors, and so on. This need for a greater level of under-standing has to be seen in context of the fact that chemicalprocesses are usually complex to understand and operate.The complexity arises at different levels: at the level ofphysicochemical phenomena involved; at the equipmentlevel; and finally at the level of the plant where topological
factors resulting from recycles and other connectivitiesimpose additional demands. All these factors mean thatmathematical models of increasing complexity have to beused in order to design and operate processes profitably.Good models can also guide the development of newprocesses and can substantially reduce both time and capitalrequirements in process development. The utility of aprocess model strongly depends on its predictive capabilities.The predictions should be reliable over wide ranges of feedcomposition and process conditions. The availability of sucha model, in conjunction with a simulation tool, can thenfacilitate better insight into plant behaviour through simula-tions instead of the more expensive and time consumingroute involving actual experimentation.
The advantages resulting from efforts invested in theactivities of process modelling and simulation have to beseen against the fact that any mathematical model isnecessarily based on a set of assumptions. Typically, theassumptions are governed by several factors: objectivesthe model is meant to serve at the time of its formulation;
the need to keep the model tractable, consistent with theseobjectives; state of knowledge about the processes andequipment at the time of formulation of model, and so on.Any or all of these are subject to substantial changes duringthe life of a plant. It would be therefore desirable to choose aframework for modelling and simulation that allows theflexibility of incorporating changes in parts of the modelwithout having to undertake the entire modelling exerciseanew. The present work concerns the development ofa process modelling and simulation environment thatattempts to address such concerns. The framework, calledMPROSIM, is based on the concepts of object-orientedmodelling and simulation.
In the next section, we first describe the idea and conceptof MPROSIM. Some of the recent contributions in processmodelling, and methodology of process modelling and hie-rarchy of modelling objects in MPROSIM are also descri-bed. To demonstrate the utility and merits of MPROSIM, wepresent a case study that concerns the modelling andsimulation of FCCU, which in many ways typifies thetypes of challenges in process modelling and simulationthat MPROSIM seeks to address. In MPROSIM, FCCU ismodelled as a flowsheet using the fundamental chemicalprocess units. The object-oriented design and representationof the model as a flowsheet are also described. Variousstudies conducted with the model such as reactor tuning,regenerator tuning, parametric studies on integrated reactor=regenerator model and yield optimization studies, are alsopresented. We conclude this work with some comments onthe utility of an object-oriented framework such as MPRO-SIM and extension of the framework to form a singleenvironment wherein various process engineering activitiescan be conducted.
MPROSIM—MULTIPURPOSEPROCESS SIMULATOR
Concept
Typically, in a chemical production unit, process modelsare used offline instead of online. Some of the reasons forthis may have to do with issues of reliability of the processmodel, inadequate knowledge of the model input para-meters, and presence of noise in the data collected fromplant. Model reliability is established through extensivevalidation, after the model has been tuned by estimating themodel parameters. Hence, steady-state simulation, datareconciliation (for error detection in the plant data) andparameter estimation are some of the process engineeringactivities that are very closely related. Typically, these studieswould be carried out in different environments, and wouldalso often be based on different models. The main aim ofMPROSIM is to develop an integrated framework whereinvarious process engineering activities can be carried outwithin the same environment and with the same model.
Review of Process Modelling
Traditionally, modelling involves identifying the keyphenomena occurring in the system that influence thefeatures of interest, developing mathematical equations todescribe the phenomena, and solving these equations, most
often using numerical techniques with the help of computers.Model development as an activity is expensive, requiring asit does highly skilled manpower with a good amount ofprocess knowledge. Considerable work is also involved invalidating the models. Because of the high costs associatedwith model development and validation, it is desirable thatthe models retain their relevance and usefulness over areasonably long period of time.
In recent years, a variety of process modelling andsimulation tools have been developed. As for the latter,there are several tools, some of which have becomecommercially successful e.g., ASPEN PLUS, PRO II, etc.These tools are widely used in the petroleum industry assteady state simulators. Some of the reasons for theirextensive use are: fluid data handling capabilities, physicalproperty and component data base, and an easy to usegraphical user interface (GUI) for unit operations andflowsheet simulations. Extending these tools to modelmore specific or complex processes is difficult. Some ofthe typical examples that can be cited are mineral and solidsprocesses that involve particulate systems, membraneprocesses, polymer reaction systems and multiphase reac-tors. To illustrate this, consider a particulate process, whereit would be necessary to describe the properties ofthe dispersed phase (say solids), such as particle size,particle shape and=or porosity, as a part of the streaminput. General purpose simulators allow only for the defini-tion of a discretized particle size distribution by mass foreach solids stream (Gruhn et al., 1997). Though the particlesize distribution may be easily added as a user definedvariable for the process stream, the user must also supply thecode to handle the additional data at each unit model, i.e.,even at a simple splitter (Toebermann et al., 2000). Also, theparameters for a process unit (e.g., size reduction equip-ment) depend on the type of apparatus, process-relevantdesign, operating variables (gap size) and materials beingprocessed (Gruhn et al., 1997). Apart from the extensibilityconstraints, one of the main drawbacks of these simulationtools is that the models and problem solver are tightlycoupled in software modules, i.e., FORTRAN subroutines(Nilsson, 1993).
Because of the difficulties in adaptability and extensibilityof process simulation tools, process modelling tools basedon equation-oriented approach have gained importance.Examples of commercial simulators are SPEEDUP andgProms. They support the implementation of unit modelsand their incorporation in a model library, i.e., the user canspecify all model equations. Modelling of a process unitwould require a profound knowledge not only of chemicalengineering, but also of such diverse areas as modelling andsimulation, numerical mathematics and computer science.Hence, extending the standard models and further develop-ment of specific unit models can be undertaken only by asmall group of modelling experts. Successful attempts havebeen made on extending SPEEDUP and gProms for model-ling specific units of mineral processing problems (Bartonand Perkins, 1988) and crystallization processes (Pantelidesand Oh, 1996). However, the large effort for the set-up andevaluation of the equation system, as well as the expert userknowledge, is a disadvantage (Toebermann et al., 2000).Equation-oriented languages sometimes result in redundantmodelling as they do not assist the user in developingmodels using engineering concepts and thus, reuse of even
528
well-designed and validated models is sometimes compro-mised (Marquardt, 1996).
While both the above approaches have their advantagesand disadvantages, the experience of early researchers inthese two approaches towards process modelling hastriggered considerable interest over the last decade. Effortshave been directed towards addressing issues like modelformulation, reusability of process models, extensionsand adaptability to changing conditions. As a result of theefforts of various researchers, some of the developmentsin advanced process modelling tools and environmentsare: ASCEND (Piela et al., 1991), gPROMS (Barton andPantelides, 1994), MODEL.LA (Stephanopoulos et al.,1990), and OMOLA (Nilsson, 1993). One of the commonfeatures of all modelling tools is multi-level modularization.The idea of modularization has been inherited from theconcepts of object-orientation, which in turn has developedas a branch of computer science and engineering. The mainidea of object-oriented design is to break a large andcomplex system into smaller fragments or modules so asto attain abstraction at each modular level. The object-oriented approach directly supports reusability of commonfunctions in various parts of the program. Further, it alsoallows extensibility of the whole system by the implementa-tion of modules. The reader is referred to the originalliterature cited above for a detailed summary on the devel-opment of each modelling tool. State-of-the-art reviews ondevelopments in process modelling are also available(Marquardt, 1991, 1996; Biegler, 1989; Boston et al.,1993; Pantelides and Barton, 1993).
Some of the recent advances in the area of processmodelling have been towards a systematic approach to thedevelopment of process models (process modelling metho-dology) and formal representation of process model equa-tions (Marquardt, 1994, 1996; Bogusch and Marquardt,1995, 1997; Lohmann and Marquardt, 1996). Marquardtand his group have laid the foundations for systematicprocess model development and at the same time haveproposed an object-oriented methodology for the task ofcomputer-aided process modelling. Extending the ideas ofsystem theoretic approach and object-orientation, a processunit model can be decomposed into smaller modules basedon its structure (for example, reactor wall, catalyst, heat,material, etc., for a tubular reactor) and behaviour (conser-vation, constitutive equations, etc.). Similarly, the behaviouralobjects can further be decomposed into more fundamentalentities (for example, holdup, transport, transfer, etc., for aspecies conservation equation). Following this methodology,Marquardt and his group have proposed a structure forhierarchy of elementary process quantities for developinga unit model. A real unit model is defined by aggregating aset of these canonical=fundamental modelling objects.
The main aim of adopting such a modelling methodologyis to address the following two issues: (1) at the fundamentallevel, any chemical process, be it petroleum, petrochemical,metallurgical or biological, is the same i.e., conservationof species, components or particles and conservation=conversion of energy. Hence, with a well-structured andgeneric modelling tool, it should be possible (ideally) todefine any model by aggregating the elementary modellingobjects; and (2) to be able to develop a unit model from afundamental approach and also reuse and extend the exist-ing library of models to fit the changing requirements.
However, in spite of all the developments in the area ofobject-oriented structured process modelling over the lastdecade, there still remain several important issues that needto be addressed. They can be classified into two categories:
� Generic issues. Some of the issues are:— the amount of effort and expert knowledge that would
be required in various fields of science and engineer-ing for developing such a fundamental and genericmodelling tool.
— the capabilities and conduciveness of the existingmodelling and software tools for encoding and repre-senting the vast amount of diversified scientific andengineering knowledge in a structured format.
— the extent of granularity that one should build tomodel any given process system. One of the practicalissues in this context is that a given hierarchy ofprocess model structuring, however fine it may be inits granularity, might still be not complete. Forexample, in mineral processing, the liberation state,in gravel and sand industry processes, the fractionaldensity and in environmental processes like soil-washing, the fractional contamination must be con-sidered along with the particle size distribution tocharacterize a process stream (Toebermann et al.,2000). Similarly, processes from different fields ofengineering and technology may require additionalinput and parameter specifications for both processstreams and process models.
— uniqueness of a decomposition strategy. A chemicalprocess can be represented by an aggregation ofseveral possible combinations of fundamentalmodelling objects of varying degrees of complexi-ties. Thus, the decomposition strategy for definingthe model objects gives rise to many degrees offreedom. The problem of selection of a particularstrategy for process representation can be adifficult task when a large scale industrial processis considered.
— extension and adaptability of a set of fundamentalmodelling objects. A generic process modellingframework must be capable and flexible to be ableto extend and incorporate additional information=knowledge.
� Implementation issues:— Though some general guidelines for structured
process modelling have been stated (Marquardt,1992, 1996), the utility of the formalism can onlybe shown by the implementation and evaluation ofmodelling tools along with experimentation.
While there is considerable literature on structuredprocess modelling from a subjective or theoretical view-point, very little has been published on application ofthese ideas to complex real-life modelling problems. Tothe authors’ best knowledge, there has been no directevaluation of the formalism or the guidelines for struc-tured process modelling through an implementation on alarge scale industrial process. This is the main focus ofthe paper and FCCU is used as a case study. The projectwas undertaken in joint collaboration with a refinery,Chennai Petroleum Corporation Limited (CPCL), India.Though there are few commercially available simulation
529

tools for FCCU like FCC Plus, it is necessary to reiteratethat the concepts of object-oriented modelling and resultspresented in this contribution are not to undertake anevaluation of the simulation tools. The modelling andsimulation of FCCU is chosen to demonstrate the meritsof MPROSIM and at the same time present an evaluationof structured object-oriented process modelling guidelines.The reasons for the choice of FCCU are manifold:
� FCCU is a critical unit of a refinery, and is thus importantin its own right.
� FCCU is a large system with complexities at severallevels: heterogeneous operations, solids handling, hydro-dynamic complexities in the riser and fluid-bed regen-erators, complex kinetics resulting from the complexity offeedstock, topological complexities due to recycles andinterconnected flows, etc. It is therefore a good test caseto test the implementation and evaluation of the ideas ofmodularization and structural decomposition.
� Various configurations of reactor and regenerator are inoperation in the refineries. Adaptability of the modellingframework to different configurations can therefore betested.
� Inputs to the unit often change in terms of both quality(composition of feed) and quantity (product demands inthe market). Often, a new or improved catalyst becomesavailable. This is precisely the situation where a simula-tion tool can prove its utility, since fine tuning of theoperating conditions in response to such changes is oftenneeded.
� Various assumptions have been made in literature formodelling the physics and chemistry of the crackingprocess. As a result, several approaches are available formodelling different sections of FCCU. There is thus anopportunity to test the flexibility of the framework tomodel the system using different approaches.
In the next section, we briefly describe the object-orientedmodelling framework developed in MPROSIM. The frame-work is based on the principles of systematic processmodelling as enumerated in many of the works discussedabove.
Modelling in MPROSIM
MPROSIM is a framework for multipurpose processmodelling and simulation. The simulator is based on theequation-oriented approach. It has been developed usingthe concepts of object-oriented programming (OOP). Themodelling environment and the graphical user interface(GUI) are developed using JAVA. Even though some ofthe simulator framework features are under development andseveral program module implementations are rudimentary,the overall software architecture of MPROSIM is illus-trated in Figure 1. The key idea that is being explored inMPROSIM is to make every activity of process engineeringa class or an object. It is also designed to make all theimportant and essential features of process engineeringcompletely accessible from the GUI. Hence, the overallarchitecture of MPROSIM is flat, allowing the user tocarry out various process engineering activities with thesame model built using the GUI.
Object-oriented modelling is a modern approach tohandle complexities. The method involves modularization
and characterization of data into an abstraction called class.A class is like a blueprint for an application or part of anapplication. An object, which is an instance or an incarna-tion of a class, has both substance and behaviour bycomprising data and functions that perform operations onthis data. A well abstracted class can be tested and imple-mented independently. Abstraction helps in the reuse of aclass=object in various parts of the program. Functionscommon to many classes can reside in one class and canbe implemented in other parts of the program with the helpof inheritance. The common functionalities can be adaptedto meet specific requirements with the help of polymorph-ism. To protect parts of the program from unintentionalchanges or side effects, variables and elements of an objectcan be encapsulated. The flow of control in the program canbe threaded with the help of multithreading. Multithreadingprovides a way for an application to handle many differenttasks at the same time (Niemeyer and Knudsen, 2000). Eventhough JAVA supports only single inheritance, it allowsmultiple implementation of interfaces. All these featuresmake JAVA a conducive language to design the GUI and themodelling framework.
The methodology of process modelling in MPROSIM hasbeen designed and developed based on the above conceptsof object-oriented programming and modelling. The hier-archy of process modelling in MPROSIM, as of present, isdepicted in Figure 2. The first step is a topological frag-mentation where a process is broken into model fragmentsor unit modules based on structure of the process. Therepresentation of the original process is achieved by theaggregation of these model fragments with the help ofstreams in the form of a flowsheet. Each of the modelfragments resulting from the first step of decomposition ismodular and well abstracted. The model fragments can betested and implemented independent of other fragments,thus ensuring their reuse. At the second step, a modelfragment or unit module is further decomposed into mole-cular fragments based on its internal structure and beha-viour. A model fragment can be instantiated by a collectionof the molecular fragments.
In the present development stage of MPROSIM, thehierarchial modelling structure lies at the molecular fragmentlevel. Further decomposition of the molecular fragmentsinto atomic fragments and issues relating to its testing andimplementation are some of the developments presentlyunder progress. For the FCCU case study, further
Figure 1. Software architecture of MPROSIM.
530

decomposition of molecular fragments could not be under-taken due to limitations such as project schedule, datacollection, etc. Though the modelling hierarchy builtcurrently is neither suitable nor extensible to model anygiven process system, it is appropriate to address variousissues relating to the modelling of an industrial-scale FCCU.In addition, some of the model fragments resulting from thedecomposition are generic in nature and can be extended tomodel other specific units=processes as highlighted insection on Discussion and Clarifications, below.
For the implementation of the FCCU model, a node classis defined as the molecular fragment, which contains all thetypical model equations such as mass balance, energybalance, etc. Every unit module or model fragment inheritsthe node class and can modify or add additional informationto the inherited model equations to reflect its own behaviour.The FCCU model is realized in the form of a flowsheet byan aggregation of unit modules by connecting them with the
help of streams. A detailed description of the object-orientedmethodology for FCCU modelling in MPROSIM is given ina subsequent section. As a precursor, a brief review of theliterature on FCCU modelling is presented in the nextsection.
Review of FCCU Modelling
Over the years, many models have been proposed forFCCU. These models have been based on different sets ofassumptions with respect to the kinetics of cracking reac-tions and hydrodynamics of the equipment involved, such asriser and regenerator. Some models concern themselves onlywith the regenerator (Ford et al., 1976; Errazu et al., 1979;de Lasa et al., 1981; Guigon and Large, 1984; Krishna andParkin, 1985; Lee et al., 1989a). Some have only reactor orcracking models (Weekman and Nace, 1970; Paraskos et al.,1976; Jacob et al., 1976; Shah et al., 1977; Lee et al.,
Figure 2. Hierarchy of process modelling in MPROSIM.
531

1989b; Larocca et al., 1990; Takatsuka et al., 1987). Therealso exist integrated models coupling both the regeneratorand reactor (Kumar et al., 1995; Lee and Kugelman,1973; McGreavy and Isles-Smith, 1986; Bozicevic andLukec, 1987; Arandes and de Lasa, 1992; McFarlane et al.,1993; Arbel et al., 1995; Arandes et al., 2000). Table 1presents a list of literature which typify the approaches thathave been considered for FCCU modelling.
The variety of approaches present in the literature can beanalysed with reference to Figures 3 and 4. The reactor riseris often modelled as being in plug flow (Arbel et al., 1995)with uniform temperatures across a cross section and atemperature gradient along the height of the riser. Otherassumptions, such as quasi steady state, no slip, adiabaticoperation, uniform temperature of the two phases at anypoint and constant heat capacities of oil vapour and catalystare usually made in the analysis. On the other hand,McFarlane et al. (1993) assume isothermal conditions (i.e.,CSTR type) in the riser, though the bottom of the riserinvolves a non-isothermal zone due to a finite mixing time.
Apart from this, riser models differ mainly in their con-siderations of reaction kinetics. Weekman and Nace (1970)developed a three lump model which was used by manyauthors. Lee and Groves (1985) used the three lump model intheir integrated model. Other models based on the Weekman-Nace three-lump model include those of McGreavy and Isles-Smith (1986), Kraemer and de Lasa (1988), Arandes andde Lasa (1992). Other authors expanded the three lumpsystem into more lumps. Jacob et al. (1976) developed aten lump system. A four lump model was developed by Leeet al. (1989b). Bozicevic and Lukec (1987) published a fivelump model. Takatsuka et al. (1987) developed a Weekmantype six lump model. Kraemer et al. (1990) extended theirmodel to eight lumps. Two papers appeared in 1995 using tenlump kinetics with an integrated model. Kumar et al. (1995)used an isothermal reactor riser and Arbel et al. (1995)modelled the riser assuming plug flow. Arandes et al.(2000) have considered the ten lump kinetics for dynamicand steady-state model of FCCU. Plug flow conditions wereassumed in the riser and for gas flow in the regenerator.
Among the models proposed for the regenerator, mostfocus on the dense bed that is characterized by bubblesrising through an emulsion phase. The earliest models were
single phase, simple contacting models with plug flow,mixed flow, dispersion and tanks in series. The earlyresearchers, Arthur (1951), Rowe and Partridge (1965) andWeisz and Goodwin (1966) simply divided the bed intoregions known as dense phase and dilute phase. Later on,more complete models were developed: the grid-effectmodel by Behie and Kehoe (1973) and Errazu et al.(1979); the two-region model by de Lasa and Grace (1979)and de Lasa et al. (1981); and the bubbling-bed model byKunii and Levenspiel (1968, 1990).
A summary of the assumptions made by various research-ers for modelling the physics and chemistry of the processesin FCCU is illustrated in Figure 3. In the next section, theFCCU case study is presented. The case study describes indetail the process modelling methodology adopted for asystem like FCCU and its implementation in MPROSIM.Model tuning and comparison of model predictions to theplant data are also presented. The case study is concludedwith a discussion on some merits of developing FCCUmodel in an object-oriented framework like MPROSIM.
CASE STUDY: MODELLING OF FCCU
Process Description
The schematic of a current generation FCCU with stand-pipes and slide valves is represented in Figure 4. The reactorconsists of a vertical section called the riser. The preheated
Table 1. A brief summary of literature on FCCU modelling.
Author Year Model type Kinetic model
Weekman and Nace 1970 C 3-Lump modelJacob et al. 1976 C 10-Lump modelFord et al. 1976 R NAErrazu et al. 1979 R NALee and Groves 1985 I 3-Lump modelKunii and Levenspiel 1990 R NAMcFarlane et al. 1993 I NoneArbel et al. 1995 I 10-Lump modelKumar et al. 1995 I 10-Lump modelSriramulu et al. 1996 R NAArandes et al. 2000 I 10-Lump model
C: Cracking model; R: Regenerator model; I: Integrated model.
Figure 3. Summary of various assumptions for modelling FCCU.
532

feed is brought in contact with hot regenerated catalyst at thebottom of the riser. Feed flashes at the bottom of the riser andis vapourized. As the catalyst–vapour mixture rises in nearplug flow, cracking reactions take place within the riser. Cokeis deposited on the catalyst surface during cracking reactions.Heat required for endothermic cracking reactions is suppliedby the hot catalyst. The bulk of the catalyst is separated fromproduct vapour in the riser termination device (RTD) at thetop of the riser and falls into the stripper section. Catalystfines that are entrained along with the product vapour areseparated in the reactor cyclones and returned to the stripper.The product vapour is fed to the main fractionator whereit is separated into various components such as light gases(C1–C4), liquified petroleum gas (LPG), gasoline, cycle oil inthe diesel boiling range and heavy bottoms.
In the stripper section, steam is used to strip off hydro-carbons trapped within the bulk of the catalyst and catalystpores. Stripped catalyst is regenerated in the regeneratorsection by burning coke in a fluidized bed using hot air.Coke combustion reactions occurring in the dense bedproduce CO, CO2 and H2O. Combustion reactions occurfurther in the dilute phase due to entrainment of catalystparticles from the dense bed by the flow of air. The entrainedcatalyst is separated from stack gases in regenerator cyclones
and returned to the dense bed. The heat due to combustionreactions raises the temperature of the regenerated catalystwhich is recycled to the reactor through the stand pipe. Asshown in Figure 4, spent and regenerated catalyst circulationis controlled by slide valves in most of the modern units.
Kinetic Lumping Scheme
The reactions that occur in the riser when hot regeneratedcatalyst comes into contact with the feed are described byconsidering a lumping scheme. The lumps on the feed sideare characterized based on the boiling point range of gas oilfeed and its chemical composition, mainly in terms ofparaffins, naphthenes and aromatics. The lumps on theproduct side are characterized by the boiling point rangeof main fractionator side draws. The various lumps consid-ered for building the reaction kinetics are listed in Table 2.The lumps on the feed and product side are chosen based onthe theoretical basis provided by Jacob et al. (1976) and theexperimental support from CPCL for feed and productcharacterization.
The network of reactions using the 11 lumps given inTable 2 are shown in Figure 5 along with their boiling pointranges. The salient points of the reaction network are:
Figure 4. Schematic of a FCCU reactor=regenerator system.
533

� The feed is mainly characterized as consisting of heavyand light fractions based on the boiling point range,370�C–FBP and IBP–370�C respectively. Each of theheavy and light fractions are further divided into fourlumps—paraffins, naphthenes, aromatics and side chains.The product consists of three lumps—gasoline (C5–IBP),light gases (C1–C4) and coke.
� It is assumed that there are no cross reactions betweenheavy and light fractions. For example, heavy naphthenes(Nh) crack to give only light naphthenes (Nl) and not lightparaffins (Pl). One exception to this assumption is thecracking of heavy aromatic substituent groups (Sh) goingto light aromatic bare rings (Al).
� Bare aromatic rings are mainly responsible for cokeformation. Hence (Ah) and (Al) are shown to formonly coke.
� Figure 5 shows the reactions mainly from Ph and Pl andother typical reactions. Apart from the reactions shown inthe figure, naphthenes (Nh and Nl) and substituent groupson aromatics (Sh and Sl) will have reactions similar to thatindicated for paraffins (Ph and Pl)
� Based on the above set of assumptions, the total numberof cracking reactions in the network is 27.
As described in the review on FCCU modelling literature,researchers have considered modelling the reaction kineticsin the riser based on various assumptions and parametersi.e., number of lumps the feed is characterized into, ratelaws governing the reaction kinetics, kinetic parameters, andvarious empirical catalyst deactivation functions. Some ofthe recent literature proposes the use of structure-orientedlumps for modelling the reaction kinetics of complex feed-stocks (Quann and Jaffe, 1992, 1996). In the event of somany factors influencing reaction kinetics in the riser, it hasbeen modelled as a class=object with all the influencingfactors featuring as attributes of reaction class. Thus, themodel is not restricted to a single lumping strategy. The usercan choose any number of lumps, build a reaction networkbetween various lumps, input the various kinetic parameters,define any type of rate laws governing the formation=depletion of various lumps and also include different typesof catalyst deactivation functions. Modelling the reactionkinetics as a class=object does not restrict the model toa particular lumping strategy. Moreover, it imparts theimportant characteristic—ease of extension and adaptabilityto model other complicated reaction mechanisms, which isone of the desired essential features of a structured processmodelling.
Object-Oriented Modelling of FCCU
The object-oriented model for FCCU is developedfollowing the object-oriented and process modelling metho-dology described in section on Modelling in MPROSIM,above. Catalytic reactions in the riser, regenerator flui-dized bed hydrodynamics and coke combustion areconsidered in the model. Detailed momentum calculationsat various sections of the unit have also been taken into
Figure 5. 11-lump reaction kinetic scheme.
Table 2. Kinetic lumping scheme: feed and product lumps.
Feed lumps BP range (�C) Product BP range (�C)
Ph 370–FBP Gasoline C5–IBPNh 370–FBP Light gases C1–C4
Ah 370–FBP CokeSh 370–FBPPl IBP–370Nl IBP–370Al IBP–370Sl IBP–370
IBP: Initial boiling point of feed; FBP: Final boiling point of feed;P: Paraffins; N: Naphthenes; A: Aromatic bare rings; S: Substituent groupson aromatics. Subscripts: l – Light fraction, h – Heavy fraction.
534

consideration. Based on the physicochemical phenomenaoccurring in various sections of the reactor=regeneratorand geometry of the unit, a structural decomposition wasperformed. The unit is divided into smaller fragments ofsystems and subsystems. The decomposition is progres-sively done until each model fragment represents afundamental chemical unit operation. The hierarchy ofmodel fragments as a result of decomposition performedon the commercial unit (see Figure 4) is illustrated inFigure 6. Different sections of FCCU which contribute tothe pressure drop in the system are also considered in thedecomposition and model hierarchy. A model fragment, oran aggregation of some model fragments, represents apart or the whole of FCCU. For example, the riser bottomis emulated by an adiabatic mixer model wherein catalystand liquid feed combine and produce a single streamconsisting of catalyst and feed vapour. Following thismethodology, various sections of reactor and regeneratorare decomposed to fundamental chemical engineering unitoperation models as described below:
ReactorThe reactor can be divided into various sections which
can be modelled using the following units:
� Mixer: The mixer model emulates mixing of hot regene-rated catalyst and liquid feed at the bottom of the riser. Itis modelled considering adiabatic conditions. In addition,the mixer model represents other mixing processes withinthe reactor and regenerator, for example, mixing of steamfrom stripper bed and product vapour separated from theriser termination device.
� Riser: The riser can be modelled either as a single con-tinuous stirred tank reactor (CSTR), representing com-plete back mixing with uniform temperature (McFarlaneet al., 1993), or as a plug flow reactor with temperaturegradient along the riser height (Arbel et al., 1995). Theabove two assumptions represent two extremes of model-ling the riser. The actual conditions within the riser can be
assumed to represent a non-ideal mixing zone. This is dueto the presence of slip between vapour and catalystparticles, axial dispersion of catalyst due to turbulenceand temperature difference between the riser inlet andoutlet in actual conditions. Hence, the riser is modelled asa composite object characterized by series of CSTRs. Slipratio, catalyst circulation, space velocity and void fractionare important factors which determine hydrodynamics ofthe riser. The chemistry of reactions is accounted for by alumped kinetic scheme as described earlier.
� Riser Termination Device (RTD): The RTD is modelledas a hydrodynamic unit which contributes to pressuredrop due to splitting of the vapour-catalyst stream intotwo (a ‘TEE’ junction) and a sudden expansion of thevapour through an opening into the reactor vessel.
� Splitter: The separation of catalyst from vapour at theRTD is modelled using a splitter, which divides the inletstream into two and has a splitting efficiency for eachcomponent. It is modelled with the assumptions of nopressure loss and the three streams, one inlet and twooutlet, are in thermal equilibrium.
� Cyclone: Separation of the catalyst fines from the reactorvapours is modelled using a cyclone. Separation effi-ciency for each component and pressure drop are takeninto consideration.
� Stripper: The stripper is modelled to represent stripping ofhydrocarbons. It is modelled assuming a counter currentoperation with mass transfer. The amount of unstrippedhydrocarbons in the stripper is a function of the steam tocatalyst ratio and is given by an empirical function (Arbelet al., 1995).
A schematic of the reactor configuration in an object-oriented framework using the units described above is illu-strated in Figure 7. The riser is represented as a compositeobject in the object-oriented framework. The number ofCSTRs for modelling the riser is a model input parameter.The user can specify any number of CSTRs instead ofphysically assembling that number of units on the flowsheet.As a result, the riser can be configured to represent differentFCC riser models reported in literature.
The riser termination device at the top of the riser (seeFigure 4) is modelled as a combination of the following units:the RTD, with stream splitting into two halves along withpressure drop; and a splitter, which accounts for separation ofthe catalyst from the product vapour. This methodology ofmodelling the pressure drop as a separate model fragment wasadopted in order to retain the generic nature of a component=stream splitting unit. This results in a well defined and abstractsplitter unit that can be reused. The stripper is modelled intwo sections. This is to account for recycling of the entrainedcatalyst through the dip leg of the reactor cyclones into thestripper bed. The stripper bed, Stripper0, represents the stripperfrom the top of the bed to the dip leg exit inside the bed. Thelower portion of the stripper bed, from the exit of the dip leg tothe spent catalyst exit, is represented by Stripper1.
RegeneratorThe regenerator is mainly divided into two regions: dense
bed and dilute region. It also consists of hydrodynamic unitssuch as air distributor and cyclones for catalyst separationfrom flue gases. Cyclones are modelled similarly to thosedescribed in the reactor section.Figure 6. Structural decomposition of FCC reactor=regenerator.
535

� Air distributor: The air distributor is modelled as apressure drop unit for inlet air. The pressure drop in theunit depends on the type of distributor. For a pipe grid type,the pressure drop depends on the number of open holes inthe grid, the diameter of each hole and air inlet pressure.
� Dense region: This region is characterized by a bed ofsolid catalyst particles and the air which flows through thebed for catalyst regeneration. The dense bed is furtherdivided into two sections— Emulsion phase: This phase mainly consists of solid
catalyst particles which are assumed to be completelymixed with the flow rate of air corresponding tominimum fluidization velocity. Hence, this phase ismodelled as a single CSTR with uniform temperatureand gas composition.
— Bubble phase: The portion of air with flow rate
exceeding minimum fluidization velocity is assumed
to flow in the form of bubbles. These bubbles are con-
sidered to be rising through the dense bed in near plug
flow fashion. The effect of expansion of bubbles due
to pressure gradient along the height of the dense bed,
coalescence of bubbles and increase in volumetric flow
rate of bubbles due to pressure gradient are not con-
sidered. The near plug flow of the bubble phase is
modelled as a series of CSTRs. The bubble phase is
assumed to be completely free of the catalyst particles.
� Dilute region: This region consists of combustion gasesfrom the top of the dense bed and the entrained catalystparticles. Due to superficial velocity of the air and burstingaction of the bubbles at the top of the dense bed, catalystparticles get entrained along with combustion gases andform a dilute phase above the dense bed. In this region,both gas and solid catalyst particles are assumed to be
moving in near plug flow. In actual conditions, there existssome amount of back mixing due to heavier particlesfalling off before they reach the cyclones. Hence,this phase is also modelled as a series of CSTRs. It isassumed that all the entrained catalyst particles return tothe dense bed through the cyclone dip legs.
Various reactions occurring as a result of coke combustionin different regions of the fluidized bed are considered inboth the dense bed and dilute phase. Overall conversion ofcoke depends on flow rate of air, its pressure and temperature,amount of catalyst in the bed, catalyst circulation rate, andbed temperature. The combustion reactions are also stro-ngly influenced by characteristics of the fluidized bed. Adetailed hydrodynamic calculation of the fluidization processis considered to determine various parameters such as beddensity, void fraction, etc. The reader is referred to theappendix for a detailed account of all the hydrodynamiccalculations and combustion reactions that were taken intoconsideration.
The schematic of different regions considered for model-ling the regenerator and its flowsheet representation inan object-oriented framework is shown in Figure 8. Theregenerator is a complex unit characterized by hydrodyna-mics of the fluidized bed and coke combustion reactions.In addition, inlet air flow rate and its conditions stronglyinfluence the physical and chemical phenomena, thus givingrise to a coupled transfer and exchange of mass, momentumand energy between various regenerator model fragments.Hence, dense bed and dilute phase are modelled as a singlecomposite object similar to the riser. The number of CSTRsassociated with both the bubble phase and regenerator dilutephase are part of input parameters to the composite object.
Figure 7. Configuration of the FCC reactor system in object-orientedframework.
Figure 8. Configuration of a FCC regenerator system in object-orientedframework.
536

The complete flowsheet schematic of the integratedFCC reactor=regenerator is shown in Figure 9. The repre-sentation of FCCU as a flowsheet in MPROSIM is illu-strated in Figure 10. The figure also shows the inputtemplate for the riser. In the next section, we present theresults of simulation studies conducted using the FCCUmodel.
Model Tuning
The FCCU model has been developed as a processflowsheet in MPROSIM. Various units are provided in thelibrary, with which a user can select the units and connectthem to represent various configurations of FCCU. TheFCCU model has several input parameters. In addition tothose associated with input streams i.e., flow rates, compo-sition, temperature, pressure, etc., there are various unitparameters. Many of these unit parameters are essentiallythe assumptions that are part of a FCCU model. The usercan specify these parameters and thereby make a set ofassumptions for the model. Simulation studies can becarried out by providing necessary inputs in order tocheck whether the model assumptions that the user hasmade are valid for the respective configuration of the
commercial unit. If the results are not satisfactory, the usercan change the modelling assumptions by changing theparameters. Thus, the model can be fine tuned to representthe configuration of the commercial unit.
The model was tuned with industrial data provided byCPCL to represent their FCCU configuration. Tuning themodel involved carrying out simulation studies by adjustingvarious unit parameters and comparing model predictionswith that of the plant data.
Reactor tuningObject-oriented flowsheet representation of the reactor in
MPROSIM is shown in Figure 11. Inputs to the reactorflowsheet consisted of feed flow rates, composition of feedin terms of various lumps, regenerated catalyst and steam forthe stripper section. Inputs to the reactor flowsheet areshown in Table 3. One of the important tuning parametersfor the reactor flowsheet is number of CSTRs for the riser.Studies were conducted using the reactor model by varyingnumber of CSTRs. The model predictions were comparedwith process conditions and product yield of the commercialunit. All other parameters and inputs such as catalystcirculation rate, feed conditions, etc., are kept constant.Results of the simulation studies are given in Figures 12–16.
Figure 9. FCC reactor=regenerator model in an object-oriented framework.
537

The trends of variables shown in the above figures provethat the assumption of approximating the reactor riser by afinite number of CSTRs-in-series is appropriate. A smallnumber of CSTRs would mean the riser is close to idealmixing conditions. At the same time, a large number ofCSTRs would indicate a proximity to near plug flowcondition. It is evident from the above figures that beyonda certain number of CSTRs (say, 10), change in the modelprediction is not significant. Once the model is tuned withrespect to the number of CSTRs for the riser, an appropriatenumber can be selected for carrying out further simulationstudies on the reactor and integrated reactor=regeneratorflowsheet. We have chosen 10 CSTRs to represent CPCL’sreactor riser for conducting further simulation and optimiza-tion studies.
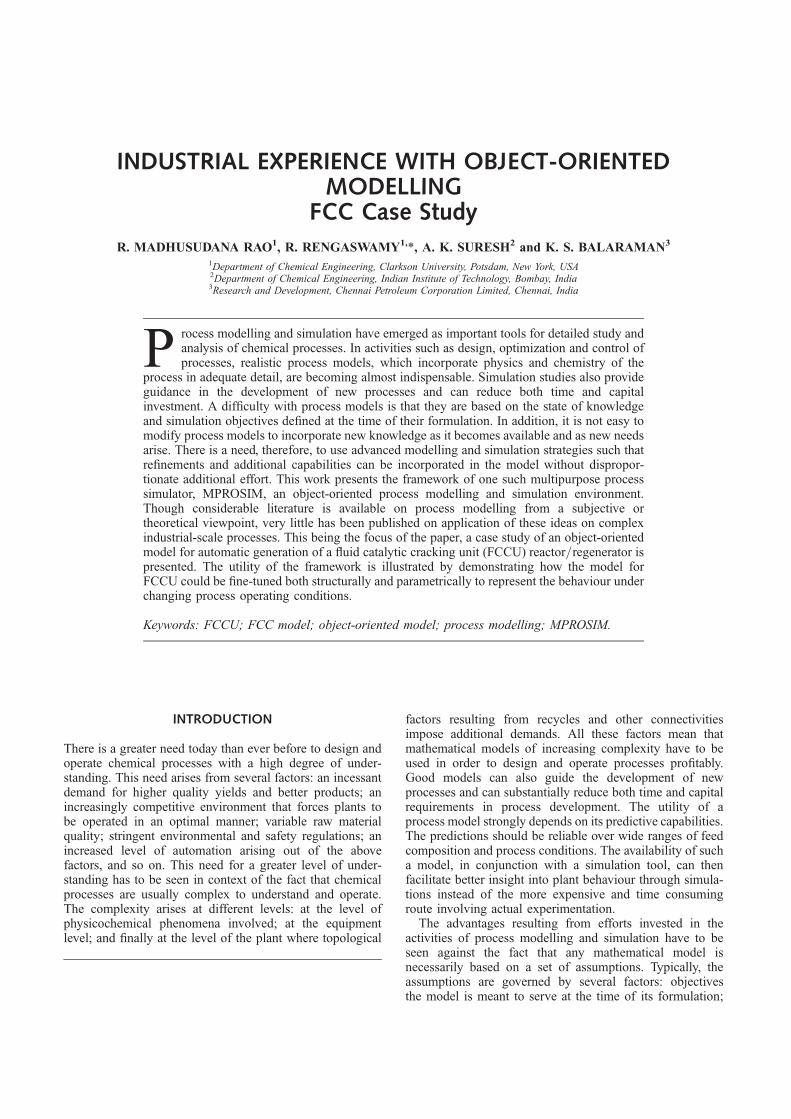
Regenerator tuningThe regenerator modelled as a flowsheet in MPROSIM is
illustrated in Figure 17. The figure also shows the input temp-late for the regenerator composite object. Typical parametersused for tuning the regenerator model are: (1) number ofCSTRs for bubble phase; (2) number of CSTRs for dilutephase; and (3) entrained catalyst as weight percent of
Figure 10. FCC reactor=regenerator model in MPROSIM.
Table 3. Reactor inputs.
Parameter (units) Value=source
Feed conditionsTotal feed flow rate (Kg h�1) 100,482.40Composition (Wt. fraction)
Ph 0.2866Nh 0.1061Ah 0.0836Sh 0.1905Pl 0.1151Nl 0.0426Al 0.0535Sl 0.1220
Feed temperature (�C) 351.0Feed pressure (Kg cm�2) 2.74
CatalystRegenerated catalyst flow rate (Kg h�1) 594,000.0Coke on regenerated catalyst (Wt. percent) 0.25Temperature (�C) 660.0
SteamFlow rate (T h�1) 1.50Temperature (�C) 220.0Pressure (Kg cm�2) 2.80
Other inputsKinetic parameters Arandes et al., 2000Catalyst deactivation Arbel et al., 1995
538

catalyst in the regenerator. Inputs to the regenerator flow-sheet are shown in Table 4. Tuning of the regeneratorflowsheet is done by varying the number of CSTRs ofboth bubble phase and dilute region for a fixed value ofcatalyst entrainment. After each simulation, model predic-tions are checked with process data from the commercial
unit. The combinations of number of CSTRs and catalystentrainment that match the plant data are chosen as repre-sentative values. Regenerator model tuning results are givenin Table 5 and parameters chosen for CPCL’s regeneratorconfiguration are highlighted.
Parametric=Optimization Studies
The parameters chosen from tuning of the reactorand regenerator are used in the integrated FCC reactor=regenerator flowsheet to conduct further simulation studies.A comparison of results of model prediction and corre-sponding process data obtained from the commercial unitare shown in Table 6. Some of the data corresponding tomodel predictions could not be derived from the commercialunit due to reasons of instrumentation and lack of samplingpoints.
A process model can also be used for various optimiza-tion studies. In the case of the FCCU model, yield optimiza-tion studies were carried out with the model. The effect offeed composition and temperature on gasoline yield isshown in Figure 18. Three different feed compositionsconsidered for this study are listed in Table 7. The behaviourshown in the plots is typically expected of gasoline. Refer-ring to Figure 5, it can be seen that gasoline not only formsfrom heavy and light fractions of the feed, but also under-
Figure 11. Reactor flowsheet in MPROSIM.
Figure 12. Wt. fraction of feed lumps (heavy) vs. no. of CSTRs.
539

goes a cracking reaction to produce light components andcoke. Due to the secondary cracking nature of gasoline, itsyield exhibits a maximum as a function of feed temperature.It is evident from Figure 18 that not only does the gasolineyield change with change in feed composition, but theoptimum temperature also changes. This result is in goodagreement with procedures typically followed in the opera-tion of the commercial unit. Stable operation of FCCU ischallenged by frequent changes in feed composition due tochange of crude oil input to the refinery. To maximize theyield from FCCU, operating parameters such as catalystcirculation rate and feed inlet temperature are regularlymonitored and manipulated whenever feed compositionchanges.
The next section briefly summarizes the authors’ experi-ences in the implementation of object-oriented frameworkfor modelling a large scale industrial process such as FCCU.The section also highlights and clarifies some of the lessonslearnt during model development stage and implementationperiod, and in hindsight, vis-a-vis the practical issues listedin the section on Review of Process Modelling, above.
Discussion and Clarifications
To begin with, the FCCU model development projectwas undertaken in an academic institution with the supportof CPCL. The scope of the project was to develop a steady-state model for CPCL’s FCC reactor=regenerator confi-guration. The model was proposed to be developed in anobject-oriented framework to support the refinery’s researchand development team in carrying out off-line simulationstudies for trouble-shooting due to frequent changes in feedcomposition, catalyst evaluation and independent studies ofinternal components of the FCCU such as cyclone, stripper,etc. From a detailed review of the literature on FCCUmodelling, the model development was focussed towardsdeveloping a general framework for modelling variousFCCU configurations proposed in the literature. Thoughthe outcome of this development effort was more orientedtowards FCCU modelling and addressing some of therefinery-based modelling issues, there are some generalprinciples that can be culled from this effort towardsunderstanding the object-oriented modelling of chemicalprocesses. Based on the modelling effort, the following
Figure 13. Wt. fraction of feed lumps (light) vs. no. of CSTRs.
Figure 14. Wt. fraction of product lumps vs. no. of CSTRs.
Figure 15. Total riser yield (Wt. fraction) vs. no. of CSTRs.
Figure 16. Riser outlet temperature (�C) vs. no. of CSTRs.
540
comments could be made regarding generic and implemen-tation issues laid down in section on Review of ProcessModelling, above.
� the development team consisted of chemical engineersfrom academia and industry, specifically from a refinery.So, the knowledge domain of the group of developers isrestricted to a few areas of chemical engineering. Typi-cally, this would be the scenario in any model develop-ment activity undertaken in collaboration with anindustrial partner. As a result, the model developmentactivity is influenced by the knowledge of the modellingexperts. In addition, several practical issues have to betaken into consideration as highlighted in the following
discussion. Even if a prototype of a generic framework isdeveloped independent of any industrial input, it wouldneed to be critically evaluated. Implementation of variousrepresentative large scale processes from diverse engineer-ing fields such as petroleum, petrochemical, biological,solids-based, etc., have to be considered for the evaluation.The amount of time and expertise needed would always bean important limiting factor.
� the development team would have to judiciously choosea decomposition strategy to model the process in anobject-oriented framework. Some of the choices availablefor developing an object-oriented model for FCCU areenumerated in Table 8. The choice of the authors for themodelling of FCCU in this contribution is alsohighlighted. The selection of a particular option is notonly influenced by the modelling experts from academia,but also by the industrial partner. In addition, the durationand time-frame of the project have to be taken intoconsideration.
� the granularity to which the given process is decomposedand design of the framework directly depend on thechoice made from the options listed in Table 8. Typically,at each level of decomposition, some assumptions may beintroduced into some or all the model fragments. Essen-tially, a higher degree of fragmentation would imply alarger number of assumptions in the model. Theseassumptions are verified as a result of experimentation
Figure 17. Regenerator flowsheet in MPROSIM.
Table 4. Regenerator inputs.
Parameter (units) Value=source
AirAir flow rate (Kn m3 h�1) 43.0Temperature (�C) 237.0Pressure (Kg cm�2) 2.60
CatalystSpent catalyst (Kg h�1) 594,000.0Temperature (�C) 500.5Coke on spent catalyst (Wt percent) 0.943
Other inputsFluidization parameters Arbel et al., 1995
541
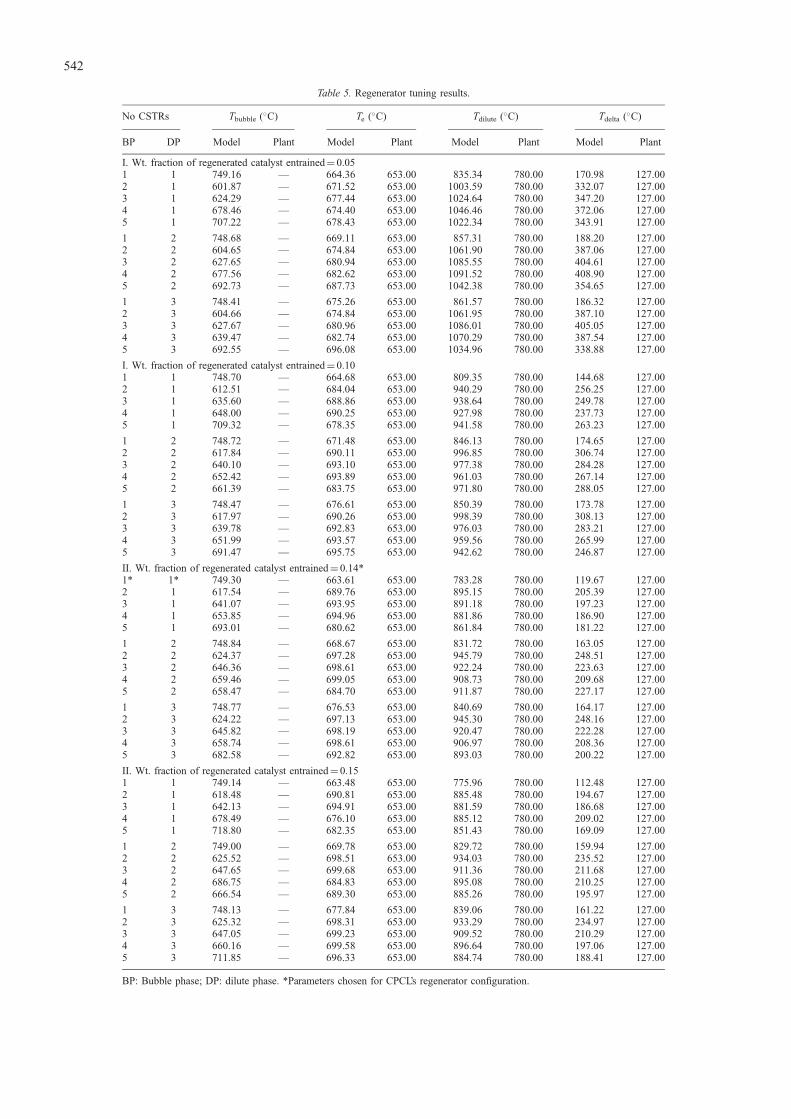
Table 5. Regenerator tuning results.
No CSTRs Tbubble (�C) Te (�C) Tdilute (�C) Tdelta (�C)
BP DP Model Plant Model Plant Model Plant Model Plant
I. Wt. fraction of regenerated catalyst entrained¼ 0.051 1 749.16 — 664.36 653.00 835.34 780.00 170.98 127.002 1 601.87 — 671.52 653.00 1003.59 780.00 332.07 127.003 1 624.29 — 677.44 653.00 1024.64 780.00 347.20 127.004 1 678.46 — 674.40 653.00 1046.46 780.00 372.06 127.005 1 707.22 — 678.43 653.00 1022.34 780.00 343.91 127.00
1 2 748.68 — 669.11 653.00 857.31 780.00 188.20 127.002 2 604.65 — 674.84 653.00 1061.90 780.00 387.06 127.003 2 627.65 — 680.94 653.00 1085.55 780.00 404.61 127.004 2 677.56 — 682.62 653.00 1091.52 780.00 408.90 127.005 2 692.73 — 687.73 653.00 1042.38 780.00 354.65 127.00
1 3 748.41 — 675.26 653.00 861.57 780.00 186.32 127.002 3 604.66 — 674.84 653.00 1061.95 780.00 387.10 127.003 3 627.67 — 680.96 653.00 1086.01 780.00 405.05 127.004 3 639.47 — 682.74 653.00 1070.29 780.00 387.54 127.005 3 692.55 — 696.08 653.00 1034.96 780.00 338.88 127.00
I. Wt. fraction of regenerated catalyst entrained¼ 0.101 1 748.70 — 664.68 653.00 809.35 780.00 144.68 127.002 1 612.51 — 684.04 653.00 940.29 780.00 256.25 127.003 1 635.60 — 688.86 653.00 938.64 780.00 249.78 127.004 1 648.00 — 690.25 653.00 927.98 780.00 237.73 127.005 1 709.32 — 678.35 653.00 941.58 780.00 263.23 127.00
1 2 748.72 — 671.48 653.00 846.13 780.00 174.65 127.002 2 617.84 — 690.11 653.00 996.85 780.00 306.74 127.003 2 640.10 — 693.10 653.00 977.38 780.00 284.28 127.004 2 652.42 — 693.89 653.00 961.03 780.00 267.14 127.005 2 661.39 — 683.75 653.00 971.80 780.00 288.05 127.00
1 3 748.47 — 676.61 653.00 850.39 780.00 173.78 127.002 3 617.97 — 690.26 653.00 998.39 780.00 308.13 127.003 3 639.78 — 692.83 653.00 976.03 780.00 283.21 127.004 3 651.99 — 693.57 653.00 959.56 780.00 265.99 127.005 3 691.47 — 695.75 653.00 942.62 780.00 246.87 127.00
II. Wt. fraction of regenerated catalyst entrained¼ 0.14*1* 1* 749.30 — 663.61 653.00 783.28 780.00 119.67 127.002 1 617.54 — 689.76 653.00 895.15 780.00 205.39 127.003 1 641.07 — 693.95 653.00 891.18 780.00 197.23 127.004 1 653.85 — 694.96 653.00 881.86 780.00 186.90 127.005 1 693.01 — 680.62 653.00 861.84 780.00 181.22 127.00
1 2 748.84 — 668.67 653.00 831.72 780.00 163.05 127.002 2 624.37 — 697.28 653.00 945.79 780.00 248.51 127.003 2 646.36 — 698.61 653.00 922.24 780.00 223.63 127.004 2 659.46 — 699.05 653.00 908.73 780.00 209.68 127.005 2 658.47 — 684.70 653.00 911.87 780.00 227.17 127.00
1 3 748.77 — 676.53 653.00 840.69 780.00 164.17 127.002 3 624.22 — 697.13 653.00 945.30 780.00 248.16 127.003 3 645.82 — 698.19 653.00 920.47 780.00 222.28 127.004 3 658.74 — 698.61 653.00 906.97 780.00 208.36 127.005 3 682.58 — 692.82 653.00 893.03 780.00 200.22 127.00
II. Wt. fraction of regenerated catalyst entrained¼ 0.151 1 749.14 — 663.48 653.00 775.96 780.00 112.48 127.002 1 618.48 — 690.81 653.00 885.48 780.00 194.67 127.003 1 642.13 — 694.91 653.00 881.59 780.00 186.68 127.004 1 678.49 — 676.10 653.00 885.12 780.00 209.02 127.005 1 718.80 — 682.35 653.00 851.43 780.00 169.09 127.00
1 2 749.00 — 669.78 653.00 829.72 780.00 159.94 127.002 2 625.52 — 698.51 653.00 934.03 780.00 235.52 127.003 2 647.65 — 699.68 653.00 911.36 780.00 211.68 127.004 2 686.75 — 684.83 653.00 895.08 780.00 210.25 127.005 2 666.54 — 689.30 653.00 885.26 780.00 195.97 127.00
1 3 748.13 — 677.84 653.00 839.06 780.00 161.22 127.002 3 625.32 — 698.31 653.00 933.29 780.00 234.97 127.003 3 647.05 — 699.23 653.00 909.52 780.00 210.29 127.004 3 660.16 — 699.58 653.00 896.64 780.00 197.06 127.005 3 711.85 — 696.33 653.00 884.74 780.00 188.41 127.00
BP: Bubble phase; DP: dilute phase. *Parameters chosen for CPCL’s regenerator configuration.
542

and=or by matching the model predictions with theindustrial data. However, the quantity and quality ofdata that can be derived from a running industrial plantare certainly limited. Some of the reasons for this are:instrumentation for the process is fixed and no additionalprocess data can be extracted; test runs that an industrialpartner is willing to conduct on the commercial unit;inaccuracies of the process data; and the availability ofsophisticated instrumentation for carrying out lab-scaleexperimental studies. Hence, hierarchy of the granularstructure designed for a process model is limited to alarge extent by the above practical issues. To cite anexample, the stripper section was modelled as an idealcounter-current mass and energy exchange operation;though, in the actual design of the unit, the operation isnot so. Since no specific tests could be conducted on thestripper of the commercial unit and due to unavailabilityof any lab-scale experimental setup, the assumptionscould not be validated. Hence, an empirical function formass exchange, i.e., stripping of hydrocarbons, was takenfrom the literature (Arbel et al., 1995) without any changeof function parameters.
� uniqueness of decomposition: decomposition of theFCCU model proposed earlier is not unique. The decom-position strategy adopted resulted in more than onedegree of freedom in terms of the number of CSTRs forreactor riser, regenerator bubble and dilute phases. If aPFR model had been chosen for the same regions, thedegrees of freedom would have been fixed and alsounique to some extent. But the choice of CSTR model
fragment allows the model to be flexible and it can beconfigured to represent many commercial FCC reactor=regenerator units.
� as described earlier, many FCCU models have beenproposed in the literature. One of the important aspects ofthis model development has been to conceptualize a frame-work in which many FCCU models can be configured. Thehierarchy of structural decomposition illustrated in Figure 6is general enough to represent many FCCU modelsproposed in the literature. An aggregation of the modelfragments along with appropriate model assumptions wouldresult in a particular configuration. The following twoexamples are highlighted to illustrate the idea:
— if the riser is assumed to be a single CSTR,regenerator bubble and dilute phases are modelledby a large number of CSTRs, and empirical kineticsare assumed for overall reactor conversion, then themodel would represent that proposed by McFarlaneet al. (1993) in its steady-state form.
— on the other hand, if the reactor riser, regeneratorbubble and dilute phases are approximated by largenumber of CSTRs, and a 10-lump kinetic model isused to describe the catalytic reactions, then themodel would be that proposed by Arbel et al.(1995).
� similarly, by considering different combination of CSTRsfor the bubble and dilute phases, various models proposedfor the regenerator can be realized. The object-orientedmodelling of FCCU as a flowsheet consisting of variousparts of the process as model fragments has resulted inthe conceptualization of a general framework which can beeasily extended and adapted to model various configura-tions of FCC reactor=regenerator. However, the issuesconcerning the reuse, extension and adaptability of eachof the model fragments need to be critically evaluated. Thesuccess and failure issues concerning the modelling of riserand regenerator composite objects are evaluated below:
Table 6. Comparison of simulated and plant data.
Process variable Model prediction Plant data
ReactorRiser bottom temperature (�C) 550.18 —Riser outlet temperature (�C) 501.78 498.50Reactor yield 69.3 68.0
CatalystCatalyst circulation rate (T min�1) 9.71 9.9Spent catalyst temperature (�C) 500.4 469.50Regenerated catalyst temperature (�C) 663.61 653.0Coke on spent catalyst (Wt.%) 0.943 —Coke on regenerated catalyst (Wt.%) 0.45 0.25
RegeneratorBubble phase outlet temperature (�C) 749.3 —Emulsion phase outlet temperature (�C) 663.61 653.0Dilute phase outlet temperature (�C) 783.28 780.0
Figure 18. Optimization of gasoline yield.
Table 7. Feed composition inputs for gasoline optimization.
Wt. fraction
Component Feed 1 Feed 2 Feed 3
Ph 0.2866 0.1791 0.1592Nh 0.1061 0.0707 0.0707Ah 0.0836 0.0557 0.0557Sh 0.1905 0.1190 0.1058Pl 0.1151 0.1957 0.2072Nl 0.0426 0.0823 0.0852Al 0.0535 0.0900 0.0963Sl 0.1220 0.2073 0.2195
Table 8. Degrees of freedom for modelling FCCU.
Option Description Evaluation
1 FCC reactor=regenerator A monolithic block2 Reactor; regenerator Two model blocks3 Reactor kinetics; reactor
hydrodynamics; regenerator kinetics;regenerator hydrodynamics
Four model blocks
4* Decomposition as given in Figure 6 General framework*5 Decomposition based on Figure 2 Fundamental approach
*Option chosen in this contribution.
543
— the riser is modelled as a composite object. It canfunction as a single CSTR or as a non-ideally mixedtubular reactor by a series of CSTRs. It can also beapproximated as a PFR by specifying a large numberof CSTRs, ideally infinite. The riser is one of themodel fragments which truly reflects the behaviour ofa composite object—one that can be completelyreused, and can be easily extended and adapted.
— the regenerator composite object is the model frag-ment for a fluidized bed. As highlighted earlier, theregenerator fluidized bed is a complex and coupledprocess. In its present state, the regenerator compositeobject can be used to represent a single stage regen-erator. It is also possible that a two-stage regeneratorcan be modelled using a stack of two compositeobjects. If the regenerator composite object is furtherdecomposed resulting in more fundamental modelfragments, then it is possible to model many indus-trial-scale fluidized bed processes. The issuesconcerning this problem are currently being studied.
As indicated in the issues listed above, the developmentand implementation of a formal structure, guidelines andprinciples of object-oriented modelling on a large-scaleindustrial process are strongly influenced not only by theexpertise of the development team as a whole, but also byvarious factors which comprise the needs and requirementsof the industry on a commercial scale. Many of the exten-sion and adaptability issues related to MPROSIM as asimulation and modelling tool are currently being evaluated.For this purpose, we are undertaking a detailed study ofobject-oriented modelling in other processes such as fuelcells, biochemical and biological processes, etc.
UTILITY AND MERITS
The representation of the FCCU model as a flowsheet hasseveral advantages. It is possible to carry out simulationstudies with an integrated reactor=regenerator flowsheet,with individual reactor and regenerator flowsheets andstudy the performance of individual units such as reactoror regenerator cyclones, stripper, air distributor, etc. Severalstudies on sensitivity of reactor yield and other importantprocess parameters to input conditions can be carried outwith the model. Typically, carrying out sensitivity, para-metric and optimization studies involves a lot of effort. Butwith the above model developed in an object-orientedframework, studies like these can be conducted easily.
The representation of modelling assumptions in terms ofunit parameters is essentially an extension of the object-oriented concept of encapsulation as described in the sectionon Modelling in MPROSIM, above. Some of the assump-tions that are encapsulated as unit parameters in the FCCUmodel are:
� the number of CSTRs for modelling the reactor riser,regenerator bubble and dilute phases
� catalyst deactivation function for catalytic cracking in theriser, and
� splitting efficiencies (either direct numerical values or interms of empirical functional forms) for all components inunits such as splitter, cyclone and stripper.
One of the important problems that units in a refinery,typically FCCU, have to face is that the feed composition
changes regularly. With evolution of technologies and needsof particular markets in terms of product requirements andspecifications, it becomes necessary for the unit configura-tion also to change with time. Hence, it is an inevitableexercise for any process model to be regularly fine-tuned torepresent the changing conditions in the plant. In such ascenario, a process model developed in an object-orientedframework can provide better support to the process engi-neer. In the case of FCCU, various reactor and regeneratorconfigurations are in operation in the refineries. Some of thevariations in structural configurations of the reactor andregenerator are:
� various types of disengagement section for separation ofproduct vapour from catalyst at the top of the riser
� different designs for the stripper section� single-stage and two-stage regenerators� single-stage and two-stage cyclone separation for catalyst
fines.
In addition to the structural variations based on processdesign, operating conditions of the unit also vary widely.Some of the reasons for this could be: the spectrum ofproducts the unit is commissioned to produce, frequentchanges in the quality of feed, and fluctuations in themarket demand affecting the quantity of throughput. Suchvariations in the configurations and operating conditions canbe modelled very easily and quickly in MPROSIM. Achange in catalyst circulation rate and=or quantity of feedto the riser will change the hydrodynamics inside the riser.Similarly, air flow rate and catalyst circulation rate willaffect hydrodynamics of the catalyst bed in the regenerator.The model can be fine tuned by simply changing the numberof CSTRs to reflect the new process operating conditions.The key factor responsible for flexibility of the FCCUmodel in MPROSIM is its modularization and representationin the form of a flowsheet. Unlike the traditional models,which might be difficult to configure to represent variousconfigurations of FCCU, the object-oriented model can beeasily configured to represent various configurations.
CONCLUSIONS
An evaluation of the principles of structured processmodelling was undertaken in this work. This was done byhighlighting the critical issues and problems encounteredwhile implementing the guidelines for structured object-oriented process modelling. As a case study for the processmodel, an industrial-scale FCCU was chosen. The FCCUmodel served as an appropriate example to bring forth theimportant object-oriented modelling issues such as granu-larity, adaptability and extensibility.
The model fragments proposed for the FCCU model aregeneral enough to be able to represent various modelsproposed in the literature and other configurations ofFCCU. However, issues relating to the reusability andextensibility of these model fragments to other chemicalprocess systems are still open and work is under progress inthis regard. As for the main aim of MPROSIM and develop-ment of a general purpose modelling tool, it is proposed tostudy processes and systems from various other science andengineering fields to address issues such as generality ofprocess models and their implementational details.
544

APPENDIX: FCCU MODEL EQUATIONS
The model equations for the various sections of the reactorand regenerator are summarized below. Typically, each unitcomprises the mass, energy and momentum balances. Thereactor riser incorporates the 11-lump kinetic model andpressure drop equations based on the pneumatic transportof the solids. On the regenerator side, the detailed hydro-dynamic equations are written characteristic of a fluidizedbed taking into consideration the coke combustion kinetics.
Reactor
� MixerThe mixer is modelled under adiabatic conditions with thetypical mass and energy balance equations. The mixerdoes not contribute any pressure drop. The equationspertaining to the pressure drop due to mixing, flow acrossnozzles, and so on are modelled as separate hydrody-namic units. For the case of riser bottom, the pressuredrop in the liquid feed across the distributor is modelledas a hydrodynamic unit.
� RiserThe riser is modelled as a composite object. The compo-site object contains mass and energy balance equationsincorporating reaction kinetics. In addition, detailedmomentum balance equations are taken into considera-tion. The model equations for the riser are typified byCSTR model equations. The effect of coking and catalystdeactivation are taken into consideration by includingappropriate terms in the model equations (McFarlaneet al., 1993; Arbel et al., 1995).— Mass balance: The mass balance equation for a
component j (either a reactant or product) withinany CSTR inside the riser for the 11-lump kineticmodel can be written as
Fj,out ¼ Fj,in � rv
Fcat
Foil
f(t)
�1
1 þ KdyAh
X11
k¼1
nkKk0e(�Ek=RT ) Fk,out
Foil
(1)
— Energy balance: A CSTR heat balance gives thetemperature profile in the riser based on the numberof CSTRs considered to model the riser. The energybalance equation for any CSTR in the riser compositeobject can be written as
Fj,inCpfvTin þ FcatCpcatTin
¼ Fj,outCpfvTout þ FcatCpcatTout
þ rv
Fcat
Foil
f(t)1
1 þ KdyAh
�X11
k¼1
nkKk0e(�Ek=RT ) Fk,out
Foil
DHrk (2)
— Pressure drop: The pressure drop in the riser ismodelled similarly to the pneumatic transport ofsolid particles in the vertical direction. The followingterms are considered as the contributing factors to the
pressure drop within the riser (Jones et al., 1967;Yang, 1973, 1974).
* acceleration of solid particles
DPr1 ¼ 8F2cat
(3:6 � 105)2p2rpartgd4riser
(3)
* static head of the catalyst-vapour mixture
DPr2 ¼Fcat þ Foil
(Fcat=rpart) þ (Foil=rv)
!hriser
104(4)
where rv, feed vapour density at the bottom of the
riser, is calculated by the equation
PmixerMfeed
RTmixer
(5)
* friction between fluid media and wall
DPr3 ¼ 2driser
hriser
� �0:079
Re0:25
� �rv
Foil=rv
(p=4)d2riser
� �2
(6)
assuming turbulent conditions. The Reynolds number
(Re) is given by the following equation
Re ¼driserVvapourrv
mv
(7)
The feed oil vapour velocity (Vvapour) inside the riser
can be calculated by the following equation
Vvapour ¼Foil=rv
(p=4)d2riser
(8)
The viscosity of the vapour at the mixer outlet
conditions is given by
mv ¼ 1:0319 � 10�6(Tmixer þ 273:15)0:4896
1:0 þ (3:4737 � 102)=(Tmixer þ 273:15)
(9)
* acceleration of the fluid media
DPr4 ¼ 1:0
2 � 104
rvVvapour
g(10)
� Riser Termination Device (RTD)The inlet stream of the RTD is assumed to be split intotwo equal halves taking into consideration the geometryof the disengaging section at the top of the riser. Further,all the three streams are assumed to be in thermalequilibrium. The pressure drop in the RTD is modelledby considering the following terms (Bird et al., 1960).— a ‘TEE’ junction which is approximated by two
90� bends
DPrtd1 ¼rmix
2 � gV 2
rtd
2:3
b21
� 1:0
!� 10�4 (11)
545

where b1, rmix and Vrtd are given by the following
equations
b1 ¼ driser
darm
� �(12)
rmix ¼ Fcat þ Foil
(Fcat=rpart) þ (Foil=rv)(13)
Vrtd ¼(Fcat=rpart) þ (Foil=rv)
(p=4)d2riser
(14)
— sudden expansion of the catalyst and product vapourmixture into the reactor vessel
DPrtd2 ¼rmix
gV 2
armb2(1 � b2) � 10�4 (15)
where b2 is the area ratio of the opening in the side
arm of the RTD and the annular area in the reactor
portion. It is given by the following equation
b2 ¼pwhw
p=4(d2reac � d2
riser)(16)
and Varm is given by the equation
Varm ¼(Fcat=rpart) þ (Foil=rv)
(p=4)d2arm
(17)
� CyclonesThe cyclone separators used for the recovery of catalystfines are modelled for the pressure drop. The totalpressure drop in the cyclone is a sum of the followingindividual pressure drops (Perry and Green, 1997)— inlet contraction
DPc1 ¼ 0:5rgmix(V 2in � V 2
vessel þ KV 2in) (18)
— particle acceleration
DPc2 ¼ LVin(Vpin � Vpvessel) (19)
For small particles, we can consider
Vpin ¼ Vin (20)
and
Vpvessel ¼ Vvessel (21)
— barrel friction
DPc3 ¼2f rgmixV
2inpDcNs
din
(22)
The friction factor f is based on the Reynolds number
calculated at the inlet area. The Reynolds number is
calculated by the following equation
Re ¼dinVinrgmix
mgmix
(23)
and din is calculated as
din ¼ 4(inlet area)
inlet perimeter(24)
and mgmix, the viscosity of the vapour-steam mixture
can be calculated by the empirical equation
mgmix ¼ 1:0319 � 10�6T0:4896
1:0 þ (3:4737 � 102)=T(25)
— gas flow reversal
DPc4 ¼rgmixV
2in
2(26)
— exit contraction
DPc5 ¼ 0:5rgmix(V 2exit � V 2
c þ KV 2exit) (27)
� SplitterThe splitter is modelled to separate the inlet streaminto two streams with an efficiency of splitting foreach component present in the inlet. The modelequations consist of the mass balance for each of thecomponents
Fj,in ¼X
streams
Fj,out j ¼ 1, 2, . . . , 11 (28)
and
Fj,out ¼ ZjFj,in j ¼ 1, 2, . . . , 11 (29)
where Zj is the efficiency of splitting for the componentj. The splitter is modelled such that the inlet andoutlet streams are in thermal and hydrodynamicequilibrium.
� StripperThe stripper is modelled as a counter current operationwith steam stripping the hydrocarbons from the voids inthe stripper bed as well as within the catalyst pores. Theefficiency of stripping depends on the steam to catalystflow rate and is assumed to be a linear function of thisratio (Arbel et al., 1995). Since the stripping is a countercurrent operation with steam injected at the bottom andcatalyst flowing down, the pressure of the streams whichlie on the same side of the stripper unit are considered tobe equal and the two outlet streams are assumed to be inthermal equilibrium.
Regenerator
� Air distributorAssuming a uniform distribution of air without anychannelling effects, the following equation models thepressure drop for the pipe grid type air distributor (CPCL,1999)
DPad ¼PairVair
3960Tair
(30)
� Dense bedAs described earlier the regenerator dense bed is dividedinto two phases, emulsion phase and bubble phase. Theemulsion phase consists of the catalyst particles and airflow equivalent to the minimum fluidization velocity. The
546
bubble phase consists of the air flow rate which is inexcess over the minimum fluidization requirement. Theair entering from the distributor, stream U0, (see Figure 8)is divided into two streams, (U07Umf) corresponding tothe bubble phase flow and Umf, equivalent to theminimum fluidization velocity (Kunii and Levenspiel,1968, 1990).— Splitter 1
The flow in stream Umf will correspond to mini-mum fluidization velocity which is given by theequation
Umf ¼9:0 � 10�4 �dd1:8
p b(rpart � rair)gc0:934
r0:066air m0:87
air
(31)
where rair can be calculated from the ideal gas
equation written at the air distributor exit conditions
and the viscosity of air can be calculated from the
empirical correlation
mair ¼ (0:016931 þ 4:9863 � 10�5Tair � 3:1481
� 10�8T2air þ 1:2682 � 10�11T3
air) �10�3
g
(32)
The average particle size can be calculated given the
particle size distribution (PSD) of the equilibrium
catalyst using the following equation
�ddp ¼ 1Pi (xi=dpi
)� 10�6 (33)
A balance across the Splitter 1 (see Figure 8) will give
the equation for calculating the air flow rate in the
form of bubbles
Fair,in ¼ Fair,bubble þp4Umfd
2reg (34)
— Emulsion phaseThe emulsion phase is assumed to be a completelymixed zone. One of the attributes of the CSTR thatshould be known is the volume occupied by the CSTR.Hence, before the balance equations for the individualcombustion components are presented, detailed hydro-dynamic calculations for the fluidized bed are listedbelow.
The fraction of the total dense bed occupied by the
bubbles is given by the equation
d ¼ Uo � Umf
Ub
(35)
where the bubble rise velocity (Ub) is given by
Ub ¼ Uo þ Umf þ Ubr (36)
Ubr ¼ Uo � Umf þ 0:711ffiffiffiffiffiffiffiffiffiffi(gdb)
p(37)
where db, the effective bubble diameter is calculated
from the following equation
db ¼ 0:667q0:375o (38)
Therefore, the volume occupied by the bubble phase
is given by
Vb ¼ dZbedAreg (39)
Zbed ¼ min Zcyc,Wreg � rdilAregZcyc
Areg(rdense � rdil)
( )(40)
rdil ¼ max{0:0,(aUo � b)} (41)
rdense ¼ (1 � edense)rpart (42)
edense ¼Uo þ c
Uo þ d(43)
and the volume occupied by the emulsion phase is
Ve ¼ ZbedAreg � Vb ¼ ZbedAreg(1 � d) (44)
The emulsion phase is considered as a single CSTR
and the bubble phase is approximated by CSTRs-
in-series, see Figure 8. The following combustion
reactions are considered in the regenerator (Arbel
et al., 1995; Weisz and Goodwin, 1966)
* r1: C þ 0:5O2 �!CO
* r2: C þ O2 �!CO2
* r3: CO þ 0:5O2 �!CO2(Heterogeneous)
* r3h: CO þ 0:5O2 �!CO2(Homogeneous)
* r4: H2 þ 0:5O2 �!H2O
It is assumed that the complete hydrogen in the coke
is burnt in the emulsion CSTR itself and hence, no
reaction kinetics are taken into consideration for the
hydrogen balance equation (Arbel et al., 1995). All
the other reactions (r1, r2, r3c and r3h) occur in the
emulsion phase. Writing the balance equation for
each of the components in the emulsion phase
* Mass Balance:
Balance equation for catalyst
Xstreams
Fcat,in ¼X
streams
Fcat,out (45)
Balance equation for carbon
Coke is assumed to be of the formula CHn.
Therefore the balance can be written as
Fcoke,in
12 þ n� 12 ¼ r1 þ r2 þ Fcoke,out (46)
The product stream from the emulsion CSTR
does not contain any hydrogen in the coke as all
the hydrogen is converted to H2O in the emulsion
phase itself. The reaction rates for the carbon in
the first two reactions described above, r1 and r2
are given by
r1 ¼ Ve(1 � edense)rpartK1
Fcoke,out
Fcat,out
PO2(47)
547

where the rate constant K1 and the partial pres-
sure of O2, PO2are defined by the following
equations
K1 ¼2:6 � 1011 exp(�12926=Te)
2512 exp(�3420=Te) þ 1(48)
PO2¼
(FO2,out=32)
Ftotal,out
Preg (49)
Ftotal,out is total sum of the molar flow rates of the
gaseous components in the emulsion phase
outlet stream and is given by
Ftotal,out ¼�FO2
32þ FCO
28þFCO2
44
þFN2
28þFH2O
18
�out
(50)
r2 ¼ Ve(1 � edense)rpartK2
Fcoke,out
Fcat,out
PO2
(51)
where the rate constant K2 is defined by the
following equation
K2 ¼1:035 � 108 exp(�9506=Te)
2512 exp(�3420=Te) þ 1(52)
Balance equation for CO2
The total CO2 produced in the emulsion phase is
contributed by three different reactions, r2, r3c,
r3h taking place simultaneously. Therefore a
balance on CO2 gives us
FCO2,out ¼44
12r2 þ
44
28ðr3c þ r3hÞ �
XNb
k¼1
MkCO2
(53)
where, the last term on the right hand side of the
above equation represents the mass transfer of
CO2 between emulsion phase and bubble phase
CSTRs. The reaction terms r3c and r3h are
combined and given by
r3 ¼ Ve K3 PO2PCO (54)
K3 ¼ xpt(1 � edense)rpartK3c
þ edenseK3h (55)
K3c ¼ K3c0 exp �Ek3c
RTe
� �(56)
K3h ¼ K3h0 exp �Ek3h
RTe
� �(57)
The mass transfer between bubble and emulsion
phase CSTRs is given by
MkCO2
¼ Kbe
(FkCO2,out=44)
Fair,bubble
�(Fe
CO2,out=44)
Fair,emulsion
( )
�dZbedAreg
2(58)
Balance equation for CO
The balance equation for CO is similar to that
written above for CO2
FCO,out ¼28
12r1 � r3 �
XNb
k¼1
MkCO (59)
The reaction terms have already been described
above. Writing the mass transfer equations
MkCO ¼ Kbe
(FkCO,out=28)
Fair,bubble
�(Fe
CO,out=28)
Fair,emulsion
( )
�dZbedAreg
2(60)
Balance equation for O2
The O2 supply to the emulsion phase takes place
from both the flow stream as well as the mass
transfer lines from the bubble phase. Writing a
balance would give
FO2,out ¼ FO2,in �1
2�32
12r1 �
32
12r2 �
1
2�32
28r3
�Fcoke;in
12 þ n� n�
1
4� 32
þXNb
k¼1
MkO2
(61)
FO2,in ¼21
100�
Fair,emulsion (Pair
þ 1:033)=1:033
82:057 � 10�3
(Tair þ 273:15)
� 32
(62)
MkO2
¼ Kbe
(FkO2,out=32)
Fair,bubble
�(Fe
O2, out=32)
Fair,emulsion
( )
�dZbedAreg
2(63)
Balance equation for N2
The balance equations are similar to that written
for O2 with one exception being that there will
548

be no reaction terms.
FN2,out ¼ FN2,in þXNb
k¼1
MkN2
(64)
FN2,in ¼ 79
100�
Fair,emulsion (Pair
þ 1:033)=1:033
82:057 � 10�3
(Tair þ 273:15)
� 28
(65)
MkN2
¼ Kbe
(FkN2,out=28)
Fair,bubble
�(Fe
N2,out=28)
Fair,emulsion
( )
�dZbedAreg
2(66)
Balance equation for H2O
The balance equation for H2O can be written as
Fcoke,in
12 þ n� n� 1
2� 18
¼ FH2O,out þXNb
k¼1
MkH2O (67)
MkH2O ¼ Kbe
(FkH2O,out=18)
Fair,bubble
�(Fe
H2O,out=18)
Fair,emulsion
( )
�dZbedAreg
2(68)
* Energy Balance: The energy balance equation for
the emulsion phase can be written as
Qinput ¼ Qoutput þ Qgen (69)
Qinput ¼ Qair þ Qent þ Qsc þ Qcoke
þ QmtO2
þ QmtN2
(70)
The last two terms of input heat are due to the mass
transfer of O2 and N2 from the bubble phase
CSTRs to the emulsion phase CSTR. The heat
input due to air (Qair) can be calculated by
Qair ¼ MairCpair(Te � Tref ) (71)
where the Mair is the flow rate of air in mol s�1 and
is given by
Mair ¼((Pad þ 1:033)=1:033)Fair,emulsion � 106
82:057 � Te
(72)
Pad is the pressure at the exit of the air distributor
and is calculated by
Pad ¼ Pair � DPad (73)
The heat input due to the entrained catalyst falling
into the dense bed is given by
Qent ¼ Fentcat Cpcat(Tent � Tref ) (74)
The heat input from the spent catalyst entering the
regenerator dense bed is given by
Qsc ¼ FcatCpcat(Tsc � Tref ) (75)
Heat input due to coke is calculated as
Qcoke ¼ FcokeCpcoke(Tsc � Tref ) (76)
The heat inputs due to the mass transfer from bubble
phase CSTRs for O2 and N2 are given by
QmtO2
¼XNb
k¼1
MkO2CpO2
(Tbubble,k � Tref ) (77)
QmtN2
¼XNb
k¼1
MkN2CpN2
(Tbubble,k � Tref ) (78)
Similarly, the following equations give the expressions
for the heat output from the emulsion phase
Qoutput ¼ Qcat þ QO2þ QN2
þ QCO
þ QCO2þ QH2O þ Qmt
CO
þ QmtCO2
þ QmtH2O (79)
Qcat ¼ FcatCpcat(Te � Tref ) (80)
QO2¼ FO2
CpO2(Te � Tref ) (81)
QN2¼ FN2
CpN2(Te � Tref ) (82)
QCO ¼ FCOCpCO(Te � Tref ) (83)
QCO2¼ FCO2
CpCO2(Te � Tref ) (84)
QH2O ¼ FH2OCpH2O(Te � Tref ) (85)
QmtCO ¼
XNb
k¼1
MkCOCpCO(Te � Tref ) (86)
QmtCO2
¼XNb
k¼1
MkCO2
CpCO2(Te � Tref ) (87)
QmtH2O ¼
XNb
k¼1
MkH2OCpH2O(Te � Tref ) (88)
The heat generation in the emulsion phase is due to
the coke combustion reactions, which are exother-
mic in nature. Hence, the total heat generated can
be written as
Qgen ¼ r1DHTe
f ,CO þ r2DHTe
f2,CO2þ r3DH
Te
f3,CO2
þ r4DHTe
f ,H2O (89)
The heats of formation at the temperature condi-
tions of the emulsion phase CSTR are given by
549

(Perry and Green, 1997)
DHTe
f ,CO ¼ �763168 þ 86:604Te þ 8:456
� 10�3T 2e � 458920
Te
(90)
DHTe
f2,CO2¼ �4160500:82 þ 158:928Te
þ 0:0236T2e � 8130804
Te
(91)
DHTe
f3,CO2¼ �2961244 þ 22:836Te þ 1:0274
� 10�2T 2e � 7409644
Te
(92)
DHTe
f ,H2O ¼ �1011938:58 � 63:665Te
þ 1:387 � 10�2T2e � 542305:545
Te
(93)
The specific heats of the gaseous components
which are required for calculating the enthalpy of
the streams can be written as functions of tempera-
ture (Smith and Van Ness, 1987)
CpCO ¼ 0:2357 þ 4:286 � 10�5T (94)
CpCO2¼ 0:235 þ 6:23 � 10�5T
� 4443:18
T2(95)
CpH2O ¼ 0:457 þ 8:33 � 10�6T
þ 7:44 � 10�8T 2 (96)
Cpcoke ¼ 0:22275 þ 1:454
� 10�4T � 6494:44
T2(97)
CpN2¼ 0:232 þ 3:57 � 10�5T (98)
CpO2¼ 0:2584 þ 8:0625
� 10�6T � 5865:625
T2(99)
— Bubble PhaseThe bubble phase is considered to be free of catalystparticles. Hence the only reaction that takes placewithin each of the bubble phase CSTRs is the COcombustion reaction in the gas phase i.e., the homo-geneous reaction (r3h). The rate equation for eachCSTR can be accordingly written as
rCO ¼ Vkb K3hPO2
PCO (100)
where the partial pressures have to be calculated as
described earlier but based on the outlet conditions of
the corresponding bubble phase CSTR. The balance
equations for other components are similar to that
written for the emulsion CSTR.� Dilute phase
The dilute phase is modelled as a series of CSTRs. The mass,momentum and energy balance equations for the CSTRs aresimilar to those written for the emulsion phase. Sincehydrogen in coke is assumed to be completely combusted
in the emulsion bed, the corresponding mass and energybalance equations are not taken into consideration.
� Regenerator CyclonesThe regenerator cyclone equations are similar to thereactor cyclone model equations. To model a two-stagecyclone separator, two single-stage cyclones are connectedin series and model equations are written accordingly.
NOMENCLATURE
a, b, c, d empirical constants in the regeneratorhydrodynamic equations
Areg cross sectional area of the regenerator, m2
Cpair heat capacity of air, kcal mol�1�C�1
Cpfv heat capacity of the oil vapour, kcal kg�1�C�1
Cpcat heat capacity of the catalyst, kcal kg�1�C�1
Cpcoke heat capacity of the coke on catalyst, kcal kg�1�C�1
Cpi specific heat of component i, kcal kg�1 K�1
darm inside diameter of the side arm of the RTD, mdb effective bubble diameter, md̄p average particle size, mdpi particle size, mmdreac internal diameter of the reactor, mdreg internal diameter of the regenerator, mdriser inside diameter of the riser, mDc cyclone barrel diameter, mEk activation energy for cracking reaction of lump k, kcal mol�1
Ek3c activation energy for the heterogeneous COcombustion reaction, 13888.55 kcal kmol�1
Ek3h activation energy for the homogeneous COcombustion reaction, 35555 kcal kmol�1
Fair;bubble flow rate of air through the bubble phase, m3 s�1
Fair;emulsion flow rate of air through the emulsion phase, m3 s�1
Fcat catalyst circulation rate, kg h�1
Fentcat entrained catalyst in regenerator cyclones, kg h�1
Fj,in inlet flow rate of component j, kg h�1
Fj,out outlet flow rate of component j, kg h�1
Fej;out outlet flow rate of component j from emulsion
phase CSTR, kg h�1
Fkj;out outlet flow rate of component j from bubble phase
CSTR k, kg h�1
Foil oil feed flow rate, kg h�1
g acceleration due to gravity, 9.81 m s�2
hriser total height of the riser, mhw height of the opening in the RTD arm, mK empirical proportionality constant for cyclone
pressure dropKbe mass transfer coefficient between emulsion and
bubble phase CSTRs, kg m�3 h�1
K1 rate constant for carbon combustion reaction toCO, cm2 kg�1 h�1
K2 rate constant for carbon combustion reaction toCO2, cm2 kg�1 h�1
K3 rate constant for CO combustion reaction toCO2, kg CO m�3 h�1(kg cm�2)�2
K3c rate constant for heterogeneous CO combustionreaction, kg CO (kg cat)�1 h�1 (kg cm�2)�2
K3c0 intrinsic rate constant for heterogeneous CO combustionreaction, 3060 kg CO (kg cat)�1 h�1 (kg cm�2)�2
K3h rate constant for homogeneous CO combustionreaction, kg CO m�3 h�1 (kg cm�2)�2
K3h0 intrinsic rate constant for homogeneous CO combustionreaction, 1.33� 1016 kg CO m�3 h�1 (kg cm�2)�2
Kd aromatic adsorption coefficient, (Wt frac of aromatics)�1
Kk0 intrinsic rate constant for cracking of component k,m3 (kg cat)�1 h�1
L loading of the entrained catalyst, kg m�3
Mfeed molecular weight of the oil feedMk
i mass transfer of component i between bubble phaseCSTR k and emulsion phase CSTR, kg h�1
Nb number of bubble phase CSTRsNs number of spirals made by the solids inside the barrelPair blower discharge pressure, psiPmixer pressure at the riser bottom, kg cm�2
550
PCO partial pressure of CO in the emulsion phase, kg cm�2
PO2partial pressure of O2 in the emulsion phase, kg cm�2
Preg pressure in the regenerator dilute phase, kg cm�2
qo volumetric flow rate of air per hole in the air grid atthe operating temperature and pressure, m3 s�1
R universal gas constant, 8.314 Pa m3 mol�1 K�1;1.987 kcal kmol�1 K�1; 82.057 atm cm3 mol�1 K�1
RCSV regenerated catalyst slide valveRe Reynolds numberSCSV spent catalyst slide valveT temperature of interest of any stream or unit, KTair temperature of air at the inlet, KTbubble,k outlet temperature of the bubble phase CSTR k, KTdelta temperature difference between emulsion and dilute
phase, KTdilute dilute phase outlet or regenerator cyclone inlet
temperature, KTe temperature of the emulsion phase CSTR, KTent temperature of the entrained catalyst, KTin riser CSTR inlet oil vapour temperature, �CTmixer temperature at the riser bottom, �CTout riser CSTR outlet oil vapour temperature, �CTref reference temperature for enthalpy calculations, 273.15 KTsc temperature of the spent catalyst, KUo superficial velocity of inlet air, m s�1
Umf minimum fluidization velocity of air, m s�1
Ub velocity of the rise of bubbles, m s�1
Ubr velocity of the rise of bubbles with respect toemulsion solids, m s�1
Vair velocity of air through jets, ft s�1
Varm velocity of the vapour-catalyst mixture in the side armof RTD, m s�1
Vkb volume of bubble phase CSTR k, m3
Vb volume occupied by the bubble phase, m3
Vc velocity of the vapour-steam mixture in cyclonebarrel, m s�1
Ve volume occupied by the emulsion phase, m3
Vexit exit velocity of the vapour-steam mixture from thecyclone, m s�1
Vin velocity of the vapour-steam mixture at the inlet of thecyclone, m s�1
Vpin actual particle velocity at inlet of the cyclone, m s�1
Vpvessel superficial velocity of the particles inside the cyclone, m s�1
Vrtd velocity of the vapour-catalyst mixture at the inlet tothe RTD, m s�1
Vvapour velocity of the vapour inside the riser, m s�1
Vvessel velocity of the vapour-steam mixture inside thecyclone, m s�1
w width of the opening in the RTD arm, mWreg catalyst loading in the regenerator bed, kgxi fraction of particles in size range ixpt relative catalytic CO combustion rateyAh mass fraction of heavy aromatic rings within the riser CSTRZbed height of the fluidized bed of catalyst, mZcyc height of the cyclone inlet from the air distributor, m
Greek symbolsd fraction of the dense bed occupied by the bubble phaseedense void fraction in the dense bedZj efficiency of split for the component jnk stoichiometric coefficient for component k, (�1)mgmix viscosity of the vapour-steam mixture, kg m�1 s�1
mair viscosity of air at the exit of air distributor, kg m�1 s�1
mv viscosity of the oil vapour at the riser bottomconditions, kg m�1 s�1
f(t) catalyst deactivation functionrair density of air at the exit of air distributor, kg m�3
rgmix mixture density of catalyst and steam, kg m�3
rdense density of the dense bed medium, kg m�3
rdil density of the dilute phase medium, kg m�3
rpart particle density of the catalyst, kg m�3
rmix mixture density of catalyst and vapour, kg m�3
rv oil vapour density at the bottom of the riser, kg m�3
t catalyst residence time within each riser CSTR, sDHT
f ;i heat of formation of component i attemperature T, kcal kg�1
DHrk heat of cracking of component k, kcal kg�1
DPad pressure drop across the distributor, psiDPri pressure drop terms inside the riser, kg cm�2
DPrtd1 pressure drop term inside the RTD, kg cm�2
DPrtd2 pressure drop term inside the RTD, kg cm�2
DPci pressure drop terms inside the cyclone, kg cm�2
References
Arandes, J.M., Azkoiti, M.J., Bilboa, J. and de Lasa, H.I., 2000, Modellingfcc units under steady and unsteady state conditions, Can J Chem Eng, 78:111–123.
Arandes, J.M. and de Lasa, H.I., 1992, Simulation and multiplicity of steadystates in fluidized FCCUs, Chem Eng Sci, 47: 2535–2540.
Arbel, A., Huang, Z., Rinard, I.H., Shinnar, R. and Sapre, A.V., 1995,Dynamic and control of fluidized catalytic crackers. l. modeling of thecurrent generation of FCCs, Ind Eng Chem Res, 34: 1128–1243.
Arthur, J.R., 1951, Reactions between carbon and oxygen, Trans FaradaySoc, 47: 164–178.
Barton, P.I. and Pantelides, C.C., 1994, The modeling of combineddiscrete=continuous processes, AIChE J, 40: 966–979.
Barton, G.W. and Perkins, J.D., 1988, Experiences with speedup in mineralprocessing industries, Chemical Engineering Research Design, 66:408–418.
Behie, L.A. and Kehoe, P., 1973, The grid region in a fluidized bed reactor,AIChE J, 19(5): 1070–1072.
Biegler, L.T., 1989, Chemical process simulation, Chem Eng Progr, Oct:50–61.
Bird, R., Stewart, W. and Lightfoot, E., 1960, Transport Phenomena (JohnWiley & Sons Inc., New York, USA).
Bogusch, R. and Marquardt, W., 1995, A formal representation of processmodel equations, Comput Chem Eng, 19(Suppl): S211–S216.
Bogusch, R. and Marquardt, W., 1997, A formal representation of processmodel equations, Comput Chem Eng, 21(10): 1105–1115.
Boston, J.F., Britt, H.I. and Tayyabkhan, M.T., 1993, Software: tacklingtougher tasks, Chem Eng Progr, Nov: 38–49.
Bozicevic, J. and Lukec, D., 1987, Dynamic mathematical model for a fluidcatalytic cracking process, Trans Inst Meas Control, 9(1): 8–12.
CPCL, 1999, FCC Operating Manual.de Lasa, H.I., Errazu, A.F., Barreiro, E. and Solioz, S., 1981, Analysis of
fluidized bed catalytic cracking regenerator models in an industrial scaleunit, Can J Chem Eng, 59: 549–553.
de Lasa, H.I. and Grace, J.R., 1979, The influence of a freeboard region in afluidized bed catalytic cracking regenerator, AIChE J, 25: 984.
Errazu, A.F., de Lasa, H.I. and Sarti, F., 1979, A fluidized bed catalyticcracking regenerator model—grid effects, Can J Chem Eng, 57: 191–197.
Ford, W.D., Reineman, R.C., Vasalos, I.A. and Fahrig, R.J., 1976, Modelingcatalytic cracking regenerators, NPRA Annual Meeting,
Gruhn, G., Rosenkranz, J., Werther, J. and Toebermann, J.C., 1997, Devel-opment of an object-oriented simulation system for complex solidsprocesses, Comput Chem Eng, 21(Suppl): S187–S192.
Guigon, P. and Large, J.F., 1984, Application of the Kunii-Levenspiel modelto a multi-stage baffled catalytic cracking regenerator, Chem Eng J, 28:131–138.
Jacob, S.M., Gross, B., Voltz, S.E. and Weekman, V.M., 1976, A lumpingand reaction scheme for catalytic cracking, AIChE J, 22(4): 701–713.
Jones, J.H., Braun, W.G., Daubert, T.E. and Allendorf, H.D., 1967, Estima-tion of pressure drop for vertical pneumatic transport of solids, AIChE J,13: 608.
Kraemer, D.W. and de Lasa, H.I., 1988, Catalytic cracking of hydrocarbonsin a riser simulator, Ind Eng Chem Res, 27(11): 2002–2008.
Kraemer, D.W., Sedran, U. and de Lasa, H.I., 1990, Catalyticcracking kinetics in a novel riser simulator, Chem Eng Sci, 45(8):2447–2452.
Krishna, A.S. and Parkin, E.S., 1985, Modeling the regenerator in commer-cial fluid catalytic cracking units, Chem Eng Prog, 81(4) 57–62.
Kumar, S., Chadha, A., Gupta, R. and Sharma, R., 1995, A process simulatorfor an integrated FCC-regenerator system, Ind Eng Chem Res, 34:3737–3748.
Kunii, D. and Levenspiel, O., 1968, Bubbling bed model for kinetic processin fluidized beds, gas-solid mass and heat transfer and catalytic reactions,Ind Eng Chem Proc Des Dev, 7(4): 481–492.
Kunii, D. and Levenspiel, O., 1990, Fluidized reactor models. l. for bubblingbeds of fine, intermediate and large particles. 2. for the lean phase: Freeboard and fast fluidization, Ind Eng Chem Res, 29: 1226–1234.
Larocca, M., Ng, S. and Lasa, H., 1990, Fast catalytic cracking of heavy gasoils: modeling coke deactivation, Ind Eng Chem Res, 29: 171–180.
551

Lee, L., Chen, Y., Huang, T. and Pan, W., 1989b, Four-lump kinetic modelfor fluid catalytic cracking process, Can J Chem Eng, 67: 615–619.
Lee, E. and Groves, F., 1985, Mathematical model of the fluidized bedcatalytic cracking plant, Trans Soc Comp Sim, 2(3): 219–236.
Lee, W. and Kugelman, A.M., 1973, Number of steady-state operating pointsand local stability of open-loop fluid catalytic cracker, Ind Eng Chemprocess Des Dev, 12(2): 197–204.
Lee, L., Yu, S., Cheng, C. and Pan, W., 1989a, Fluidized-bed catalystcracking regenerator modeling and analysis, Chem Eng J, 40: 71–82.
Lohmann, B. and Marquardt, W., 1996, On the systematization of processmodel develoment, Comput Chem Eng, 20(Suppl): S213–S218.
Marquardt, W., 1991, Dynamic process simulation — recent progress andfuture challenges, Chemical Process Control IV, 131.
Marquardt, W., 1992, An object-oriented representation of structuredprocess models, Comput Chem Eng, 16(Suppl): S329–S336.
Marquardt, W., 1994, Computer-aided generation of chemical engineeringprocess models, Int Chem Eng, 34(1): 28–46.
Marquardt, W., 1996, Trends in computer-aided process modeling, ComputChem Eng, 20(6=7): 591–609.
McFarlane, R.C., Reineman, R.C., Bartee, J.F. and Georgakis, C., 1993,Dynamic simulation for model IV FCCU, Comput Chem Eng, 17(3):275–300.
McGreavy, C. and Isles-Smith, P.C., 1986, Modeling of fluid catalyticcracker, Trans Inst Meas Control, 8(3): 130–136.
Niemeyer, P. and Knudsen, J. 2000, Learning JAVA (O’Reilly & AssociatesInc., California, USA).
Nilsson, B., 1993, Object-oriented modeling of chemical processes,Doctoral Dissertation, Lund Institute of Technology, Sweden.
Pantelides, C.C. and Barton, P.I., 1993, Equation-oriented dynamic simula-tion — current status and future perspectives, Comput Chem Eng,17(Suppl): S263–S285.
Pantelides, C.C. and Oh, M., 1996, Process modelling tools and theirapplications to particulate processes, Powder Tech, 87: 13–20.
Paraskos, J.A., Shah, Y.T., McKinney, J.D. and Carr, N.L., 1976, Akinematic model for catalytic cracking in a transfer line reactor, IndEng Chem Process Des Dev, 15(1): 165–169.
Perry, R.H. and Green, D.W. (eds) 1997, Perry’s Chemical Engineers’Handbook (McGraw-Hill, New York, USA).
Piela, P.C., Epperly, T.G., Westerberg, K.M. and Westerberg, A.W., 1991,Ascend: an object-oriented environment for modeling and analysis: themodeling language, Comput Chem Eng, 15: 53–72.
Quann, R.J. and Jaffe, S.B., 1992, Structure-oriented lumping: describingthe chemistry of complex hydrocarbon mixtures, Ind Eng Chem Res, 31:2483–2497.
Quann, R.J. and Jaffe, S.B., 1996, Building useful models of complexreaction systems in petroleum refining, Chem Eng Sci, 51(10):1615–1653.
Rowe, P.N. and Partridge, B.A., 1965, An x-ray study of bubbles in fluidizedbeds, Trans Inst Chem Eng, 43: 157.
Shah, Y.T., Huling, G.T., Paraskos, J.A. and McKinney, J.D., 1977, Akinematic model for an adiabatic transfer line catalytic cracking reactor,Ind Eng Chem Process Des Dev, 16(1): 89–94.
Smith, J.M. and Van Ness, H.C., 1987, Introduction to Chemical Engineer-ing Thermodynamics (McGraw-Hill, New York, USA).
Sriramulu, S., Sane, S., Agarwal, P.K. and Mathews, T., 1996, Mathematicalmodelling of fluidized bed combustion. 1. Combustion of carbon inbubbling beds, Fuel, 75: 1351–1362.
Stephanopoulos, G., Henning, G. and Leone, H., 1990, MODEL.LA. Alanguage for process engineering. Part I and II, Comput Chem Eng, 14:813–869.
Takatsuka, T., Sato, S., Morimoto, Y. and Hashimoto, H., 1987, A reactionmodel for fluidized-bed catalytic cracking of residual oil, Int Chem Eng,27: 107–116.
Toebermann, J.C., Rosenkranz, J., Werther, J. and Gruhn, G., 2000, Block-oriented process simulation of solids processes, Comput Chem Eng, 23:1773–1782.
Weekman, V.W. and Nace, D.M., 1970, Kinetics of catalytic crackingselectivity in fixed, moving and fluid bed reactors, AIChE J, 16: 397–404.
Weisz, P.B. and Goodwin, R.B., 1966, Combusion of carbonaceous depositswithin porous catalyst particles. II. Intrinsic burning rate, J Catal, 6:227–236.
Yang, W.C., 1973, Estimating the solid particle velocity in vertical pneumaticconveying lines, Ind Eng Chem Fund, 12(3): 349–352.
Yang, W.C., 1974, Correlations for solid friction factors in vertical andhorizontal pneumatic conveying, AIChE J, 20(3): 605–607.
ACKNOWLEDGEMENTS
The authors wish to acknowledge the support provided by Invensys IndiaPrivate Limited (IIPL), Foxboro Division, Chennai, India throughout theduration of the project. We wish to specially acknowledge and thankB. Jayaram (Manager, Advanced Applications Group) for extending his supportand cooperation in various model development activities during the project.
The manuscript was received 14 February 2003 and accepted forpublication after revision 3 September 2003.
552