recent oil market volatility dave ernsberger global head ... · s&p global platts. march 15,...
TRANSCRIPT

Recent oil market volatility
Recent trends and structural volatility in physical benchmarks
Dave Ernsberger Global Head of Energy Pricing S&P Global Platts
March 15, 2018

Interpretations of recent volatility trends: physical crude oil
2
0
10
20
30
40
50
60
70
80
02 J
an 1
502
Feb
15
02 M
ar 1
502
Apr
15
02 M
ay 1
502
Jun
15
02 J
ul 1
502
Aug
15
02 S
ep 1
502
Oct
15
02 N
ov 1
502
Dec
15
02 J
an 1
602
Feb
16
02 M
ar 1
602
Apr
16
02 M
ay 1
602
Jun
16
02 J
ul 1
602
Aug
16
02 S
ep 1
602
Oct
16
02 N
ov 1
602
Dec
16
02 J
an 1
702
Feb
17
02 M
ar 1
702
Apr
17
02 M
ay 1
702
Jun
17
02 J
ul 1
702
Aug
17
02 S
ep 1
702
Oct
17
02 N
ov 1
702
Dec
17
02 J
an 1
802
Feb
18
02 M
ar 1
8
Vola
tility
in %
Dated Brent: Volatility
Dated Brent Volatility
• Volatility does not trend, it mean reverts -- tends to get back to an equilibrium level
• Volatility inversely correlated to prices
• When crude prices go down they tend to crash a lot more quickly than when they uptrend
• Implies that when volatility starts to slow, crude likely to recover

Seasonal trends in physical crude volatility
3
0
10
20
30
40
50
60
70
80
Vola
tility
in
%
Dated Brent: Seasonal Price Volatility
2015 2016 2017 2018
• Dated Brent in 2018 experiencing the lowest volatility for several years
• 2016 a high watermark in volatility
• 2017 showed a very low degree of price fluctuation, higher market stability
More thoughts and analysis around market volatility
• CFDs have flipped between contango and backwardation
• Tepid regional demand, more sluggish buying from South Korea & China
• Volatility likely to tick higher in coming weeks
• Regular updates for free on our website
4
https://www.platts.com/videos/platts-snapshot

A robust
How data is analyzed to produce a final value
What is being assessed
How data is collected must define
Structural considerations around physical price benchmarks

Potential drivers of benchmark volatility
• Benchmark specifications – Volume deliverable against the benchmark – Logistical capacity to handle liquidity surges – Fungibility of the grade against the broader marketplace
• Availability and collection of data – Voluntary reporting of bids, offers, transactions, other spot market indications – Process used to collect data available
• Analytical process applied to the data
– Time sensitive assessment of value – Volume weighted average of transactional data
6

Example of specification evolution: Dated Brent
1976 – First oil from the Brent oilfield
1985 – Platts launches first Cash Brent assessments
1987 – Dated Brent assessed for the first
time
1990 – Brent production goes into
sharp decline 1987-2002 – 7-15 day
Brent market
2002 – Forties and Oseberg added to
form Dated BFO; 10-21 day pricing window
2007 – Buzzard oilfield enters
production
2007 – Sulfur de-escalators
introduced
2007 – Dated BFOE with introduction
of Ekofisk
2011 – Decision to widen Dated Brent,
cash BFOE to 10-25 day
2012 – Platts launches
25-day Brent
2013 – Quality Premiums introduced
on Ekofisk and Oseberg
2014 – Quality Premiums formula
updated
2015 – Full month-ahead Brent from February 2, ICE
follows with March 16
2016 – Dated Brent CIF Rotterdam
launched
2017 – Introduction of Troll to Dated BFOE, first bids and offers in
CIF R’dam MOC
0
200,000
400,000
600,000
800,000
1,000,000
1,200,000
2017 2018 2019 2020 2021 2022 2023 2024 2025
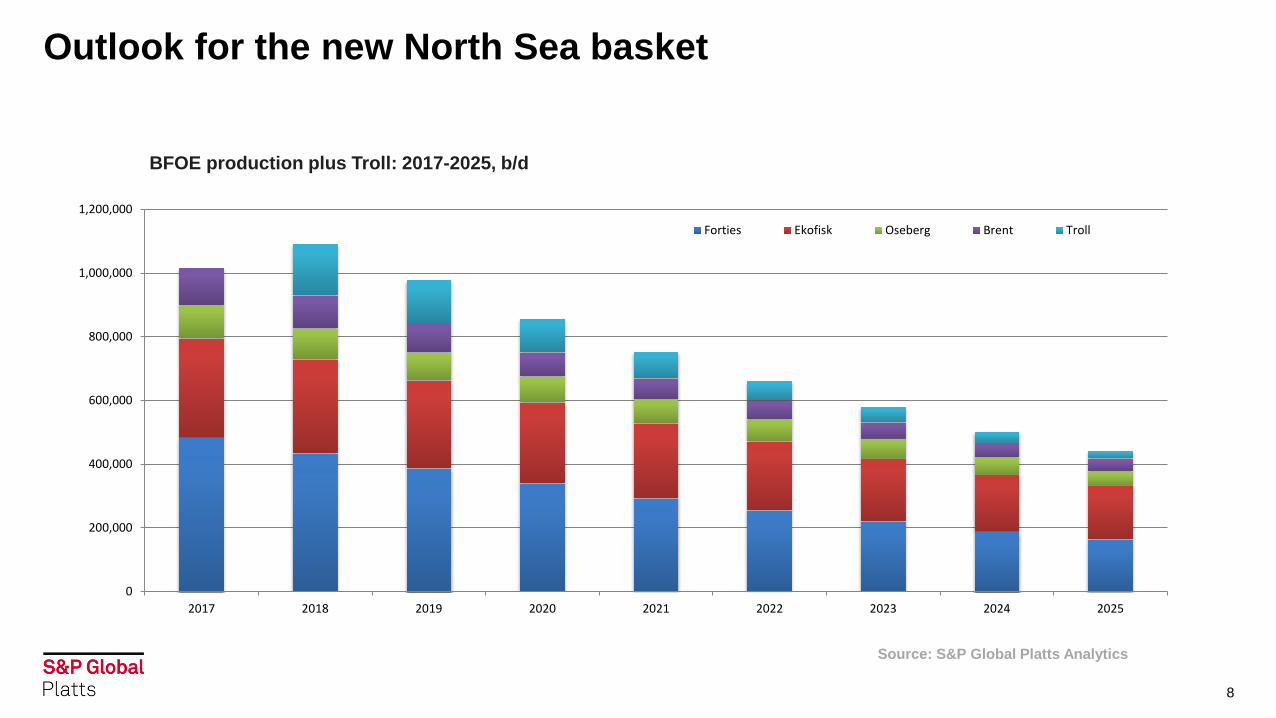
Forties Ekofisk Oseberg Brent Troll
Outlook for the new North Sea basket
8
BFOE production plus Troll: 2017-2025, b/d
Source: S&P Global Platts Analytics

An Eventful Winter: Forties Pipeline System
#PlattsLOF

Looking Ahead: Sverdrup due in 2019
• Johan Sverdrup, due to begin production in late-2019, is expected to be the single largest field in North Sea by 2022
• Production is forecast to peak above 650,000 b/d
• Differences in quality raise important considerations
10

Looking Ahead: A role for storage?
11
Source: S&P Global Platts Analytics
Tank Storage
Refineries
Cavern Storage
• Stored crude oil was a major source of local refinery supply in 2017
• Majority of European crude oil storage – both tank and cavern – is easily accessible for seaborne export
• Crude from storage, especially cavern storage, generally trades at a discount to FOB amid concerns about quality

Example of logistical evolution: FOB Singapore (FOB Straits)
12

Terminals reflected in FOB Straits

Example of fungibility evolution: Gasoline specifications
14
https://www.platts.com/subscriber-notes-details/27913267
