recent machine learning advancements in sensor-based
TRANSCRIPT

Abstract— The development of wearable sensors has opened the door for long-term assessment of movement disorders. However, there is still a need for developing methods suitable to monitor motor symptoms in and outside the clinic. The purpose of this paper was to investigate deep learning as a method for this monitoring. Deep learning recently broke records in speech and image classification, but it has not been fully investigated as a potential approach to analyze wearable sensor data.
We collected data from ten patients with idiopathic Parkinson’s disease using inertial measurement units. Several motor tasks were expert-labeled and used for classification. We specifically focused on the detection of bradykinesia. For this, we compared standard machine learning pipelines with deep learning based on convolutional neural networks. Our results showed that deep learning outperformed other state-of-the-art machine learning algorithms by at least 4.6 % in terms of classification rate. We contribute a discussion of the advantages and disadvantages of deep learning for sensor-based movement assessment and conclude that deep learning is a promising method for this field.
I. INTRODUCTION
Machine learning (ML) has been used successfully in the medical field, for example in arrhythmia classification using electrocardiogram data [1] or clinical variable regression using medical image data [2]. The advantages of ML in these and other applications are objective, data-driven, and situation-independent analysis. Specifically, ML has also been applied in the analysis of wearable inertial measurement unit (IMU) sensor data for automated assessment of movement disorders like Parkinson’s disease (PD) [3-5].
PD is one of the most common neurological movement disorders, its prevalence is up to 2% in the elderly. The cardinal motor symptoms of PD are bradykinesia, rigidity, tremor, and postural instability [6, 7]. These motor symptoms
This work was partially supported by the Michael J. Fox Foundation
(project “Wearable Sensors and a Web-Based Application to Monitor Patients with Parkinson’s Disease in the Home Environment”), by the National Institutes of Health (project “Wearable Wireless Sensors to Monitor Parkinsonian Symptoms”, #5R44AG029036-03), and by the FAU Emerging Fields Initiative (EFIMoves, 2_Med_03).
B. M. Eskofier and T. Kautz are with the Digital Sports Group, Pattern Recognition Lab, Department of Computer Science, Friedrich-Alexander University Erlangen-Nürnberg (FAU), Erlangen, Germany (corresponding author B. M. Eskofier; phone: +49 91318527297; fax: +49 91318527270; e-mail: [email protected]).
J. Klucken is with the Department of Molecular Neurology, University Hospital Erlangen, Germany.
S. I. Lee, J. F. Daneault, F. N. Golabchi, G. F. Carvalho, G. V. Diaz, S. Sapienza, G. Costante, and P. Bonato are with the Department of Physical Medicine and Rehabilitation, Harvard Medical School, Spaulding Rehabilitation Hospital, Boston, USA.
provide a major treatment target parameter. However, it is still a challenge to accurately monitor the severity of motor symptoms over time. Furthermore, low inter-rater reliability has been reported for their standardized clinical assessment [8]. Therefore, PD is an ideal model to establish, validate, and clinically apply IMU sensor-based and ML driven motor behavior approaches.
Recently, a new class of methods, deep learning [9], has gained considerable attention in the ML community. Deep learning is based on neural network theory, and makes use of multiple processing layers that learn abstract representations of the input data. Despite breaking records in image and speech recognition [10, 11], deep learning has not fully reached the IMU data analysis field. Applications exist in human activity recognition [12], but to the best of our knowledge, deep learning has so far not been applied to the field of automated movement disorder assessment. This is despite the fact that deep learning has several interesting advantages for this field: (i) it does not rely on expert-defined features, but rather on automatic extraction of features (also known as representation learning [9]), (ii) it enables the analysis of a specific task to assess a motor symptom as a whole, similar to what a medical expert does in his assessment [7], and (iii) it enables individualization of the neural network structure to a specific patient [13]. Therefore, the purpose of this paper was to explore deep learning as a method for IMU-based movement disorder assessment.
Specifically, we focus on the PD motor symptom bradykinesia and contribute a comparison of the detection accuracy of deep learning with state-of-the-art ML pipelines. These pipelines typically make use of expert-defined features and algorithms like boosting, decision trees, k-nearest neighbors, and support vector machines [14-17]. Besides the comparison with these well-established approaches, we provide a discussion of the advantages and disadvantages of deep learning for sensor-based movement disorder assessment and we also point out directions for future work.
II. METHODS
A. Data Collection Patient data was collected as part of an ongoing study on
motor fluctuations supported by the Michael J. Fox Foundation. The study was approved by the institutional review board of Spaulding Rehabilitation Hospital. Ten patients diagnosed with idiopathic PD were included (Tab. I) after giving informed consent. All patients were on levodopa therapy and reported having on/off motor fluctuations. A movement disorder specialist obtained UPDRS ratings immediately prior to subsequent IMU data recording.
Recent Machine Learning Advancements in Sensor-Based Mobility Analysis: Deep Learning for Parkinson’s Disease Assessment
Bjoern M. Eskofier, Member, IEEE, EMBS, Sunghoon I. Lee, Member, IEEE, Jean-Francois Daneault, Fatemeh N. Golabchi, Gabriela Ferreira-Carvalho, Gloria Vergara-Diaz, Stefano Sapienza, Gianluca
Costante, Jochen Klucken, Thomas Kautz, and Paolo Bonato, Senior Member, IEEE
978-1-4577-0220-4/16/$31.00 ©2016 IEEE 655
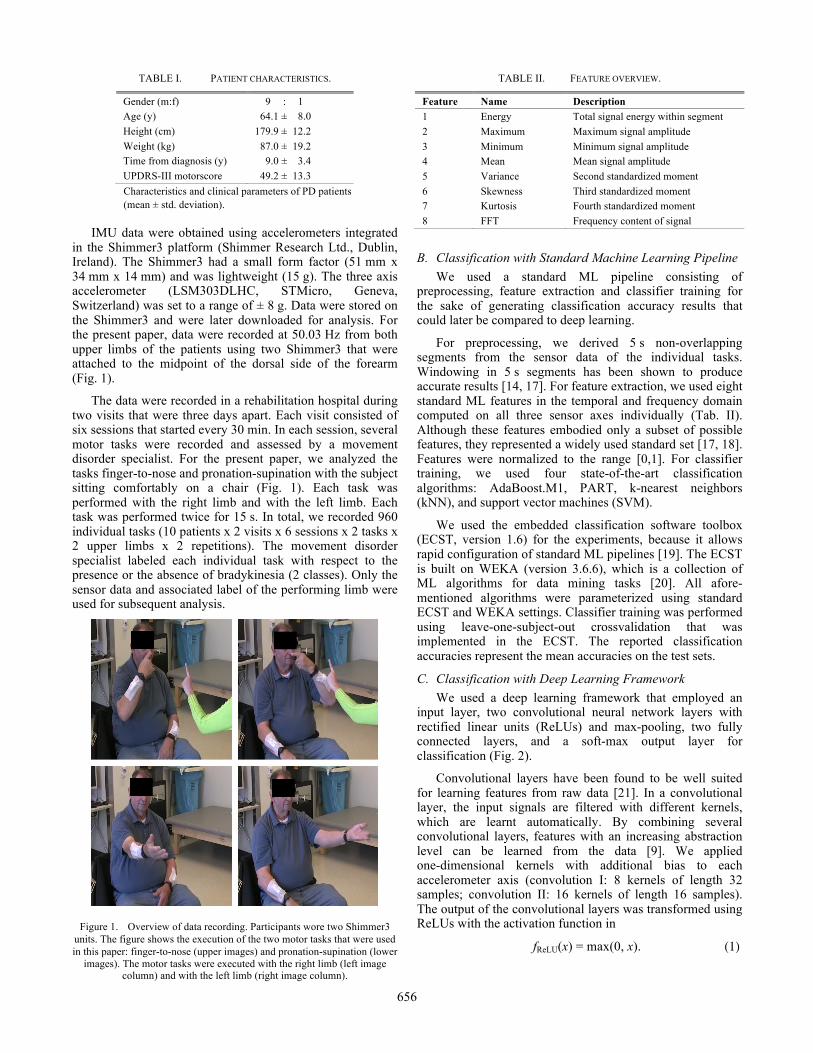
TABLE I. PATIENT CHARACTERISTICS.
Gender (m:f) 009.0 : 001 Age (y) 164.1 ±008.0 Height (cm) 179.9 ±012.2 Weight (kg) 087.0 ±019.2 Time from diagnosis (y) 009.0 ±003.4 UPDRS-III motorscore 049.2 ±013.3
Characteristics and clinical parameters of PD patients (mean ± std. deviation).
IMU data were obtained using accelerometers integrated
in the Shimmer3 platform (Shimmer Research Ltd., Dublin, Ireland). The Shimmer3 had a small form factor (51 mm x 34 mm x 14 mm) and was lightweight (15 g). The three axis accelerometer (LSM303DLHC, STMicro, Geneva, Switzerland) was set to a range of ± 8 g. Data were stored on the Shimmer3 and were later downloaded for analysis. For the present paper, data were recorded at 50.03 Hz from both upper limbs of the patients using two Shimmer3 that were attached to the midpoint of the dorsal side of the forearm (Fig. 1).
The data were recorded in a rehabilitation hospital during two visits that were three days apart. Each visit consisted of six sessions that started every 30 min. In each session, several motor tasks were recorded and assessed by a movement disorder specialist. For the present paper, we analyzed the tasks finger-to-nose and pronation-supination with the subject sitting comfortably on a chair (Fig. 1). Each task was performed with the right limb and with the left limb. Each task was performed twice for 15 s. In total, we recorded 960 individual tasks (10 patients x 2 visits x 6 sessions x 2 tasks x 2 upper limbs x 2 repetitions). The movement disorder specialist labeled each individual task with respect to the presence or the absence of bradykinesia (2 classes). Only the sensor data and associated label of the performing limb were used for subsequent analysis.
Figure 1. Overview of data recording. Participants wore two Shimmer3 units. The figure shows the execution of the two motor tasks that were used in this paper: finger-to-nose (upper images) and pronation-supination (lower
images). The motor tasks were executed with the right limb (left image column) and with the left limb (right image column).
TABLE II. FEATURE OVERVIEW.
Feature Name Description 1 Energy Total signal energy within segment 2 Maximum Maximum signal amplitude 3 Minimum Minimum signal amplitude 4 Mean Mean signal amplitude 5 Variance Second standardized moment 6 Skewness Third standardized moment 7 Kurtosis Fourth standardized moment 8 FFT Frequency content of signal
B. Classification with Standard Machine Learning Pipeline We used a standard ML pipeline consisting of
preprocessing, feature extraction and classifier training for the sake of generating classification accuracy results that could later be compared to deep learning.
For preprocessing, we derived 5 s non-overlapping segments from the sensor data of the individual tasks. Windowing in 5 s segments has been shown to produce accurate results [14, 17]. For feature extraction, we used eight standard ML features in the temporal and frequency domain computed on all three sensor axes individually (Tab. II). Although these features embodied only a subset of possible features, they represented a widely used standard set [17, 18]. Features were normalized to the range [0,1]. For classifier training, we used four state-of-the-art classification algorithms: AdaBoost.M1, PART, k-nearest neighbors (kNN), and support vector machines (SVM).
We used the embedded classification software toolbox (ECST, version 1.6) for the experiments, because it allows rapid configuration of standard ML pipelines [19]. The ECST is built on WEKA (version 3.6.6), which is a collection of ML algorithms for data mining tasks [20]. All afore- mentioned algorithms were parameterized using standard ECST and WEKA settings. Classifier training was performed using leave-one-subject-out crossvalidation that was implemented in the ECST. The reported classification accuracies represent the mean accuracies on the test sets.
C. Classification with Deep Learning Framework We used a deep learning framework that employed an
input layer, two convolutional neural network layers with rectified linear units (ReLUs) and max-pooling, two fully connected layers, and a soft-max output layer for classification (Fig. 2).
Convolutional layers have been found to be well suited for learning features from raw data [21]. In a convolutional layer, the input signals are filtered with different kernels, which are learnt automatically. By combining several convolutional layers, features with an increasing abstraction level can be learned from the data [9]. We applied one-dimensional kernels with additional bias to each accelerometer axis (convolution I: 8 kernels of length 32 samples; convolution II: 16 kernels of length 16 samples). The output of the convolutional layers was transformed using ReLUs with the activation function in
fReLU(x) = max(0, x). (1)
656

Figure 2. Overview of the deep convolutional neural network architecture. Elements in brackets are only active during training and not during testing.
By using ReLUs, the performance of deep learning systems can be improved considerably [22]. In the max-pooling step, the output of the ReLUs within a pooling window was replaced by the maximum activation. We employed overlapping pooling windows (pooling I: length 4 samples, stride 2 samples; pooling II: length 6 samples, stride 4 samples). Max-pooling layers have been found to make the features learned in the convolutional layers more robust towards variations of the position and duration of relevant signatures in the input signals [23]. Subsequent fully connected layers employed 64 ReLUs with added bias in order to find combinations of the extracted features that were suitable for the final classification step. This final step was a soft-max output layer with as many neurons as classes. A bias was added to the input of each unit. The class predicted by the network corresponded to the output unit with the highest activation.
We used Google’s TensorFlow framework (version 0.7.0) for the experiments because it allowed straightforward configuration of deep learning pipelines [24]. For network learning, we used an initial value for each weight that was drawn from a truncated normal distribution with mean 0 and standard deviation 0.1. Initial values for each bias were set to 0.1. was conducted by minimizing the cross entropy between the predicted labels and the reference labels. For the minimization, we employed Adam [25], a gradient-based optimizer for stochastic objective functions. an optimization algorithm for stochastic loss functions. The Adam algorithm was used in the configuration recommended by Kingma & Ba (learning rate 10-3, β1 = 0.9, β2 = 0.999, ε = 10-8) [25].
For network learning, mini-batches of 500 labeled tasks were randomly drawn from the training data to speed up learning. To improve the robustness and generalization abilities of the network, zero-mean additive Gaussian noise with a standard deviation of 3 m/s2 was added to the input signals. By creating new noise vectors in each learning step, repetitions in the presented input signals were avoided. During learning, connections in the fully-connected layers were randomly set to zero. This random dropout was applied in order to reduce overfitting of the network [26] was applied to the connections of the fully-connected layers. This was performed by randomly removing connections between units of these layers during learning. In each learning step, 50 % of the connections were maintained. Network learning was performed in a crossvalidation framework that was implemented in TensorFlow. During testing, no artificial noise was added to the data and no dropout was performed. The reported classification accuracy results represent the mean accuracies on the test sets.
III. RESULTS
Assessment of the class distribution showed that 576 tasks were labeled with “bradykinesia present” and 384 tasks were labeled with “bradykinesia absent”. We considered this distribution to be sufficiently balanced for all classification algorithms to work without the need of additional balancing. The classification accuracies of the individual classification algorithms are given in Tab. III.
TABLE III. CLASSIFICATION ACCURACY RESULTS.
Classifier Accuracy [%] AdaBoost.M1 86.3 PART 81.7 kNN 67.1 SVM 85.6 Deep learning 90.9
IV. DISCUSSION
The purpose of this paper was to explore the use of deep learning as a valuable method for wearable IMU-based movement disorder assessment. Although the study had limitations, we reported a classification accuracy result for deep learning that was at least 4.6 % better than any other standard ML pipeline. We conclude that deep learning is promising for the research area of IMU-based movement disorder assessment.
Limitations of the study were the non-optimized ML pipeline and the limited database. Regarding the first limitation, we specifically chose a non-optimized feature set without feature selection as well as no classifier parameter tuning in order to perform a fair comparison with deep learning. For the deep learning implementation, we also used non-optimized parameter values that were either predefined in TensorFlow or that were reported to work well in the literature. Regarding the second limitation, we are aware that all ML algorithms and especially deep learning need to rely on a sufficient database. Nevertheless, the presented first results give rise to the argument for a more in-depth analysis of deep learning based analysis of IMU-based movement disorder assessment.
657
Limitations of the deep learning method are twofold. First, the network structure that results after training is not straightforward to interpret. Although there are possibilities for interpretation [9], the interpretation of standard ML pipeline has been more broadly investigated. More work is needed in this regard for deep learning. Besides, the computational time needed for training is generally higher than for standard ML pipelines. However, this is not relevant for runtime.
Advantages of deep learning in the aforementioned context are: (i) there is no need to rely on expert-defined features [9] that may or may not represent the information content of the signal that is subjected to classification; (ii) the analysis procedure resembles what human experts do, since the whole signal segment is rated with one, continuous and clinical scale-like output [7]; (iii) an adaptation of the network to an individual patient is possible [13]; and (iv) especially deep learning based frameworks can be expected to produce better results with the growing amount of data that will become available. However, these data need high quality labels from clinical experts, which is why we repeat our call for data sharing across groups in the community [27].
Future work will target some of the shortcomings of the present study. A larger database will be generated, and the method will be individualized and optimized for other classification tasks that are relevant to PD monitoring (e.g. dyskinesia, tremor). Furthermore, we will focus on the interpretation of the learned network structure, in order to generate meaningful clinical insights from the data analysis. Lastly, these methods will be applied to data collected in the home and community settings.
In conclusion, we state that deep learning is a promising method for IMU-based movement disorder assessment. The development of wearable sensors has opened the door for long-term monitoring of patients in the home and community settings. There is a need to develop methods suitable to monitor the severity of PD symptoms in patients in and outside the clinic. We think that the recent advancement of deep learning methods in ML may make an important contribution to sensor-based motor behavior analysis.
REFERENCES [1] H. A. Guvenir, B. Acar, G. Demiroz, and A. Cekin, "A supervised
machine learning algorithm for arrhythmia analysis," in Computers in Cardiology 1997, 433-436, 1997.
[2] Y. Wang, Y. Fan, P. Bhatt, and C. Davatzikos, "High-dimensional pattern regression using machine learning: from medical images to continuous clinical variables," Neuroimage, vol. 50, 1519-1535, 2010.
[3] A. Salarian, H. Russmann, F. J. Vingerhoets, C. Dehollain, Y. Blanc, P. R. Burkhard, et al., "Gait assessment in Parkinson's disease: toward an ambulatory system for long-term monitoring," IEEE Transactions on Biomedical Engineering, vol. 51, 1434-43, Aug 2004.
[4] M. Bächlin, M. Plotnik, D. Roggen, I. Maidan, J. M. Hausdorff, N. Giladi, et al., "Wearable Assistant for Parkinson's Disease Patients With the Freezing of Gait Symptom," IEEE Transactions on Information Technology in Biomedicine, vol. 14, 436-446, 2010.
[5] C. Ahlrichs and M. Lawo, "Parkinson's Disease Motor Symptoms in Machine Learning: A Review," Health Informatics - An International Journal, vol. 2, 1-18, 2013.
[6] J. Parkinson, An Essay on the Shaking Palsy. London, U.K.: Neely & Jones, 1817.
[7] M. M. Hoehn and M. D. Yahr, "Parkinsonism: onset, progression and mortality," Neurology, vol. 17, 427-42, May 1967.
[8] M. Richards, K. Marder, L. Cote, and R. Mayeux, "Interrater reliability of the Unified Parkinson's Disease Rating Scale motor examination," Mov Disord, vol. 9, 89-91, Jan 1994.
[9] Y. LeCun, Y. Bengio, and G. Hinton, "Deep learning," Nature, vol. 521, 436-44, May 28 2015.
[10] K. He, X. Zhang, S. Ren, and J. Sun, "Delving Deep into Rectifiers: Surpassing Human-Level Performance on ImageNet Classification," preprint on arXiv:1502.01852, 2015.
[11] G. Hinton, L. Deng, D. Yu, G. E. Dahl, A. R. Mohamed, N. Jaitly, et al., "Deep Neural Networks for Acoustic Modeling in Speech Recognition: The Shared Views of Four Research Groups," IEEE Signal Processing Magazine, vol. 29, 82-97, 2012.
[12] Z. Ya-Li, D. Xiao-Rong, C. C. Y. Poon, B. P. L. Lo, Z. Heye, Z. Xiao-Lin, et al., "Unobtrusive Sensing and Wearable Devices for Health Informatics," IEEE Transactions on Biomedical Engineering, vol. 61, 1538-1554, 2014.
[13] S. Stober, A. Sternin, A. M. Owen, and J. A. Grahn, "Deep Feature Learning for EEG Recordings," preprint on arXiv:1511.04306, 2015.
[14] M. Pastorino, J. Cancela, M. T. Arredondo, M. Pansera, L. Pastor-Sanz, F. Villagra, et al., "Assessment of bradykinesia in Parkinson's disease patients through a multi-parametric system," Proceedings of the 33rd IEEE Engineering in Medicine and Biology Society Conference (EMBC), Boston, MA, USA, 1810-1813, 2011.
[15] A. Salarian, H. Russmann, C. Wider, P. R. Burkhard, F. J. G. Vingerhoets, and K. Aminian, "Quantification of Tremor and Bradykinesia in Parkinson's Disease Using a Novel Ambulatory Monitoring System," IEEE Transactions on Biomedical Engineering, vol. 54, 313-322, 2007.
[16] D. G. M. Zwartjes, T. Heida, J. P. P. v. Vugt, J. A. G. Geelen, and P. H. Veltink, "Ambulatory Monitoring of Activities and Motor Symptoms in Parkinson's Disease," IEEE Transactions on Biomedical Engineering, vol. 57, 2778-2786, 2010.
[17] S. Patel, K. Lorincz, R. Hughes, N. Huggins, J. Growdon, D. Standaert, et al., "Monitoring Motor Fluctuations in Patients With Parkinson's Disease Using Wearable Sensors," IEEE Transactions on Information Technology in Biomedicine, vol. 13, 864-873, 2009.
[18] J. Barth, J. Klucken, P. Kugler, T. Kammerer, R. Steidl, J. Winkler, et al., "Biometric and mobile gait analysis for early diagnosis and therapy monitoring in Parkinson's disease," Proceedings of the 33rd IEEE Engineering in Medicine and Biology Society Conference (EMBC), Boston, MA, USA, 868-871, 2011.
[19] M. Ring, U. Jensen, P. Kugler, and B. Eskofier, "Software-based performance and complexity analysis for the design of embedded classification systems," in Pattern Recognition (ICPR), 2012 21st International Conference on, 2266-2269, 2012.
[20] M. Hall, E. Frank, G. Holmes, B. Pfahringer, P. Reutemann, and I. H. Witten, "The WEKA data mining software: an update," SIGKDD Explor. Newsl., vol. 11, 10-18, 2009.
[21] K. Chatfield, K. Simonyan, A. Vedaldi, and A. Zisserman, "Return of the devil in the details: Delving deep into convolutional nets," preprint on arXiv:1405.3531v4, 2014.
[22] K. Jarrett, K. Kavukcuoglu, M. Ranzato, and Y. LeCun, "What is the best multi-stage architecture for object recognition?," in Computer Vision, 2009 IEEE 12th International Conference on, 2146-2153, 2009.
[23] Y. Boureau, J. Ponce, and Y. LeCun, "A theoretical analysis of feature pool- ing in visual recognition," in Proc. of the 27th International Conference on Machine Learning (ICML 2010), Haifa, Israel, 111-118, 2010.
[24] M. Abadi, A. Agarwal, P. Barham, E. Brevdo, Z. Chen, C. Citro, et al., "TensorFlow: Large-Scale Machine Learning on Heterogeneous Distributed Systems," (White Paper, November 9, 2015), 2015.
[25] D. P. Kingma and J. Ba, "Adam: A Method for Stochastic Optimization," presented at the 3rd International Conference on Learning Representations (ICLR), San Diego, USA, 2014.
[26] N. Srivastava, G. Hinton, A. Krizhevsky, I. Sutskever, and R. Salakhutdinov, "Dropout: a simple way to prevent neural networks from overfitting," J. Mach. Learn. Res., vol. 15, 1929-1958, 2014.
[27] C. F. Pasluosta, H. Gassner, J. Winkler, J. Klucken, and B. M. Eskofier, "An Emerging Era in the Management of Parkinson's Disease: Wearable Technologies and the Internet of Things," IEEE Journal of Biomedical and Health Informatics, vol. 19, 1873-81, Nov 2015.
658