recent advancements in the electro-mechanical (e/m
TRANSCRIPT

1
Recent Advancements in the Electro-Mechanical (E/M) ImpedanceMethod for Structural Health Monitoring and NDE
Victor Giurgiutiu and Craig A. Rogers
Department of Mechanical Engineering, University of South CarolinaColumbia, SC, 29212, USA, 803-777-8018, [email protected]
ABSTRACT
The emerging electro-mechanical impedance technology has high potential for in-situ health monitoring and NDE ofstructural systems and complex machinery. At first, the fundamental principles of the electro-mechanical impedance methodare briefly reviewed and ways for practical implementation are highlighted. The equations of piezo-electric material responseare given, and the coupled electro-mechanical impedance of a piezo-electric wafer transducer as affixed to the monitoredstructure is discussed. Due to the high frequency operation of this NDE method, wave propagation phenomena are identifiedas the primary coupling method between the structural substrate and the piezo-electric wafer transducer. Attention is thenfocused on several recent advancements that have extended the electro-mechanical impedance method into new areas ofapplications and/or have developed its underlying principles. US Army Construction Engineering Research Laboratory usedthe electro-mechanical impedance method to monitor damage development in composite overlaid civil infrastructurespecimens under full-scale static testing. A simplified E/M impedance measuring technique was employed at the PolytechnicUniversity of Madrid, Spain, to detect damage in GFRP composite specimens. The development of miniaturized "bare-bones" impedance analyzer equipment that could be easily packaged into transponder-size dimensions is being studied at theUniversity of South Carolina. US Army Research Laboratory developed novel piezo-composite film transducers forembedment into composite structures. Disbond gauges for monitoring the structural joints of adhesively bonded rotor bladeshave been studies in the Mechanical Engineering Department at the University of South Carolina.
These recent developments accentuate the importance and benefits of using the electro-mechanical impedance method for on-line health monitoring and damage detection in a variety of applications. Further investigation of the electro-mechanicalimpedance method is warranted. A further examination of the complex interaction between wave propagation, drive-pointimpedance, structural damage and electro-mechanical impedance of the piezo-electric wafer transducer is needed. Once theseaspects are better understood, the E/M impedance method has the potential to become a widely used NDE technique withlarge applicability in diverse engineering fields (aerospace, automotive, infrastructure and biomedical implants).
Key Words: Damage detection; Health monitoring; Failure prevention; Electro-mechanical impedance; NDE; Non-destructive evaluation; Incipient damage; Piezo-electric transducer; Crack propagation; Crack detection..
INTRODUCTION
Structural health monitoring and machinery failure prevention form a complex activity that requires the interaction of severalconcurrent factors. Critical among them is the ability to detect the apparition and propagation of structural damage at anincipient stage. The detection of damage (e.g., cracks, delaminations, disbonds, etc.) is crucial in any failure preventiontechnology. If damage could be detected at an early stage, corrective measures can be taken and catastrophic failure can beprevented. Moreover, a structure with incipient damage can be quickly repaired, and put back in service. By substitutingtimely repairs for costly replacements, important lifecycle cost savings can be achieved. A reliable procedure for earlydamage detection will reduce the design uncertainties, will increase designer confidence, and will result in lower reservefactors, smaller weight, and reduced initial cost. The development of damage detection technologies plays a major role in theoverall process of machinery failure prevention and lifecycle cost reduction.
Paper # 3329-53 at the SPIE’s 5th Annual International Symposium on Smart Structures and Materials, 1-5 March 1998, Catamaran Resort Hotel, CA,

2
However, early damage detection is not easily achieved. The principal impediment in achieving early detection of incipientdamage lies in the very nature of this type of damage. Incipient damage is a small scale phenomenon. Incipient damage canpropagate inside a machinery part without producing detectable changes in its operational parameters. Global detectionmethods, as those based on vibration modeshapes and frequency characteristics, are insensitive to incipient local damage. Acrack initiating at a critical location in a complex structure can be fatal for its operation, but may produce undetectablechanges in the overall structural frequency. For this reasons, failure detection methods are still needed for the detection ofincipient damage in vital structural areas. Two approaches are possible: either subject the structure periodically to minute in-depth inspection; or implement an automatic system for continuous health monitoring. The two approaches differ in the waythey are applied and in the technologies they use. During periodic inspection, a complex machinery is disassembled and itsvital parts are subjected to meticulous scanning in search of incipient damage. This is a time-consuming and labor-intensiveactivity. In contrast, automatic health monitoring performs continuous surveillance of the machinery, with special emphasison the critical areas. For rapid evaluation of incipient damage, a scalar damage index and a danger threshold are used. AGreen-Yellow-Red structural health indicator displays the state of the structure health and warn if incipient damage isdetected. At present, only the first approach is widely used: periodic inspections are done on most complex machinery,ranging from airplanes, helicopters and their engines, to nuclear power plants and Navy ships. However, periodic inspectionsare very costly and time consuming, demands that the machinery is taken out of service for a considerable period of time, andis not foolproof against failures between inspection intervals. The current trend in machinery maintenance is to substitute the"fixed-term" replacement policy with an "as-needed" replacement policy. This trend is driven by cost reduction and makesperfect economic sense. However, it puts additional burden on the periodic inspection procedures. In contrast, continuoushealth monitoring concepts raise the prospect of early detection and timely intervention. Continuous health monitoring is inperfect accord with the as-needed replacement policy and can lead to very significant cost saving opportunities. Bothapproaches, periodic inspection and continuous health monitoring, depend on the availability of enabling technologies (ASMHandbook, Vol. 17, 1992). Figure 1 present a list of such enabling technologies. On the left -- passive and active scanningmethods for periodic inspection. On the left, in-situ sensors array technologies that could enable continuous healthmonitoring. The in-situ sensors array methods, and their accompanying technologies, are of paramount importance for thesuccessful implementation of on-line health monitoring and failure prevention.
Passive and Active Scanning1. Ultrasonic probing2. Eddy currents3. Liquid penetrant4. Thermography and Vibro-thermography5. Magnetic particles and Magnaflux6. Computer tomography7. Laser ultrasound8. Low power impulse radar
In-situ Sensor Arrays1. Vibration monitoring2. Strain monitoring (electrical and fiber optics)3. Peak-strain indicators4. Acoustic emission5. Dielectric response6. Elastic Wave emitter-detector pairs7. Electro-mechanical impedance
Damage Detection Technologies
Figure 1 Overview of damage detection technologies
Vibration sensors (accelerometers and velocity transducers), have been used for a long time to monitor the vibration levelsand frequency spectra at critical locations. In this method, the presence of incipient damage may be inferred from changes inthe vibration signature. This method is effective in situations where a dominant harmonics is present in the normal operation(e.g., related to the basic rotation speed of a turbine or electric motor). Then, the appearance of new harmonics indicate that achange in the structural health has taken place. However, vibration monitoring methods are almost meaningless when nodominant normal-operation harmonic is present. Strain monitoring sensors (e.g., resistance strain gauges or fiber opticsensors) may be used as an alternative way of recording vibrations. Strain sensors may also be used to measure actual strainsin the structure, but inference of damage information from structural strain values is not straightforward. The peak-strain atcritical locations can be recorded with the TRIP technology peak-strain indicators recently developed by Thbompson andWestermo (1994) of Strain Monitoring Systems, Inc. Acoustic emission (AE) sensors are another example of passivetechnology. AE sensors pick-up the minute “pops” generated in a structure as a crack is tearing its way through the structuralmaterial. Dielectric sensors are capable of passively detecting the structural changes taking place in a polymeric compositedue to insufficient cure, or damage, or moisture absorption. The advent of active materials capable of deforming their shapeand dimensions in response to electric, magnetic, and thermal fields has opened new options and opportunities in the field of
3
sensor technologies for nondestructive evaluation (NDE) and health monitoring. It is now possible to advance from passivesensors (e.g., vibration pick-up, acoustic detection microphones, etc.) to active devices that can simultaneously interrogatethe structure and listen to its response. Emitter-detector pairs of piezoelectric transducers have been used to send ultrasonicwaves through the material and detect the incipient damage using wave signature (Keilers and Chang, 1994). Alternatively,changes in the point-wise structural impedance can be detected and recorded by an array of piezoelectric wafer transducers(Rogers and Giurgiutiu, 1997). In the latter case, the processing of the electro-mechanical impedance spectrum determined bythe transducers is used to identify if incipient damage has occurred (Giurgiutiu and Rogers, 1997). These emerging newtechnologies have the potential of identifying incipient damage well before it starts to affect the normal and safe operation ofthe structural system and/or machinery.
ELECTROMECHANICAL (E/M) IMPEDANCE TECHNIQUE
The electro-mechanical (E/M) impedance technique utilizes the direct and the converse electro-mechanical properties ofpiezoelectric materials, allowing for the simultaneous actuation and sensing of the structural response (Rogers andGiurgiutiu, 1997). The variation of the electro-mechanical impedance of piezo-electric sensor-actuators (wafer transducers)intimately bonded to the structure is monitored over a large frequency spectrum in the high kHz frequency band. Theirfrequency response reflects the state of structural integrity.
(a)
Signalmultiplexer
Health-monitoredstructure instrumentedwith wafer transducers
Data-acquisitionand processing
computer
HP 4194AImpedanceAnalyzer
(b)
Automatic Monitoring Mode1. Scan and interrogate PZT
transducers2. Update impedance signature
for each transducer3. Evaluate damage index for
each transducer and compare4. Use artificial intelligence to
process all data and issuehealth diagnosis report
5. Signal alert diagnosticsthrough teletransmission
System Calibration Mode1. Measure impedance of
"healthy" reference structure2. Measure impedance of
"damaged" reference structure3. Calculate damage index and
its variation range4. Evaluate damage detection
thresholds.5. Initialize artificial intelligence
data-base.
System Initialization andMode Selection
s
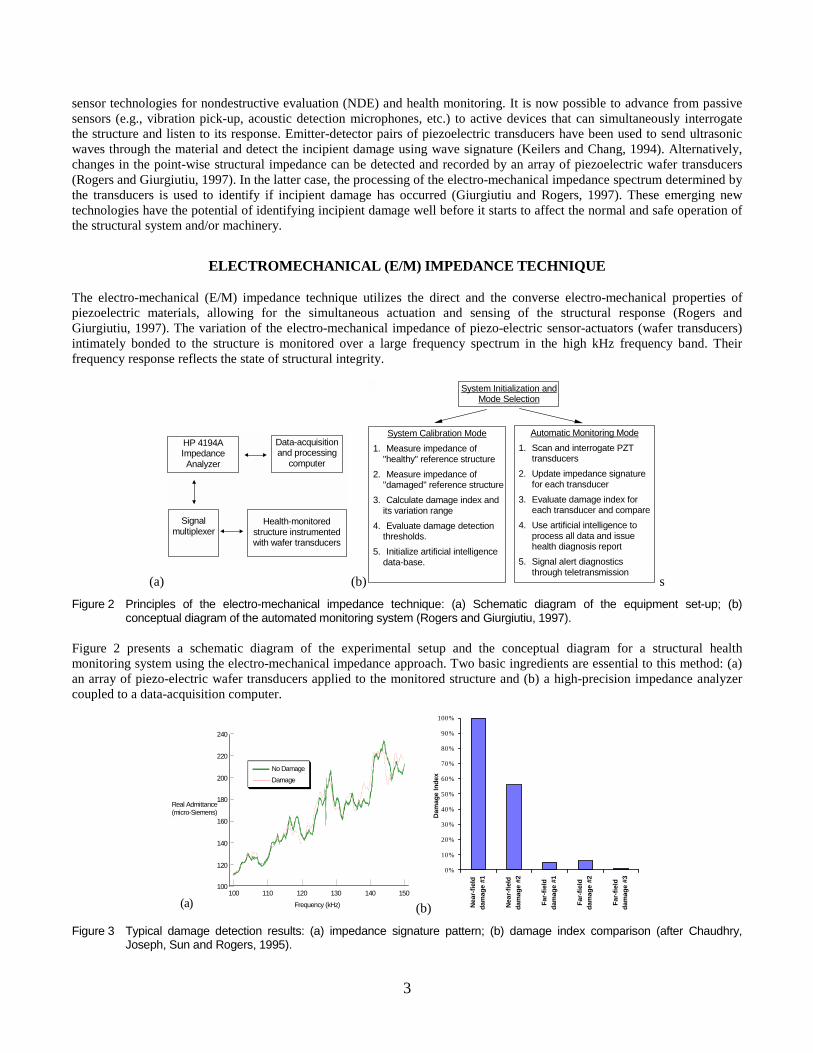
Figure 2 Principles of the electro-mechanical impedance technique: (a) Schematic diagram of the equipment set-up; (b)conceptual diagram of the automated monitoring system (Rogers and Giurgiutiu, 1997).
Figure 2 presents a schematic diagram of the experimental setup and the conceptual diagram for a structural healthmonitoring system using the electro-mechanical impedance approach. Two basic ingredients are essential to this method: (a)an array of piezo-electric wafer transducers applied to the monitored structure and (b) a high-precision impedance analyzercoupled to a data-acquisition computer.
Frequency (kHz)100 110 120 130 140 150
100
120
140
160
180
200
220
240
Real Admittance(micro-Siemens)
No DamageDamage
(a) (b)
0%
10%
20%
30%
40%
50%
60%
70%
80%
90%
100%
Nea
r-fie
ldda
mag
e #1
Nea
r-fie
ldda
mag
e #2
Far-
field
dam
age
#1
Far-
field
dam
age
#2
Far-
field
dam
age
#3
Dam
age
Inde
x
Figure 3 Typical damage detection results: (a) impedance signature pattern; (b) damage index comparison (after Chaudhry,Joseph, Sun and Rogers, 1995).

4
The size of the wafer transducers is typically small (less than 0.5 sq. in., 0.01 in. thick), allowing for non-intrusive installationin the monitored structure. The small dimensions and wafer-like appearance of these transducers make them ideal forapplication to civil engineering structures. Figure 3a shows the frequency response diagrams obtained during a typicallaboratory demonstration of the electromechanical impedance technique. Figure 3b presents a typical damage index diagramthat distinguishes between damaged and undamaged locations during the health-monitoring process. The high resolution ofthis incipient damage detection technique is ensured through the intimate electro-mechanical coupling between the electricalimpedance response of the piezo-electric sensor-actuator (E/M transducer) affixed to the structure and the local mechanicalimpedance of the adjacent material present in the structure and in the structural joints. Localization of the sensing areaensures sensitivity of the impedance signature only to damage and/or structural changes in the near-field of the E/Mtransducer. The method has good rejection of the unwanted far-field information and is prevented from giving “false alarms”in response to changes due to normal structural usage (boundary conditions, mass distribution, service loads, etc.). Theelectro-mechanical impedance technique utilizes well-developed equipment that is currently available for high-frequencyaccurate measurements of electronic and electro-chemical impedance (Mansfeld, 1993). This aspect is a significant advantagefor quickly bringing this new NDE technique to widespread practical implementation.
PHYSICAL MECHANISM OF THE ELECTRO-MECHANICAL IMPEDANCE TECHNIQUE
The electro-mechanical impedance technique relies on two main physical principles (Rogers and Giurgiutiu, 1997; Giurgiutiuand Rogers, 1997): (a) the piezo-electric coupling between mechanical and electrical fields inside the wafer transducer; and(b) the elastic wave propagation of the interrogation signal into the structure.
Piezo-electric transducersThe general constitutive equations of linear piezo-electric materials, given by ANSI/IEEE Standard 176-1987, describe atensorial relation between mechanical and electrical variables (mechanical strain ijS , mechanical stress klT , electrical field
kE , and electrical displacement jD ) in the form:
, kTjkkljklj
kkijklEijklij
ETdD
EdTsS
ε+=
+=(1.)
where s is the mechanical compliance of the material measured at zero electric field (E = 0), Tjkε is the dielectric permittivity
measured at zero mechanical stress (T = 0), and jkld is the piezo-electric coupling between the electrical and mechanicalvariables. The second equation reflects the direct piezo-electric effect, while the first equation refers to the converse piezo-electric effect. The piezo-electric transducers used in the electro-mechanical impedance technique are thin piezo-ceramic(PZT) wafers intimately bonded to the host structure. In this configuration, mechanical stress and strain are applied in the 1and 2 directions, i.e. in the plane of the surface, while the electric field acts in the 3 direction, i.e., normal to the surface.Hence, the significant electro-mechanical couplings for this type of analysis are the 31 and 32 effects. The application of anelectric field, E3, induces surface strains, S11 and S22, and vice-versa. For a PZT transducer affixed to 1-D member, e.g., abeam along the 1-direction, the analysis is mainly one-dimensional. In this case, the dominant electro-mechanical couplingconstant is d31. If the transducer is placed on a 2-D the surface, the analysis is, in principle, two-dimensional. Since thecoupling constants, d31 and d32, have essentially same value, radial symmetry can be applied, and the analysis becomes one-dimensional in the radial coordinate, r.
Drive-Point Impedance
The effect of a piezo-electric transducer bonded to the structure surface is to apply a local strain parallel to the surface thatcreates elastic waves in the structure. The structure presents to the transducer the drive-point impedance,
ωωωωωω /)()()()( eeestr ikcmiZ −+= . Through the mechanical coupling between the PZT transducer and the hoststructure, on one side, and through the electro-mechanical transduction inside the PZT transducer, on the other side, thedrive-point structural impedance gets directly reflected in the effective electrical impedance as seen at the transducerterminals (Figure 4).

5
v t V t( ) sin( )= ω PZT wafertransducer
ce(ω)
F(t) ke(ω)
me(ω)
�( )u t i t I t( ) sin( )= +ω φ
Figure 4 Electro-mechanical coupling between the PZT transducer and the structure.
The electro-mechanical impedance technique for health monitoring and NDE utilizes the changes that take place in the drive-point structural impedance to identify incipient damage in the structure. The change in the drive-point impedance is sensedelectrically through changes in the apparent electro-mechanical impedance of the piezo-electric transducer. The apparentelectro-mechanical impedance of the piezo-transducer as coupled to the host structure is given by
1231 )()(
)()(
−�
���
����
���
−
ωωωκωω
strPZT
str
Z+ZZ1 Ci=Z , (2.)
where )(ωZ is the equivalent electro-mechanical admittance as seen at the PZT transducer terminals, C is the zero-loadcapacitance of the PZT transducer, κ31 is the electro-mechanical cross coupling coefficient of the PZT transducer( 33111331 / εκ sd= ), Zstr is the impedance of the structure, and ZPZT is the impedance of the PZT transducer. The electro-mechanical impedance method is applied by scanning a predetermined frequency range in the hundreds of kHz band andrecording the complex impedance spectrum. By comparing the impedance spectra taken at various times during the servicelife of a structure, meaningful information can be extracted pertinent to structural degradation and the appearance of incipientdamage. It must be noted that the frequency range must be high enough for the signal wavelength to be significantly smallerthan the defect size.
A qualitative estimation of the structural health can be rapidly achieved through the damage index. The damage index is ascalar quantity that serves as a metric of the damage that is taking place in the structure. A convenient damage index can bebased on the Euclidean norm, i.e.,
[ ][ ]
−=
Ni
Nii
Z
ZZDI 20
20
)Re(
)Re()Re(, (3.)
where N is the number of sample points in the spectrum, and the superscript 0 signifies the initial (base-line) state of thestructure.
RECENT ADVANCEMENTS IN THE ELECTRO-MECHANICAL IMPEDANCE TECHNIQUE
Damage Detection of Composite Overlay Repair, Upgrade, and Rehabilitation of Civil InfrastructureQuattrone, Berman, and Kamphaus (1998), at the US Army Construction Engineering Research Laboratory, reported the useof the electro-mechanical impedance method to monitor crack initiation during static testing of masonry wall specimensreinforced with composite overlays. The specimens had dimensions 4-ft by 4-ft and were build from standard concretemasonry units. A face-shell bedding of type N mortar mix was applied on the wall face. The masonry wall were strengthenedwith overlays of fiber reinforced polymeric (FRP) composite sheets applied on one face. The FRP composite overlays weregenerally thin (approximately 1/8-in), but were able to provide up to 94% increase in the wall load-carrying capacity. Severaltests were performed with different composite-overlay fabrication solutions. One fabrication solution was to have thecomposite overlay cured separately in the form of rigid sheets. These were applied on the masonry walls using contactpressure and room temperature adhesive. The other fabrication solution was to apply the composite overlay as a wet lay-updirectly on the wall. In this situation, the polymeric resin acted a double role: it served as matrix for the composite fibers inthe overlay, and as adhesive for the joint between the composite overlay and the wall.
6
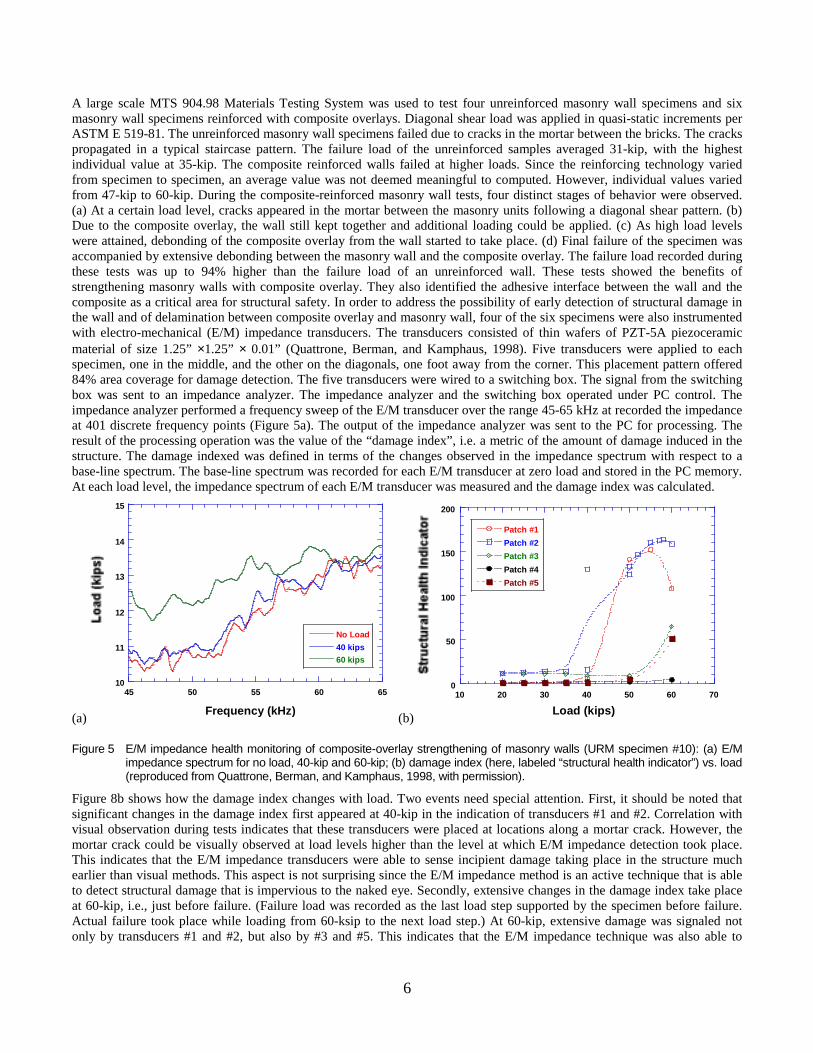
A large scale MTS 904.98 Materials Testing System was used to test four unreinforced masonry wall specimens and sixmasonry wall specimens reinforced with composite overlays. Diagonal shear load was applied in quasi-static increments perASTM E 519-81. The unreinforced masonry wall specimens failed due to cracks in the mortar between the bricks. The crackspropagated in a typical staircase pattern. The failure load of the unreinforced samples averaged 31-kip, with the highestindividual value at 35-kip. The composite reinforced walls failed at higher loads. Since the reinforcing technology variedfrom specimen to specimen, an average value was not deemed meaningful to computed. However, individual values variedfrom 47-kip to 60-kip. During the composite-reinforced masonry wall tests, four distinct stages of behavior were observed.(a) At a certain load level, cracks appeared in the mortar between the masonry units following a diagonal shear pattern. (b)Due to the composite overlay, the wall still kept together and additional loading could be applied. (c) As high load levelswere attained, debonding of the composite overlay from the wall started to take place. (d) Final failure of the specimen wasaccompanied by extensive debonding between the masonry wall and the composite overlay. The failure load recorded duringthese tests was up to 94% higher than the failure load of an unreinforced wall. These tests showed the benefits ofstrengthening masonry walls with composite overlay. They also identified the adhesive interface between the wall and thecomposite as a critical area for structural safety. In order to address the possibility of early detection of structural damage inthe wall and of delamination between composite overlay and masonry wall, four of the six specimens were also instrumentedwith electro-mechanical (E/M) impedance transducers. The transducers consisted of thin wafers of PZT-5A piezoceramicmaterial of size 1.25” ×1.25” × 0.01” (Quattrone, Berman, and Kamphaus, 1998). Five transducers were applied to eachspecimen, one in the middle, and the other on the diagonals, one foot away from the corner. This placement pattern offered84% area coverage for damage detection. The five transducers were wired to a switching box. The signal from the switchingbox was sent to an impedance analyzer. The impedance analyzer and the switching box operated under PC control. Theimpedance analyzer performed a frequency sweep of the E/M transducer over the range 45-65 kHz at recorded the impedanceat 401 discrete frequency points (Figure 5a). The output of the impedance analyzer was sent to the PC for processing. Theresult of the processing operation was the value of the “damage index”, i.e. a metric of the amount of damage induced in thestructure. The damage indexed was defined in terms of the changes observed in the impedance spectrum with respect to abase-line spectrum. The base-line spectrum was recorded for each E/M transducer at zero load and stored in the PC memory.At each load level, the impedance spectrum of each E/M transducer was measured and the damage index was calculated.
(a)
10
11
12
13
14
15
45 50 55 60 65
No Load40 kips60 kips
Frequency (kHz) (b)
0
50
100
150
200
10 20 30 40 50 60 70
Patch #1Patch #2Patch #3Patch #4Patch #5
Load (kips)
Figure 5 E/M impedance health monitoring of composite-overlay strengthening of masonry walls (URM specimen #10): (a) E/Mimpedance spectrum for no load, 40-kip and 60-kip; (b) damage index (here, labeled “structural health indicator”) vs. load(reproduced from Quattrone, Berman, and Kamphaus, 1998, with permission).
Figure 8b shows how the damage index changes with load. Two events need special attention. First, it should be noted thatsignificant changes in the damage index first appeared at 40-kip in the indication of transducers #1 and #2. Correlation withvisual observation during tests indicates that these transducers were placed at locations along a mortar crack. However, themortar crack could be visually observed at load levels higher than the level at which E/M impedance detection took place.This indicates that the E/M impedance transducers were able to sense incipient damage taking place in the structure muchearlier than visual methods. This aspect is not surprising since the E/M impedance method is an active technique that is ableto detect structural damage that is impervious to the naked eye. Secondly, extensive changes in the damage index take placeat 60-kip, i.e., just before failure. (Failure load was recorded as the last load step supported by the specimen before failure.Actual failure took place while loading from 60-ksip to the next load step.) At 60-kip, extensive damage was signaled notonly by transducers #1 and #2, but also by #3 and #5. This indicates that the E/M impedance technique was also able to
7
detect wide-area damage and to predict failure of the structure.
Simplified Impedance Measurements Using an RC BridgePardo de Vera and Guemes (1997), at the Polytechnic University of Madrid, Spain, employed the electromechanical (E/M)impedance technique to detect damage in a GFRP composite specimen using a simplified impedance measuring method. Thesimplified impedance-measuring method consisted in the use of an inexpensive laboratory-made RC-bridge instead of thecostly HP4194A impedance analyzer (Figure 9a).
(a)
R2
CR1
B
A
PZT Wafer Transducer
STRUCTURE
CPZT
Actuatorsignal
generator
Sensorsignal
pick-up
(b)
115 mm
PZT
30 mm
35 mm Simulated defect(3, 4, 6 mm hole)
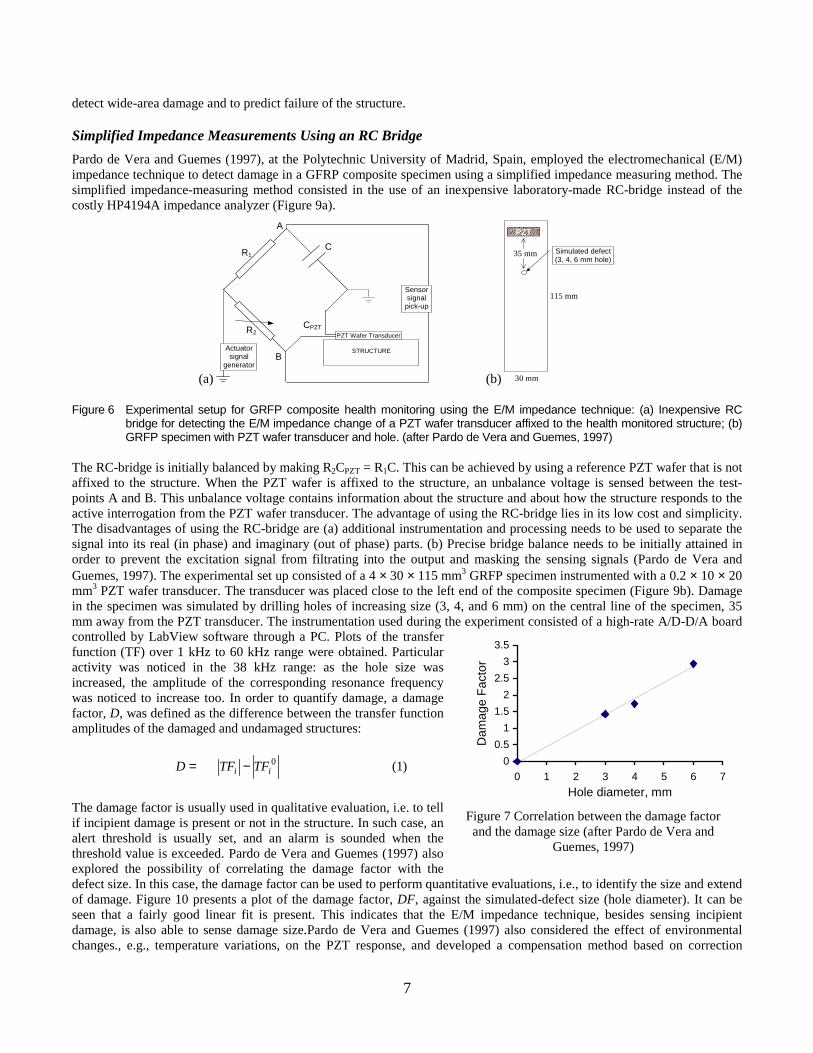
Figure 6 Experimental setup for GRFP composite health monitoring using the E/M impedance technique: (a) Inexpensive RCbridge for detecting the E/M impedance change of a PZT wafer transducer affixed to the health monitored structure; (b)GRFP specimen with PZT wafer transducer and hole. (after Pardo de Vera and Guemes, 1997)
The RC-bridge is initially balanced by making R2CPZT = R1C. This can be achieved by using a reference PZT wafer that is notaffixed to the structure. When the PZT wafer is affixed to the structure, an unbalance voltage is sensed between the test-points A and B. This unbalance voltage contains information about the structure and about how the structure responds to theactive interrogation from the PZT wafer transducer. The advantage of using the RC-bridge lies in its low cost and simplicity.The disadvantages of using the RC-bridge are (a) additional instrumentation and processing needs to be used to separate thesignal into its real (in phase) and imaginary (out of phase) parts. (b) Precise bridge balance needs to be initially attained inorder to prevent the excitation signal from filtrating into the output and masking the sensing signals (Pardo de Vera andGuemes, 1997). The experimental set up consisted of a 4 × 30 × 115 mm3 GRFP specimen instrumented with a 0.2 × 10 × 20mm3 PZT wafer transducer. The transducer was placed close to the left end of the composite specimen (Figure 9b). Damagein the specimen was simulated by drilling holes of increasing size (3, 4, and 6 mm) on the central line of the specimen, 35mm away from the PZT transducer. The instrumentation used during the experiment consisted of a high-rate A/D-D/A boardcontrolled by LabView software through a PC. Plots of the transferfunction (TF) over 1 kHz to 60 kHz range were obtained. Particularactivity was noticed in the 38 kHz range: as the hole size wasincreased, the amplitude of the corresponding resonance frequencywas noticed to increase too. In order to quantify damage, a damagefactor, D, was defined as the difference between the transfer functionamplitudes of the damaged and undamaged structures:
−= 0ii TFTFD (1)
The damage factor is usually used in qualitative evaluation, i.e. to tellif incipient damage is present or not in the structure. In such case, analert threshold is usually set, and an alarm is sounded when thethreshold value is exceeded. Pardo de Vera and Guemes (1997) alsoexplored the possibility of correlating the damage factor with thedefect size. In this case, the damage factor can be used to perform quantitative evaluations, i.e., to identify the size and extendof damage. Figure 10 presents a plot of the damage factor, DF, against the simulated-defect size (hole diameter). It can beseen that a fairly good linear fit is present. This indicates that the E/M impedance technique, besides sensing incipientdamage, is also able to sense damage size.Pardo de Vera and Guemes (1997) also considered the effect of environmentalchanges., e.g., temperature variations, on the PZT response, and developed a compensation method based on correction
00.5
11.5
22.5
33.5
0 1 2 3 4 5 6 7Hole diameter, mm
Dam
age
Fact
or
Figure 7 Correlation between the damage factorand the damage size (after Pardo de Vera and
Guemes, 1997)

8
coefficients. In their study, a temperature range from 340C to 470C was considered. Increments of 10C were considered. Inline with previous observations by Sun, Chaudhry Rogers et al. (1995), a shift of the frequency peaks with temperature wasnoticed. Using dimensional analysis, a temperature scale factor was developed of the form:
�
��
�
�= 2 Geom
LE
LVdf
VV PZTA
A
S ,...,,, 225
4231
ρρ
ρωρωε
(2)
where VA and VS are the actuation and sensing voltage amplitudes, ε is the electric permittivity of the PZT, d31 is the cross-axis induced-strain coefficient, L is a length scale,ω is the excitation angular frequency, while E,EPZT and ρ, ρPZT are the Young’s modulus anddensity of the substrate and PZT, respectively.The variable Geom signifies a generic variabledescribing the geometrical features of the setup.Using certain simplifying assumptions, Pardo deVera and Guemes (1997) proposed the correctionlaw:
Tba ∆���
� −−=2
10ω
ω (3)
where ω0 and ω are the original and the currentfrequency values of the response peaks, ∆T is thetemperature increment, and sa and b are thetemperature variation coefficients of d31 and ε,respectively. Figure 11 presents a plot of theexperimental frequency ratios vs. temperatureincrement. A fairly good linear variation can be inferred from this graph. Thus, experimentally determined temperature-correction factors could be determined. Pardo de Vera and Guemes (1997) used these temperature-correction factors tosuccessfully compensate for temperature changes in their experiment.
Piezo-Composite Film Transducers Embedded in Layered CompositesBlanas et al. (1997), at the US Army Research Laboratory, reported the development of very thin piezoelectric-compositewafer transducers that can be incorporated into composite plates. The piezoelectric composite consists of piezoelectric fillerceramics into a polymeric matrix material. Calcium modified lead titanite (PTCa) piezoelectric ceramic powders of 10-30 µmgrain size were used as fillers. Polar copolymers (P(VDF-TrFE)) and non-polar epoxy resin were the two alternative matrixmaterials used in the study. After the piezoelectric filler was intimately mixed with the matrix, a hot press method was usedto produce thin films of 100-150 µm thickness. Aluminum electrodes (1000 Å = 0.1 µm thick) were vacuum deposited onboth sides of the transducers. The films were poled at up to 25 kV/mm across the thickness in a silicon bath. The films werepoled at 800C/1000C, respectively, and then allowed to cool in the field.
The resulting piezo-composite films were found to have both 0-3 and 1-3 connectivity, where the first number refers to thepiezoceramic granules and the second term refers to the polymeric matrix. When the piezo-ceramic loading is sufficientlyhigh, 1-3 connectivity could be observed in thin piezo-composite films, with the thickness dimension of same order ofmagnitude as the grain size. Since the piezo-composites developed by Blanas et al. (1997) presented both 0-3 and 1-3connectivity, their connectivity was termed “mixed connectivity”.
The 3-direction poled piezo-composite films are expected to present both 33 and 31/32 piezoelectricity. This means that theywould electrically respond to direct strains applied normal to the mid-plane (33 effect) as well as in the mid-plane (31 and 32effects). Blanas et al. (1997) used the monomorh piezo-polymeric films to fabricate bimorph elements that, through theappropriate wiring option (either series or parallel), could be made to respond to either axial or bending deformation.Monomorph and bimorph piezo-composite films were embedded in S-glass/epoxy composite plates. Experiments wereperformed to detect acoustic (AE) emission signals. Acoustic emission is hypothesized to occur when a local defect (crack,disbond) takes place and acoustic waves of a certain pattern (pops) are generated. In these experiments, simulated AE signalswere generated by the pencil-lead breaking method. The AE information travels through the composite in the form of Lamb’splate waves. Both the high-frequency low-amplitude axial waves and the low-frequency higher-amplitude bending waves are
Figure 8 Correlation between frequency factor and temperature increments(reproduced from Pardo de Vera and Guemes, 1997)

9
generated. were detected. Figure 12a shows the time domain signal, while Figure 12b presents its Fast Fourier Transform(FFT). The time domain plot shows how the axial wave arrives first, followed by the flexure wave. The high-frequency low-amplitude characteristics of the axial wave and the low-frequency high-amplitude characteristics of the flexure wave areclearly apparent.
(a)
(b)
Extension mode Flexure mode
(c)
Figure 9 PTCa/P(VDF-TrFE) bimorph transducer for the detection of acoustic emission signals in composite plates: (a) schematicof transducer insertion into GFRP laminate; (b) time response to a simulated AE source; (b) FFT of the time responsesignal (after Blanas et al. 1997)
The piezoelectric composites are inherently less brittle than the pure piezoceramics. This greatly increases their processabilityand makes then easier to use in applications. Piezoelectric composites can be manufactured in thinner gauges thanpiezoceramics (lower limit on piezoceramic thin wafers seems to be around 0.0075-in ~ 190 µm, while piezo-composite filmsreported by Blanas et al. are as thin as 100 µm). Besides, thin polymeric piezo-composites behave like films, while even verythin piezoceramics still behave like plates. The strain to failure of polymeric piezo-composites is many times larger than thatof piezoceramics. These attributes make polymeric piezo-composites an ideal candidate for embedding in compositematerials. Polymeric piezo-composites are generally more forgiving, and have the potential of sustaining in-service strainsand impact loads. These benefits are, however, accompanied by the reduction in stiffness and force capabilities. However,this reduction may be less dramatic than the reductions experienced by pure piezo-polymers, e.g., PVDF. In granularcomposite, the effective modulus can be coarsely predicted by the rule of mixtures through compliance addition. Since thepolymeric phase is about two orders of magnitude more compliant than the ceramic phase, its compliance is dominant. For apiezo-composite with, say, 40% vol. of polymer, the effective compliance will be 40% that of the polymer. In terms ofmodulus, this means that a piezo-composite with 40% vol. of polymer has a modulus about 2.5 higher than that of the neatpolymer. For a 35% vol. of polymer, the effective modulus may be up to 3 times that of the matrix. In their work, Blanas etal. (1997) reported volume fractions of polymer between 35% and 40%, but did not make modulus determinations However,for an epoxy matrix, with EEpoxy ~ 3.3 GPa, the corresponding piezo-composite modulus could be as high as 10 GPa. This isstill about 1/7 of the modulus of neat piezoceramics (~70 GPa).
The piezocomposite microtransducers developed by Blanas et al. (1997) also have the potential of being used in conjunction withthe electromechanical impedance technique. This application would take these revolutionary transducers a step further from the
10
passive into active applications. When used as pure acoustic emission sensors, the piezocomposite are only passive devices that donot interact with the host structure and only listen to its sounds. But when used as E/M impedance transducers, they become activedevices that also send calibrated frequency elastic wave signals into the structure and determine the structures health from itsresponse impedance signature. In order to perform this transition from passive into active devices, the mechanical energygeneration capability of these microtransducers will have to be determined using mathematical predictions and experimentaldeterminations.
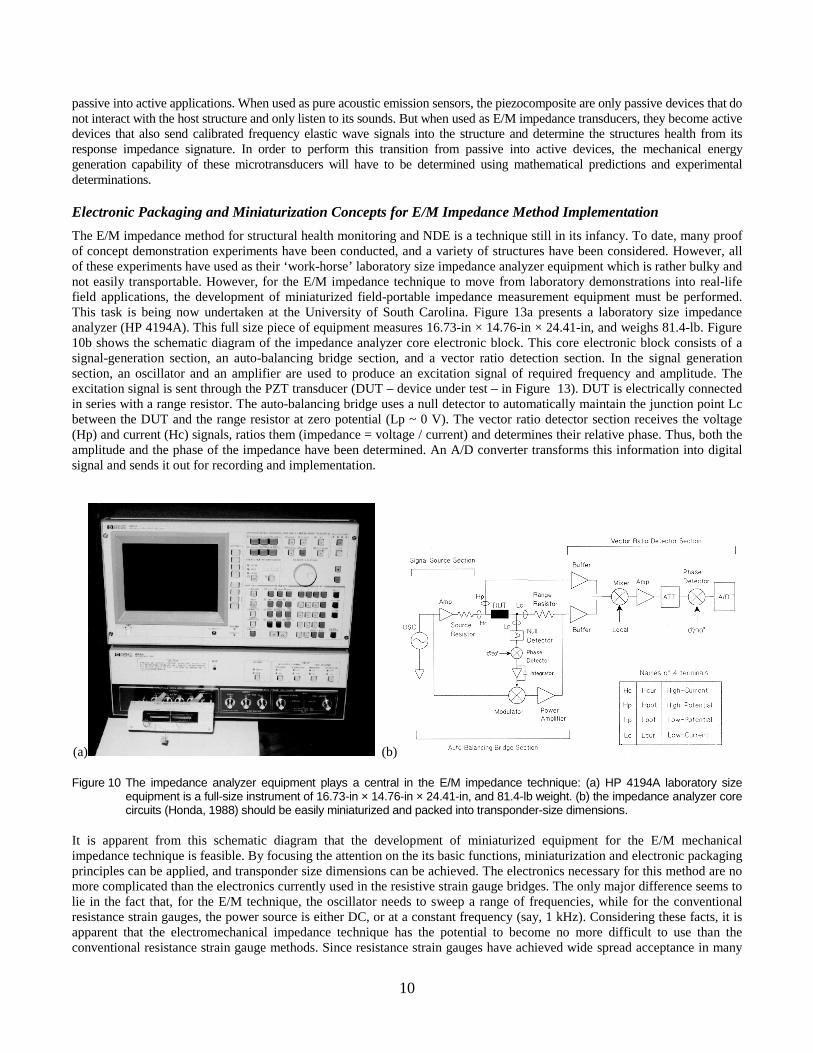
Electronic Packaging and Miniaturization Concepts for E/M Impedance Method ImplementationThe E/M impedance method for structural health monitoring and NDE is a technique still in its infancy. To date, many proofof concept demonstration experiments have been conducted, and a variety of structures have been considered. However, allof these experiments have used as their ‘work-horse’ laboratory size impedance analyzer equipment which is rather bulky andnot easily transportable. However, for the E/M impedance technique to move from laboratory demonstrations into real-lifefield applications, the development of miniaturized field-portable impedance measurement equipment must be performed.This task is being now undertaken at the University of South Carolina. Figure 13a presents a laboratory size impedanceanalyzer (HP 4194A). This full size piece of equipment measures 16.73-in × 14.76-in × 24.41-in, and weighs 81.4-lb. Figure10b shows the schematic diagram of the impedance analyzer core electronic block. This core electronic block consists of asignal-generation section, an auto-balancing bridge section, and a vector ratio detection section. In the signal generationsection, an oscillator and an amplifier are used to produce an excitation signal of required frequency and amplitude. Theexcitation signal is sent through the PZT transducer (DUT – device under test – in Figure 13). DUT is electrically connectedin series with a range resistor. The auto-balancing bridge uses a null detector to automatically maintain the junction point Lcbetween the DUT and the range resistor at zero potential (Lp ~ 0 V). The vector ratio detector section receives the voltage(Hp) and current (Hc) signals, ratios them (impedance = voltage / current) and determines their relative phase. Thus, both theamplitude and the phase of the impedance have been determined. An A/D converter transforms this information into digitalsignal and sends it out for recording and implementation.
(a) (b)
Figure 10 The impedance analyzer equipment plays a central in the E/M impedance technique: (a) HP 4194A laboratory sizeequipment is a full-size instrument of 16.73-in × 14.76-in × 24.41-in, and 81.4-lb weight. (b) the impedance analyzer corecircuits (Honda, 1988) should be easily miniaturized and packed into transponder-size dimensions.
It is apparent from this schematic diagram that the development of miniaturized equipment for the E/M mechanicalimpedance technique is feasible. By focusing the attention on the its basic functions, miniaturization and electronic packagingprinciples can be applied, and transponder size dimensions can be achieved. The electronics necessary for this method are nomore complicated than the electronics currently used in the resistive strain gauge bridges. The only major difference seems tolie in the fact that, for the E/M technique, the oscillator needs to sweep a range of frequencies, while for the conventionalresistance strain gauges, the power source is either DC, or at a constant frequency (say, 1 kHz). Considering these facts, it isapparent that the electromechanical impedance technique has the potential to become no more difficult to use than theconventional resistance strain gauge methods. Since resistance strain gauges have achieved wide spread acceptance in many

engineering fields, it is envisaged that E/M impedance gauges will also become widely used in the foreseeable future.
Disbond Sensors for Adhesively-Bonded Rotor Blade StructuresThe use of the E/M impedance technique for detecting disbonds between adhesively bonded structural elements wasinvestigated in the Department of Mechanical Engineering of the University of South Carolina. Helicopter blade sectionsfrom the Apache 64H helicopter were considered. These rotor blades have a built-up construction consisting of preformedsheet-metal members adhesively bonded with high-performance structural adhesive. In service experience with these bladeshas shown disbonds between the structural elements appearing due to in-flight vibrations. In our experiment, we considered arear rotor blade section, as shown in Figure 14. The section was instrumented with several E/M impedance wafer transducersof size 0.5-in × 0.5-in acting as of disbond gauges. The disbond gauges were adhesively bonded to the surface using standardstrain-gauge installation procedures.
Figure 11 E/M impedance disbond gauges were placed on a rear rotor-blade section in critical areas to detect delaminationbetween the adhesively bonded structural elements.
An HP4194A Impedance Analyzer was used to measure the E/M impedance signature of the disbond gauges attached to thestructure. Based on initial exploratory tests, the frequency range 100 to 750 kHz was selected. A base-line measurement ofthe E/M frequency response of the structure in the “as received” condition was first recorded (Figure 15, dashed line).Repeated sampling of the data indicated a stable and reproducible pattern of the impedance spectrum. Strong activity (clearlydefined response peaks) was observed in the 200 kHz band. Activity of lesser amplitude also appeared in the 400 kHz and650 kHz bands, but. The data was stored in PC memory as base-line signature of the structure in the “as received” condition.
(a)
05
101520253035404550
0 200 400
Frequency, kH
Rea
l Par
t of I
mpe
danc
e , O
hms
80
100
120
ce ,
Ohm
s
Figure 12 Comparison of the E/M impedaclear identification of the disbonlocation #3.
D#
D
D
#3 -- Main spardisbond gauge
#1 -- Trailing edgedisbond gauge
#1 Locationamage Index
DI = 39.4%
11
600 800
z
DisbondedAs received
(b)
0
20
40
60
0 200 400
Frequency ,
Rea
l Par
t of I
mpe
dan
nce response curves measured for the “as received” and “disbond: (a) spectrum of the disbond gauge at location #1; (b) spectrum o
3 Locationamage Index
I = 286.1%
600 800
kHz
DisbondedAs received
ded” structure showsf the disbond gauge at

12
Damage was mechanically induced in the structure in the form of local disbonds. A sharp knife blade was used to inducelocal disbonds starting at the edge of the test section. The extent of the disbonds was about 0.5-in spanwise, i.e., ~10% of thetotal bond length. The E/M impedance spectrum of the damaged structure is also shown in Figure 15 (continuous line).Examination of the damage-structure E/M impedance spectra in comparison with the base-line spectra (dashed-line) revealsthree important phenomena: (a) frequency shift of existing peaks; (b) increase in peak amplitudes; and (c) appearance of newpeaks. The frequency shifts were consistently towards lower frequencies. This left shift in frequency could be explained bythe increase in local compliance due to disbonds. The increased impedance amplitude can be also correlated with the decreasein local damping that appears when the two faying surfaces were separated. The appearance of new peaks is justified by thenew local modes that are created when disbonds appear. The damage index (DI) was calculated using the Euclidean norm ofEquation (3). The damage index values are shown as text in Figure 15. It can be seen that the damage index has a moderatevalue at the #1 location (DI = 39.4%) and a higher value at the #3 location (DI = 286.1%). This difference is consistent withfrom the visual appearance of the E/M impedance curves. The changes observed in the #1 location spectrum are less intensethan the changes observed in the #3 location spectrum. Further work needs to be done to fully develop this E/M impedancedisbond sensor. The research will concentrate on (a) Determining the sensing range of the E/M impedance disbond gauges.(b) Establishing the environmental effects on the gauge performance (temperature and humidity); (c) Determining thecorrelation between gauge size and driving voltage, on one hand, and disbond sensing range, on the other hand. (d)Calibration of the disbond gauge in terms of minimum disbond size and minimum sensing distance as function of gauge sizeand driving voltage.
CONCLUSIONSThe electro-mechanical (E/M) impedance technique is an emerging NDE technology with high potential for in-situ healthmonitoring of complex machinery. Its fundamental principles have been briefly reviewed and its benefits highlighted. Recentadvancements in the E/M impedance technique have focused in two main directions: (a) development of new transducers andsignal analysis hardware; (b) extension of the E/M method into new application areas. Considerable success has beenachieved in both these directions. Further theoretical and applied research is needed to achieve sufficient understanding of thecomplex interaction between wave propagation, drive-point structural impedance, structural damage, and the E-M impedanceresponse of the piezo-electric wafer transducer. The following areas of further research are proposed. (i) Development of awave-propagation-based model to predict the E/M impedance response as function of structural damage (disbonds, voids, anddelaminations). (ii) Mathematical modeling of the response of an elastic half-plane and of thin plate structures to the in-plane“pinching” actuation of the piezo-electric transducer (so far, this problem has only been studied for out-of-plane normalactuation in the context of ultrasonic methods). (iii) Further development of piezo-composite film transducers forembodiment into composite structures. (iv) Exploration of the miniaturization and electronic packaging issues for stand-alonefield-portable impedance analyzer equipment coupled with transponder technology. (v) The study of the size, excitation leveland energy transduction issues for practical implementation of the E/M impedance method to various engineering structuresmade of monolithic and/or composite materials. Once the understanding of these aspects is achieved, the E/M impedancemethod will know a quick development into a well-established NDE technique used with wide engineering applicability fromaeronautics and space, through land and water transportation and civil infrastructure to biomedical and bioengineering fields.
REFERENCESAnon., 1988, “IEEE Standard on Piezoelectricity", ANSI/IEEE Std 176-1987, Institute of Electrical and Electronics Engineers, Inc., New York.Anon., 1992, ASM Handbook, Volume 17, Nondestructive Evaluation and Quality Control, ASM International, 1992.Blanas, P., Wenger, M. P., Shuford, R. J., and Das-Gupta, D. K., 1997. “Active Composite Materials and Damage Monitoring”, Proceedings of the
International Workshop on Structural Health Monitoring, Stanford University, CA, September 18-20, 1997, pp. 199-207.Giurgiutiu, V., and Rogers, C. A., 1997. "The electro-mechanical (E/M) impedance method for structural health monitoring and non-destructive evaluation",
International Workshop on Structural Health Monitoring, Stanford University, CA, September 18-20, 1997.Giurgiutiu, V., Lyons, J., Petrou, M., Dutta, S., and Rogers, C. A., 1998. “Strength, Durability, and Health Monitoring of Composite Overlays on Civil
Engineering Structures”, Proceeding of the International Composites Expo ICE-98, Nashville, TN, January 19-21, 1998.Honda, M, 1989, Impedance Measurement Handbook, Yokogawa-Hewlett Packard Ltd.Keilers, C. H., Chang, F.-K., 1995, "Identifying Delamination in Composite Beams Using Built-in Piezoelectrics: Part I - Experiments and Analysis; Part II
An Identification Method", Journal of Intelligent Material Systems and Structures, Vol. 6, pp. 649-672, September, 1995.Mansfeld, F., 1993, "Analysis and Interpretation of Electrochemical Impedance Spectroscopy (EIS) Data for Metal and Alloys", #12606010, Schlumberger
Technologies, UK, 1993.Pardo de Vera, C. and Guemes, J. A., 1997, “Embedded Self-Sensing Piezoelectrics for Damage Detection”, Proceedings of the International Workshop on
Structural Health Monitoring, Stanford University, CA, September 18-20, 1997, pp. 445-455.Rogers, C. A. and Giurgiutiu, V., 1997. “Electro-Mechanical (E/M) Impedance Technique for Structural Health Monitoring and Non-Destructive
Evaluation”, Invention Disclosure No. 97162, University of South Carolina Office of Technology Transfer, July 1997.Thompson, L. and Westermo, B. 1994, "A New Strain Measurement Technology for Material Damage Assessment," Proceedings of Smart Structures and
Materials Conference, Orlando, FL, Feb. 1994, SPIE Vol. 2191, pp. 380-391Quattrone, R., Berman, J., and Kamphaus, J., 1998. “Upgrade and Monitoring of Unreinforced Masonry Structures Using Fiber Reinforced Polymers”,
Proceeding of the 1998 International Composites Expo, January 19-21, 1998, Nashville, TN, pp. 13-C/1-7.