recent developments in the global and south african economies€¦ · excluding south africa and...
TRANSCRIPT

Economic overview:
Recent developments in the global and South African economies
May 2019
Department of Research and Information

i
Economic overview
ic overview: Contents
Contents
Highlights ........................................................................................................................................................................................................ 1
Implications for South African businesses .......................................................................................................................................... 2
Global developments and outlook ........................................................................................................................................................ 4
Sub-Saharan Africa: Growth outlook and South African direct investment .......................................................................... 8
Recent developments in the South African economy ................................................................................................................ 11
Growth prospects for the South African economy ...................................................................................................................... 17

Highlights
1
Economic overview
Highlights
• The world economy’s expansion momentum is slowing more than previously
anticipated. The International Monetary Fund (IMF) is projecting global economic
growth of 3.3% for 2019, down from 3.6% in 2018. At the regional level, only Sub-
Saharan Africa (SSA), as well as South and Central America are expected to post faster
rates of expansion in 2019 compared to last year.
• Concerned with possibly weaker growth prospects while inflation remains generally
below targeted levels, central banks in most advanced economies, including the
United States (US), have paused their monetary policy tightening actions.
• The trade war between the US and China recently escalated after President Trump
raised tariffs on USD200 billion’ worth of Chinese imports to 25%. The Chinese
authorities have since retaliated by increasing tariffs by as much as 25% on US
products totalling USD60 billion in import trade. Such developments will have adverse
repercussions for both economies and the world at large.
• The industrial commodities complex has experienced relative price stability since the
start of 2019, precipitated by improved investor risk appetite due to an anticipated
resolution to the US-China trade spat, as well as improved manufacturing activity in
China. However, the prognosis for industrial commodity prices is being constrained
by geopolitical risks and by the recent deterioration in US-China trade relations.
• Although improving, the economic outlook for SSA remains relatively modest, with
growth rates of below 4% projected for the next five years. Excluding South Africa
and Nigeria, the regional economy is expected to grow at sturdy rates of around 5%
in 2019 and 2020. Robust performances are anticipated from Rwanda, Ethiopia, Côte
d’Ivoire, Ghana, Senegal, Uganda and Kenya.
• South African direct investment in the rest of the African continent has grown
exponentially since the advent of democracy in 1994, but the pace of expansion
tapered off after 2015 as economic conditions deteriorated domestically and growth
moderated in the SSA region.
• After a dismal performance in 2018, the South African economy continues to face
serious challenges, with various sectors under severe strain. In the first quarter of 2019,
output levels were sharply lower in key sectors such as mining and manufacturing,
affected by weak demand conditions and recurring interruptions in electricity supply.
The difficult consumer environment was reflected in a steep drop in sales volumes of
new passenger vehicles as well as in lower retail trade sales in real terms.
• Total employment in the domestic economy fell by 237 000 (quarter-on-quarter) in
the first quarter of 2019, taking the unemployment rate to 27.6%, from 27.1% at the
end of 2018. Substantial job losses were reported by several sectors, particularly
construction, finance and business services, community and social services, as well as
the embattled mining sector. Manufacturing sector employment, however, increased
by 14 000 on a quarter-on-quarter basis.
• The outcome of the national elections held on May 8th could have a decisive impact
on investor, business and consumer confidence, potentially leading to a sharp
rebound if followed by effective action with regard to structural reforms aimed at
boosting economic growth, greater policy certainty and coherence, increased
localisation associated with public sector procurement and infrastructure
development, concerted efforts to tackle the challenges at the power utility, Eskom,
and visible progress in the fight against corruption. This could result in substantially
increased production activity, fixed investment and employment creation.
Manufacturing
output growth in
South Africa:
-9.1% in Q1 2019
(q-o-q; annualised)
(Stats SA)
Sub-Saharan Africa
GDP growth:
3.5% in 2019
3.7% in 2020
(IMF forecasts)
World GDP growth:
3.3% in 2019
3.6% in 2020
(IMF forecasts)
South Africa’s
unemployment rate:
27.6%
in Q1 2019
(Stats SA)

Highlights
2
Economic overview
• Growth prospects for the South African economy are expected to improve gradually
over the five-year outlook period. GDP is forecast to expand by 1.5% in 2019, with the
growth momentum projected to accelerate towards 3.2% by 2022. Household
consumption expenditure will be a key driver of economic growth, whereas fiscal
constraints are likely to curb government expenditure. Although fixed investment
spending by the private sector is expected to remain relatively subdued in 2019, it
could be bolstered by rising sentiment on the back of the implementation of pro-
growth and business-friendly reforms following the election outcomes. The
anticipated slowdown in economic growth in some of South Africa’s key trading
partners could, however, have unfavourable implications for the country’s export
performance.
Implications for South African businesses
Implications of global economic developments
• Slowing growth in China, the US and Germany, which are South Africa’s three largest
trading partners at the individual country level, may constrain the performance of
export-oriented businesses in the mining and manufacturing sectors.
• The escalating trade war between the US and China, alongside renewed threats of US
protectionist measures being imposed on specific imports from the European Union,
are raising risks (displacement of South African exports in existing external markets
and import competition in the local market) as well as presenting export opportunities
for the manufacturing, mining and agriculture sectors due to trade diversion effects.
• The postponement of Brexit to the end of October 2019 prolongs the uncertainty not
only for the British and European Union economies, but also for their trading partners,
such as South Africa, for they are likely to be directly and/or indirectly affected in the
process. In the interim, companies based in or highly exposed to the United Kingdom
are increasingly implementing contingency strategies, with potential implications
(both positive and negative) for South Africa’s export sector.
• The improved outlook for Sub-Saharan Africa (SSA) bodes well for South Africa’s
export sector. The rest of the African continent has become the leading global
destination for South African exports at the regional level, having claimed a 26.5%
share in the overall merchandise export basket and just over 39% of total
manufactured exports in 2018. However, South African producers have, to-date,
hardly tapped the export market development potential in the region’s fastest
growing economies, specifically Rwanda, Ethiopia, Côte d’Ivoire, Ghana and Senegal,
thus presenting significant opportunities.
• Notwithstanding the positive prospects for the SSA region, there are considerable
risks at the individual country level. These include debt sustainability challenges in a
number of countries such as Mozambique, Zimbabwe, Zambia and Sudan;
vulnerability to adverse developments in commodity markets where resource-reliant
African exporters are concerned, with their performance being strongly correlated to
developments in the Chinese economy; and the trade diversion effects of increasing
protectionism in the world trading arena, which may displace South African export
products from existing African markets.
• The pause in monetary policy normalisation in major advanced economies, especially
the US and the Eurozone, has prompted renewed flows of capital to emerging
markets. In the short-term, such inflows could support emerging market currencies,
South Africa GDP
growth:
1.5% in 2019
2.0% in 2020
(IDC forecasts)

Highlights
3
Economic overview
including the rand. However, due to their short-term nature, they could also result in
significant currency volatility in future.
• US dollar weakness on the back of unaltered or potentially lower US policy rates would
be largely supportive of industrial commodity prices as well as precious metals.
• Financial market jitters have recently resurfaced due largely to a spate of negative
developments in the global arena, particularly the escalating trade war between the
US and China, as well as substantial higher geopolitical risks due to increased tension
between the US and Iran, among other factors. Such developments are affecting the
performance of listed equities, particularly resource-based companies as well as those
with significant exposures to the most affected world markets.
Implications of domestic economic developments
• The national election’s outcomes are expected to strengthen President Ramaphosa’s
economic reform and stimulus agendas. Clear signs of a swift and effective roll-out of
such reforms will be crucial for a substantial rebound in confidence levels amongst
businesses, investors and households, setting the foundation for a virtuous cycle of
growth, investment and employment creation.
• Private sector fixed investment could rebound strongly in a more business-friendly
environment. This is based on the assumption of a significant turnaround in business
and investor sentiment in anticipation of improving prospects for the South African
economy. Businesses that are reliant on the investment cycle should pay close
attention to economic developments and plan accordingly so as to take advantage
of emerging opportunities in an improved investment climate.
• In the meantime, considering that many industries in the domestic economy currently
have spare production capacity, fixed investment activity is likely to be of a
maintenance and upgrading nature earlier in the forecast period. However,
expansionary investments are expected to gradually gain momentum.
• In light of the limited fiscal space of general government, as well as the financial
constraints and operational challenges experienced by a number of state-owned
companies, infrastructure spending by the public sector is likely to remain constrained
for some time. This could have continued adverse implications for the construction
sector and respective suppliers, among other potentially affected industries. Effective
efforts to enhance the localisation benefits of public sector procurement would,
however, be a powerful mitigant in this regard.

Highlights
4
Economic overview
Global developments and outlook
The world economy’s expansion momentum is slowing more than previously anticipated.
The International Monetary Fund (IMF) is now projecting global economic growth at 3.3%
for 2019, down from the 3.6% growth achieved in 2018. A relatively synchronised slowdown
is expected around the globe, with the regional exceptions being Sub-Saharan Africa as well
as South and Central America, for these regions should post improved economic
performances in 2019 relative to last year.
Preliminary growth data for the first quarter of 2019 in the United States (US), China and the
Eurozone were reasonably robust. However, the headline numbers mask underlying
challenges that may constrain the ability of these economies to maintain their growth
momentum over the remainder of the year. Concerned with possibly weaker growth
prospects while inflation remains generally below targeted levels, central banks in most
advanced economies, including the US, have paused their monetary policy tightening
actions.
Figure 1: Global growth to moderate in the short-term, recovering thereafter
The US economy expanded by 3.2% (quarter-on-quarter, seasonally-adjusted and
annualised rate) in the opening quarter of 2019, a recovery from the 2.2% recorded in the
previous quarter. Although overall growth remains strong, both the pace of increase in and
level of inventories point to a potential slowing in coming quarters. Furthermore, activity
levels in the US have been fuelled by substantial tax reductions and higher fiscal spending.
The beneficial transmission effects are, however, largely reflected in the economy’s growth
rates hitherto.
Also concerning is the fact that personal consumption expenditure in the US increased by
only 1.2% in the first quarter, while overall spending on durable goods declined. The
weakness in US consumer spending is surprising given unemployment at 50-year lows and
wage growth in excess of 3%, while inflation has remained below 2% in recent months.

Highlights
5
Economic overview
Concerns over a possible recession in the US were prompted by the inversion of the yield
curve on US government bonds (i.e. short-term interest rates being higher than long-term
interest rates), for such a development had preceded recession periods in the past. However,
this appears to be an overly pessimistic view, for slower growth is a more probable outcome.
The IMF projects a moderation in US economic growth to 2.3% and 1.9% for 2019 and 2020,
respectively, from 2.9% last year.
Although the impact of the trade spat with China on the US economy has been modest thus
far, production costs, exports and investment activity have started being affected by higher
tariffs and the associated policy-related uncertainty. Furthermore, hopes of a trade deal
being concluded by mid-May were scuppered by President Trump raising tariffs on USD200
billion worth of Chinese imports from 10% to 25% on the 10th of May, after accusing China
of reneging on previous commitments during the negotiation process.
The Chinese authorities have since retaliated by increasing tariffs by as much as 25% on
USD60 billion worth of import products from the US. Tariffs on imports of US cotton,
machinery and grains were raised from 10% to 25%, hitting directly on America’s agricultural
heartland, while imports of US-produced aircraft parts, optical instruments and furniture will
now face 20% duties upon entering the Chinese market, from 10% previously. The escalating
trade war will have adverse repercussions for both economies and the world at large.
The most recent reading of the World Trade Indicator, released by the World Trade
Organisation (WTO), came in at 96.3, the lowest since March 2010 (a reading below 100
indicates that global trade growth is set to be below the medium-term trend). Prevailing
weakness in world trade is attributable not only to increasing protectionism and escalating
tension, but, among other factors, also to the difficulties experienced by Germany’s
automotive sector as new emissions standards impacted on vehicle production in the latter
part of 2018 and early in 2019.
Figure 2: World trade under pressure as trade tensions take a toll
The trade war with the US is impacting on the Chinese economy, which expanded by 5.6%
in the first quarter of 2019 (quarter-on-quarter, seasonally-adjusted and annualised rate),
down from the 6% achieved in the final quarter of 2018. Encouragingly though, year-on-
year growth in manufacturing output improved to 6.5% in the first quarter of 2019, from

Highlights
6
Economic overview
5.7% in the preceding quarter. The Chinese authorities continue to provide substantial
stimuli to sustain the economy’s growth momentum in the face of increased adversity.
In the Eurozone, the recent improvement in German industrial production supported the
upturn in regional growth to 1.8% (q-o-q, seasonally-adjusted, annualised rate) in the first
quarter of 2019, from 0.9% and 1.2% in the third and fourth quarters of 2018 respectively.
The recovery was further supported by the emergence of the Italian economy from a
technical recession. However, growth prospects for the Eurozone remain subdued, with key
risk factors including continued uncertainty regarding Brexit, which has been postponed to
31 October 2019, and the threat of US tariff increases on motor vehicle exports.
Sustained weakness in the Eurozone economy, alongside low inflationary pressures,
prompted the European Central Bank (ECB) to remove its guidance on possible interest rate
increases, while reactivating the targeted longer-term refinancing operations (TLTRO-III) in
an effort to stimulate lending activity by financial institutions across the regional bloc.
Although recent growth data from the US, China and the Eurozone (which collectively
account for around half of global GDP) have been relatively positive, the outlook remains
somewhat downbeat. The prognosis is supported by the Brookings-Financial Times’
Tracking Indexes for the Global Economic Recovery (TIGER), which indicate that although
confidence levels remain in positive territory in advanced economies, they have fallen
steeply in recent times. The trend has been even more unfavourable where emerging
markets are concerned, with sentiment already in negative territory.
Figure 3: Confidence levels have fallen as global headwinds are mounting
Turkey remains at the forefront of emerging market concerns, with the IMF projecting a
2.5% contraction in GDP in 2019.
In India, the run-up to the six-week long election process provided a modest boost to overall
economic activity as the government provided some fiscal stimulus to attract voters. The
Indian economy is anticipated to sustain its growth trajectory, with the IMF forecasting 7.3%
and 7.5% growth for 2019 and 2020, respectively. Should Prime Minister Modi and his

Highlights
7
Economic overview
political allies obtain an outright majority in the Indian national election, this could provide
the platform needed to roll-out the required economic reforms over the next five years.
In Brazil, the election of President Bolsonaro raised hopes that much needed reforms would
be effected, supporting the recovery from the recession that gripped the country in 2015
and 2016. Although this optimism is reflected in the IMF’s growth forecasts for the Brazilian
economy, at 2.1% and 2.5% for 2019 and 2020 respectively, signs of infighting in the
Bolsonaro administration are prompting concerns that such reforms could stall.
Prospects for the Russian economy remain subdued, with growth of 1.6% and 1.7%
projected by the IMF for 2019 and 2020, respectively. This lukewarm outlook is premised on
continued US sanctions against Russia and a large number of its prominent business people,
as well as threats of weaker global economic conditions suppressing commodity prices,
especially those of crude oil.
Industrial commodities: Relative stability in prices, but risks still abound
The industrial commodities complex has experienced greater price stability since the start
of 2019, after a volatile performance in the fourth quarter of 2018.
Figure 4: Relative commodity price performance and China’s manufacturing PMI
Economic growth in China, which accounts for approximately 50% of global demand for
industrial commodities, is being buoyed by several growth-supportive policies.
Consequently, China’s manufacturing PMI is once again above the 50-index-points
threshold, reversing investors’ expectations of a steep downturn in demand for industrial
commodities, which were prevalent throughout 2018. However, according to the most
recent data releases, retail sales growth is at its lowest since 2003 and industrial production
activity has also slowed, indicating that the Chinese economy remains vulnerable and that
additional policy stimulus may be required in the months ahead to avert further downside
risks. Furthermore, the lifting of industrial output restrictions imposed in China during the
winter season provides a supportive context for the base metals’ complex in general, as well
as for the commodities associated with the steel value chain, which have recorded weak
expansion in primary supplies.
Relatively more stable
industrial commodity
prices since the start of
2019
47
48
49
50
51
52
53
0
50
100
150
200
250
300
Jan
-15
Ap
r-1
5
Jul-
15
Oct-
15
Jan
-16
Ap
r-1
6
Jul-
16
Oct-
16
Jan
-17
Ap
r-1
7
Jul-
17
Oct-
17
Jan
-18
Ap
r-1
8
Jul-
18
Oct-
18
Jan
-19
Ap
r-1
9
China Manufacturing PMI (RHS) Oil
Platinum Gold
Aluminium Palladium
Thermal Coal Copper
Iron ore Steel
Manganese Chrome
Ind
ex
base
= 1
00
(Ja
n 2
01
5)
PM
I: I
nd
ex
level
Source: IDC analysis, compiled using data from Bloomberg
Recovery in China’s
manufacturing PMI
brings some respite to
the outlook for
industrial commodities,
particularly base
metals

Highlights
8
Economic overview
Among the base metals, the copper and aluminium markets are expected to record
sustained deficits due to global supply chain constraints and are well positioned to benefit
from a recovery in manufacturing activity in China. The collapse of the tailings dam at Vale’s
Feijão operation in Brazil, which led to the suspension of 5% of global iron ore supply
capacity, is expected to result in a market deficit in 2019. This should be supportive of iron
ore prices in the months ahead.
The prices of industrial and energy commodities that have experienced expanded global
supply, such as manganese and thermal coal, should remain under pressure. The downside
risks for thermal coal prices are being exacerbated by uncertainty surrounding China’s coal
import policies, as well as by increasing renewable energy generation in Europe.
The upside potential for crude oil prices is being limited by tepid growth in global demand
and by the potential future supply responses of OPEC+ to geopolitical disruptions, especially
the impact of US sanctions on Iran, which should displace more than 1.5 million barrels per
day from the global oil market, but also heightened conflict in Libya and Venezuela.
While commodities have, over the year-to-date, been supported by improved sentiment
among global investors and by a more dovish approach by the US Fed to monetary policy,
the recent deterioration in US-China trade relations is again likely to weigh on China’s
growth prospects and reflate downside risks across global industrial commodity markets.
Elevated global macro-financial and geopolitical risks could lead to investment flows into
precious metals, especially if unaltered policy rates in the US weigh on the dollar. A steep
market deficit supports the outlook for palladium, while growing industrial demand and
constrained supply growth limit the downside risks for platinum prices.
Sub-Saharan Africa: Growth outlook and South African direct investment
Sub-Saharan Africa (SSA) is still expected to post a moderate recovery in overall economic
growth from 2019 onwards, largely on the back of gradual improvements in activity levels
in some of the region’s larger economies, particularly South Africa and Nigeria, alongside
relatively faster growth in most of its non-resource intensive economies.
Figure 5: Wide variations in SSA’s economic performance
0 2 4 6 8 10
South Africa
Angola
Nigeria
Sub-Saharan Africa
Kenya
Uganda
Senegal
Ghana
Côte d'Ivoire
Ethiopia
Rwanda
Average annual % change
Average annual GDP growth forecasts (2019-20) for the fastest growing
economies in Sub-Saharan Africa
and growth forecasts for the region's three largest economies
Source: IDC, compiled using IMF data (April 2019)
Modest growth expected
for the SSA region as
weaknesses persist in
some of the region’s
larger economies
Manganese and
thermal coal prices
could endure further
downward pressure
in coming months
Precious metals could
attract investment inflows
amidst geopolitical and
economic risks

Highlights
9
Economic overview
The IMF projects growth of 3.5% for the SSA region in 2019, and 3.7% for 2020. However,
these aggregate figures mask wide disparities at the individual economy level. Economic
conditions are likely to remain relatively subdued in its three largest economies - namely
Nigeria, South Africa and Angola – although gradually improving. Excluding South Africa
and Nigeria, the region’s economy is expected to grow at a sturdy 5.0% rate in 2019 and by
5.1% in 2020. Robust performances are anticipated from countries such as Rwanda,
Ethiopia, Côte d’Ivoire, Ghana, Senegal, Uganda and Kenya, which are not reliant on oil and
metals exports.
However, the external environment is becoming less favourable, while fiscal and debt
sustainability risks remain very high in certain countries and climate-related shocks are
intensifying, as recently observed in Mozambique and, to a lesser extent, in Zimbabwe and
Malawi. Such factors could undermine the region’s economic prospects.
A less supportive external environment and a moderation of economic growth in the region
would likely affect capital flows into the African continent, including foreign direct
investment (FDI) flows, which have struggled to reach the USD58 billion level recorded in
2008.
South African foreign direct investment in the rest of the Africa
South Africa has, over the years, become an increasingly important source of FDI in the
African continent. Its direct investment stock in the rest of the continent totaled R338.2
billion as at 31 December 2017 (latest available data), compared to less than R10 billion in
the late 1990s. As such, South Africa ranks amongst the world’s top five sources of FDI in
Africa.
South African direct investment in the rest of the continent has grown exponentially since
the advent of democracy in 1994, but the pace of expansion tapered off after 2015 as
economic conditions deteriorated domestically and growth moderated regionally.
Furthermore, South Africa’s FDI assets in the rest of Africa represented only 9.9% of its
overall FDI assets globally in 2017, down from a ratio of just over 23% in 2011.
Figure 6: South African direct investment in the rest of Africa has grown exponentially
0
50
100
150
200
250
300
350
400
Ran
d b
illi
on
South Africa's direct investment in the rest of Africa
and relative shares of select host countries
Nigeria
Mozambique
Mauritius
Zimbabwe
Namibia
Swaziland
Lesotho
Botswana
Other
countries
Source: IDC, compiled using SARB data
Strong South African
investment activity in the
rest of the continent over
the years

Highlights
10
Economic overview
Investment activity was historically concentrated in other member states of the Southern
African Customs Union (SACU), mainly due to their geographical proximity as well as strong
commercial and cultural connections with South Africa. However, the outward investment
momentum also gained strength elsewhere in the Southern African Development
Community (SADC) region during the 1990s, and subsequently moved progressively further
afield to other parts of the continent. Mauritius is host to over 40% of South Africa’s FDI on
the continent, reflecting the island nation’s attractive tax environment which makes it an
investment platform of choice for many South African investors targeting regional
opportunities.
Figure 7: The distribution of South Africa’s direct investment assets in the rest of Africa
is relatively concentrated
Historically, South African investments on the continent have been mainly of a market- and
resource-seeking nature, having been largely concentrated on the telecommunications,
retail and wholesale, as well as mining sectors. However, it has diversified to a significant
extent in more recent years, also encompassing investments in manufacturing operations
and in other services sectors, including infrastructure and construction-related
developments.
The South African private non-banking sector has been responsible for the largest share of
direct investments into Africa, accounting for 76.1% of the total in 2017. Many of these were
realised through mergers and acquisitions. Total direct investments by the domestic banking
sector represented 18.2% of the total, while investments by South African public
corporations accounted for only 5.7%. The latter have been declining in the past few years,
possibly not only reflecting the financial challenges faced by several of these entities, but
also shifts in their strategic focus towards the South African market.
FDI flows into Africa from the world at large are expected to increase on the back of
improving economic conditions in various African countries. However, these could be
tampered by risk factors such as adverse geopolitical developments, rising protectionism
and escalating trade tensions between the world’s largest economic powers, which should
affect production activity, trade flows and investment activity worldwide. In addition, tax
reforms in the United States, which is one of the principal sources of FDI into Africa, may
also affect its outward investment activity.
Botswana
6,9%
Lesotho
1,0%
Swaziland
1,9%
Namibia
5,3%
Zimbabwe
7,2%
Mauritius
41,7%
Mozambique
11,2%
Nigeria
0,3%Other
24,4%
South African direct investment in the rest of Africa
as at 31 December 2017: R338.2 billion
Source: IDC, compiled using SARB data

Highlights
11
Economic overview
Recent developments in the South African economy
With the national and provincial elections behind us, the stage is set for follow-through on
governmental commitments to structural reform, policy alignment and certainty, prudent
macroeconomic management and the fight against corruption. The vigour and swiftness of
their roll-out will be a major determinant of the economy’s performance for the remainder
of the year and over the outlook period, for they will influence sentiment amongst
households, businesses and investors. Considering the base set by the economy’s weak
performance in the first quarter of 2019, a rapid turnaround in confidence levels is crucial.
Domestic economic conditions reflecting widespread challenges
After a dismal performance in 2018 (gross domestic product increased by a mere 0.8% in
real terms), the South African economy has continued to face serious challenges since the
start of 2019.
As illustrated in Figure 8, in the first quarter of the year output levels were sharply lower in
key sectors such as mining and manufacturing. These were affected by generally weak
demand conditions both domestically and globally, but also by extended and recurring
interruptions in electricity supply as Eskom resumed “load-shedding” to prevent a collapse
of the national power grid. The difficult consumer environment, in turn, was reflected in the
steep drop in sales volumes of new passenger vehicles as well as in lower retail trade sales.
Considering that the manufacturing; mining; trade catering and accommodation (which
includes motor trade); and electricity sectors account for around 35% of overall GDP, the
economy is likely to have contracted in the first quarter of 2019. Such a contraction is
estimated at 0.5% on a quarter-a-quarter, seasonally-adjusted and annualised basis.
Figure 8: Sharply lower output or sales volumes in key sectors of the economy
Manufacturing output fell by 9.1% in the first quarter of 2019 (refer to Figure 9), thereby
posing a major drag on overall GDP growth. Several consumer-oriented manufacturing sub-
sectors reported lower output levels relative to the previous quarter, such as those
producing televisions, radios and professional equipment (-13.1%); as well as furniture
(-3.5%). Energy-intensive sectors such as chemicals, rubber and plastics (-10.3%); wood,
Economic activity
under severe strain
at the start of 2019
Lower output
levels in several
manufacturing
sub-sectors
-30,0
-25,0
-20,0
-15,0
-10,0
-5,0
0,0
5,0
10,0
15,0
Mining
output
Manufac-
turing
output
Retail
trade
sales
Wholesale
trade
sales
Passenger
vehicle
sales
Total
vehicle
sales
Electricity
production
% C
han
ge (
q-o
-q)
an
nu
ali
sed
rate
Q1 2018 Q2 2018 Q3 2018 Q4 2018 Q1 2019
Source: IDC, compiled using SARB, Stats SA data
Growth in select key economic indicators

Highlights
12
Economic overview
paper and printing (-13.2%); as well as metals and machinery (-12.5%) were significantly
impacted by the interruptions in electricity supply. Moreover, weak investment activity
continued to affect demand for building materials such as non-metallic mineral products
(e.g. cement, tiles and bricks).
In contrast, output levels increased considerably in the sub-sectors producing transport
equipment, which includes motor vehicles, parts and accessories (+16%); food and
beverages (+10.1%); and, among others, clothing, textiles, leather and footwear (+16.8%).
Figure 9: Manufacturing output under strain in key sub-sectors
The manufacturing sector’s poor performance is of concern, for it has strong linkages with
supplier and supporting industries across the South African economy. At the broad sector
level, the manufacturing sector has the highest GDP multiplier (4.00), while it ranks second
in terms of employment multipliers. Its employment multiplier of 5.02 implies that every
single direct job in the manufacturing sector creates and/or sustains an additional 4.02 jobs
elsewhere in the economy. Similarly, for every R1 million of GDP in the manufacturing sector,
a further R3 million of value added is created across the entire supply chain in all sectors
whose production activities benefit from the manufacturing sector’s demand.
Furthermore, the sector’s relative contribution to overall GDP has declined over time, as
illustrated in Figure 10. From being the largest of the ten broad sectors of the South African
economy in 1994 (21% of overall GDP at basic prices), the manufacturing sector currently
ranks in fourth position, with its contribution to total GDP having fallen to 13.2% by 2018.
From a global perspective, the share claimed by South Africa’s manufacturing sector has
largely followed the trend observed in developed economies, and is presently well below
those of eastern and south-eastern Asian economies (excluding China), for which the ratio
stood at 23.6% by 2017.
According to recent surveys, South African manufacturers have become more pessimistic
about expected business conditions in 12 months’ time, thus indicating that production
activity may remain weak for some time. Their expectations regarding export volumes over
the next 12 months have also deteriorated due to unfavourable developments in the world
trading arena.
-20
-15
-10
-5
0
5
10
15
20
25
30
% C
han
ge (
q-o
-q;
an
nu
ali
sed
)
Q4 2018 Q1 2019
Growth in manufacturing output
Source: IDC, compiled using Stats SA data
Short-term prospects
to remain largely
unfavourable for the
manufacturing sector
Strong linkages
illustrate the
importance of
manufacturing
sector

Highlights
13
Economic overview
Figure 10: Manufacturing sector performances from a global perspective
Mining production fell by 12.7% in the first quarter of 2019 (quarter-on-quarter, seasonally-
adjusted and annualised rate), as shown in Figure 11. This was the worst quarterly decline in
four years, reflecting the generally unfavourable operating environment for the mining
sector at large.
Figure 11: Mining sector under renewed pressure at the start of the year
Lower output was recorded in the large iron ore, platinum group metals (PGMs) and coal
mining sub-sectors, although smaller sub-sectors such as those mining diamonds, chrome
and manganese also reported lower volumes. Gold output recovered modestly in the first
quarter of 2019, after a significant drop in the preceding quarter. The output of the sub-
sectors mining copper and other mineral products expanded at a robust pace.
The South African mining sector has now been under considerable strain for more than a
decade. Excluding gold, which is in long-term decline, domestic mining output has only
managed to expand by 0.7% per annum, on average, over the past 10 years. Consequently,
5
10
15
20
25
30
1970 1975 1980 1985 1990 1995 2000 2005 2010 2015
Man
ufa
ctu
rin
g s
ecto
r's
% s
hare
of
tota
l G
DP
Source: IDC, compiled using UNCTAD data; SARB data for South Africa
Manufacturing sector's contribution to GDP
2018
Eastern and South-Eastern Asia (excluding China)
South AfricaDeveloped economies
Middle income developing economies
Sub-Saharan Africa (excluding South Africa)
-40 -30 -20 -10 0 10 20
Diamonds
Nickel
Manganese ore
Iron ore
Building materials
Chromium
PGMs
Coal
Other non-metallic minerals
Gold
Other metallic minerals
Copper
Mining total
% change (q-o-q)
Growth in mining output by sub-sector in Q1 of 2019
Source: IDC, compiled using Stats SA data
The mining sector
continues to face a
difficult operating
environment

Highlights
14
Economic overview
its overall employment has fallen sharply over time, standing at approximately 450 000 in
2018, about 85 000 fewer than in 2012.
Going forward, activity in the mining sector may be constrained by the global slowdown. In
addition, the steep hike in domestic electricity tariffs will raise the costs of doing business,
with serious consequences for many of the marginal and loss-making mining operations.
Such factors could affect the sector’s overall production, exports and investment activity,
with adverse effects on labour-absorption.
Further drop in employment
Overall employment in the South African economy declined by 237 000 (q-o-q) in the first
quarter of 2019, taking the unemployment rate to 27.6%, from 27.1% at the end of 2018
(refer to Table 1). The construction sector reported a loss of 142 000 jobs as its employment
fell to a four-year low. Substantial job losses were also reported by finance and business
services, community and social services (which includes government), as well as by the
embattled mining sector.
Although the manufacturing sector managed to increase its workforce by 14 000 people,
this is still 69 000 fewer than for the same period in 2018. Higher employment levels were
also recorded by sectors such as transport; trade, catering and accommodation; and utilities
(i.e. electricity, gas and water supply).
The number of discouraged work-seekers (part of “not economically active” population)
increased by 156 000, while the labour absorption rate (i.e. number of working-age
population that are employed) decreased further to 42.6%. Of major concern is the fact that
69% of the unemployed have been without a job for more than one year. Considering the
fact that the economy has become more technologically advanced in its production and
operating methods, whereas many of the unemployed lack the required skills, their chances
of being re-employed in the formal sectors of the economy are quite low.
Table 1: Labour market reflecting a worrying trend
Labour market indicators for the quarter to March 2019
Labour market indicators Number
('000s)
Change in '000s
(q-o-q)
Population (15 to 64 years) 38 283 149.4
Labour force 22 492 -175.7
Unemployed 6 201 61.5
Unemployment rate (%) 27.6 0.5
Not economically active 15 791 325.1
Employed: 16 291 -237
Agriculture 837 -12.1
Mining 417 -20.1
Manufacturing 1 780 13.9
Utilities (electricity, gas & water) 150 16.2
Construction 1 339 -142.5
Trade, catering & accommodation 3 345 25.0
Transport 1 025 59.2
Finance & business services 2 516 -94.3
Community services (incl. government) 3 574 -49.9
Private households 1 301 -31.2
Source: IDC, compiled using Stats SA data
Challenging conditions
expected to persist in
the mining sector
Economy loses a further
237 000 jobs and
unemployment rate
rises to 27.6%

Highlights
15
Economic overview
Consumer environment
South African households have been facing a difficult environment for quite some time.
Subdued growth in real disposable incomes, high levels of indebtedness and tighter lending
practices by the financial sector, rising living costs (e.g. fuel, electricity tariffs) and concerns
over employment prospects are affecting their discretionary spending. The net wealth of
households as a ratio of disposable incomes declined to 367.4% in 2018, the lowest in five
years, while the household savings-to-disposable income ratio deteriorated further in 2018.
These factors contributed to the sharp drop in consumer confidence in the first quarter of
2019, to a reading of just 2 points, from the all-time highs of 26 points at the start of 2018
(refer to Figure 12). Credit extended to households has declined in each of the past five
years, with some recovery at the beginning of 2019, as shown in the chart below.
The consumer environment is expected to remain fairly challenging in the months ahead,
affecting the ability and willingness of households to raise consumption spending.
Figure 12: Subdued demand for household debt
Business confidence
Overall business confidence has been at low levels for more than 11 years and fell further in
the first quarter of 2019 to a reading of just 28 points (refer to Figure 13). Business
confidence was well below the crucial 50-point mark for all the sectors surveyed by the
Bureau for Economic Research (BER).
The highest reading was reported for the textiles, clothing, leather and footwear sector at
42 points, whereas the lowest pertained to furniture and other industries, at zero.
Confidence levels amongst manufacturers fell by 10 points over the 12 months to the
opening quarter of 2019 to a reading of 25 points, one of the lowest readings since the 2009
economic recession.
Factors at play included weak domestic demand; the adverse impacts of load shedding on
business activity; prolonged labour strikes in the gold mining sector and threats of industrial
action in other mining sectors; policy uncertainty (e.g. renewed calls for land expropriation
without compensation); as well as the global economic slowdown, which may further limit
export opportunities.
-30
-20
-10
0
10
20
30
-6%
-4%
-2%
0%
2%
4%
6%
2010 2011 2012 2013 2014 2015 2016 2017 2018 2019
Co
nsu
mer
co
nfi
den
ce: n
et
bala
nce
Cre
dit
exte
nd
ed
to
ho
use
ho
lds:
% c
han
ge (
y-o
-y)
Consumer confidence
Credit extension (% change)
Source: IDC, compiled using SARB, Stats SA, BER data
Consumer confidence and credit extended to households
Last data: March 2019
Household spending
constrained by several
factors
Declining business
confidence a major
concern
Highlights
16
Economic overview
However, the outcome of the recent national election could have a decisive impact on
investor, business and consumer confidence, potentially leading to a sharp rebound if
followed by effective action with regard to structural reforms aimed at boosting economic
growth, increased localisation associated with public sector procurement and infrastructure
development, concerted efforts to tackle the challenges at Eskom, and visible progress in
the fight against corruption and state capture. This would eventually result in increased
production activity, fixed investment and much needed employment creation.
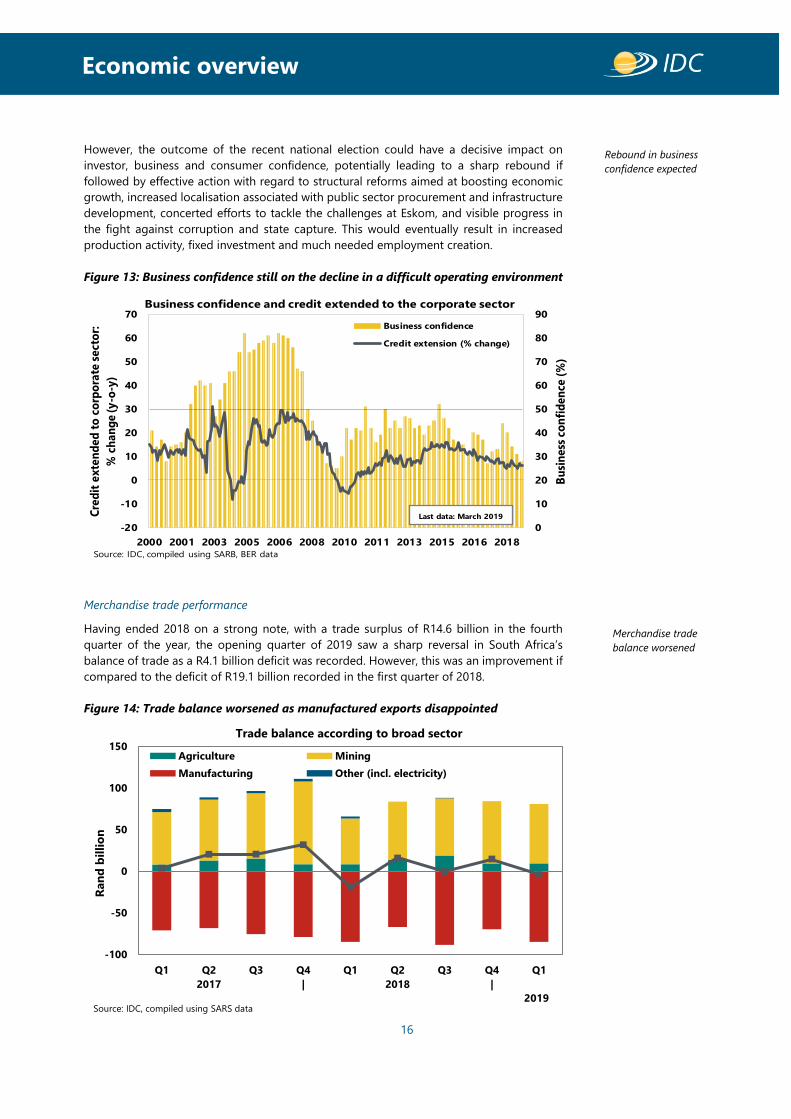
Figure 13: Business confidence still on the decline in a difficult operating environment
Merchandise trade performance
Having ended 2018 on a strong note, with a trade surplus of R14.6 billion in the fourth
quarter of the year, the opening quarter of 2019 saw a sharp reversal in South Africa’s
balance of trade as a R4.1 billion deficit was recorded. However, this was an improvement if
compared to the deficit of R19.1 billion recorded in the first quarter of 2018.
Figure 14: Trade balance worsened as manufactured exports disappointed
0
10
20
30
40
50
60
70
80
90
-20
-10
0
10
20
30
40
50
60
70
2000 2001 2003 2005 2006 2008 2010 2011 2013 2015 2016 2018
Bu
sin
ess
co
nfi
de
nce
(%
)
Cre
dit
ex
ten
de
d t
o c
orp
ora
te s
ect
or:
% c
ha
ng
e (
y-o
-y)
Business confidence
Credit extension (% change)
Business confidence and credit extended to the corporate sector
Source: IDC, compiled using SARB, BER data
Last data: March 2019
Merchandise trade
balance worsened
-100
-50
0
50
100
150
Q1 Q2
2017
Q3 Q4
|
Q1 Q2
2018
Q3 Q4
|
Q1
Ran
d b
illi
on
Agriculture Mining
Manufacturing Other (incl. electricity)
Trade balance according to broad sector
Source: IDC, compiled using SARS data2019
Rebound in business
confidence expected

Highlights
17
Economic overview
Whereas gold exports plummeted by 26.9% (year-on-year), mining exports were boosted
by solid increases in iron ore (+52.8%), PGM (23.2%) and, to a lesser extent, by other mining
exports (e.g. chrome, copper, manganese) (+18.7%). On the import side, demand for crude
oil, which accounted for about 80% of all mineral imports in the first three months of 2019,
decreased by 16.2% on the back of lower international oil prices.
The mining sector’s trade surplus thus increased by R16.4 billion to R71.5 billion over the 12
months to the first quarter of 2019. This higher trade surplus was the main contributor to
the lower trade deficit in the first three months of the year, as illustrated in Figure 14, if
compared to that for the same period of 2018. On a quarterly basis, however, the trade
surplus of the mining sector decreased slightly by R3.4 billion, due to lower exports.
Figure 15: Growth in exports outpaced that of imports in the opening quarter of 2019
Manufactured exports increased by 7.5% (year-on-year), largely supported by a strong
performance by the transport equipment sector (including motor vehicles, parts and
accessories), and by higher exports of chemicals, rubber and plastic products. Imports of
manufactured goods, in turn, increased by only 4.5% over the same period. Consequently,
the trade deficit for the manufacturing sector remained almost unchanged compared to a
year earlier, at just over R84 billion, but widened by R14.6 billion relative to the final quarter
of 2018.
South Africa’s balance of trade is expected to remain under pressure during the course of
2019. Slower global growth and the destabilising effects of the escalating trade war between
the US and China on world trade flows may affect the domestic export sector’s performance.
Import demand, in turn, is likely to be relatively constrained by subdued consumption and
investment spending domestically.
Growth prospects for the South African economy
Despite a very poor start to the year, with real GDP estimated to have contracted by 0.5%
during the first quarter, economic activity is likely to rebound over the remainder of 2019.
Overall GDP growth is forecast at 1.5% for the year as a whole (refer to Table 2).
South Africa’s growth prospects will, however, hinge on the extent of a turnaround in
confidence levels among households, businesses and investors.
Economy expected to
recover after a difficult
start to the year
-30% -20% -10% 0% 10% 20% 30%
Furniture & other manufacturing
Transport equip (incl. motor vehicles & parts)
TV, radio & professional equipment
Electrical machinery
Base metals, metal products & machinery
Non-metallic mineral products
Chemicals, rubber & plastic
Wood, paper, publishing & printing
Textiles, clothing, leather & footwear
Food & beverages
Manufacturing (total):
Mining
Agriculture
Total merchandise trade
% change (y-o-y)
Imports
Exports
Source: IDC, compiled using SARS data
Trade performance by broad sector in the first quarter of 2019
Mining exports boosted
mainly by iron ore and
PGMs

Highlights
18
Economic overview
The outcomes of the national elections held on 8 May 2019 provide a significant degree of
comfort that President Cyril Ramaphosa will have the necessary support and mandate to
implement his pro-growth reform agenda, as outlined in the State of the Nation Address.
These include reforms aimed at accelerating inclusive economic growth and creating jobs;
improving the education system and skills development; stepping up the fight against
corruption and state capture; and strengthening the capacity of the state to address the
needs of the people.
Effective efforts to ensure fiscal consolidation and debt sustainability, which will essentially
also encompass decisive interventions to address the prevailing challenges facing key state-
owned companies, will also be key to the economic recovery process. Limited fiscal space in
a low-growth environment will continue to weigh on government finances for some time,
thereby constraining both its consumption and capital expenditure.
The consumer environment is, however, expected to remain challenging for some time, thus
impacting on the ability and willingness of households to increase expenditure in a
meaningful manner. Nonetheless, consumer confidence should recover gradually over the
outlook period, thereby permitting a progressive improvement in household consumption
spending, albeit well short of the expansion rates achieved during the consumer boom of
the early 2000s.
South Africa’s export performance is expected to improve over the outlook period. This is
based on the assumptions that export market development efforts will intensify, that global
demand will remain reasonably sturdy and that commodity markets will remain fairly
supportive of mining sector exports.
Subdued demand conditions and surplus production capacity in many sectors of the
economy will continue to adversely affect private sector fixed investment expenditure earlier
in the outlook period. However, as demand conditions recover, overall investment spending
should gain momentum and gradually shift towards expansionary investments.
Table 2: South Africa’s economic growth expected to improve over the outlook period
Key performance indicators for the South African economy
Variable (% change or % of GDP) 2016 2017 2018 2019f 2020f 2021f 2022f 2023f
Real GDP growth and its components:
Household consumption expenditure 0.6 2.1 1.8 1.7 2.0 2.5 3.2 3.1
Government consumption expenditure 2.2 0.2 1.9 1.2 1.3 1.6 1.8 1.9
Gross fixed capital formation (GFCF) -3.5 1.0 -1.4 1.1 2.7 5.3 6.1 6.5
Exports 0.4 -0.7 2.6 2.7 3.0 3.1 3.2 2.6
Imports -3.9 1.0 3.3 3.1 3.5 4.1 4.2 4.0
GDP 0.4 1.4 0.8 1.5 2.0 2.6 3.2 3.1
Consumer price inflation 6.3 5.3 4.6 4.9 5.3 4.9 4.6 4.7
Current account balance (% of GDP) -2.9 -2.5 -3.5 -3.3 -3.6 -4.0 -3.7 -3.3
GFCF as % of GDP 19.4 18.8 18.2 17.6 17.6 18.0 18.4 18.9
Source: IDC, compiled using SARB data; IDC forecasts
Import growth is expected to rise as South Africa is highly dependent on key imported items
such as machinery and equipment, crude oil, refined petroleum products, as well as parts
and accessories for motor vehicles. Nevertheless, considering the relatively modest
domestic demand conditions anticipated through most of the outlook period, growth in
The election
outcomes provide
platform for pro-
growth reforms
Gradual recovery
in household
spending
Weak domestic
demand to contain
imports to some
extent
Financial
challenges to
constrain public
sector expenditure
Private sector fixed
investment to gain
momentum over
the outlook period

Highlights
19
Economic overview
imports will be contained, thereby alleviating pressure on the current account of the balance
of payments.
The rand is expected to strengthen to some extent vis-à-vis the US dollar and euro over the
five-year outlook period. Relative rand appreciation alongside the absence of significant
demand-pull inflationary pressures throughout the forecast horizon, are likely to translate
into moderate average rates of consumer price inflation well within the target band set by
the South African Reserve Bank. In the absence of major cost-push risks (for example,
extraordinary hikes in electricity tariffs), the Monetary Policy Committee is expected to leave
the repurchase (repo) rate unchanged throughout the period.
Among the key risks to the economic outlook summarised in this section of the report are
the financial and operational challenges at Eskom, with government having to embark on
decisive plans to swiftly implement a restructuring plan to ensure reliable and affordable
electricity supply.
Department of Research and Information
15 May 2019