real-time prediction of user performance based on
TRANSCRIPT

AIS Transactions on Human-Computer Interaction AIS Transactions on Human-Computer Interaction
Volume 10 Issue 1 Article 2
3-31-2018
Real-time Prediction of User Performance based on Pupillary Real-time Prediction of User Performance based on Pupillary
Assessment via Eye Tracking Assessment via Eye Tracking
Ricardo Buettner Aalen University, [email protected]
Sebastian Sauer FOM University of Applied Sciences for Economics and Management, [email protected]
Christian Maier [email protected]
Andreas Eckhardt German Graduate School of Management & Law (GGS), [email protected]
Follow this and additional works at: https://aisel.aisnet.org/thci
Recommended Citation Recommended Citation Buettner, R., Sauer, S., Maier, C., & Eckhardt, A. (2018). Real-time Prediction of User Performance based on Pupillary Assessment via Eye Tracking. AIS Transactions on Human-Computer Interaction, 10(1), 26-56. https://doi.org/10.17705/1thci.00103 DOI: 10.17705/1thci.00103
This material is brought to you by the AIS Journals at AIS Electronic Library (AISeL). It has been accepted for inclusion in AIS Transactions on Human-Computer Interaction by an authorized administrator of AIS Electronic Library (AISeL). For more information, please contact [email protected].

T ransactions on
H C I uman — omputer nteraction
Research Paper
Volume 10 Issue 1 pp. 26 – 56 DOI:10.17705/1thci.00102 June 2019
Real-time Prediction of User Performance based on Pupillary Assessment via Eye Tracking Ricardo Buettner
Aalen University, Germany Sebastian Sauer
FOM University of Applied Sciences for Economics and Management, Germany
Christian Maier University of Bamberg, Germany
Andreas Eckhardt German Graduate School of Management and Law
Abstract:
We propose a method to predict user performance based on eye-tracking. The method uses eye-tracking-based pupillometry to capture pupil diameter data and calculates—based on a Random Forest algorithm—user performance expectations. We conducted a large-scale experimental evaluation (125 participants aged from 21 to 61 years) and found promising results that pave the way for a dynamic real-time adaption of IT to a user’s mental effort and expected user performance. We have already achieved a good classification accuracy of user performance after only 40 seconds (5% of the mean total trial time that our participants took to complete our experiment). The non-invasive contact-free method can be applied cost-efficiently both in research and practical environments.
Keywords: NeuroIS, user performance, mental effort, pupillometry, eye-tracking, Random Forest.
Christoph Schneider was the accepting senior editor for this paper.
Recommended Citation Buettner, Ricardo; Sauer, Sebastian; Maier, Christian; and Eckhardt, Andreas (2018) "Real-time Prediction of User Performance based on Pupillary Assessment via Eye Tracking," AIS Transactions on Human-Computer Interaction (10) 1, pp. 25-56.
DOI: 10.17705/1thci.00103
Available at: http://aisel.aisnet.org/thci/vol10/iss1/2

27 Real-time Prediction of User Performance based on Pupillary Assessment via Eye Tracking
Volume 10 Issue 1
1 Introduction Users’ wish to achieve higher performance when engaging with IT has long been an issue in information systems (IS) research (Kositanurit, Osei-Bryson, Ngwenyama, 2011), particularly in the domain of human-computer interaction (Zhang, Li, Scialdone, & Carey, 2009). For example, cognitive load theory (Hollender, Hoffmann, Deneke, & Schmitz, 2010) conceptualizes mental effort as an important IS concept that strongly influences user performance. The technology acceptance literature also shows the high relevance of mental effort concerning perceived ease of use (Davis, 1989, p. 325; van der Heijden, 2004, p. 697). From various theoretical perspectives (e.g., cognitive load, task technology fit, job demands-resources), users need to adaptively regulate their mental effort to increase their performance. However, current means to measure users’ mental effort based on their own subjective rating do not do so adequately (e.g., Xie & Salvendy, 2000); further, one cannot possibly perform such measurements so in real time.
However, interesting results have emerged in recent years from neuroIS research in which researchers have made efforts to determine a user’s mental effort based on objective psychophysiological measurements (Dimoka, Pavlou, & Davis, 2011; Dimoka et al., 2012; Riedl et al., 2010, Gwizdka, 2014b, 2016; Buettner, 2017b). The promising nature of these results helps open the door to the possibility that one could adapt IT dynamically and in real time to a user’s mental effort. In doing so, one could address one of the most challenging problems in IS research as researchers have observed: “neurophysiological tools could assist in the design of metrics for complex constructs such as ... cognitive effort” (Dimoka et al., 2012, p. 687) and “cognitive effort...can be reduced by effective IT designs” (Dimoka et al., 2011, p. 7).
However, despite these promising (neuro-) IS results, the need to establish research requirements that contribute to the ambitious visions of the neuroIS community remains because all existing research on predicting user performance based on real-time mental effort measurement is either (very) expensive, invasive, or not contact free. As Dimoka et al. (2012, p. 685) state: “There is a need for a direct measurement of information and cognitive overload, and neurophysiological tools have the potential to offer such a direct measurement”.
Eye tracking-based pupillometry provides such a direct measure of mental effort that is well established in psychology (Goldinger & Papesh, 2012), physiology (Loewenfeld, 1999; Steinhauer, Siegle, Condray, & Pless, 2004), marketing research (Wang & Minor, 2008), and other social sciences (Webb, Campbell, Schwartz, & Sechrest, 2000) and that participants cannot voluntarily control or manipulate (Laeng, Sirois, & Gredebäck, 2012). Thus, we contribute to IS research by being the first to propose a method to predict user performance based on a non-invasive, contact-free, and cost-efficient real-time measurement of instantaneous mental effort using eye-tracking devices.
Various theoretical perspectives (e.g., cognitive load theory, task technology fit, job demands-resources theory, flow theory) have shown that the degree of a user’s mental effort strongly influences the user’s performance (see Newell & Simon, 1972; Sweller, 1988; Hart & Staveland, 1988; Bakker & Demerouti, 2006; Gwizdka, 2013a; Buettner, 2017b). Since previous work (e.g., Iqbal, Adamczyk, Zheng, & Bailey, 2005; Bailey & Iqbal, 2008; Buettner, Daxenberger, Eckhardt, & Maier, 2013) has demonstrated that the completion of a sequence of subtasks in realistic task environments (e.g., orientation, information search, reading, recall of information, writing) leads to a recurrent mental effort resulting in an observable variability of the pupil diameters, we evaluate whether the pupil diameter variability predicts user performance. Against this background, we formulate the following research question:
RQ: Does the pupil diameter variability predict user performance?
Our findings offer researchers and industrial managers to better understand user performance and, thus, to develop more advanced user performance management systems. Since, in all probability, mental effort is also closely related to pivotal IS constructs other than performance such as perceived ease of use (Davis, 1989; de Guinea, Titah, & Léger, 2014; Dimoka et al., 2011, p. 12; van der Heijden, 2004, p. 697), applying the method to study the relations to these IS constructs would be worthwhile. Our study will likely have a high impact on IS research since one can apply the performance measurement method cost-efficiently to research and practical environments without disturbing participants. Moreover, our method adopts psychophysiological measurement instead of self-rated subjective participant reports and, as such, addresses an important IS measurement problem (Dimoka et al., 2011, p. 7).
In contrast to other physiological measurements such as electroencephalography (EEG), electrodermal activity (EDA), heart-rate (HR), facial electromyography (fEMG), functional near-infrared spectroscopy

Transactions on Human-Computer Interaction 28
Volume 10 Issue 1
(fNIR), functional magnetic resonance imaging (fMRI), positron emission tomography (PET), or magnetoencephalography (MEG), eye tracking-based pupillometry does not require one to apply a cap/net (EEG) and/or electrodes (EDA/HR/fEMG/ fNIR) or to use a cost-intensive scanner (fMRI/PET/MEG). In addition, our method allows one to capture far more mental effort data points than participants could ever report themselves. For instance, subjective measurements would continually interrupt participants every five to 10 seconds, which would lead to a heavily biased measure.
This paper proceeds as follows: in Section 2, we present the research background about the role of mental effort and mental effort-based pupillary responses in IS research and detail the biological mechanism for mental effort-based pupillary dilation. In Section 3, we present our research methodology; discuss how we applied existing neuroIS guidelines; present our research model, laboratory setting and test procedure, and sampling strategy; discuss how we cleansed the data; and describe the Random Forest method. In Section 4, we present our results, which we discuss in Section 5. Finally, in Section 6, we discuss the study’s limitations and future research opportunities and conclude the paper.
2 Research Background Xie and Salvendry (2000) noted that researchers have not coherently defined mental effort and that they have used different effort measures for it. As such, the authors proposed a comprehensive framework with five effort types:
1) Instantaneous effort: effort at a specific moment 2) Peak effort: maximum value of the instantaneous effort in a given time period 3) Average effort: intensity of effort measured per time period 4) Accumulated effort: total experienced amount of effort, and 5) Overall effort: subjective mapping of instantaneous, average, and accumulated efforts in a
user’s mind.
In addition, Xie and Salvendry (2000) differentiated between effective effort that stems only from the task demands and ineffective effort.
2.1 Mental Effort in IS Research Both IS (Evaristo, Adams, & Curley, 1995; Johannsen, Levis, & Stassen, 1992; Stassen, Johannsen, & Moray, 1990) and, in particular, neuroIS research (Gwizdka, 2010; Riedl et al., 2010: Dimoka et al., 2011; Dimoka et al., 2012; Buettner, 2014, 2017b; de Guinea et al., 2014) has often cited the means of determining a user’s mental effort as a fundamental problem. Researchers have established mental effort as an essential construct in theories such as information processing theory (Miller, 1956), cognitive load theory (Sweller, 1988; Sweller, van Merrienboer, & Paas, 1998), task-technology fit theory (Goodhue & Thompson, 1995), flow theory (Csíkszentmihályi, 1975), job demands-resources theory (Bakker & Demerouti, 2006), psychobiological theory (Kock, 2004), and dual process theory (Stanovich & West, 2000).
Despite mental effort’s high relevance to IS research, it remains remarkable that IS scholars have traditionally investigated a user’s mental effort and its derivatives (Cain, 2007) by primarily basing their findings on user-perceived/non-objective measures (Ragu-Nathan, Tarafdar, Ragu-Nathan, & Tu, 2008; Tarafdar, Tu, & Ragu-Nathan, 2010; Ayyagari, Grover, & Purvis, 2011; Gupta, Li, & Sharda, 2013) or have even discussed the need for user effort measurements without making any measurement proposal (Wastell, 1999). Other IS-relevant fields also share the same situation concerning user-perceived/non-objective mental effort measures (Harris, 1961). For example, Loft, Penelope, Neal, and Mooji (2007) summarize current knowledge about 22 existing approaches for predicting mental effort in air traffic control. Notably, all 22 developed approaches use subjective effort ratings. In summary, most IS research on mental effort has only measured overall effort using subjective rating techniques (cf. Xie & Salvendry, 2000). However, IS scholars have pointed out the need to pay attention to the dynamics of mental effort (e.g., Gwizdka, 2010).
The discourse on this topic has emphasized the need to both quantify the mental effort of IS users and to conduct research into mental effort measures based on objective parameters such as behavioral signals, eye movements, or physiological variables (Dimoka et al., 2012). The discussions about metrics for human-robot interaction have also emphasized the need for research into a more objective measurement

29 Real-time Prediction of User Performance based on Pupillary Assessment via Eye Tracking
Volume 10 Issue 1
technique for mental effort; for example, Steinfeld et al. (2006, p. 38) state: “At this point in time, there is a need to identify non-intrusive measures of workload”. NeuroIS researchers have previously proposed determining a user’s mental effort based on objective psychophysiological measurements (Dimoka et al., 2011; Dimoka et al., 2012; Riedl et al., 2010; Gwizdka, 2014b, 2016).
Scholars have found physiological markers of mental effort in EEG (Fairclough, Venable, & Tattersall, 2005; Wang, Gwizdka, & Chaovalitwongse, 2016; Buettner, 2017b), fMRI (Lim et al., 2010; Gwizdka, 2013b), fNIR (Sassaroli et al., 2008; Herff et al., 2014), EDA (Wilson, 2002; Boucsein, 2012; Buettner, 2017b), HR (Vogt, Hagemann, & Kastner, 2006; Brookhuis & de Waard, 2010), facial action (Buettner, 2017b, 2018), fEMG (Stone & Wei, 2011; Ekman, Friesen, & Hager, 2002), PET (Kramer, 1990; Just, Carpenter, & Miyake, 2003), MEG (Tanaka, Ishii, & Watanabe, 2015; Ishii, Tanaka, & Watanabe, 2016), and various eye-tracking measures (e.g., Rayner, 1998; Buettner, 2013, 2017b; Gwizdka, 2016). In particular, they have found that mental effort is associated with a lot of eye-related characteristics, such as a user’s pupil diameter (Hess & Polt, 1964; Beatty, 1982; Buettner, 2017b), eye-blink duration and blink rate (Fairclough et al., 2005; Marshall, 2007), eye saccade speed (Porter et al., 2010; Buettner, 2013, 2017b), and the number of eye gaze fixations (Rayner, 1998; Buettner, 2013, 2017b).
While neuroimaging (fMRI/PET/MEG/fNIR/EEG) allows one to spatially locate mental effort in the brain, the measures indirectly linked to a human’s brain (HR, EDA, eye-tracking measures) does not (Riedl & Léger, 2016). They also differ in temporal resolution. For instance, EEG shows a high temporal resolution and PET and fMRI low ones (Gwizdka, 2013b, 2016; Riedl & Léger, 2016). When conducting experimental performance studies, one needs to ensure that laboratory devices, interruptions from questionnaires needs, and so on do not disturb participants (e.g., Marshall, 2007). Eye tracking-based mental effort measurement works without any contact and is cost-efficient. In contrast to other physiological measurements such as EEG, EDA, HR, fEMG, fNIR, fMRI, PET, MEG, eye tracking does not require one to apply a cap/net (EEG) and/or electrodes (EDA/HR/fEMG/ fNIR) or use a cost-intensive scanner (fMRI/PET/MEG). In addition, eye tracking allows one to capture far more mental effort data points than participants/users could ever report themselves. Marshall (2007) points out that:
[Eye-tracking] technology is based on video recordings of the eye made at high speed and in real time from cameras located on a lightweight headband or positioned on a computer monitor. Data may be collected unobtrusively in virtually any environment and without interfering with the operator’s performance of complex tasks. (p. B165)
Given these reasons, in this study, we focus on assessing pupillary-based mental effort via eye-tracking devices. Pupillary assessment is an unobtrusive, non-reactive research method well established in psychology (Goldinger & Papesh, 2012; Laeng et al., 2012) and physiology (Loewenfeld, 1999; Steinhauer, Condray, & Kasparek, 2004), and IS research has also recently used it (Pomplun & Sunkara, 2003; Cegarra & Chevalier, 2008; Longo, 2011; Xu et al., 2011; Wang, Li, Wang, & Chen, 2013; Buettner et al., 2013; Buettner, 2013, 2014, 2015). Consequently, in Section 2.2, we focus on the pupillary anatomical mechanism to show that mental effort directly leads to pupil dilation.
2.2 The Mechanism of Mental Effort-based Pupillary Dilation The tone of the iris dilator muscle (radial muscle of iris, radiating fibers) and the iris constrictor muscle (iris sphincter muscle, circular fibers) determines pupil diameter (Goldwater, 1972). The pupil dilates when the dilator muscle is stimulated or the constrictor muscle is inhibited (Laeng et al., 2012, p. 19), while the iris dilator muscle acts as an antagonist to the pupil iris constrictor muscle. The vegetative (involuntary) nervous system, which largely works below the level of consciousness, controls the innervation of the iris dilator and the iris constrictor muscles, for that reason, pupillary diameter responses that specific stimuli evoke occur spontaneously and are difficult to manipulate over a longer period of time (Laeng et al., 2012, p. 19).
The vegetative nervous system comprises the sympathetic nervous system and the parasympathetic nervous system. The sympathetic nervous system plays a large role in the fight-or-flight response (Donkelaar, Nĕmcová, Lammens, Overeem, & Keyser, 2011). The sympathetic nervous system in particular stimulates the iris dilator muscle, while the parasympathetic nervous system plays a large role in the body’s preparation for rest and for digestion issues. More specifically, the parasympathetic nervous system that originates from the Edinger-Westphal nucleus controls the iris constrictor muscle (Goldwater, 1972). Significantly, research has found mental effort to inhibit the activity of the Edinger-Westphal nucleus, which directly leads to pupil dilation (Steinhauer et al., 2000). This finding explains why, through
Transactions on Human-Computer Interaction 30
Volume 10 Issue 1
eye tracking-based pupillometry, one can gain insights into a user’s instantaneous and peak mental effort (cf. Xie & Salvendry, 2000).
2.3 Pupillary Responses as a Marker of Mental Effort in Psychological Research Before the discovery of the mental effort-based inhibition of the Edinger-Westphal nucleus, psychologists had observed the relationship between mental effort and pupillary dilations. The initial work on task-evoked pupillary responses stemmed from Hess and Polt (1964), Kahneman and Beatty (1966), Kahneman, Beatty, and Pollack (1967), and Kahneman, Onuskaa, and Wolmana, 1968). These authors conducted experiments based on arithmetical, listening, and speaking tasks. They all found consistent results that indicate a relationship between a user’s mental effort and the diameter of their pupils. Specifically, at this early research stage, most of the psychologists involved only assumed the link between mental effort and the pupils’ dilation because, while researchers had identified further attentional processes, they could not satisfactorily explain them.
However, following Kahneman and Beatty’s (1966), Bradshaw’s (1967, 1968), and Simpson’s (1969) work, researchers began to realize that the pupil dilates long before task-evoked mental effort occurs and that the pupillary response has a greater role in individuals’ attention processes than previously thought (Kahneman, 1973). Researchers confirmed the finding that the pupil diameter response represents an individual’s mental effort and attention through identifying the “preparedness effect”, which occurs before any demanding task.
Hakarem and Sutton (1966) found the initial evidence for the “preparedness effect”: that the pupil dilates long before mental effort occurs. Specifically, they found that the pupillary dilates more when an individual needs to hand in a report compared to when they do not need to hand in a report at all. Hakarem and Sutton (1966) had already suspected that “this difference in dilation may reflect the different levels of vigilance required in the ‘report’ and ‘no report’ conditions” (p. 485). Simpson (1969) found something similar: that is, that a subsequent indication of task completion before preceding a cognitive task causes a higher pupillary dilation during the preceding cognitive task. Simpson could not satisfactorily explain this effect and assumed that individuals become more excited when anticipating later task evaluation and recognition. Simpson and Molloy (1971) revealed that participants with audience anxiety had much larger pupils compared to participants without audience anxiety. Based on these indications and their own results, Kahneman and Wright (1971) noted that the “pupillary diameter...is a measure of the intensity of mental effort” (p. 188). They add: “Further, as in the other studies which showed a preparation effect on pupil size, this effect vanishes completely once actual work begins” (p. 189). Stanners and Headley (1972) later noted the so-called “preparedness effect” of the pupillary (as Kahneman and Wright (1971) originally termed it) as well.
Beatty (1982) reviewed the existing empirical work about task-evoked pupillary responses and concluded that the pupillary dilations, which occur before and after task execution, belong to certain attentional processes (Beatty, 1982, p. 283). He assumed that the pupil dilates as a function of task preparation and remains widened due to sustained attention. In a later experiment, Richer and Beatty (1985) analyzed pupillary responses to self-triggered finger flexion experiments. The pupillary response began about one-and-a-half seconds before the motoric finger action started, which indicates individuals shifted their attention to preparing for the task at that point. Richer and Beatty (1987) revealed different reaction latencies of the pupillary diameter response peak depending on task complexity, while the task complexity did not affect the pupil diameter peak value itself. Since the pupillary diameter signal slowly increased just before individuals presented a task, their results indicate that the signal reflects attention shifts as a function of task preparation. Qiyuan, Richer, Wagoner, and Beatty (1985) found that a task-evoked pupillary diameter response “in random stimulus sequences is sensitive to the surprise value of events” (p. 530), which also indicates that an individual has begun to prepare for a task.
Marshall (2000) proposed a method for assigning a pupillary response value to the result of the wavelet analysis as a measure of a user’s cognitive activity. Based on this patented work, she introduced the so-called index of cognitive activity (ICA) to measure cognitive effort (Marshall, 2002). The ICA “measures abrupt discontinuities in the signal created from continuous recording of pupil diameter” (Marshall, 2002, p. 7-5). Subsequently, Marshall (2007) demonstrated how neural network and discriminant classification using ICA, eye blinks, saccadic eye moves, and eye divergence can distinguish different cognitive states (relaxed versus engaged, focused versus distracted, alerted versus fatigued), and Bartels and Marshall (2012) demonstrated that the ICA measure works with various eye tracker systems.
31 Real-time Prediction of User Performance based on Pupillary Assessment via Eye Tracking
Volume 10 Issue 1
2.4 Pupillary Responses as a Marker of Mental Effort in IS Research In recent years, IS researchers have begun to use pupillary response as a marker of mental effort—initially through rudimentary work (based on games, simple/trivial arithmetic tasks, non-evaluated frameworks, etc.). For example, Pomplun and Sunkara (2003) used pupillary dilation as a mental effort indicator in a simple visual experiment by asking users to find numbers in ascending order and to read them aloud (n = 10). Longo (2011), in a research work in progress, sketched out a rudimentary framework for assessing mental effort using information technology. Cegarra and Chevalier (2008) experimentally evaluated the effort of users when solving a Sudoku puzzle by capturing pupil diameter data from eye tracking (n = 4). Xu, Wang, Chen, and Choi (2011) experimentally studied pupillary responses indicating mental effort when individuals performed arithmetical tasks that a computer gave under luminance changes. Wang et al. (2013) investigated pupillary response as a mental effort measurement under the influence of different luminance levels and emotional arousal (n1 = 13, n2 = 12). The experimental setup contained simple arithmetical tasks that participants had to memorize/reproduce. Buettner (2014) reported results from an experiment that determined the state of a user’s mental effort based on analyzing pupillary hippus (continuous small fluctuations) using eye-tracking technology (n = 12).
The little IS-related work on the relationship between task-evoked mental effort and pupillary responses stems mainly from certain researchers: Bailey and Iqbal (2008), Iqbal et al. (2005), Gwizdka (2014b, 2016), Gwidzka and Zhang (2015), Buettner (2013, 2015, 2016a, 2016b, 2017b), and Buettner et al. (2013). Iqbal et al. (2005) and Bailey and Iqbal (2008) measured changes in mental effort when individuals executed different types of tasks (planning routes, editing documents, and classifying emails) (n1 = 12, n2 = 24). Gwizdka (2014b, 2016) demonstrated that pupil size is related to levels of information relevance. Gwidzka and Zhang (2015) analyzed differences in Wikipedia users’ cognitive effort via various eye-tracking measures and found that “relative pupil dilation was the most important predictor” (p. 813). Buettner (2013) investigated whether a higher level of artificial intelligence support leads to a lower level of mental effort in users (n = 5). Buettner et al. (2013) reliably detected three different levels of mental effort in users (n1 = 12, n2 = 125). Buettner (2015, 2016b) also reported results from an experiment on the relationship between visual website complexity and users’ mental effort, which he assessed with pupillary responses. Furthermore, Buettner (2016a) demonstrated the use of eye tracking-based pupillometry to assess participants’ mental effort when using different negotiation support systems. Buettner (2017b) evaluated the mental effort of individuals when using Microsoft Excel via various eye-tracking measures (n = 53).
In addition, Jiang, Atkins, Tien, Bednarik, and Zheng, (2014), Weber et al. (2015), and Zhou et al. (2015) also investigated mental effort based on pupillary responses using realistic experimental setups. Jiang et al. (2014) found a relationship between pupil dilations and the level of task requirements (n = 12) in a surgical tele-operation setting. Weber et al. (2015) applied a pupillary-based mental effort assessment to assess individuals when creating process models (n = 3). Zhou et al. (2015) used an experimental travel-route decision making setup with 40 participants to demonstrate that one can classify subjective decision difficulty levels ex post by jointly using three task time-based factors (task time length, number of responses of pupil diameter signal, and sum of duration of pupil diameter signal).
In summary, one can see the rudimentary nature of prior research on pupillary-based measures of users’ mental effort: this research has largely used only games, simple/trivial (arithmetic) tasks, non-evaluated frameworks, and so on. Indeed, only a few investigations have used a more realistic experimental setup, but the corresponding experiments have contained only a small number of participants (4 ≤ n ≤ 53). For example, Gwidzka and Zhang (2015) stated: “There is still a need for more research conducted on more realistic search task scenarios and documents (e.g., on the live Web), and paying attention to sequential stages of search and to a wider range of eye-tracking measures” (p. 812). Buettner et al. (2013) conducted the sole large-scale experiment with 125 participants. Regardless, most significantly, all prior investigations evaluated users’ mental effort after the experiment. Even though almost all researchers stressed that one can suitably use the measurement approaches to predict mental effort in real time, no design-oriented work has built a pupillary-based mechanism to reliably predict user performance based on users’ mental effort states in real time. Because action-oriented neuroIS clearly needs such a mechanism, which many researchers have emphasized in the past (Dimoka, 2010; Dimoka et al., 2011; Ren, Barreto, Gao, & Adjouadi, 2013), we build the first one.
In the framework of building such a pupillary-based mechanism for realistic tasks, we acknowledge that, in realistic tasks, individuals have to solve not only one simple task (e.g., using mental arithmetic), which

Transactions on Human-Computer Interaction 32
Volume 10 Issue 1
leads to a singular pupillary dilation (Bradshaw, 1967, 1968; Kahneman, 1973; Kahneman & Beatty, 1966; Simpson, 1969), but also a sequence of subtasks (e.g., orientation, information search, reading, recall of information, writing) that lead to a recurrent demand for mental activity that, in turn, results in a variable pupil diameter. As such, in realistic task settings, the pupil diameter itself and its variability constitute the measurements of interest. Accordingly, one can see why previous research that has used realistic task-environments has applied pupil diameter variability measures, which include the percent change (Bailey & Iqbal, 2008; Iqbal et al., 2005) and standard deviation (Buettner et al., 2013). We argue that, as the recurring pupillary diameter response, the pupil diameter variability (PDV) represents a user’s instantaneous mental effort (cf. Xie & Salvendy, 2000) in a timeframe of a few seconds. Since a user’s mental effort correlates positively with the user’s performance, we argue that PDV, which represents a user’s instantaneous mental effort, may be a suitable predictor of user performance. Motivational psychology research largely conceptualized the assumption that an individual’s mental effort relates positively with the user’s performance (Vroom, 1964; Lawler & Suttle, 1973), and various empirical studies have subsequently confirmed it (e.g., Locke, 1968; Gardner, Dunham, Cummings, & Pierce, 1989; Blau, 1993; Brown & Leigh, 1996; Wheeler, Harris, & Sablynski, 2012).
Parsons (1968) defined mental effort as the extent to which motivation is translated into accomplished work, which implies that mental effort mediates the relationship between the unobservable psychological state of motivation and performance.
3 Methodology
3.1 Applying the NeuroIS Guidelines In order to clearly contribute to neuroIS research and show strong methodological rigor, we strictly adhered to the neuroIS guidelines that von Brocke and Liang (2014) present. In particular, we conducted a comprehensive literature review to assess prior research in the field of measuring mental effort as an important IS construct (vom Brocke et al., 2009). By basing our experimental design on solid research in related neuroscience fields (vom Brocke & Liang, 2014), we show how the vegetative nervous system controls the fundamental anatomic mechanism of the pupillary dilation and emphasize the key role of the Edinger-Westphal nucleus (which mental effort inhibits) (see Section 2.2). We also provide in-depth experimental results derived from work in psychology on task-evoked pupillary diameter responses and existing related work in IS research (see Sections 2.3 and 2.4).
Our new methodology employs eye tracking-based pupillometry—a well-established approach in physiology (Loewenfeld, 1999; Steinhauer et al., 2004) and psychology (Goldinger & Papesh, 2012; Laeng et al., 2012) for “widening the ‘window’ of data collection” (Goldinger & Papesh, 2012, p. 93). Through our method, one can use bio-data (i.e., pupil diameter) to better understand mental effort as an IS construct (vom Brocke & Liang, 2014, guideline 4). Taken together and in comparison with other neuroscience tools, eye tracking-based pupillometry is the contact-free and efficient method of choice (Laeng et al., 2012). We applied the guidelines and standards that Duchowski (2007) and the Eyegaze Edge manual describe.
3.2 Laboratory Setting and Measurement In order to capture pupillary diameter, we used the binocular double Eyegaze Edge system eye tracker paired with a 19” LCD monitor (86 dpi) set at a resolution of 1280 x 1024. The eye tracker samples the pupillary diameter at a rate of 60 Hz for each eye separately.
The Eyegaze Edge system (from LC Technologies) is a video eye tracker that uses the pupil-center corneal-reflection (PCCR) method to measure a participant’s gazepoint (Young & Sheena, 1975). In the PCCR method, one calculates a participant’s gazepoint on the display surface based on measuring the glint-pupil vector (i.e., the two-dimensional vector from the center of the corneal reflection (glint) to the center of the pupil as seen in the camera image of the eye). Eyegaze Edge uses the asymmetric aperture method to measure variations in eye range that result from forward and backward head motion (Cleveland, Cleveland, Norloff, & Forsythe, 1990). A triangular aperture pattern, built into the camera lens’s entrance aperture, optically generates size and shape features in the corneal reflection image that allow the system to directly measure the longitudinal offset between the corneal surface and the camera’s ideal focus plane. One needs to input the variation in head range into the system to ensure that it correctly calculates both the participant’s gaze point and pupil diameter. Even as a participant continues to look at a

33 Real-time Prediction of User Performance based on Pupillary Assessment via Eye Tracking
Volume 10 Issue 1
fixed point on the display and as the participant’s real pupil diameter remains fixed, the magnitudes of the apparent glint-pupil vector and pupil size, as observed in the camera image, vary as the participant moves forward and back. The Eyegaze Edge system uses the asymmetric aperture’s calculations of the eye-range offset to mathematically accommodate the apparent variations in gaze direction and pupil diameter that result from a varied head range. In addition, the apparent size of the pupil in the camera image varies with direction of gaze. For example, the apparent size of the pupil image is largest when the eye looks directly at the camera, and the apparent area decreases as the gaze angle moves away from the camera and the camera views the pupil at a more oblique angle. Based on calculating the eye’s angular orientation with respect to the camera, the Eyegaze Edge corrects for the large majority of apparent pupil-size variations that result from a varied gaze direction.
Because a pupil’s diameter is related to not only mental effort but also brightness (Steinhauer et al., 2004) and emotional arousal (Bradshaw, 1967), we controlled the laboratory luminescence level by using constant lighting (ceiling lamps with a soft ambience light). In doing so, we could ensure that the laboratory’s brightness did not influence participants’ pupils. In addition, we chose emotion-free tasks in the experiment to not agitate participants.
Our eye tracking-based approach is cost efficient, non-invasive and contact free, whereas EDA, HR, EEG, fEMG, fNIR are not contact-free measurements, and fMRI, PET, and MEG come with significant costs (Dimoka et al., 2012; Gefen, Hasan, & Banu, 2014).
3.3 Procedures To evaluate our method as part of a complex and widely used information system with a lot of dynamic Web elements, interaction functions, and advertising banners, we conducted a large-scale experiment in which participants used LinkedIn (Eckhardt, Maier, & Buettner, 2012). We chose LinkedIn because it is the world’s largest professional social network with more than 530 million members in over 200 countries and territories (LinkedIn, 2017). In our experiment, participants solved three tasks of varied levels of difficulty (low/mid/high), which induced different levels of mental effort:
1) Task A: “Ask your contact [given first name, surname] for a letter of recommendation.” 2) Task B: “Apply to Oracle for a new job of your choice.” 3) Task C: “Identify and name the Global Head of Recruiting at BMW.”
We accepted that the participants solved task A correctly if they asked the correct contact for a letter of recommendation via the specific LinkedIn recommendation function. We accepted that they solved task B correctly if they chose any Oracle vacancy and pushed the specific LinkedIn apply button. We accepted that they solved task C correctly if they communicated the right name to the laboratory assistant.
By choosing a widely used platform and realistic tasks for the participants, we could ensure that we evaluated our method in a realistic context (Addas, 2010). We selected these three tasks as common actions that applicants experience when using career-oriented social networking websites (Buettner, 2016c).
In order to induce different levels of mental effort, we manipulated task difficulty by the minimum number of search steps a user need to successfully complete the given task (Campbell, 1988; Gonzalez, 2005). This task-focused difficulty measure is appropriate to assess effective mental effort (Xie & Salvendy, 2000). We successfully evaluated the subjective perceived task difficulty prior the experiment with a small non-documented student sample. In addition, we evaluated the perceived task difficulty with an external student sample and also found significant differences (p < 0.05) in the assumed direction (see Table 1).
Table 1. Evaluation of Perceived Task Difficulty
Task order
Task ID Task difficulty Number of steps needed between login and task
completion NASA TLX mental
demand 1 A High 8 5.00 2 B Low 4 3.48 3 C Medium 6 4.26
We used a NASA TLX mental demand instrument that we anchored on a 10-point Likert scale between very low and very high. In all, 23 participants (17 females, 6 males) aged between 20 and 31 (mean: 24.7, SD: 3.2) participated in the pre-test.

Transactions on Human-Computer Interaction 34
Volume 10 Issue 1
We also evaluated the task difficulty by the number of participants that solved the task correctly (see the success rate column in Table 2).
We made a common LinkedIn account available to all participants. In order to guarantee the same test conditions for all participants, we restored the account to the previous state after every session and carefully deleted all cookies, messages, contact requests, and job applications.
Since the Eyegaze Edge eye tracker system needs a fixed test order, we had to use a fixed test sequence, which explains why the participants had to complete the three tasks in the same test order. To maintain avoiding universally rising or falling task difficulties from task to task, we used the high-demand task first (task A) followed by the low-demand task (B) and medium-demand task (C).
Table 2. Task Difficulty, Success Rate, Minimal Number of Steps Needed Between Login and Task Completion
Task order
Task ID Task difficulty Success rate (%)
Number of steps needed between login and task
completion Duration (seconds)
1 A High 22% (28 of 125) 8 237 2 B Low 65% (81 of 125) 4 147 3 C Medium 34% (42 of 125) 6 327
Success rate means how many participants correctly solved the given task.
In summary, three (2%) participants scored 0, 54 (43%) participants scored 1, 53 (42%) participants scored 2, and 15 (12%) participants scored 3. However, in addition to evaluating task difficulty by success rate, we also evaluated it by the minimal number of steps a participant needed between logging into LinkedIn and completing the task. As Table 2 shows, the number of such steps corresponds to task difficulty. Task duration neither correlates with the number of steps nor with the success rate / task difficulty (see also Table 2). Please note that differences in task duration do not affect PDV.
Prior to collecting the data, in the first stage, the experimenter welcomed each test participant and asked each one to fill out both a consent form and a questionnaire with their demographic information. In the second stage, the experimenter turned the task sheet over and briefly explained each task before reading them aloud. The experimenter then gave the participant time to read each task again and to ask questions. In the third stage, the experimenter calibrated the eye-tracking cameras. In the fourth stage, the experiment began as the participant proceeded with the first task.
Since we focused on predicting user performance (for which we classified participants into either “underperformers” or “outperformers”), we used a between-subject design.
3.4 Participants We chose 129 participants from a pool of part-time MBA and bachelor students, and, because each had professional working experience, they were realistic candidates for application situations. To ensure that all participants understood the scenario and LinkedIn, we introduced them the system and the computer interface.
We appropriately calibrated 125 of the 129 participants (97%) using the eye tracking system. We could not successfully calibrate four test participants due to problems with eyeglasses or visual defects and, thus, deleted them from the dataset. The remaining participants were 21 to 61 years old (mean = 29.6, SD = 7.2), and 56 were female and 69 were male.
We evaluated user experience in terms of how frequently the participants used career-oriented social networks in general (mean: 2.61, SD: 1.22) and LinkedIn in particular (mean: 1.50, SD: 0.91) that we measured with a single item that ranged from “never” (1) to “very often” (5). Since we conducted the study in Germany, we note that most Germans regularly use XING instead of LinkedIn for career purposes (Buettner, 2016c, 2017a).
3.5 Data Cleansing The eye tracking system we used tracks participants’ eye movements and pupillary responses when they look in the direction of the monitor. The more complex and realistic a task is, the more participants tend to look away from the monitor (e.g., at the keyboard) and, hence, the eye tracking system can no longer

35 Real-time Prediction of User Performance based on Pupillary Assessment via Eye Tracking
Volume 10 Issue 1
record each movement of the eye. In real conditions, participants look in the direction of the monitor around 70 percent of the time. In addition, some naturally determined events occur (e.g., eye blinks) (Verney, Granholm, & Dionisio, 2001). When the eye tracker lost contact with the participants’ vision, it marked the time accordingly (“invalid”, NA). We used the eye tracking signal without further cleansing it in any way to show the robustness of our prediction method.
Since eye-tracking measures are typically individual and vary between participants (Gwizdka, 2014a), we also calculated z-scores for pupil diameter data before entering the z-scores into the predictive models to compensate for individual differences in eye diameters and diameter change. Figure A1 in the Appendix analyzes the missing values in more detail. We did not preprocess raw data but used it as is; we did not exclude any data due to extreme or “suspect” values.
3.6 Random Forest Method We used the Random Forest (RF) method to predict user performance based on pupil diameter data. The RF method is a machine-learning classifier that relies on an ensemble of unpruned decision trees (Breiman, 2001). The method bases the classification decision on a majority vote principle based on all trees of the RF. A decision tree rests on the conceptual idea that one can recursively identify a predictor that allows one to split a sample into two parts that are as homogenous as possible with regard to the classification at hand. Binary predictors (yes/no), have a self-evident split point; however, for polytomous or continuous predictors, the algorithm identifies the most selective split point for the dependent variable using entropy (e.g., as a measure). In this way, the algorithm builds a tree-like structure and repeats the procedure until it reaches a stop signal (e.g., it classifies all cases or it can no longer improve the accuracy of the classification) (Breiman, 2001). Researchers term such algorithms recursive partitioning because they subdivide (i.e., partition) a sample into smaller parcels in a reiterated manner.
Researchers have successfully applied the RF method to various research problems such as brain imaging (Kačar et al., 2011), gene expression (Díaz-Uriarte & de Andrés, 2006), biomarker identification (Zhang et al., 2008), psychometry (Sauer, Lemke, Zinn, & Buettner, 2015; Sauer et al., 2018), and, recently, to IS problems (Ali, Khan, Ahmad, & Maqsood, 2012; Buettner, 2016d, 2018). In particular, the RF method is especially useful in, but not limited to, “small n, large p” problems where the number of predictor variables p is larger than the number of cases n. Even with sufficiently large samples, the RF method can be a valuable tool because it allows the delineation of statistical properties such as non-linear trends, high-degree interaction, and correlated predictors. Additionally, one does not need to make assumptions that are usually necessary for classical multivariate analyses such as homoscedasticity (homogeneity of variance), linear associations between variables, or metric variable levels (Breiman, 2001).
4 Results The experiment lasted for a mean of 13 minutes for each participant; in that time, we captured on average about 85,000 pupillary data points for each one. The captured data comprised time-stamped pupil diameter values for both the left and right eyes.
4.1 Pupil Diameter Time Series Results Figures 1 presents the period-normalized time series for the pupillary diameter values for the left eye. Figure 2 presents the same values for the right eye. The normalization procedure means that a participant’s data was compressed to vectors of 1,000 measurement points per each eye (see also Section 4.5 for the data-compression procedure we used).
In both Figures 1 (left eye) and 2 (right eye), the results clearly indicate that the outperformers had a higher pupillary dilation compared to underperformers, which indicates that the outperformers exhibited a higher mental effort. In addition, the pupillary dilation of the outperformers remained relatively more constant over time, which also indicates that the outperformers exhibited a higher mental effort. Figure A4 in the Appendix shows variants of the pupil diameter time series.

Transactions on Human-Computer Interaction 36
Volume 10 Issue 1
Figure 1. Period-normalized Pupil Diameter Time Series for Outperformers (Red Line, 2/3 Correct Tasks) vs.
Underperformers (Green Line, 0/1 Correct Tasks) (Left Eye)
Figure 2. Period-normalized Pupil Diameter Time Series for Outperformers (Red Line, 2/3 Correct Tasks) vs.
Underperformers (Green Line, 0/1 Correct Tasks) (Right Eye)

37 Real-time Prediction of User Performance based on Pupillary Assessment via Eye Tracking
Volume 10 Issue 1
4.2 Relationship between Pupillary Diameter Variability and Task Difficulty We calculated standard deviation of the median pupil diameter (the measure of pupillary diameter variability, PDV) as the recurring pupillary diameter response for each task (Buettner et al., 2013).
Table 3. Relationship Between Pupil Diameter (PD), its Variability (PDV) and Task Difficulty
Task difficulty Success rate (%) PD [mm] PDV [mm]
Left eye Right eye Left eye Right eye Low 65% (81 of 125) 3.21509 3.21828 0.16591 0.15782
Medium 34% (42 of 125) 3.19683 3.20754 0.18050 0.17762 High 22% (28 of 125) 3.23461 3.24275 0.19117 0.19898
The success rate means how many participants correctly solved the given task.
As Table 3 shows, we found a strong relationship between the pupillary diameter variability and the difficulty of a task, which indicates that a higher task difficulty demanded more variability of the pupils. Note that this data aggregates all 1,000 measurement points and is not meant to be a predictive device but to provide an overview of the association of these variables. Figure A2 in the Appendix shows the distribution of the PDV per person. Similarly, Figure A3 in the Appendix shows the time series of the PDV over the 1,000 measurement points.
The differences of the pupillary diameter variabilities between the low- and the medium-demand levels and between the medium- and the high-demand levels were all significant (pleft < 0.01, pright < 0.001), which validates the possibility that one measure mental effort via PDV.
4.3 Relationship between Pupillary Diameter Variability and Performance To assess the relationship between PDV and user performance, we calculated PDV as the standard deviation of the median pupil diameter for each of the 125 participants. We found a clear relationship between the performance score and the pupillary diameter variability (see Table 4): higher performance scores corresponded with higher PDVs. All differences between the absolute underperformers (0 score) and other performance groups (1, 2, or 3 score) were significant (pleft < 0.1; pright < 0.05). In addition, the difference between the 1 score group and the 3 score group was significant for the right eye (pright < 0.1).
Table 4. Relationship Between Pupil Diameter (PD), its Variability (PDV), and Performance
Performance score PD [mm] PDV [mm]
Left eye Right eye Left eye Right eye
No correct task (0/3) 3.2321 3.3390 0.21549 0.22182 One correct task (1/3) 3.1813 3.2052 0.28828 0.30699 Two correct tasks (2/3) 3.2630 3.2517 0.29199 0.31798 All tasks correct (3/3) 3.3876 3.4299 0.30284 0.36028
4.4 Random Forest Analysis As we state in Section 3.6, we used the Random Forest (RF) method to predict to predict user performance based on pupil diameter data. Because the participants needed different amounts of time to complete the three tasks, the number of measurement points differed between participants. Because the employed algorithm relied on data vectors of the same length and in order to reduce the data to a manageable size, we compressed the measurement points to 1,000 measurement points per eye per participant (mean compression factor: 95.67; SD: 49.09). For example, if 60,000 measurement points were available for a participant, we compressed 60 data points to 1, which yielded a measurement of 1,000 for this participant. For each participant, we based one compressed measurement point on the median of the adjacent uncompressed measurement points; no further interpolation was conducted. The online R source code in function “pdReadCompress” provides more details on compressing pupillary data (see below).

Transactions on Human-Computer Interaction 38
Volume 10 Issue 1
Next, we performed the RF method using 2,000 trees and standard settings for mtry and other tuning parameters. We used R version 3.3.0 for all analyses (R Core Team, 2014) and the randomForest package to conduct the RF analyses (Liaw & Wiener, 2002). This approach is predictive because we included only earlier measurement points as predictors for user performance. For example, at measurement point 200, we employed the first 200 measurement points of each participant as predictors in the RF model. Readers can download our R code from dx.doi.org/10.6084/m9.figshare.1050342. The code comprises one main analysis part and several functions.
One flaw in decision trees is their instability with regard to the input data. As a consequence, relatively small changes in the input data can have a large effect on the classification results. However, one can counteract this undesirable effect by drawing random samples of cases and features. For example, a typical RF classifier can “grow” to 1,000 or more trees and, thereby, diminish the effect of strong influential individual cases, which results in more stable results. The effect of drawing a random subset of variables that the RF method considers to be entry parameters for an individual tree (the excluded variables cannot enter the respective tree) allows “weaker” information to enter the model, which allows the RF method to use potentially important interactions that one or more powerful variable(s) would otherwise conceal and that the analysis would not identify. Thus, one needs to ensure that one does not test an analytical framework—RF or otherwise—based on its own construction sample because one runs the danger of overfitting. For that reason, we estimated the predictive accuracy of a decision tree in the RF method based the part of the sample that we did not use for building the RF framework, an excluded part of the sample called the “out of bag” (OOB or test) sample. In doing so, one avoids the risk of overfitting. Thus, we assessed the predictive quality of the RF model via a cross-validation sample approach. Note that, for each tree, the RF method randomly selects cases and, thereby, includes approximately 1 - e-1 ~ 2/3 of the cases in each tree. Thus, we used 63 percent of the data for the training samples and 37 percent for the validation samples.
4.5 Predictive Model Quality Using our RF model, we were able to make a more granular distinction between the outperformers by predicting class membership. As only three participants scored 0 points, we combined score 0 and score 1 based on the fact that the RF method cannot learn sparsely populated categories.
Figure 3. Mean OOB Prediction Error for Random Forest Model for Measurement Points 1-1,000 for Left Eye
(Upper Panel) and Right Eye (Lower Panel) Based on Raw (Non-normalized) Data

39 Real-time Prediction of User Performance based on Pupillary Assessment via Eye Tracking
Volume 10 Issue 1
The prediction errors (ERR) based on the left and the right pupillary response were substantially lower compared to the random error of 0.67 (ERRleft = 0.51 < 0.67, ERRright = 0.52 < 0.67). The RF algorithm reached a good overall correct prediction rate (ERRoverall = 0.52 < 0.67; see Figure 3). Since we achieved a predictive gain of 45 percent (48% accuracy vs. 33% random line), the pupil diameter variability appears to predict user performance well (see RQ). Figures A5 to A7 in the Appendix show variants of the Random Forest models.
Also, in comparison to other established eye tracking- and pupillometry-based classification approaches, our PDV-based RF prediction performed well. For instance, Marshall (2007) found a predictive gain between 46 and 74 percent using in combination her ICA measure, eye blinks, eye saccades, and divergence. With the approach that we present here, we achieved a predictive gain of 45 percent by using only one variable (PDV).
To analyze the model performance in more detail, we examined the confusion matrix for different periods or measurement times. As Figure 4 shows, the predictive performance was constant during the whole experiment.
Figure 4. Confusion Matrices for OOB Cases (Based on Percentages) for 5%, 10%, 25%, 50%, and 100% of
Trial Time for Both Eyes (Three Score Categories/Classes) Based on Raw (Non-normalized) Data1
The model performance for a classification model with only two groups (low scorers, class 1 vs. high scorers, class 2) was similar (see Figure A2.4 for the confusion matrix plot). To analyze the model in more detail, readers can access the 1,000 confusion matrices online (https://figshare.com/s/df4cfd73e44c9b335a9d).
5 Discussion As anticipated, our experimental data revealed clear differences in the pupil diameter time series between underperformers and outperformers, which indicates that pupillary diameter data may be a possible predictor for user performance. In addition, we found a strong relationship between the pupillary diameter variability and the difficulty of a task. In fact, a higher task difficulty created more pupil variability. Furthermore, we found a clear relationship between user performance and the pupillary diameter variability. Our results from using the Random Forest method demonstrate that our method has a good ability to predict user performance (see RQ).
1 Bold text shows the OOB classification error (aggregated over the three classes). For each class, the figure depicts the OOB error rate. The figure plots the correct class in a stronger tone; it plots the incorrect classes in a lighter tone.

Transactions on Human-Computer Interaction 40
Volume 10 Issue 1
Our method was very robust, and neither screen brightness differences nor age differences affected it, which is impressive because luminance caused by lighting conditions (Steinhauer et al., 2004) and an individual’s age primarily influence pupil size (Birren, Casperson, & Botwinick, 1950; Van Gerven, Paas, Van Merriënboer, & Schmidt, 2004).
In addition, our results are promising because we evaluated our method with a realistic and large-scale experiment that used a real online social network application (i.e., LinkedIn). LinkedIn offered a complex and widely used information system with a lot of dynamic Web elements, interaction functions, and advertising banners.
Because this work constitute the first attempt to use eye tracking-based pupillometry for predicting user performance (to the best of our knowledge), we cannot easily compare our prediction accuracy with previous research. However, Kraft et al. (2017) recently achieved similar accuracy scores in using deep artificial neural networks and radial kernel-based support vector machines that computed up to 26 inputs from EEG, ECG, and EOG sensors. However, our method used only pupil diameter.
5.1 Contributions to Research and Practice This study contributes to IS research because it is the first to propose a method to predict user performance based on a non-invasive, contact-free, and cost-efficient real-time measurement of mental effort. One can cost-efficiently apply our method in both research and practical environments without disturbing users.
With the method, we could measure mental effort in real time and do so more objectively—two big advantages compared to measuring it after the fact with users’ subjective self-rating. Our method also predicts user performance in real time based on this measurement. As such, our results are promising because they pave the way for one to dynamically adapt IT to a user’s mental effort and the expected user performance (e.g., by regulating the degree of information complexity and/or the font size or by presenting help texts) in real time; as such, it address one of the most challenging problems in IS research. As Figure 5 shows, we achieved good classification accuracy of user performance after only approximately 40 seconds (approximately 5% of the total trial time for each user). User performance is one of the most important IS constructs (Zhang et al., 2009; Kositanurit et al., 2011), while mental effort is in all probability closely related to further significant IS constructs such as perceived ease of use (Davis, 1989; de Guinea et al., 2014; Dimoka et al., 2011; van der Heijden, 2004).
Our method can also assist practitioners. For example, it can help individuals who operate safety-critical systems, such as nuclear power plants, automobiles, or aircraft, in assessing mental effort (Harris, 1961; Naranji, Sarkani, & Mazzuchi, 2015).
5.2 Limitations As with any study, ours has several limitations. One limitation stems from our using the RF method as the sole machine-learning approach, a decision that we made for several reasons. First, we did not use a complicated data-cleansing approach; thus, in order to guarantee that one could use our method without the eye tracking system we chose, we recognized outliers in pupillary data. The RF method, however, is not very sensitive to outliers in training data (Ali et al., 2012). In addition, overfitting is not a problem in the RF method, and the RF algorithm learns quickly (Breiman, 2001)—two important preconditions for real-time predictions. Finally, the RF method regularly leads to greater accuracy than simple-/mixed-effect regression models or some other classifiers (Ali et al., 2012). However, one can still compare the results one obtains from using the RF method to those obtained with other machine-learning approaches.
In addition, by continuously recording task-evoked pupillary responses, we measured instantaneous effort (see Xie & Salvendy, 2000) but at a sampling rate much lower than an EEG would allow (e.g., Wang et al., 2016). Future work should triangulate the pupillary signal with other psychophysiological measures.
As we describe in Section 3.3, for technical reasons, our research design comprised a fixed task sequence (difficult/easy/intermediate). As such, future work needs to test a randomized task order that counterbalances task sequence. The design and its power would benefit from increased sample sizes and even samples from different populations. In a similar vein, our research design allowed for different task durations between the participants, and we compressed these duration differences to 1,000 measurement points. This standardization may impose difficulties when interpreting the data because, for example, 50

41 Real-time Prediction of User Performance based on Pupillary Assessment via Eye Tracking
Volume 10 Issue 1
percent of trial time means different amounts of time for each participant. Future studies should control the trial time in order to control for this potential confounding variable.
In order to avoid inducing emotional arousal (cf. Bradshaw, 1967), we used emotion-free tasks in the experiment in order to not agitate the participants. However, we cannot discount that some of the 125 participants still felt emotions during the experiment. Researchers should address this concern in a replication study that uses different emotion-free tasks and a new sample.
Furthermore, note that mental effort increases whenever an individual is interested in something (e.g., by solving a task or just as a result of a stimulus) but also when a task becomes more demanding. Psychology research conceptualizes both factors. Motivation theorists have worked specifically on the relationship between (intrinsic) motivation and mental effort. For example, Csíkszentmihályi (1975) introduced “flow” as a key concept in performance motivation. The flow mental state means a zone in which the user intrinsically performs an action in a feeling of energized focus and full attentional involvement that leads to a moderate level of mental effort (Afergan et al., 2014). Because of the positive relationship between intrinsic motivation and mental effort, pupillometry researchers have found that pupils enlarge when people view interesting stimuli. For example, Hess (1975) shows that the pupillary diameter of hungry human subjects dilates significantly more when they look at food compared to those who are not hungry, which indicates that intrinsic motivation leads to pupillary dilation. In addition, Libby, Lacey, and Lacey (1973) show that the pupillary diameter clearly corresponds with individuals’ own-rated attention-interest value when they view pictures.
In addition to the intrinsic driven enlargement of the pupil, it also increases with more demanding tasks. Researchers have used various performance theories to investigate the underlying relationship between mental effort and performance relationship, such as the job demands-resources theory (Bakker & Demerouti, 2006), dual process theory (Stanovich & West, 2000), information processing theory (Miller, 1956) and cognitive load theory (Sweller et al., 1988).
As a result, from observing pupillary increases, we cannot determine why mental effort increases at this point. We do not know if the increase is intrinsically or extrinsically motivated. However, the variability of the pupil diameter seems to predict user performance well. We can only speculate that maintaining this variability could be a positive individual characteristic that indicates task performance similar to the way heart rate variability is a positive individual characteristic that indicates physical fitness. Further, note that we based our models on z-standardized data to exclude idiosyncrasies such as different pupil sizes. However, this measure did not improve predictive accuracy, which leaves room for future research to shed light on the underlying processes.
5.3 Future Research This study and its findings open a lot of future empirical and design-oriented research opportunities. Using our cost-efficient and physiology-based method, one can empirically investigate the relationships between mental effort and other important IS constructs such as perceived ease of use in a much more sophisticated manner (Dimoka et al., 2011; Dimoka et al., 2012; de Guinea et al., 2014). Furthermore, our approach may complement other eye-tracking approaches such as gaze-fixation analysis in order to improve user experience (Djamasbi, Siegel, & Tullis, 2012; Sheng & Joginapelly, 2012; Eckhardt et al., 2013; Djamasbi, 2014), a triangulation that may also help to better explain the construct of mental effort itself since, until now, research has not defined mental effort and its derivatives well psychometrically (Xie & Salvendy, 2000; Dunaway & Steelman 2013, Matthews, Reinerman-Jones, Barber, & Abich, 2015).
Furthermore, our method opens up new research opportunities about dynamically adapting IT to users’ mental effort: such research would substantially enhance our understanding of IS constructs and ensure the technological impact of IS research results.
As we describe in Section 5.2, future work should use other ML algorithms, such as support vector machines, Bayesian networks, and artificial neural networks to evaluate the predictive power of user performance based on pupillary diameter variability.
The relationship we found between PDV and user performance (see Table 4) needs further investigation since the user performance-based increase of PDV was not always significant. Future research should more deeply analyze a non-linear relationship (e.g., saturation effects of PDVs). In addition, future research should focus on separating the intrinsic part of PDV from the extrinsic part.

Transactions on Human-Computer Interaction 42
Volume 10 Issue 1
Future work should also investigate alternative means for measuring the variance of the pupillary diameter (e.g., various statistical variance measures). Further, since prior research has found fruit evidence from analyzing the pupillary spectra in terms of mental effort (Buettner, 2014; Reiner & Gelfeld, 2014; Hossain & Yeasin, 2014), future research should also analyze the so-called pupillary hippus (Buettner, 2014) and its frequency components in more detail.
In addition, one could potentially improve our method further by integrating higher-order statistics from frequency analyses as Marshall (2000, 2002, 2007) has proposed.
Following Chapanis’s (1967) argumentation, other unobserved potential factors probably balance each other out, but they may also mutually reinforce each other. Future work should try to replicate our study because replication is the most effective means of preventing influences from disturbances caused by uncontrolled/unobserved variables (Kirk, 2013).
6 Conclusion In this paper, we propose a machine learning-based method for predicting user performance using eye tracking-based pupillometry. In a large-scale experimental evaluation with 125 participants aged from 21 to 61 years, we achieved a good classification accuracy of user performance after five percent trial time. Our experimental data revealed a clear relationship between user performance and pupillary diameter variability.
The novel method is effective, non-invasive, contact free, robust, not affected by screen brightness differences or by age differences, and can be applied cost-efficiently both in research and practical environments, which paves the way for one to adapt IT to a user’s mental effort and expected user performance in real time.
Acknowledgments An earlier version of this paper was presented at the 48th Hawaii International Conference on System Sciences (HICSS) in 2015 and appeared in the HICSS-48 proceedings (cf. Buettner, Sauer, Maier, & Eckhardt, 2015). We would like to thank the HICSS-48 reviewers and participants and the AIS THCI journal reviewers and the senior editor who provided very helpful comments for refining the manuscript. We also thank Dixon Cleveland from LC Technologies for providing the technical pupillometry details of the Eyegaze Edge system, which we gratefully used in this paper. This research was partly funded by the German Federal Ministry of Education and Research (03FH055PX2).

43 Real-time Prediction of User Performance based on Pupillary Assessment via Eye Tracking
Volume 10 Issue 1
References Addas, S. (2010). A call for engaging context in HCI/MIS research with examples from the area of
technology interruptions. AIS Transactions on Human-Computer Interaction, 2(4), 178-196.
Afergan, D., Peck, E. M., Solovey, E. T., Jenkins, A., Hincks, S. W., Brown, E. T., Chang, R., & Jacob, R. (2014). Dynamic difficulty using brain metrics of workload. in Proceedings of the ACM CHI Conference on Human Factors in Computing Systems (pp. 3797-3806).
Ali, J., Khan, R., Ahmad, N., & Maqsood, I. (2012). Random forests and decision trees. International Journal of Computer Science Issues, 9(5), 272-278.
Ayyagari, R., Grover, V., & Purvis, R. (2011). Technostress: Technological antecedents and implications. Management Information Systems Quarterly, 35(4), 831-858.
Bakker, A. B., & Demerouti, E. (2006). The job demands-resources model: State of the art. Journal of Managerial Psychology, 22(3), 309-328.
Bailey, B. P., & Iqbal, S. T. (2008). Understanding changes in mental workload during execution of goal-directed tasks and its application for interruption management. ACM Transactions on Computer-Human-Interaction, 14(4), 21:1-21:28.
Bartels, M., & Marshall, S. P. (2012). Measuring cognitive workload across different eye tracking hardware platforms. In Proceedings of the Symposium on Eye Tracking Research and Applications (pp. 161-164).
Beatty, J. (1982). Task-evoked pupillary responses, processing load, and the structure of processing resources. Psychological Bulletin, 91( 2), 276-292.
Birren, J. E., Casperson, R. C., & Botwinick, J. (1950). Age changes in pupil size. Journal of Gerontology, 5(2), 216-221.
Blau, G. J. (1993). Operationalizing direction and level of effort and testing their relationships to individual job performance. Organizational Behavior and Human Decision Processes, 55(1), 152-170.
Boucsein, W. (2012). Electrodermal activity. Berlin: Springer.
Bradshaw, J. L. (1967). Pupil size as a measure of arousal during information processing. Nature, 216(5114), 515-516.
Bradshaw, J. L. (1968). Pupil size and problem solving. Quarterly Journal of Experimental Psychology, 20(2), 116-122.
Breiman, L. (2001). Random forests. Machine Learning, 45(1), 5-32.
Brookhuis, K. A., & de Waard, D. (2010). Monitoring drivers’ mental workload in driving simulators using physiological measures. Accident Analysis and Prevention, 42(3), 898-903.
Brown, S. P., & Leigh, T. W. (1996). A new look at psychological climate and its relationship to job involvement, effort, and performance. Journal of Applied Psychology, 81(4), 358-368.
Buettner, R. (2013). Cognitive workload of humans using artificial intelligence systems: Towards objective measurement applying eye-tracking technology. In Proceedings of the 36th Annual German Conference on AI (LNAI vol. 8077, pp. 37-48).
Buettner, R. (2014). Analyzing mental workload states on the basis of the pupillary hippus. In Proceedings of the Gmunden Retreat on NeuroIS.
Buettner, R. (2015). Investigation of the relationship between visual website complexity and users' mental workload: A NeuroIS perspective. In Proceedings of the Gmunden Retreat on NeuroIS (pp. 123-128).
Buettner, R. (2016a). A user's cognitive workload perspective in negotiation support systems: An eye-tracking experiment. In Proceedings of the 20th Pacific Asia Conference on Information Systems.
Buettner, R. (2016b). The relationship between visual website complexity and a user's mental workload: A NeuroIS Perspective. In Proceedings of the Gmunden Retreat on NeuroIS (pp. 107-113).

Transactions on Human-Computer Interaction 44
Volume 10 Issue 1
Buettner, R. (2016c). Getting a job via career-oriented social networking sites: The weakness of ties. In Proceedings of the 49th Hawaii International Conference on System Sciences (pp. 2156-2165).
Buettner, R. (2016d). Mining a user’s personality from social media data: A comparison between the random forest and the C4.5 J48 based approach. In Proceedings of the 78th Annual Meeting of the German Academic Association for Business Research.
Buettner, R. (2017a). Getting a job via career-oriented social networking markets: The weakness of too many ties. Electronic Markets, 27(4), 371-385.
Buettner, R. (2017b). Asking both the user’s brain and its owner using subjective and objective psychophysiological NeuroIS instruments. In Proceedings of the International Conference on Information Systems.
Buettner, R. (2018). Robust user identification based on facial action units unaffected by users’ emotions. In Proceedings of the 51th Hawaii International Conference on System Sciences (pp. 265-273).
Buettner, R., Daxenberger, B., Eckhardt, A., & Maier, C. (2013). Cognitive workload induced by information systems: Introducing an objective way of measuring based on pupillary diameter responses. In Proceedings of the 12th Annual Workshop on Human-Computer Interaction Research in Management Information Systems.
Buettner, R., Sauer, S., Maier, C., & Eckhardt, A. (2015). Towards ex ante prediction of user performance: A novel NeuroIS methodology based on real-time measurement of mental effort. In Proceedings of the 48th Hawaii International Conference on System Sciences (pp. 533-542).
Campbell, D. J. (1988). Task complexity: A review and analysis. Academy of Management Review, 13(1), 40-52.
Cain, B. (2007). A review of the mental workload literature. Toronto, Canada: Defence Research and Development.
Cegarra, J., & Chevalier, A. (2008). The use of Tholos software for combining measures of mental workload: Toward theoretical and methodological improvements. Behavior Research Methods, 40(4), 988-1000.
Chapanis, A. (1967). The relevance of laboratory studies to practical situations. Ergonomics, 10(5), 557-577.
Cleveland, D., Cleveland, J. H., Norloff, P. L., & Forsythe, J. A. (1990). Focus control system (US Patent 4,974,010).
Csíkszentmihályi, M. (1975) Beyond boredom and anxiety: Experiencing flow in work and play. San Francisco, CA: Jossey-Bass.
Davis, F. D. (1989). Perceived usefulness, perceived ease of use, and user acceptance of information technology. Management Information Systems Quarterly, 13(3), 319-340.
de Guinea, A. O., Titah, R., & Léger, P.-M. (2014). Explicit and implicit antecedents of users’ behavioral beliefs in information systems: A neuropsychological investigation. Journal of Management Information Systems, 30(4), 179-210.
Díaz-Uriarte, R., & de Andrés, S. A. (2006). Gene selection and classification of microarray data using random forest. BMC Bioinformatics, 7(3).
Dimoka, A. (2010). What does the brain tell us about trust and distrust? Evidence from a functional neuroimaging study. MIS Quarterly, 34(2), 373-396.
Dimoka, A., Banker, R. D., Benbasat, I., Davis, F. D., Dennis, A. R., Gefen, D., Gupta, A., Ischebeck, A., Kenning, P. H., Pavlou, P. A., Müller-Putz, G., Riedl, R., vom Brocke, J., & Weber, B. (2012). On the use of neurophysiological tools in IS research: Developing a research agenda for NeuroIS. MIS Quarterly, 36(3), 679-A19.
Dimoka, A., Pavlou, P. A., & Davis, F. D. (2011). NeuroIS: The potential of cognitive neuroscience for information systems research. Information Systems Research, 22(4), 687-702.

45 Real-time Prediction of User Performance based on Pupillary Assessment via Eye Tracking
Volume 10 Issue 1
Djamasbi, S., Siegel, M., & Tullis, T. S. (2012). Faces and viewing behavior: An exploratory investigation. AIS Transactions on Human-Computer Interaction, 4(3), 190-211.
Djamasbi, S. (2014). Eye tracking and Web experience. AIS Transactions on Human-Computer Interaction, 6(2), 37-54.
Donkelaar, H. J. t., Nĕmcová, V., Lammens, M., Overeem, S., & A. Keyser, (2011). The autonomic nervous system. In H. J. t. Donkelaar (Ed.), Clinical neuroanatomy: Brain circuitry and its disorders (pp. 565-602). Berlin: Springer.
Duchowski, A. T. (2007). Eye tracking methodology: Theory and practice (2nd ed.). London, UK: Springer.
Dunaway, M., & Steelman, Z. (2013). IS cognitive load: An examination of measurement convergence. In Proceedings of the 12th Annual Workshop on Human-Computer Interaction Research in Management Information Systems.
Eckhardt, A., Maier, C., & Buettner, R. (2012). The influence of pressure to perform and experience on changing perceptions and user performance: A multi-method experimental analysis. In Proceedings of the 33rd International Conference on Information Systems.
Eckhardt, A., Maier, C., Hsieh, J. J., Chuk, T., Chan, A., Hsiao, J., & Buettner, R. (2013). Objective measures of IS usage behavior under conditions of experience and pressure using eye fixation data. In Proceedings of the Thirty Fourth International Conference on Information Systems.
Ekman, P., Friesen, W. V., & Hager, J. C. (2002). The facial action coding system. London: Weidenfeld & Nicolson, 2nd ed.
Evaristo, R., Adams, C., & Curley, S. (1995). Information load revisited: A theoretical model. In Proceedings of the 16th International Conference on Information Systems.
Fairclough, S. H., Venable, L., & Tattersall, A. (2005). The influence of task demand and learning on the psychophysiological response. International Journal of Psychophysiology, 56(2), 171-184.
Gardner, D. G., Dunham, R. B., Cummings, L. L., & Pierce, J. L. (1989). Focus of attention at work: Construct definition and empirical validation. Journal of Occupational Psychology, 62 1), 61-77.
Gefen, D., Hasan, A., & Banu, O. (2014). Apply functional near infrared (fNIR) spectroscopy to enhance MIS research. AIS Transactions on Human-Computer Interaction, 6(3), 55-73.
Goodhue, D. L., & Thompson, R. L. (1995). Task-technology fit and individual performance. MIS Quarterly, 19(2), 213-236.
Goldinger, S. D., & Papesh, M. H. (2012). Pupil dilation reflects the creation and retrieval of memories. Current Directions in Psychological Science, 21(2), 90-95.
Goldwater, B. C. (1972). Psychological significance of pupillary movements. Psychological Bulletin, 77(5), 340-355.
Gonzalez, C. (2005). Task workload and cognitive abilities in dynamic decision making. Human Factors, 47(1), 92-101.
Gupta, A., Li, H., & Sharda, R. (2013). Should I send this message? Understanding the impact of interruptions, social hierarchy and perceived task complexity on user performance and perceived workload. Decision Support Systems, 55(1), 135-145.
Gwizdka, J (2010). Distribution of cognitive load in Web search. Journal of the American Society for Information Science and Technology, 61(11), 2167-2187.
Gwizdka, J. (2013a). Effects of working memory capacity on users’ search effort. In Proceedings of the MIDI ’13 Conference.
Gwizdka, J. (2013b). Looking for information relevance in the brain. In Proceedings of the Gmunden Retreat on NeuroIS.
Gwizdka, J. (2014a). Tracking information relevance. In Proceedings of the Gmunden Retreat on NeuroIS (pp. 29-31).

Transactions on Human-Computer Interaction 46
Volume 10 Issue 1
Gwizdka, J. (2014b). Characterizing relevance with eye-tracking measures. In Proceedings of the 5th Information Interaction in Context Symposium (pp. 58-67).
Gwizdka, J., & Zhang, Y. (2015). Differences in eye-tracking measures between visits and revisits to relevant and irrelevant web pages. In Proceedings of the 38th International ACM SIGIR Conference on Research and Development in Information Retrieval (pp. 811-814).
Gwizdka, J. (2016). Differences in reading between word search and information relevance decisions - evidence from eye-tracking. In Proceedings of the Gmunden Retreat on NeuroIS (pp. 141-147).
Hakarem, G., & Sutton, S. (1966). Pupillary response at visual threshold. Nature, 212(5061), 485-486.
Harris, D. (1961). Human performance on the flight deck. Surrey, England: Ashgate Publishing.
Hart, S. G., & Staveland, L. E. (1988). Development of NASA-TLX (task load index): Results of empirical and theoretical research. In P. A. Hancock & N. Meshkati (Eds.), Human mental workload (pp. 139-183). Amsterdam: North Holland Press.
Herff, C., Heger, D., Fortmann, O., Hennrich, J., Putze, F., & Schultz, T. (2014). Mental workload during n-back task—quantified in the prefrontal cortex using fNIRS. Frontiers in Human Neuroscience, 7.
Hess, E. H., & Polt, J. M. (1964). Pupil size in relation to mental activity during simple problem-solving. Science, 143(3611), 1190-1192.
Hess, E. H (1975). The role of pupil size in communication. Scientific American, 233(5), 110-119.
Hollender, N., Hofmann, C., Deneke, M., & Schmitz, B. (2010). Integrating cognitive load theory and concepts of human-computer interaction. Computers in Human Behavior, 26(6), 1278-1288.
Hossain, G., & Yeasin, M. (2014). Understanding effects of cognitive load from pupillary responses using hilbert analytic phase. In Proceedings of the 2014 IEEE Conference on Computer Vision and Pattern Recognition Workshop (pp. 381-386).
Iqbal, S. T., Adamczyk, P. D., Zheng, X. S., & Bailey, B. P. (2005). Towards an index of opportunity: Understanding changes in mental workload during task execution. In Proceedings of the ACM Conference on Human Factors in Computing Systems (pp. 311-320).
Ishii, A., Tanaka, M., & Watanabe, Y. (2016). Neural mechanisms to predict subjective level of fatigue in the future: A magnetoencephalography study. Scientific Reports, 6.
Jiang, X., Atkins, M. S., Tien, G., Bednarik, R., & Zheng, B. (2014). Pupil responses during discrete goal-directed movements. In Proceedings of the Special Interest Group on Human Computer Interaction Conference on Human Factors in Computing Systems (pp. 2075-2084).
Just, M. A., Carpenter, P. A., & Miyake, A. (2003). Neuroindices of cognitive workload: Neuroimaging, pupillometric and event-related potential studies of brain work. Theoretical Issues in Ergonomics Science, 4(1-2), 56-88.
Johannsen, G., Levis, A. H., & Stassen, H. G. (1992). Theoretical problems in man-machine systems and their experimental validation. Automatica, 30(2), 217-231.
Kačar, K., Rocca, M. A., Copetti, M., Sala, S., Mesaroš, V., Stosić Opinćal, T., Caputo, D., Absinta, M., Drulović, J., Kostić, V. S., Comi, G., & Filippi, M. (2011). Overcoming the clinical-MR imaging paradox of multiple sclerosis: MR imaging data assessed with a random forest approach. American Journal of Neuroradiology, 32(11), 2098-2102.
Kahneman, D. (1973). Attention and effort. Englewood Cliffs, NJ: PH.
Kahneman, D., & Beatty, J. (1966). Pupil diameter and load on memory. Science, 154(3756), 1583-1585.
Kahneman, D., Beatty, J., & Pollack, I. (1967). Perceptual deficit during a mental task. Science, 157(3785), 218-219.
Kahneman, D., Onuskaa, L., & Wolmana, R. E. (1968). Effects of grouping on the pupillary response in a short-term memory task. Quarterly Journal of Experimental Psychology, 20(3), 309-311.
Kahneman, D., & Wright, P. (1971). Changes of pupil size and rehearsal strategies in a short-term memory task. Quarterly Journal of Experimental Psychology, 23(2), 187-196.

47 Real-time Prediction of User Performance based on Pupillary Assessment via Eye Tracking
Volume 10 Issue 1
Kirk, R. E. (2013). Experimental design: Procedures for the behavioral sciences. Thousand Oaks, CA: Sage.
Kock, N. (2004). The psychobiological model: Towards a new theory of computer-mediated communication based on darwinian evolution. Organization Science, 15(3), 327-348.
Kositanurit, B., Osei-Bryson, K.-M., & Ngwenyama, O. (2011). Re-examining information systems user performance: Using data mining to identify properties of IS that lead to highest levels of user performance. Expert Systems with Applications, 38(6), 7041-7050.
Kraft, A. E., Russo, J., Krein, M., Russell, B., Casebeer, W., & Ziegler, M. (2017). A systematic approach to developing near real-time performance predictions based on physiological measures. In Proceedings of the IEEE Conference on Cognitive and Computational Aspects of Situation Management.
Kramer, A. F. (1990). Physiological metrics of mental workload: A review of recent progress. San Diego, California: Navy Personnel Research and Development Center.
Laeng, B., Sirois, S., & Gredebäck, G. (2012). Pupillometry: A window to the preconscious? Perspectives on Psychological Science, 7(1), 18-27.
Lawler, E. E., III., & Suttle, J. L. (1973). Expectancy theory and job behavior. Organizational Behavior and Human Performance, 9(3), 482-503.
Liaw, A., & Wiener, M. (2002). Classification and regression by randomForest. R News, 2(3), 18-22.
Libby, W. L., Lacey, B. C., & Lacey, J. I. (1973). Pupillary and cardiac activity during visual attention. Psychophysiology, 10(3), 270-294.
Lim, J., Wu, W. C., Wang, J., Detre, J. A., Dinges, D. F., & Rao, H. (2010). Imaging brain fatigue from sustained mental workload: An ASL perfusion study of the time-on-task effect. NeuroImage, 49(4), 3426-3435.
LinkedIn. (2017). About LinkedIn. Retrieved from https://press.linkedin.com/about-linkedin.
Locke, E. A. (1968). Toward a theory of task motivation and incentives. Organizational Behavior and Human Performance, 3(2), 157-189.
Loewenfeld, I. E. (1999). The pupil: Anatomy, physiology, and clinical applications (2nd ed.). Oxford, UK: Butterworth-Heinemann.
Loft, S., Penelope, S., Neal, A., & Mooij, M. (2007). Modeling and predicting mental workload in en route air traffic control: Critical review and broader implications. Human Factors, 49(3), 376-399.
Longo, L. (2011). Human-computer interaction and human mental workload: Assessing cognitive engagement in the World Wide Web. In Proceedings of the 13th IFIP TCI3 Conference on Human-Computer Interaction (pp. 402-405).
Marshall, S. P. (2000). Method and apparatus for eye tracking and monitoring pupil dilation to evaluate cognitive activity (U.S. Patent 6,090,051).
Marshall, S. P. (2002). The index of cognitive activity: Measuring cognitive workload. In Proceedings of the 7th IEEE Conference on Human Factors and Power Plants.
Marshall, S. P. (2007). Identifying cognitive state from eye metrics. Aviation, Space, and Environmental Medicine, 78(S1), B165-B175.
Matthews, G., Reinerman-Jones, L. E., Barber, D. J., & Abich, J., IV. (2015). The psychometrics of mental workload multiple measures are sensitive but divergent. Human Factors: The Journal of the Human Factors and Ergonomics Society, 57(1), 125-143.
Miller, G. A. (1956). The magical number seven, plus or minus two: Some limits on our capacity for processing information. Psychological Review, 63(2), 81-97.
Naranji, E., Sarkani, S., & Mazzuchi, T. (2015). Reducing human/pilot errors in aviation using augmented cognition and automation systems in aircraft cockpit. AIS Transactions on Human-Computer Interaction, 7(2), 71-96

Transactions on Human-Computer Interaction 48
Volume 10 Issue 1
Newell, A., & Simon, H. A. (1972). Human problem solving. Englewood Cliffs, N.J.: Prentice-Hall.
Parsons, T. (1968). The structure of social action. New York: Free Press.
Pomplun, M., & Sunkara, S. (2003). Pupil dilation as an indicator of cognitive workload in human-computer interaction. In Proceedings of the 10th International Conference on Human-Computer Interaction (pp. 542-546).
Porter, G., Tales, A., Troscianko, T., Wilcock, G., Haworth, J., & Leonards, U. (2010). New insights into feature and conjunction search: Evidence from pupil size, eye movements and ageing. Cortex, 46(5), 621-636.
Qiyuan, J., Richer, F., Wagoner, B. L., & Beatty, J. (1985). The pupil and stimulus probability. Psychophysiology, 22(5), 530-534.
R Core Team. (2014) R: A language and environment for statistical computing. Vienna, Austria: R Foundation for Statistical Computing.
Ragu-Nathan, T. S., Tarafdar, M., Ragu-Nathan, B. S., & Tu, Q. (2008). The consequences of technostress for end users in organizations: Conceptual development and empirical validation. Information Systems Research, 19(4), 417-433.
Rayner, K. (1998). Eye movements in reading and information processing: 20 years of research. Psychological Bulletin, 124(3), 372-422.
Reiner, M., & Gelfeld, T. M. (2014). Estimating mental workload through event-related fluctuations of pupil area during a task in a virtual world. International Journal of Psychophysiology, 93(1), 38-44.
Ren, P., Barreto, A., Gao, Y., & Adjouadi, M. (2013). Affective assessment by digital processing of the pupil diameter. IEEE Transactions on Affective Computing, 4(1), 2-14.
Richer, F., & Beatty, J. (1985). Pupillary dilations in movement preparation and execution. Psychophysiology, 22(2), 204-207.
Richer, F., & Beatty, J. (1987). Contrasting effects of response uncertainty on the task-evoked pupillary response and reaction time. Psychophysiology, 24(3), 258-262.
Riedl, R., Banker, R. D., Benbasat, I., Davis, F. D., Dennis, A. R., Dimoka, A., Gefen, D., Gupta, A., Ischebeck, A., Kenning, P., Müller-Putz, G., Pavlou, P. A., Straub, D. W., vom Brocke, J., & Weber, B. (2010). On the foundations of NeuroIS: Reflections on the Gmunden Retreat 2009. Communications of the Association for Information Systems, 27, 243-264.
Riedl, R., & Léger, P.-M. (2016). Fundamentals of NeuroIS: Information systems and the brain. Berlin: Springer.
Sassaroli, A., Zheng, F., Hirshfield, L. M., Girouard, A., Solovey, E. T., Jacob, R. J. K., & Fantini, S. (2008). Discrimination of mental workload levels in human subjects with functional near-infrared spectroscopy. Journal of Innovative Optical Health Sciences, 1(2), 227-237.
Sauer, S., Lemke, J., Zinn, W., Buettner, R., & Kohls, N. (2015). Mindful in a random forest: Assessing the validity of mindfulness items using random forests methods. Journal of Personality and Individual Differences, 81, 117-123.
Sauer, S., Buettner, R., Heidenreich, T., Lemke, J., Berg, C., & Kurz, C. (2018). Mindful machine learning: Using machine learning algorithms to predict the practice of mindfulness. European Journal of Psychological Assessment, 34(1), 6-13.
Sheng, H., & Joginapelly, T. (2012). Effects of Web atmospheric cues on users’ emotional responses in e-commerce. AIS Transactions on Human-Computer Interaction, 4(1), 1-24.
Simpson, H. M. (1969). Effects of a task-relevant response on pupil size. Psychophysiology, 6(2), 115-121.
Simpson, H. M., & Molloy, F. M. (1971). Effects of audience anxiety on pupil size. Psychophysiology, 8(4), 491-496.
Stanners, R. F., & Headley, D. B. (1972). Pupil size and instructional set in recognition and recall. Psychophysiology, 9(5), 505-511.
49 Real-time Prediction of User Performance based on Pupillary Assessment via Eye Tracking
Volume 10 Issue 1
Stanovich, K. E., & West, R. F. (2000). Individual differences in reasoning: Implications for the rationality debate. Behavioral and Brain Sciences, 23(5), 645-665.
Stassen, H. G., Johannsen, G, & Moray, N. (1990). Internal representation, internal model, human performance model and mental workload. Automatica, 26(4), 811-820.
Steinfeld, A., Fong, T., Kaber, D., Lewis, M., Scholtz, J., Schultz, A., & Goodrich, M. (2006). Common metrics for human-robot interaction. In Proceedings of the 1st ACM SIGCHI/SIGART Conference on Human-Robot Interaction (pp. 33-40).
Steinhauer, S. R., Condray, R., & Kasparek, A. (2000). Cognitive modulation of midbrain function: Task-induced reduction of the pupillary light reflex. International Journal of Psychophysiology, 39(1), 21-30.
Steinhauer, S. R., Siegle, G. J., Condray, R., & Pless, M. (2004). Sympathetic and parasympathetic innervation of pupillary dilation during sustained processing. International Journal of Psychophysiology, 52(1), 77-86.
Stone, R. T., & Wei, C.-S. (2011). Exploring the linkage between facial expression and mental workload for arithmetic tasks. In Proceedings of the Human Factors and Ergonomics Society Annual Meeting, 55(1), 616-619.
Sweller, J. (1988). Cognitive load during problem solving: Effects on learning. Cognitive Science, 12(2), 257-285.
Sweller, J., van Merrienboer, J. J. G., & Paas, F. G. W. C. (1998). Cognitive architecture and instructional design. Educational Psychology Review, 10(3), 251-296.
Tanaka, M., Ishii, A., & Watanabe, Y. (2015). Effects of mental fatigue on brain activity and cognitive performance: A magnetoencephalography study. Anatomy & Physiology, 5(S4), 1-5.
Tarafdar, M., Tu, Q., & Ragu-Nathan, T. S. (2010). Impact of technostress on end-user satisfaction and performance. Journal of Management Information Systems, 27(3), 303-334.
van der Heijden, H. (2004). User acceptance of hedonic information systems. Management Information Systems Quarterly, 28(4), 695-704.
Van Gerven, P. W. M., Paas, F., Van Merriënboer, J. J. G., & Schmidt, H. G. (2004). Memory load and the cognitive pupillary response in aging. Psychophysiology, 41(2), 167-174.
Verney, S. P., Granholm, E., & Dionisio, D. P. (2001). Pupillary responses and processing resources on the visual backward masking task. Psychophysiology, 38(1), 76-83.
Vogt, J., Hagemann, T., & Kastner, M. (2006). The impact of workload on heart rate and blood pressure in en-route and tower air traffic control. Journal of Psychophysiology, 20(4), 297-314.
vom Brocke, J., & Liang, T.-P. (2014). Guidelines for neuroscience studies in information systems research. Journal of Management Information Systems, 30(4), 211-234.
vom Brocke, J., Simons, A., Niehaves, B., Riemer, K., Plattfaut R., & Cleven, A. (2009). Reconstructing the giant: On the importance of rigour in documenting the literature search process. In Proceedings of the 17th European Conference on Information Systems (pp. 2206-2217).
Vroom, V. H. (1964). Work and motivation. New York: Wiley.
Wang, W., Gwizdka, J., & Chaovalitwongse, W. A. (2016). Using wireless EEG signals to assess memory workload in the n-back task. IEEE Transactions on Human-Machine Systems, 46(3), 424-435.
Wang, Y. J., & Minor, M. S. (2008). Validity, reliability, and applicability of psychophysiological techniques in marketing research. Psychology & Marketing, 25(2), 197-232.
Wang, W., Li, Z., Wang, Y, & Chen, F. (2013). Indexing cognitive workload based on pupillary response under luminance and emotional changes. In Proceedings of the 18th International Conference on Intelligent User Interfaces (pp. 247-256).
Wastell, D. G. (1999). Learning dysfunctions in information systems development: Overcoming the social defenses with transitional objects. MIS Quarterly, 23(4), 581-600.

Transactions on Human-Computer Interaction 50
Volume 10 Issue 1
Weber, B., Neurauter, M., Pinggera, J., Zugal, S., Furtner, M., Martini, M., & Sachse, P. (2015). Measuring cognitive load during process model creation. In Proceedings of the Gmunden Retreat on NeuroIS (pp. 129-136).
Webb, E. J., & Campbell, D. T, Schwartz, R. D, & Sechrest, L. (2000). Unobtrusive measures. Thousand Oaks, CA: Sage.
Wheeler, A. R., Harris, K. J., & Sablynski, C. J. (2012). How do employees invest abundant resources? The mediating role of work effort in the job-embeddedness/job-performance relationship. Journal of Applied Social Psychology, 42(S1), E244-E266.
Wilson, G. F. (2002). An analysis of mental workload in pilots during flight using multiple psychophysiological measures. The International Journal of Aviation Psychology, 12(1), 3-18.
Xie, B., & Salvendy, G. (2000). Prediction of mental workload in single and multiple task environments. International Journal of Cognitive Ergonomics, 4(3), 213-242.
Xu, J., Wang, Y., Chen, F., & Choi, E. (2011). Pupillary response based cognitive workload measurement under luminance changes. In Proceedings of the 13th IFIP TCI3 Conference on Human-Computer Interaction (pp. 178-185).
Young, L. R., & Sheena, D. (1975). Survey of eye movement recording methods. Behavior Research Methods & Instrumentation, 7(5), 397-429.
Zhang, J., Sokal, I., Peskind, E. R., Quinn, J. F., Jankovic, J., Kenney, C., Chung, K. A., Millard, S. P., Nutt, J. G., & Montine, T. J. (2008). CSF multianalyte profile distinguishes Alzheimer and Parkinson diseases. American Journal of Clinical Pathology, 129(4), 526-529.
Zhang, P., Li, N., Scialdone, M. J., & Carey, J. (2009). The intellectual advancement of human-computer interaction research: A critical assessment of the MIS literature (1990-2008). AIS Transactions on Human-Computer Interaction, 1(3), 55-107
Zhou, J., Sun, J., Chen, F., Wang, Y., Taib, R., Khawaji, A., & Li, Z. (2015). Measurable decision making with GSR and pupillary analysis for intelligent user interface. ACM Transactions on Computer-Human Interaction, 21(6), 1-23.

51 Real-time Prediction of User Performance based on Pupillary Assessment via Eye Tracking
Volume 10 Issue 1
Appendix: Additional Materials The following figures show the distribution of missing values (Figure A1), the distribution of pupil diameter standard deviation (Figure A2), and the time series on the pupil diameter standard deviation (Figure A3). The vertical lines denote the median.
Figure A1. Distribution of Missing Values (Left Panel: Compressed Data with 1,000 Measurement Points;
Right Panel: Raw Data)
Figure A2. Distribution of Pupil Diameter Standard Deviation for Left Eye (Left) and Right Eye (Right)

Transactions on Human-Computer Interaction 52
Volume 10 Issue 1
Figure A3. Time Series on the Pupil Diameter Standard Deviation (Y-axis) for the 1,000 Measurement Points
(X-axis)
Figure A4 shows pupil diameter time series for raw data and z-normalized data. As one can see in the left panels, the raw data clearly differentiates the group that scored 1 from the rest (the group that scored 0 comprised only three people and should be interpreted with caution). Interestingly, the right eye appeared to outperform the left eye due possibly to light influx in the experimental setup. Compressing the data based on the mean (as opposed to the median) appears to lead to a better separation of the score groups. On the other side, the z-normalized data do not differentiate the groups as clearly as the raw data models do.
Figure A4. Pupil Diameter Time Series for Raw Data and Z-normalized Data (Left vs. Right Panels) and for
Median vs. Mean Aggregated Data (Upper vs. Lower Panels)
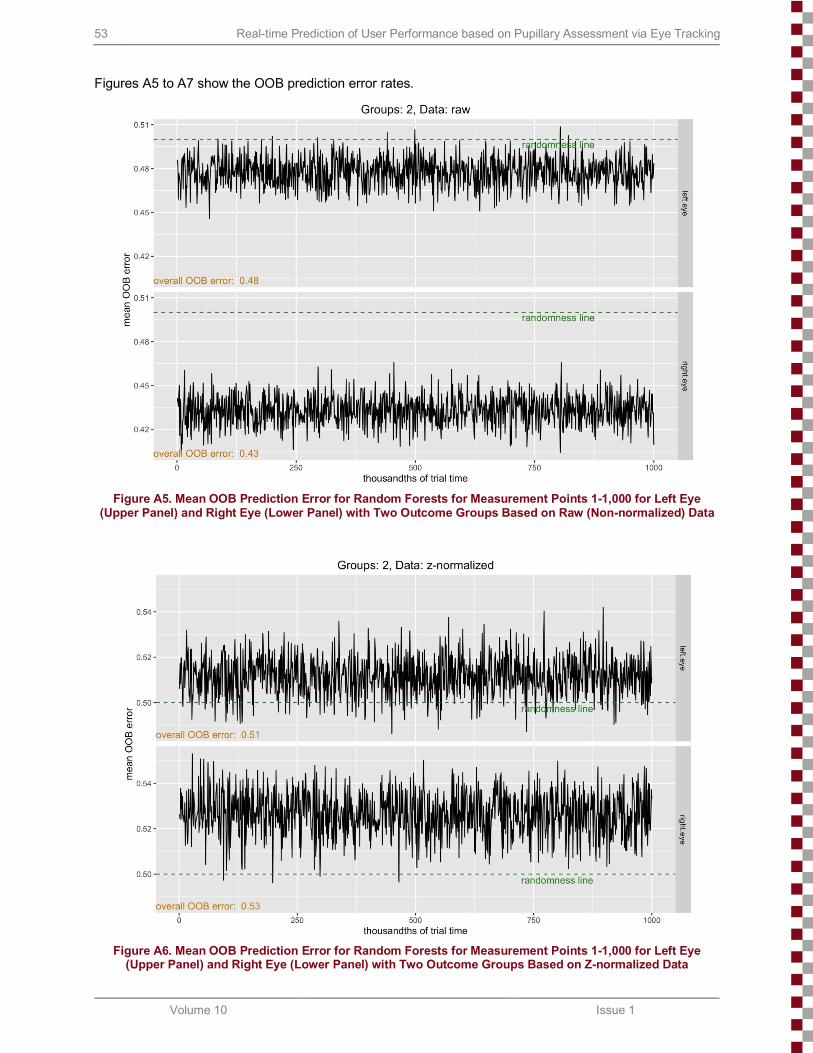
53 Real-time Prediction of User Performance based on Pupillary Assessment via Eye Tracking
Volume 10 Issue 1
Figures A5 to A7 show the OOB prediction error rates.
Figure A5. Mean OOB Prediction Error for Random Forests for Measurement Points 1-1,000 for Left Eye
(Upper Panel) and Right Eye (Lower Panel) with Two Outcome Groups Based on Raw (Non-normalized) Data
Figure A6. Mean OOB Prediction Error for Random Forests for Measurement Points 1-1,000 for Left Eye
(Upper Panel) and Right Eye (Lower Panel) with Two Outcome Groups Based on Z-normalized Data

Transactions on Human-Computer Interaction 54
Volume 10 Issue 1
Figure A7. Mean OOB Prediction Error for Random Forests for Measurement Points 1-1,000 for Left Eye
(Upper Panel) and Right Eye (Lower Panel) Based on Z-normalized Data
Figure A8 shows the confusion matrices for OOB cases in percentages. The panels depict five percent, 10 percent, 25 percent, 50 percent, and 100 percent of trial time (from left to right). Bold text shows the mean OOB classification error. Stronger tones show the correct classification rate.
Figure A8. Confusion Matrices for OOB Cases in Percentages (Class 1: “Low Scorers”; Class 2: “High
Scorers”)

55 Real-time Prediction of User Performance based on Pupillary Assessment via Eye Tracking
Volume 10 Issue 1
About the Authors Ricardo Buettner is a professor of Data Science at Aalen University. He studied Computer Science (Dipl.-Inf.), Industrial Engineering and Management (Dipl.-Wirtsch.-Ing.), and Business Administration (Dipl.-Kfm.) and received his PhD in Information Systems from Hohenheim University. After nine years working with the BMW Group, with experience in the fields of Finance/Controlling, Marketing, Strategy, R&D and HR, Ricardo joined the FOM University of Applied Sciences in 2009 before he moved to Aalen University in 2017. Ricardo published his work in Electronic Markets, Personality and Individual Differences, European Journal of Psychological Assessment and numerous information systems conference proceedings. He is a member of the German Academic Association for Business Research (VHB), the Scientific Committee on Information Systems within the VHB (WKWI), the Association for Information Systems (AIS), and the German Computer Society (GI).
Sebastian Sauer is a professor at FOM University of Applied Sciences in Nuremberg. His research interests include predictive modeling, psychoinformatics and political psychology. He is a proponent of open science, Bayesian methods, and couch philosophy. He blogs his current thinking at https://data-se.netlify.com/, and tweets about thoughts in progress (@sauer_sebastian).
Christian Maier is an assistant professor at the University of Bamberg, Germany. His research on IS usage, technostress, social media, E-HRM, IT workforce, and enterprise content management has been published in several conference proceedings and scientific journals including European Journal of Information Systems, Information Systems Journal, Journal of Strategic Information Systems and Journal of Information Technology. His research has been awarded with best paper awards, such as the ACM SIGMIS Magid Igbaria Outstanding Conference Paper Award, and the honorable Schmalenbach prize for young researchers.
Andreas Eckhardt is a professor at the German Graduate School of Management & Law in Heilbronn. His research on technology adoption, behavioral security, digital innovation management, and computer personnel-related issues has been published in two books, several conference proceedings, and numerous scientific journals including Journal of Information Technology, Journal of Strategic Information Systems, European Journal of Information Systems, MIS Quarterly Executive, Information & Management, Employee Relations, and Business & Information Systems Engineering.
Copyright © 2018 by the Association for Information Systems. Permission to make digital or hard copies of all or part of this work for personal or classroom use is granted without fee provided that copies are not made or distributed for profit or commercial advantage and that copies bear this notice and full citation on the first page. Copyright for components of this work owned by others than the Association for Information Systems must be honored. Abstracting with credit is permitted. To copy otherwise, to republish, to post on servers, or to redistribute to lists requires prior specific permission and/or fee. Request permission to publish from: AIS Administrative Office, P.O. Box 2712 Atlanta, GA, 30301-2712 Attn: Reprints or via e-mail from [email protected].
Transactions on Human-Computer Interaction 56
Volume 10 Issue 1
1.1 Editors-in-Chief http://thci.aisnet.org/ Dennis Galletta, U. of Pittsburgh, USA Paul Benjamin Lowry, U. of Hong Kong, China
1.2 Advisory Board Izak Benbasat U. of British Columbia, Canada
John M. Carroll Penn State U., USA
Phillip Ein-Dor Tel-Aviv U., Israel
Jenny Preece U. of Maryland, USA
Gavriel Salvendy, Purdue U., USA, & Tsinghua U., China
Ben Shneiderman U. of Maryland, USA
Joe Valacich U of Arizona, USA
Jane Webster Queen's U., Canada
K.K. Wei City U. of Hong Kong, China
Ping Zhang Syracuse University USA
1.3 Senior Editor Board Torkil Clemmensen Copenhagen Business School, Denmark
Fred Davis U. of Arkansas, USA
Traci Hess U. of Massachusetts Amherst, USA
Shuk Ying (Susanna) Ho Australian National U., Australia
Jinwoo Kim Yonsei University, Korea
Eleanor Loiacono Worcester Polytechnic Institute, USA
Anne Massey U. of Wisconsin - Madison, USA
Fiona Fui-Hoon Nah Missouri University of Science and Technology, USA
Lorne Olfman Claremont Graduate U., USA
Kar Yan Tam Hong Kong U. of Science & Technology, China
Dov Te'eni Tel-Aviv U., Israel
Jason Thatcher Clemson University, USA
Noam Tractinsky Ben-Gurion U. of the Negev, Israel
Viswanath Venkatesh U. of Arkansas, USA
Susan Wiedenbeck Drexel University, USA
Mun Yi Korea Advanced Institute of Science & Technology, Korea
1.4 Editorial Board Miguel Aguirre-Urreta DePaul U., USA
Michel Avital Copenhagen Business School, Denmark
Hock Chuan Chan National U. of Singapore, Singapore
Christy M.K. Cheung Hong Kong Baptist University, China
Michael Davern U. of Melbourne, Australia
Carina de Villiers U. of Pretoria, South Africa
Alexandra Durcikova U. of Oklahoma, USA
Xiaowen Fang DePaul University
Matt Germonprez U. of Wisconsin Eau Claire, USA
Jennifer Gerow Virginia Military Institute, USA
Suparna Goswami Technische U.München, Germany
Khaled Hassanein McMaster U., Canada
Milena Head McMaster U., Canada
Netta Iivari Oulu U., Finland
Zhenhui Jack Jiang National U. of Singapore, Singapore
Richard Johnson SUNY at Albany, USA
Weiling Ke Clarkson U., USA
Sherrie Komiak Memorial U. of Newfoundland, Canada
Na Li Baker College, USA
Ji-Ye Mao Renmin U., China
Scott McCoy College of William and Mary, USA
Gregory D. Moody U. of Nevada Las Vegas, USA
Robert F. Otondo Mississippi State U., USA
Lingyun Qiu Peking U., China
Sheizaf Rafaeli U. of Haifa, Israel
Rene Riedl Johannes Kepler U. Linz, Austria
Khawaja Saeed Wichita State U., USA
Shu Schiller Wright State U., USA
Hong Sheng Missouri U. of Science and Technology, USA
Stefan Smolnik U. of Hagen, Germany
Jeff Stanton Syracuse U., USA
Heshan Sun Clemson University, USA
Horst Treiblmaier Vienna U. of Business Admin.& Economics, Austria
Ozgur Turetken Ryerson U., Canada
Fahri Yetim U. of Siegen, Germany
Cheng Zhang Fudan U., China
Meiyun Zuo Renmin U., China
1.5 Managing Editor Gregory D. Moody, U. of Nevada Las Vegas, USA
1.6 SIGHCI Chairs 2001-2004: Ping Zhang 2004-2005: Fiona Fui-Hoon Nah 2005-2006: Scott McCoy 2006-2007: Traci Hess
2007-2008: Weiyin Hong 2008-2009: Eleanor Loiacono 2009-2010: Khawaja Saeed 2010-2011: Dezhi Wu
2011-2012: Dianne Cyr 2012-2013: Soussan Djamasbi 2013-2015: Na Li 2015-2016: Miguel Aguirre-Urreta
2016-2017: Jack Jiang 2017-2018: Gabe Lee 2018-2019: Gregory D. Moody