real-value and confidence prediction of protein … · outperforms the existing state-of-art method...
TRANSCRIPT
Real-value and confidence prediction of protein
backbone dihedral angles through a hybrid
method of clustering and deep learning
Yujuan Gao1,2, Sheng Wang2, Minghua Deng1,3,4∗, Jinbo Xu2∗
December 19, 2017
1 Center for Quantitative Biology, Peking University, Beijing, China2 Toyota Technological Institute at Chicago, Chicago, Illinois, United States ofAmerica3 School of Mathematical Sciences, Peking University, Beijing, China4 Center for Statistical Sciences, Peking University, Beijing, China
Abstract
Background. Protein dihedral angles provide a detailed descriptionof protein local conformation. Predicted dihedral angles can be used tonarrow down the conformational space of the whole polypeptide chainsignificantly, thus aiding protein tertiary structure prediction. However,direct angle prediction from sequence alone is challenging.
Method. In this study, we present a novel method to predict real-valued angles by combining clustering and deep learning. That is, we firstgenerate certain clusters of angles (each assigned a label) and then applya deep residual neural network to predict the label posterior probability.Finally, we output real-valued prediction by a mixture of the clusterswith their predicted probabilities. At the same time, we also estimate thebound of the prediction errors at each residue from the predicted labelprobabilities.
Result. In this article, we present a novel method (named RaptorX-Angle) to predict real-valued angles by combining clustering and deeplearning. Tested on a subset of PDB25 and the targets in the latest twoCritical Assessment of protein Structure Prediction (CASP), our methodoutperforms the existing state-of-art method SPIDER2 in terms of Pear-son Correlation Coefficient (PCC) and Mean Absolute Error (MAE). Ourresult also shows approximately linear relationship between the real pre-diction errors and our estimated bounds. That is, the real prediction errorcan be well approximated by our estimated bounds.
Conclusions. Our study provides an alternative and more accurateprediction of dihedral angles, which may facilitate protein structure pre-diction and functional study.
∗Corresponding authors
1
.CC-BY-NC-ND 4.0 International licenseIt is made available under a (which was not peer-reviewed) is the author/funder, who has granted bioRxiv a license to display the preprint in perpetuity.
The copyright holder for this preprint. http://dx.doi.org/10.1101/236851doi: bioRxiv preprint first posted online Dec. 20, 2017;
1 Introduction
It has been shown that sequences contain rich information for protein tertiarystructure prediction as well as functional study [1, 2]. But it is challengingto directly predict tertiary structure from primary sequence, so the hierarchi-cal approach has been widely accepted as one of the most efficient methods.That means to transform the ultimate goal into several sub-problems, such assecondary structure prediction, solvent accessibility prediction, residue-residuecontact prediction, etc. [3] reviewed the progress in the field of intermediatestate or one-dimensional property prediction. It has been shown that predictedsecondary structure is useful in the prediction of disordered and flexible regions,fold recognition and function prediction. However, secondary structure statesare described as discrete classes and there is no clear boundary between coiland helical/strand states. It is a significant step towards establishing the struc-ture and function of a protein to predict local conformation of the polypeptidechain. The local structural bias information restricts the possible conformationsof a sequence segment and therefore narrows down the conformation space ofthe whole polypeptide chain significantly. Thus, prediction of dihedral angles isespecially useful for protein tertiary structure prediction.
On the whole, dihedral angle prediction may benefit protein tertiary struc-ture prediction in several aspects. Firstly, dihedral angle prediction may act assubstitute or supplement for secondary structure prediction [4, 5, 6]. Secondly,It can be used in generation of sequence/structure alignment. For one thing,it can be directly applied to structure alignment methods based on dihedralangles [7, 8] and may aid refinement of target-template structure alignment.For another, considering predicted angles to refine multiple sequence alignmentmay narrow the gap between sequence and structure alignment, thus aiding denovo prediction of structural properties. In addition, dihedral angle predictionmay also find applications in protein structure prediction that includes but notlimits to fold recognition approaches [9, 10], fragment-free tertiary structureprediction [11], tertiary structure refinement and structure quality assessment[12] and functional study, such as ligand-binding site prediction [13].
There are mainly two kinds of problems in dihedral angle prediction: angleregion prediction and real value prediction, which corresponds to two differentrepresentations of protein backbone local structural bias.
Initially, Ramachandran basin is an intuitive description of local structuralbias [14]. A Ramachandran basin is a specific region of a Ramachandran plotand illustrates the preference of torsion angle values. Each angle pair can beassigned a basin label. With more basins, the assignment would be harder butthe representation would be more accurate and vice versa. Colubri et al. testedthe ability to recover the native structure from a given basin assignment for eachresidue to investigate the level of representation required to simulate folding andpredict structure, resulting in five basins [15]. Gong et al. partitioned φ, ψ-spaceinto a uniform grid of 36 squares, each 60◦ × 60◦, thus resulting in 36 basins,and showed that they successfully reconstructed six proteins solely from theirmesostate (basin label) sequences [16]. There are also some other methods
2
.CC-BY-NC-ND 4.0 International licenseIt is made available under a (which was not peer-reviewed) is the author/funder, who has granted bioRxiv a license to display the preprint in perpetuity.
The copyright holder for this preprint. http://dx.doi.org/10.1101/236851doi: bioRxiv preprint first posted online Dec. 20, 2017;

to define basins and do angle region prediction with different definitions ofbasins [17, 18, 19, 20]. Although it is vital to determine the proper numberof regions and clearly define the boundary, a universal algorithm to generateRamachandran basins and assign basin labels remains to be developed. In ourstudy, k-means clustering serves as the basin generator and label assigner.
While Ramachandran basin provides an overall description of conformation,it is a coarse-grained representation and lacks statistical explanations describingthe torsion angle distributions of each basin. In consideration of the circularnature of angles, traditional parametric or non-parametric density estimationmethods cannot work properly to approximate Ramachandran distributions.Fortunately, directional distributions such as von Mises distribution could solvethe problem [21]. Bivariate von Mises distribution (mixtures) has been used tomodel protein dihedral angle distribution [22, 23], which removes arbitrarinessin defining the boundary between discrete states. In this study, we assumeangle pairs in each basin follow a bivariate von Mises distribution to derive thelog-likelihood of each clustering.
Thanks to the rapid growth of Protein Data Bank and computational andalgorithmic development in machine learning (especially deep learning), severalsupervised machine learning methods have been proposed to predict real valuesof dihedral angles. As φ values in α-helices and β-sheets are quite similar, ψseems more informative. Wood et al. first developed a method DESTRUCT forprediction of real-valued dihedral angle ψ and used this information for predic-tion of the protein secondary structure with high accuracy [4]. Wu et al.proposeda composite machine-learning algorithm called ANGLOR to predict real-valueprotein backbone torsion angles from protein sequences [24]. The input fea-tures of ANGLOR include sequence profiles, predicted secondary structure andsolvent accessibility. The mean absolute error (MAE) of the φ/ψ predictionwas reported to be 28◦/46◦. Later Song et al. developed TANGLE based on atwo-level support vector regression approach using a variety of features derivedfrom amino acid sequences, including the evolutionary profiles and natively dis-ordered region as well as other global sequence features [25]. The MAE of theφ/ψ was 27.8◦/44.6◦. Xue et al. established a neural network method calledReal-SPINE, with sequence profiles generated from multiple sequence alignmentand predicted secondary structures as inputs [26]. In 2015, they presented SPI-DER2 [27] by improving SPIDER [28] through iterative learning, which useda deep artificial neural network (ANN) with three hidden layers of 150 nodes.They fed the predicted torsion angles of last layer as the input to the followinggeneration and reported 19◦ and 30◦ for mean absolute errors of backbone φand ψ angles, respectively. As it is impossible to introduce all methods here,interested readers can refer to excellent reviews [29, 30].
Although there has been tremendous development, their performance is stilllimited by their shallow architectures. Inspired by the excellent performanceof convolution neural network in predicting secondary structure [31] and or-der/disorder regions [32] and also the success of residual framework to do con-tact prediction [33], we adopt the ultra deep residual framework of convolutionalneural network to do k-means basin label probability prediction.
3
.CC-BY-NC-ND 4.0 International licenseIt is made available under a (which was not peer-reviewed) is the author/funder, who has granted bioRxiv a license to display the preprint in perpetuity.
The copyright holder for this preprint. http://dx.doi.org/10.1101/236851doi: bioRxiv preprint first posted online Dec. 20, 2017;
However, even though a protein backbone conformation can be highly accu-rately rebuilt from its respective native dihedral angles, accumulation of errorsin predicted angles can lead to large deviation in three-dimensional structures,which prevents angle prediction from its direct use in building protein struc-tures [27]. It is of great significance to produce the corresponding confidencescores for the real value predictions, i.e., we need to know the confidence level ofthe predictions. Otherwise the effect of predicted dihedral angles as restraintsfor three dimensional structure prediction would be limited [34]. Zhou et al.had developed SPIDER2 [27] to predict real-valued angles and then separatelySPIDER2-Delta [35] to predict error of those predicted structural properties.Here we describe a simple hybrid technique to predict angles and confidencescores simultaneously.
Another problem that need to be considered is the periodicity of angles. Forexample, if an angle θ = 179◦ is predicted to be −179◦, the error would betreated as 358◦ instead of 2◦. There are some approaches proposed to reducethe impact of cyclic nature of angles. One was angle shifting to reduce confusionat 0◦ and 360◦ (or −180◦ and 180◦), e.g., shifting ψ by 100◦ and φ by −10◦ [26]or adding 100◦ to the angles between −100◦ and 180◦ and adding 460◦ to theangles between −180◦ and −100◦ [34]. But the improvement was limited andstrongly depended on the angle range. For amino acids such as alanine thathad minimal residues in the affected range, angle shifting made little difference[29]. A better choice was to take advantage of the inherent angle periodicityof trigonometric functions, that is, mapping the angles to their sine and cosinevalues [27], which has achieved best performance so far. Inspired by this, wedeal with equivalent trigonometric representations of dihedral angle pairs, ratherthan real value angles.
Considering dihedral angles share similar patterns in alpha helix and betastrand, the acceptable (φ, ψ) patterns are limited. Moreover, it is much eas-ier to do classification than regression. Also indebted to mixture models andExpectation-maximization algorithm, we develop a hybrid method of k-meansclustering and deep learning to do angle prediction, combining advantages of dis-crete and continuous representation of dihedral angles. Specifically, we firstlygenerate a set of clusters of (φ, ψ) from training data, in which we could get thedistribution of each cluster; then we use deep learning methods to predict dis-crete labels; lastly we predict real value angles by mixing empirical clusters withtheir predicted probabilities. We employ a residual framework of convolutionalneuron network in RaptorX-Angle to predict the cluster label probabilities. Wetest our method on filtered PDB25 dataset as well as CASP (Critical Assess-ment of protein Structure Prediction) targets and compare with other threestate-of-art methods. Tested on the subset of PDB25, our method gains about0.5◦ and 1.4◦ for φ and ψ better MAE than SPIDER2, currently among the bestbackbone angle predictors. Our method also performs better than SPIDER2 onthe CASP11 and CASP12 test targets. The advantage is even more obviouswhen looking into detailed secondary structural regions.
4
.CC-BY-NC-ND 4.0 International licenseIt is made available under a (which was not peer-reviewed) is the author/funder, who has granted bioRxiv a license to display the preprint in perpetuity.
The copyright holder for this preprint. http://dx.doi.org/10.1101/236851doi: bioRxiv preprint first posted online Dec. 20, 2017;
2 Methods
2.1 K-means clustering of angle vectors
Genearating k-means “centers” from angle vectors. For a dihedral an-gle pair (φ, ψ), we can equivalently denote it by an angle vector
v = (cos(φ), sin(φ), cos(ψ), sin(ψ)).
Conversely, given the vector representation v, we can easily derive the corre-sponding angles φ and ψ (Supplementary Material S1.1). We run k-means on an-gle vectors to cluster dihedral angle pairs in training set into K = 10, 20, . . . , 100clusters. Then we normalize the K centres {Ck}Kk=1 and get the final “centers”
{Ck = (ck0, ck1, ck2, ck3)}Kk=1, so that each “centre” Ck is a valid representationfor some angle pair (Supplementary Material S1.2).
Predicting “true” labels from k-means. Given the K normalised vector“centres” {Ck}Kk=1, we could assign the “true” label for each dihedral angle pairas the one whose corresponding normalised centre was closest to its respectivevector representation. Then the “true” labels can be used as the training labelsto build a deep learning model as a classifier to predict labels for testing data.
2.2 Deep learning model details
Deep Convolutional Neural Network (DCNN). DCNN consists of mul-tiple convolutional blocks. A convolutional block is a neural network that im-plements a composite of linear convolution and nonlinear activation transfor-mation. Convolution is used in place of general matrix multiplication, whichcan better capture local dependency. It has been widely accepted that proteintorsion angles strongly depend on neighbour residues [36, 37, 38]. So DCNN isideal to abstract angle information from sequence.
Residual Network (ResNet). DCNN can integrate features in hierarchicallevels and some work has shown the significance of depth [39]. However, with thedepth increasing, accuracy gets saturated and even degraded. That is becauseadding more layers may lead to higher training error as identity mapping isdifficult to fit with a stack of nonlinear layers [40]. ResNet was proposed as aresidual learning framework to ease the training of substantially deeper networks[41]. Figure 1 demonstrates the basic architecture of ResNet in RaptorX-Angle.Figure 1(A) is a residual block, which consists of 2 convolution layers and 2activation layers, and the ResNet consists of stacked residual blocks (Figure1B). The activation layer conducts a simple nonlinear transformation of itsinput depending on the activation function with no additional parameters. Inthis work, we used the ReLU activation function [42].
5
.CC-BY-NC-ND 4.0 International licenseIt is made available under a (which was not peer-reviewed) is the author/funder, who has granted bioRxiv a license to display the preprint in perpetuity.
The copyright holder for this preprint. http://dx.doi.org/10.1101/236851doi: bioRxiv preprint first posted online Dec. 20, 2017;

Figure 1: Illustration of the ResNet model in RaptorX-Angle. (A) A buildingblock of ResNet with xi and xi+1 being input and output, respectively. (B)The ResNet model architecture as a classifier with stacked residual blocks anda logistic regression layer. Here L is the sequence length of the protein or totalnumber of residues under prediction and K is the number of clusters.
6
.CC-BY-NC-ND 4.0 International licenseIt is made available under a (which was not peer-reviewed) is the author/funder, who has granted bioRxiv a license to display the preprint in perpetuity.
The copyright holder for this preprint. http://dx.doi.org/10.1101/236851doi: bioRxiv preprint first posted online Dec. 20, 2017;
Logistic Regression layer. DCNN and ResNet can capture informationfrom data and output abstract features. To do classification for residues, alogistic regression layer is added as the final layer in RaptorX-Angle, whichcould output the marginal probability of K labels (Figure 1(B)).
Loss function. We train model parameters through maximizing the proba-bility of angle pairs belong to the “true” labels. Naturally, the loss function isdefined as the negative log-likelihood averaged over all residues of the trainingproteins.
Regularization and optimization. As is widely used in machine learning,the log-likelihood objective function is penalized with a L2-norm of the modelparameters to prevent overfitting. Thus, the final objective function has twoitems: loss function and regularization item, with a regularization factor λ tobalance the two items. That is, the final objective function is:
maxθ
logPθ(Y |X)− λ‖θ‖2
where X is the input features, Y is the output labels, θ is the model parametersand λ is the regularization factor used to balance the log likelihood and regu-larization. We use Adam [43] to minimize the objective function, which usuallycan converge within 20 epochs. The whole algorithm has been implemented byTheano [44] and mainly run on a GPU card.
Input features. For each residue in each protein sequence, we generate a to-tal of 66 input features, of which 20 from position specific scoring matrix(PSSM)of PSI-BLAST [45], 20 from position-specific frequency matrix (PSFM) of HH-pred [46, 47], 20 from primary sequence, 3 from predicted solvent accessibility(ACC) and 3 from predicted secondary structure(SS) probabilities (Supplemen-tary Material S1.3).
2.3 Predicting real-value angles from predicted marginalprobability
From the last logistic regression layer of the deep learning model, we couldpredict the marginal probability P = (p1, p2, . . . , pK) of an angle pair for eachlabel. We use the marginal probability rather than the single predicted label toreduce bias. Concretely, we calculate the weighted mean by:
v = (v0, v1, v2, v3) =K∑k=1
pkCk,
Finally, we normalise v to get
cos(φ) =v0√
v02 + v12, sin(φ) =
v1√v02 + v12
,
7
.CC-BY-NC-ND 4.0 International licenseIt is made available under a (which was not peer-reviewed) is the author/funder, who has granted bioRxiv a license to display the preprint in perpetuity.
The copyright holder for this preprint. http://dx.doi.org/10.1101/236851doi: bioRxiv preprint first posted online Dec. 20, 2017;
cos(ψ) =v2√
v22 + v32, sin(ψ) =
v3√v22 + v32
.
and we could derive the predicted real values φ, ψ from this angle vector (Sup-plementary Material S1.1). We also tried to predict real-value angles from labelswith top R(R < K) probabilities when K is well chosen (Supplementary Mate-rial S2.3).
2.4 Programs to compare and evaluation metrics
We compare our method with three available standalone softwares SPIDER2[27], SPINE X [11], and ANGLOR [24]. All the programs are run with param-eters suggested in their respective papers.
We evaluate the performance by Pearson Correlation Coefficient (PCC) andMean Absolute Error (MAE) as described by [48], for assessing the prediction ofφ/ψ angles. Considering the periodicity of angles, PCC is calculated between thecosine (sine) values of predicted and experimentally determined angles. MAEis the average absolute difference between predicted and experimentally deter-mined angles. The periodicity of an angle has been taken care of by utilizingthe smaller value of the absolute difference d(= |θpred − θexp|) and 360 − d foraverage, where θpred is the predicted angle and θexp is the true angle value.
3 Results
3.1 Datasets
We use the targets from PDB25 updated in February, 2016. The set consistsof 10820 non-redundant protein chains, in which any two chains share no morethan 25% sequence identity. To remove impact of disordered regions, we filterout proteins with internal disordered regions by DSSP [49]. Finally we get 7604proteins. We then randomly select 5070 proteins as the candidate training set,1267 as validation set (VL1267, see VL1267 list.txt) and the remaining 1267as test set (TS1267, see TS1267 .txt). We also test on 85 CASP11 targets(see casp11 list.txt) and the latest 40 CASP12 targets (see casp12 list.txt) withpublicly released native structures. To remove redundancy between trainingproteins and CASP targets, we run MMseqs2 [50], which is similar but moresensitive and faster than BLAST (PSI-BLAST) for protein sequence homologysearch, with seqID cutoff 0.25 and also E-value cutoff 0.001 to filter 5070 thecandidate training proteins, resulting in 5046 training proteins (TR5046, seeTR5046 list.txt).
3.2 Choosing a proper number of clusters
A vital problem is how to select the number of clusters, which can be reducedto defining measures for clustering evaluation. Here we adopt two measures:(i) entropy loss based on discrete distribution; (ii) loglikelihood based on con-tinuous distribution to evaluate 10 different clusterings (K = 10, 20, . . . , 100).
8
.CC-BY-NC-ND 4.0 International licenseIt is made available under a (which was not peer-reviewed) is the author/funder, who has granted bioRxiv a license to display the preprint in perpetuity.
The copyright holder for this preprint. http://dx.doi.org/10.1101/236851doi: bioRxiv preprint first posted online Dec. 20, 2017;
Firstly, we do k-means clustering on TR5046 and get K empirical clusters.Secondly, we train the deep learning models and do classification on VL1267,then we can obtain the predicted marginal probability of the K clusters Pi =(pi1, pi2, . . . , piK), i = 1, 2, . . . , N , where i is the index of residue and N is thetotal number of residues in VL1267.
Entropy loss. Entropy H(·) is always used to measure the information of adistribution. From k-means clustering on TR5046, the background distributionamong clusters P0 = (p01, p02, . . . , p0K) could be derived. Then the entropy lossof this clustering on VL1267 can be calculated as the mean difference betweenentropy of background distribution and predicted marginal distribution:
EL =1
N
N∑i=1
(H(P0)−H(Pi))
=1
N
N∑i=1
(K∑k=1
p0k log(p0k)−K∑k=1
pik log(pik))
which can roughly evaluate the information gain from the clustering. Here Nis the number of residues in VL1267.
Loglikelihood. To demonstrate the detailed information of each cluster, weneed a continuous angular(circular) distribution defined on the torus. Mixturebivariate von Mises distributions are successfully used to describe the local biasof torsion angle pair (φ, ψ) [21, 22, 23], we assume that angle pairs belong tothe same cluster k obey a common bivariate von Mises distribution fk withparameters Θk = (κk1 , κ
k2 , κ
k3 , µ
k, νk). Here,
fk(φ, ψ) = c(κk1 , κk2 , κ
k3) exp{κk1 cos(φ− µk)
+κk2 cos(ψ − νk) + κk3 cos(φ− µk − ψ + νk)}
where µk and νk are the mean value of φ and ψ, respectively; κk1 , κk2 are
the concentrations, κk3 allows for the dependency between the two angles andc(κk1 , κ
k2 , κ
k3) is a normalization constant:
c(κk1 , κk2 , κ
k3) = (2π)2
{I0(κk1)I0(κk2)I0(κk3) + 2
∞∑p=1
Ip(κk1)Ip(κ
k2)Ip(κ
k3)}
in which Ip(κ) is the modified Bessel function of the first kind and order p.Parameters {Θk = (κk1 , κ
k2 , κ
k3 , µ
k, νk)}Kk=1 can be intuitively estimated from theempirical clusters {(φ, ψ)k}Kk=1 [51]. Then the density function for the torsionangle pair (φ, ψ) can be approximately described as:
f(φ, ψ) =
K∑k=1
pkfk(φ, ψ)
9
.CC-BY-NC-ND 4.0 International licenseIt is made available under a (which was not peer-reviewed) is the author/funder, who has granted bioRxiv a license to display the preprint in perpetuity.
The copyright holder for this preprint. http://dx.doi.org/10.1101/236851doi: bioRxiv preprint first posted online Dec. 20, 2017;
10 20 30 40 50 60 70 80 90 100n_clusters
0.55
0.56
0.57
0.58
0.59
0.60
0.61
0.62
0.63
0.64Entropy_loss for 10 clusterings
10 20 30 40 50 60 70 80 90 100n_clusters
−0.225
−0.220
−0.215
−0.210
−0.205
−0.200
−0.195
−0.190
−0.185Loglikelihood for 10 clusterings
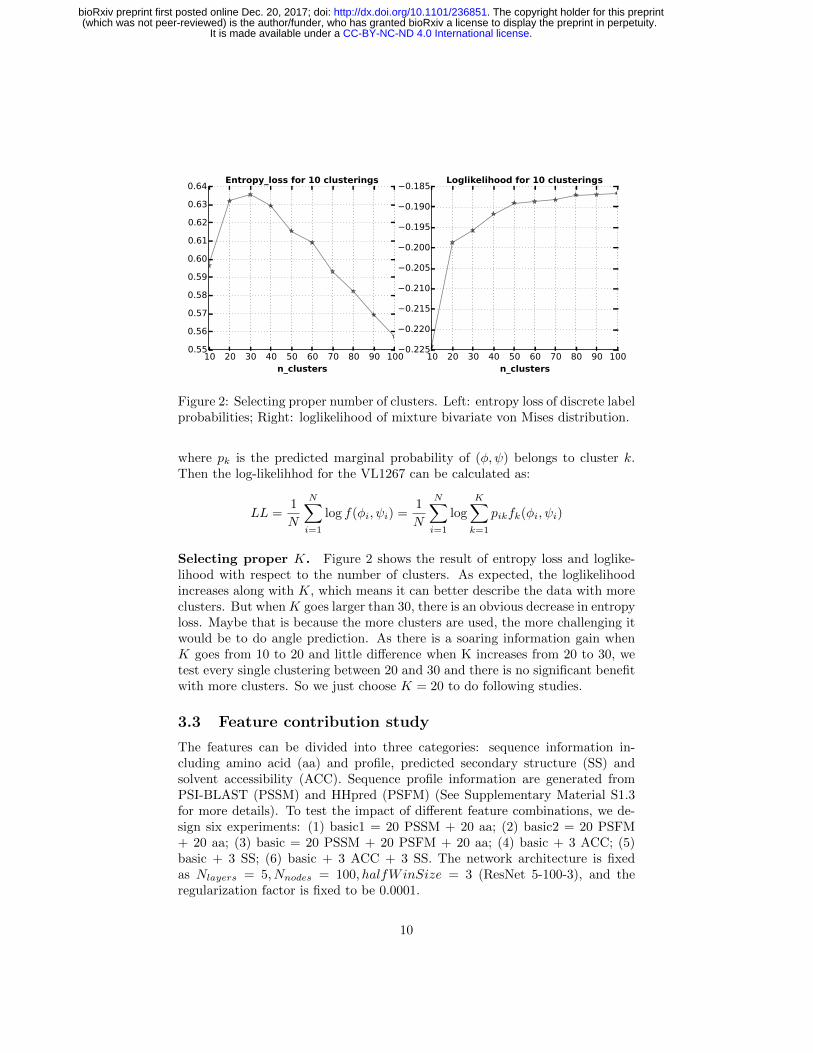
Figure 2: Selecting proper number of clusters. Left: entropy loss of discrete labelprobabilities; Right: loglikelihood of mixture bivariate von Mises distribution.
where pk is the predicted marginal probability of (φ, ψ) belongs to cluster k.Then the log-likelihhod for the VL1267 can be calculated as:
LL =1
N
N∑i=1
log f(φi, ψi) =1
N
N∑i=1
logK∑k=1
pikfk(φi, ψi)
Selecting proper K. Figure 2 shows the result of entropy loss and loglike-lihood with respect to the number of clusters. As expected, the loglikelihoodincreases along with K, which means it can better describe the data with moreclusters. But whenK goes larger than 30, there is an obvious decrease in entropyloss. Maybe that is because the more clusters are used, the more challenging itwould be to do angle prediction. As there is a soaring information gain whenK goes from 10 to 20 and little difference when K increases from 20 to 30, wetest every single clustering between 20 and 30 and there is no significant benefitwith more clusters. So we just choose K = 20 to do following studies.
3.3 Feature contribution study
The features can be divided into three categories: sequence information in-cluding amino acid (aa) and profile, predicted secondary structure (SS) andsolvent accessibility (ACC). Sequence profile information are generated fromPSI-BLAST (PSSM) and HHpred (PSFM) (See Supplementary Material S1.3for more details). To test the impact of different feature combinations, we de-sign six experiments: (1) basic1 = 20 PSSM + 20 aa; (2) basic2 = 20 PSFM+ 20 aa; (3) basic = 20 PSSM + 20 PSFM + 20 aa; (4) basic + 3 ACC; (5)basic + 3 SS; (6) basic + 3 ACC + 3 SS. The network architecture is fixedas Nlayers = 5, Nnodes = 100, halfWinSize = 3 (ResNet 5-100-3), and theregularization factor is fixed to be 0.0001.
10
.CC-BY-NC-ND 4.0 International licenseIt is made available under a (which was not peer-reviewed) is the author/funder, who has granted bioRxiv a license to display the preprint in perpetuity.
The copyright holder for this preprint. http://dx.doi.org/10.1101/236851doi: bioRxiv preprint first posted online Dec. 20, 2017;
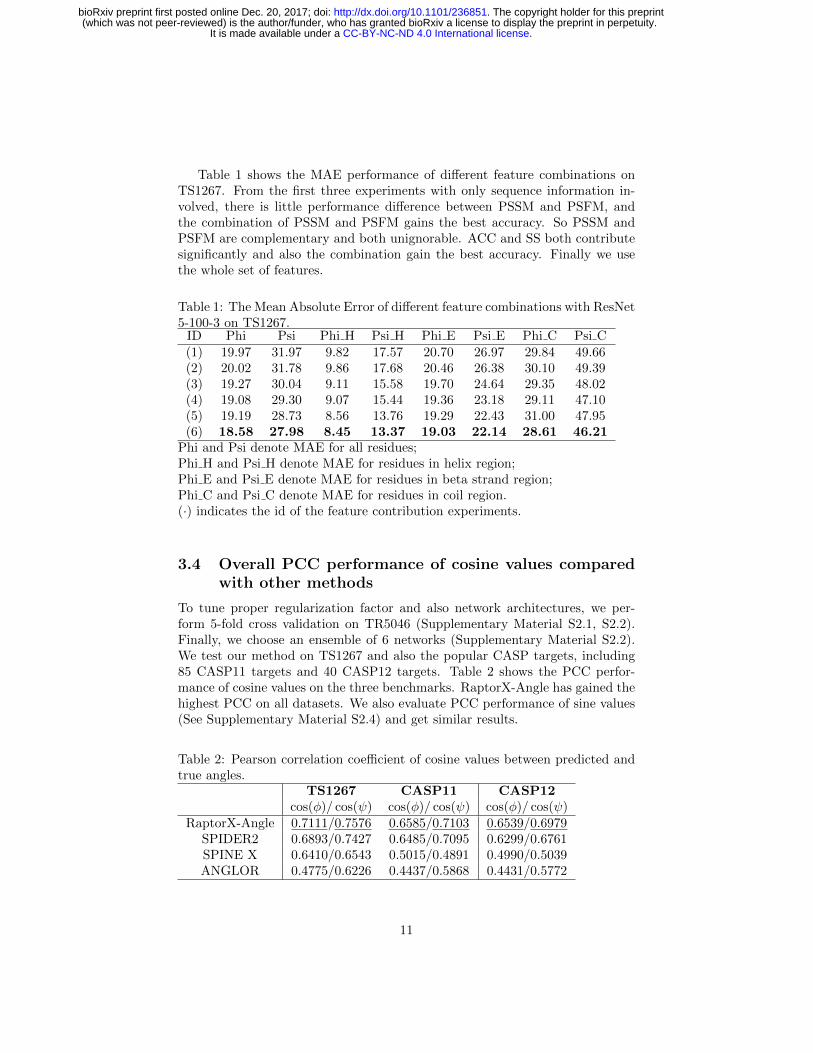
Table 1 shows the MAE performance of different feature combinations onTS1267. From the first three experiments with only sequence information in-volved, there is little performance difference between PSSM and PSFM, andthe combination of PSSM and PSFM gains the best accuracy. So PSSM andPSFM are complementary and both unignorable. ACC and SS both contributesignificantly and also the combination gain the best accuracy. Finally we usethe whole set of features.
Table 1: The Mean Absolute Error of different feature combinations with ResNet5-100-3 on TS1267.
ID Phi Psi Phi H Psi H Phi E Psi E Phi C Psi C(1) 19.97 31.97 9.82 17.57 20.70 26.97 29.84 49.66(2) 20.02 31.78 9.86 17.68 20.46 26.38 30.10 49.39(3) 19.27 30.04 9.11 15.58 19.70 24.64 29.35 48.02(4) 19.08 29.30 9.07 15.44 19.36 23.18 29.11 47.10(5) 19.19 28.73 8.56 13.76 19.29 22.43 31.00 47.95(6) 18.58 27.98 8.45 13.37 19.03 22.14 28.61 46.21
Phi and Psi denote MAE for all residues;Phi H and Psi H denote MAE for residues in helix region;Phi E and Psi E denote MAE for residues in beta strand region;Phi C and Psi C denote MAE for residues in coil region.(·) indicates the id of the feature contribution experiments.
3.4 Overall PCC performance of cosine values comparedwith other methods
To tune proper regularization factor and also network architectures, we per-form 5-fold cross validation on TR5046 (Supplementary Material S2.1, S2.2).Finally, we choose an ensemble of 6 networks (Supplementary Material S2.2).We test our method on TS1267 and also the popular CASP targets, including85 CASP11 targets and 40 CASP12 targets. Table 2 shows the PCC perfor-mance of cosine values on the three benchmarks. RaptorX-Angle has gained thehighest PCC on all datasets. We also evaluate PCC performance of sine values(See Supplementary Material S2.4) and get similar results.
Table 2: Pearson correlation coefficient of cosine values between predicted andtrue angles.
TS1267 CASP11 CASP12cos(φ)/ cos(ψ) cos(φ)/ cos(ψ) cos(φ)/ cos(ψ)
RaptorX-Angle 0.7111/0.7576 0.6585/0.7103 0.6539/0.6979SPIDER2 0.6893/0.7427 0.6485/0.7095 0.6299/0.6761SPINE X 0.6410/0.6543 0.5015/0.4891 0.4990/0.5039ANGLOR 0.4775/0.6226 0.4437/0.5868 0.4431/0.5772
11
.CC-BY-NC-ND 4.0 International licenseIt is made available under a (which was not peer-reviewed) is the author/funder, who has granted bioRxiv a license to display the preprint in perpetuity.
The copyright holder for this preprint. http://dx.doi.org/10.1101/236851doi: bioRxiv preprint first posted online Dec. 20, 2017;
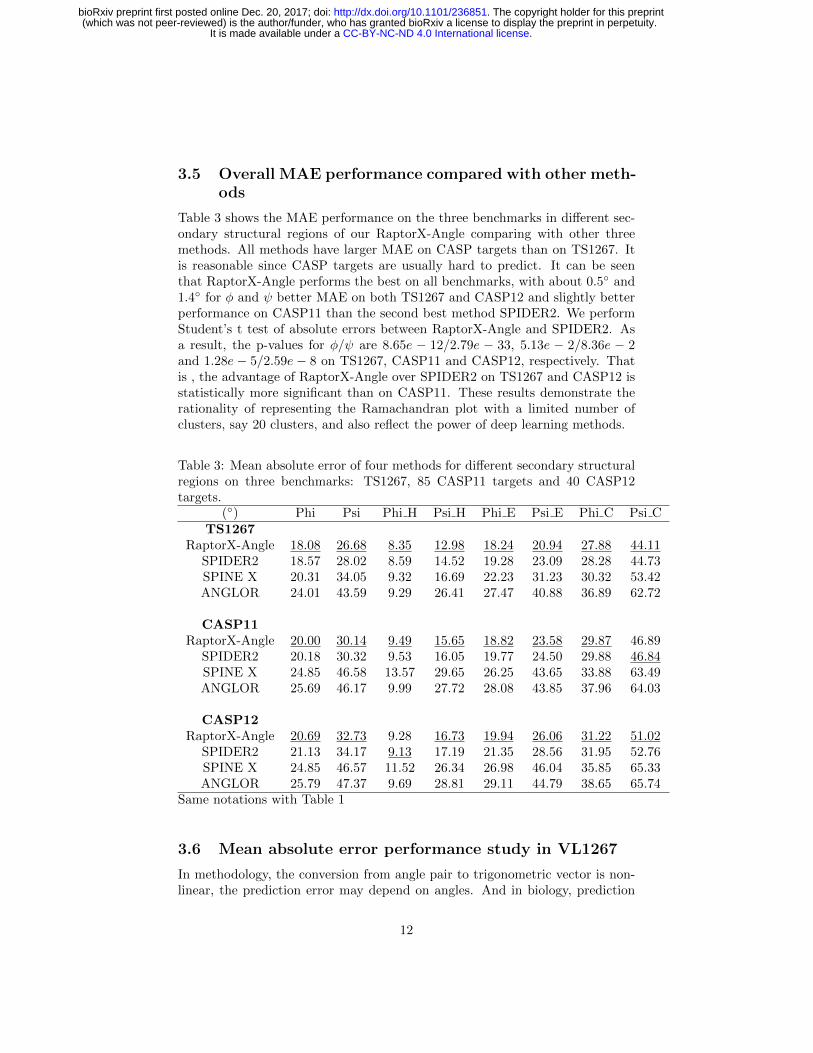
3.5 Overall MAE performance compared with other meth-ods
Table 3 shows the MAE performance on the three benchmarks in different sec-ondary structural regions of our RaptorX-Angle comparing with other threemethods. All methods have larger MAE on CASP targets than on TS1267. Itis reasonable since CASP targets are usually hard to predict. It can be seenthat RaptorX-Angle performs the best on all benchmarks, with about 0.5◦ and1.4◦ for φ and ψ better MAE on both TS1267 and CASP12 and slightly betterperformance on CASP11 than the second best method SPIDER2. We performStudent’s t test of absolute errors between RaptorX-Angle and SPIDER2. Asa result, the p-values for φ/ψ are 8.65e − 12/2.79e − 33, 5.13e − 2/8.36e − 2and 1.28e − 5/2.59e − 8 on TS1267, CASP11 and CASP12, respectively. Thatis , the advantage of RaptorX-Angle over SPIDER2 on TS1267 and CASP12 isstatistically more significant than on CASP11. These results demonstrate therationality of representing the Ramachandran plot with a limited number ofclusters, say 20 clusters, and also reflect the power of deep learning methods.
Table 3: Mean absolute error of four methods for different secondary structuralregions on three benchmarks: TS1267, 85 CASP11 targets and 40 CASP12targets.
(◦) Phi Psi Phi H Psi H Phi E Psi E Phi C Psi CTS1267
RaptorX-Angle 18.08 26.68 8.35 12.98 18.24 20.94 27.88 44.11SPIDER2 18.57 28.02 8.59 14.52 19.28 23.09 28.28 44.73SPINE X 20.31 34.05 9.32 16.69 22.23 31.23 30.32 53.42ANGLOR 24.01 43.59 9.29 26.41 27.47 40.88 36.89 62.72
CASP11RaptorX-Angle 20.00 30.14 9.49 15.65 18.82 23.58 29.87 46.89
SPIDER2 20.18 30.32 9.53 16.05 19.77 24.50 29.88 46.84SPINE X 24.85 46.58 13.57 29.65 26.25 43.65 33.88 63.49ANGLOR 25.69 46.17 9.99 27.72 28.08 43.85 37.96 64.03
CASP12RaptorX-Angle 20.69 32.73 9.28 16.73 19.94 26.06 31.22 51.02
SPIDER2 21.13 34.17 9.13 17.19 21.35 28.56 31.95 52.76SPINE X 24.85 46.57 11.52 26.34 26.98 46.04 35.85 65.33ANGLOR 25.79 47.37 9.69 28.81 29.11 44.79 38.65 65.74
Same notations with Table 1
3.6 Mean absolute error performance study in VL1267
In methodology, the conversion from angle pair to trigonometric vector is non-linear, the prediction error may depend on angles. And in biology, prediction
12
.CC-BY-NC-ND 4.0 International licenseIt is made available under a (which was not peer-reviewed) is the author/funder, who has granted bioRxiv a license to display the preprint in perpetuity.
The copyright holder for this preprint. http://dx.doi.org/10.1101/236851doi: bioRxiv preprint first posted online Dec. 20, 2017;
−150−100 −50 0 50 100 150φ
−150
−100
−50
0
50
100
150
ψ
0
1
2
3 4
5
6
7
8
9
10
11
1213
1415
16
17
1819
0 5 10 15 20cluster
0
10
20
30
40
50
60
70
80
Mean Absolute Error
Phi
psi
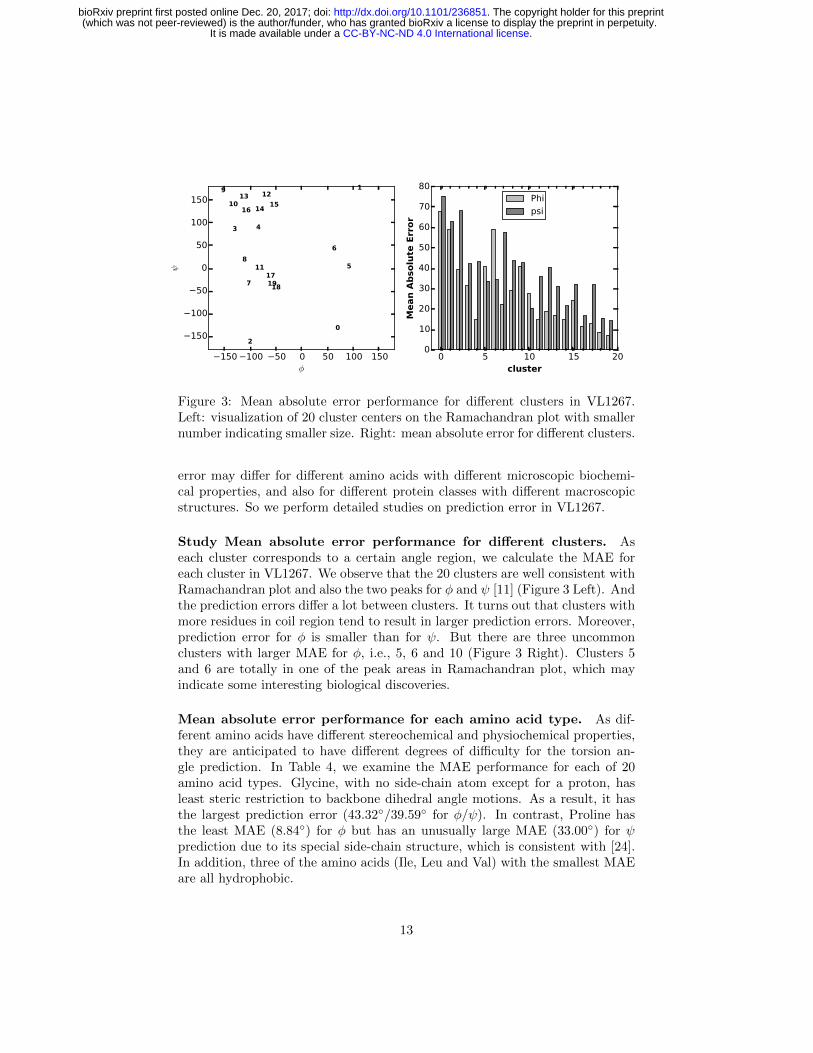
Figure 3: Mean absolute error performance for different clusters in VL1267.Left: visualization of 20 cluster centers on the Ramachandran plot with smallernumber indicating smaller size. Right: mean absolute error for different clusters.
error may differ for different amino acids with different microscopic biochemi-cal properties, and also for different protein classes with different macroscopicstructures. So we perform detailed studies on prediction error in VL1267.
Study Mean absolute error performance for different clusters. Aseach cluster corresponds to a certain angle region, we calculate the MAE foreach cluster in VL1267. We observe that the 20 clusters are well consistent withRamachandran plot and also the two peaks for φ and ψ [11] (Figure 3 Left). Andthe prediction errors differ a lot between clusters. It turns out that clusters withmore residues in coil region tend to result in larger prediction errors. Moreover,prediction error for φ is smaller than for ψ. But there are three uncommonclusters with larger MAE for φ, i.e., 5, 6 and 10 (Figure 3 Right). Clusters 5and 6 are totally in one of the peak areas in Ramachandran plot, which mayindicate some interesting biological discoveries.
Mean absolute error performance for each amino acid type. As dif-ferent amino acids have different stereochemical and physiochemical properties,they are anticipated to have different degrees of difficulty for the torsion an-gle prediction. In Table 4, we examine the MAE performance for each of 20amino acid types. Glycine, with no side-chain atom except for a proton, hasleast steric restriction to backbone dihedral angle motions. As a result, it hasthe largest prediction error (43.32◦/39.59◦ for φ/ψ). In contrast, Proline hasthe least MAE (8.84◦) for φ but has an unusually large MAE (33.00◦) for ψprediction due to its special side-chain structure, which is consistent with [24].In addition, three of the amino acids (Ile, Leu and Val) with the smallest MAEare all hydrophobic.
13
.CC-BY-NC-ND 4.0 International licenseIt is made available under a (which was not peer-reviewed) is the author/funder, who has granted bioRxiv a license to display the preprint in perpetuity.
The copyright holder for this preprint. http://dx.doi.org/10.1101/236851doi: bioRxiv preprint first posted online Dec. 20, 2017;
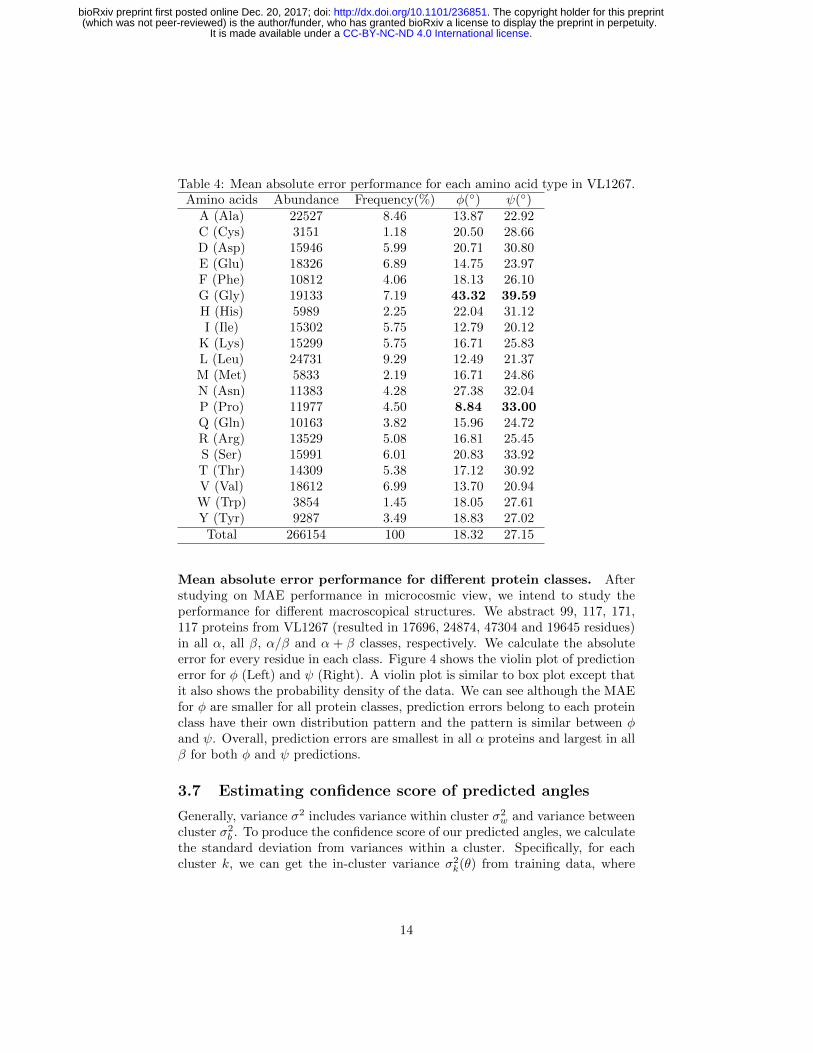
Table 4: Mean absolute error performance for each amino acid type in VL1267.Amino acids Abundance Frequency(%) φ(◦) ψ(◦)
A (Ala) 22527 8.46 13.87 22.92C (Cys) 3151 1.18 20.50 28.66D (Asp) 15946 5.99 20.71 30.80E (Glu) 18326 6.89 14.75 23.97F (Phe) 10812 4.06 18.13 26.10G (Gly) 19133 7.19 43.32 39.59H (His) 5989 2.25 22.04 31.12I (Ile) 15302 5.75 12.79 20.12
K (Lys) 15299 5.75 16.71 25.83L (Leu) 24731 9.29 12.49 21.37M (Met) 5833 2.19 16.71 24.86N (Asn) 11383 4.28 27.38 32.04P (Pro) 11977 4.50 8.84 33.00Q (Gln) 10163 3.82 15.96 24.72R (Arg) 13529 5.08 16.81 25.45S (Ser) 15991 6.01 20.83 33.92T (Thr) 14309 5.38 17.12 30.92V (Val) 18612 6.99 13.70 20.94W (Trp) 3854 1.45 18.05 27.61Y (Tyr) 9287 3.49 18.83 27.02
Total 266154 100 18.32 27.15
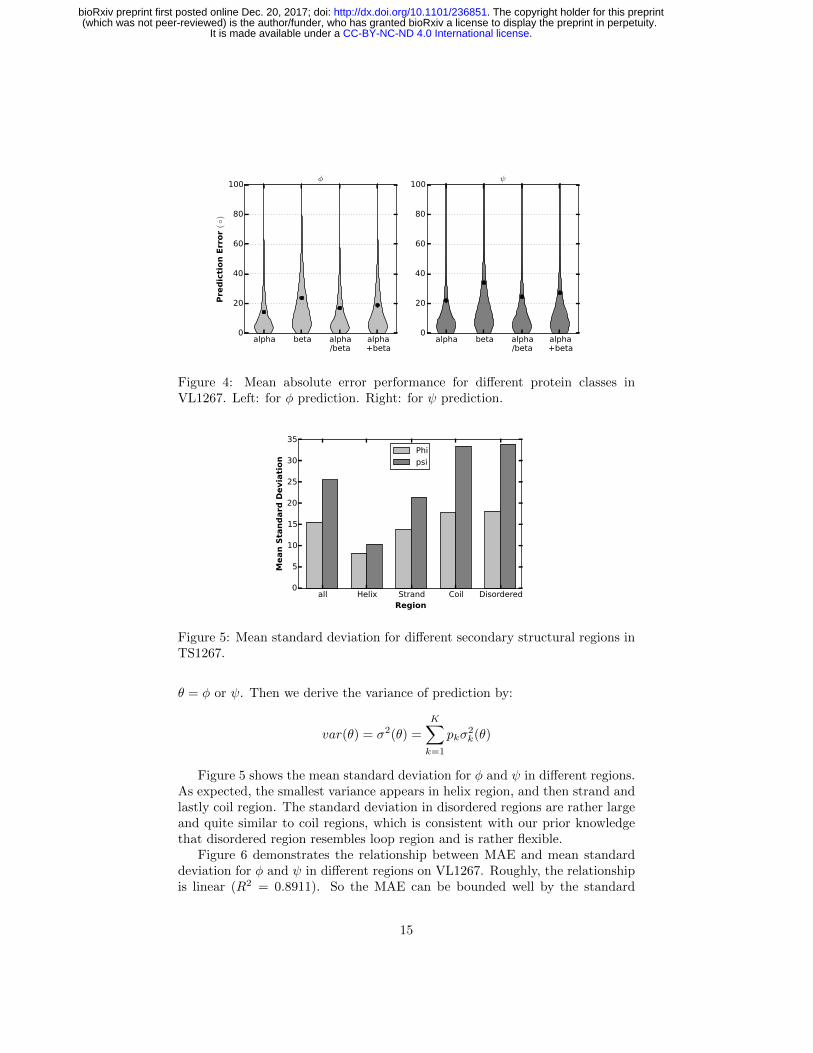
Mean absolute error performance for different protein classes. Afterstudying on MAE performance in microcosmic view, we intend to study theperformance for different macroscopical structures. We abstract 99, 117, 171,117 proteins from VL1267 (resulted in 17696, 24874, 47304 and 19645 residues)in all α, all β, α/β and α + β classes, respectively. We calculate the absoluteerror for every residue in each class. Figure 4 shows the violin plot of predictionerror for φ (Left) and ψ (Right). A violin plot is similar to box plot except thatit also shows the probability density of the data. We can see although the MAEfor φ are smaller for all protein classes, prediction errors belong to each proteinclass have their own distribution pattern and the pattern is similar between φand ψ. Overall, prediction errors are smallest in all α proteins and largest in allβ for both φ and ψ predictions.
3.7 Estimating confidence score of predicted angles
Generally, variance σ2 includes variance within cluster σ2w and variance between
cluster σ2b . To produce the confidence score of our predicted angles, we calculate
the standard deviation from variances within a cluster. Specifically, for eachcluster k, we can get the in-cluster variance σ2
k(θ) from training data, where
14
.CC-BY-NC-ND 4.0 International licenseIt is made available under a (which was not peer-reviewed) is the author/funder, who has granted bioRxiv a license to display the preprint in perpetuity.
The copyright holder for this preprint. http://dx.doi.org/10.1101/236851doi: bioRxiv preprint first posted online Dec. 20, 2017;
alpha beta alpha/beta
alpha+beta
0
20
40
60
80
100
Prediction Error
(◦)
φ
alpha beta alpha/beta
alpha+beta
0
20
40
60
80
100ψ
Figure 4: Mean absolute error performance for different protein classes inVL1267. Left: for φ prediction. Right: for ψ prediction.
all Helix Strand Coil DisorderedRegion
0
5
10
15
20
25
30
35
Mean Standard Deviation
Phi
psi
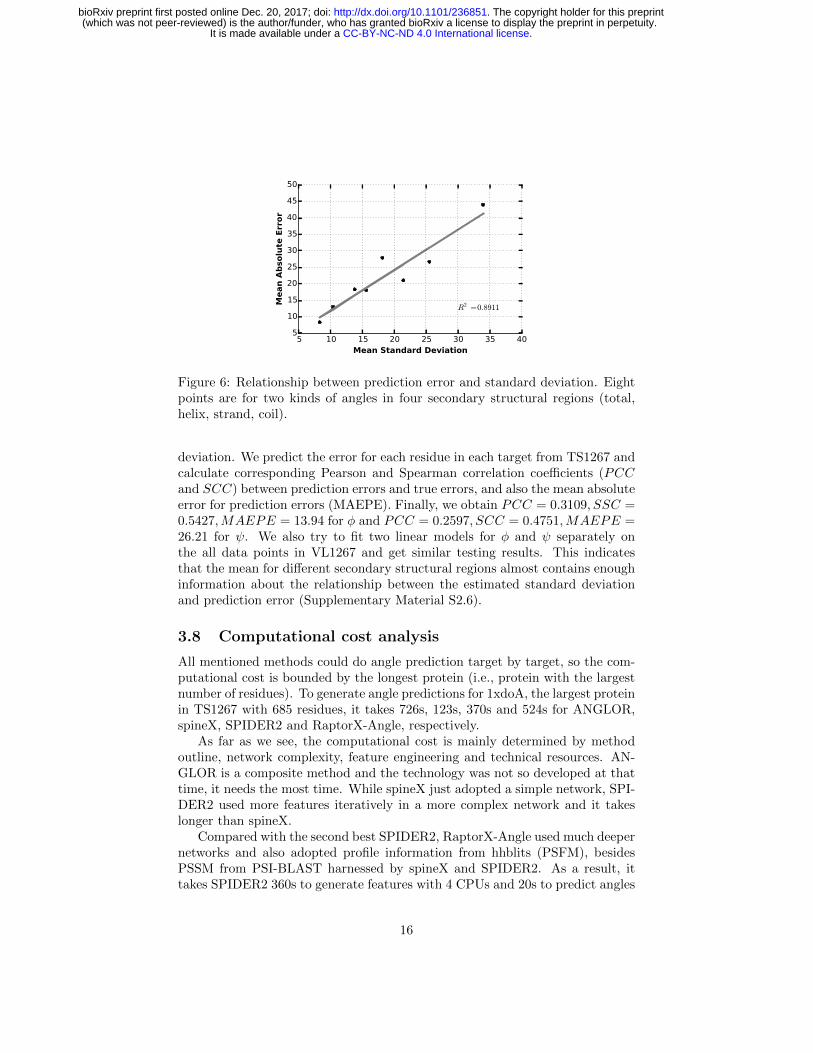
Figure 5: Mean standard deviation for different secondary structural regions inTS1267.
θ = φ or ψ. Then we derive the variance of prediction by:
var(θ) = σ2(θ) =K∑k=1
pkσ2k(θ)
Figure 5 shows the mean standard deviation for φ and ψ in different regions.As expected, the smallest variance appears in helix region, and then strand andlastly coil region. The standard deviation in disordered regions are rather largeand quite similar to coil regions, which is consistent with our prior knowledgethat disordered region resembles loop region and is rather flexible.
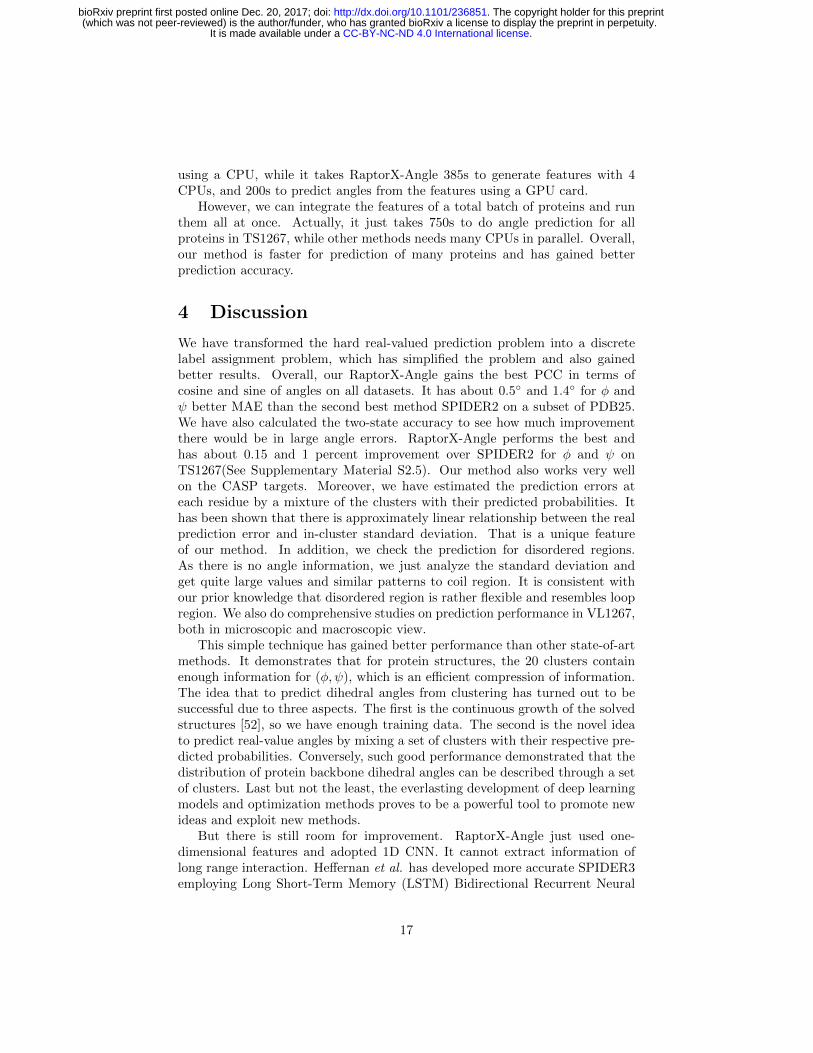
Figure 6 demonstrates the relationship between MAE and mean standarddeviation for φ and ψ in different regions on VL1267. Roughly, the relationshipis linear (R2 = 0.8911). So the MAE can be bounded well by the standard
15
.CC-BY-NC-ND 4.0 International licenseIt is made available under a (which was not peer-reviewed) is the author/funder, who has granted bioRxiv a license to display the preprint in perpetuity.
The copyright holder for this preprint. http://dx.doi.org/10.1101/236851doi: bioRxiv preprint first posted online Dec. 20, 2017;
5 10 15 20 25 30 35 40Mean Standard Deviation
5
10
15
20
25
30
35
40
45
50
Mean Absolute Error
R2 =0.8911
Figure 6: Relationship between prediction error and standard deviation. Eightpoints are for two kinds of angles in four secondary structural regions (total,helix, strand, coil).
deviation. We predict the error for each residue in each target from TS1267 andcalculate corresponding Pearson and Spearman correlation coefficients (PCCand SCC) between prediction errors and true errors, and also the mean absoluteerror for prediction errors (MAEPE). Finally, we obtain PCC = 0.3109, SSC =0.5427,MAEPE = 13.94 for φ and PCC = 0.2597, SCC = 0.4751,MAEPE =26.21 for ψ. We also try to fit two linear models for φ and ψ separately onthe all data points in VL1267 and get similar testing results. This indicatesthat the mean for different secondary structural regions almost contains enoughinformation about the relationship between the estimated standard deviationand prediction error (Supplementary Material S2.6).
3.8 Computational cost analysis
All mentioned methods could do angle prediction target by target, so the com-putational cost is bounded by the longest protein (i.e., protein with the largestnumber of residues). To generate angle predictions for 1xdoA, the largest proteinin TS1267 with 685 residues, it takes 726s, 123s, 370s and 524s for ANGLOR,spineX, SPIDER2 and RaptorX-Angle, respectively.
As far as we see, the computational cost is mainly determined by methodoutline, network complexity, feature engineering and technical resources. AN-GLOR is a composite method and the technology was not so developed at thattime, it needs the most time. While spineX just adopted a simple network, SPI-DER2 used more features iteratively in a more complex network and it takeslonger than spineX.
Compared with the second best SPIDER2, RaptorX-Angle used much deepernetworks and also adopted profile information from hhblits (PSFM), besidesPSSM from PSI-BLAST harnessed by spineX and SPIDER2. As a result, ittakes SPIDER2 360s to generate features with 4 CPUs and 20s to predict angles
16
.CC-BY-NC-ND 4.0 International licenseIt is made available under a (which was not peer-reviewed) is the author/funder, who has granted bioRxiv a license to display the preprint in perpetuity.
The copyright holder for this preprint. http://dx.doi.org/10.1101/236851doi: bioRxiv preprint first posted online Dec. 20, 2017;
using a CPU, while it takes RaptorX-Angle 385s to generate features with 4CPUs, and 200s to predict angles from the features using a GPU card.
However, we can integrate the features of a total batch of proteins and runthem all at once. Actually, it just takes 750s to do angle prediction for allproteins in TS1267, while other methods needs many CPUs in parallel. Overall,our method is faster for prediction of many proteins and has gained betterprediction accuracy.
4 Discussion
We have transformed the hard real-valued prediction problem into a discretelabel assignment problem, which has simplified the problem and also gainedbetter results. Overall, our RaptorX-Angle gains the best PCC in terms ofcosine and sine of angles on all datasets. It has about 0.5◦ and 1.4◦ for φ andψ better MAE than the second best method SPIDER2 on a subset of PDB25.We have also calculated the two-state accuracy to see how much improvementthere would be in large angle errors. RaptorX-Angle performs the best andhas about 0.15 and 1 percent improvement over SPIDER2 for φ and ψ onTS1267(See Supplementary Material S2.5). Our method also works very wellon the CASP targets. Moreover, we have estimated the prediction errors ateach residue by a mixture of the clusters with their predicted probabilities. Ithas been shown that there is approximately linear relationship between the realprediction error and in-cluster standard deviation. That is a unique featureof our method. In addition, we check the prediction for disordered regions.As there is no angle information, we just analyze the standard deviation andget quite large values and similar patterns to coil region. It is consistent withour prior knowledge that disordered region is rather flexible and resembles loopregion. We also do comprehensive studies on prediction performance in VL1267,both in microscopic and macroscopic view.
This simple technique has gained better performance than other state-of-artmethods. It demonstrates that for protein structures, the 20 clusters containenough information for (φ, ψ), which is an efficient compression of information.The idea that to predict dihedral angles from clustering has turned out to besuccessful due to three aspects. The first is the continuous growth of the solvedstructures [52], so we have enough training data. The second is the novel ideato predict real-value angles by mixing a set of clusters with their respective pre-dicted probabilities. Conversely, such good performance demonstrated that thedistribution of protein backbone dihedral angles can be described through a setof clusters. Last but not the least, the everlasting development of deep learningmodels and optimization methods proves to be a powerful tool to promote newideas and exploit new methods.
But there is still room for improvement. RaptorX-Angle just used one-dimensional features and adopted 1D CNN. It cannot extract information oflong range interaction. Heffernan et al. has developed more accurate SPIDER3employing Long Short-Term Memory (LSTM) Bidirectional Recurrent Neural
17
.CC-BY-NC-ND 4.0 International licenseIt is made available under a (which was not peer-reviewed) is the author/funder, who has granted bioRxiv a license to display the preprint in perpetuity.
The copyright holder for this preprint. http://dx.doi.org/10.1101/236851doi: bioRxiv preprint first posted online Dec. 20, 2017;
Networks (BRNNs), which are capable of capturing long range interactions [53].That is, considering pairwise interaction can further increase prediction accu-racy. We will include two-dimensional features and exploit 2D CNN to see howmuch improvement could be achieved.
Moreover, as mentioned before, accumulation of prediction errors has buriedthe usefulness of torsion angles to construct 3D models. There is a great demandto develop a proper technique to deal with the errors. A general pipeline to addangle restraints and confidence to improve protein tertiary structure predictionneed to be developed.
In conclusion, this study has made a more reliable prediction of dihedral an-gles and may facilitate protein structure prediction and functional study. In thenear future, we can use the angle restraints to do tertiary structure prediction,which should be considered carefully to deal with errors and flexibility. We canalso adopt the angle prediction to aid structure alignment and fold recognition.
Acknowledgements
This work has been partly supported by the National Key Research and De-velopment Program of China(No.2016YFA0502303), the National Key BasicResearch Project of China (No. 2015CB910303), the National Natural ScienceFoundation of China (No.31471246) and China Scholarship Council. It is alsosupported by National Institutes of Health grant R01GM089753 to JX andNational Science Foundation grant DBI-1564955 to JX. The authors are alsograteful to the support of Nvidia Inc.
References
[1] Debora S Marks, Thomas A Hopf, and Chris Sander. Protein structure pre-diction from sequence variation. Nature biotechnology, 30(11):1072–1080,2012.
[2] David De Juan, Florencio Pazos, and Alfonso Valencia. Emerging methodsin protein co-evolution. Nature Reviews Genetics, 14(4):249–261, 2013.
[3] Lukasz Kurgan and Fatemeh Miri Disfani. Structural protein descriptorsin 1-dimension and their sequence-based predictions. Current Protein andPeptide Science, 12(6):470–489, 2011.
[4] Matthew J Wood and Jonathan D Hirst. Protein secondary structure pre-diction with dihedral angles. PROTEINS: Structure, Function, and Bioin-formatics, 59(3):476–481, 2005.
[5] Petros Kountouris and Jonathan D Hirst. Predicting β-turns and theirtypes using predicted backbone dihedral angles and secondary structures.BMC bioinformatics, 11(1):407, 2010.
18
.CC-BY-NC-ND 4.0 International licenseIt is made available under a (which was not peer-reviewed) is the author/funder, who has granted bioRxiv a license to display the preprint in perpetuity.
The copyright holder for this preprint. http://dx.doi.org/10.1101/236851doi: bioRxiv preprint first posted online Dec. 20, 2017;
[6] Eshel Faraggi, Tuo Zhang, Yuedong Yang, Lukasz Kurgan, and Yaoqi Zhou.Spine x: improving protein secondary structure prediction by multisteplearning coupled with prediction of solvent accessible surface area and back-bone torsion angles. Journal of computational chemistry, 33(3):259–267,2012.
[7] Xijiang Miao, Peter J Waddell, and Homayoun Valafar. Tali: local align-ment of protein structures using backbone torsion angles. Journal of bioin-formatics and computational biology, 6(01):163–181, 2008.
[8] S Jung, SE Bae, and HS Son. Validity of protein structure alignmentmethod based on backbone torsion angles. J Proteomics Bioinform, 4:218–226, 2011.
[9] Chao Zhang, Jingtong Hou, and Sung-Hou Kim. Fold prediction of helicalproteins using torsion angle dynamics and predicted restraints. Proceedingsof the National Academy of Sciences, 99(6):3581–3585, 2002.
[10] Wei Zhang, Song Liu, and Yaoqi Zhou. Sp 5: improving protein foldrecognition by using torsion angle profiles and profile-based gap penaltymodel. PloS one, 3(6):e2325, 2008.
[11] Eshel Faraggi, Yuedong Yang, Shesheng Zhang, and Yaoqi Zhou. Predict-ing continuous local structure and the effect of its substitution for sec-ondary structure in fragment-free protein structure prediction. Structure,17(11):1515–1527, 2009.
[12] Gregory E Sims and Sung-Hou Kim. A method for evaluating the struc-tural quality of protein models by using higher-order ϕ–ψ pairs scoring.Proceedings of the National Academy of Sciences of the United States ofAmerica, 103(12):4428–4432, 2006.
[13] Chen Cao and Shutan Xu. Improving the performance of the plb indexfor ligand-binding site prediction using dihedral angles and the solvent-accessible surface area. Scientific Reports, 6, 2016.
[14] GN t Ramachandran and V Sasisekharan. Conformation of polypeptidesand proteins. Advances in protein chemistry, 23:283–437, 1968.
[15] Andres Colubri, Abhishek K Jha, Min-yi Shen, Andrej Sali, R StephenBerry, Tobin R Sosnick, and Karl F Freed. Minimalist representations andthe importance of nearest neighbor effects in protein folding simulations.Journal of molecular biology, 363(4):835–857, 2006.
[16] Haipeng Gong, Patrick J Fleming, and George D Rose. Building nativeprotein conformation from highly approximate backbone torsion angles.Proceedings of the National Academy of Sciences of the United States ofAmerica, 102(45):16227–16232, 2005.
19
.CC-BY-NC-ND 4.0 International licenseIt is made available under a (which was not peer-reviewed) is the author/funder, who has granted bioRxiv a license to display the preprint in perpetuity.
The copyright holder for this preprint. http://dx.doi.org/10.1101/236851doi: bioRxiv preprint first posted online Dec. 20, 2017;
[17] David L Dowe, Lloyd Allison, Trevor I Dix, Lawrence Hunter, Chris SWallace, and Timothy Edgoose. Circular clustering by minimum messagelength of protein dihedral angles. 1995.
[18] Rui Kuang, Christina S Leslie, and An-Suei Yang. Protein backbone angleprediction with machine learning approaches. Bioinformatics, 20(10):1612–1621, 2004.
[19] Olav Zimmermann and Ulrich HE Hansmann. Support vector machinesfor prediction of dihedral angle regions. Bioinformatics, 22(24):3009–3015,2006.
[20] Shesheng Zhang, Shengping Jin, and Bin Xue. Accurate prediction of pro-tein dihedral angles through conditional random field. Frontiers in biology,8(3):353–361, 2013.
[21] Harshinder Singh, Vladimir Hnizdo, and Eugene Demchuk. Probabilisticmodel for two dependent circular variables. Biometrika, pages 719–723,2002.
[22] Kanti V Mardia, Charles C Taylor, and Ganesh K Subramaniam. Proteinbioinformatics and mixtures of bivariate von mises distributions for angulardata. Biometrics, 63(2):505–512, 2007.
[23] Shuai Cheng Li, Dongbo Bu, Jinbo Xu, and Ming Li. Fragment-hmm: A new approach to protein structure prediction. Protein Science,17(11):1925–1934, 2008.
[24] Sitao Wu and Yang Zhang. Anglor: a composite machine-learningalgorithm for protein backbone torsion angle prediction. PLoS One,3(10):e3400, 2008.
[25] Jiangning Song, Hao Tan, Mingjun Wang, Geoffrey I Webb, and TatsuyaAkutsu. Tangle: two-level support vector regression approach for pro-tein backbone torsion angle prediction from primary sequences. PloS one,7(2):e30361, 2012.
[26] Bin Xue, Ofer Dor, Eshel Faraggi, and Yaoqi Zhou. Real-value predictionof backbone torsion angles. Proteins: Structure, Function, and Bioinfor-matics, 72(1):427–433, 2008.
[27] Rhys Heffernan, Kuldip Paliwal, James Lyons, Abdollah Dehzangi, AlokSharma, Jihua Wang, Abdul Sattar, Yuedong Yang, and Yaoqi Zhou. Im-proving prediction of secondary structure, local backbone angles, and sol-vent accessible surface area of proteins by iterative deep learning. Scientificreports, 5, 2015.
[28] James Lyons, Abdollah Dehzangi, Rhys Heffernan, Alok Sharma, KuldipPaliwal, Abdul Sattar, Yaoqi Zhou, and Yuedong Yang. Predicting back-bone cα angles and dihedrals from protein sequences by stacked sparse
20
.CC-BY-NC-ND 4.0 International licenseIt is made available under a (which was not peer-reviewed) is the author/funder, who has granted bioRxiv a license to display the preprint in perpetuity.
The copyright holder for this preprint. http://dx.doi.org/10.1101/236851doi: bioRxiv preprint first posted online Dec. 20, 2017;
auto-encoder deep neural network. Journal of computational chemistry,35(28):2040–2046, 2014.
[29] Harinder Singh, Sandeep Singh, and Gajendra PS Raghava. Evaluation ofprotein dihedral angle prediction methods. PloS one, 9(8):e105667, 2014.
[30] Olav Zimmermann. Backbone dihedral angle prediction. Prediction ofProtein Secondary Structure, pages 65–82, 2017.
[31] Sheng Wang, Jian Peng, Jianzhu Ma, and Jinbo Xu. Protein secondarystructure prediction using deep convolutional neural fields. Scientific re-ports, 6, 2016.
[32] Sheng Wang, Shunyan Weng, Jianzhu Ma, and Qingming Tang. Deepcnf-d:predicting protein order/disorder regions by weighted deep convolutionalneural fields. International journal of molecular sciences, 16(8):17315–17330, 2015.
[33] Sheng Wang, Siqi Sun, Zhen Li, Renyu Zhang, and Jinbo Xu. Accuratede novo prediction of protein contact map by ultra-deep learning model.PLOS Computational Biology, 13(1):e1005324, 2017.
[34] Eshel Faraggi, Bin Xue, and Yaoqi Zhou. Improving the prediction accuracyof residue solvent accessibility and real-value backbone torsion angles ofproteins by guided-learning through a two-layer neural network. Proteins:Structure, Function, and Bioinformatics, 74(4):847–856, 2009.
[35] Jianzhao Gao, Yuedong Yang, and Yaoqi Zhou. Predicting the errors ofpredicted local backbone angles and non-local solvent-accessibilities of pro-teins by deep neural networks. Bioinformatics, 32(24):3768–3773, 2016.
[36] Marcos R Betancourt and Jeffrey Skolnick. Local propensities and statisti-cal potentials of backbone dihedral angles in proteins. Journal of molecularbiology, 342(2):635–649, 2004.
[37] O Keskin, D Yuret, A Gursoy, M Turkay, and B Erman. Relationshipsbetween amino acid sequence and backbone torsion angle preferences. Pro-teins: Structure, Function, and Bioinformatics, 55(4):992–998, 2004.
[38] Abhishek K Jha, Andres Colubri, Muhammad H Zaman, Shohei Koide,Tobin R Sosnick, and Karl F Freed. Helix, sheet, and polyproline ii fre-quencies and strong nearest neighbor effects in a restricted coil library.Biochemistry, 44(28):9691–9702, 2005.
[39] Christian Szegedy, Wei Liu, Yangqing Jia, Pierre Sermanet, Scott Reed,Dragomir Anguelov, Dumitru Erhan, Vincent Vanhoucke, and Andrew Ra-binovich. Going deeper with convolutions. In Proceedings of the IEEEConference on Computer Vision and Pattern Recognition, pages 1–9, 2015.
21
.CC-BY-NC-ND 4.0 International licenseIt is made available under a (which was not peer-reviewed) is the author/funder, who has granted bioRxiv a license to display the preprint in perpetuity.
The copyright holder for this preprint. http://dx.doi.org/10.1101/236851doi: bioRxiv preprint first posted online Dec. 20, 2017;
[40] Rupesh K Srivastava, Klaus Greff, and Jurgen Schmidhuber. Training verydeep networks. In Advances in neural information processing systems, pages2377–2385, 2015.
[41] Kaiming He, Xiangyu Zhang, Shaoqing Ren, and Jian Sun. Deep residuallearning for image recognition. In Proceedings of the IEEE Conference onComputer Vision and Pattern Recognition, pages 770–778, 2016.
[42] Vinod Nair and Geoffrey E Hinton. Rectified linear units improve restrictedboltzmann machines. In Proceedings of the 27th international conferenceon machine learning (ICML-10), pages 807–814, 2010.
[43] Diederik Kingma and Jimmy Ba. Adam: A method for stochastic opti-mization. arXiv preprint arXiv:1412.6980, 2014.
[44] James Bergstra, Olivier Breuleux, Frederic Bastien, Pascal Lamblin, Raz-van Pascanu, Guillaume Desjardins, Joseph Turian, David Warde-Farley,and Yoshua Bengio. Theano: A cpu and gpu math compiler in python. InProc. 9th Python in Science Conf, pages 1–7, 2010.
[45] Christiam Camacho, George Coulouris, Vahram Avagyan, Ning Ma, JasonPapadopoulos, Kevin Bealer, and Thomas L Madden. Blast+: architectureand applications. BMC bioinformatics, 10(1):421, 2009.
[46] Johannes Soding. Protein homology detection by hmm–hmm comparison.Bioinformatics, 21(7):951–960, 2004.
[47] Michael Remmert, Andreas Biegert, Andreas Hauser, and Johannes Soding.Hhblits: lightning-fast iterative protein sequence searching by hmm-hmmalignment. Nature methods, 9(2):173–175, 2012.
[48] Petros Kountouris and Jonathan D Hirst. Prediction of backbone dihe-dral angles and protein secondary structure using support vector machines.BMC bioinformatics, 10(1):437, 2009.
[49] Wolfgang Kabsch and Christian Sander. Dictionary of protein secondarystructure: pattern recognition of hydrogen-bonded and geometrical fea-tures. Biopolymers, 22(12):2577–2637, 1983.
[50] Martin Steinegger and Johannes Soding. Sensitive protein sequence search-ing for the analysis of massive data sets.
[51] Thomas Hamelryck, Kanti Mardia, and Jesper Ferkinghoff-Borg. Bayesianmethods in structural bioinformatics. Springer, Cambridge, 2012.
[52] Helen M Berman, John Westbrook, Zukang Feng, Gary Gilliland, Tala-pady N Bhat, Helge Weissig, Ilya N Shindyalov, and Philip E Bourne. Theprotein data bank. Nucleic acids research, 28(1):235–242, 2000.
22
.CC-BY-NC-ND 4.0 International licenseIt is made available under a (which was not peer-reviewed) is the author/funder, who has granted bioRxiv a license to display the preprint in perpetuity.
The copyright holder for this preprint. http://dx.doi.org/10.1101/236851doi: bioRxiv preprint first posted online Dec. 20, 2017;

[53] Rhys Heffernan, Yuedong Yang, Kuldip Paliwal, and Yaoqi Zhou. Captur-ing non-local interactions by long short term memory bidirectional recur-rent neural networks for improving prediction of protein secondary struc-ture, backbone angles, contact numbers, and solvent accessibility. Bioin-formatics, page btx218, 2017.
23
.CC-BY-NC-ND 4.0 International licenseIt is made available under a (which was not peer-reviewed) is the author/funder, who has granted bioRxiv a license to display the preprint in perpetuity.
The copyright holder for this preprint. http://dx.doi.org/10.1101/236851doi: bioRxiv preprint first posted online Dec. 20, 2017;