real estate market in brazil - urban land institute the... · real estate market in brazil -...
TRANSCRIPT

Real Estate Industry in Brazil
15Th
ULI Europe Annual Conference
February, 2011

2
Agenda
1. Macro Scenario
2. The Real Estate Market in Brazil
Residential
Office
Hospitality
Industrial
Shopping center
3. Sonae Sierra Brasil at a Glance

3
Growth
Over the last decade, Brazil experienced an unparalleled growth trend and should continue to
grow at solid rates in the foreseeable future…
Source: IBGE, MCM
GDP Growth Brazil
Source: MCM
Brazil
Area: 8.6 million sq km
Population (09): 193.7million
GDP (10E): US$ 2.0 trillion
GDP per capita (10E): US$ 10.4k
1.2%
5.7%
3.2%
3.9%
6.1%
5.2%
-0.7%
7.5%
4.5% 4.5% 4.6% 4.6%
2003 2004 2005 2006 2007 2008 2009 2010E 2011E 2012E 2013E 2014E

4
Decreasing Unemployment & Credit Expansion
Favorable economic conditions have led unemployment rate to its lowest level since 2003, and
have boosted both demand for credit and the purchasing power of middle class families mainly…
Unemployment Rate
Source: MCM
12.3%
11.5%
9.9% 10.0%
9.3%
7.9% 8.1%
7.3%
2003 2004 2005 2006 2007 2008 2009 2010E
Total Credit to Individuals Outstanding (R$ bn)
Source: Cetelem “O Observador 2010, Itau Securities
5
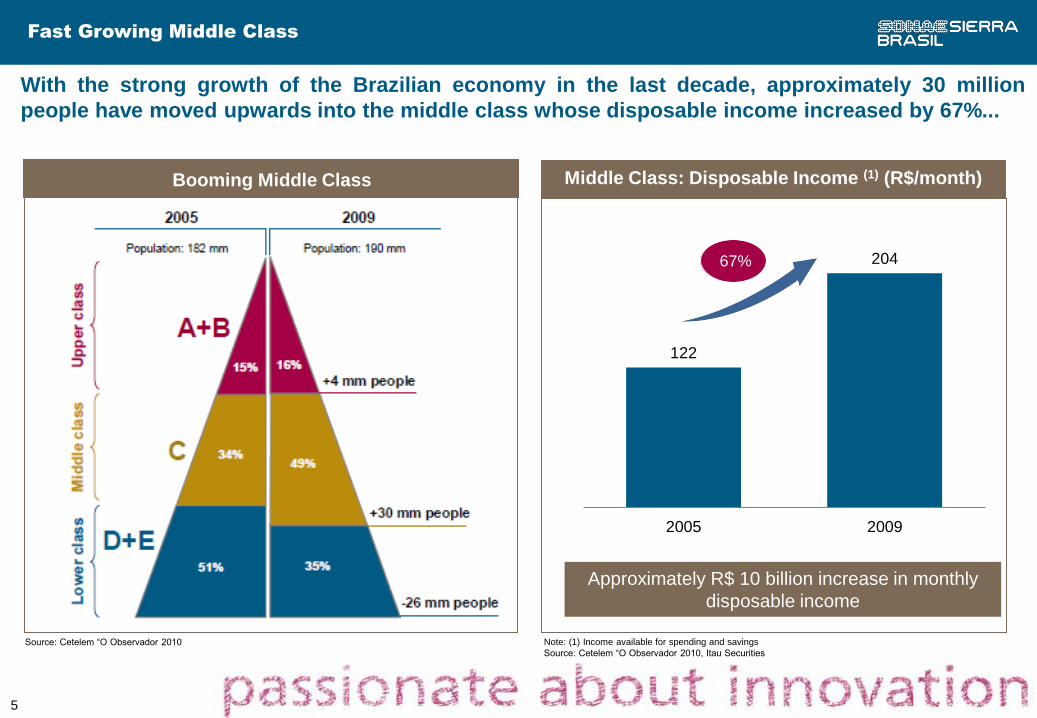
With the strong growth of the Brazilian economy in the last decade, approximately 30 million
people have moved upwards into the middle class whose disposable income increased by 67%...
Source: Cetelem “O Observador 2010
Fast Growing Middle Class
Middle Class: Disposable Income (1) (R$/month) Booming Middle Class
122
204
2005 2009
Note: (1) Income available for spending and savings
Source: Cetelem “O Observador 2010, Itau Securities
67%
Approximately R$ 10 billion increase in monthly
disposable income

6
Agenda
1. Macro Scenario
2. The Real Estate Market in Brazil
Residential
Office
Hospitality
Industrial
Shopping center
3. Sonae Sierra Brasil at a Glance

7
Real Estate Market in Brazil - Residential Market
Sound potential demand of circa R$173 billion with 58% in the mid and upper-mid income classes
and 42% in the affordable entry-level segment
En
try-le
ve
l fa
mili
es
Mid
an
d U
pp
er
mid
in
co
me
fa
mil
ies
Total households (million)
R$16k -
R$32K
R$8,000 –
R$16,000
R$4,000 – R$8,000
R$2,000 – R$4,000
R$1,000 – R$2,000
Up to R$1,000
Above R$32k
Total
0 0.3
0.3 1.3
1.1 4.3
3.3 11.0
8.4 21.8
15.5 27.6
31.7 29.1
Monthly Income Bracket
13
43
139
335
583
526
(113)
1,526
# Annual households (demand in thousand) 2007 2030e
60.3 95.4
Annual Potential Demand
(R$ bn)
Total volume
(R$ bn) 101
Households
(thousand) 530
Total volume
(R$ bn) 72
Households
(thousand) 846
Source: press releases of listed companies
(1)
(1) It includes only 50% of the potential annual households from R$1,000 – R$2,000 bracket
8
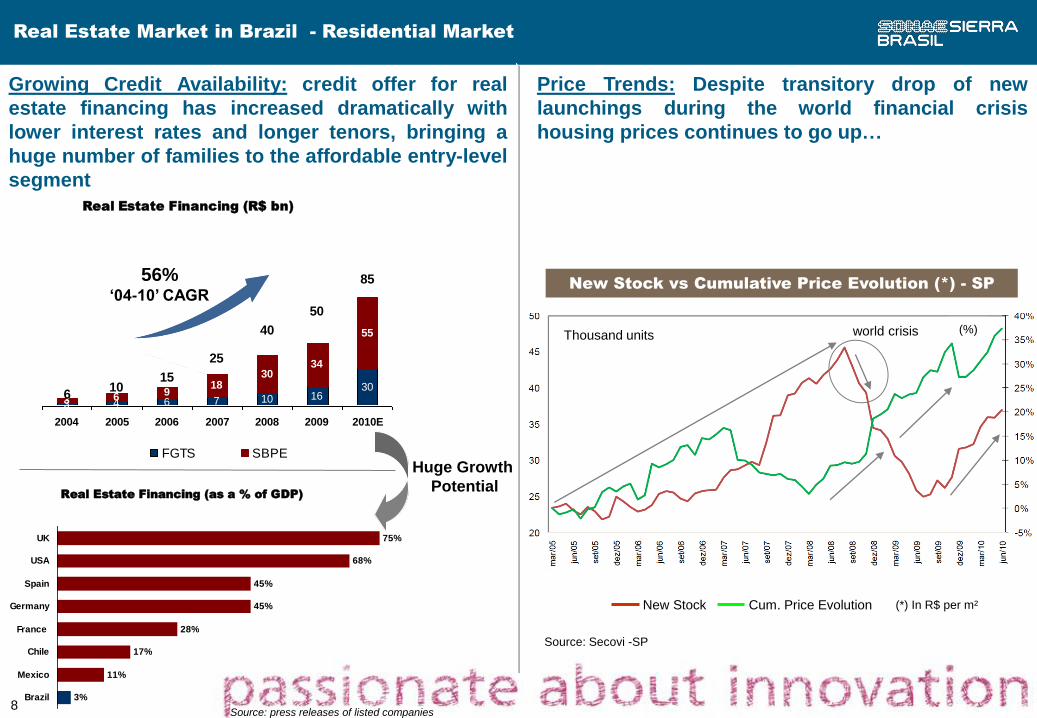
Real Estate Market in Brazil - Residential Market
Growing Credit Availability: credit offer for real
estate financing has increased dramatically with
lower interest rates and longer tenors, bringing a
huge number of families to the affordable entry-level
segment
Real Estate Financing (R$ bn)
3 4 6 7 10 1630
3 6 918
3034
55
610
15
25
40
50
85
2004 2005 2006 2007 2008 2009 2010E
FGTS SBPE
56% ‘04-10’ CAGR
Real Estate Financing (as a % of GDP)
75%
68%
45%
45%
28%
17%
11%
3%
UK
USA
Spain
Germany
France
Chile
Mexico
Brazil
Huge Growth
Potential
Source: press releases of listed companies
New Stock vs Cumulative Price Evolution (*) - SP
Thousand units (%) world crisis
New Stock Cum. Price Evolution
Source: Secovi -SP
(*) In R$ per m²
Price Trends: Despite transitory drop of new
launchings during the world financial crisis
housing prices continues to go up…

9
Agenda
1. Macro Scenario
2. The Real Estate Market in Brazil
Residential
Office
Hospitality
Industrial
Shopping center
3. Sonae Sierra Brasil at a Glance

10
Real Estate Market in Brazil - Office Market
€0 €300 €600 €900 €1200 €1500
Occupancy Costs per m² per year
Most Expensive World Locations
Source: C&W
2010
São Paulo represents the largest office submarket of
Brazil accounting for 60% of the total class A buildings
Rio de Janeiro is the 2nd largest office submarket and
also the most expensive, recording R$142 per m² per
month in 3Q10, mainly due to both the lack of vacant
lands for future developments and growing demand
Rio de Janeiro is among the top 20 most expensive locations in the world but still has lower rental rates when compared to that of prime office markets such as Tokyo, London, Dubai, New York and Paris indicating potential for future appreciation
With an overall average of R$70 per m² per
month, in 3Q10 asking rental rates increased
about 23% yoy
Overall vacancy rate averaged 10% in 3Q10
Source: C&W 2010
Overall Asking Rental Rates (Class A)
-
15
30
45
60
75
90
105
120
135
150
São Paulo Rio de
Janeiro
Brasília Porto
Alegre
Salvador Vitória Curitiba
R$/s
qm
/mo
nth
3Q09 3Q10
Overall Vacancy Rates (Class A)
0%
5%
10%
15%
20%
25%
30%
São Paulo Rio de
Janeiro
Brasília Porto
Alegre
Salvador Vitória Curitiba
Vacan
cy R
ate
3Q09 3Q10
142
91
Average = 10%
Average = 70

11
Agenda
1. Macro Scenario
2. The Real Estate Market in Brazil
Residential
Office
Hospitality
Industrial
Shopping center
3. Sonae Sierra Brasil at a Glance

12
Real Estate Market in Brazil - Hospitality Market
Source: JLL Hotels
Since 2004 ADR and RevPAR grew 5.7% and 8.4% per year, respectively, as occupancy rates have
been going up. The southeast region represents almost half of the entire national supply with São
Paulo and Rio de Janeiro being the main submarkets
78 7583
87
97104
112
181
164158
152
140137
151
62%63%61%57%59%
55%52%
60
80
100
120
140
160
180
200
2003 2004 2005 2006 2007 2008 2009
0%
10%
20%
30%
40%
50%
60%
70%
Average Daily Rate (R$) RevPAR (R$) Room Occupancy
Brazil Lodging Performance
8%
21%
21%
47%
3%
Mid-west Northeast North Southeast South
Distribution of Rooms per Region
Source: JLL Hotels
440,857 Total Number of Rooms:
# Brands # Rooms % of Total
1 Accor 23,950 5%
2 Choice 9,158 2%
3 Golden Tulip 5,313 1%
4 Blue Tree 4,149 1%
5 Nacional inn 3,747 1%
6 Meliá 3,395 1%
7 IHG 3,247 1%
8 Transamérica 2,774 1%
9 Windsor 2,726 1%
10 Othon 2,717 1%
61,176 14%
Offered by national and
international brands
Top 10 Brands
Source: JLL Hotels
13
Agenda
1. Macro Scenario
2. The Real Estate Market in Brazil
Residential
Office
Hospitality
Industrial
Shopping center
3. Sonae Sierra Brasil at a Glance

14
Real Estate Market in Brazil - Industrial Market
Net Absorption
Gross Absorption
Vacancy Rate (prime properties)
Overall Vacancy Rate
Industrial Space Performance*
Va
ca
nc
y R
ate
(%)
Ab
so
rpti
on
(m
²)
(*) São Paulo & Campinas Region Source: CBRE
Industrial real estate market continues to experience strong net absorption with low vacancy rates
and escalating rents. The average vacancy rate is 6.3% with asking rents growing 7.8% per year
on average, and ranging from R$12 to R$25 per m² per month – the highest levels since 2007
13
14
19
16
17
19
2005 2006 2007 2008 2009 2010
Asking Rental Rates* (R$/ m² / month)
Growing direct investments on new plants are expected to lead cumulative absorption
(demand) to historic levels of 600 thousand m² in 2010
Coupled with rising construction costs, leasing prices may experience a new rising wave in
coming future, mainly for built-to-suit developments
Trends:

15
Agenda
1. Macro Scenario
2. The Real Estate Market in Brazil
Residential
Office
Hospitality
Industrial
Shopping center
3. Sonae Sierra Brasil at a Glance
16
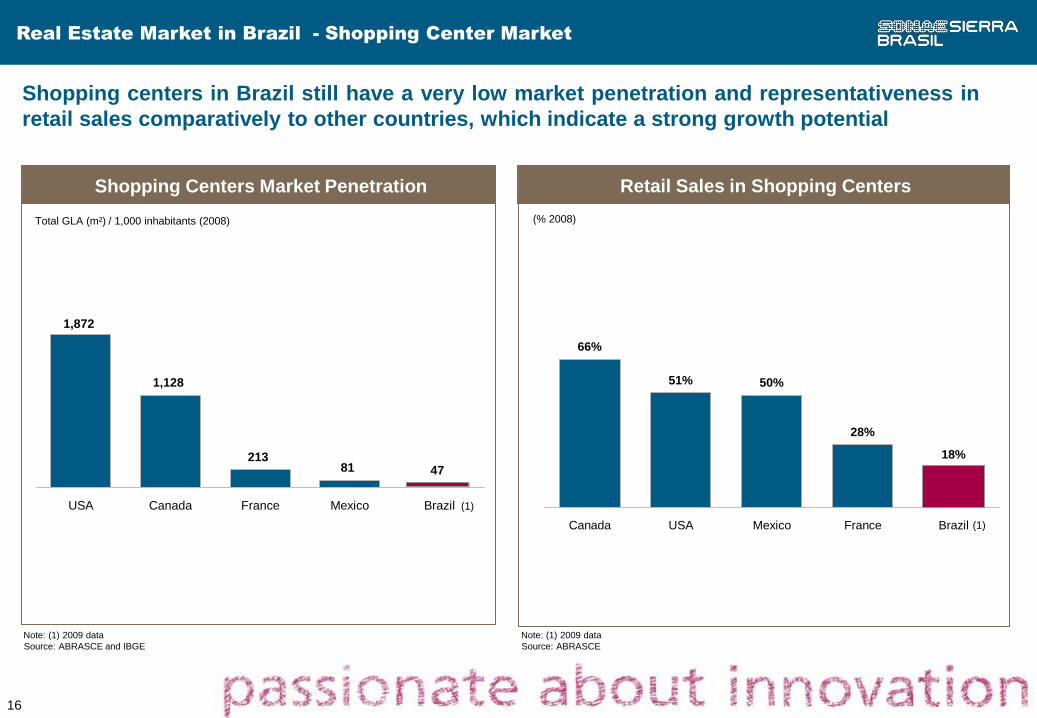
Retail Sales in Shopping Centers
Shopping centers in Brazil still have a very low market penetration and representativeness in
retail sales comparatively to other countries, which indicate a strong growth potential
Shopping Centers Market Penetration
Total GLA (m²) / 1,000 inhabitants (2008)
1,872
1,128
21381 47
USA Canada France Mexico Brazil
66%
51% 50%
28%
18%
Canada USA Mexico France Brazil
(% 2008)
(1)
(1)
Note: (1) 2009 data
Source: ABRASCE and IBGE
Note: (1) 2009 data
Source: ABRASCE
Real Estate Market in Brazil - Shopping Center Market

17
Total GLA
Source: ABRASCE (2010)
In the last 10 years, the number of shopping centers and GLA increased at annual rates of 3.8%
and 6.6%, respectively
Number of Operating Shopping Centers
Source: ABRASCE (2010)
2000 – 2009 CAGR: 3.8% 2000 – 2009 CAGR: 6.6%
280294
304316
325338
351365
377393
2000 2001 2002 2003 2004 2005 2006 2007 2008 2009
5.1 5.25.5 5.6
6.26.5
7.5
8.38.6
9.1
2000 2001 2002 2003 2004 2005 2006 2007 2008 2009
Real Estate Market in Brazil - Shopping Center Market

18
Geographic Distribution of GLA Geographic Distribution of Number of Malls
Geographic Distribution of Number of Shopping Centers Total number of shopping centers aff iliated to ABRASCE: 391
North
3% Northeast
14%
Mid-West
9%
Southeast
55%
South
19%
Geographic Distribution of Total GLA Total GLA of shopping centers aff iliated to ABRASCE: 96.9 million square feet
North
3% Northeast
14%
Mid-West
8%
Southeast
60%
South
15%
The Southeast Region – the most economically advanced in Brazil - holds more than half of
total malls and GLA in Brazil
Malls in operation: 393 Total GLA: 9.1 million m2
Source: ABRASCE (2010) Source: ABRASCE (2010)
Real Estate Market in Brazil - Shopping Center Market
19
Agenda
1. Macro Scenario
2. The Real Estate Market in Brazil
Residential
Office
Hospitality
Industrial
Shopping center
3. Sonae Sierra Brasil at a Glance

20
Portfolio Footprint
1
City: Campinas (SP)
GLA: 114.2 k m2
Ownership: 51.0%
2
City: São Paulo (SP)
GLA: 16.0 k m2
Ownership: 100.0%
City: Campinas (SP)
GLA1): 118.730 m2
Ownership1): 51.0%
Parque D. Pedro
Boavista Shopping
3
City: São Paulo (SP)
GLA: 29.5 k m2
Ownership: 73.2%
Shopping Penha
4 Franca Shopping
City: Franca (SP)
GLA: 18.1 k m2
Ownership: 67.4%
5 Tivoli Shopping
City: Sta. Barbara
d’Oeste (SP)
GLA: 22.1 k m2
Ownership: 30.0%
6 Shopping Metrópole
City: São Bernardo do
Campo (SP)
GLA1): 25.0 k m2
Ownership: 100.0%
7 Pátio Brasil
City: Brasília (DF)
GLA: 29.0 k m2
Ownership: 10.4%
8
Shopping Plaza Sul
City: São Paulo (SP)
GLA: 23.0 k m2
Ownership: 30.0%
9 Shopping Campo Limpo
City: São Paulo (SP)
GLA: 19.9 k m2
Ownership: 20.0%
10 Manaura Shopping
City: Manaus (AM)
GLA: 46.7 k m2
Ownership: 100.0%
12 Boulevard Londrina Shopping
City: Londrina (PR)
GLA2): 47.8 k m2
Ownership: 84.5%
Exp. Opening2): 2H 2012
11 Uberlândia Shopping
City: Uberlândia (MG)
GLA2): 43.6 k m2
Ownership: 100.0%
Exp. Opening2): 2H 2011
13 Passeio das Águas Shopping
City: Goiânia (GO)
GLA: 78.1 k m2
Ownership: 100.0%
Exp. Opening: 2013
Projects under development:
Centers # Stores Total GLA
(‘000 m²)¹
Operating Assets 1,934 347.7
Greenfields Projects 691 173.3
Total 2,625 521.0
8
1) Excludes GLA owned by third parties
2) Includes PDP 1 BV’s stake

21
Thank you!

22
Disclaimer
The material herein has been prepared based on data collected through our own research as well as information available to us from public
and other external sources. In respect to all external data, the sources are believed to be reliable and have been used in good faith.
However, Sonae Sierra Brasil can not accept responsability for their accuracy and completeness, nor for any undisclosed matters that would
affect the conclusions we have drawn. In addition, this presentation is provided for informational purposes only and It does not constitute an
offer or a solicitation of any kind or to participate in any particular trading strategy.
