quantitative reasoning ii - final project presentation
TRANSCRIPT
Quantitative reasoning II - final project
Sarah Lee • Hannah Pierce

Introduction

Variables● Variables
○ Urban population [ %Urban ]○ Percentage population with commute over 1 hr [ %LongCommute ]○ Percentage population with bachelor’s degrees [ %BA ]○ Percentage population with graduate degrees [ % MA ]
● Hypotheses○ Negative linear relationship between %Longcommute VS %BA/MA○ Positive linear relationship between %Longcommute VS %Urban○ Positive linear relationship between %Urban VS %BA/MA

Patterns Across the United States● %Urban
○ 1st highest D.C. at 100%○ 2nd highest California at 95%○ Lowest Maine with 38.7%○ Highest urban populations on the East and West coasts
● %LongCommute○ Highest New York at 16.6%○ Lowest South Dakota at 2.6%○ Highest commute times in Northeastern states○ Lowest commute times in Midwestern states

Patterns Across the United States● %BA
○ 1st highest D.C. at 50%○ 2nd highest Massachusetts at 39%○ Lowest West Virginia at 17.5%
○ Highest degree holders in Northeastern states
○ Lowest degree holders in Southeastern states
● %MA○ 1st highest D.C. at 26.9%○ 2nd highest Massachusetts at 16.7%○ Lowest Arkansas at 6.3%○ Regional trends similar to %BA

Univariate analysis

%BA
Median = 27.1%Mean = 28%SD = 5.7%
Distribution is positively / right skewed
Outlier: D.C.Excluding outlier, distribution is normal

%MA
Median = 9.4%Mean = 10.3%SD = 3.4%
Distribution is positively / right skewed
Outlier: D.C.Excluding outlier, distribution is similar

%UrbanMedian = 74.2%Mean = 74.1%SD = 14.9%
Distribution is almost normal
Outlier: D.C.Excluding outlier, distribution is similar or slightly negative / left skewed
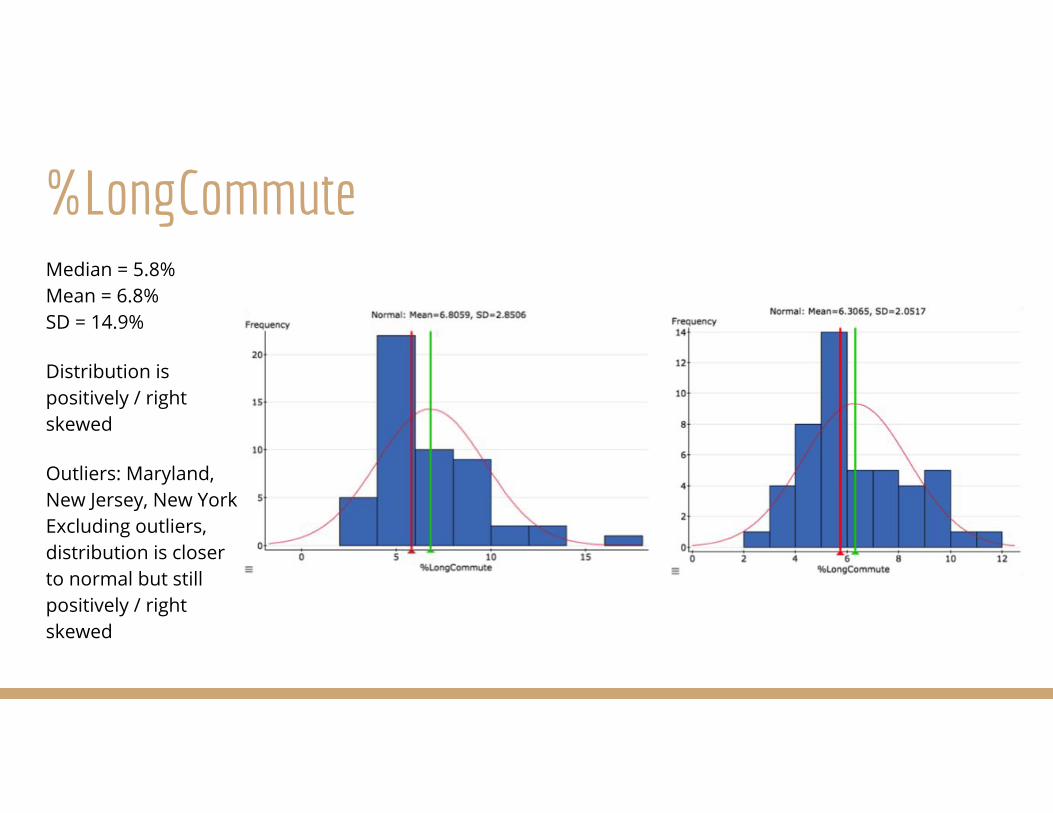
%LongCommuteMedian = 5.8%Mean = 6.8%SD = 14.9%
Distribution is positively / right skewed
Outliers: Maryland, New Jersey, New YorkExcluding outliers, distribution is closer to normal but still positively / right skewed

Bivariate analysis

%BA VS %Urban
Positive linear relationship
y = 37.88 + 1.30x
r = +0.50 (moderate)
r2 = 0.25

%MA VS %Urban
Positive linear relationship
y = 52.23 + 2.12x
r = +0.48 (moderate)
r2 = 0.23

%BA VS %LongCommute
Positive linear relationship
y = 0.86 + 0.21x
r = +0.43 (moderate)
r2 = 0.18

%MA VS %LongCommute
Positive linear relationship
y = 2.39 + 0.43x
r = +0.51 (moderate)
r2 = 0.26
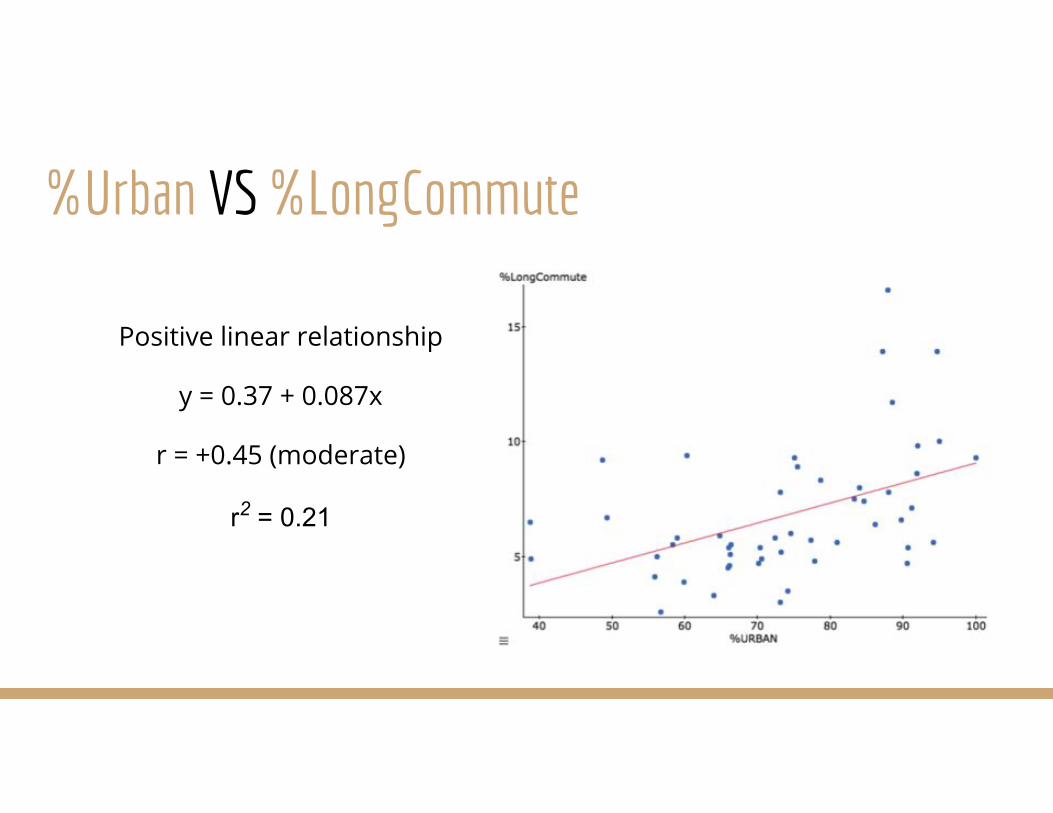
%Urban VS %LongCommute
Positive linear relationship
y = 0.37 + 0.087x
r = +0.45 (moderate)
r2 = 0.21

Summary and investigation

Summary of observations of relationships● Highest correlation between %MA and %LongCommute at
r = +0.51● %LongCommute increases as %Urban increases● Both are unexpected results, results are correlated● As % graduates increases, more people live in urban areas● Commute times increase due to high traffic in urban areas● Walking or biking slower modes of transportation than cars,
potential increase in %LongCommute data

Regional Comparisons

Regional Comparisons

Regional Comparisons