rapid assessment of heavy damage areas of the 2008 mw 7.9 ... · mw 7.9 wenchuan earthquake using...
TRANSCRIPT
Rapid assessment of heavy damage areas of the 2008
Mw 7.9 Wenchuan earthquake using satellite SAR data Ken Xiansheng Hao
National Research Institute for Earth Science and Disaster Prevention, Japan Tomokazu Kobayashi Geospatial Information Authority of Japan Hiroyuki Fujiwara
National Research Institute for Earth Science and Disaster Prevention, Japan Yifan Yuan Institute of Engineering Mechanics, CEA, China SUMMARY: This paper proposed a novel method of rapidly assessing high damage areas by using satellite geodetic surveys. We re-compute pixel displacements using the ALOS/PALSAR data acquired before and after the Wenchuan earthquake. By analyses of displacements and seismic intensity contours, we propose a criterion of the displacement-to-intensity to qualitatively judge if high seismic intensity has occurred. Displacements of ≥ 1 m may correspond to area where higher intensity (> IX) has occurred. We reveal that seismic intensity IX extended into VIII areas in western mountainous regions based on the criterion. Following mega inland earthquakes (i.e. > M7), ground displacements of above one meter may indicate the possibility that the area suffers from high seismic intensity with heavy damage. Keywords: Rapid assessment, Heavy damage, Wenchuan earthquake, ALOS PALSAR 1. INTRODUCTION One of the largest inland earthquakes ever recorded struck Wenchuan, China on May 12, 2008. It devastated huge regions and triggered over 11,000 catastrophic landslides, slope collapse and debris flows (Huang and Li, 2009) spanning 300 km along the Longmen Shan (LMS) fault zone. The great disaster resulted in 69,226 fatalities, 17,923 missing, 374,643 injuries, and 14,565 heavy-affected villages dated on 25 August 2008 (State Council of China, 2008). The Mw 7.9 earthquake epicenter was located on the southwestern end of the LMS faults; however, the most damaged regions were Yinxue (seismic intensity XI), Beichuan (XI) and Qingchuan (IX), distributed over a distance of 290 km toward the northeast as the LMS faults ruptured. Some of the high intensity areas were not revealed in the immediate days after the earthquake since the epicenter was determined by initial P-waves from far-field seismological observations. Lack of information on inaccessible areas such as mountainous regions led to more fatalities and injuries. On-line instrumental surveys of seismic intensity have dramatically revolutionized the method for assessing earthquake damage from the conventional field investigations. To survey seismic intensity in Japan, 4,200 strong-motion seismographs were installed allowing information to be automatically publicized within minutes following an earthquake (Japan Meteorological Agency (JMA), 1996; Kinoshita, 1998; Okada et al., 2004). Unfortunately, the other countries frequently affected by earthquakes lack such dense array of the seismographs leading to delayed reporting. For example, after the Wenchuan earthquake, a field investigation-based seismic intensity map (Figure 1b) was not produced until 14 weeks post-quake due to widespread damages (China Earthquake Administration (CEA), 2008; Yuan, 2008). As earthquake survivors in devastated regions waited for rescue, responders had no detailed knowledge of seismic intensity distribution. An assessment of damage intensity (Wald et al., 2006; Fielding et al., 2010) is crucial to quickly determine extreme disaster regions without reliance on slower, resource intensive methods such as ground observations and field surveys. Here we describe the analysis of pixel-offset tracking of synthetic aperture radar (SAR) data in measuring ground coseismic displacements, compare its results with the field seismic intensity
contours for the Wenchuan earthquake, and propose a simplified displacement-to-intensity criterion for rapid assessment of devastating areas. 2. SPACE-GEODETIC SURVEYS Modern space-geodetic surveys provide much of our knowledge about the Earth’s surface. Satellite SAR data provides spatially comprehensive ground information for large areas. Interferometric SAR (InSAR) analysis has the advantage of detecting ground deformations with high precision (Massonnet and Feigl, 1998; Bürgmann, 2000). Using ALOS/PALSAR data collected before and after the Wenchuan earthquake, crustal deformations were revealed by InSAR analysis for the region (Hao et al., 2009; Shen et al., 2009; Tong et al., 2010). However, many areas of deformation remained unknown due to low coherence or decorrelation of InSAR phase signals. By adding additional field data and fault slip inversion, Hao et al. (2009) constrained the boundary of coseismic faults, which spanned a region of 200 km x 30 km, but the details of deformation within the boundaries were left unclear. On the other hand, the pixel offset-tracking (or sub-pixel correlation) method, using amplitude data of backscattered signals improved the decorrelation of phase signals (Kobayashi et al., 2009; Hashimoto et al., 2009; de Michele et al., 2010).
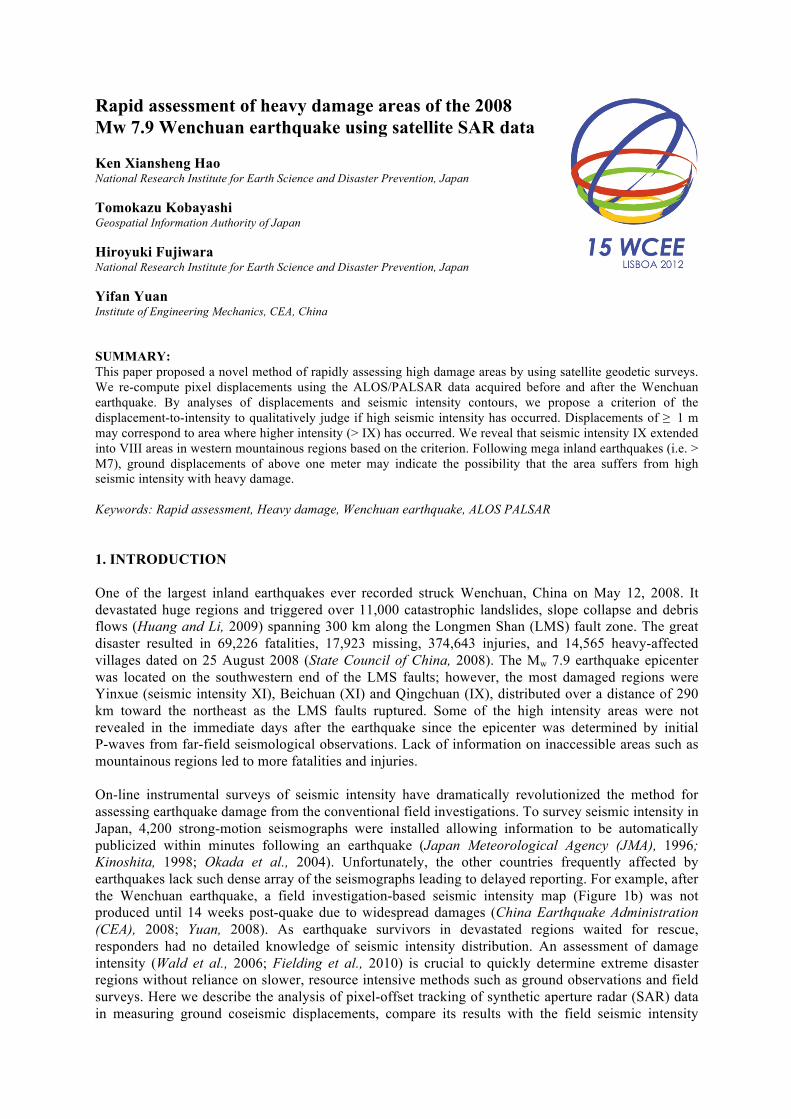
Figure 1. A comparison of the displacement using a pixel-offset analysis with isoseismal contours (CEA, 2008) obtained from field investigations for the Mw7.9 Wenchuan earthquake (star, epicenter). (a) The displacements, indicated by offset [m] with ± and color scale, represent the forward or away from the satellite in the ground-to-satellite line of sight (LOS) direction, superimposed by GPS-observed coseismic offsets (red arrows, scale proportional to 2.43 m of maximum horizontal displacement) (CMONC, 2008), and by locations (plus signs) of the major coseismic fault scarp (Hao et al, 2009). (b) The isoseismal contours indicated by CSI intensity VI to XI, superimposed by profile locations hinted from pairs of green arrows with Letters A to E and Numbers 10 to 61 as shown in Figures 2, 3 and 4, by locations of the major landslides (solid triangles)(Huang and Li, 2009), and by active faults (brown lines) (Kirby et al, 2003). YX, Yingxiu; BC, Beichuan; WC, Wenchuan; MX, Maoxian; DX, Diexi; SP, Songpan; GX, Guangxian; AC, Anchang; JY, Jiangyou; and QC, Qingchuan.
In this study, we concentrate on analysis of high intensity areas with large damages by using the pixel offset-tracking method combined with field observations. Following the procedure of Kobayashi et al. (2009), we re-evaluate displacements by using new hole-filled data (Jarvis et al., 2008) of the 90-m-spacing Shuttle Radar Topography Mission (SRTM) DEM. We employ a search patch of 64 × 192 pixels (range × azimuth) equivalent to ~480 × 610 m on the ground and a sampling interval of 36 × 108 pixels equivalent to ~270 × 340 m on the ground. The ALOS/PALSAR data on the ascending orbital paths 471 to 476 are used as shown in Figure 1a from east to west. Figure 1a shows displacements in the ground-to-satellite line of sight (LOS) direction. By using warm/cold colors for the signs (±) of the displacements, the ground movements spanning ~300 km in length and ~100 km in width can be roughly divided into two moving-patterns along the northwest-dipping LMS fault zone. The hanging wall on the western side (warm hues) moves away from the LOS, in the ESE direction, whereas the footwall on the eastern side (cold hues) moves toward the satellite, in the WNW direction. The coseismic displacements were tracked precisely by global positioning system (GPS) observations, but unfortunately the GPS stations were distributed sparsely (Working group of CMONC, 2008). Under the illumination of the GPS vectors in whole regions, we can consider the displacements in LOS direction as corrected/pseudo ground displacements by referring to the GPS as control points. As indicated by arrows, the largest GPS horizontal displacement of 2.43 m (0.68 m vertical) west northwestward occurs at H35 (31.80°N, 104.44°E) near Beichuan on the footwall side (Figures 1, 4).
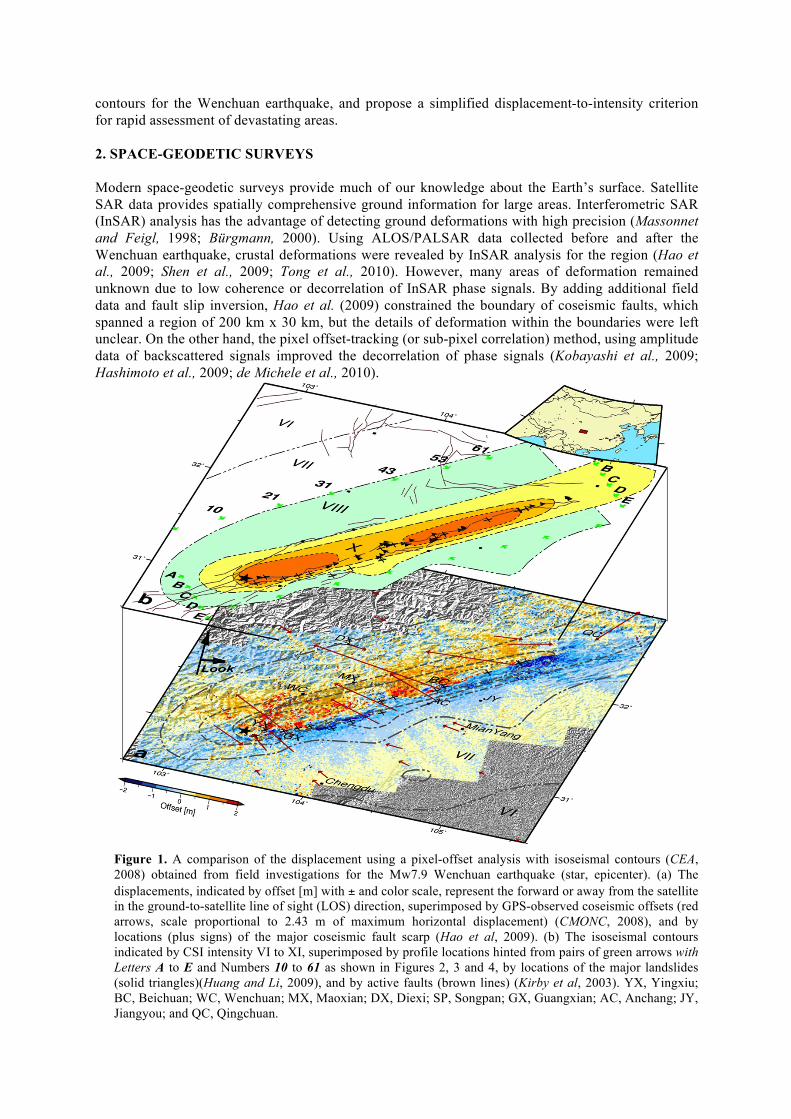
Figure 2. Displacements in LOS direction along with profiles A to E (see Figure 1) are distributed parallel to the LMS fault zone within a length of 300 km. Displacements of ± 1 m were indicated by blue broken line and over ± 3 m were omitted. Isoseismal contours are projected as background to image distributions of CSI intensity XI= dark-orange (dot); X= orange (dash); IX= yellow (dot-dash). Major coseismic-fault and heavy damage area are projected. Elevation (dark grey) along profile C is given at bottom. QP, Qingping; L, Leigu; SK, Shikan; BL, Bailu, and H, Hanwan.

3. FIELD INVESTIGATIONS AND SEISMIC INTENSITY CONTOURS While many field investigations reported individual aspects of the coseismic faults, landslides and damages of the Wenchuan earthquake, the entire damage distribution can be roughly summarized using seismic intensity contours based on 4,150 investigated points spanning 500,000 km2 as shown in Figure 1b (CEA, 2008). The seismic intensities of a given area (e.g. a village) were determined from averaged observations based on the China seismic intensity (CSI) scale (Chinese National Standard, 1999), a method similar to the Modified Mercalli Intensity (MMI) scale (Wood and Neumann, 1931). The contours of CSI intensities greater than VIII do not change after seismic intensity reassessments, while the rest of the contours narrows gradually (Yuan 2008). Two isolated contours with CSI intensity XI in dark-orange (dotted line, Figure 1b) spanned the Yingxue and Beichuan regions where severe damages had occurred (State Council of China, 2008). The towns of Yingxue and Beichuan, with elevations of 900 m and 800 m respectively, located within a V-shaped valley surrounded by steep cliffs of ~2700 m and ~1600 m, were completely destroyed. In these two towns, peak ground acceleration (PGA) was estimated to have exceeded 1 g since a PGA of 0.958 g was recorded at Wolong station, 19 km away from the epicenter (Li et al., 2008). The contour of CSI intensity X in orange (dash line, Figure 1b) closely surrounded the intensity XI belts. Most landslides and coseismic fault scarps were concentrated along the Yingxue-Beichuan coseismic fault within the XI and X intensity belts, while the coseismic faults observed at Hanwan, Yinghua, and Bailu were concentrated along the Guanxian-Anxian active fault in the IX contour in yellow color (dotted-dash line) and VIII contour in blue (double dotted-dash line). The majority of field investigations were conducted in plains and low mountainous areas (< 2000 m). In the high mountainous regions to the west (> 2000 m) where the hanging wall of the LMS fault zone is located, field work was performed only along a few of the deep valleys; therefore, comparatively less investigation was conducted in this area (Yuan, 2008). We recognize that the unequal distribution of field data could produce possible bias and, thus, reduce the weight of the field data of high mountainous areas as discussed later. In addition to isoseismal contours, major coseismic faults (Hao et al., 2009), landslides (as determined by the editorial committee of WEDM 2008; Huang and Li, 2009), and GPS coseismic offset information (as determined by the working group of CMONC, 2008) are employed for comparison.
Figure 3. The same with Figure 2 but profiles 1 to 71 (see Figure 1) with elevation (dark grey) perpendicular to the LMS fault zone within a length of 100 km. Profile 21 with projected active faults is given at bottom, Guanxian-Anxian coseismic fault (right), Yingxiu-Beichuan coseismic fault (middle) and Wenchuan- Maoxian active fault (left).
4. DISPLACEMENT COMPARISON With the abundance of seismic intensity contours and field investigations mentioned above, the
corresponding displacement measured from satellite geodetic surveys is a potential resource for determining the possible location of large displacement over a given value. Pixel displacements in the LOS direction obtained from ALOS/PALSAR data are generally proportional to seismic intensities obtained from field observations as shown in Figure 1. To understand their potential relationship, profiles A to E x 1 to 71 (covering about 50 km x 260 km) are distributed parallel and perpendicular to the LMS fault zone. Profiles A to E with an interval of about 12 km are covered by seismic intensities > VIII (CEA, 2008); however, profiles 1 to 71 with interval of 3.7 km are covered by higher seismic intensity zones VII to IX, as shown in Figures 1 ~ 4. In general, variations of displacements along the profiles range about one meter. However, displacements along profiles B and C are as large as ~3 m where seismic intensities of X and XI were assigned, such as at Yingxiu, Qingping, Leigu, Beichuan and Sikan. The highest intensity XI regions are located on profile C with the highest variation of displacements. In contrast, displacements along profile E are partly less than one meter in seismic intensity VIII regions. Displacement levels along profiles A and D are in-between the aforementioned two with occasional large amplitudes such as at Bailu (BL) and Wenchuan (WC), as shown in Figure 2. In other words, displacement of 1 m in the LOS direction can be a criterion to qualitatively judge if high seismic intensity has occurred, shown as the blue dashed lines in Figures 2, 3 and 4. Large displacements of ≥ 1 m may correspond to areas where higher seismic intensities occurred (e.g., CSI > IX), and smaller displacements of < 1 m may refer to areas where seismic intensities of around VIII and less had occurred. The InSAR phase analysis also supports this criterion although larger displacement (> 1 m) regions were unidentified due to the signal decorrelation (Hao et al, 2009). We refer to this criterion of using satellite-offset displacement with the seismic intensity as the displacement-to-intensity criterion. We note that although profile A for the westward hanging wall has larger displacements than profile E on the eastward footwall, the same CSI=VIII was assigned to both areas. The difference can be attributed to the resolution difference between pixel offsets and field investigations, where the former is composed of continuous spatial pixels and the latter of average of damages around a village. The isoseismal intensity contour was integrated from discrete investigations, with possible bias especially in the high mountainous areas. This kind of difference may exist in other areas but is difficult to reassess once damages and evidence are removed following an earthquake. However, dense displacements from satellite geodetic survey offer a possible way to uncover the complex information of seismic intensity in wide regions. Primary thrust-fault scarps with vertical displacements of ~6 m were found along the Yingxue-Beichuan coseismic fault, spanning across seismic intensity regions of XI to X. Sub-primary thrust-fault scarps with vertical displacements of ~3 m were found along the Guanxian- Anxian coseismic fault, spanning IX to VIII intensity regions.
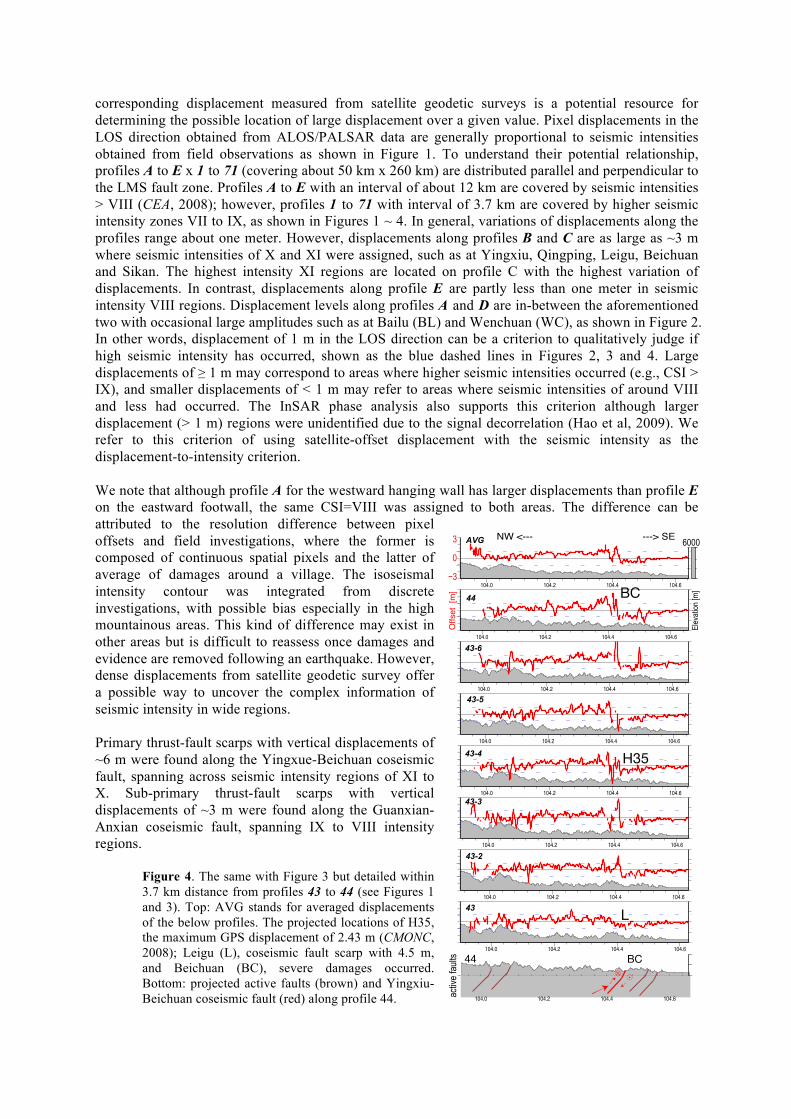
Figure 4. The same with Figure 3 but detailed within 3.7 km distance from profiles 43 to 44 (see Figures 1 and 3). Top: AVG stands for averaged displacements of the below profiles. The projected locations of H35, the maximum GPS displacement of 2.43 m (CMONC, 2008); Leigu (L), coseismic fault scarp with 4.5 m, and Beichuan (BC), severe damages occurred. Bottom: projected active faults (brown) and Yingxiu- Beichuan coseismic fault (red) along profile 44.
104.0 104.2 104.4 104.6
104.0 104.2 104.4 104.6
104.0 104.2 104.4 104.6
104.0 104.2 104.4 104.6
104.0 104.2 104.4 104.6
104.0 104.2 104.4 104.6
104.0 104.2 104.4 104.6
104.0 104.2 104.4 104.6
43
43-2
43-3
43-4
43-5
43-6
44
AVG
L
H35
BC
í�
0
� 6000
44 BC
Elev
ation
[m]
Offset [m
]
---> SENW <---
activ
e fau
lts
104.0 104.2 104.4 104.6

From analysis, we notice that displacements vary largely around the coseismic faults. Figure 4 shows a set of pixel displacement offsets both of the averaged profile (AVG) and the detailed sub-profiles between profiles 43 to 44 within a distance of 3.7 km. Displacement at Leigu (L) is less than 1 m on profile 43, but varies to ~2 m in distance of 0.5 km on profile 43-2; furthermore displays to > 3m at 104.44° on profile 44, in Beichuan (BC) where the highest intensity of XI was assigned. Variations of offset displacements can predominantly be identified in all profiles, and L is the field location of coseismic fault-scarp that had a vertical maximum of 4 m (Hao et al., 2009). Furthermore, H35 is location that had the largest horizontal displacement of 2.43 m by GPS. 5. DISCUSSION 5.1 Implication of large displacement areas We notice that the seismic intensity > IX contours correspond to the deep tone hues of pixel- displacement areas, where displacements ≥ 1 m as shown in Figure 1a. Of these, the orange to red pixel-displacements extended westward into VIII intensity contour areas that were asymmetrical to the eastern area. For instance, a large pixel-displacement area can be found SW of Wenchuan at 103.5° on profile B and at 103.4° on profile A in Figure 2. Previous field investigations inferred that the hanging wall on the western side suffered more shaking and geological disasters than the footwall on the eastern side but lacked detailed information (CEA, 2008; Yuan, 2008; Hao et al., 2009). Based on the analysis of pixel-displacements, we can confirm that larger crustal deformations and higher intensities occurred there. 5.2 Accuracy and further works Seismic intensity is related to the kinematic process of ground motion and represents an average of various affected phenomena after a strong earthquake. Assessment of ground shaking intensity by describing observed phenomena has a long history even before the invention of the strong-motion seismograph (e.g., Ishimoto, 1931; Wood and Neumann, 1931). The seismic intensity associated with PGA and peak ground velocity (PGV) has gradually been adopted for seismic intensity scale but not yet associated with peak ground displacement (PGD). One cannot rely on neither PGA nor PGV in areas which are not covered by strong-motion seismographs, but only rely on field investigations of resulting phenomena such as residual displacements of PGD, secondary damages, and permanent ground deformation. Field investigations are not accurate kinematically but useful for describing earthquake intensity. The novel criterion of the displacement-to-intensity combines the conventional field investigation with the modern technology of satellite observation. When a mega-earthquake occurs in inland areas, the satellite geodetic survey is a very effective tool to precisely assess the surface deformations, such as landslides, debris flows, and coseismic-faults, thus roughly identifying the high seismic intensity areas. The rapid assessment of devastating regions is critical in revealing the location of fault rupture, its spread, and damage distribution. We must be aware that the geomorphological deformations and ground remains detected from satellite geodetic survey may include secondary disasters. Also, a latency of SAR data acquisition is not tolerant at this moment. In the case of the Wenchuan earthquake, although Track 473 passed through one week after the event, all track information (Hao et al., 2012) still took a long time to be released by ALOS/PALSAR since the same LOS pair of satellite tracking is needed. The accuracy is limited to ~0.1 m and ~0.4 m for deformations in plain and mountainous areas, and pixel size is also limited to ~500 m in our analysis of the pixel offset-tracking method. This result calls for further study and cooperation, such as reducing the latency with more dedicated cooperation (e.g., International Charter, 2012) and improving accuracy (e.g., de Michele et al, 2010). With a multilateral cooperative effort for improving spatial observations, highly accurate pixel offset information could become available online which would be extremely valuable in mitigating future disasters. Recently we obtain the detailed data of field investigation after the analysis based on the isoseismal CSI intensity contours. We noticed that field investigation of the 4150 points (CEA, 2008) had large
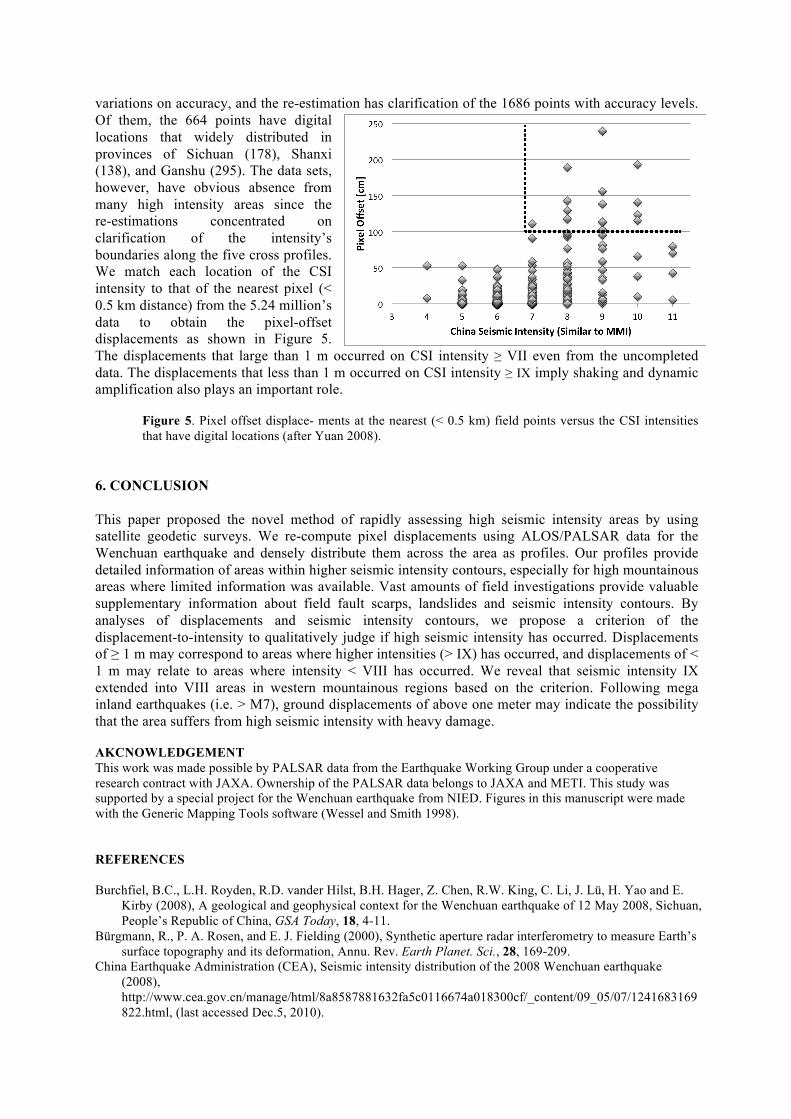
variations on accuracy, and the re-estimation has clarification of the 1686 points with accuracy levels. Of them, the 664 points have digital locations that widely distributed in provinces of Sichuan (178), Shanxi (138), and Ganshu (295). The data sets, however, have obvious absence from many high intensity areas since the re-estimations concentrated on clarification of the intensity’s boundaries along the five cross profiles. We match each location of the CSI intensity to that of the nearest pixel (< 0.5 km distance) from the 5.24 million’s data to obtain the pixel-offset displacements as shown in Figure 5. The displacements that large than 1 m occurred on CSI intensity ≥ VII even from the uncompleted data. The displacements that less than 1 m occurred on CSI intensity ≥ IX imply shaking and dynamic amplification also plays an important role.
Figure 5. Pixel offset displace- ments at the nearest (< 0.5 km) field points versus the CSI intensities that have digital locations (after Yuan 2008).
6. CONCLUSION This paper proposed the novel method of rapidly assessing high seismic intensity areas by using satellite geodetic surveys. We re-compute pixel displacements using ALOS/PALSAR data for the Wenchuan earthquake and densely distribute them across the area as profiles. Our profiles provide detailed information of areas within higher seismic intensity contours, especially for high mountainous areas where limited information was available. Vast amounts of field investigations provide valuable supplementary information about field fault scarps, landslides and seismic intensity contours. By analyses of displacements and seismic intensity contours, we propose a criterion of the displacement-to-intensity to qualitatively judge if high seismic intensity has occurred. Displacements of ≥ 1 m may correspond to areas where higher intensities (> IX) has occurred, and displacements of < 1 m may relate to areas where intensity < VIII has occurred. We reveal that seismic intensity IX extended into VIII areas in western mountainous regions based on the criterion. Following mega inland earthquakes (i.e. > M7), ground displacements of above one meter may indicate the possibility that the area suffers from high seismic intensity with heavy damage. AKCNOWLEDGEMENT This work was made possible by PALSAR data from the Earthquake Working Group under a cooperative research contract with JAXA. Ownership of the PALSAR data belongs to JAXA and METI. This study was supported by a special project for the Wenchuan earthquake from NIED. Figures in this manuscript were made with the Generic Mapping Tools software (Wessel and Smith 1998). REFERENCES Burchfiel, B.C., L.H. Royden, R.D. vander Hilst, B.H. Hager, Z. Chen, R.W. King, C. Li, J. Lü, H. Yao and E.
Kirby (2008), A geological and geophysical context for the Wenchuan earthquake of 12 May 2008, Sichuan, People’s Republic of China, GSA Today, 18, 4-11.
Bürgmann, R., P. A. Rosen, and E. J. Fielding (2000), Synthetic aperture radar interferometry to measure Earth’s surface topography and its deformation, Annu. Rev. Earth Planet. Sci., 28, 169-209.
China Earthquake Administration (CEA), Seismic intensity distribution of the 2008 Wenchuan earthquake (2008), http://www.cea.gov.cn/manage/html/8a8587881632fa5c0116674a018300cf/_content/09_05/07/1241683169822.html, (last accessed Dec.5, 2010).

Chinese National Standard (1999). The Chinese Seismic Intensity Scale, Beijing: Standards Press of China (in Chinese).
de Michele, M., Raucoules, D., De Sigoyer, J., Pubellier, M. and Chamot-Rooke, N(2010), Three-dimensional surface displacement of the 2008 May 12 Sichuan earthquake (China) derived from Synthetic Aperture Radar: evidence for rupture on a blind thrust. Geophys. J. Int., 183: 1097-1103. doi:10.1111/j.1365-246X.2010.04807.x.
Editor committee of WEDM (2008), Wenchuan Earthquake Disaster Maps (WEDM), Chengdu map press, China.
Fielding, E. J., A. Sladen, M. Simons, P. A. Rosen, S. Yun, Z. Li, J. Avouac and S. Leprince (2010), Rapid assessment of earthquakes with radar and optical geodetic imaging and finite fault models, Eos Trans. AGU, 91, Fall Meet. Suppl., Abstract G11C-03.
Hao, K. X., H. Si, H. Fujiwara, and T. Ozawa (2009), Coseismic surface-ruptures and crustal deformations of the 2008 Wenchuan earthquake Mw7.9, China, (and Cover image of), Geophys. Res. Lett., 36, L11303, doi:10.1029/2009GL037971.
Hao, K.X., H. Si and H. Fujiwara (2008), A preliminary investigation of the coseismic surface-ruptures for Wenchuan earthquake of 12 May 2008, Sichuan, China, Proc. Of 14th WCEE, S31-007, 1-7, Available at http://www.iitk.ac.in/nicee/wcee/article/14_S31-007.PDF.
Hao, K.X., T. Kobayashi and H. Fujiwara (2012), Rapid assessment of high seismic intensity areas of the 2008 Mw 7.9 Wenchuan earthquake using satellite SAR data, Seis. Res. Lett. 83, No.4, In print.
Hashimoto, M., et al. (2009), Coseismic deformation from the 2008 Wenchuan, China, earthquake derived from ALOS/PALSAR images, Tectonophysics, doi:10.1016/j.tecto.2009.08.034.
Huang, R. Q. and W. L. Li (2009), Analysis of the geo-hazards triggered by the 12 May 2008 Wenchuan Earthquake, China, Bull. Eng. Geol. Environ. 68, 363-371, doi:10.1007/s10064-009-0207-0.
Ishimoto, M. (1931), Etude preliminaire sur l’acceleration des seismes, Bull. Earthq. Res. Inst., 9, 157-167. International Charter (2012), http://www.disasterscharter.org/web/charter/home Japan Meteorological Agency (1996), Note on the JMA seismic intensity, Gyosei, 1-238. Jarvis A., H.I. Reuter, A. Nelson, E. Guevara (2008), Hole-filled seamless SRTM data V4, International centre
for tropical agriculture (CIAT), http://srtm.csi.cgiar.org. Kinoshita, S. (1998), Kyoshin Net (K-NET), Seismol. Res. Lett. 69, 309-332. Kirby, E., K., X. Whipple, W. Tang, and Z. Chen (2003), Distribution of active rock uplift along the eastern
margin of the Tibetan Plateau: Inferences from bedrock channel longitudinal profiles, J. Geophys. Res., 108, 2217.
Kobayashi , T., Y. Takada, M. Furuya, and M. Murakami (2009), Locations and types of ruptures involved in the 2008 Sichuan earthquake inferred from SAR image matching, Geophys. Res. Lett., 36, L09304, doi:10.1029/2009GL038675.
Li X. et al. Preliminary Analysis of Strong-Motion (2008), recordings from the magnitude 8.0 Wenchuan, China, earthquake of 12 May 2008, Seism. Res. Lett. 79, 844-854.
Lin, A., Z. Ren, D. Jia, X. Wu (2009), Co-seismic thrusting rupture and slip distribution produced by the 2008 Mw7.9 Wenchuan earthquake, China. Tectonophysics 471, 203-215.
Liu-Zeng, J., et al. (2009), Coseismic ruptures of the 12 May 2008, Ms 8.0 Wenchuan earthquake, Sichuan: East-west crustal shortening on oblique, parallel thrusts along the eastern edge of Tibet, Earth Planet. Sci. Lett., 286, 355-370.
Massonnet, D., and K. L. Feigl (1998), Radar interferometry and its application to changes in the Earth’s surface, Rev. Geophys., 36, 441-500.
Okada, Y., K. Kasahara, S. Hori, K. Obara, S. Sekiguchi, H. Fujiwara (2004), Japan-Hi-net, F-net, K-NET and KiK-net, Earth Planets Space 56, xv-xxviii.
Royden, L. H., B. C. Burchfiel, R. D. van der Hilst (2008), The geological evolution of the Tibetan plateau, Science, 321, 1054-1058.
Shen, Z.K., et al. (2009), Slip maxima at fault junctions and rupturing of barriers during the 2008 Wenchuan earthquake. Nature Geosci. Ngeo636.
State Council of China (2008), http://www.gov.cn/xxgk/pub/govpublic/mrlm/200809/t20080924_32957.html, (last accessed Mar.30, 2012).
Tong, X., D. T. Sandwell, and Y. Fialko (2010), Coseismic slip model of the 2008 Wenchuan earthquake derived from joint inversion of interferometric synthetic aperture radar, GPS, and field data, J. Geophys. Res., 115, B04314, doi:10.1029/2009JB006625.
Wald, D. J., P. S., K. Lin, V. Quitoriano, and B. Worden. (2006). Challenges in rapid ground motion estimation for the prompt assessment of global urban earthquakes. Bull. Earthq. Res. Inst. 81, 272-281.
Wessel, P., and W. H. F. Smith (1991). Free software helps map and display data. Eos, Transactions, American Geophysical Union 72, 445–446.

Wood, H. O., and Neumann, F. (1931), Modified Mercalli intensity scale of 1931, Bull. Seismol. Soc. Am. 21, 277-283.
Working Group of CMONC (2008), Coseismic displacement field of the 2008 Ms 8.0 Wenchuan earthquake determined by GPS, Sci. China Ser. D38, 1195-1206.
Xu, X. et al. (2009), Coseismic reverse- and oblique-slip surface faulting generated by the 2008 Mw 7.9 Wenchuan earthquake, China, Geology, 37, 515-518.
Yuan, Y. (2008), Impact of intensity and loss assessment following the great Wenchuan earthquake, Earthq. Eng. & Eng. Vib., 7, 247-254.