raleigh - national weather service · nws raleigh briefing a there are no high-impact weather...
TRANSCRIPT

Independence Day Weather Forecast for Central North Carolina
Briefing as of 9 AM, July 4, 2018 Please visit NWS Raleigh at weather.gov/Raleigh for forecast info for your specific area
• Slightly cooler than recent days, but seasonably hot with high temps around 90. Afternoon heat indices in the mid 90’s.
• Scattered to numerous , but brief, afternoon and evening showers and thunderstorms, best chance east of US-1.
Additional Details on Subsequent Pages
Fayetteville Greensboro Raleigh
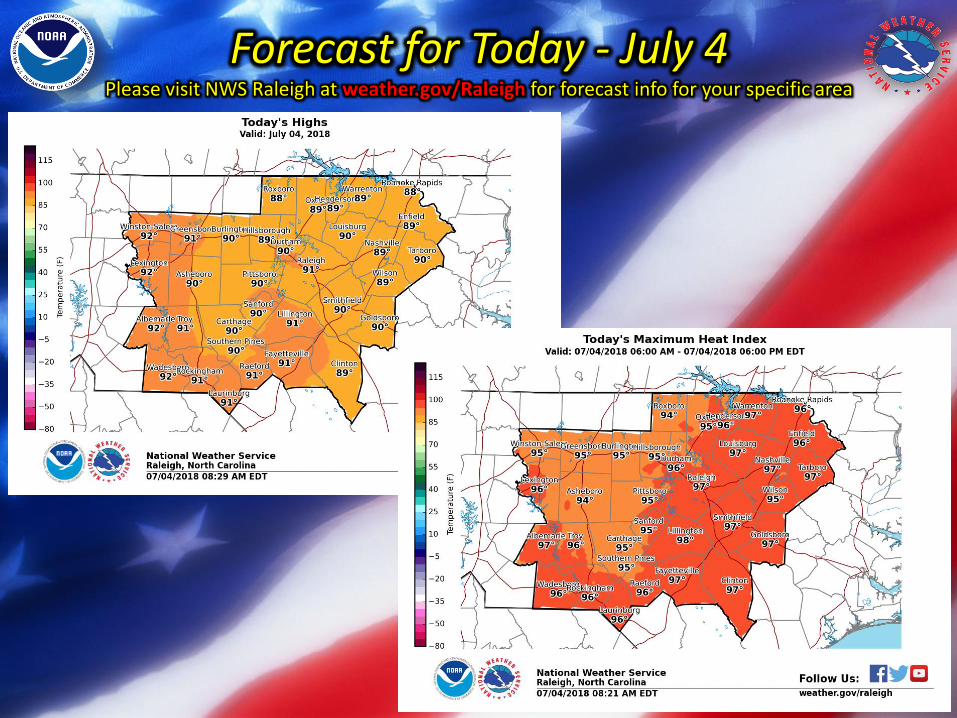
Forecast for Today - July 4 Please visit NWS Raleigh at weather.gov/Raleigh for forecast info for your specific area
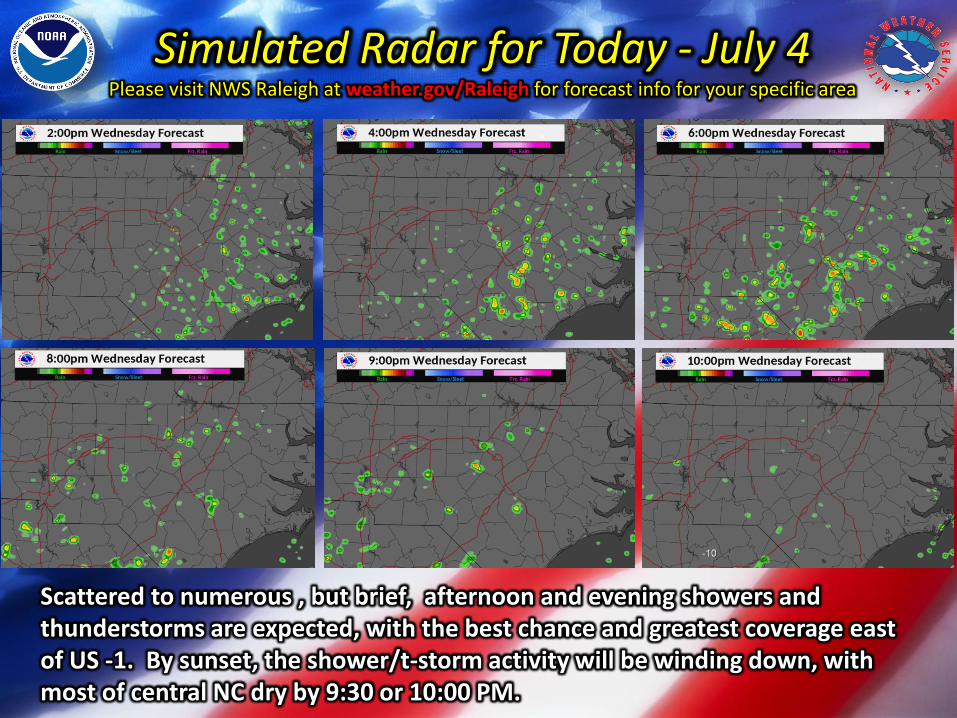
Simulated Radar for Today - July 4 Please visit NWS Raleigh at weather.gov/Raleigh for forecast info for your specific area
Scattered to numerous , but brief, afternoon and evening showers and thunderstorms are expected, with the best chance and greatest coverage east of US -1. By sunset, the shower/t-storm activity will be winding down, with most of central NC dry by 9:30 or 10:00 PM.
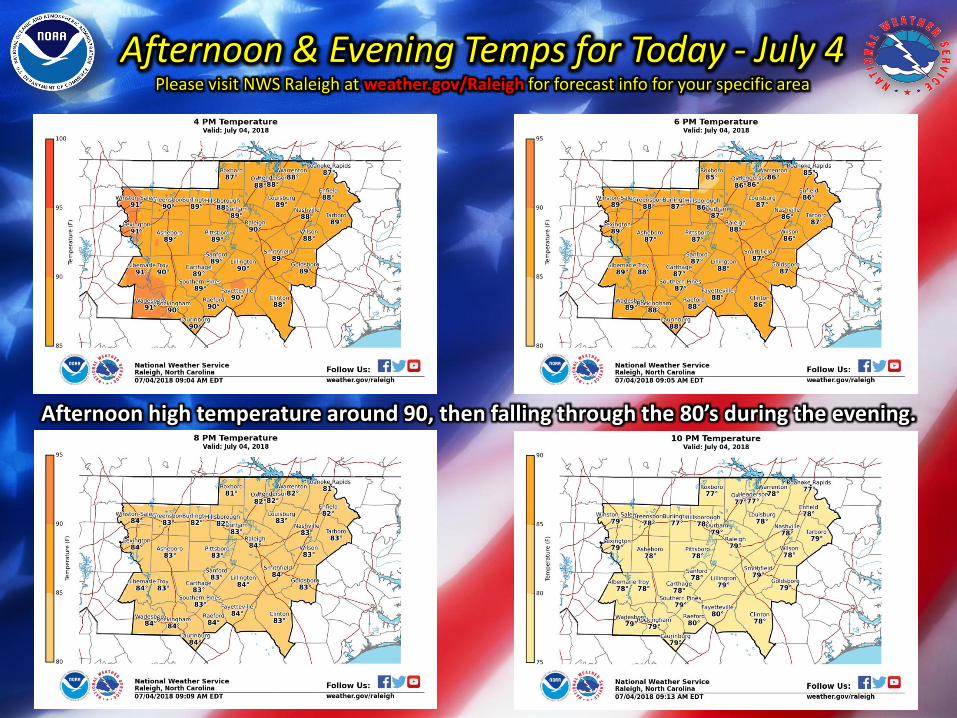
Afternoon & Evening Temps for Today - July 4 Please visit NWS Raleigh at weather.gov/Raleigh for forecast info for your specific area
Afternoon high temperature around 90, then falling through the 80’s during the evening.

Independence Day Climatology Temperature Data Going Back 15 Years
RDU GSO FAY
Year Max Min Rainfall Max Min Rainfall Max Min Rainfall
Normal 90 70 88 69 91 71
2018 (Forecast) 91 74 91 73 92 74
2017 92 71 0.84 89 69 0 92 67 T
2016 85 69 0.02 85 67 1.23 94 74 T
2015 87 69 0.06 86 68 0 89 72 0
2014 88 71 T 86 67 0 90 73 0
2013 88 73 T 86 73 0.21 90 74 0
2012 101 73 0.24 95 71 0 96 74 0
2011 99 70 1.38 93 69 0.09 95 74 0.02
2010 93 61 0 90 62 0 89 60 0
2009 90 60 0 84 61 0 92 67 0
2008 95 69 0.62 92 67 0.29 97 71 0.26
2007 89 65 0 86 66 0 88 63 0
2006 94 75 0 92 71 0.82 94 74 0
2005 90 73 T 84 72 0.19 90 73 0.48
2004 90 73 T 89 70 0.1 92 71 T
2003 91 65 0 89 66 0 92 69 0
Rank Max Year
1 79 1902
2 76 1897
3 75 2006
4 73 2013
- 73 2012
- 73 2005
- 73 2004
- 73 1987
- 73 1934
- 73 1901
- 73 1900
- 73 1898
RDU Top 10 High Min T
Period of record: 1887-01-01 to 2018-07-02
Rank Max Year
1 73 2013
- 73 1925
- 73 1903
4 72 2005
- 72 1973
6 71 2012
- 71 2006
- 71 2000
- 71 1999
- 71 1993
- 71 1983
- 71 1978
- 71 1970
- 71 1926
- 71 1910
- 71 1906
Period of record: 1903-01-01 to 2018-07-02
GSO Top 10 Day High Min T
Rank Max Year
1 78 1913
2 75 2011
- 75 1970
- 75 1925
- 75 1902
6 74 2012
- 74 2006
- 74 1993
9 73 2014, 2013,
- 73 2005, 2002,
- 73 1999, 1997,
- 73 1991, 1980,
- 73 1966, 1926,
- 73 1910, 1903, 1901
FAY Area Top 10 High Min T
Period of record: 1899-01-01 to 2018-07-02