nws training guide in surface weather observations
TRANSCRIPT
METAR KWSH 031558Z 11014KT 7SM !SHRA BKN040 28/21 A3005
Training Guide in
SurfaceWeather Observations
MAY 1998
U.S. DEPARTMENT OF COMMERCENATIONAL OCEANIC AND ATMOSPHERIC ADMINISTRATION
National Weather ServiceOffice of Systems OperationsSystems Integration DivisionObserving Systems Branch1325 East-West Highway
Silver Spring, Maryland 20910
NATIONAL WEATHER SERVICE
“Serving the Nation Since 1870”
i
PREFACE
METAR/SPECI is the international standard code for hourly and special surface weather observations.The METAR acronym roughly translates from the French as Aviation Routine Weather Report. Aspecial report, SPECI, is merely a METAR-formatted report which is issued on a non-routine basis asdictated by changing meteorological conditions. The SPECI acronym roughly translates as AviationSelected Special Weather Report.
National Weather Service Observing Handbook No. 7, Part I (WSOH #7), and National Weather ServiceObserving Handbook No. 8 (WSOH #8) prescribe aviation weather observing, reporting, and codingprocedures applicable to taking and reporting manual surface observations. They provide a frameworkwithin which meteorological phenomena can be identified and reported in a standardized andunderstandable format. The type of station you are assigned to will determine which National WeatherService Observation Handbook is to be used for your station’s surface weather observing program.
WSOH #7 provides procedures and practices for NWS and NWS-contract personnel. WSOH #8prescribes procedures and practices for Supplementary Aviation Weather Reporting Stations (SAWRS).
Training Guide in Surface Weather Observations is designed to provide additional information inobserving, recording, and coding of manual surface weather reports. The Training Guide doesn’t includeeverything you need to know. Therefore, it is necessary to use it in conjunction with your station’sWSOH.
When you’ve finished reading a chapter in your station’s WSOH, read the discussion in the trainingguide. When you are confident and familiar with the contents of both, proceed to the review questionsat the end of each chapter. Answer each question, but DO NOT guess at the answers. If in doubt, lookup the answer in the appropriate instructions. This will help you become more familiar with theHandbooks.
Correct answers to review questions can be found in Appendix A. Use these answers only afteranswering all questions in the chapter. If you made a mistake, locate the appropriate instructions anddetermine where you went wrong.
Complete the Observing and Coding Exercises and the Quality Control Exercises in Chapter 9 only afterall other chapters in the training guide are completed. Correct answers to the exercises can be found inAppendix A.
Because this Training Guide provides a wide spectrum of information on surface weather observations,some of the information may not be applicable to a station’s observing program. For example, SAWRSare not required to provide 3- and 6-hourly precipitation amounts, 24-hour precipitation amounts, snowdepth on the ground, or water equivalent of snow on the ground data; so a student working at a SAWRSwould not need to study this information. Therefore, students should consider only the information inthis study guide that is applicable to their station’s observing program.

ii
iii
Table of Contents
Page
PREFACE . . . . . . . . . . . . . . . . . . . . . . . . . . . . . . . . . . . . . . . . . . . . . . . . . . . . . . . . . . . . . . . . . . . . . . i
CHAPTER 1 - GENERAL . . . . . . . . . . . . . . . . . . . . . . . . . . . . . . . . . . . . . . . . . . . . . . . . . . . . . . 1-1Content and Format of the Manual METAR/SPECI . . . . . . . . . . . . . . . . . . . . . . . . . . . . . . . . 1-2Type of Report - METAR/SPECI . . . . . . . . . . . . . . . . . . . . . . . . . . . . . . . . . . . . . . . . . . . . . . . 1-2Station Identifier - CCCC . . . . . . . . . . . . . . . . . . . . . . . . . . . . . . . . . . . . . . . . . . . . . . . . . . . . . 1-3Date/Time Group - YYGGggZ . . . . . . . . . . . . . . . . . . . . . . . . . . . . . . . . . . . . . . . . . . . . . . . . . 1-3Report Modifier - COR . . . . . . . . . . . . . . . . . . . . . . . . . . . . . . . . . . . . . . . . . . . . . . . . . . . . . . . 1-4Delayed Reports . . . . . . . . . . . . . . . . . . . . . . . . . . . . . . . . . . . . . . . . . . . . . . . . . . . . . . . . . . . . 1-4Differences Between Transmitted Coded Report and MF1M-10 Entries . . . . . . . . . . . . . . . . 1-4Various Observational Programs . . . . . . . . . . . . . . . . . . . . . . . . . . . . . . . . . . . . . . . . . . . . . . . 1-4REVIEW QUESTIONS . . . . . . . . . . . . . . . . . . . . . . . . . . . . . . . . . . . . . . . . . . . . . . . . . . . . . . 1-7
CHAPTER 2 - WIND . . . . . . . . . . . . . . . . . . . . . . . . . . . . . . . . . . . . . . . . . . . . . . . . . . . . . . . . . . 2-1
m m mWind Group - dddff(f)Gf f (f )KT . . . . . . . . . . . . . . . . . . . . . . . . . . . . . . . . . . . . . . . . . . . . . 2-1
n n n x x xVariable Wind Direction - d d d Vd d d . . . . . . . . . . . . . . . . . . . . . . . . . . . . . . . . . . . . . . . . . 2-2Wind Shifts . . . . . . . . . . . . . . . . . . . . . . . . . . . . . . . . . . . . . . . . . . . . . . . . . . . . . . . . . . . . . . . 2-2REVIEW QUESTIONS . . . . . . . . . . . . . . . . . . . . . . . . . . . . . . . . . . . . . . . . . . . . . . . . . . . . . . 2-5
CHAPTER 3 - VISIBILITY . . . . . . . . . . . . . . . . . . . . . . . . . . . . . . . . . . . . . . . . . . . . . . . . . . . . . 3-1Prevailing Visibility . . . . . . . . . . . . . . . . . . . . . . . . . . . . . . . . . . . . . . . . . . . . . . . . . . . . . . . . . 3-1Visibility Chart . . . . . . . . . . . . . . . . . . . . . . . . . . . . . . . . . . . . . . . . . . . . . . . . . . . . . . . . . . . . . 3-7Runway Visual Range . . . . . . . . . . . . . . . . . . . . . . . . . . . . . . . . . . . . . . . . . . . . . . . . . . . . . . . . 3-8REVIEW QUESTIONS . . . . . . . . . . . . . . . . . . . . . . . . . . . . . . . . . . . . . . . . . . . . . . . . . . . . . 3-11
CHAPTER 4 - PRESENT WEATHER . . . . . . . . . . . . . . . . . . . . . . . . . . . . . . . . . . . . . . . . . . . . 4-1Coding of Present Weather Group(s) . . . . . . . . . . . . . . . . . . . . . . . . . . . . . . . . . . . . . . . . . . . . 4-7REVIEW QUESTIONS . . . . . . . . . . . . . . . . . . . . . . . . . . . . . . . . . . . . . . . . . . . . . . . . . . . . . 4-11
CHAPTER 5 - SKY CONDITION . . . . . . . . . . . . . . . . . . . . . . . . . . . . . . . . . . . . . . . . . . . . . . . . 5-1Sky Cover . . . . . . . . . . . . . . . . . . . . . . . . . . . . . . . . . . . . . . . . . . . . . . . . . . . . . . . . . . . . . . . . . 5-2Cloud and Ceiling Heights . . . . . . . . . . . . . . . . . . . . . . . . . . . . . . . . . . . . . . . . . . . . . . . . . . . 5-15Maintenance of Cloud Height Equipment . . . . . . . . . . . . . . . . . . . . . . . . . . . . . . . . . . . . . . . 5-19REVIEW QUESTIONS . . . . . . . . . . . . . . . . . . . . . . . . . . . . . . . . . . . . . . . . . . . . . . . . . . . . . 5-23
CHAPTER 6 - TEMPERATURE AND DEW POINT . . . . . . . . . . . . . . . . . . . . . . . . . . . . . . . . 6-1Difference Between Coded Report and MF1M-10 Entries . . . . . . . . . . . . . . . . . . . . . . . . . . . 6-1Reporting Temperature and Dew Point . . . . . . . . . . . . . . . . . . . . . . . . . . . . . . . . . . . . . . . . . . 6-1The Psychrometer . . . . . . . . . . . . . . . . . . . . . . . . . . . . . . . . . . . . . . . . . . . . . . . . . . . . . . . . . . . 6-2Computing the Dew Point . . . . . . . . . . . . . . . . . . . . . . . . . . . . . . . . . . . . . . . . . . . . . . . . . . . . 6-4Obtaining Temperatures from Hygrothermometers . . . . . . . . . . . . . . . . . . . . . . . . . . . . . . . . . 6-7Liquid-In-Glass Minimum and Maximum Thermometers . . . . . . . . . . . . . . . . . . . . . . . . . . . . 6-8Correcting Thermometer Errors . . . . . . . . . . . . . . . . . . . . . . . . . . . . . . . . . . . . . . . . . . . . . . . 6-14Maximum/Minimum Temperature System (MMTS) . . . . . . . . . . . . . . . . . . . . . . . . . . . . . . . 6-15REVIEW QUESTIONS . . . . . . . . . . . . . . . . . . . . . . . . . . . . . . . . . . . . . . . . . . . . . . . . . . . . . 6-17
iv
Page
CHAPTER 7 - PRESSURE . . . . . . . . . . . . . . . . . . . . . . . . . . . . . . . . . . . . . . . . . . . . . . . . . . . . . . 7-1
H H H HAltimeter Setting - AP P P P . . . . . . . . . . . . . . . . . . . . . . . . . . . . . . . . . . . . . . . . . . . . . . . . . 7-1
pStation Elevation - H . . . . . . . . . . . . . . . . . . . . . . . . . . . . . . . . . . . . . . . . . . . . . . . . . . . . . . . . 7-2Sea-Level Pressure . . . . . . . . . . . . . . . . . . . . . . . . . . . . . . . . . . . . . . . . . . . . . . . . . . . . . . . . . . 7-2Difference Between Coded Report and MF1M-10C Entries . . . . . . . . . . . . . . . . . . . . . . . . . . 7-3Altimeter Setting Accuracy . . . . . . . . . . . . . . . . . . . . . . . . . . . . . . . . . . . . . . . . . . . . . . . . . . . . 7-3REVIEW QUESTIONS . . . . . . . . . . . . . . . . . . . . . . . . . . . . . . . . . . . . . . . . . . . . . . . . . . . . . . 7-5
CHAPTER 8 - REMARKS . . . . . . . . . . . . . . . . . . . . . . . . . . . . . . . . . . . . . . . . . . . . . . . . . . . . . . 8-1Some of the More Important Remarks . . . . . . . . . . . . . . . . . . . . . . . . . . . . . . . . . . . . . . . . . . . 8-2Measuring Precipitation . . . . . . . . . . . . . . . . . . . . . . . . . . . . . . . . . . . . . . . . . . . . . . . . . . . . . . 8-5Contractions . . . . . . . . . . . . . . . . . . . . . . . . . . . . . . . . . . . . . . . . . . . . . . . . . . . . . . . . . . . . . . . 8-8Difference Between Coded Report and MF1M-10 Entries . . . . . . . . . . . . . . . . . . . . . . . . . . . 8-9REVIEW QUESTIONS . . . . . . . . . . . . . . . . . . . . . . . . . . . . . . . . . . . . . . . . . . . . . . . . . . . . . 8-11
CHAPTER 9 - REVIEW EXERCISESOBSERVING and CODING EXERCISES . . . . . . . . . . . . . . . . . . . . . . . . . . . . . . . . . . . . . . . 9-1QUALITY CONTROL EXERCISE . . . . . . . . . . . . . . . . . . . . . . . . . . . . . . . . . . . . . . . . . . . . 9-13
APPENDIX A - ANSWERS TO CHAPTER and REVIEW EXERCISESANSWERS TO CHAPTER QUESTIONS . . . . . . . . . . . . . . . . . . . . . . . . . . . . . . . . . . . . . . A-1ANSWERS TO OBSERVING and CODING EXERCISES - CHAPTER 9 . . . . . . . . . . . . A-21ANSWERS TO QUALITY CONTROL EXERCISE - CHAPTER 9 . . . . . . . . . . . . . . . . . A-23
APPENDIX B - DEW POINT TABLE . . . . . . . . . . . . . . . . . . . . . . . . . . . . . . . . . . . . . . . . . . . . B-1
APPENDIX C - TRANSMISSION FORM FOR MANUAL OBSERVATIONS,WS Form B-11 . . . . . . . . . . . . . . . . . . . . . . . . . . . . . . . . . . . . . . . . . . . . . . . . . . . . . . . . . . . . . C-1
APPENDIX D - ORDER OF OBSERVING ELEMENTS . . . . . . . . . . . . . . . . . . . . . . . . . . . . D-1
The MF1M-10A, B, and C have the same column numbers and designations.1
1-1
CHAPTER 1
GENERAL
This chapter introduces you to the Aviation Weather Observation and some of the procedures used inthe observing program.
1.1 General Information
1.1.1 The Aviation Weather Observation
An Aviation Weather Observation is used to report the various meteorological elements that togetherdescribe the atmosphere as observed and evaluated from the observer’s position. The meteorologicalelements normally observed are: Wind, Visibility, Present Weather, Sky Condition, Temperature, DewPoint, Altimeter Setting, and Remarks.
Learning what to observe and how to report your observation is described in National Weather ServiceObserving Handbooks (WSOH #7 and WSOH #8). The format of these Handbooks is such thatinformation concerning an element is contained in its named chapter. A separate chapter covers codinginformation for all elements and information for entries on Meteorological Form 1M-10 (MF1M-10) forall elements provided in separate chapters.
1.1.2 Meteorological Form 1M-10 (A, B, and C)1
MF1M-10 (A, B, and C) are the standard forms used to log observations. The form your station usesis the official record of observations taken and disseminated by your station. If you make a mistake onthe form, correct the error with the same black ink used to record the observation. Whether the error wasdiscovered before or after the dissemination of the observation, correct the erroneous data by clearlydrawing a single line through the error. Do not erase or obliterate the entry by writing over it or bycovering it up.
The accuracy of the actual time of the observation is of the utmost importance in aviation safetyinvestigations. Therefore, the station clock needs to be checked daily at part-time stations, on each shiftat full-time stations, or if there is an aircraft mishap. Time checks are logged in column 65 of MF1M-10.
By the second working day of the following month, send the originals of all MF1M-10’s used duringthe month to the National Climatic Data Center. SAWRS send their original MF1M-10C forms usedduring the month to the station designated by the NWS regional headquarters. This station will checkthe forms and advise the SAWRS of any corrections required on the forms by means of WS Form B-14,“Notice of Corrections To Weather Records.” Make corrections to the associated MF1M-10 forms thatare on hand. SAWRS with more than one observer shall post the B-14 so that all observers can reviewit. These notices are an excellent aid for the station’s on-going training and quality control programs.
Once the MF1M-10 is reviewed, the correction notices along with the associated copies of the weatherrecords shall be retained in accordance with the local guidelines provided by the supervising office. Iflocal guidelines were not provided, you may discard the records when they are 90 days old.
1-2
1.2 Content and Format of the Manual METAR/SPECI
The following is an overview of the various elements in a METAR/SPECI report. Each element isdescribed in the following paragraphs and chapters. Each element or group is separated by a space ina transmitted report.
a. Body of report.
(1) Type of Report - METAR or SPECI(2) Station Identifier - CCCC(3) Date and Time of Report - YYGGggZ(4) Report Modifier - COR
n n n x x x(5) Wind - dddff(f)KT_d d d Vd d d(6) Visibility - VVVVVSM
R R R R R R(7) Runway Visual Range - RD D /V V V V FT or
R R N N N N X X X XRD D /V V V V VV V V V FT(8) Present Weather - w0w0
s s s s s s s s s(9) Sky Condition - N N N h h h or VVh h h or SKC
d d(10) Temperature and Dew Point - T0T0/T0 T0
H H H H(11) Altimeter - AP P P P
b. Remarks Section of Report - RMK
(1) Manual and Plain Language(2) Additive Data
1.3 Type of Report - METAR/SPECI
The type of report is the first element of the coded report.
The type of report shall be METAR for a routine report and SPECI for a special report. Transmittedreports shall always begin with either METAR or SPECI, entered as M or S in column 1 of MF1M-10.
1.3.1 METAR
METAR is a routine scheduled observation and is the primary observation code used in the United Statesto satisfy requirements for reporting surface meteorological data. METAR contains a report of wind,visibility, present weather, sky condition, temperature, dew point, and altimeter setting collectivelyreferred to as “the body of the report.” In addition, information that elaborates on data in the body ofthe report may be appended to the METAR. This significant information can be found in the sectionreferred to as “Remarks.”
1.3.2 SPECI
SPECI is an unscheduled observation. SPECI observations are taken when specific weather conditionshave been met or observed (noted). SPECI reports shall contain all the data elements found in aMETAR report (except single-element special) plus additional plain language information that elaborateson data in the body of the report. All SPECIs shall be made as soon as possible after the relevant specialcriteria are met or observed. Whenever SPECI criteria are met or observed at the time of a METAR, thetype of report shall be METAR. Single-element special observations are authorized to be taken fortornadic activity and volcanic eruptions.
1-3
There are two categories of criteria for taking SPECIs. The first is applicable to all stations across theUnited States. The second category of criteria for taking SPECIs is determined by you the observer. Itallows you to take a SPECI observation to report any phenomenon that in your opinion is operationallysignificant at your station. In making these SPECI reports, there are no limits. Even if no provision ismade for reporting a particular occurrence, take a SPECI and report the phenomenon even if it isnecessary to use plain language in Remarks.
1.4 Station Identifier - CCCC
The second element of the transmitted coded aviation weather report is the Station Identifier:This is entered on MF1M-10 in the heading block labeled SID.
The METAR/SPECI uses the International Civil Aviation Organization (ICAO) four-letter stationidentifier. All airports in the 48 contiguous states begin with the letter “K” followed by the three-letteridentifier for the airport. Alaskan stations all begin with “PA” for Pacific-Alaskan, Hawaiian stationsbegin with “PH” for Pacific-Hawaiian. The “PA” or “PH” is followed by the international two-letteridentifier for that station.
Stations in the Eastern Caribbean begin with the letter “T”; Western Caribbean stations begin with theletter “M”; Guam stations begin with the letters “PG.”
Examples: New Iberia, LA - KARA Alexandria, LA - KAEXSugar Land, TX - KSGR Anchorage, AK - PANCNome, AK - PAOM Honolulu, HI - PHNLKeahole Point, HI - PHKO
1.5 Date/Time Group - YYGGggZ
The third element of the coded aviation weather observation is the Date/Time group.
YY - two-digit date GG - two-digit hour gg - two-digit minutes Z - letter indicator for UTC
In the METAR/SPECI, the day and time of observation is a six-character field plus the letter “Z.” Thefirst two digits “YY” are the day of the month and the next four digits “GGgg” are the time. The timesentered are in reference to the 24-hour clock. The letter “Z” is added to the end of the group to indicatethe date and time are in Coordinated Universal Time.
The date and time are included in all reports. The actual time of a METAR report is the time the lastelement of the observation was observed. The actual time of a SPECI report is when the criterion fora SPECI is met or noted. If the report is a correction to a previously disseminated report, the time of thecorrected report shall be the same time used in the report being corrected.
Examples: An observation taken on the 23rd of the month at 1955 UTCMETAR KARA 231955Z
An observation taken on the 1st of the month at 0550 UTCMETAR KAEX 010550Z
An observation taken on the 10th of the month at 0005 UTCSPECI PAOM 100005Z
1-4
An observation taken on the 20th of the month at 4:35 PM UTCSPECI PHKO 201635Z
1.6 Report Modifier - COR
The Report Modifier falls between the “Date/Time” group and the “Wind” group when used. The onlymodifier for the report will be COR. COR indicates the report is a correction to a previouslytransmitted report. Corrections transmitted shall consist of the entire corrected report. The original dateand time of the report shall be used as the date and time in the corrected report.
Example of a Transmitted Corrected Report:
METAR KOKC 011955Z COR 22015G25KT 3/4SM TSRA BR OVC010CB 18/16 A2992 RMKFRQ LTGIC TS OHD MOV E
Corrections to a still valid observation should be given to everyone who received the erroneous data.
1.7 Delayed Reports
If an observation is taken but cannot be transmitted before the next regularly scheduled report, only thelatest report shall be transmitted. The remark FIBI (Filed But Impractical to Transmit) shall beappended in parentheses to the report that was not transmitted to indicate the report was not transmitted.The remark FIBI shall not be included in local dissemination of the report.
Reports of Volcanic Eruption shall be disseminated by any means possible, regardless of the delay.
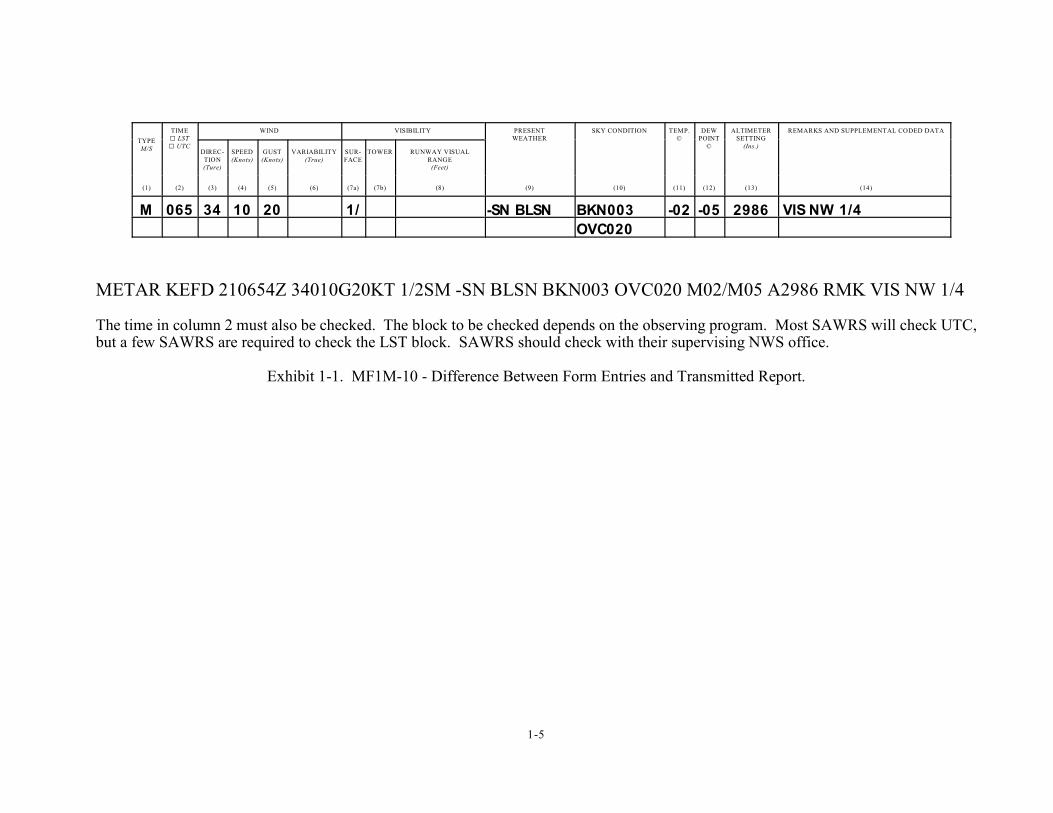
1.8 Differences Between Transmitted Coded Report and MF1M-10 Entries
When reviewing your station’s WSOH, you should have noticed there are some differences betweenthe transmitted coded report and entries made in the columns on MF1M-10 (see Exhibit 1-1). Thecoded report contains certain “letter indicators” to show the unit of measure used, time standard used,or to separate “the body of the report” from the “remarks” section of the report, while such entries arenot made on MF1M-10. This training guide highlights where these differences exist in each element.
Failure to place the correct “letter indicator” in its proper location or to place a required space in thetransmitted coded report may result in the report not being decoded properly. For example, the reportwill not be decoded if the “Z” is not placed after the date/time group. The observation will not makeit into hourly roundups, etc.
1.9 Various Observational Programs
Because of the great variety of observational programs, it is impractical to explain in this training guidehow the various observations apply to each station. Therefore, you should discuss this part of theprogram with either the Surface Observation Specialist from the NWS regional headquarters or witha visiting representative from the supervising station.
1-5
TYPEM/S
TIMEG LSTG UTC
WIND VISIBILITY PRESENTWEATHER
SKY CONDITION TEMP.©
DEWPOINT
©
ALTIMETERSETTING
(Ins.)
REMARKS AND SUPPLEMENTAL CODED DATA
DIREC-TION(Ture)
SPEED(Knots)
GUST(Knots)
VARIABILITY(True)
SUR-FACE
TOWER RUNWAY VISUALRANGE
(Feet)
(1) (2) (3) (4) (5) (6) (7a) (7b) (8) (9) (10) (11) (12) (13) (14)
M 065 34 10 20 1/ -SN BLSN BKN003 -02 -05 2986 VIS NW 1/4
OVC020
METAR KEFD 210654Z 34010G20KT 1/2SM -SN BLSN BKN003 OVC020 M02/M05 A2986 RMK VIS NW 1/4
The time in column 2 must also be checked. The block to be checked depends on the observing program. Most SAWRS will check UTC,but a few SAWRS are required to check the LST block. SAWRS should check with their supervising NWS office.
Exhibit 1-1. MF1M-10 - Difference Between Form Entries and Transmitted Report.

1-6
1-7
REVIEW QUESTIONS
1. What are the designators used on coded aviation weather observations for the following types ofreports?
a. Routine report
b. Unscheduled report
2. Weather conditions being equal, why should you allow more time for taking observations at nightthan during the day?
3. If you decide at the time of an observation that the normal procedures given in your station’sHandbook are inappropriate for circumstances at hand, what should you do?
4. How often should time checks be made on the official station clock used as the station standard?
5. How long are you required to retain carbon copies of MF1M-10?
6. When the actual cloud height or visibility falls midway between two reportable values, which valueis reported?
7. The time of observation, which is entered in column 2 for most SAWRS, is in:
a. UTCb. LSTc. LDTd. GMT
8. Under what conditions may you omit taking a SPECI when notified of an aircraft mishap?
9. If you discover an error in column 9 after you have given the observation to the tower, you should correct the error by:
a. erasing the erroneous entry and entering the correct data in redb. erasing the erroneous entry and entering the correct data in blackc. drawing a line through the erroneous entry and entering the correct data in redd. drawing a line through the erroneous entry and entering the correct data in black
10. All time entries in column 2 of MF1M-10 are made with reference to the hour clock.
11. The primary observation code to be used in the U.S. to satisfy requirements for reporting surfacemeteorological data is:
a. METARb. SAc. SAWRSd. synoptic
1-8
12. A METAR observation contains section(s), .
a. 1, the body of the reportb. 1, the remarksc. 2, the body of the report and the remarksd. 3, the time, the data, and the remarks
13. A SPECI observation contains section(s), .
a. 1, the body of the reportb. 1, the remarksc. 3, the time, the data, and the remarksd. 2, the body of the report and the remarks
14. Which of the following meet SPECI criteria? (more than one answer):
the wind speed is 15 kt while the wind direction changes by 60 degrees in 10 minutes surface visibility drops from 2 1/2 miles to 2 miles a tornado is observed hail intensity changes thunderstorm begins the ceiling changes from 3,000 ft to 2,500 ft AGL a new cloud layer is observed below 1,000 ft AGL an aircraft mishap occurs squalls occur
15. Regardless of the delay, observations containing which of the following elements must bedisseminated?
a. volcanic eruptionsb. tornadoesc. thunderstormsd. blizzards
16. If SPECI criteria are met or observed at the time a METAR observation is due, it is coded as a:
a. METARb. SPECIc. RSPECId. RS
17. The station identifier is the ________ element in a METAR/SPECI coded report.
a. firstb. secondc. thirdd. sixth
1-9
18. The ICAO identifier uses letters.
a. threeb. fivec. twod. four
19. Which report includes the Date and Time group?
a. METARb. SPECIc. SAd. both METAR and SPECI
20. In a METAR report, the time of the Date/Time group is:
a. the time the observation is disseminatedb. actual time of the reportc. time the last element is observedd. both b and c
21. In a SPECI report, the time of the Date/Time group is:
a. the time the observation is disseminatedb. the time of the last METAR reportc. when the criterion for a SPECI is met or notedd. 5 minutes before the event was noticed
22. Which time will be used for the Date/Time group if the report is a corrected one?
a. same time used in the report being correctedb. time when the error was noticedc. time when the last element was entered on the corrected reportd. time of the next METAR or SPECI report
23. Code the following Date/Time groups. All times are in UTC.
a. 1st of month at 1001 b. 9th of month at 1755 c. 15th of month at 2045 d. 30th of month at 0113 e. 7th of month at 1625
24. In a manual observation, what is the only report modifier used?
a. AUTOb. RMKc. TMPd. COR
1-10
25. At no time shall an observation be started more than minutes prior to the scheduledobservation time.
26. Corrected reports are not transmitted if they are:
a. more than 15 minutes oldb. superseded by a later reportc. recorded locallyd. only minor corrections
27. What remark is appended to the report of a METAR or SPECI observation that is not transmitted?
28. People authorized to take weather observations:
a. need no training or certificationb. must have training but not certificationc. must be certified by the National Weather Serviced. are not paid
29. Place the following groups in the order in which they occur in METAR/SPECI:
date and time of report sky condition visibility type of report present weather report modifier altimeter wind temperature and dew point station identifier manual and plain language remarks
30. If an element does not occur or cannot be observed, it is:
a. marked missingb. estimatedc. omitted from the reportd. added from complementary data
31. The time of observation, which is entered in Column 2 for the NWS, is in:
a. UTCb. LSTc. LDTd. GMT
2-1
CHAPTER 2
WIND
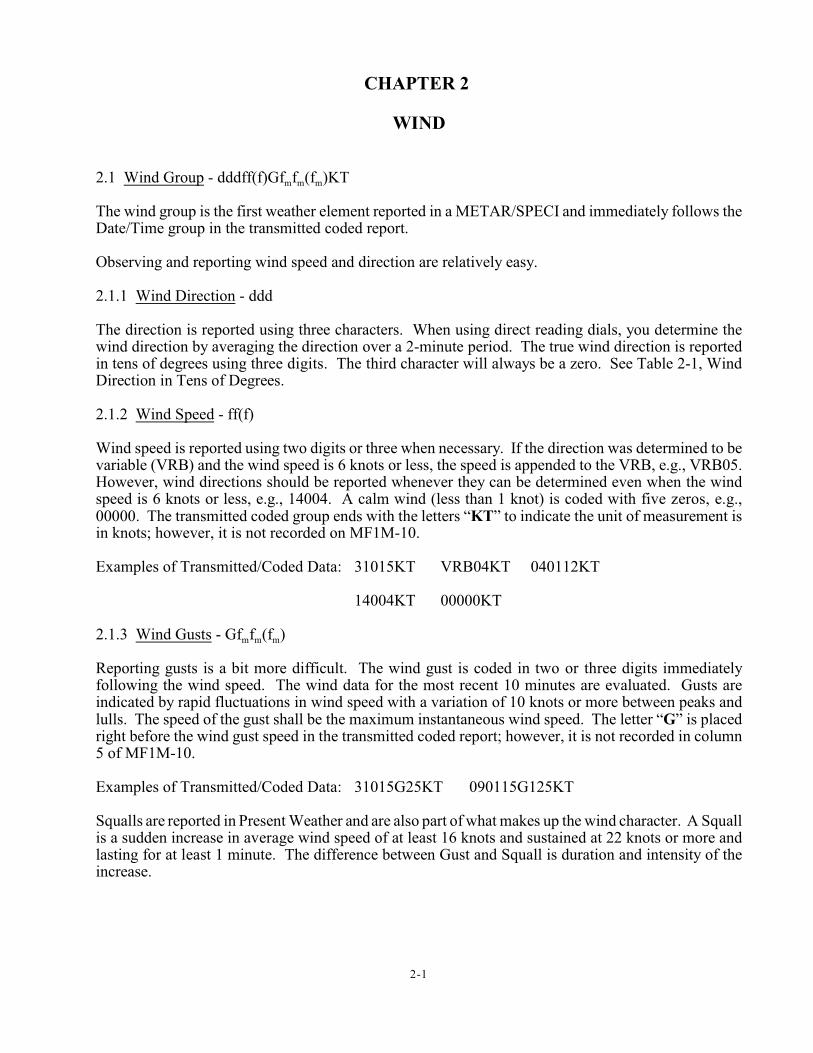
m m m2.1 Wind Group - dddff(f)Gf f (f )KT
The wind group is the first weather element reported in a METAR/SPECI and immediately follows theDate/Time group in the transmitted coded report.
Observing and reporting wind speed and direction are relatively easy.
2.1.1 Wind Direction - ddd
The direction is reported using three characters. When using direct reading dials, you determine thewind direction by averaging the direction over a 2-minute period. The true wind direction is reportedin tens of degrees using three digits. The third character will always be a zero. See Table 2-1, WindDirection in Tens of Degrees.
2.1.2 Wind Speed - ff(f)
Wind speed is reported using two digits or three when necessary. If the direction was determined to bevariable (VRB) and the wind speed is 6 knots or less, the speed is appended to the VRB, e.g., VRB05.However, wind directions should be reported whenever they can be determined even when the windspeed is 6 knots or less, e.g., 14004. A calm wind (less than 1 knot) is coded with five zeros, e.g.,00000. The transmitted coded group ends with the letters “KT” to indicate the unit of measurement isin knots; however, it is not recorded on MF1M-10.
Examples of Transmitted/Coded Data: 31015KT VRB04KT 040112KT
14004KT 00000KT
m m m2.1.3 Wind Gusts - Gf f (f )
Reporting gusts is a bit more difficult. The wind gust is coded in two or three digits immediatelyfollowing the wind speed. The wind data for the most recent 10 minutes are evaluated. Gusts areindicated by rapid fluctuations in wind speed with a variation of 10 knots or more between peaks andlulls. The speed of the gust shall be the maximum instantaneous wind speed. The letter “G” is placedright before the wind gust speed in the transmitted coded report; however, it is not recorded in column5 of MF1M-10.
Examples of Transmitted/Coded Data: 31015G25KT 090115G125KT
Squalls are reported in Present Weather and are also part of what makes up the wind character. A Squallis a sudden increase in average wind speed of at least 16 knots and sustained at 22 knots or more andlasting for at least 1 minute. The difference between Gust and Squall is duration and intensity of theincrease.
2-2
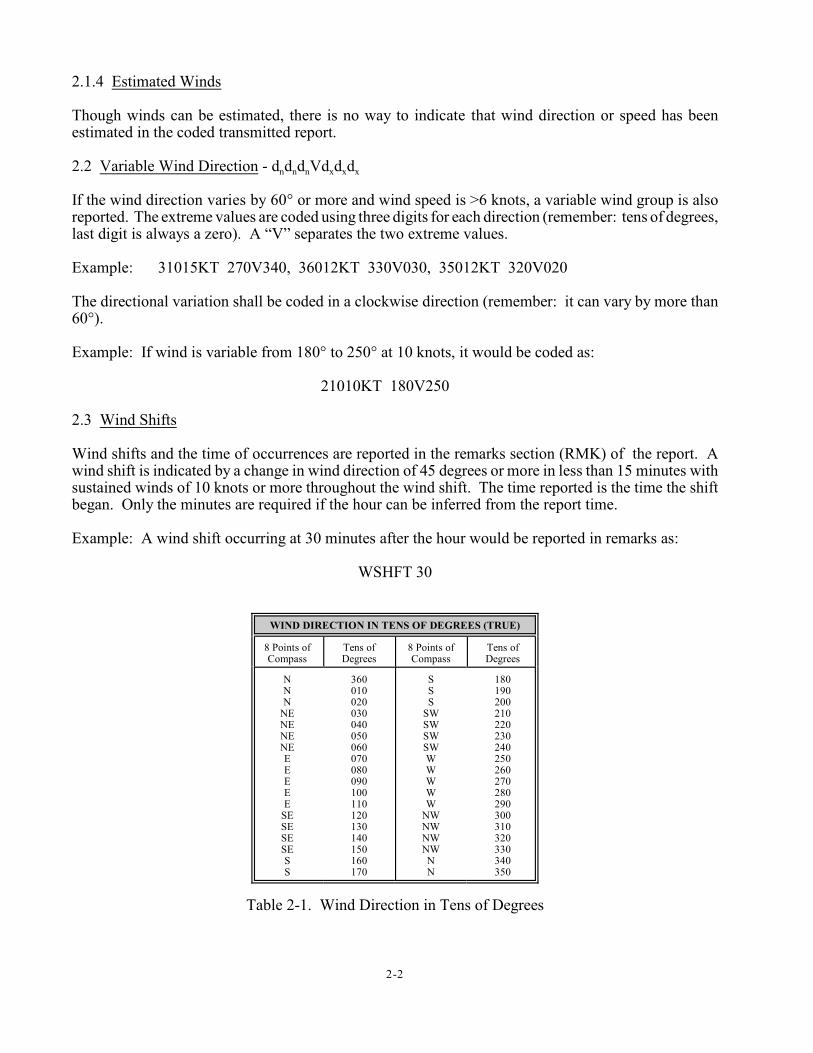
2.1.4 Estimated Winds
Though winds can be estimated, there is no way to indicate that wind direction or speed has beenestimated in the coded transmitted report.
n n n x x x2.2 Variable Wind Direction - d d d Vd d d
If the wind direction varies by 60° or more and wind speed is >6 knots, a variable wind group is alsoreported. The extreme values are coded using three digits for each direction (remember: tens of degrees,last digit is always a zero). A “V” separates the two extreme values.
Example: 31015KT 270V340, 36012KT 330V030, 35012KT 320V020
The directional variation shall be coded in a clockwise direction (remember: it can vary by more than60°).
Example: If wind is variable from 180° to 250° at 10 knots, it would be coded as:
21010KT 180V250
2.3 Wind Shifts
Wind shifts and the time of occurrences are reported in the remarks section (RMK) of the report. Awind shift is indicated by a change in wind direction of 45 degrees or more in less than 15 minutes withsustained winds of 10 knots or more throughout the wind shift. The time reported is the time the shiftbegan. Only the minutes are required if the hour can be inferred from the report time.
Example: A wind shift occurring at 30 minutes after the hour would be reported in remarks as:
WSHFT 30
WIND DIRECTION IN TENS OF DEGREES (TRUE)
8 Points ofCompass
Tens ofDegrees
8 Points ofCompass
Tens ofDegrees
NNN
NENENENEEEEEE
SESESESESS
360010020030040050060070080090100110120130140150160170
SSS
SWSWSWSWWWWWW
NWNWNWNWNN
180190200210220230240250260270280290300310320330340350
Table 2-1. Wind Direction in Tens of Degrees
2-3
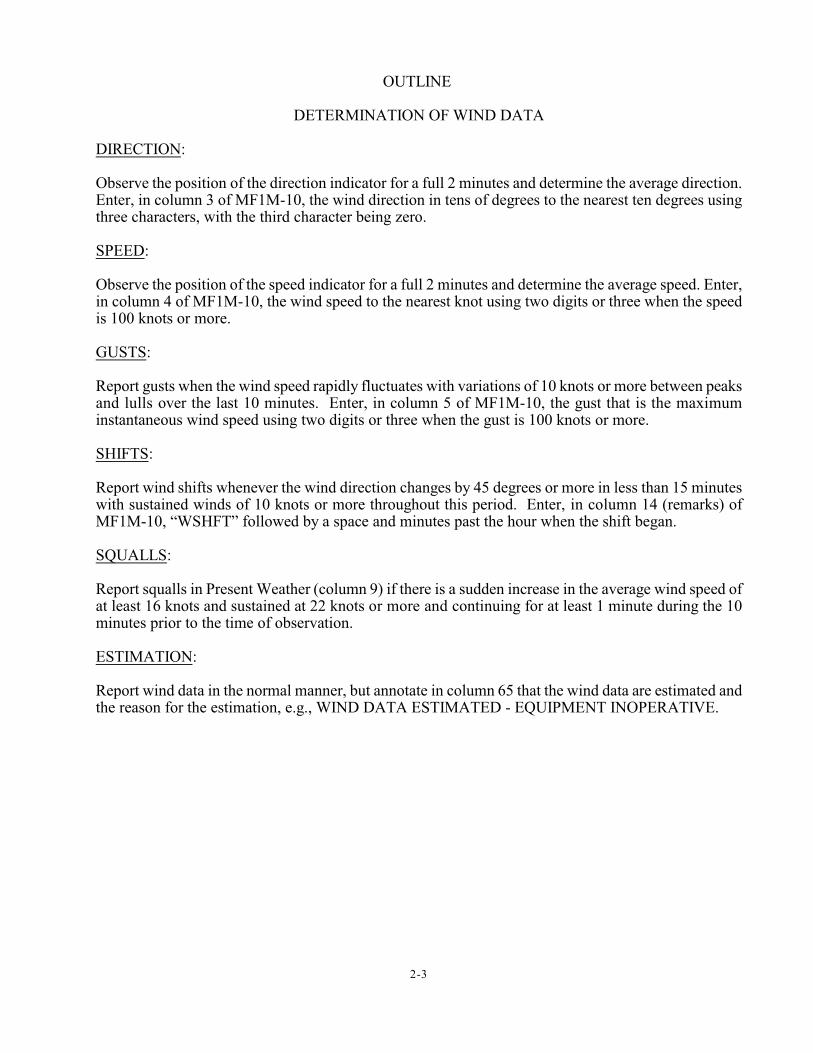
OUTLINE
DETERMINATION OF WIND DATA
DIRECTION:
Observe the position of the direction indicator for a full 2 minutes and determine the average direction.Enter, in column 3 of MF1M-10, the wind direction in tens of degrees to the nearest ten degrees usingthree characters, with the third character being zero.
SPEED:
Observe the position of the speed indicator for a full 2 minutes and determine the average speed. Enter,in column 4 of MF1M-10, the wind speed to the nearest knot using two digits or three when the speedis 100 knots or more.
GUSTS:
Report gusts when the wind speed rapidly fluctuates with variations of 10 knots or more between peaksand lulls over the last 10 minutes. Enter, in column 5 of MF1M-10, the gust that is the maximuminstantaneous wind speed using two digits or three when the gust is 100 knots or more.
SHIFTS:
Report wind shifts whenever the wind direction changes by 45 degrees or more in less than 15 minuteswith sustained winds of 10 knots or more throughout this period. Enter, in column 14 (remarks) ofMF1M-10, “WSHFT” followed by a space and minutes past the hour when the shift began.
SQUALLS:
Report squalls in Present Weather (column 9) if there is a sudden increase in the average wind speed ofat least 16 knots and sustained at 22 knots or more and continuing for at least 1 minute during the 10minutes prior to the time of observation.
ESTIMATION:
Report wind data in the normal manner, but annotate in column 65 that the wind data are estimated andthe reason for the estimation, e.g., WIND DATA ESTIMATED - EQUIPMENT INOPERATIVE.

2-4
2-5
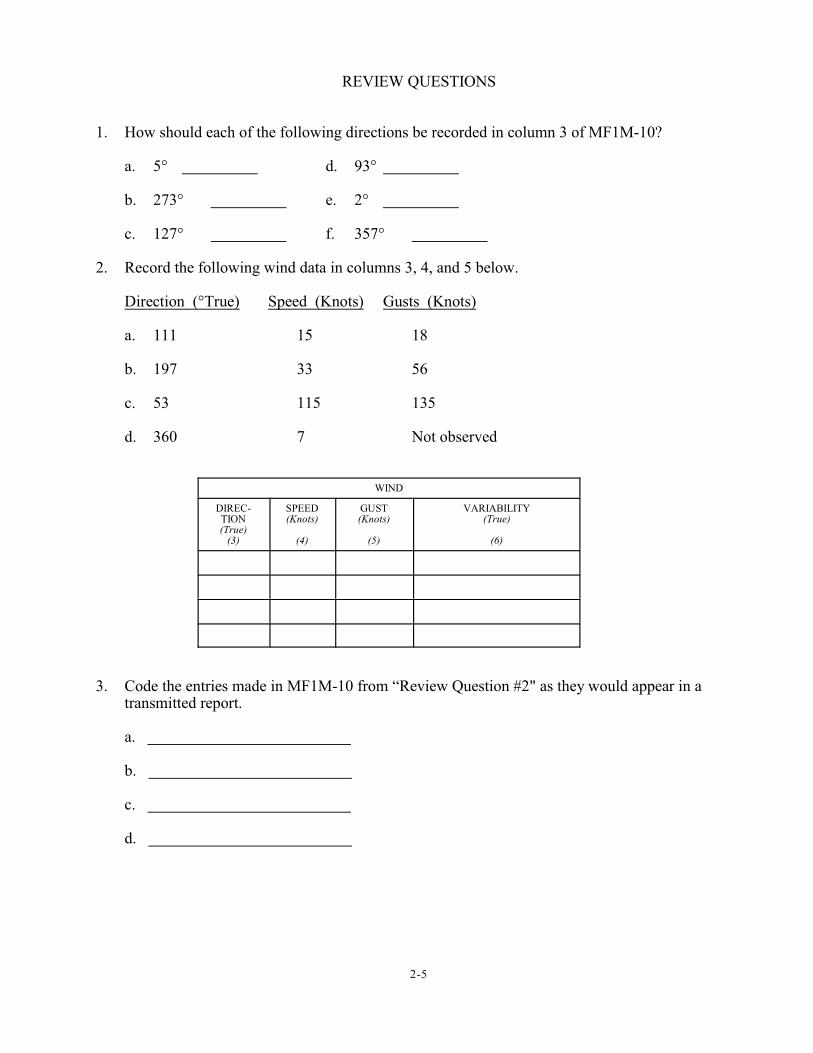
REVIEW QUESTIONS
1. How should each of the following directions be recorded in column 3 of MF1M-10?
a. 5° d. 93°
b. 273° e. 2°
c. 127° f. 357°
2. Record the following wind data in columns 3, 4, and 5 below.
Direction (°True) Speed (Knots) Gusts (Knots)
a. 111 15 18
b. 197 33 56
c. 53 115 135
d. 360 7 Not observed
WIND
DIREC-TION(True)
(3)
SPEED(Knots)
(4)
GUST(Knots)
(5)
VARIABILITY(True)
(6)
3. Code the entries made in MF1M-10 from “Review Question #2" as they would appear in atransmitted report.
a.
b.
c.
d.
2-6
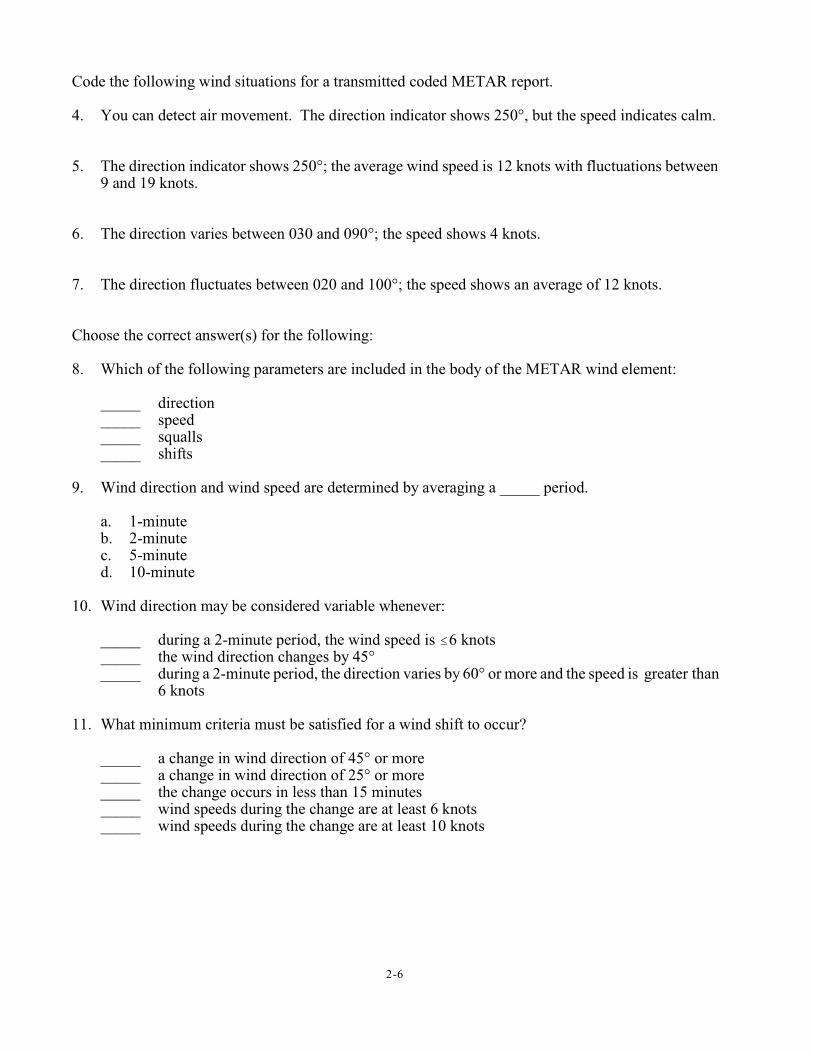
Code the following wind situations for a transmitted coded METAR report.
4. You can detect air movement. The direction indicator shows 250°, but the speed indicates calm.
5. The direction indicator shows 250°; the average wind speed is 12 knots with fluctuations between9 and 19 knots.
6. The direction varies between 030 and 090°; the speed shows 4 knots.
7. The direction fluctuates between 020 and 100°; the speed shows an average of 12 knots.
Choose the correct answer(s) for the following:
8. Which of the following parameters are included in the body of the METAR wind element:
_____ direction_____ speed_____ squalls_____ shifts
9. Wind direction and wind speed are determined by averaging a _____ period.
a. 1-minuteb. 2-minutec. 5-minuted. 10-minute
10. Wind direction may be considered variable whenever:
_____ during a 2-minute period, the wind speed is #6 knots_____ the wind direction changes by 45°_____ during a 2-minute period, the direction varies by 60° or more and the speed is greater than
6 knots
11. What minimum criteria must be satisfied for a wind shift to occur?
_____ a change in wind direction of 45° or more_____ a change in wind direction of 25° or more_____ the change occurs in less than 15 minutes_____ wind speeds during the change are at least 6 knots_____ wind speeds during the change are at least 10 knots
2-7
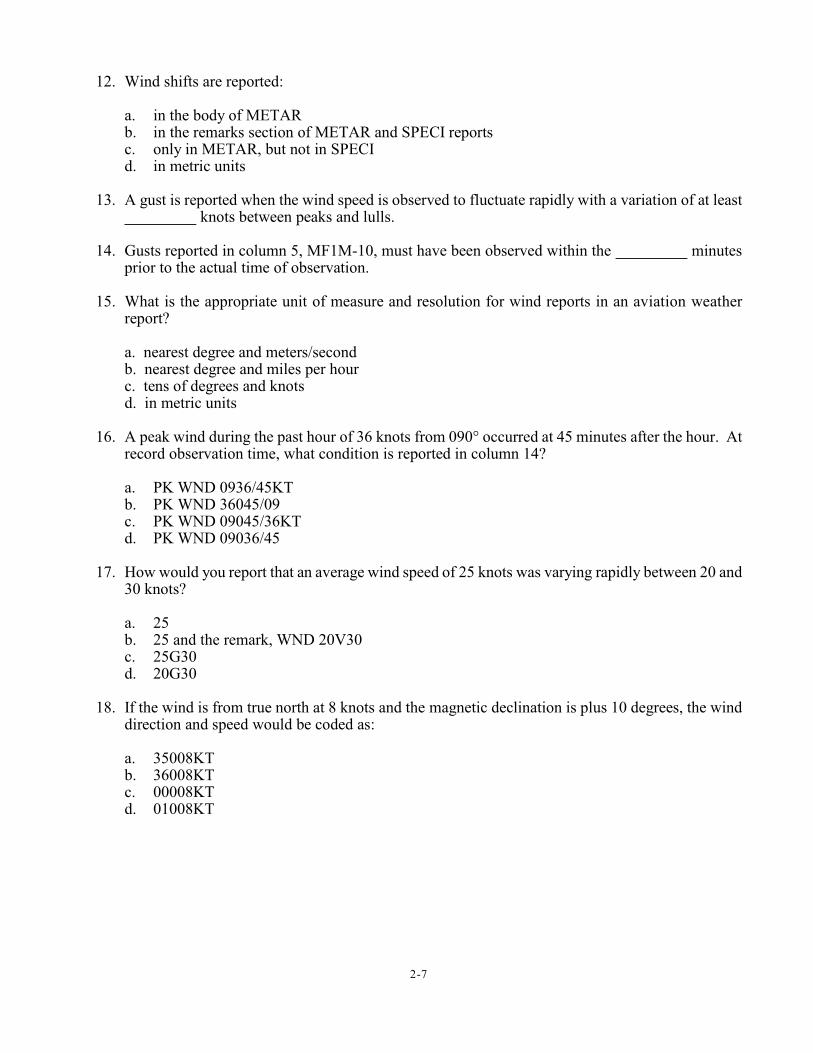
12. Wind shifts are reported:
a. in the body of METARb. in the remarks section of METAR and SPECI reportsc. only in METAR, but not in SPECId. in metric units
13. A gust is reported when the wind speed is observed to fluctuate rapidly with a variation of at least knots between peaks and lulls.
14. Gusts reported in column 5, MF1M-10, must have been observed within the minutesprior to the actual time of observation.
15. What is the appropriate unit of measure and resolution for wind reports in an aviation weatherreport?
a. nearest degree and meters/secondb. nearest degree and miles per hourc. tens of degrees and knotsd. in metric units
16. A peak wind during the past hour of 36 knots from 090° occurred at 45 minutes after the hour. Atrecord observation time, what condition is reported in column 14?
a. PK WND 0936/45KTb. PK WND 36045/09c. PK WND 09045/36KTd. PK WND 09036/45
17. How would you report that an average wind speed of 25 knots was varying rapidly between 20 and30 knots?
a. 25b. 25 and the remark, WND 20V30c. 25G30d. 20G30
18. If the wind is from true north at 8 knots and the magnetic declination is plus 10 degrees, the winddirection and speed would be coded as:
a. 35008KTb. 36008KTc. 00008KTd. 01008KT
2-8
19. Which of the following wind parameters is not included in the body of the METAR/SPECI windelement?
a. directionb. speedc. squallsd. variable
20. A strong wind suddenly increases from 270° at 15 knots to 32 knots with gusts to 44 knots andpersists for 3 minutes before subsiding. This is reported as:
a. 27032G44KTb. 27044KT SQ (in present weather)c. 27015G44KT SQ (in present weather)d. 27032G44KT SQ (in present weather)
21. Calm wind is coded in the body of the report as:
a. 00000KTb. VRB00KTc. 0000KTd. blank (no entry for wind)
22. The wind direction is from 240° at 9 knots and the direction is varying from 210° to 260°. Howwould this be formatted for transmission?
a. 24009KTb. 24009KT 210V260c. 24009KT 210V260KTd. VRB09KT
23. If a wind shift is accompanied by a cold frontal passage that began at 30 minutes after the hour, theremark would be coded as:
a. FROPA 30b. COLD FROPA 30c. FROPA WSHFT 30d. WSHFT 30 FROPA
24. The essential difference between gusts and squalls is:
a. the intensity of precipitation with which they are associatedb. the variation between peaks and lullsc. the duration of the increased wind speedd. their peak speed
2-9
25. A variable wind direction and a speed of 4 knots would be coded as:
a. 00004KTb. 99904KTc. VRB04KTd. /04KT
26. Which of the following is a good method for estimating low surface wind speed?
a. movement of very low cloudsb. pilot reportsc. a non-moving wind vaned. none of the above
27. The wind is from 360° at 125 knots. What would be the correct entry in Column 4 (Speed) ofMF1M-10?
a. 25b. 125c. 36025d. 36125
28. The station anemometer is not in operation. However, the observer estimates that the wind speedis 10 knots. The wind speed will be reported as:
a. Mb. /Mc. E10d. 10
A sector represents at least one eighth of the horizon circle (45°).1
3-1
CHAPTER 3
VISIBILITY
3.1 Visibility
In the coded transmitted report this group always ends with “SM,” the indicator for statute miles. Theentries in column 7a of MF1M-10 do not contain the “SM” indicator.
Example: 10SM
Whole numbers and fractions are separated by a space.
Example: 1 1/2SM
Because it affects pilots approaching or departing your station, visibility is one of the most importantelements in the METAR observation. Make the visibility report descriptive of the actual conditions atyour point of observation. If conditions are different over another portion of the field, and you are awareof it, describe the difference(s) using the Remarks section of the report.
Visibility is the greatest horizontal distance at which selected objects (visibility markers) can be seenand identified. At times, however, you will be called upon to estimate visibilities for which you haveno markers. Base the estimate on the sharpness with which the most distant markers can be seen. If themarkers can be seen clearly, with little loss of color, and with sharp outlines, it means that the visibilityis much greater than the distance to the markers.
Estimate visibility to the nearest reportable value using the values listed in Table 4-1 of your station’sWSOH.
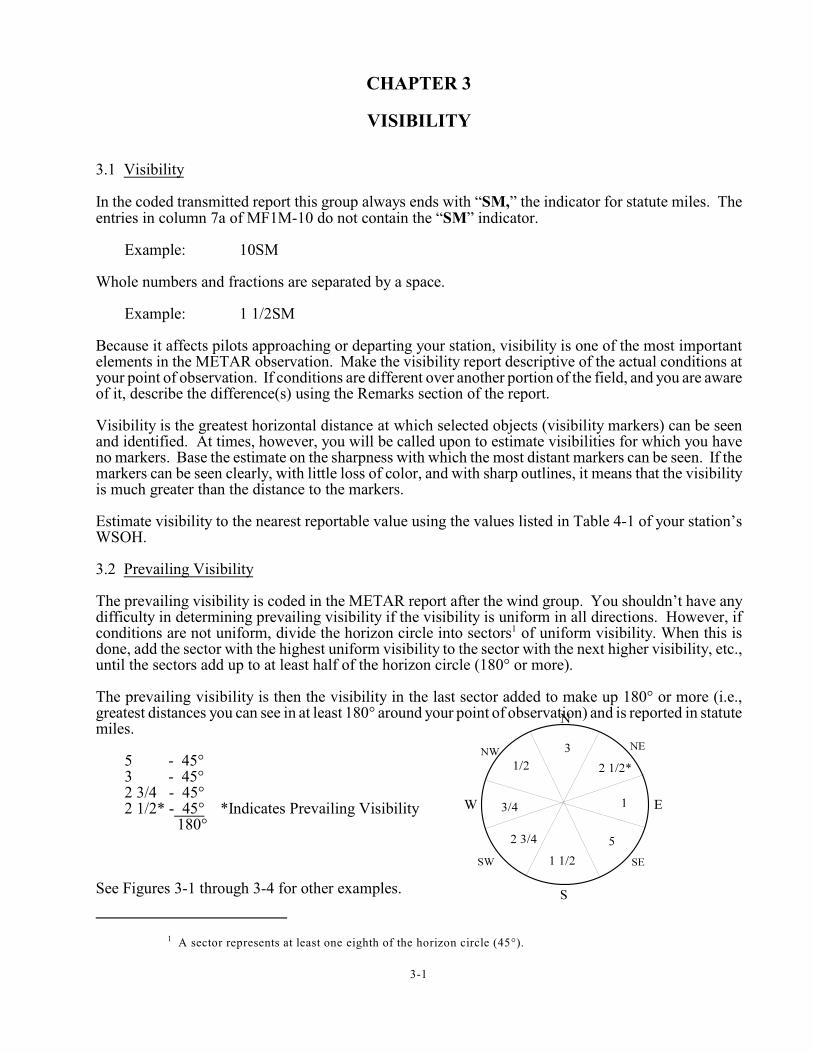
3.2 Prevailing Visibility
The prevailing visibility is coded in the METAR report after the wind group. You shouldn’t have anydifficulty in determining prevailing visibility if the visibility is uniform in all directions. However, ifconditions are not uniform, divide the horizon circle into sectors of uniform visibility. When this is1
done, add the sector with the highest uniform visibility to the sector with the next higher visibility, etc.,until the sectors add up to at least half of the horizon circle (180° or more).
The prevailing visibility is then the visibility in the last sector added to make up 180° or more (i.e.,greatest distances you can see in at least 180° around your point of observation) and is reported in statutemiles.
5 - 45°3 - 45°2 3/4 - 45°2 1/2* - 45° *Indicates Prevailing Visibility
180°
See Figures 3-1 through 3-4 for other examples.
A sector visibility may also be entered if in the opinion of the observer it is operationally significant.2
3-2
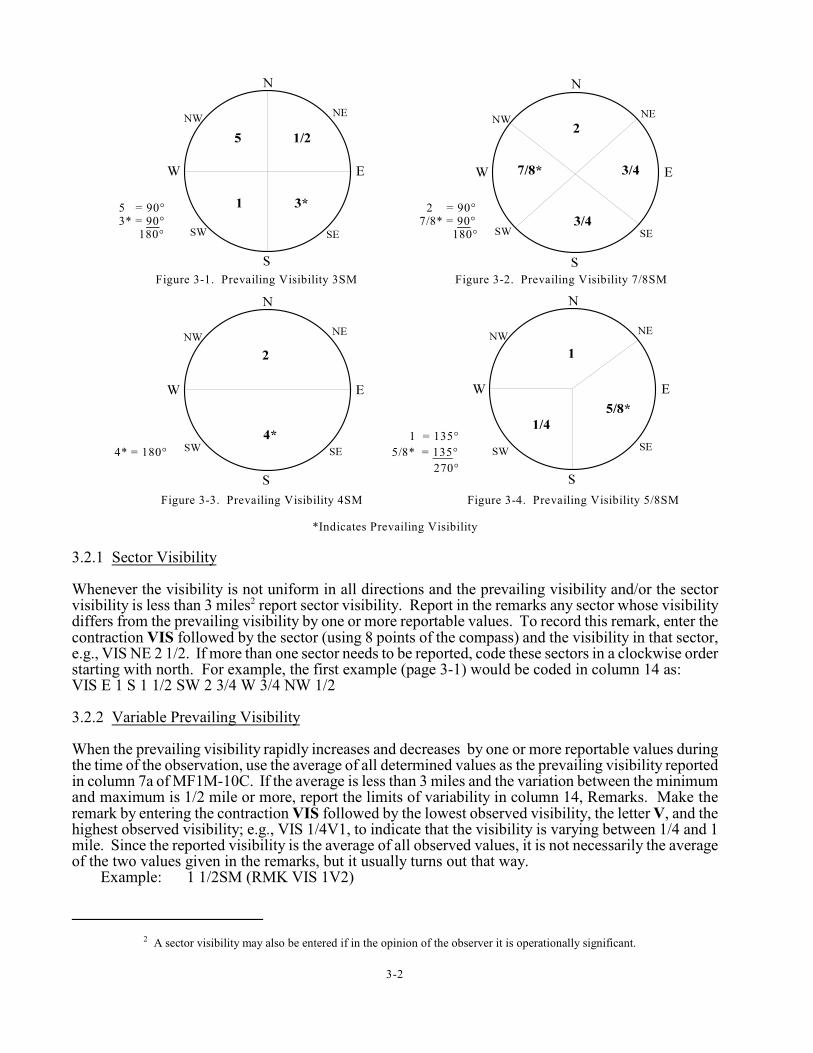
5 = 90° 2 = 90° 3* = 90° 7/8* = 90° 180° 180°
Figure 3-1. Prevailing Visibility 3SM Figure 3-2. Prevailing Visibility 7/8SM
1 = 135°
4* = 180° 5/8* = 135°
270°
Figure 3-3. Prevailing Visibility 4SM Figure 3-4. Prevailing Visibility 5/8SM
*Indicates Prevailing Visibility
3.2.1 Sector Visibility
Whenever the visibility is not uniform in all directions and the prevailing visibility and/or the sectorvisibility is less than 3 miles report sector visibility. Report in the remarks any sector whose visibility2
differs from the prevailing visibility by one or more reportable values. To record this remark, enter thecontraction VIS followed by the sector (using 8 points of the compass) and the visibility in that sector,e.g., VIS NE 2 1/2. If more than one sector needs to be reported, code these sectors in a clockwise orderstarting with north. For example, the first example (page 3-1) would be coded in column 14 as: VIS E 1 S 1 1/2 SW 2 3/4 W 3/4 NW 1/2
3.2.2 Variable Prevailing Visibility
When the prevailing visibility rapidly increases and decreases by one or more reportable values duringthe time of the observation, use the average of all determined values as the prevailing visibility reportedin column 7a of MF1M-10C. If the average is less than 3 miles and the variation between the minimumand maximum is 1/2 mile or more, report the limits of variability in column 14, Remarks. Make theremark by entering the contraction VIS followed by the lowest observed visibility, the letter V, and thehighest observed visibility; e.g., VIS 1/4V1, to indicate that the visibility is varying between 1/4 and 1mile. Since the reported visibility is the average of all observed values, it is not necessarily the averageof the two values given in the remarks, but it usually turns out that way.
Example: 1 1/2SM (RMK VIS 1V2)
3-3
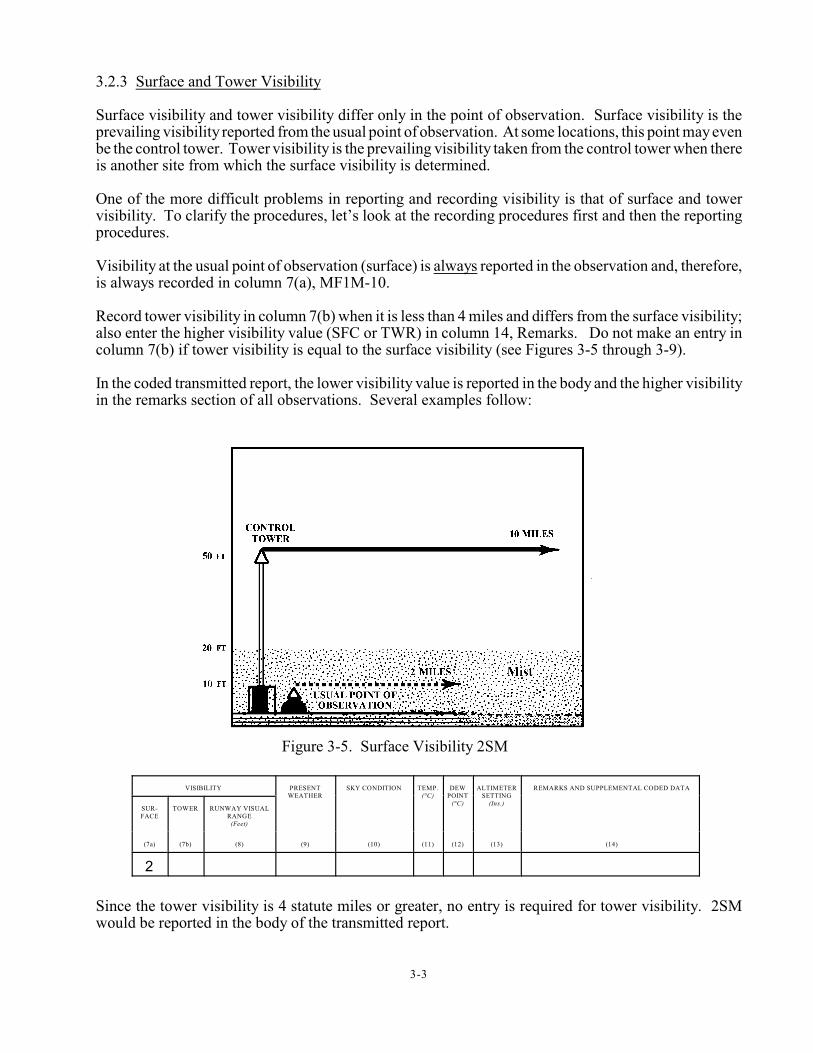
Figure 3-5. Surface Visibility 2SM
3.2.3 Surface and Tower Visibility
Surface visibility and tower visibility differ only in the point of observation. Surface visibility is theprevailing visibility reported from the usual point of observation. At some locations, this point may evenbe the control tower. Tower visibility is the prevailing visibility taken from the control tower when thereis another site from which the surface visibility is determined.
One of the more difficult problems in reporting and recording visibility is that of surface and towervisibility. To clarify the procedures, let’s look at the recording procedures first and then the reportingprocedures.
Visibility at the usual point of observation (surface) is always reported in the observation and, therefore,is always recorded in column 7(a), MF1M-10.
Record tower visibility in column 7(b) when it is less than 4 miles and differs from the surface visibility;also enter the higher visibility value (SFC or TWR) in column 14, Remarks. Do not make an entry incolumn 7(b) if tower visibility is equal to the surface visibility (see Figures 3-5 through 3-9).
In the coded transmitted report, the lower visibility value is reported in the body and the higher visibilityin the remarks section of all observations. Several examples follow:
VISIBILITY PRESENTWEATHER
SKY CONDITION TEMP.(°C)
DEWPOINT
(°C)
ALTIMETERSETTING
(Ins.)
REMARKS AND SUPPLEMENTAL CODED DATA
SUR-FACE
TOWER RUNWAY VISUALRANGE
(Feet)
(7a) (7b) (8) (9) (10) (11) (12) (13) (14)
2
Since the tower visibility is 4 statute miles or greater, no entry is required for tower visibility. 2SMwould be reported in the body of the transmitted report.
3-4
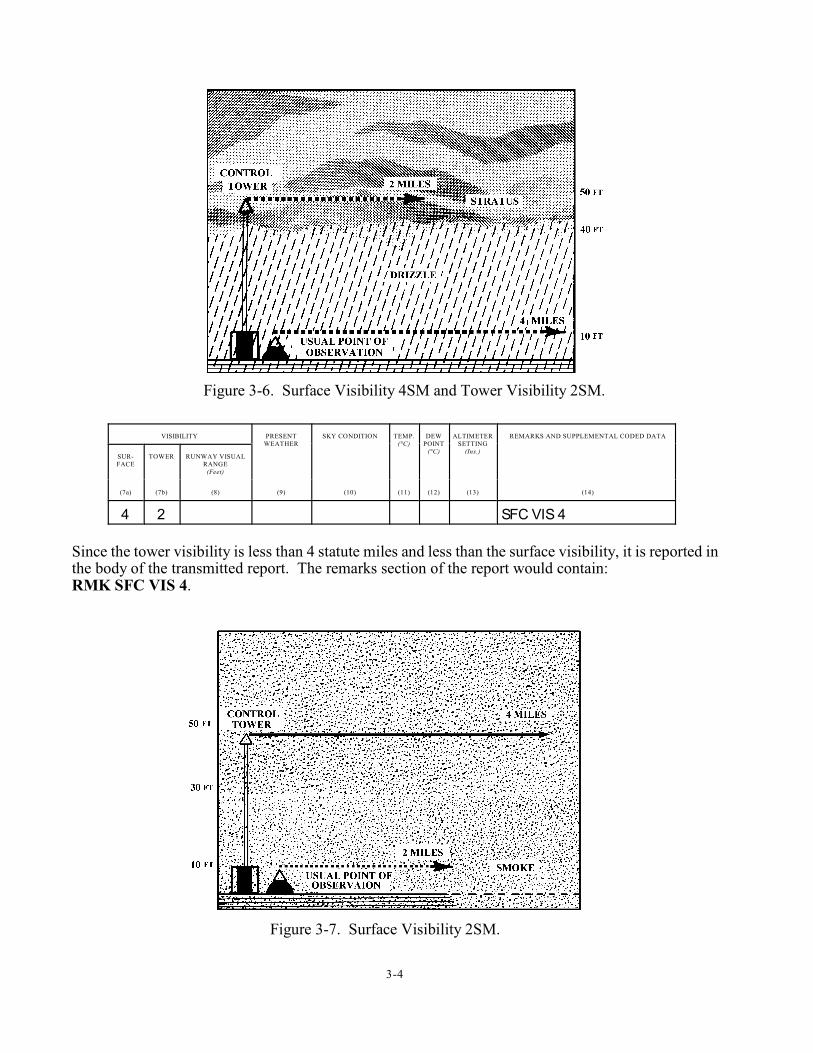
Figure 3-6. Surface Visibility 4SM and Tower Visibility 2SM.
Figure 3-7. Surface Visibility 2SM.
VISIBILITY PRESENTWEATHER
SKY CONDITION TEMP.(°C)
DEWPOINT
(°C)
ALTIMETERSETTING
(Ins.)
REMARKS AND SUPPLEMENTAL CODED DATA
SUR-FACE
TOWER RUNWAY VISUALRANGE
(Feet)
(7a) (7b) (8) (9) (10) (11) (12) (13) (14)
4 2 SFC VIS 4
Since the tower visibility is less than 4 statute miles and less than the surface visibility, it is reported inthe body of the transmitted report. The remarks section of the report would contain:RMK SFC VIS 4.
3-5
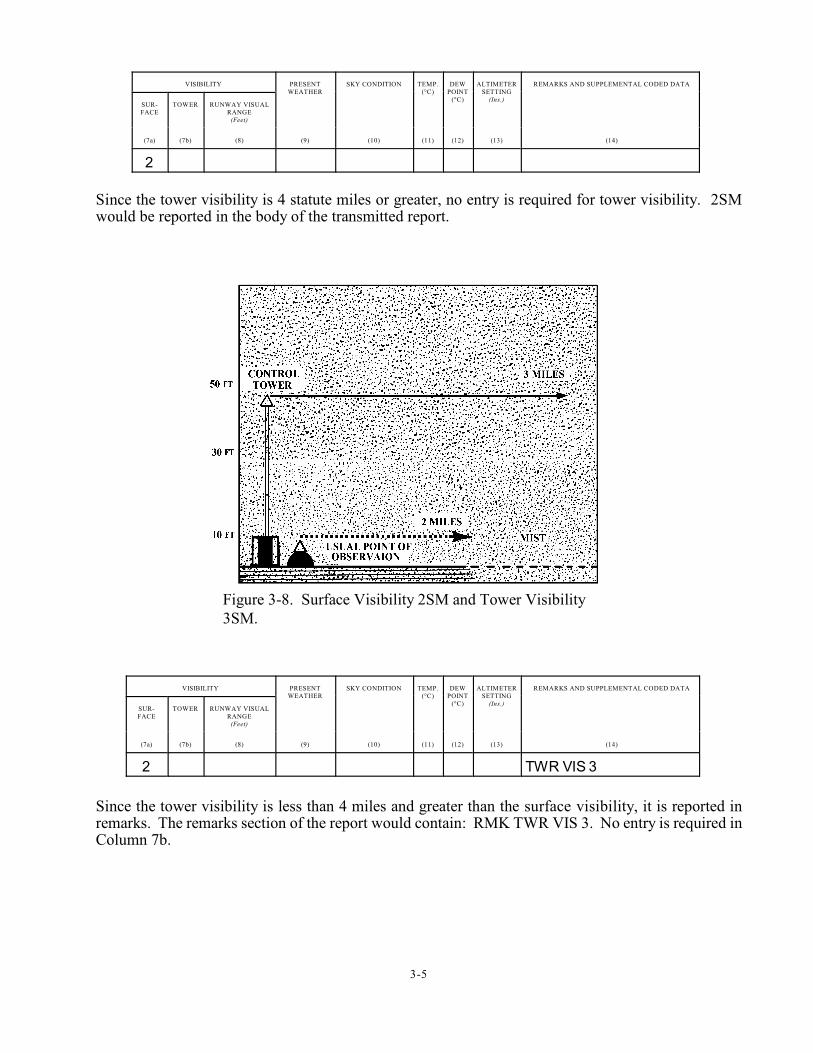
Figure 3-8. Surface Visibility 2SM and Tower Visibility3SM.
VISIBILITY PRESENTWEATHER
SKY CONDITION TEMP.(°C)
DEWPOINT
(°C)
ALTIMETERSETTING
(Ins.)
REMARKS AND SUPPLEMENTAL CODED DATA
SUR-FACE
TOWER RUNWAY VISUALRANGE
(Feet)
(7a) (7b) (8) (9) (10) (11) (12) (13) (14)
2
Since the tower visibility is 4 statute miles or greater, no entry is required for tower visibility. 2SMwould be reported in the body of the transmitted report.
VISIBILITY PRESENTWEATHER
SKY CONDITION TEMP.(°C)
DEWPOINT
(°C)
ALTIMETERSETTING
(Ins.)
REMARKS AND SUPPLEMENTAL CODED DATA
SUR-FACE
TOWER RUNWAY VISUALRANGE
(Feet)
(7a) (7b) (8) (9) (10) (11) (12) (13) (14)
2 TWR VIS 3
Since the tower visibility is less than 4 miles and greater than the surface visibility, it is reported inremarks. The remarks section of the report would contain: RMK TWR VIS 3. No entry is required inColumn 7b.
3-6
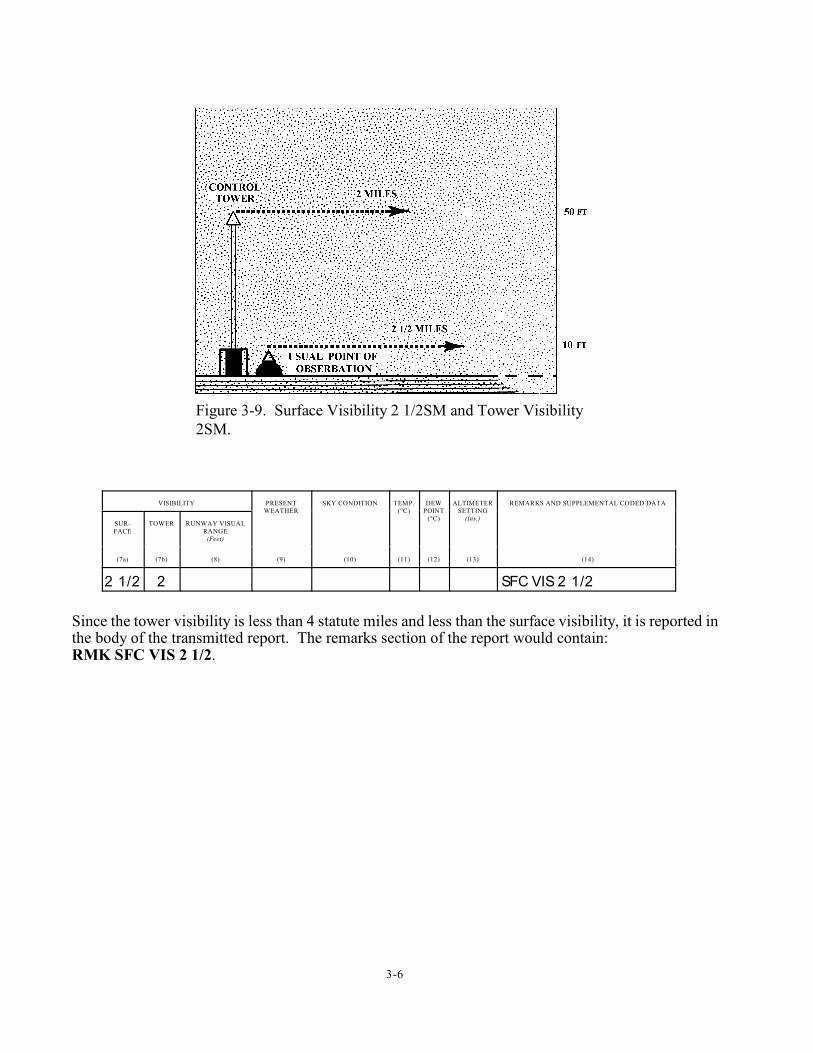
Figure 3-9. Surface Visibility 2 1/2SM and Tower Visibility2SM.
VISIBILITY PRESENTWEATHER
SKY CONDITION TEMP.(°C)
DEWPOINT
(°C)
ALTIMETERSETTING
(Ins.)
REMARKS AND SUPPLEMENTAL CODED DATA
SUR-FACE
TOWER RUNWAY VISUALRANGE
(Feet)
(7a) (7b) (8) (9) (10) (11) (12) (13) (14)
2 1/2 2 SFC VIS 2 1/2
Since the tower visibility is less than 4 statute miles and less than the surface visibility, it is reported inthe body of the transmitted report. The remarks section of the report would contain:RMK SFC VIS 2 1/2.
3-7
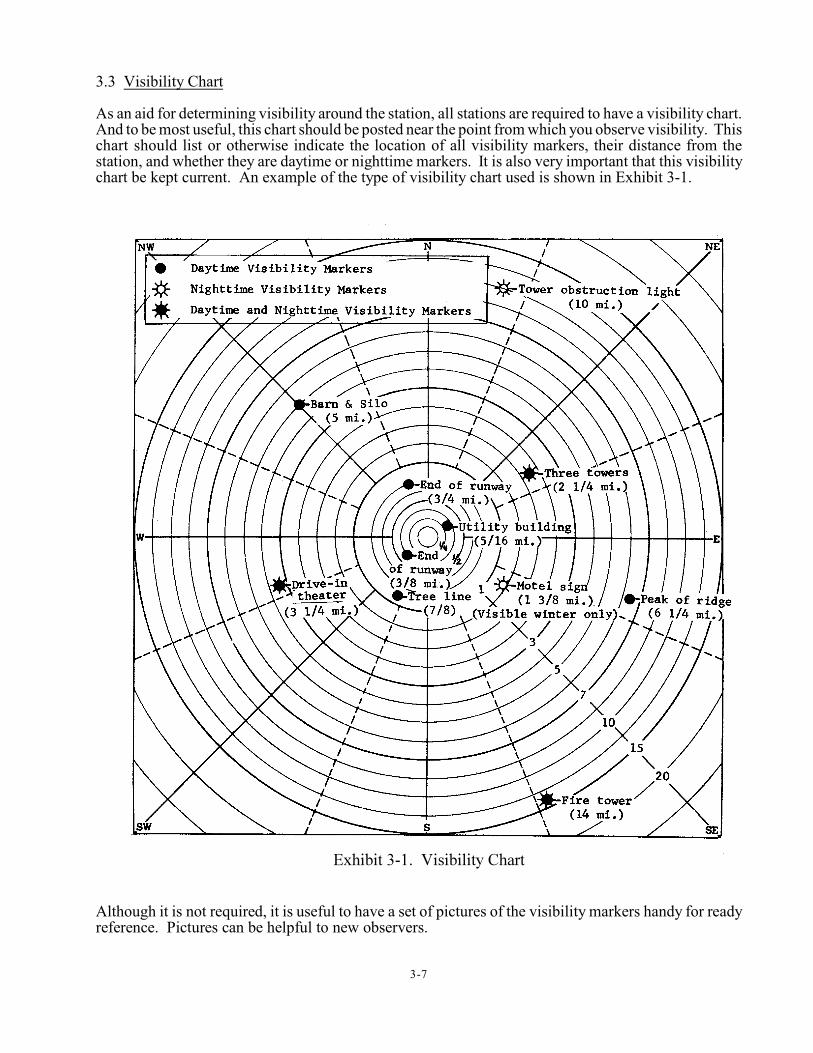
3.3 Visibility Chart
As an aid for determining visibility around the station, all stations are required to have a visibility chart.And to be most useful, this chart should be posted near the point from which you observe visibility. Thischart should list or otherwise indicate the location of all visibility markers, their distance from thestation, and whether they are daytime or nighttime markers. It is also very important that this visibilitychart be kept current. An example of the type of visibility chart used is shown in Exhibit 3-1.
Although it is not required, it is useful to have a set of pictures of the visibility markers handy for readyreference. Pictures can be helpful to new observers.
3-8
R R R R R R3.4 Runway Visual Range - RD D /V V V V FT
R - Indicates that a runway number follows.
R RD D - Runway number; if the airport comprises parallel runways, the runway number may be appendedby “L” (left), “R” (right), or “C” (center).
R R R RV V V V - Constant reportable value in feet.
It is reported in increments of 100 feet up to 1,000 feet, increments of 200 feet from 1,000 feet to 3,000feet, and increments of 500 feet above 3,000 feet to 6,000 feet.
FT - Indicates the unit of measurement is in feet.
When reported, runway visual range will be entered in the body of the report between the visibility andpresent weather groups. The runway visual range is the maximum distance at which the runway, or thespecified lights or markers delineating it, can be seen from a position above a specified point on itscenter line. This value is normally determined by visibility sensors located alongside and higher thanthe center line of the runway. RVR is reported whenever the prevailing visibility is 1 statute mile or lessand/or the RVR for the designated instrument runway is 6,000 feet or less.
Example: R12L/1200FT
If the RVR value is less than its lowest reportable value, the lowest reportable value is encoded precededby "M" (minus). If the RVR value is more than its greatest reportable value, the greatest reportable valueis encoded preceded by "P" (plus).
Example: R12L/M0600FT R12L/P6000FT
If RVR equipment is out of service or data are not available, but criteria for reporting RVR exists, theelement is omitted from the body of the report and RVRNO is entered in remarks.
R R n n n n x x x x3.4.1 Variable Runway Visual Range - D D /V V V V VV V V V FT
n n n n x x x xIn the case of variable RVR, V V V V VV V V V , is the minimum and maximum RVR over the 10-minute period preceding the time of observation.
THE RUNWAY VISUAL RANGE RESULTS FROM AUTOMATIC MEASUREMENTS;THEREFORE, THIS GROUP IS INCLUDED ONLY IF THE INSTRUMENTS THAT TAKE THESEAUTOMATIC MEASUREMENTS ARE AT YOUR STATION.
3-9
OUTLINE
DETERMINING VISIBILITY
From an outside point where all appropriate visibility markers can be observed:
1. Determine the most distant object visible, using the station visibility chart as a guide.
2. Estimate the visibility in the direction of this object as follows:
a. If the object is barely identifiable, consider the visibility to be the same as the distance tothis object.
b. If the outlines of the object are in sharp relief, estimate the distance that can be seenbeyond this object.
3. Check the visibility in other directions to determine if the above value is representative of alldirections.
a. If the visibility is different in other sectors but is relatively uniform within each sector,estimate the value in each sector in a manner similar to (2) above.
b. If the visibility rapidly increases and decreases by one or more reportable values during theperiod of observation, use the average of all observed values as the prevailing visibility.
Entries on MF1M-10:
4. Enter the prevailing visibility in column 7(a) as follows:
a. If the visibility is the same in all directions, enter this value.
b. If the visibility differs in various sectors (3a), select a single value that is the greatestvisibility equaled or exceeded throughout at least half the horizon circle.
c. If the visibility is variable (3b), enter the average value.
5. If the visibility is non-uniform (3a) with the prevailing visibility and/or the sector visibility lessthan 3 miles, or variable (3b) with the average visibility less than 3 miles and the variationbetween the minimum and maximum 1/2 mile or more, enter remarks in column 14 inaccordance with sector visibility (3a) or variable prevailing visibility (3b).
6. If control tower visibility observations are taken at your station, they are entered in column 7(b)only when the visibility at the control tower is less than 4 miles and differs from the visibilityat the usual point of observation (surface). The higher visibility value (SFC or TWR) wouldalso be entered in column 14, Remarks.

3-10
3-11
REVIEW QUESTIONS
Select the best answer that will make each statement correct.
1. In a METAR/SPECI report, the visibility group follows the __________ group.
a. sky conditionsb. windc. location identifierd. Time/Date
2. The visibility in a METAR/SPECI transmitted coded report can be identified by ___________.
a. “SM” at the end of the groupb. “M” at the beginning of the group at manual stationsc. “M” at the end of the group when visibility is reported in metersd. “VV” for virtual visibility
Code the following visibility situations into the coded transmitted METAR/SPECI report. Any entriesfor Remarks should include the contraction RMK.
3. The prevailing visibility from your point of observation is 12 statute miles.
4. The prevailing visibility is two and one-half statute miles.
5. The prevailing visibility from your point of observation varies rapidly from one and one-half to twoand one-half miles.
6. Prevailing visibility is two miles except to the south. Visibility to the south is one and one-halfmiles.
7. The prevailing visibility from your point of observation is three to five miles.
3-12
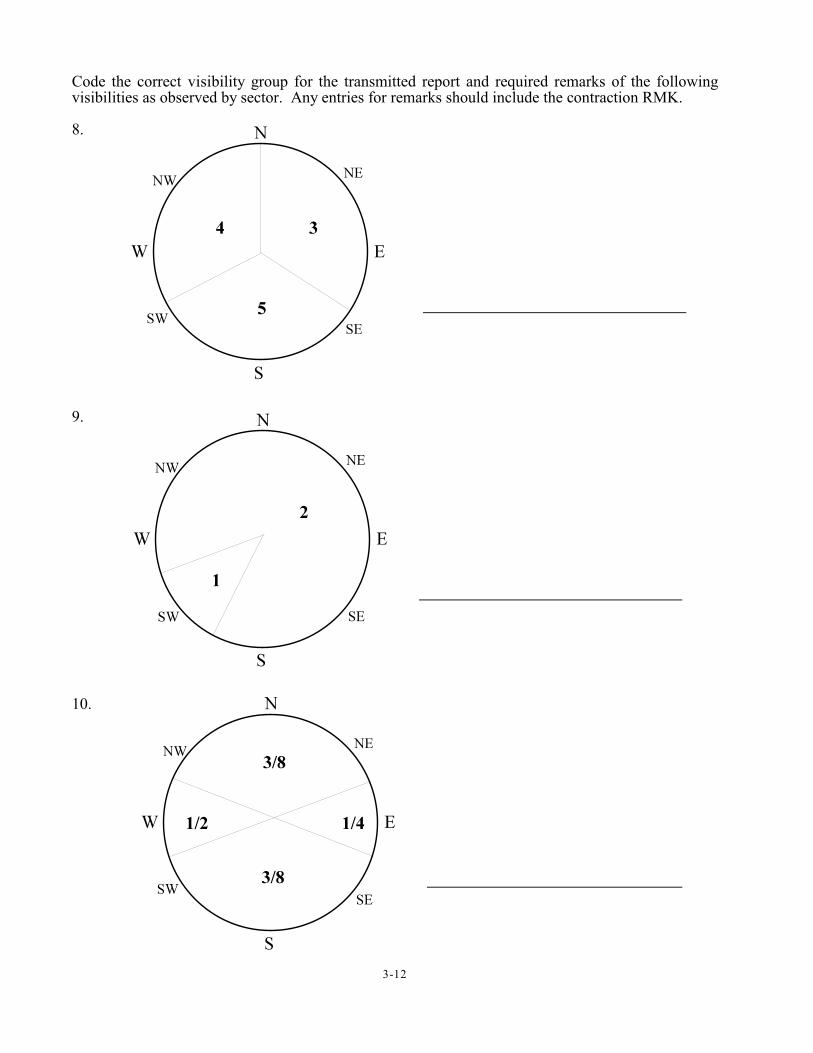
Code the correct visibility group for the transmitted report and required remarks of the followingvisibilities as observed by sector. Any entries for remarks should include the contraction RMK.
8.
9.
10.
3-13
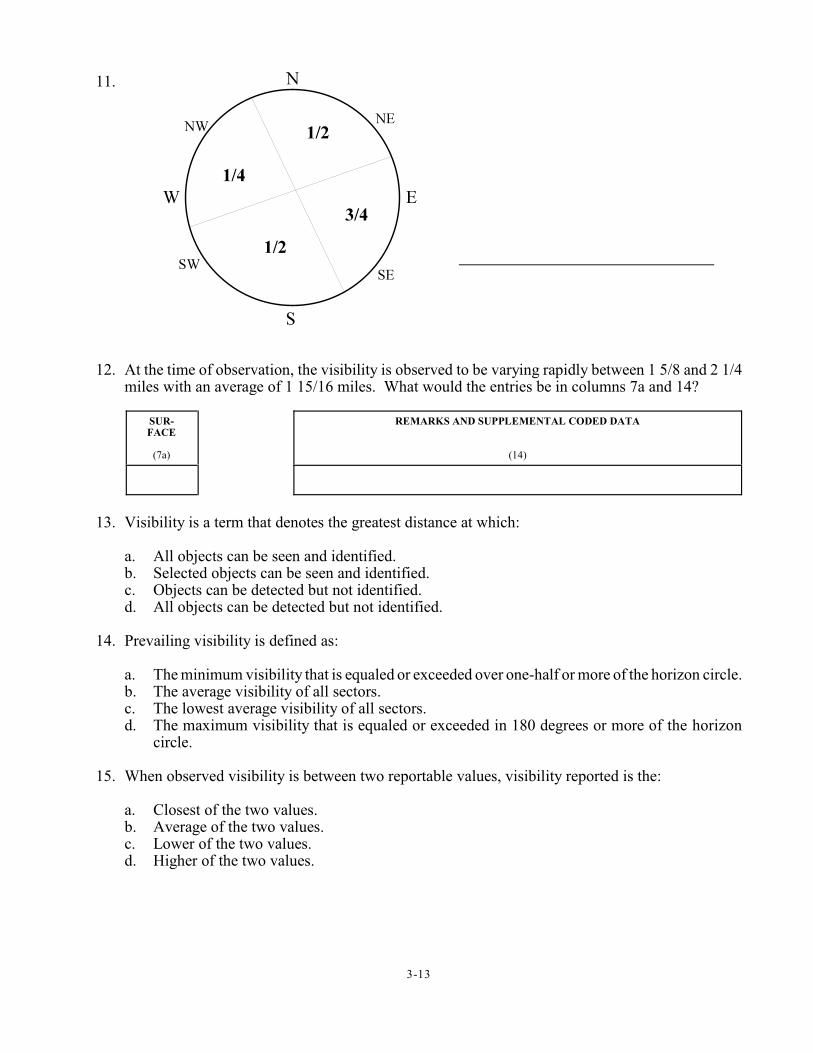
11.
12. At the time of observation, the visibility is observed to be varying rapidly between 1 5/8 and 2 1/4miles with an average of 1 15/16 miles. What would the entries be in columns 7a and 14?
SUR-FACE
(7a)
REMARKS AND SUPPLEMENTAL CODED DATA
(14)
13. Visibility is a term that denotes the greatest distance at which:
a. All objects can be seen and identified.b. Selected objects can be seen and identified.c. Objects can be detected but not identified.d. All objects can be detected but not identified.
14. Prevailing visibility is defined as:
a. The minimum visibility that is equaled or exceeded over one-half or more of the horizon circle.b. The average visibility of all sectors.c. The lowest average visibility of all sectors.d. The maximum visibility that is equaled or exceeded in 180 degrees or more of the horizon
circle.
15. When observed visibility is between two reportable values, visibility reported is the:
a. Closest of the two values.b. Average of the two values.c. Lower of the two values.d. Higher of the two values.
3-14
16. Prevailing visibility is reported in:
a. Nautical miles and fractions.b. Kilometers and fractions.c. Statute miles and fractions.d. Hundreds of feet.
17. Of the following, the most suitable objects for determining nighttime visibility are:
a. Unfocused lights of moderate intensity at known distances.b. Searchlights.c. High intensity runway lights.d. Focused lights of moderate intensity at known distances.
18. Report sector visibility in the remarks whenever it:
a. Is nonuniformb. Differs from prevailing visibility by one or more reportable values and is less than 3 miles.c. Is less than 7 miles.d. Is nonuniform and differs from prevailing visibility.
19. Prevailing visibility is reported as variable when it rapidly increases and decreases by 1/2 or moremiles and is less than:
a. 7 milesb. 3 milesc. 4 milesd. 6 miles
20. The following are reported changes in prevailing visibility. Put a check mark in front of those thatrequire a SPECI to be taken.
a. 5 miles to 3 milesb. 3 miles to 2 1/2 milesc. 2 1/2 miles to 2 milesd. 2 miles to 1 milee. 1 mile to 2 milesf. 2 miles to 2 1/2 milesg. 2 1/2 miles to 3 milesh. 3 miles to 5 miles
21. What objects can be used for determining visibility?
22. For variable visibility to be reported, which of the following criteria need to be satisfied?(more than one answer):
visibility is less than 3 miles visibility is between 2 and 4 miles visibility is rapidly increasing and decreasing by 1/2 mile or more visibility changes by 1 mile or more
3-15
23. Weather conditions being equal, why should you allow more time for taking observations at nightthan during the day?
24. Where is the RVR group reported in a METAR/SPECI report?
a. after the windb. after the visibilityc. in remarksd. with weather and obscuration
25. Which of the following are true of RVR reports?
_____ the prevailing visibility is 1 statute mile or less_____ the RVR is 8,000 feet or less_____ the RVR is reported in the body of a METAR/SPECI report_____ the RVR is reported even if your station does not have the RVR equipment
Code the following RVR values for a METAR report.
26. The RVR is indicating a value of 2400 feet for runway 22.
27. The RVR is indicating a value of 600 feet for runway 02 left.
28. The RVR is indicating a value of more than 6000 feet for runway 02 left. The visibility is one andone-quarter miles.
29. Your station does not have runway visual range equipment and your visibility is down to one quartermile. How is the RVR coded in the report?
30. When taking a visibility observation, you should take the observation from:
a. one fixed location.b. as many locations as practicable.c. the main point of observation.d. two locations and report the average visibility.
31. The tower visibility is entered in column 7b and transmitted in the body of the observation whenvisibilities are:
a. SFC VIS = 3, TWR VIS = 3b. SFC VIS = 3, TWR VIS = 2c. SFC VIS = 3, TWR VIS = 5d. SFC VIS = 2, TWR VIS = 4
3-16
32. The RVR for runway 06 left is not functioning properly for the 10-minute readout, but the 1-minutedisplay in the tower is reporting 1000 feet. What should be recorded in column 8 (Runway VisualRange) and/or column 14 (Remarks)?
a. column 8: R06L/1000; column 14: nothing requiredb. column 8: nothing required; column 14: RVRNOc. column 8: R06L/VR1000FT; column 14: RVRNOd. column 8: nothing required; column 14: nothing required
33. Runway Visual Range (RVR) is calculated from:
a. visibilityb. ambient light levelc. runway light intensityd. all of the above.
34. Visibility is reported to the nearest mile when it is observed to be in the range of miles.
a. 1 to 3b. 3 to 15c. 3 to 25d. 15 to 25
35. A visibility of 7/16 miles would be reported as:
a. 1/4b. 3/8c. 7/16d. 1/2
36. If the following visibility values were observed: N 3, NE 2 1/2, E 1, SE 3/4, S 2, SW 3 1/2, W 4,NW 2 3/4, what would be the prevailing visibility?
a. 3 1/2SMb. 3SMc. 2 3/4SMd. 2 1/2SM
37. If the prevailing visibility varies rapidly during the observation, the prevailing visibility is reportedas:
a. the average of the extremes.b. the highest observed values.c. the lowest observed values.d. the average of all observed values.
3-17
38. Visibility of 2 3/8 miles is reported as:
a. 2 1/2SMb. 2 1/4SMc. 2SMd. 3SM
39. Which of the following would not be entered as a visibility value on MF1M-10?
a. 1/16b. 3/16c. 5/16d. 7/16
40. When you are determining the prevailing visibility, how many sectors can the horizon circle bedivided into?
a. 8b. 6c. 4d. 2
The contraction “PE” for ice pellets will change to “PL” at a future date. All observers1
will be notified when this change takes effect.
4-1
CHAPTER 4
PRESENT WEATHER
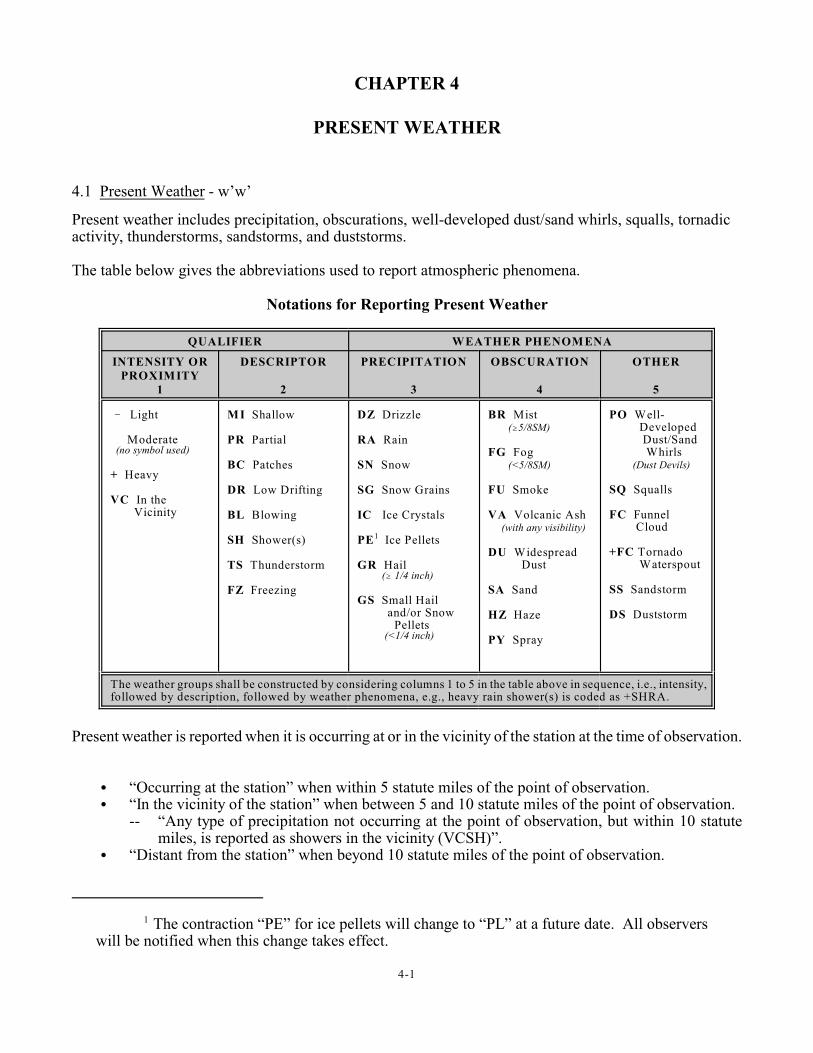
4.1 Present Weather - w’w’
Present weather includes precipitation, obscurations, well-developed dust/sand whirls, squalls, tornadicactivity, thunderstorms, sandstorms, and duststorms.
The table below gives the abbreviations used to report atmospheric phenomena.
Notations for Reporting Present Weather
QUALIFIER WEATHER PHENOMENA
INTENSITY ORPROXIMITY
1
DESCRIPTOR
2
PRECIPITATION
3
OBSCURATION
4
OTHER
5
! Light
Moderate (no symbol used)
+ Heavy
VC In the Vicinity
M I Shallow
PR Partial
BC Patches
DR Low Drifting
BL Blowing
SH Shower(s)
TS Thunderstorm
FZ Freezing
DZ Drizzle
RA Rain
SN Snow
SG Snow Grains
IC Ice Crystals
PE Ice Pellets1
GR Hail ($ 1/4 inch)
GS Small Hail and/or Snow Pellets (<1/4 inch)
BR Mist ($5/8SM)
FG Fog (<5/8SM)
FU Smoke
VA Volcanic Ash (with any visibility)
DU Widespread Dust
SA Sand
HZ Haze
PY Spray
PO Well- Developed Dust/Sand Whirls (Dust Devils)
SQ Squalls
FC Funnel Cloud +FC Tornado Waterspout
SS Sandstorm
DS Duststorm
The weather groups shall be constructed by considering columns 1 to 5 in the table above in sequence, i.e., intensity,followed by description, followed by weather phenomena, e.g., heavy rain shower(s) is coded as +SHRA.
Present weather is reported when it is occurring at or in the vicinity of the station at the time of observation.
C “Occurring at the station” when within 5 statute miles of the point of observation. C “In the vicinity of the station” when between 5 and 10 statute miles of the point of observation.
-- “Any type of precipitation not occurring at the point of observation, but within 10 statutemiles, is reported as showers in the vicinity (VCSH)”.
C “Distant from the station” when beyond 10 statute miles of the point of observation.
4-2
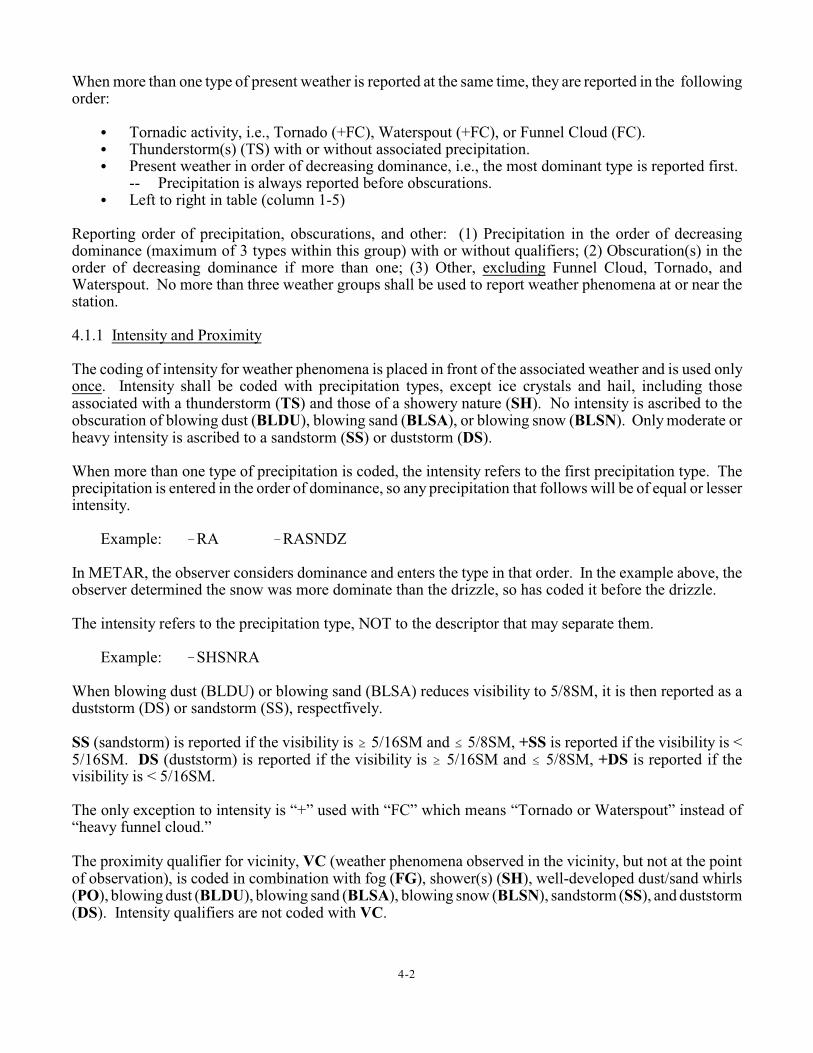
When more than one type of present weather is reported at the same time, they are reported in the followingorder:
C Tornadic activity, i.e., Tornado (+FC), Waterspout (+FC), or Funnel Cloud (FC).C Thunderstorm(s) (TS) with or without associated precipitation.C Present weather in order of decreasing dominance, i.e., the most dominant type is reported first.
-- Precipitation is always reported before obscurations.C Left to right in table (column 1-5)
Reporting order of precipitation, obscurations, and other: (1) Precipitation in the order of decreasingdominance (maximum of 3 types within this group) with or without qualifiers; (2) Obscuration(s) in theorder of decreasing dominance if more than one; (3) Other, excluding Funnel Cloud, Tornado, andWaterspout. No more than three weather groups shall be used to report weather phenomena at or near thestation.
4.1.1 Intensity and Proximity
The coding of intensity for weather phenomena is placed in front of the associated weather and is used onlyonce. Intensity shall be coded with precipitation types, except ice crystals and hail, including thoseassociated with a thunderstorm (TS) and those of a showery nature (SH). No intensity is ascribed to theobscuration of blowing dust (BLDU), blowing sand (BLSA), or blowing snow (BLSN). Only moderate orheavy intensity is ascribed to a sandstorm (SS) or duststorm (DS).
When more than one type of precipitation is coded, the intensity refers to the first precipitation type. Theprecipitation is entered in the order of dominance, so any precipitation that follows will be of equal or lesserintensity.
Example: !RA !RASNDZ
In METAR, the observer considers dominance and enters the type in that order. In the example above, theobserver determined the snow was more dominate than the drizzle, so has coded it before the drizzle.
The intensity refers to the precipitation type, NOT to the descriptor that may separate them.
Example: !SHSNRA
When blowing dust (BLDU) or blowing sand (BLSA) reduces visibility to 5/8SM, it is then reported as aduststorm (DS) or sandstorm (SS), respectfively.
SS (sandstorm) is reported if the visibility is $ 5/16SM and # 5/8SM, +SS is reported if the visibility is <5/16SM. DS (duststorm) is reported if the visibility is $ 5/16SM and # 5/8SM, +DS is reported if thevisibility is < 5/16SM.
The only exception to intensity is “+” used with “FC” which means “Tornado or Waterspout” instead of“heavy funnel cloud.”
The proximity qualifier for vicinity, VC (weather phenomena observed in the vicinity, but not at the pointof observation), is coded in combination with fog (FG), shower(s) (SH), well-developed dust/sand whirls(PO), blowing dust (BLDU), blowing sand (BLSA), blowing snow (BLSN), sandstorm (SS), and duststorm(DS). Intensity qualifiers are not coded with VC.
4-3
10 SM VCSH 10SM VCSH
VCFG
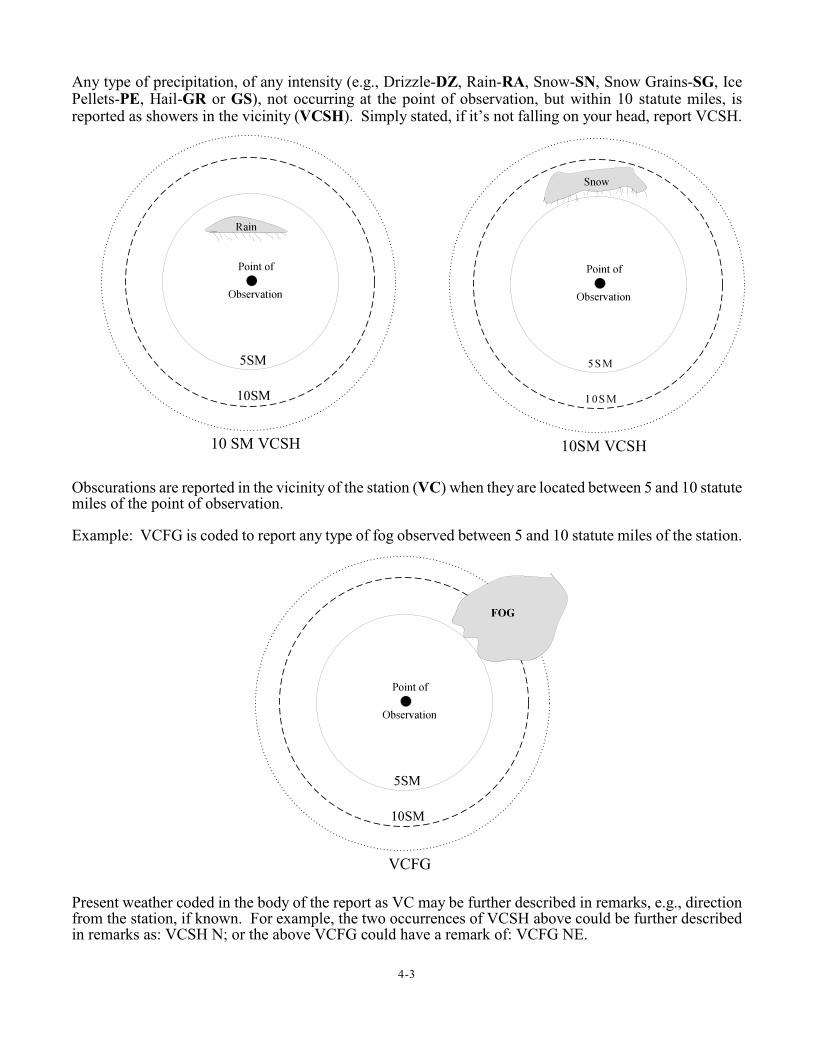
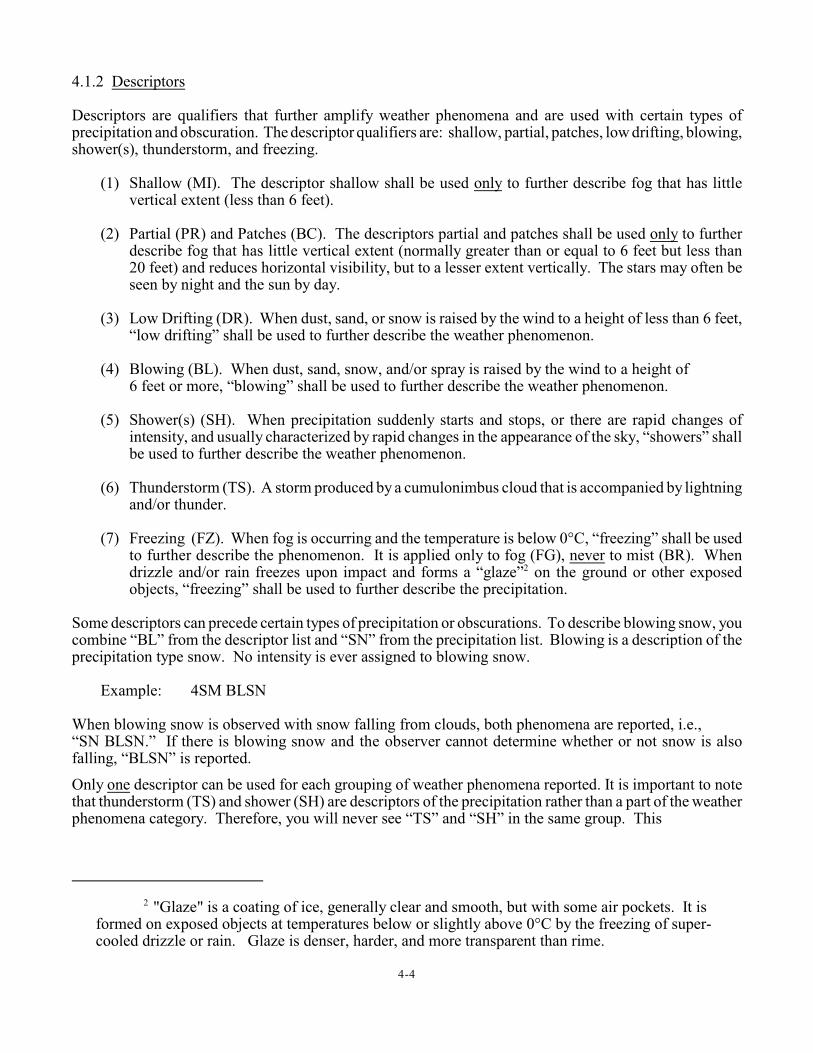
Any type of precipitation, of any intensity (e.g., Drizzle-DZ, Rain-RA, Snow-SN, Snow Grains-SG, IcePellets-PE, Hail-GR or GS), not occurring at the point of observation, but within 10 statute miles, isreported as showers in the vicinity (VCSH). Simply stated, if it’s not falling on your head, report VCSH.
Obscurations are reported in the vicinity of the station (VC) when they are located between 5 and 10 statutemiles of the point of observation.
Example: VCFG is coded to report any type of fog observed between 5 and 10 statute miles of the station.
Present weather coded in the body of the report as VC may be further described in remarks, e.g., directionfrom the station, if known. For example, the two occurrences of VCSH above could be further describedin remarks as: VCSH N; or the above VCFG could have a remark of: VCFG NE.
"Glaze" is a coating of ice, generally clear and smooth, but with some air pockets. It is2
formed on exposed objects at temperatures below or slightly above 0°C by the freezing of super-cooled drizzle or rain. Glaze is denser, harder, and more transparent than rime.
4-4
4.1.2 Descriptors
Descriptors are qualifiers that further amplify weather phenomena and are used with certain types ofprecipitation and obscuration. The descriptor qualifiers are: shallow, partial, patches, low drifting, blowing,shower(s), thunderstorm, and freezing.
(1) Shallow (MI). The descriptor shallow shall be used only to further describe fog that has littlevertical extent (less than 6 feet).
(2) Partial (PR) and Patches (BC). The descriptors partial and patches shall be used only to furtherdescribe fog that has little vertical extent (normally greater than or equal to 6 feet but less than20 feet) and reduces horizontal visibility, but to a lesser extent vertically. The stars may often beseen by night and the sun by day.
(3) Low Drifting (DR). When dust, sand, or snow is raised by the wind to a height of less than 6 feet,“low drifting” shall be used to further describe the weather phenomenon.
(4) Blowing (BL). When dust, sand, snow, and/or spray is raised by the wind to a height of 6 feet or more, “blowing” shall be used to further describe the weather phenomenon.
(5) Shower(s) (SH). When precipitation suddenly starts and stops, or there are rapid changes ofintensity, and usually characterized by rapid changes in the appearance of the sky, “showers” shallbe used to further describe the weather phenomenon.
(6) Thunderstorm (TS). A storm produced by a cumulonimbus cloud that is accompanied by lightningand/or thunder.
(7) Freezing (FZ). When fog is occurring and the temperature is below 0°C, “freezing” shall be usedto further describe the phenomenon. It is applied only to fog (FG), never to mist (BR). Whendrizzle and/or rain freezes upon impact and forms a “glaze” on the ground or other exposed2
objects, “freezing” shall be used to further describe the precipitation.
Some descriptors can precede certain types of precipitation or obscurations. To describe blowing snow, youcombine “BL” from the descriptor list and “SN” from the precipitation list. Blowing is a description of theprecipitation type snow. No intensity is ever assigned to blowing snow.
Example: 4SM BLSN
When blowing snow is observed with snow falling from clouds, both phenomena are reported, i.e., “SN BLSN.” If there is blowing snow and the observer cannot determine whether or not snow is alsofalling, “BLSN” is reported.
Only one descriptor can be used for each grouping of weather phenomena reported. It is important to notethat thunderstorm (TS) and shower (SH) are descriptors of the precipitation rather than a part of the weatherphenomena category. Therefore, you will never see “TS” and “SH” in the same group. This
These are local phenomena usually formed by radiation cooling of the air. They often3
form first in low lying areas.
May be reported with prevailing visibility of 7 statute miles or greater.4
4-5
does not mean that showers do not occur when thunderstorms are reported, e.g., the report may be “TS!SHRA.” Remember, thunderstorms can be treated as weather, even though it is a descriptor.
Example: TSRA or TS SHRA
Remember, a thunderstorm can occur without precipitation; it is the only descriptor that can be treated aspresent weather and may be reported without precipitation.
Example: 10SM TS
When light precipitation is occurring along with a thunderstorm, following the rule of intensity beforedescriptor puts the “!” before the “TS.”
REMEMBER, THE INTENSITY REFERS TO PRECIPITATION, NOT THE DESCRIPTOR. THERE ISNO SUCH THING AS A LIGHT THUNDERSTORM.
Example: 3SM !TSRA
Using the same principle, when a “+” is placed in front of a “TS,” it is not an indication of a heavythunderstorm. Again, the intensity symbol relates to the precipitation, not the descriptor. An intensitysymbol is never used with “TS” if it is reported alone.
There are restrictions on the use of descriptors. The most significant restriction is: Descriptors are neverused with Mist (BR). A descriptor such as patches (BC) or partial (PR) used to describe fog (FG) alwaysimplies that the visibility within the phenomenon meets the less than 5/8 statute mile criterion.
4.1.3 Obscuration
Obscurations when present with precipitation are in a separate group following the precipitation and enteredin order of dominance, e.g., !RA BR HZ.
Shallow Fog (MIFG) is reported when the visibility at 6 feet above ground level is 5/8SM or more and the3 4
apparent visibility in the fog layer is less than 5/8SM. This fog has a vertical extent of less than 6 feet.
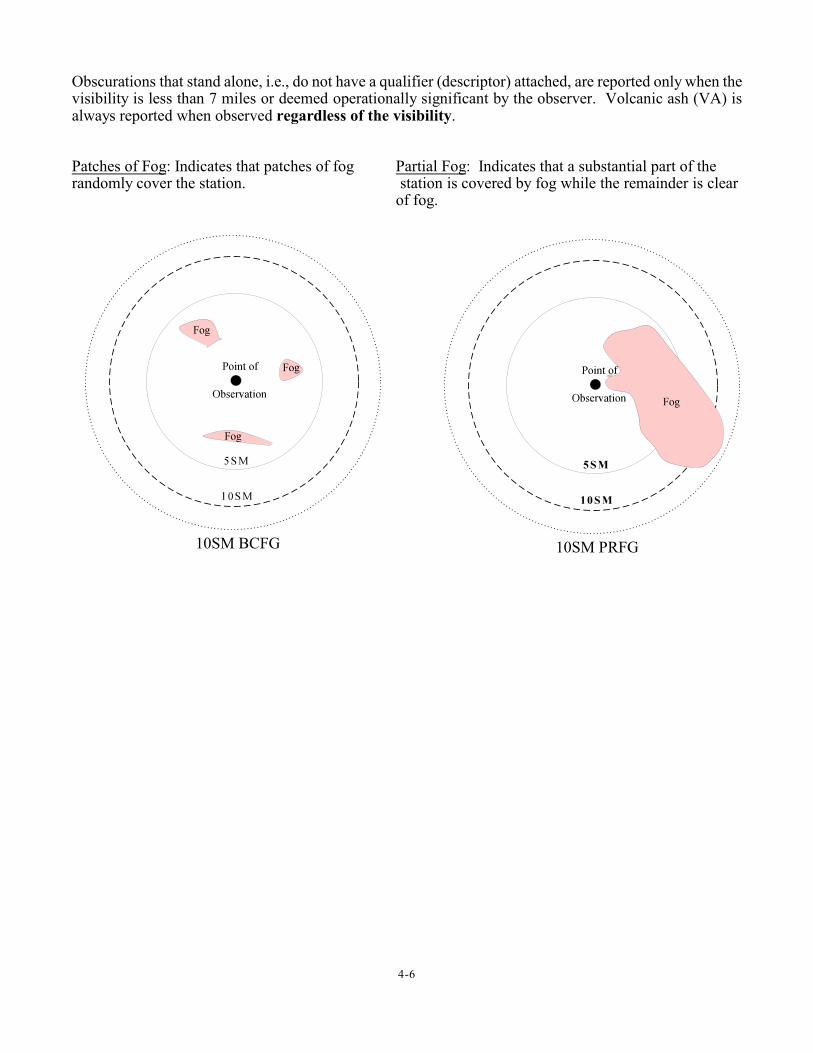
Partial Fog (PRFG) is fog covering part of the station, which extends to at least 6 feet above the ground,3
but not more than 20 feet, and apparent visibility in the fog is less than 5/8 statute mile. A substantial partof the station is covered by fog while the remainder is clear of fog.
Patches of Fog (BCFG) are fog patches that randomly cover the station, which extend to at least 6 feet, but3
less than 20 feet above the ground, and apparent visibility in the fog is less than 5/8 statute mile.
Freezing Fog (FZFG) is reported when the air temperature is !0.1°C or colder. This fog may produce adeposit of ice known as rime ice. It is composed of grains separated by air, sometimes adorned withcrystalline branches. The visibility must also be less than 5/8 statute miles.
4-6
10SM PRFG 10SM BCFG
Obscurations that stand alone, i.e., do not have a qualifier (descriptor) attached, are reported only when thevisibility is less than 7 miles or deemed operationally significant by the observer. Volcanic ash (VA) isalways reported when observed regardless of the visibility.
Patches of Fog: Indicates that patches of fog Partial Fog: Indicates that a substantial part of therandomly cover the station. station is covered by fog while the remainder is clear
of fog.
4-7
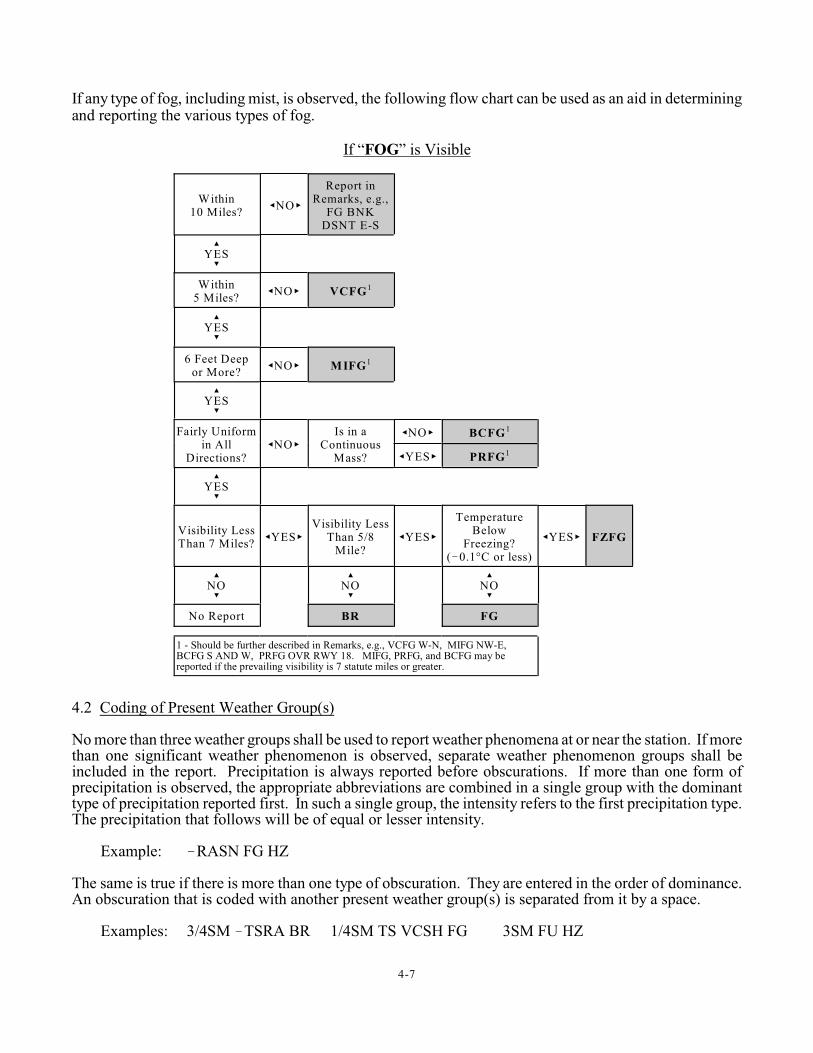
If any type of fog, including mist, is observed, the following flow chart can be used as an aid in determiningand reporting the various types of fog.
If “FOG” is Visible
Within10 Miles?
=NO<
Report inRemarks, e.g.,
FG BNKDSNT E-S
>YES?
Within5 Miles?
=NO< VCFG1
>YES?
6 Feet Deepor More?
=NO< MIFG1
>YES?
Fairly Uniformin All
Directions?=NO<
Is in aContinuous
Mass?
=NO< BCFG1
=YES< PRFG1
>YES?
Visibility LessThan 7 Miles?
=YES<Visibility Less
Than 5/8Mile?
=YES<
TemperatureBelow
Freezing?(!0.1°C or less)
=YES< FZFG
>NO?
>NO?
>NO?
No Report BR FG
1 - Should be further described in Remarks, e.g., VCFG W-N, MIFG NW-E,BCFG S AND W, PRFG OVR RWY 18. MIFG, PRFG, and BCFG may bereported if the prevailing visibility is 7 statute miles or greater.
4.2 Coding of Present Weather Group(s)
No more than three weather groups shall be used to report weather phenomena at or near the station. If morethan one significant weather phenomenon is observed, separate weather phenomenon groups shall beincluded in the report. Precipitation is always reported before obscurations. If more than one form ofprecipitation is observed, the appropriate abbreviations are combined in a single group with the dominanttype of precipitation reported first. In such a single group, the intensity refers to the first precipitation type.The precipitation that follows will be of equal or lesser intensity.
Example: !RASN FG HZ
The same is true if there is more than one type of obscuration. They are entered in the order of dominance.An obscuration that is coded with another present weather group(s) is separated from it by a space.
Examples: 3/4SM !TSRA BR 1/4SM TS VCSH FG 3SM FU HZ
4-8
Question: What does an observer do if there are more than three weather groups, or more than threetypes of precipitation are occurring?
Answer: The observer decides which three groups and/or precipitation types are more dominantthan the rest. These three groups or precipitation types are then coded in theMETAR/SPECI report in their order of dominance; the rest are not reported.
Example: Occurring: TS RA SN BR FU HZ
Thunderstorms are always reported when they occur. Moderate rain and snow (precipitation) are consideredpart of the group that is coded with the thunderstorm, i.e., TSRASN or TSSNRA. This is one of the threegroups that may be reported. The choice now falls between the mist, smoke, and haze. Each is considereda separate group. The observer needs to decide which is the least significant or which two are the mostdominant.
If the observer decides that smoke (FU) is least dominant, the present weather for this METAR report couldbe: TSRASN BR HZ or TSSNRA HZ BR. The smoke is not used in the report.
Example: Occurring: TS RA SN !DZ GS BR
Thunderstorms are always reported when they occur. Even if four types of precipitation are occurring, onlythree can be reported. The observer must decide which of them is the least dominant.
The choice for this observation is: TSSNRAGS BR
The light drizzle was considered least dominate and was not reported.
The “Weather Phenomena Matrix” found on the following two pages gives combinations of weatherphenomena and qualifiers (intensity, proximity, and descriptor) that are to be used in METAR/SPECIreports.
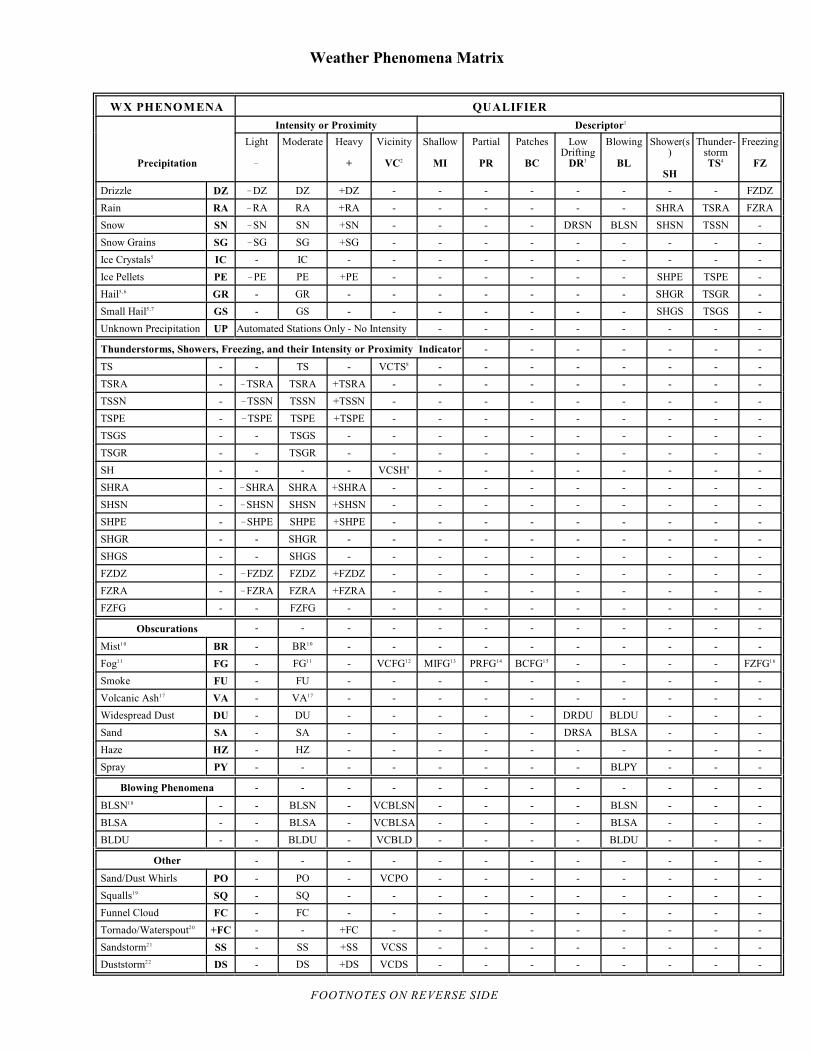
Weather Phenomena Matrix
WX PHENOMENA QUALIFIER
Intensity or Proximity Descriptor1
Precipitation
Light
!
Moderate Heavy
+
Vicinity
VC2
Shallow
MI
Partial
PR
Patches
BC
LowDrifting
DR3
Blowing
BL
Shower(s)
SH
Thunder-stormTS4
Freezing
FZ
Drizzle DZ !DZ DZ +DZ - - - - - - - - FZDZ
Rain RA !RA RA +RA - - - - - - SHRA TSRA FZRA
Snow SN !SN SN +SN - - - - DRSN BLSN SHSN TSSN -
Snow Grains SG !SG SG +SG - - - - - - - - -
Ice Crystals5 IC - IC - - - - - - - - - -
Ice Pellets PE !PE PE +PE - - - - - - SHPE TSPE -
Hail5,6 GR - GR - - - - - - - SHGR TSGR -
Small Hail5,7 GS - GS - - - - - - - SHGS TSGS -
Unknown Precipitation UP Automated Stations Only - No Intensity - - - - - - - -
Thunderstorms, Showers, Freezing, and their Intensity or Proximity Indicator - - - - - - -
TS - - TS - VCTS - - - - - - - -8
TSRA - !TSRA TSRA +TSRA - - - - - - - - -
TSSN - !TSSN TSSN +TSSN - - - - - - - - -
TSPE - !TSPE TSPE +TSPE - - - - - - - - -
TSGS - - TSGS - - - - - - - - - -
TSGR - - TSGR - - - - - - - - - -
SH - - - - VCSH - - - - - - - -9
SHRA - !SHRA SHRA +SHRA - - - - - - - - -
SHSN - !SHSN SHSN +SHSN - - - - - - - - -
SHPE - !SHPE SHPE +SHPE - - - - - - - - -
SHGR - - SHGR - - - - - - - - - -
SHGS - - SHGS - - - - - - - - - -
FZDZ - !FZDZ FZDZ +FZDZ - - - - - - - - -
FZRA - !FZRA FZRA +FZRA - - - - - - - - -
FZFG - - FZFG - - - - - - - - - -
Obscurations - - - - - - - - - - - -
Mist10 BR - BR - - - - - - - - - -10
Fog11 FG - FG - VCFG MIFG PRFG BCFG - - - - FZFG11 12 13 14 15 16
Smoke FU - FU - - - - - - - - - -
Volcanic Ash17 VA - VA - - - - - - - - - -17
Widespread Dust DU - DU - - - - - DRDU BLDU - - -
Sand SA - SA - - - - - DRSA BLSA - - -
Haze HZ - HZ - - - - - - - - - -
Spray PY - - - - - - - - BLPY - - -
Blowing Phenomena - - - - - - - - - - - -
BLSN - - BLSN - VCBLSN - - - - BLSN - - -18
BLSA - - BLSA - VCBLSA - - - - BLSA - - -
BLDU - - BLDU - VCBLD - - - - BLDU - - -
Other - - - - - - - - - - - -
Sand/Dust Whirls PO - PO - VCPO - - - - - - - -
Squalls19 SQ - SQ - - - - - - - - - -
Funnel Cloud FC - FC - - - - - - - - - -
Tornado/Waterspout20 +FC - - +FC - - - - - - - - -
Sandstorm21 SS - SS +SS VCSS - - - - - - - -
Duststorm22 DS - DS +DS VCDS - - - - - - - -
FOOTNOTES ON REVERSE SIDE
4-10
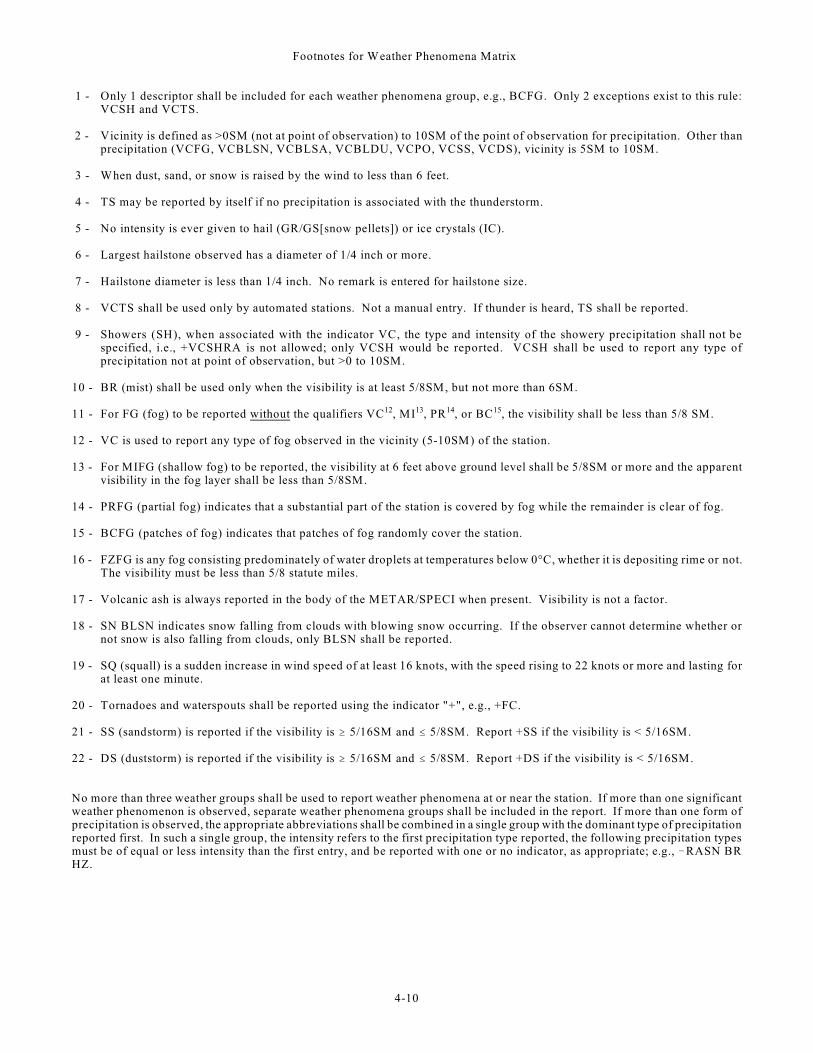
Footnotes for Weather Phenomena Matrix
1 - Only 1 descriptor shall be included for each weather phenomena group, e.g., BCFG. Only 2 exceptions exist to this rule:VCSH and VCTS.
2 - Vicinity is defined as >0SM (not at point of observation) to 10SM of the point of observation for precipitation. Other thanprecipitation (VCFG, VCBLSN, VCBLSA, VCBLDU, VCPO, VCSS, VCDS), vicinity is 5SM to 10SM.
3 - When dust, sand, or snow is raised by the wind to less than 6 feet.
4 - TS may be reported by itself if no precipitation is associated with the thunderstorm.
5 - No intensity is ever given to hail (GR/GS[snow pellets]) or ice crystals (IC).
6 - Largest hailstone observed has a diameter of 1/4 inch or more.
7 - Hailstone diameter is less than 1/4 inch. No remark is entered for hailstone size.
8 - VCTS shall be used only by automated stations. Not a manual entry. If thunder is heard, TS shall be reported.
9 - Showers (SH), when associated with the indicator VC, the type and intensity of the showery precipitation shall not bespecified, i.e., +VCSHRA is not allowed; only VCSH would be reported. VCSH shall be used to report any type ofprecipitation not at point of observation, but >0 to 10SM.
10 - BR (mist) shall be used only when the visibility is at least 5/8SM, but not more than 6SM.
11 - For FG (fog) to be reported without the qualifiers VC , MI , PR , or BC , the visibility shall be less than 5/8 SM.12 13 14 15
12 - VC is used to report any type of fog observed in the vicinity (5-10SM) of the station.
13 - For MIFG (shallow fog) to be reported, the visibility at 6 feet above ground level shall be 5/8SM or more and the apparentvisibility in the fog layer shall be less than 5/8SM.
14 - PRFG (partial fog) indicates that a substantial part of the station is covered by fog while the remainder is clear of fog.
15 - BCFG (patches of fog) indicates that patches of fog randomly cover the station.
16 - FZFG is any fog consisting predominately of water droplets at temperatures below 0°C, whether it is depositing rime or not.The visibility must be less than 5/8 statute miles.
17 - Volcanic ash is always reported in the body of the METAR/SPECI when present. Visibility is not a factor.
18 - SN BLSN indicates snow falling from clouds with blowing snow occurring. If the observer cannot determine whether ornot snow is also falling from clouds, only BLSN shall be reported.
19 - SQ (squall) is a sudden increase in wind speed of at least 16 knots, with the speed rising to 22 knots or more and lasting forat least one minute.
20 - Tornadoes and waterspouts shall be reported using the indicator "+", e.g., +FC.
21 - SS (sandstorm) is reported if the visibility is $ 5/16SM and # 5/8SM. Report +SS if the visibility is < 5/16SM.
22 - DS (duststorm) is reported if the visibility is $ 5/16SM and # 5/8SM. Report +DS if the visibility is < 5/16SM.
No more than three weather groups shall be used to report weather phenomena at or near the station. If more than one significantweather phenomenon is observed, separate weather phenomena groups shall be included in the report. If more than one form ofprecipitation is observed, the appropriate abbreviations shall be combined in a single group with the dominant type of precipitationreported first. In such a single group, the intensity refers to the first precipitation type reported, the following precipitation typesmust be of equal or less intensity than the first entry, and be reported with one or no indicator, as appropriate; e.g., !RASN BRHZ.
4-11
REVIEW QUESTIONS
1. The intensity indicators for rain are:
a. Light (!), Moderate (0), Severe (+)b. Thin (!), Moderate ( ), Heavy (+)c. Light (!), Moderate ( ), Heavy (+)
Decode the following weather and obscuration portions of the listed METAR reports:
2. +SHRA
a. Severe snow, hail, and rainb. Severe showers of rainc. Heavy rain showers
3. MIFG
a. Medium fogb. Patchy fogc. Shallow fog
4. BLSN
a. Blowing snowb. Blowing sandc. Blowing spray
5. +TSRAGR
a. Heavy thunderstorm, snow, rain, and snow grainsb. Thunderstorm, heavy rain, and hailc. Severe thunderstorm, rain, and hail
6. DRSN
a. Low drifting snowb. Driving snow showersc. Dust, rain, and snow
7. BCFG
a. Breaks in the fogb. Patchy fogc. Fog bank
8. VCSH
a. Volcanic ashb. Showers in the vicinityc. Snow and hail in the vicinity
4-12
9. +FZRA
a. Severe freezing rainb. Moderate freezing rainc. Heavy freezing rain
10. !TSRA HZ
a. Light thunderstorm, moderate rain, and hazeb. Thunderstorm, light rain, and hazec. Thunderstorm and light rain showers
11. TSRAPE
a. Thunderstorm, rain, and pea-size hailb. Moderate thunderstorm, rain, and hailc. Thunderstorm, moderate rain, and ice pellets
12. TSRAGS
a. Thunderstorm, rain, and gusty windb. Thunderstorm, moderate rain, and wind gustsc. Thunderstorm, moderate rain, and small hail
13. !FZRASN
a. Light freezing rain and snowb. Light freezing rain showersc. Freezing rain and light snow showers
14. VA FU
a. Smoke in the vicinityb. Volcanic ash and smokec. Volcanic ash and fog
15. DRDU
a. Drifting dustb. Driving dustc. Low drifting dust
16. BLSA
a. Blowing sandb. Blowing sprayc. Blinding sand
4-13
17. BLPY
a. Blowing sprayb. Blowing dust whirlsc. Blowing sand whirls
18. SHPE
a. Ice pellet showersb. Snow and ice pelletsc. Moderate ice pellet showers
19. PRFG
a. Patchy fogb. Partial fogc. Partly foggy
20. Present weather includes which of the following? (more than one answer):
_____ precipitation_____ clouds_____ obscuration_____ well-developed dust/sand whirls_____ tornadic activity_____ wind gusts_____ sandstorm_____ duststorm
21. Proximity qualifier(s) is (are):
a. light, moderate, heavyb. vicinityc. weak, strong, violentd. light, moderate, strong
22. Match the following definitions to their phrase:
a. “occurring at the station”b. “in the vicinity of the station”c. “distant from the station”
_____ precipitation occurring not at the point of observation but within 10 statute miles_____ beyond 10 statute miles of the point of observation_____ between 5 and 10 statute miles from the point of observation for obscurations_____ within 5 statute miles of the point of observation
4-14
23. Volcanic ash is reported:
a. when visibility is less than 7 milesb. only during daylight hoursc. whenever it occursd. only if accompanied by fog or mist
24. Match the following code figures to the qualifier or phenomenon they represent:
_____ MI a. ice pellets_____ BC b. sandstorm_____ SH c. shallow_____ PE d. showers_____ GR e. smoke_____ BR f. mist_____ FU g. spray_____ PY h. patches_____ SS i. hail
Decode the following present weather groups:
25. !RASN BR = ____________________________________________________________________
26. TS SHRA SQ = ________________________________________________________________
27. TS VCSH FG = ________________________________________________________________
28. TS FZRA = ___________________________________________________________________
29. +FC TSRA BR = ______________________________________________________________
30. FZFG = ______________________________________________________________________
31. Which present weather group(s) cannot be reported:
_____ FZBR_____ 2SM FG_____ VCTS SHRA BR _____ +TSRA_____ !FZDZ_____ FZSA_____ BLRA_____ SHPE
32. What are the differences between blowing and low drifting snow?
33. Before the obscuration mist, smoke, widespread dust, sand, haze, or spray is entered in column 9 ofMF1M-10C, it must be occurring both at the and at the and must reduce the prevailing visibility to less than miles.
4-15
34. Precipitation is:
a. any particle falling from the skyb. any form of water particles that fall from the atmosphere and reache the groundc. any form of water found at the earth’s surfaced. water in any state (liquid, solid, vapor) moving through the atmosphere
35. Match the following precipitation types with their definitions:
drizzle a. a fall of unbranched ice crystals in the form of needles, columns, or plates
rain b. small balls or other pieces of ice
snow c. mostly branched ice crystals in the form of six-pointed stars
snow grains d. transparent or translucent pellets of ice with diameters less than5 mm
ice crystals e. fine drops of liquid precipitation with diameters less than 0.5 mm
ice pellets f. very small, white, and opaque grains of ice
hail g. liquid precipitation drops with diameters greater than 0.5 mm
snow pellets h. white, opaque grains of ice with diameters from 2 to 5 mm
36. Match the following obscurations with their definition:
mist volcanic ash haze fog
widespread dust spray smoke sand
a. visible aggregate of minute water particles based at the earth’s surface that reduce horizontal visibility to less than 5/8 statute miles
b. fine particles of earth or other material raised or suspended in the air by the wind
c. a suspension in the air of small particles produced by combustion
d. an ensemble of water droplets torn by the wind from the surface of an extensive body of water
e. visible aggregate of minute water particles based at the earth’s surface that reduces horizontalvisibility to less than 7 statute miles but not less than 5/8 statute miles
f. sand particles raised by the wind
g. fine particles of rock power that originate from a volcano
h. a suspension in the air of extremely small, dry particles that give the air an opalescent appearance
4-16
37. Match the following present weather phenomena with their definition:
well-developed dust/sand whirl sandstorm
funnel cloud duststorm
squalls
a. a violent, rotating column of air that does not touch the earth’s surface
b. particles of sand carried aloft by a strong wind, mostly confined to the lowest ten feet
c. a whirling column of dust or sand with a small diameter and an approximately vertical axis
d. a severe weather condition characterized by strong winds and dust-filled air over an extensivearea
e. sudden onset of strong winds in which the wind speed increases by at least 16 knots and is sustained at 22 knots or more for at least one minute
38. For each of the following descriptions, indicate the appropriate precipitation intensity (LGT, MOD, HVY)
a rain accumulation of 0.25 inch/hour rain seemingly falls in sheets visibility is not affected by falling ice pellets scattered rain drops do not completely wet an exposed surface 0.05 inch of rain in 6 minutes slow accumulation of ice pellets on the ground snow is observed and visibility is 3/4 mile drizzle reduces visibility to 1/8 mile
39. Match the following “descriptors” with the phenomenon they may be used to describe:
shallow, partial a. snow raised by the wind to a height of 6 feet or more
low drifting b. fog with little vertical extent
blowing c. drizzle that forms a glaze on the ground
showers d. precipitation characterized by rapid changes in intensity
thunderstorm e. sand raised by the wind to less than 6 feet
freezing f. local storm produced by a cumulonimbus cloud
4-17
40. For each of the following, indicate the proper order for reporting:
a. squalls rain fog
b. thunderstorm tornado rain
c. thunderstorm snow fog
41. The beginning of a thunderstorm is reported when:
a. thunder is heardb. lightning is observed but local noise prevents hearing thunderc. lightning is observed at a distance but no thunder is heardd. both a and b
42. The ending of a thunderstorm is reported minutes after the last occurrence of the event.
a. 5 minutesb. 10 minutesc. 15 minutesd. 30 minutes
43. The visibility at your station was reduced from 12 miles to 7 miles by mist, light snow, and haze. Wtahminimum entry should you make in column 9 (Present Weather)?
a. BR !SN HZb. !SN BR HZc. !SN BRHZd. !SN
44. Occassional lightning is observed 8 miles north of the station, but thunder is not heard. What is reported in column 9 (Present Weather) and column 14 (Remarks)?
a. col. 9: nothing; col. 14: OCNL LTG VC Nb. col. 9: TS; col. 14: OCNL LTG Nc. col. 9: VCTS; col. 14: OCNL LTG Nd. col. 9: VCTS; col. 14 OCNL LTG 8 N
45. Light drizzle (!DZ) is reported when drizzle is occurring with fog and the visibility is:
a. 1/4 to 1/2 mile.b. less than 1/4 mile.c. less than 1/2 mile.d. any of the above.
4-18
46. Which of the following precipitation events does not require a SPECI report?
a. Ice pellets begin.b. Hail begins.c. !FZRA changes to FZRA.d. !SN changes to +SN.
47. Ice formed on exposed surfaces by freezing rain or freezing drizzle is known as:
a. glaze.b. frost.c. rime.d. ice pellets.
48. Report thunderstorms occurring at your station when is/are observed within the past 15 minutes.
a. very dark CB overhead and lightning in all quadrantsb. heavy rain showers and 55 knot windsc. heavy rain showers and 1/2 inch haild. 3/4 inch hail 20 minutes earlier, but not at the time of the observation
49. Moderate snow (SN) is reported when snow is occurring alone and the visibility is less than:
a. 5/8 of a mile, but not less than 5/16 of a mile.b. 3/4 of a mile, but not less than 5/16 of a mile.c. 5/8 of a mile, but not less than 1/8 of a mile.d. 1 mile, but not less than 1/2 mile.
50. A light intensity symbol (!) is never used to report:
a. ice crystals.b. ice pellets.c. snow showers.d. freezing drizzle.
51. Which of the following phenomena may be classified as having heavy intensity?
a. Hailb. Thunderstormc. Funnel cloudd. Sandstorm
52. If more than one obscuration is occurring at the same time, the obscurations are entered in column 9 (Present Weather) in the order of:
a. their beginning.b. decreasing dominance.c. increasing dominance.d. intensity.
4-19
53. A complex weather situation, represented by light rain showers, light snow showers (dominant), anda thunderstorm, is present. Entries are made in the following order:
a. TS !RA!SNb. !TSSNRAc. TS !SNRAd. !TSSHSNRA
54. The weather phenomena !FZRASN indicates which type of weather is occurring at the station?
a. Light freezing rain and snow.b. Light freezing rain and moderate snow.c. Freezing rain and light snow showers.d. Light rain showers and snow.
55. The visibility at your station was reduced from 12 miles to 7 miles by mist, light snow, and smoke.What is the minimum entry that should be made in column 9 (Present Weather)?
a. !SNb. !SN BR FUc. BRd. BR !SN FU
56. Blowing dust is reducing the prevailing visibility to 5/8 statute mile. What would be recorded incolumn 9 (Present Weather)?
a. BLDUb. DUc. DSd. +DS
57. The visibility decreased from 1 mile to 1/2 mile in fog. At the same time, the temperature decreasedfrom 1.5°C to 0.0°C. What should be recorded in column 9 (Present Weather)?
a. FZFGb. BRc. FGd. FZBR
58. If light snow and blowing snow are occurring at the same time and the observer can no longer determineif light snow is falling, what should be reported in column 9 (Present Weather)?
a. BLSNb. !SN BLSNc. !SN !BLSNd. !BLSN
4-20
59. Steady rain is observed 4 miles NE to SE from the station. How should it be recorded?
a. remarks: RA NE-SEb. remarks: VCSHc. column 9 (Present Weather): VCSHd. column 9 (Present Weather): RA, and in remarks: RA NE-SE
60. Heavy rain (+RA) is reported when the rate-of-fall is:
a. more than 0.01 inch to 0.03 inch in 6 minutesb. more than 0.11 inch to 0.30 inch per hourc. more than 0.30 inch per hourd. more than 0.20 inch per hour
61. When more than one type of present weather is reported at the same time, present weather shall bereported in the following order:
a. Tornadic activity, obscurations, precipitationb. Tornadic activity, thunderstorms, precipitation, obscurations, other weatherc. Thunderstorms, precipitation, obscurations, other weatherd. Tornadic activity, precipitation, thunderstorms, other weather
62. The intensity of snow occurring alone is determined according to:
a. the degree that it affects visibility.b. the rate of accumulation.c. whether it is showery or intermittent.d. the temperature of the dew point.
63. For which of the following is a minus sign (!) used to show light intensity?
a. TSb. ICc. GSd. SG
64. When is lightning reported in column 9 (Present Weather)?
a. lightning is overheadb. lightning is observed and the wind gusts exceed 50 knotsc. hailstone size exceeds 3/4 inchd. lightning is never reported in column 9
65. Sand raised by the wind to less than 6 feet is coded as:
a. BLSAb. MISAc. SHSAd. DRSA
4-21
66. The observer reports IC in column 9 (Present Weather). Given this report, which of the followingstatements is correct?
a. The visibility is less than one mile.b. The sky may be clear.c. The air is unstable with rapidly changing weather conditions.d. The observer has made an error in column 9.
67. Fog that covers a substantial part of the station when the prevailing visibility is 7 miles would be codedin the present weather as:
a. BRb. PRFGc. MIFGd. BCFG
68. Patches of fog randomly cover the station, but the prevailing visibility is 7 miles. What is reported incolumn 9 (Present Weather)?
a. nothingb. BCFGc. BRd. VCFG
69. The intensity of snow, occurring alone, is reported as moderate when the prevailing visibility is 1/2 to5/16 mile. When observing phenomena are also present, you could not report moderate snow if theprevailing visibility is:
a. 0SMb. 1/2SMc. 1/4SMd. 3/4SM
70. Which of the following phenomena can be reported with an intensity qualifier?
a. drizzleb. fogc. small haild. smoke
71. Obscurations should be reported only when the prevailing visibility is less than 7 miles, except for:
a. Volcanic ashb. Partial fogc. Patches of fogd. All of the above
4-22
72. Rain showers of an unknown intensity are observed approximately 7 to 8 miles north of the station.What should be recorded in column 9 (Present Weather) and/or column 14 (Remarks)?
a. column 9: VCSH; column 14: VCSH Nb. column 9: nothing required; column 14: VCSH 7-8 Nc. column 9: VCSH; column 14: RA SH UNKN Nd. nothing required in either column
73. Fog/mist is responsible for lowering the visibility to 5/8 mile. Light rain is also occurring. The presentweather would be coded:
a. FG RA!b. !RA FGc. !RA BRd. BR !RA
74. A large area of fog is observed 6 miles NE-S of the station. What is reported in column 9 (PresentWeather)?
a. nothingb. VCFGc. PRFGd. BCFG
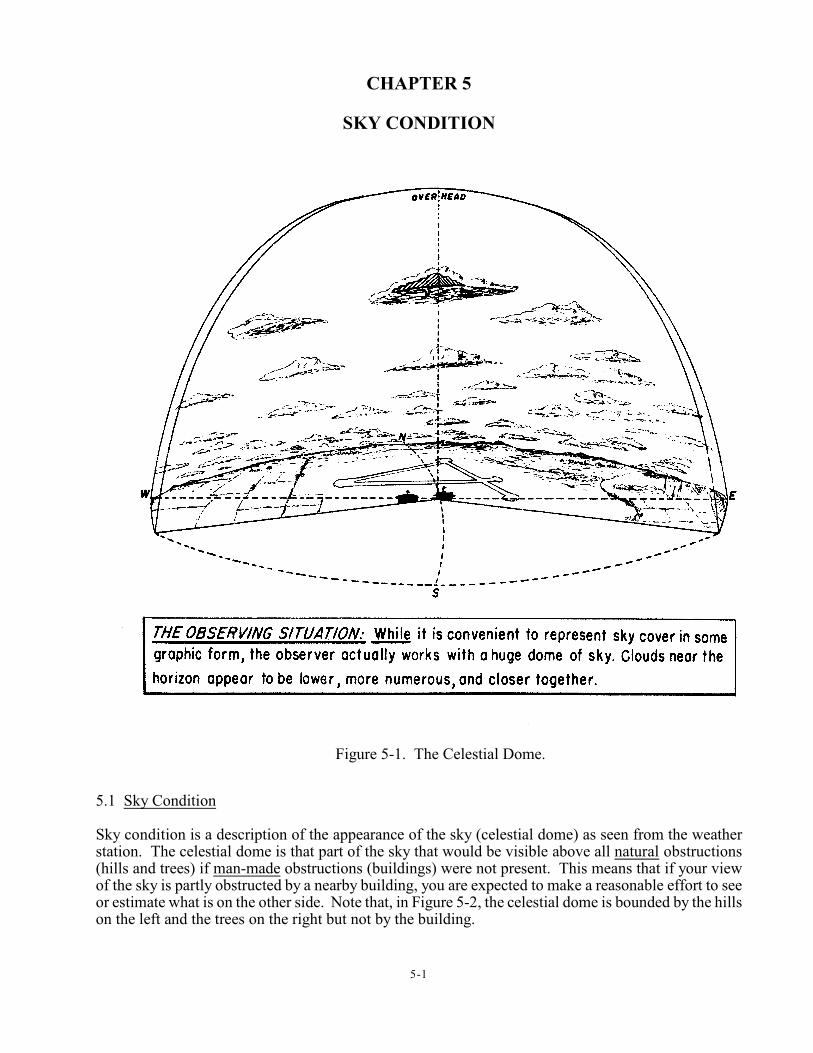
5-1
Figure 5-1. The Celestial Dome.
CHAPTER 5
SKY CONDITION
5.1 Sky Condition
Sky condition is a description of the appearance of the sky (celestial dome) as seen from the weatherstation. The celestial dome is that part of the sky that would be visible above all natural obstructions(hills and trees) if man-made obstructions (buildings) were not present. This means that if your viewof the sky is partly obstructed by a nearby building, you are expected to make a reasonable effort to seeor estimate what is on the other side. Note that, in Figure 5-2, the celestial dome is bounded by the hillson the left and the trees on the right but not by the building.
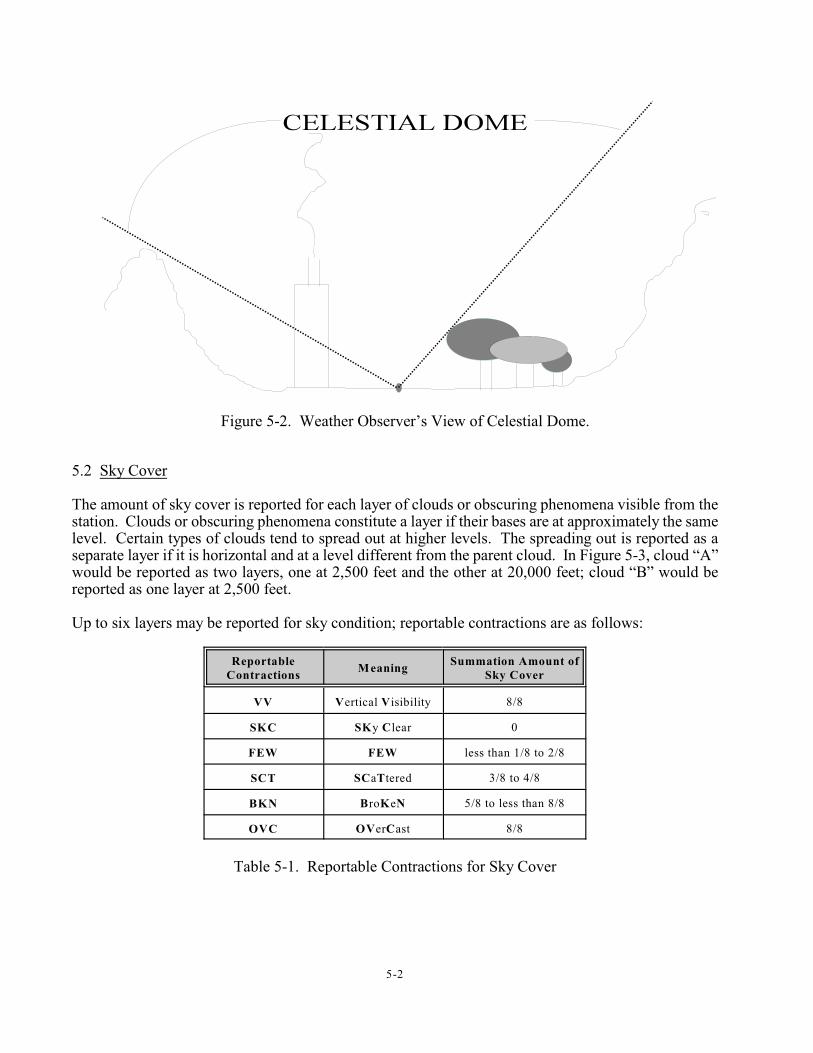
5-2
Figure 5-2. Weather Observer’s View of Celestial Dome.
5.2 Sky Cover
The amount of sky cover is reported for each layer of clouds or obscuring phenomena visible from thestation. Clouds or obscuring phenomena constitute a layer if their bases are at approximately the samelevel. Certain types of clouds tend to spread out at higher levels. The spreading out is reported as aseparate layer if it is horizontal and at a level different from the parent cloud. In Figure 5-3, cloud “A”would be reported as two layers, one at 2,500 feet and the other at 20,000 feet; cloud “B” would bereported as one layer at 2,500 feet.
Up to six layers may be reported for sky condition; reportable contractions are as follows:
ReportableContractions
MeaningSummation Amount of
Sky Cover
VV Vertical Visibility 8/8
SKC SKy Clear 0
FEW FEW less than 1/8 to 2/8
SCT SCaTtered 3/8 to 4/8
BKN BroKeN 5/8 to less than 8/8
OVC OVerCast 8/8
Table 5-1. Reportable Contractions for Sky Cover
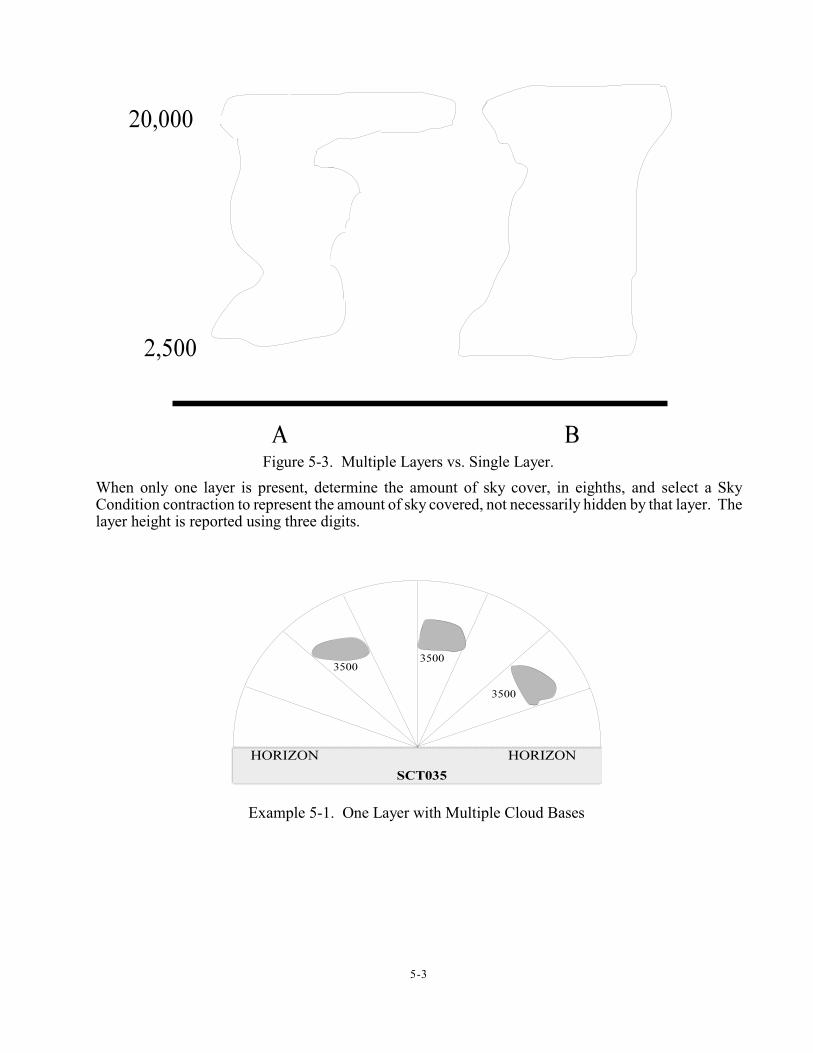
5-3
Figure 5-3. Multiple Layers vs. Single Layer.
Example 5-1. One Layer with Multiple Cloud Bases
When only one layer is present, determine the amount of sky cover, in eighths, and select a SkyCondition contraction to represent the amount of sky covered, not necessarily hidden by that layer. Thelayer height is reported using three digits.
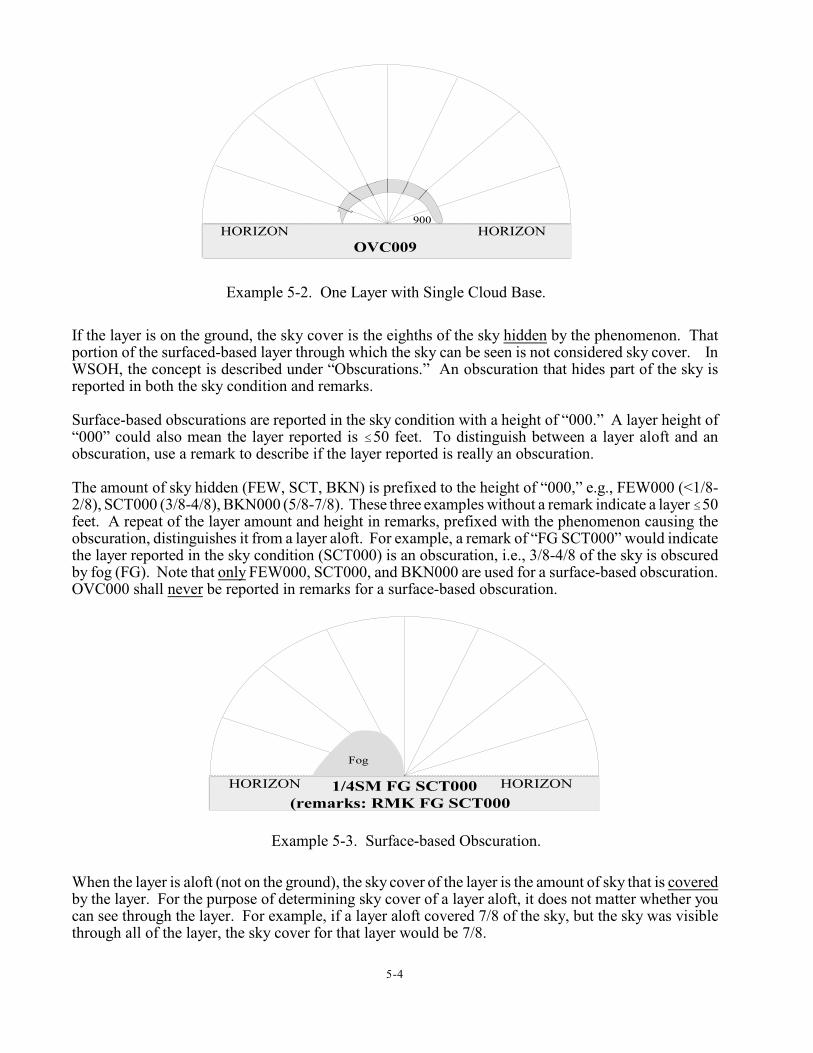
5-4
Example 5-2. One Layer with Single Cloud Base.
Example 5-3. Surface-based Obscuration.
If the layer is on the ground, the sky cover is the eighths of the sky hidden by the phenomenon. Thatportion of the surfaced-based layer through which the sky can be seen is not considered sky cover. InWSOH, the concept is described under “Obscurations.” An obscuration that hides part of the sky isreported in both the sky condition and remarks.
Surface-based obscurations are reported in the sky condition with a height of “000.” A layer height of“000” could also mean the layer reported is #50 feet. To distinguish between a layer aloft and anobscuration, use a remark to describe if the layer reported is really an obscuration.
The amount of sky hidden (FEW, SCT, BKN) is prefixed to the height of “000,” e.g., FEW000 (<1/8-2/8), SCT000 (3/8-4/8), BKN000 (5/8-7/8). These three examples without a remark indicate a layer #50feet. A repeat of the layer amount and height in remarks, prefixed with the phenomenon causing theobscuration, distinguishes it from a layer aloft. For example, a remark of “FG SCT000” would indicatethe layer reported in the sky condition (SCT000) is an obscuration, i.e., 3/8-4/8 of the sky is obscuredby fog (FG). Note that only FEW000, SCT000, and BKN000 are used for a surface-based obscuration.OVC000 shall never be reported in remarks for a surface-based obscuration.
When the layer is aloft (not on the ground), the sky cover of the layer is the amount of sky that is coveredby the layer. For the purpose of determining sky cover of a layer aloft, it does not matter whether youcan see through the layer. For example, if a layer aloft covered 7/8 of the sky, but the sky was visiblethrough all of the layer, the sky cover for that layer would be 7/8.
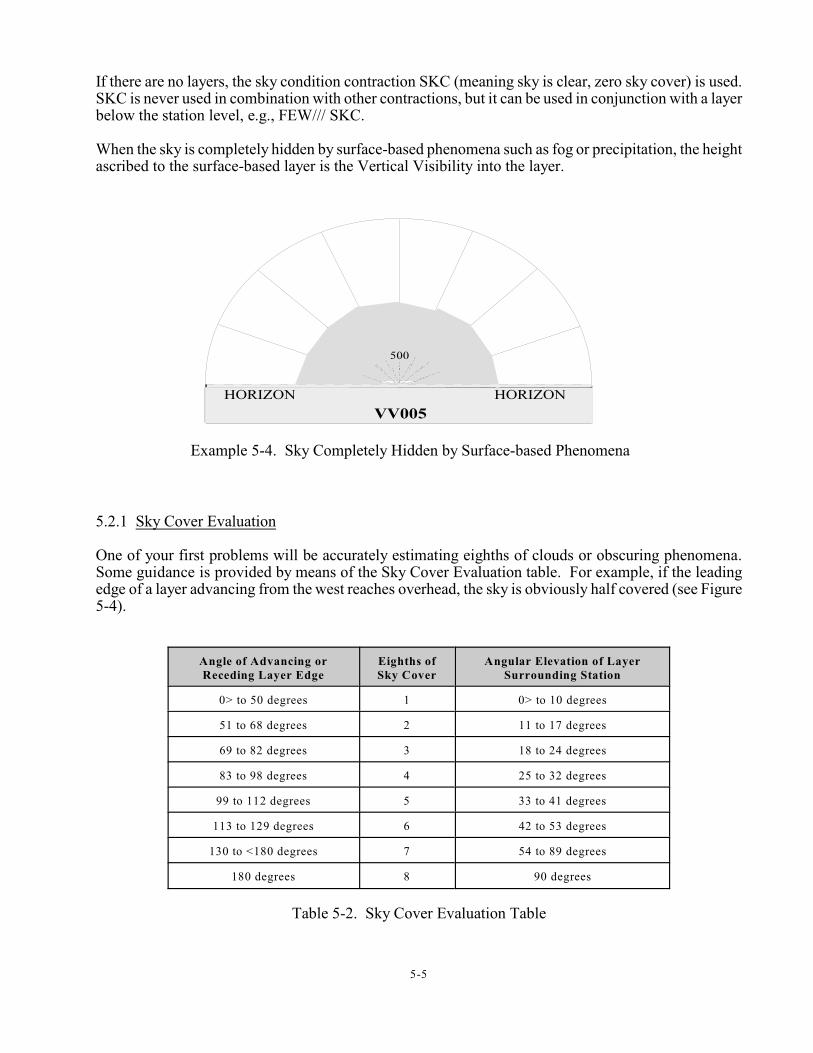
5-5
Example 5-4. Sky Completely Hidden by Surface-based Phenomena
If there are no layers, the sky condition contraction SKC (meaning sky is clear, zero sky cover) is used.SKC is never used in combination with other contractions, but it can be used in conjunction with a layerbelow the station level, e.g., FEW/// SKC. When the sky is completely hidden by surface-based phenomena such as fog or precipitation, the heightascribed to the surface-based layer is the Vertical Visibility into the layer.
5.2.1 Sky Cover Evaluation
One of your first problems will be accurately estimating eighths of clouds or obscuring phenomena.Some guidance is provided by means of the Sky Cover Evaluation table. For example, if the leadingedge of a layer advancing from the west reaches overhead, the sky is obviously half covered (see Figure5-4).
Angle of Advancing orReceding Layer Edge
Eighths ofSky Cover
Angular Elevation of LayerSurrounding Station
0> to 50 degrees 1 0> to 10 degrees
51 to 68 degrees 2 11 to 17 degrees
69 to 82 degrees 3 18 to 24 degrees
83 to 98 degrees 4 25 to 32 degrees
99 to 112 degrees 5 33 to 41 degrees
113 to 129 degrees 6 42 to 53 degrees
130 to <180 degrees 7 54 to 89 degrees
180 degrees 8 90 degrees
Table 5-2. Sky Cover Evaluation Table
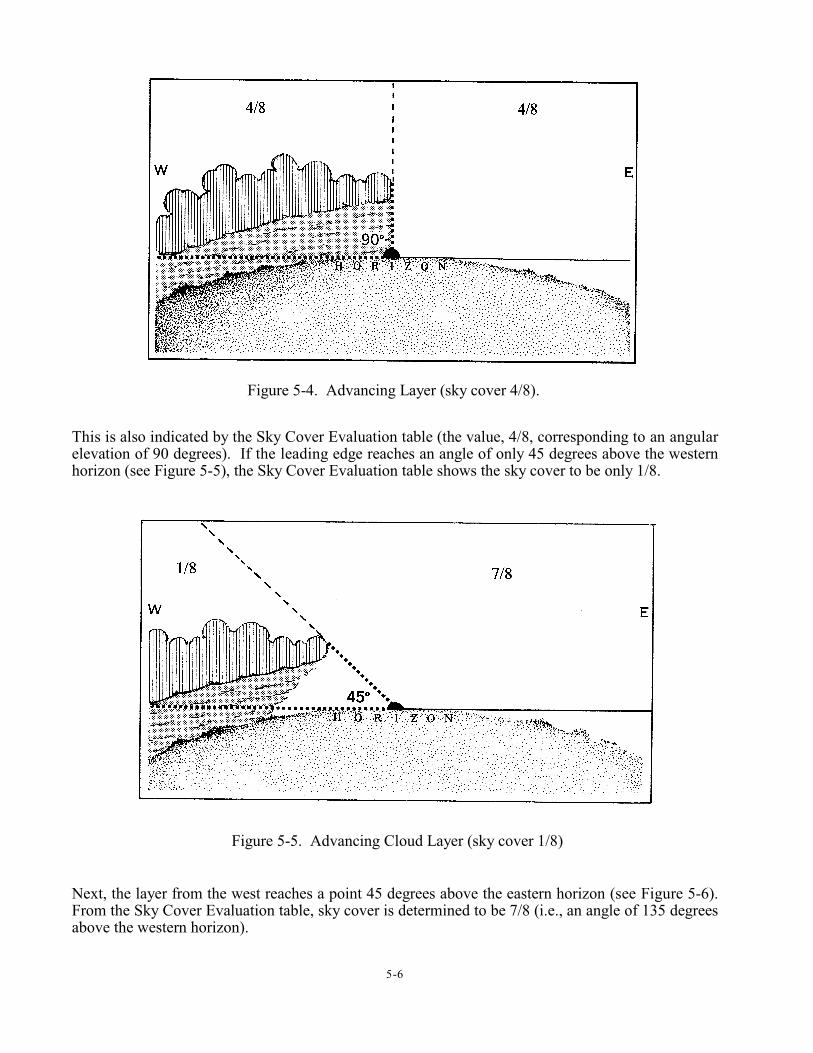
5-6
Figure 5-4. Advancing Layer (sky cover 4/8).
Figure 5-5. Advancing Cloud Layer (sky cover 1/8)
This is also indicated by the Sky Cover Evaluation table (the value, 4/8, corresponding to an angularelevation of 90 degrees). If the leading edge reaches an angle of only 45 degrees above the westernhorizon (see Figure 5-5), the Sky Cover Evaluation table shows the sky cover to be only 1/8.
Next, the layer from the west reaches a point 45 degrees above the eastern horizon (see Figure 5-6).From the Sky Cover Evaluation table, sky cover is determined to be 7/8 (i.e., an angle of 135 degreesabove the western horizon).
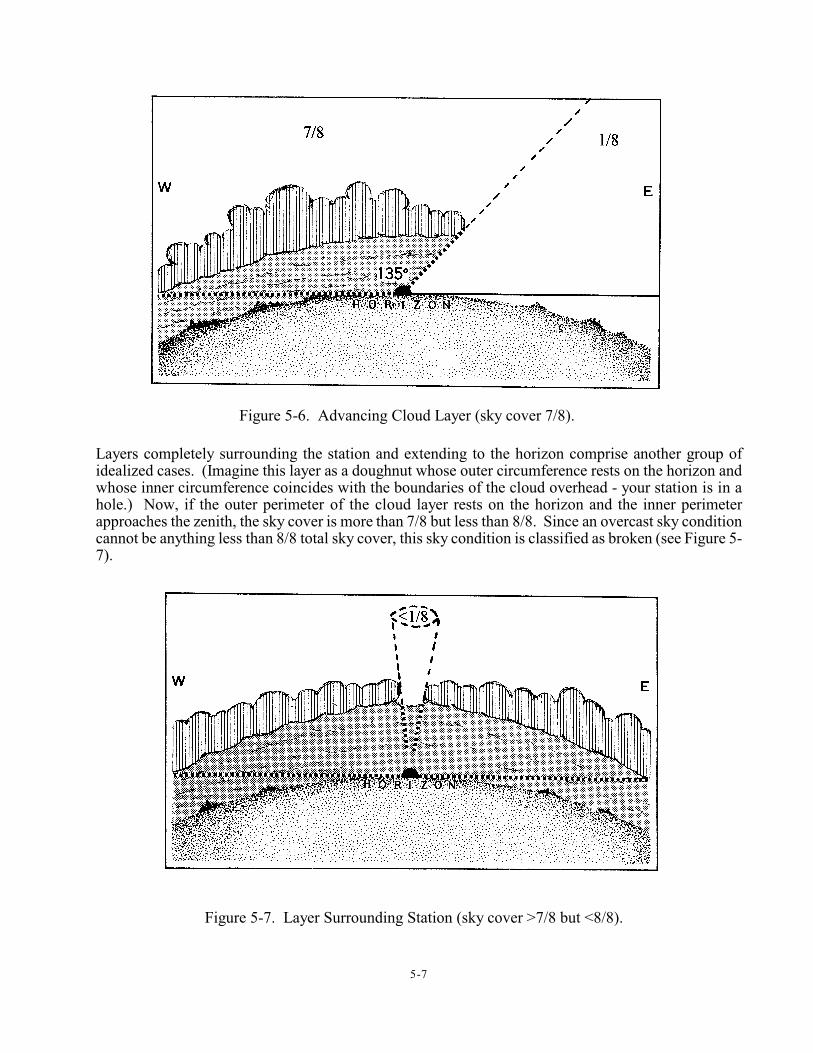
5-7
Figure 5-6. Advancing Cloud Layer (sky cover 7/8).
Figure 5-7. Layer Surrounding Station (sky cover >7/8 but <8/8).
Layers completely surrounding the station and extending to the horizon comprise another group ofidealized cases. (Imagine this layer as a doughnut whose outer circumference rests on the horizon andwhose inner circumference coincides with the boundaries of the cloud overhead - your station is in ahole.) Now, if the outer perimeter of the cloud layer rests on the horizon and the inner perimeterapproaches the zenith, the sky cover is more than 7/8 but less than 8/8. Since an overcast sky conditioncannot be anything less than 8/8 total sky cover, this sky condition is classified as broken (see Figure 5-7).

5-8
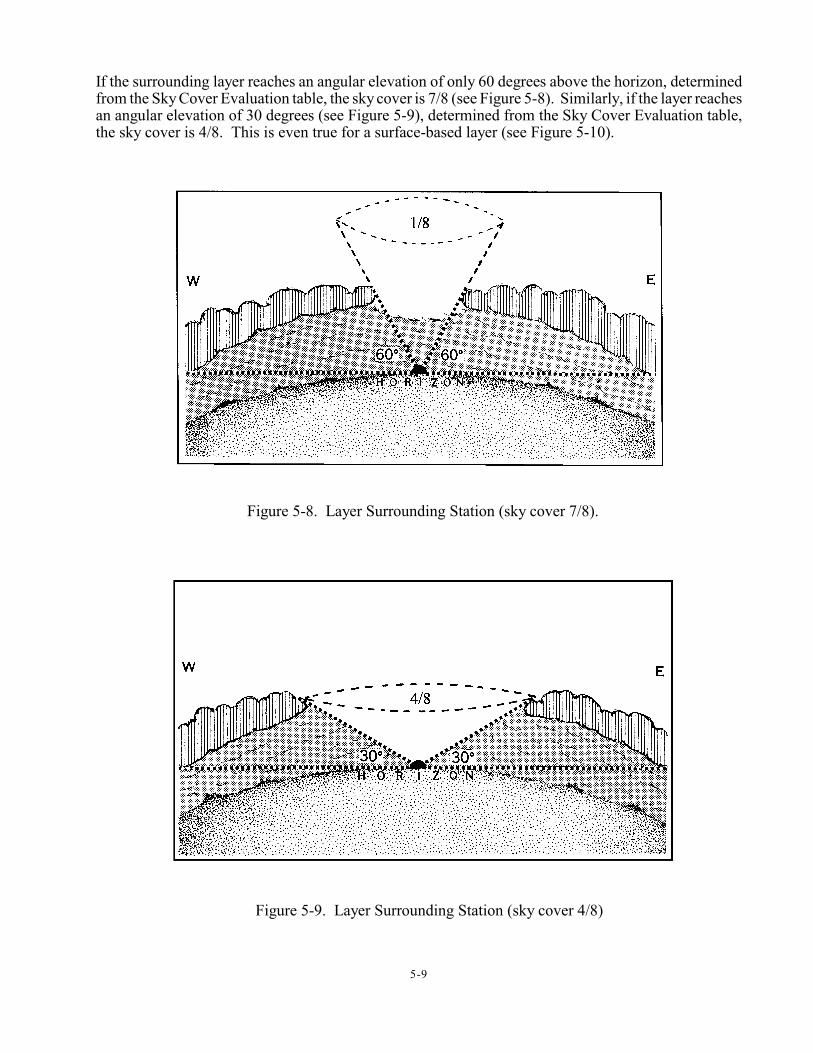
5-9
Figure 5-8. Layer Surrounding Station (sky cover 7/8).
Figure 5-9. Layer Surrounding Station (sky cover 4/8)
If the surrounding layer reaches an angular elevation of only 60 degrees above the horizon, determinedfrom the Sky Cover Evaluation table, the sky cover is 7/8 (see Figure 5-8). Similarly, if the layer reachesan angular elevation of 30 degrees (see Figure 5-9), determined from the Sky Cover Evaluation table,the sky cover is 4/8. This is even true for a surface-based layer (see Figure 5-10).
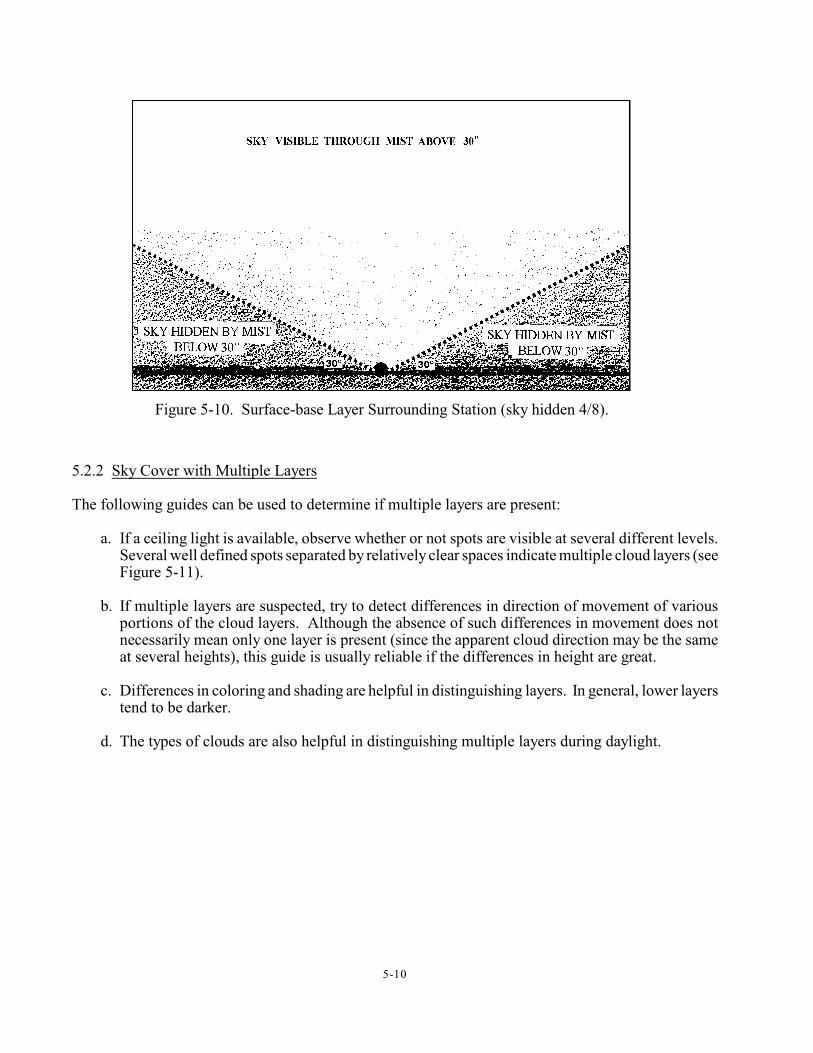
5-10
Figure 5-10. Surface-base Layer Surrounding Station (sky hidden 4/8).
5.2.2 Sky Cover with Multiple Layers
The following guides can be used to determine if multiple layers are present:
a. If a ceiling light is available, observe whether or not spots are visible at several different levels.Several well defined spots separated by relatively clear spaces indicate multiple cloud layers (seeFigure 5-11).
b. If multiple layers are suspected, try to detect differences in direction of movement of variousportions of the cloud layers. Although the absence of such differences in movement does notnecessarily mean only one layer is present (since the apparent cloud direction may be the sameat several heights), this guide is usually reliable if the differences in height are great.
c. Differences in coloring and shading are helpful in distinguishing layers. In general, lower layerstend to be darker.
d. The types of clouds are also helpful in distinguishing multiple layers during daylight.
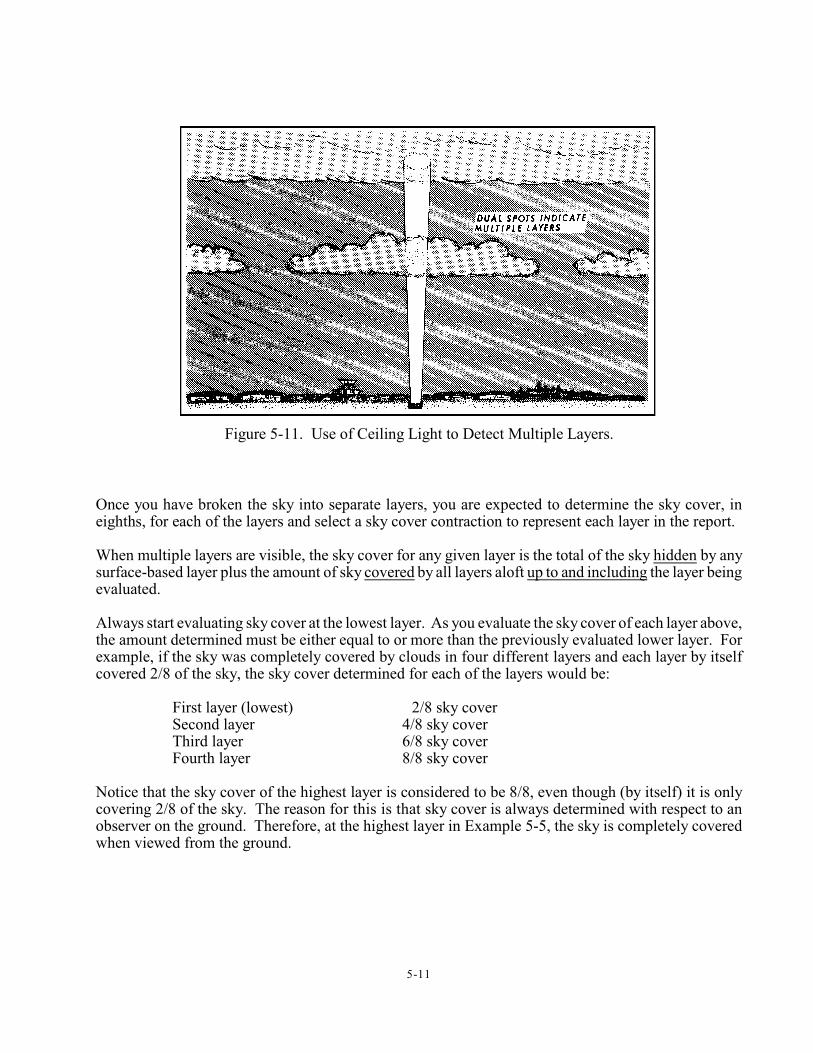
5-11
Figure 5-11. Use of Ceiling Light to Detect Multiple Layers.
Once you have broken the sky into separate layers, you are expected to determine the sky cover, ineighths, for each of the layers and select a sky cover contraction to represent each layer in the report.
When multiple layers are visible, the sky cover for any given layer is the total of the sky hidden by anysurface-based layer plus the amount of sky covered by all layers aloft up to and including the layer beingevaluated.
Always start evaluating sky cover at the lowest layer. As you evaluate the sky cover of each layer above,the amount determined must be either equal to or more than the previously evaluated lower layer. Forexample, if the sky was completely covered by clouds in four different layers and each layer by itselfcovered 2/8 of the sky, the sky cover determined for each of the layers would be:
First layer (lowest) 2/8 sky coverSecond layer 4/8 sky coverThird layer 6/8 sky coverFourth layer 8/8 sky cover
Notice that the sky cover of the highest layer is considered to be 8/8, even though (by itself) it is onlycovering 2/8 of the sky. The reason for this is that sky cover is always determined with respect to anobserver on the ground. Therefore, at the highest layer in Example 5-5, the sky is completely coveredwhen viewed from the ground.
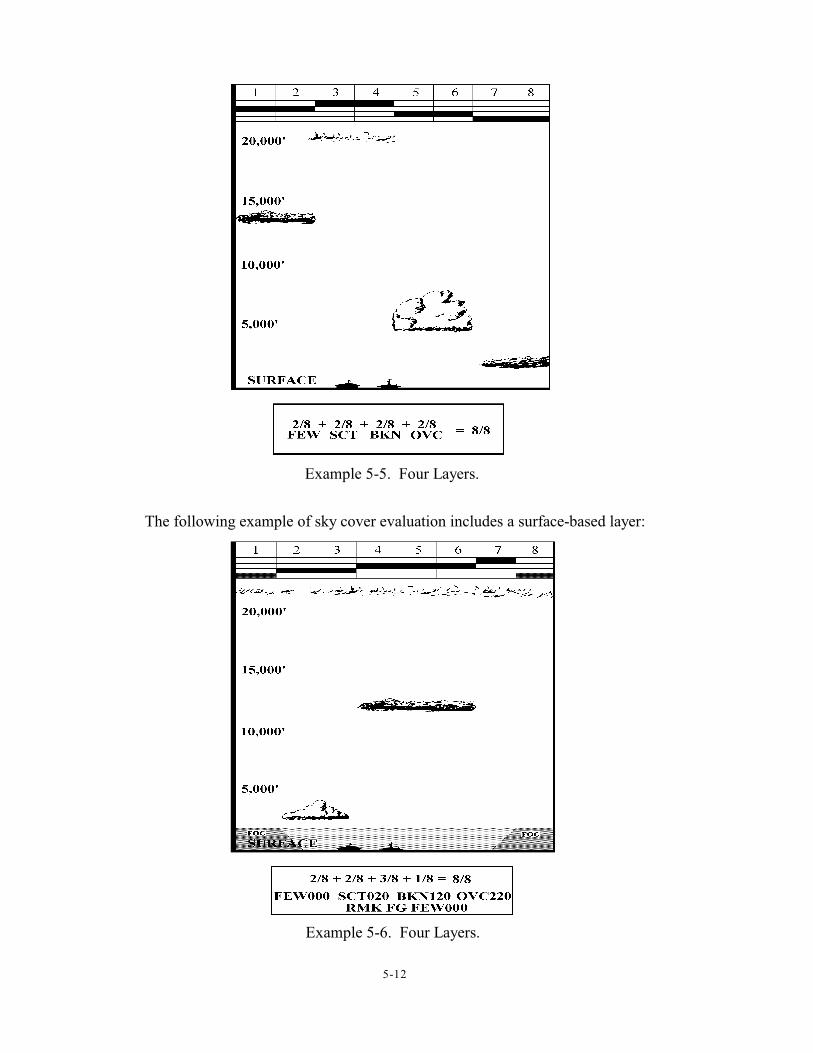
5-12
Example 5-5. Four Layers.
Example 5-6. Four Layers.
The following example of sky cover evaluation includes a surface-based layer:
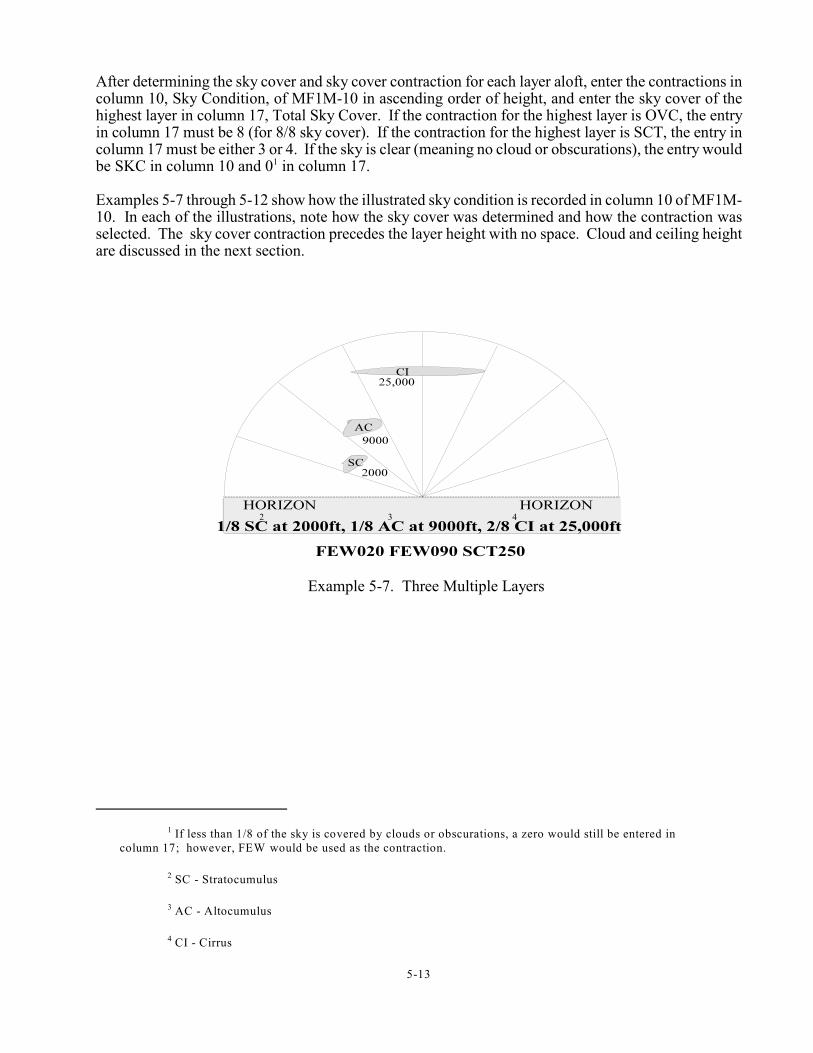
If less than 1/8 of the sky is covered by clouds or obscurations, a zero would still be entered in1
column 17; however, FEW would be used as the contraction.
SC - Stratocumulus2
AC - Altocumulus3
CI - Cirrus4
5-13
Example 5-7. Three Multiple Layers
After determining the sky cover and sky cover contraction for each layer aloft, enter the contractions incolumn 10, Sky Condition, of MF1M-10 in ascending order of height, and enter the sky cover of thehighest layer in column 17, Total Sky Cover. If the contraction for the highest layer is OVC, the entryin column 17 must be 8 (for 8/8 sky cover). If the contraction for the highest layer is SCT, the entry incolumn 17 must be either 3 or 4. If the sky is clear (meaning no cloud or obscurations), the entry wouldbe SKC in column 10 and 0 in column 17.1
Examples 5-7 through 5-12 show how the illustrated sky condition is recorded in column 10 of MF1M-10. In each of the illustrations, note how the sky cover was determined and how the contraction wasselected. The sky cover contraction precedes the layer height with no space. Cloud and ceiling heightare discussed in the next section.
2 3 4
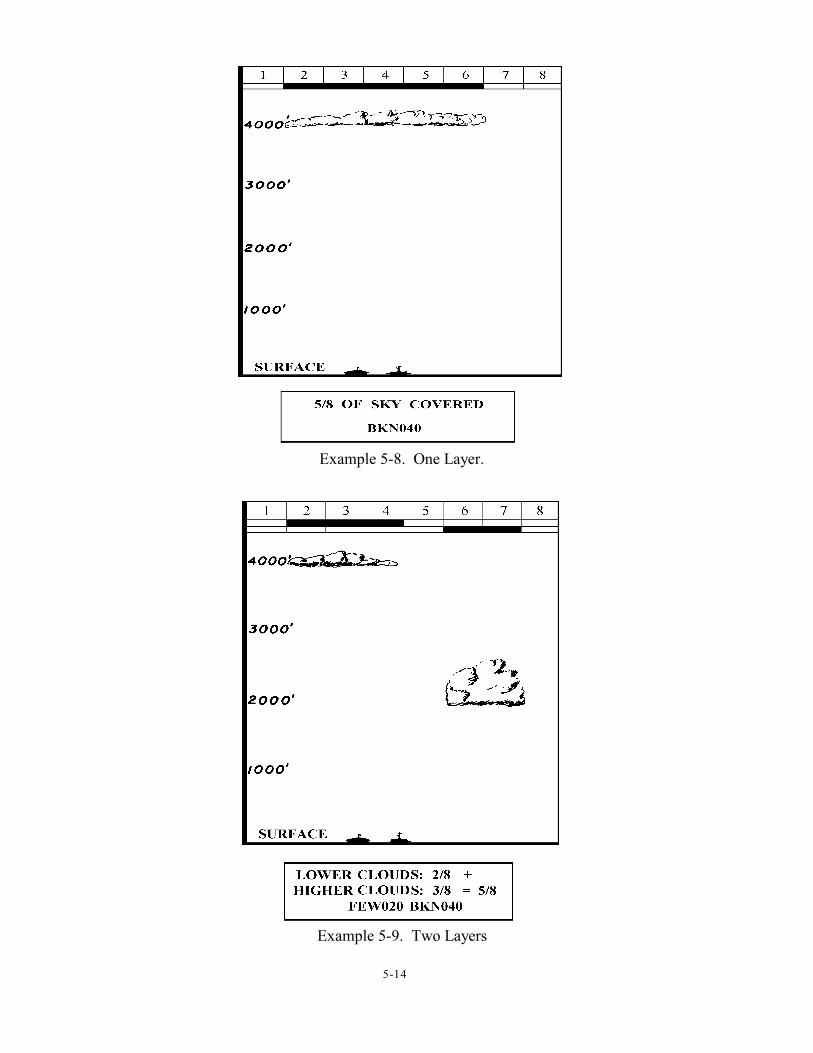
5-14
Example 5-8. One Layer.
Example 5-9. Two Layers
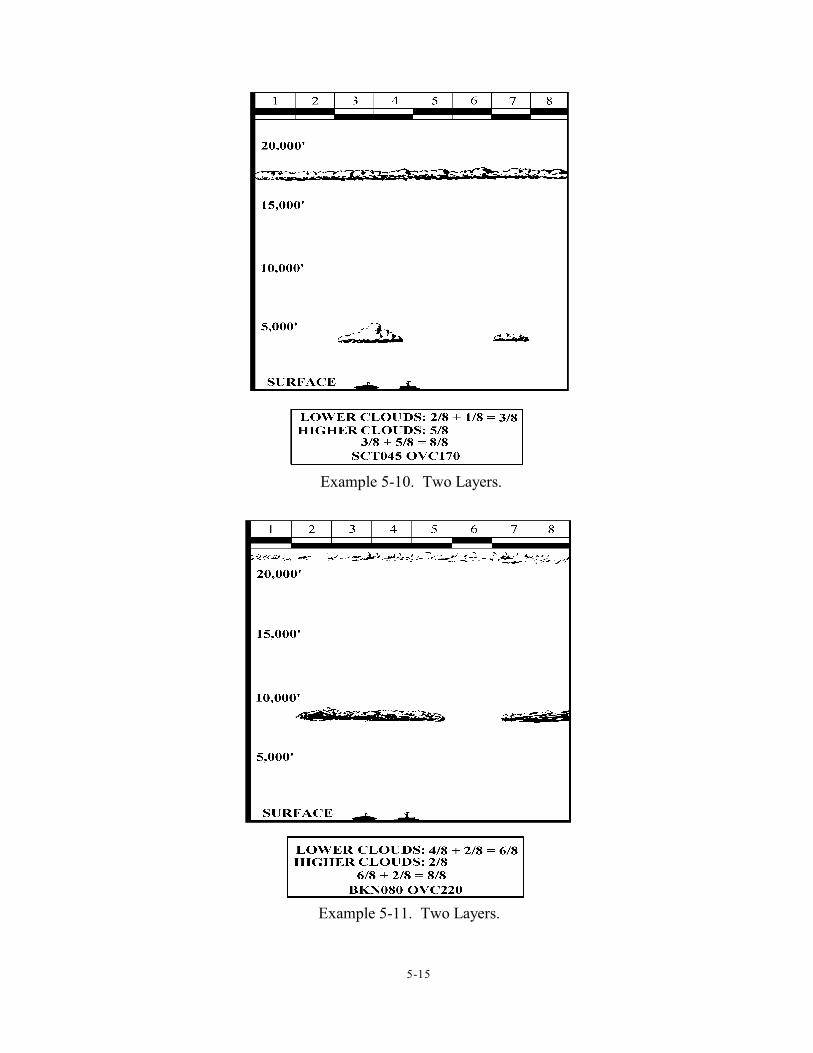
5-15
Example 5-10. Two Layers.
Example 5-11. Two Layers.
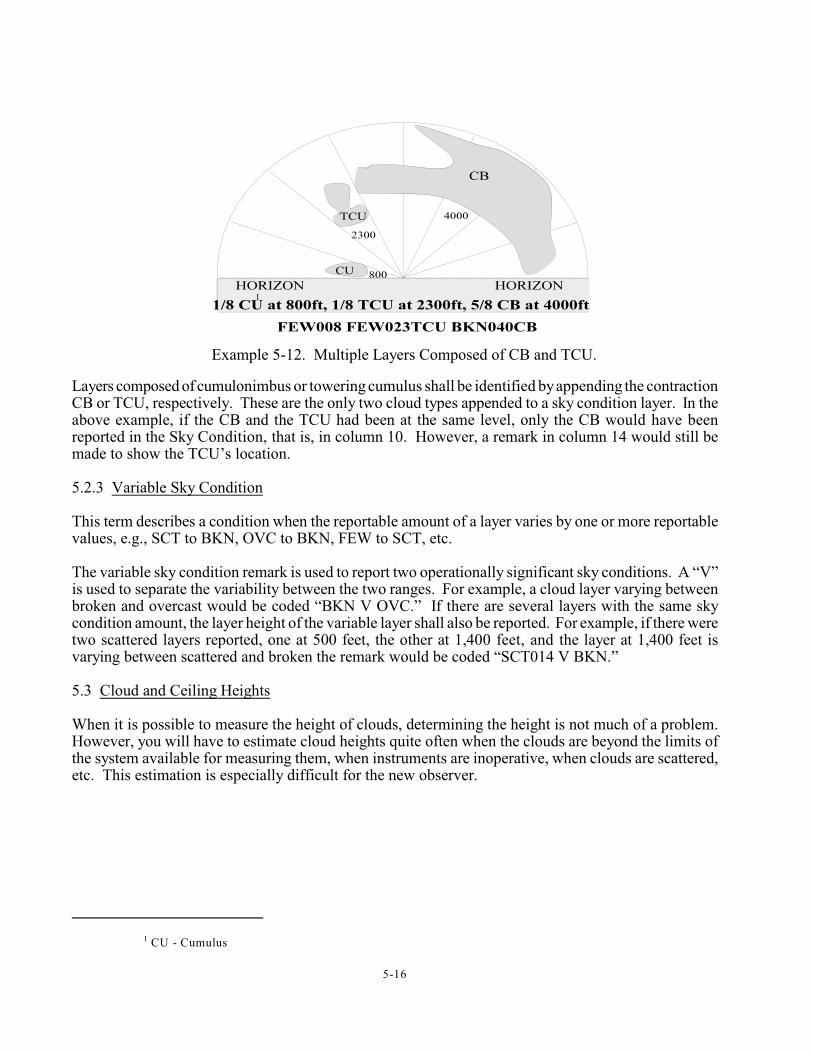
CU - Cumulus1
5-16
Example 5-12. Multiple Layers Composed of CB and TCU.
1
Layers composed of cumulonimbus or towering cumulus shall be identified by appending the contractionCB or TCU, respectively. These are the only two cloud types appended to a sky condition layer. In theabove example, if the CB and the TCU had been at the same level, only the CB would have beenreported in the Sky Condition, that is, in column 10. However, a remark in column 14 would still bemade to show the TCU’s location.
5.2.3 Variable Sky Condition
This term describes a condition when the reportable amount of a layer varies by one or more reportablevalues, e.g., SCT to BKN, OVC to BKN, FEW to SCT, etc.
The variable sky condition remark is used to report two operationally significant sky conditions. A “V”is used to separate the variability between the two ranges. For example, a cloud layer varying betweenbroken and overcast would be coded “BKN V OVC.” If there are several layers with the same skycondition amount, the layer height of the variable layer shall also be reported. For example, if there weretwo scattered layers reported, one at 500 feet, the other at 1,400 feet, and the layer at 1,400 feet isvarying between scattered and broken the remark would be coded “SCT014 V BKN.”
5.3 Cloud and Ceiling Heights
When it is possible to measure the height of clouds, determining the height is not much of a problem.However, you will have to estimate cloud heights quite often when the clouds are beyond the limits ofthe system available for measuring them, when instruments are inoperative, when clouds are scattered,etc. This estimation is especially difficult for the new observer.
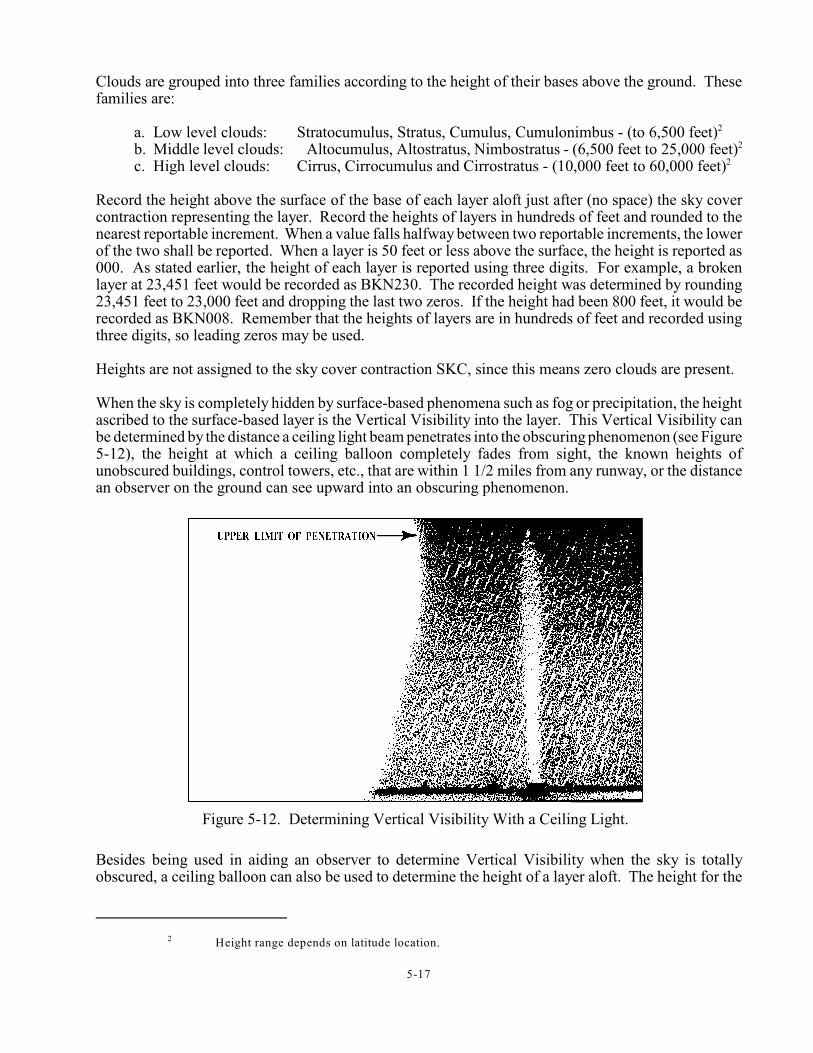
Height range depends on latitude location.2
5-17
Figure 5-12. Determining Vertical Visibility With a Ceiling Light.
Clouds are grouped into three families according to the height of their bases above the ground. Thesefamilies are:
a. Low level clouds: Stratocumulus, Stratus, Cumulus, Cumulonimbus - (to 6,500 feet)2
b. Middle level clouds: Altocumulus, Altostratus, Nimbostratus - (6,500 feet to 25,000 feet)2
c. High level clouds: Cirrus, Cirrocumulus and Cirrostratus - (10,000 feet to 60,000 feet)2
Record the height above the surface of the base of each layer aloft just after (no space) the sky covercontraction representing the layer. Record the heights of layers in hundreds of feet and rounded to thenearest reportable increment. When a value falls halfway between two reportable increments, the lowerof the two shall be reported. When a layer is 50 feet or less above the surface, the height is reported as000. As stated earlier, the height of each layer is reported using three digits. For example, a brokenlayer at 23,451 feet would be recorded as BKN230. The recorded height was determined by rounding23,451 feet to 23,000 feet and dropping the last two zeros. If the height had been 800 feet, it would berecorded as BKN008. Remember that the heights of layers are in hundreds of feet and recorded usingthree digits, so leading zeros may be used.
Heights are not assigned to the sky cover contraction SKC, since this means zero clouds are present.
When the sky is completely hidden by surface-based phenomena such as fog or precipitation, the heightascribed to the surface-based layer is the Vertical Visibility into the layer. This Vertical Visibility canbe determined by the distance a ceiling light beam penetrates into the obscuring phenomenon (see Figure5-12), the height at which a ceiling balloon completely fades from sight, the known heights ofunobscured buildings, control towers, etc., that are within 1 1/2 miles from any runway, or the distancean observer on the ground can see upward into an obscuring phenomenon.
Besides being used in aiding an observer to determine Vertical Visibility when the sky is totallyobscured, a ceiling balloon can also be used to determine the height of a layer aloft. The height for the
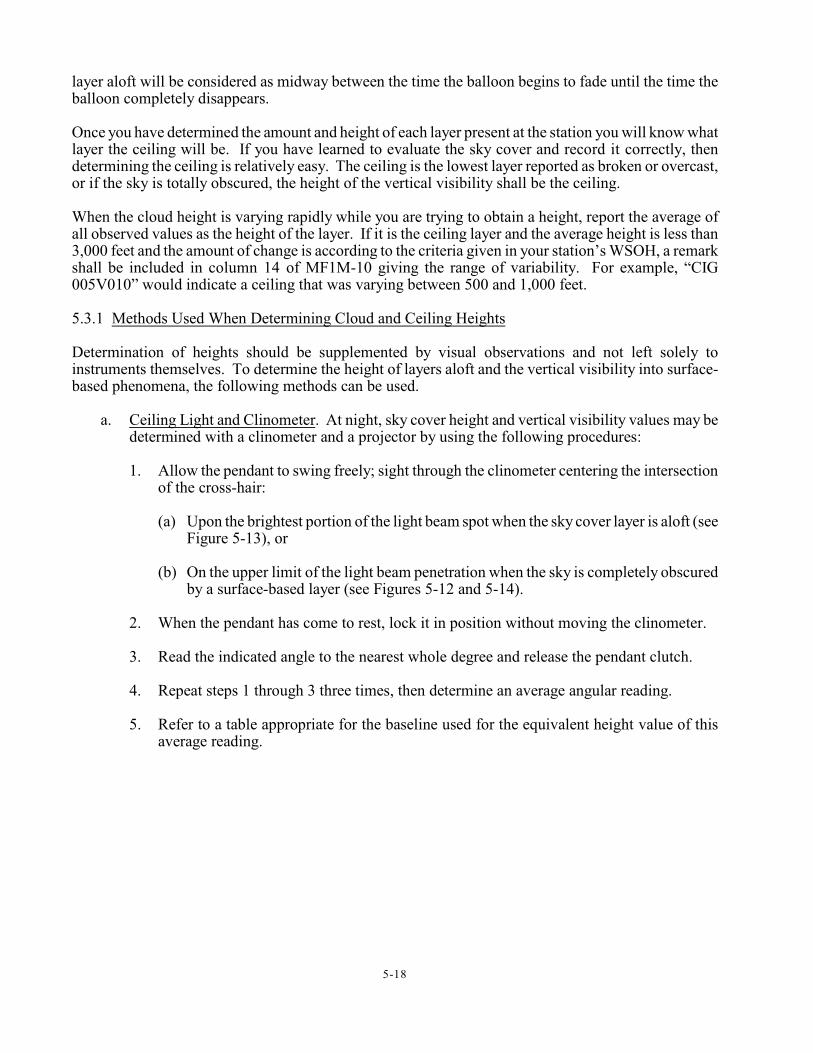
5-18
layer aloft will be considered as midway between the time the balloon begins to fade until the time theballoon completely disappears.
Once you have determined the amount and height of each layer present at the station you will know whatlayer the ceiling will be. If you have learned to evaluate the sky cover and record it correctly, thendetermining the ceiling is relatively easy. The ceiling is the lowest layer reported as broken or overcast,or if the sky is totally obscured, the height of the vertical visibility shall be the ceiling.
When the cloud height is varying rapidly while you are trying to obtain a height, report the average ofall observed values as the height of the layer. If it is the ceiling layer and the average height is less than3,000 feet and the amount of change is according to the criteria given in your station’s WSOH, a remarkshall be included in column 14 of MF1M-10 giving the range of variability. For example, “CIG005V010” would indicate a ceiling that was varying between 500 and 1,000 feet.
5.3.1 Methods Used When Determining Cloud and Ceiling Heights
Determination of heights should be supplemented by visual observations and not left solely toinstruments themselves. To determine the height of layers aloft and the vertical visibility into surface-based phenomena, the following methods can be used.
a. Ceiling Light and Clinometer. At night, sky cover height and vertical visibility values may bedetermined with a clinometer and a projector by using the following procedures:
1. Allow the pendant to swing freely; sight through the clinometer centering the intersectionof the cross-hair:
(a) Upon the brightest portion of the light beam spot when the sky cover layer is aloft (seeFigure 5-13), or
(b) On the upper limit of the light beam penetration when the sky is completely obscuredby a surface-based layer (see Figures 5-12 and 5-14).
2. When the pendant has come to rest, lock it in position without moving the clinometer.
3. Read the indicated angle to the nearest whole degree and release the pendant clutch.
4. Repeat steps 1 through 3 three times, then determine an average angular reading.
5. Refer to a table appropriate for the baseline used for the equivalent height value of thisaverage reading.
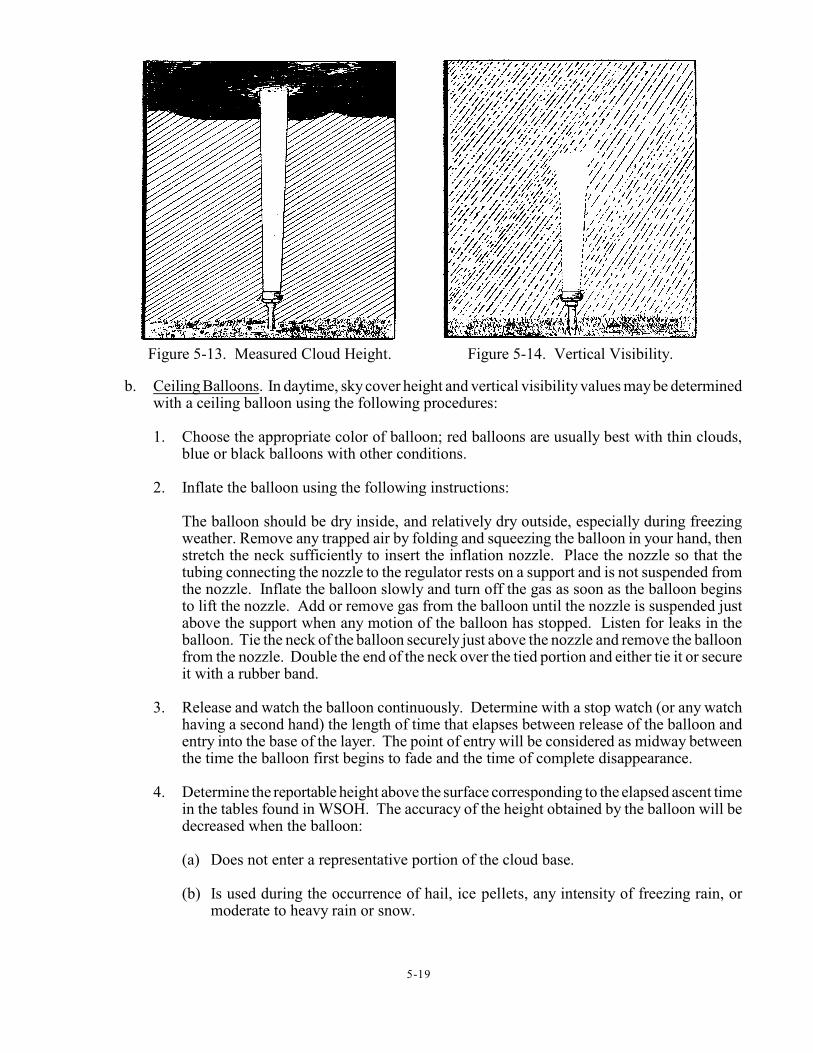
5-19
Figure 5-13. Measured Cloud Height. Figure 5-14. Vertical Visibility.
b. Ceiling Balloons. In daytime, sky cover height and vertical visibility values may be determinedwith a ceiling balloon using the following procedures:
1. Choose the appropriate color of balloon; red balloons are usually best with thin clouds,blue or black balloons with other conditions.
2. Inflate the balloon using the following instructions:
The balloon should be dry inside, and relatively dry outside, especially during freezingweather. Remove any trapped air by folding and squeezing the balloon in your hand, thenstretch the neck sufficiently to insert the inflation nozzle. Place the nozzle so that thetubing connecting the nozzle to the regulator rests on a support and is not suspended fromthe nozzle. Inflate the balloon slowly and turn off the gas as soon as the balloon beginsto lift the nozzle. Add or remove gas from the balloon until the nozzle is suspended justabove the support when any motion of the balloon has stopped. Listen for leaks in theballoon. Tie the neck of the balloon securely just above the nozzle and remove the balloonfrom the nozzle. Double the end of the neck over the tied portion and either tie it or secureit with a rubber band.
3. Release and watch the balloon continuously. Determine with a stop watch (or any watchhaving a second hand) the length of time that elapses between release of the balloon andentry into the base of the layer. The point of entry will be considered as midway betweenthe time the balloon first begins to fade and the time of complete disappearance.
4. Determine the reportable height above the surface corresponding to the elapsed ascent timein the tables found in WSOH. The accuracy of the height obtained by the balloon will bedecreased when the balloon:
(a) Does not enter a representative portion of the cloud base.
(b) Is used during the occurrence of hail, ice pellets, any intensity of freezing rain, ormoderate to heavy rain or snow.
5-20
5. When a balloon is used for determining vertical visibility in a surface-based obscuration,the value shall be the height at which the balloon completely disappears.
c. Convective Cloud Height Diagram. Use this diagram only to estimate the height of cumulusclouds formed in the vicinity of your station. It is not used at stations in mountainous or hillyterrain, or to determine the height of other than cumulus clouds. This diagram is more accuratewhen used to determine the height of cloud bases below 5,000 feet. Obtain the estimatedheight of a cloud base above the point of observation as follows:
1. Locate the point of intersection of the vertical line corresponding to the observed dew-point temperature, and the sloping line corresponding to the observed dry-bulbtemperature.
2. From the point of intersection move horizontally to the height scale printed in feet on theright side of the chart. This value is a good estimation of the height of the cloud base.
d. Pilot Report. A cloud base or ceiling height reported by a pilot (converted from height abovemean sea level to height above surface) may be used in determining cloud heights.
e. Known Heights. The known heights of unobscured portions of natural landmarks or objects(buildings, towers, etc.) in contact with the cloud base or ceiling layer may be used indetermining cloud and ceiling heights.
f. Experience. Cloud and ceiling heights may be determined on the basis of an observersobservational experience.
5.4 Maintenance of Cloud Height Equipment
Determining cloud and ceiling heights are an important part of the weather observation. The cloudheight equipment your station uses to aid you in making this determination needs to be maintained ata proper operating level. The following maintenance checks will help you to do this.
a. Ceiling Light
1. Daily Checks. At least once each day, turn on the lamp. If it is shut off by a timer,determine if it is operational. During daylight hours, the operation of the lamp can beobserved from the office if a metal reflector is placed at the top edge of the cover. Replacethe lamp if it is determined to be defective.
2. Weekly Checks. Clean the outside of the cover glass with water and detergent once eachweek or more often if the local conditions require it.
3. Monthly Checks. Clean the mirror and the inside of the cover glass using water anddetergent. Wipe both surfaces completely dry using a soft lint-free cloth. CAUTION -Theconcentrated rays of the sun can burn the skin or injure the eyes of personnel and maydamage equipment. Therefore, if direct rays of the sun reach the mirror, take precautionsto shade the projector. If the projector has drainage holes in the mirror or housing, cleanthe holes to ensure adequate drainage and ventilation. With the light turned off, inspectits condition and if the envelope has darkened appreciably, replace it.
5-21
b. Clinometer
Once each month, check the clinometer as follows:
1. Examine the scale graduation and clean the scale if necessary.
2. Test the action of the clutch and indicator for normal operation. When unlocked, theindicator should react freely to elevation angle changes of 1 or 2 degrees. If it does not,a drop of SAE 10 oil on the bearings may improve the action. When the clutch is locked,ordinary vibrations or light shocks should not disturb the indicator.
3. Examine the cross wires for proper alignment.
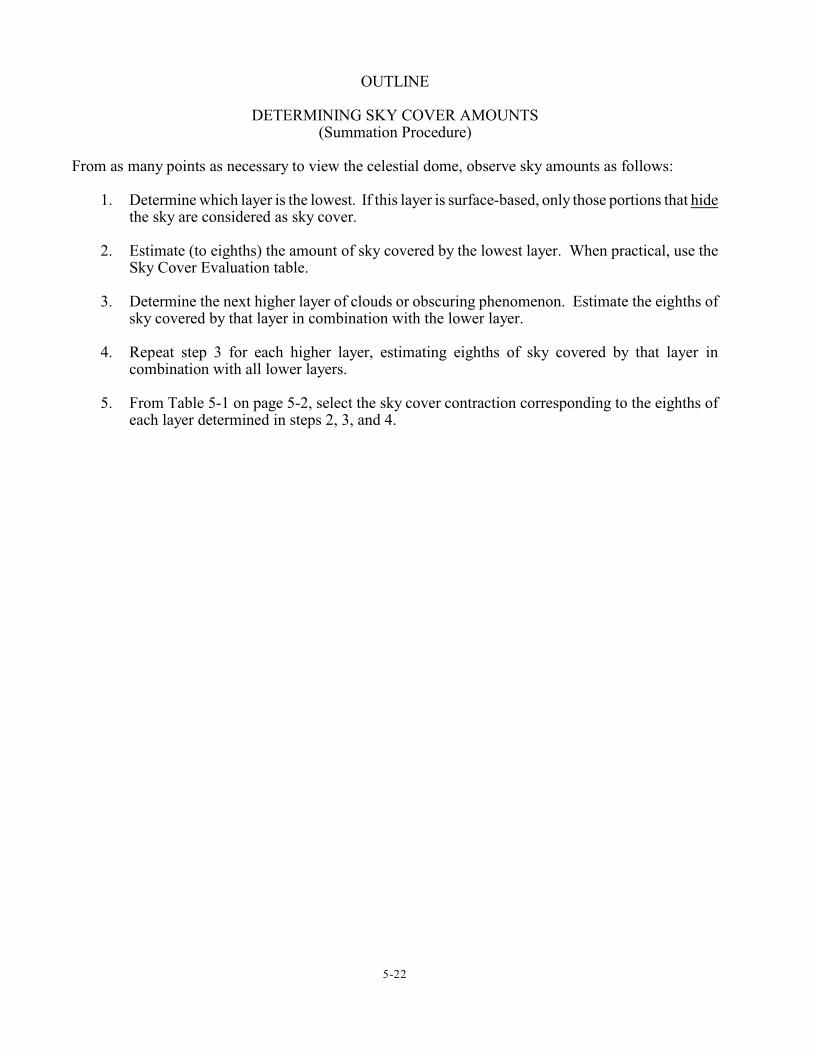
5-22
OUTLINE
DETERMINING SKY COVER AMOUNTS(Summation Procedure)
From as many points as necessary to view the celestial dome, observe sky amounts as follows:
1. Determine which layer is the lowest. If this layer is surface-based, only those portions that hidethe sky are considered as sky cover.
2. Estimate (to eighths) the amount of sky covered by the lowest layer. When practical, use theSky Cover Evaluation table.
3. Determine the next higher layer of clouds or obscuring phenomenon. Estimate the eighths ofsky covered by that layer in combination with the lower layer.
4. Repeat step 3 for each higher layer, estimating eighths of sky covered by that layer incombination with all lower layers.
5. From Table 5-1 on page 5-2, select the sky cover contraction corresponding to the eighths ofeach layer determined in steps 2, 3, and 4.

5-23
5-24
REVIEW QUESTIONS
Select the correct answer.
1. Cloud heights are reported in increments of hundreds of _________________________ .
a. feetb. metersc. oktasd. yards
2. Types of reportable layers are _________________________ .
a. X, SCT, BKN, OVCb. VV, FEW, SCT, BKN, OVCc. -X, SCT, BKN, OVCd. WW, OHD, FRQ, CON
3. At manual reporting stations, the contraction for clear skies is _______________ .
a. CLRb. No CLDSc. SKCd. VV
4. The contraction used to describe a total ground-based obscuration is _______________ .
a. Wb. VVc. Xd. SKC
Code the following sky conditions for the body of a METAR/SPECI report and include remarks. Anyremark entries should include the contraction RMK.
5. A layer of clouds covers four-eighths of the sky at an estimated nine thousand feet.
6. A layer of clouds covers two-eighths of the sky at one thousand feet and a higher layer of cloudscovers five-eighths of the sky at twenty-five thousand feet.
7. No clouds are visible.
8. A layer of clouds covers three-eighths of the sky at two thousand five hundred feet, with a toweringcumulus cloud overhead as part of this layer. A higher layer of clouds that covers five-eighths ofthe sky at twenty-five thousand feet is seen aloft.
5-25
9. Fog is obscuring five-eighths of the sky. A higher layer of clouds covers three-eighths of the skyat ten thousand feet.
10. Fog is obscuring all of the sky and you can see vertically into the fog three hundred feet.
11. A layer of smoke covers five-eighths of the sky at three thousand feet.
12. A layer of clouds covers five-eighths of the sky varying from one thousand to two thousand fivehundred feet.
13. A layer of clouds covers four-eighths to six-eighths of the sky at two thousand feet.
14. A layer of clouds covers four-eighths to six-eighths of the sky at two thousand five hundred feet.A higher layer of clouds covers the remainder of the sky at ten thousand feet.
15. The maximum number of layers coded in a manual observation is _______ .
16. All cloud layers and obscurations aloft are considered to be:
a. either opaque or transparentb. opaquec. translucentd. measurable
17. The amount of sky cover for each layer shall be observed in:
a. sectorsb. quadrantsc. tenthsd. eighths
18. A cloud layer with a base less than 50 feet is reported:
a. with a height of 0 feetb. with a height of 50 feetc. with a height of 100 feetd. as an obscuration
19. Match the reportable contraction with the summation amount for the layer.
_____ SKC a. less than 1/8 to 2/8_____ FEW b. 0_____ SCT c. 5/8 to 7/8_____ BKN d. 8/8_____ OVC e. 3/8 to 4/8
5-26
20. If a layer aloft has less than 1/8 of sky cover, the reportable contraction is:
a. SKCb. FEWc. SCTd. VV
21. An obscuration is the portion of sky that is by weather phenomena either surface-basedor aloft.
22. If all the sky is visible through a surfaced-based phenomenon covering 8/8 of the sky, the sky covercontraction used if no other layers are present is .
23. If the sky is visible everywhere through a layer of smoke aloft that covers 8/8 of the sky, the skycover of the layer is eighths and the sky cover contraction is .
24. If the sky cannot be seen because of a layer of smoke at the surface that hides 8/8 of the sky, the skycover of the layer is eighths and the sky cover contraction used is .
25. If 8/8 of the sky is covered by a layer aloft that hides 6/8 of the sky, the sky cover layer is and the sky contraction used is .
26. If 7/8 of the sky is covered by a layer aloft that hides 2/8 of the sky, the sky cover of the layer is and the sky cover contraction used is .
27. Sky cover contractions are entered in column 10 of MF1M-10C in (ascending, descending) orderof the height of the layers. (Circle one)
28. A ceiling is defined as
29. How should each of the following observed heights be recorded in column 10 of MF1M-10C?
a. 175 feet
b. 11,250 feet
c. 7,750 feet
d. 50 feet
e. 725 feet
f. 2,650 feet
30. The height of all layers, including the ceiling layer, will be recorded in column 10 of MF1M-10Cin terms of feet above .
31. An overcast layer of clouds is present over the field. A balloon is released and the observer notesthat the balloon begins to fade at 1,800 feet and completely fades from view at 2,000 feet. This skycondition would be entered in column 10 of MF1M-10C as: .
5-27
32. The sky is completely obscured (hidden) by a layer of fog at the surface. The observer releases aballoon to determine the ceiling height and notes that the balloon starts to fade almost immediatelyand completely fades from view at 650 feet. This sky condition would be entered in column 10 ofMF1M-10C as: .
33. When several layers are reported as broken, the ceiling is the layer in the report.
34. The sky cover summation amount for any given layer is the sum of the sky cover for the layer beingevaluated plus the sky cover of:
a. all upper layersb. all lower layers excluding obscurationsc. all lower layers including obscurationsd. obscurations only
35. The sky cover shall be considered variable if it:
a. varies one or more reportable valuesb. varies one reportable value onlyc. contains more than one layerd. is fragmented by strong gusty winds
36. The portion of the sky cover hidden by weather phenomena either surface-based or aloft describes:
a. vertical visibilityb. obscurationc. layer summationd. ceiling
37. Which of the following may be used to determine the height of the sky cover?(more than one answer)
a ceilometer a ceiling balloon
pilot reports observer experience
a ceiling light
38. A 1500-foot ceiling varies in height by 300 feet during the period of evaluation. Would this beconsidered a variable ceiling?
39. At mountain stations, a cloud layer located 200 feet below the station elevation would be reportedwith a height of:
a. -200b. M200c. ///d. it is not reported
5-28
40. Match the following reportable increments (in feet) with the range of height values of the sky cover:
100 ft a. >5,000 but #10,000 ft 500 ft b. #5,000 ft 1000 ft c. >10,000 ft
41. When the height of a layer falls halfway between two reportable values, the value isreported.
a. lowerb. upperc. exact
42. Which of the following is never reported as a ceiling?
a. a broken layer of cloudsb. a layer over a layer of fog that hides more than half the skyc. a layer of fog hiding 7/8 of the skyd. the vertical visibility into precipitation that hides the entire sky
43. When the ceiling height is variable, the height in column 10 (Sky Condition) is the of allobserved heights.
a. minimumb. maximumc. averaged. sum
44. A layer of smoke is observed at 900 feet obscuring less than 1/8 sky cover. What is reported incolumn 9 (Present Weather), column 10 (Sky Condition), and column 14 Remarks)?
a. col. 9: FU; col. 10: FEW000 FEW009; col. 14: FU FEW000b. col. 9: nothing; col. 10: FEW009; col. 14: FU FEW009c. col. 9: nothing; col. 10: FEW000; col. 14: FU FEW000d. col. 9: FU; col. 10: FEW009; col. 14: nothing
45. The vertical visibility into a snow shower that hides the whole sky is estimated to be 300 feet. Whatwould be the correct entry in column 10 (Sky Condition)?
a. OVC003b. VV030c. VV003d. OVC030
5-29
46. If an observing station is so located that an unobstructed view of the sky cannot be obtained becauseof manmade structures, then for purposes of determining layer amount, the whole sky will beconsidered as:
a. the whole sky including the obstructed portionb. the portion of the sky visible to the observerc. a mean area considered the percentage of sky hiddend. a mean area considered the percentage of sky visible to the observer
47. The sky is covered by a combination of 4/8 mist (obscuring), 2/8 clouds at a measured 500 feet, and2/8 clouds at an estimated 4,000 feet. The correct sky condition entries on MF1M-10C are:
a. SCT000 BKN005 OVC040 with the remark, BR SCT000b. SCT000 BKN005 OVC040 with no remarksc. SCT000 BKN005 BKN040 with the remark, BR SCT000d. SCT001 BKN005 OVC040 with the remark, BR SCT001
48. A ceiling is measured at 4,000 feet overcast, but it is variable from 3,500 to 4,500 feet. This iscoded as:
a. OVC040 and, in remarks, CIG 035V045b. OVC040c. OVC040 and, in remarks, CIG VRB 035V045d. OVC040V
49. The height of an overcast layer of stratus clouds cannot be determined with a:
a. pilot reportb. convective cloud height diagramc. ceilometerd. balloon
50. Which of the following is not considered a ceiling?
a. a broken layer of cloudsb. a layer of mist hiding 6/8 of the skyc. the vertical visibility into fog that hides the entire skyd. a layer of clouds above a layer of fog that hides more than half the sky
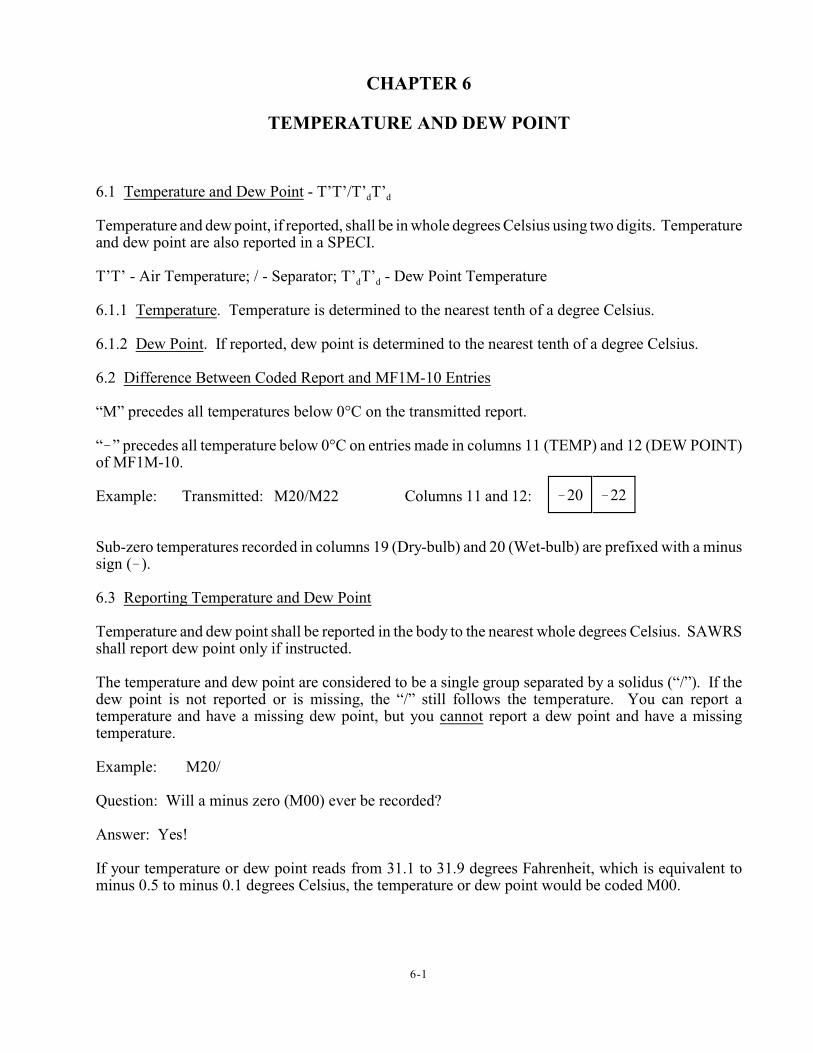
6-1
!20 !22
CHAPTER 6
TEMPERATURE AND DEW POINT
d d6.1 Temperature and Dew Point - T’T’/T’ T’
Temperature and dew point, if reported, shall be in whole degrees Celsius using two digits. Temperatureand dew point are also reported in a SPECI.
d dT’T’ - Air Temperature; / - Separator; T’ T’ - Dew Point Temperature
6.1.1 Temperature. Temperature is determined to the nearest tenth of a degree Celsius.
6.1.2 Dew Point. If reported, dew point is determined to the nearest tenth of a degree Celsius.
6.2 Difference Between Coded Report and MF1M-10 Entries
“M” precedes all temperatures below 0°C on the transmitted report.
“!” precedes all temperature below 0°C on entries made in columns 11 (TEMP) and 12 (DEW POINT)of MF1M-10.
Example: Transmitted: M20/M22 Columns 11 and 12:
Sub-zero temperatures recorded in columns 19 (Dry-bulb) and 20 (Wet-bulb) are prefixed with a minussign (!).
6.3 Reporting Temperature and Dew Point
Temperature and dew point shall be reported in the body to the nearest whole degrees Celsius. SAWRSshall report dew point only if instructed.
The temperature and dew point are considered to be a single group separated by a solidus (“/”). If thedew point is not reported or is missing, the “/” still follows the temperature. You can report atemperature and have a missing dew point, but you cannot report a dew point and have a missingtemperature.
Example: M20/
Question: Will a minus zero (M00) ever be recorded?
Answer: Yes!
If your temperature or dew point reads from 31.1 to 31.9 degrees Fahrenheit, which is equivalent tominus 0.5 to minus 0.1 degrees Celsius, the temperature or dew point would be coded M00.
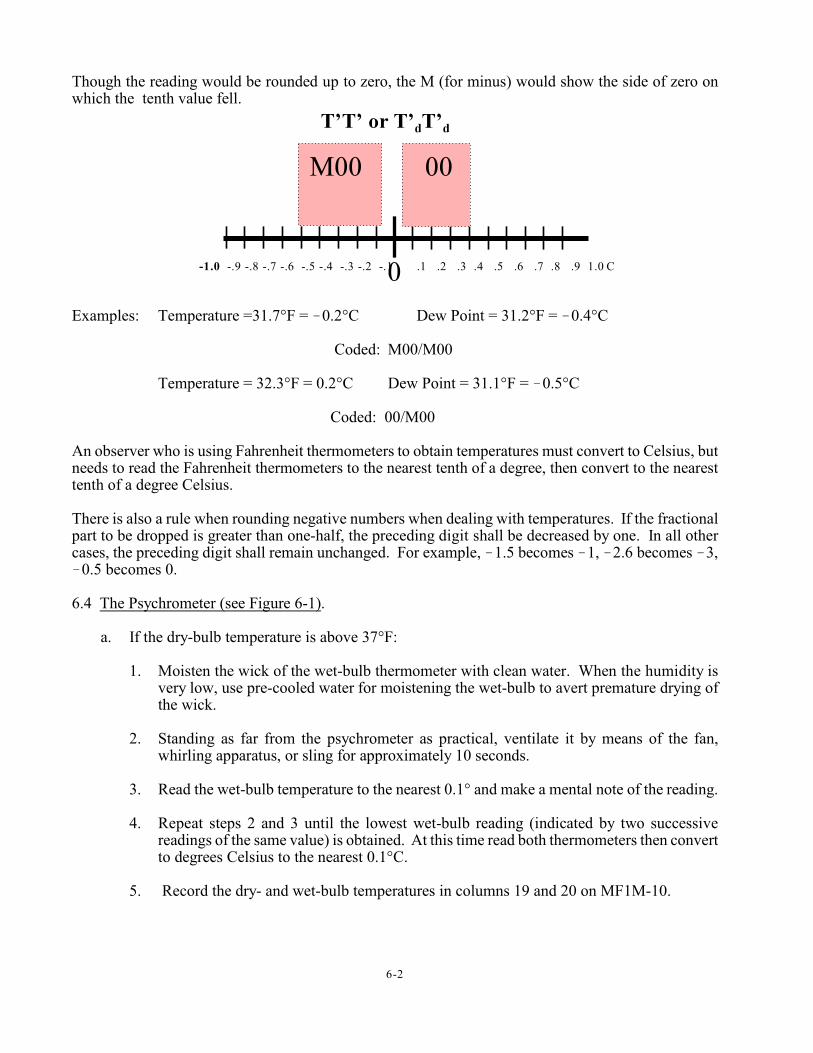
6-2
Though the reading would be rounded up to zero, the M (for minus) would show the side of zero onwhich the tenth value fell.
-1.0 -.9 -.8 -.7 -.6 -.5 -.4 -.3 -.2 -.1 .1 .2 .3 .4 .5 .6 .7 .8 .9 1.0 C
Examples: Temperature =31.7°F = !0.2°C Dew Point = 31.2°F = !0.4°C
Coded: M00/M00
Temperature = 32.3°F = 0.2°C Dew Point = 31.1°F = !0.5°C
Coded: 00/M00
An observer who is using Fahrenheit thermometers to obtain temperatures must convert to Celsius, butneeds to read the Fahrenheit thermometers to the nearest tenth of a degree, then convert to the nearesttenth of a degree Celsius.
There is also a rule when rounding negative numbers when dealing with temperatures. If the fractionalpart to be dropped is greater than one-half, the preceding digit shall be decreased by one. In all othercases, the preceding digit shall remain unchanged. For example, !1.5 becomes !1, !2.6 becomes !3,!0.5 becomes 0.
6.4 The Psychrometer (see Figure 6-1).
a. If the dry-bulb temperature is above 37°F:
1. Moisten the wick of the wet-bulb thermometer with clean water. When the humidity isvery low, use pre-cooled water for moistening the wet-bulb to avert premature drying ofthe wick.
2. Standing as far from the psychrometer as practical, ventilate it by means of the fan,whirling apparatus, or sling for approximately 10 seconds.
3. Read the wet-bulb temperature to the nearest 0.1° and make a mental note of the reading.
4. Repeat steps 2 and 3 until the lowest wet-bulb reading (indicated by two successivereadings of the same value) is obtained. At this time read both thermometers then convertto degrees Celsius to the nearest 0.1°C.
5. Record the dry- and wet-bulb temperatures in columns 19 and 20 on MF1M-10.
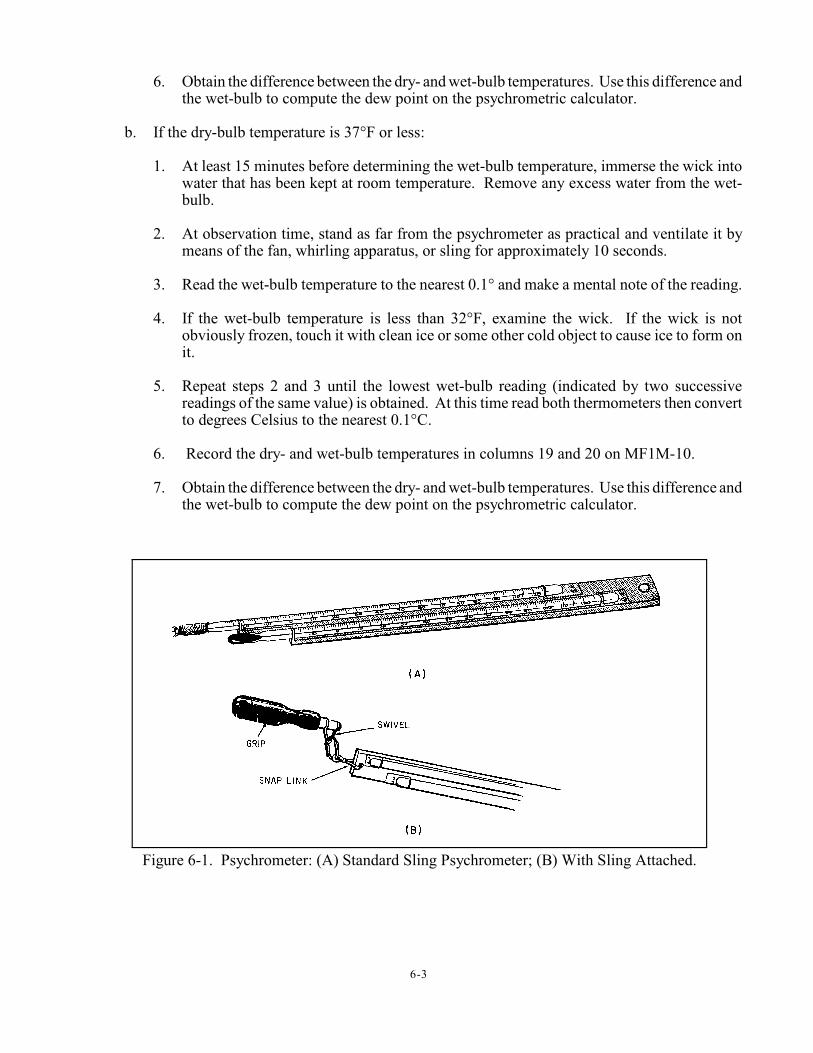
6-3
Figure 6-1. Psychrometer: (A) Standard Sling Psychrometer; (B) With Sling Attached.
6. Obtain the difference between the dry- and wet-bulb temperatures. Use this difference andthe wet-bulb to compute the dew point on the psychrometric calculator.
b. If the dry-bulb temperature is 37°F or less:
1. At least 15 minutes before determining the wet-bulb temperature, immerse the wick intowater that has been kept at room temperature. Remove any excess water from the wet-bulb.
2. At observation time, stand as far from the psychrometer as practical and ventilate it bymeans of the fan, whirling apparatus, or sling for approximately 10 seconds.
3. Read the wet-bulb temperature to the nearest 0.1° and make a mental note of the reading.
4. If the wet-bulb temperature is less than 32°F, examine the wick. If the wick is notobviously frozen, touch it with clean ice or some other cold object to cause ice to form onit.
5. Repeat steps 2 and 3 until the lowest wet-bulb reading (indicated by two successivereadings of the same value) is obtained. At this time read both thermometers then convertto degrees Celsius to the nearest 0.1°C.
6. Record the dry- and wet-bulb temperatures in columns 19 and 20 on MF1M-10.
7. Obtain the difference between the dry- and wet-bulb temperatures. Use this difference andthe wet-bulb to compute the dew point on the psychrometric calculator.
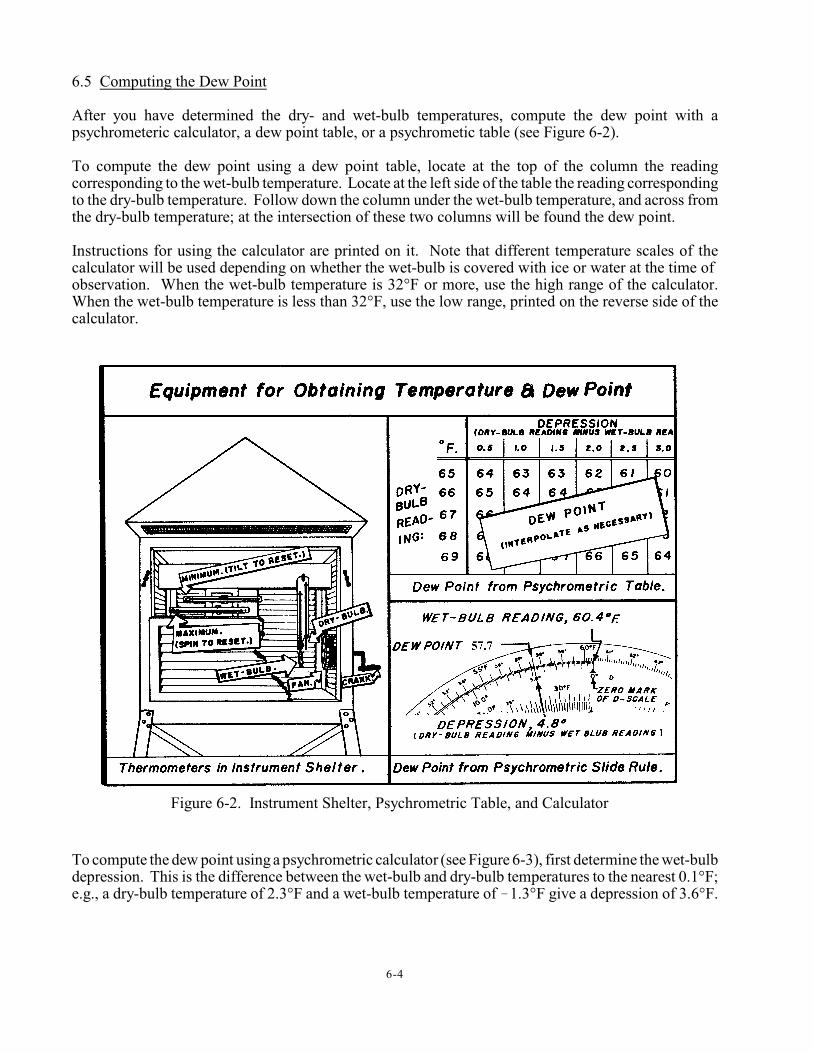
6-4
Figure 6-2. Instrument Shelter, Psychrometric Table, and Calculator
6.5 Computing the Dew Point
After you have determined the dry- and wet-bulb temperatures, compute the dew point with apsychrometeric calculator, a dew point table, or a psychrometic table (see Figure 6-2).
To compute the dew point using a dew point table, locate at the top of the column the readingcorresponding to the wet-bulb temperature. Locate at the left side of the table the reading correspondingto the dry-bulb temperature. Follow down the column under the wet-bulb temperature, and across fromthe dry-bulb temperature; at the intersection of these two columns will be found the dew point.
Instructions for using the calculator are printed on it. Note that different temperature scales of thecalculator will be used depending on whether the wet-bulb is covered with ice or water at the time of observation. When the wet-bulb temperature is 32°F or more, use the high range of the calculator.When the wet-bulb temperature is less than 32°F, use the low range, printed on the reverse side of thecalculator.
To compute the dew point using a psychrometric calculator (see Figure 6-3), first determine the wet-bulbdepression. This is the difference between the wet-bulb and dry-bulb temperatures to the nearest 0.1°F;e.g., a dry-bulb temperature of 2.3°F and a wet-bulb temperature of !1.3°F give a depression of 3.6°F.
6-5
Other examples of determining wet-bulb depression: Dry-Bulb - Wet-Bulb = Depression 75.6 58.3 17.3 38.2 37.8 0.4 4.3 !1.2 5.5 !8.7 !10.2 1.5
Use the wet-bulb temperature and the wet-bulb depression to obtain the dew point. After obtaining thedepression, ignore the dry-bulb temperature. Do not make the common mistake of using the dry-bulbtemperature in calculating the dew point.
Computing dew point using the high range scale:(Dry-Bulb = 85.7°F) - (Wet-Bulb = 70.6°F) = (Depression = 15.1°F)
1. Align the “0” index of the “D” scale with the wet-bulb reading on the “DP” scale = 70.6°F
2. Align the cursor with the wet-bulb depression using the nearest station pressure ring of the “D” scale = 15.1
3. Follow the cursor out to the “DP” scale and read the dew point temperature: P=30 = 63.2°F converted to Celsius = 17.3°C; entered in column 12 as 17.
Computing dew point using the low range scale: Frozen Wick(Dry-Bulb = 30.1°F) - (Wet-Bulb = 27.8°F) = (Depression = 2.3°F)
1. Align the “0" index of the “D” scale with the wet-bulb reading on the “Ti” scale (inner temperature ring) = 27.8°F
2. Align the cursor with the wet-bulb depression using the nearest station pressure ring of the “D” scale = 2.3
3. Follow the cursor out to the “DP” scale (outer temperature ring) and read the dew point temperature: P=30 = 22.8°F converted to Celsius = !5.1; entered in column 12 as !05.
Computing dew point using the low range scale: Unfrozen Wick(Dry-Bulb = 32.4°F) - (Wet-Bulb = 29.1°F) = (Depression = 3.3°F)
1. Align the “0" index of the “D” scale with the wet-bulb reading on the “DP” scale (outer temperature ring) = 29.1°F
2. Align the cursor with the wet-bulb depression using the nearest station pressure ring of the “D” scale = 3.3
3. Follow the cursor out to the “DP” scale (outer temperature ring) and read the dew point temperature: P=30 = 23.0°F converted to Celsius = !5.0; entered in column 12 as !05.
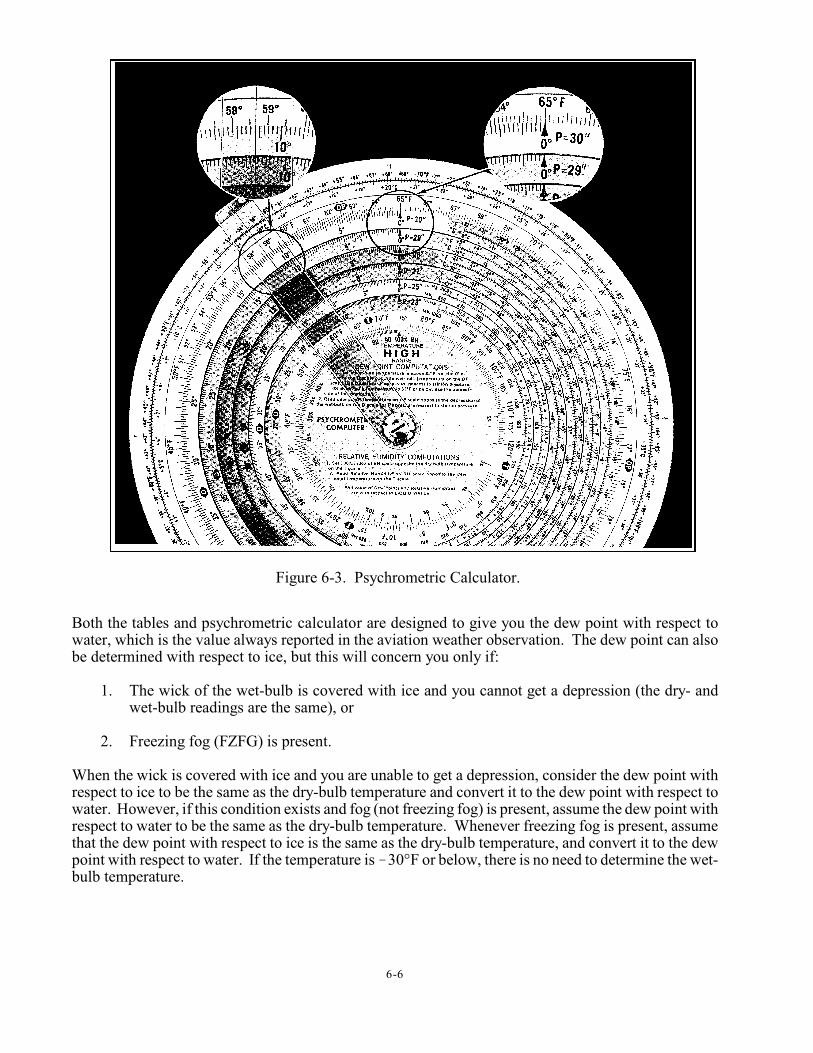
6-6
Figure 6-3. Psychrometric Calculator.
Both the tables and psychrometric calculator are designed to give you the dew point with respect towater, which is the value always reported in the aviation weather observation. The dew point can alsobe determined with respect to ice, but this will concern you only if:
1. The wick of the wet-bulb is covered with ice and you cannot get a depression (the dry- andwet-bulb readings are the same), or
2. Freezing fog (FZFG) is present.
When the wick is covered with ice and you are unable to get a depression, consider the dew point withrespect to ice to be the same as the dry-bulb temperature and convert it to the dew point with respect towater. However, if this condition exists and fog (not freezing fog) is present, assume the dew point withrespect to water to be the same as the dry-bulb temperature. Whenever freezing fog is present, assumethat the dew point with respect to ice is the same as the dry-bulb temperature, and convert it to the dewpoint with respect to water. If the temperature is !30°F or below, there is no need to determine the wet-bulb temperature.
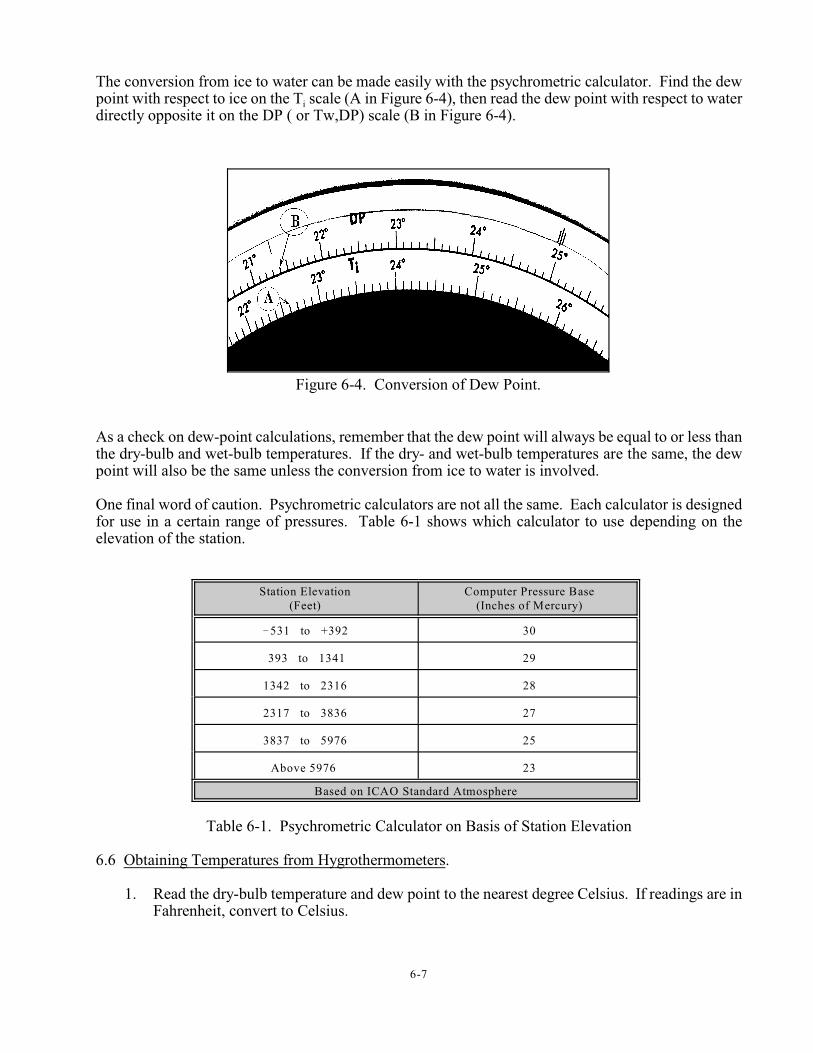
6-7
Figure 6-4. Conversion of Dew Point.
The conversion from ice to water can be made easily with the psychrometric calculator. Find the dew
ipoint with respect to ice on the T scale (A in Figure 6-4), then read the dew point with respect to waterdirectly opposite it on the DP ( or Tw,DP) scale (B in Figure 6-4).
As a check on dew-point calculations, remember that the dew point will always be equal to or less thanthe dry-bulb and wet-bulb temperatures. If the dry- and wet-bulb temperatures are the same, the dewpoint will also be the same unless the conversion from ice to water is involved.
One final word of caution. Psychrometric calculators are not all the same. Each calculator is designedfor use in a certain range of pressures. Table 6-1 shows which calculator to use depending on theelevation of the station.
Station Elevation(Feet)
Computer Pressure Base(Inches of Mercury)
!531 to +392 30
393 to 1341 29
1342 to 2316 28
2317 to 3836 27
3837 to 5976 25
Above 5976 23
Based on ICAO Standard Atmosphere
Table 6-1. Psychrometric Calculator on Basis of Station Elevation
6.6 Obtaining Temperatures from Hygrothermometers.
1. Read the dry-bulb temperature and dew point to the nearest degree Celsius. If readings are inFahrenheit, convert to Celsius.
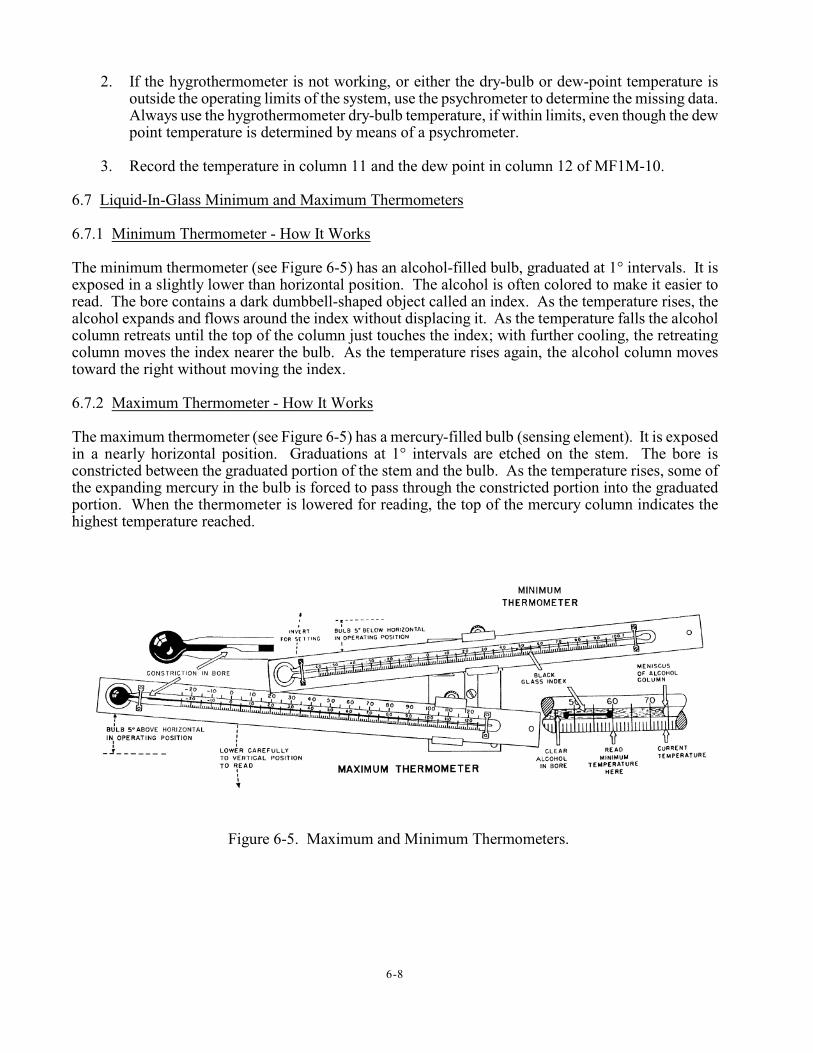
6-8
Figure 6-5. Maximum and Minimum Thermometers.
2. If the hygrothermometer is not working, or either the dry-bulb or dew-point temperature isoutside the operating limits of the system, use the psychrometer to determine the missing data.Always use the hygrothermometer dry-bulb temperature, if within limits, even though the dewpoint temperature is determined by means of a psychrometer.
3. Record the temperature in column 11 and the dew point in column 12 of MF1M-10.
6.7 Liquid-In-Glass Minimum and Maximum Thermometers
6.7.1 Minimum Thermometer - How It Works
The minimum thermometer (see Figure 6-5) has an alcohol-filled bulb, graduated at 1° intervals. It isexposed in a slightly lower than horizontal position. The alcohol is often colored to make it easier toread. The bore contains a dark dumbbell-shaped object called an index. As the temperature rises, thealcohol expands and flows around the index without displacing it. As the temperature falls the alcoholcolumn retreats until the top of the column just touches the index; with further cooling, the retreatingcolumn moves the index nearer the bulb. As the temperature rises again, the alcohol column movestoward the right without moving the index.
6.7.2 Maximum Thermometer - How It Works
The maximum thermometer (see Figure 6-5) has a mercury-filled bulb (sensing element). It is exposedin a nearly horizontal position. Graduations at 1° intervals are etched on the stem. The bore isconstricted between the graduated portion of the stem and the bulb. As the temperature rises, some ofthe expanding mercury in the bulb is forced to pass through the constricted portion into the graduatedportion. When the thermometer is lowered for reading, the top of the mercury column indicates thehighest temperature reached.
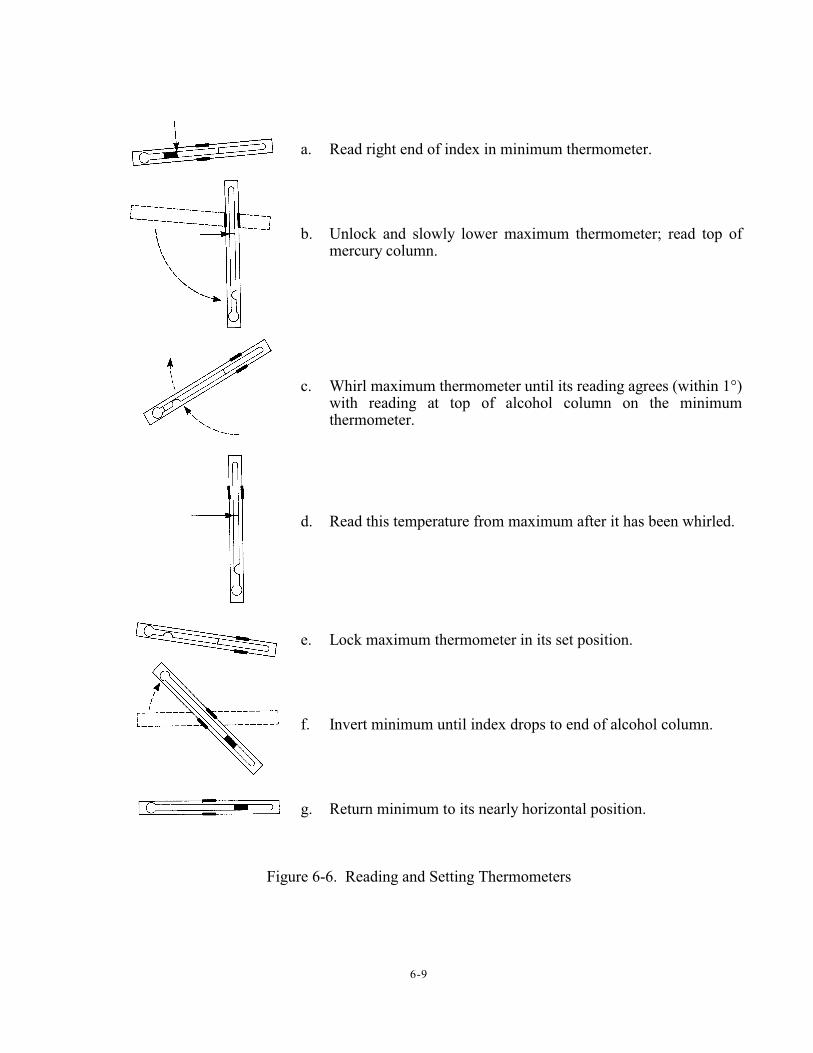
6-9
a. Read right end of index in minimum thermometer.
b. Unlock and slowly lower maximum thermometer; read top ofmercury column.
c. Whirl maximum thermometer until its reading agrees (within 1°)with reading at top of alcohol column on the minimumthermometer.
d. Read this temperature from maximum after it has been whirled.
e. Lock maximum thermometer in its set position.
f. Invert minimum until index drops to end of alcohol column.
g. Return minimum to its nearly horizontal position.
Figure 6-6. Reading and Setting Thermometers
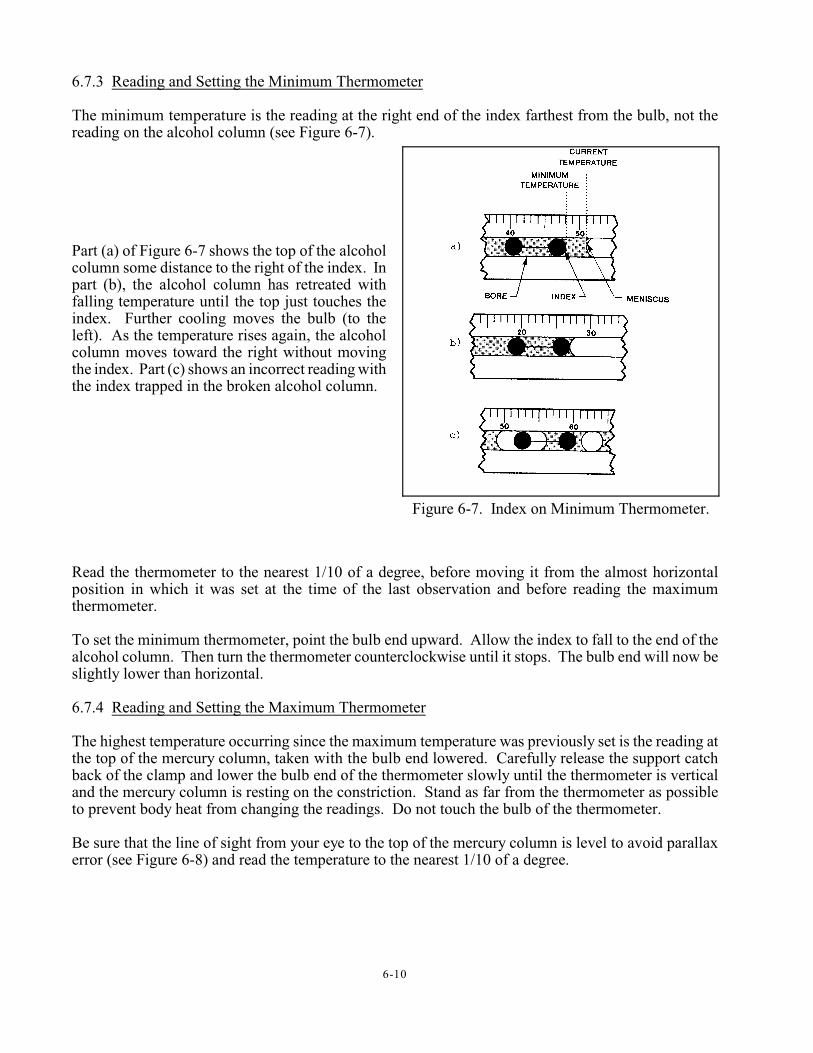
6-10
Figure 6-7. Index on Minimum Thermometer.
6.7.3 Reading and Setting the Minimum Thermometer
The minimum temperature is the reading at the right end of the index farthest from the bulb, not thereading on the alcohol column (see Figure 6-7).
Part (a) of Figure 6-7 shows the top of the alcoholcolumn some distance to the right of the index. Inpart (b), the alcohol column has retreated withfalling temperature until the top just touches theindex. Further cooling moves the bulb (to theleft). As the temperature rises again, the alcoholcolumn moves toward the right without movingthe index. Part (c) shows an incorrect reading withthe index trapped in the broken alcohol column.
Read the thermometer to the nearest 1/10 of a degree, before moving it from the almost horizontalposition in which it was set at the time of the last observation and before reading the maximumthermometer.
To set the minimum thermometer, point the bulb end upward. Allow the index to fall to the end of thealcohol column. Then turn the thermometer counterclockwise until it stops. The bulb end will now beslightly lower than horizontal.
6.7.4 Reading and Setting the Maximum Thermometer
The highest temperature occurring since the maximum temperature was previously set is the reading atthe top of the mercury column, taken with the bulb end lowered. Carefully release the support catchback of the clamp and lower the bulb end of the thermometer slowly until the thermometer is verticaland the mercury column is resting on the constriction. Stand as far from the thermometer as possibleto prevent body heat from changing the readings. Do not touch the bulb of the thermometer.
Be sure that the line of sight from your eye to the top of the mercury column is level to avoid parallaxerror (see Figure 6-8) and read the temperature to the nearest 1/10 of a degree.
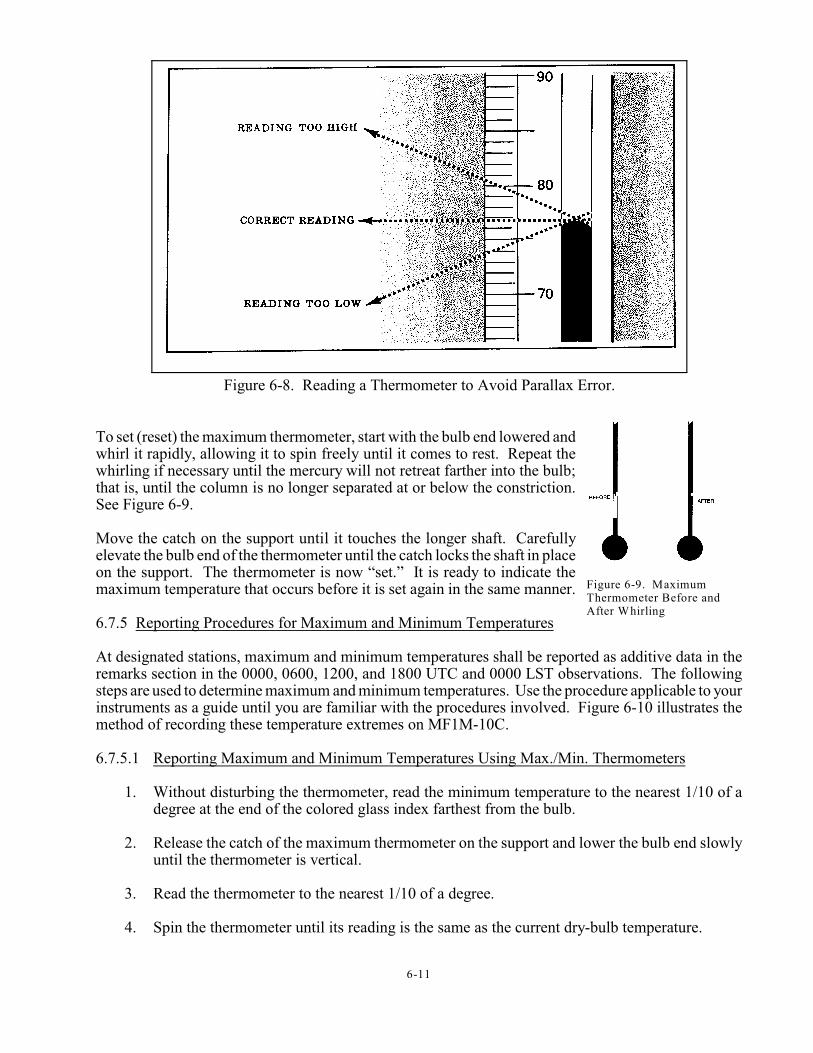
6-11
Figure 6-8. Reading a Thermometer to Avoid Parallax Error.
Figure 6-9. MaximumThermometer Before andAfter Whirling
To set (reset) the maximum thermometer, start with the bulb end lowered andwhirl it rapidly, allowing it to spin freely until it comes to rest. Repeat thewhirling if necessary until the mercury will not retreat farther into the bulb;that is, until the column is no longer separated at or below the constriction.See Figure 6-9.
Move the catch on the support until it touches the longer shaft. Carefullyelevate the bulb end of the thermometer until the catch locks the shaft in placeon the support. The thermometer is now “set.” It is ready to indicate themaximum temperature that occurs before it is set again in the same manner.
6.7.5 Reporting Procedures for Maximum and Minimum Temperatures
At designated stations, maximum and minimum temperatures shall be reported as additive data in theremarks section in the 0000, 0600, 1200, and 1800 UTC and 0000 LST observations. The followingsteps are used to determine maximum and minimum temperatures. Use the procedure applicable to yourinstruments as a guide until you are familiar with the procedures involved. Figure 6-10 illustrates themethod of recording these temperature extremes on MF1M-10C.
6.7.5.1 Reporting Maximum and Minimum Temperatures Using Max./Min. Thermometers
1. Without disturbing the thermometer, read the minimum temperature to the nearest 1/10 of adegree at the end of the colored glass index farthest from the bulb.
2. Release the catch of the maximum thermometer on the support and lower the bulb end slowlyuntil the thermometer is vertical.
3. Read the thermometer to the nearest 1/10 of a degree.
4. Spin the thermometer until its reading is the same as the current dry-bulb temperature.
6-12
5. Lock the thermometer in its support.
6. Reset the minimum thermometer by holding it in a vertical position, bulb end up, until theindex reaches the end of the column and the corrected reading is the same as the dry-bulbtemperature.
7. Reset the minimum thermometer to a horizontal position. (Note: To avoid jarring the index,always read the minimum thermometer before the maximum thermometer, and reset it afterresetting the maximum thermometer.)
8. Record the minimum temperature to the nearest 1/10 of a degree in column 32 of MF1M-10(see Figure 6-10). Note that the temperature must be as low or lower than the lowest dry-bulbtemperature recorded in the period beginning at the time of the last reading of minimumthermometer.
9. Record the maximum temperature to the nearest 1/10 of a degree in column 31 of MF1M-10(see Figure 6-10). Note that the temperature must be as high or higher than the highest dry-bulb temperature recorded in the period beginning at the time of the last reading of themaximum thermometer.
10. If either the maximum or minimum temperature is known to be in error, determine the valuefrom the thermograph trace, if available; otherwise, use the highest or lowest dry-bulbtemperature as appropriate that was recorded during the applicable period.
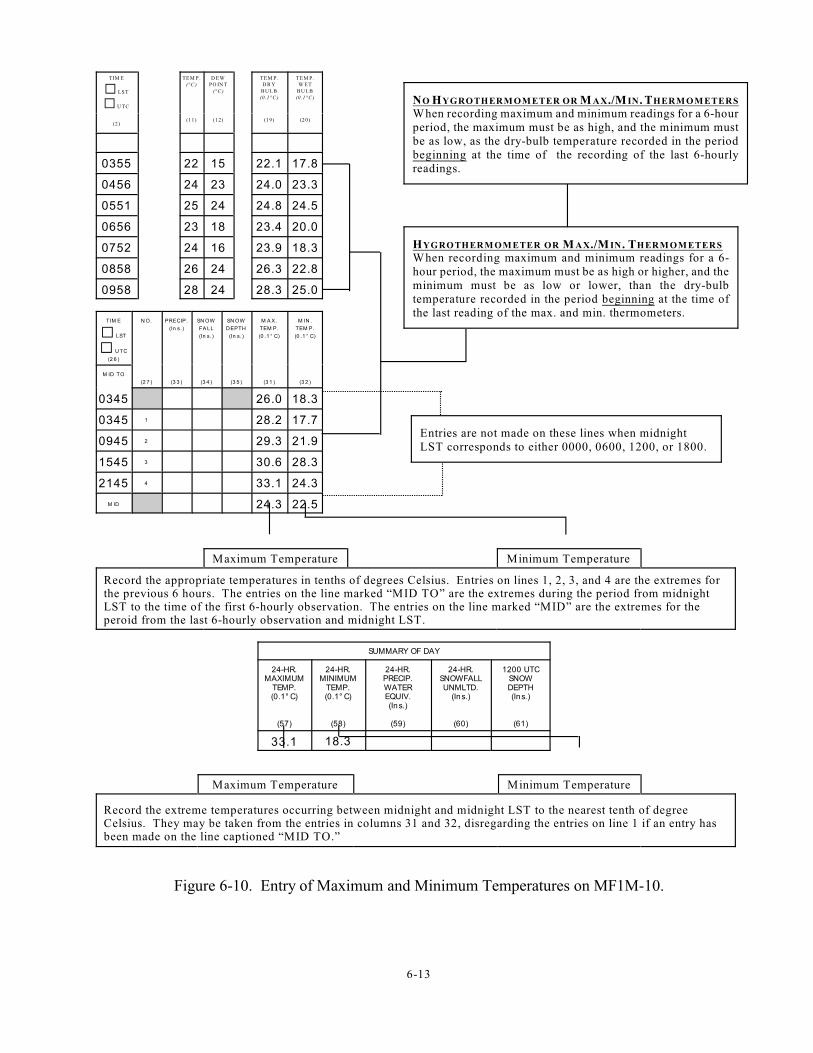
6-13
NO HYGROTHERM OM ETER OR M AX./M IN . THERM OM ETERS
When recording maximum and minimum readings for a 6-hourperiod, the maximum must be as high, and the minimum mustbe as low, as the dry-bulb temperature recorded in the periodbeginning at the time of the recording of the last 6-hourlyreadings.
HYGROTHERM OM ETER OR M AX./M IN . THERM OM ETERS
When recording maximum and minimum readings for a 6-hour period, the maximum must be as high or higher, and theminimum must be as low or lower, than the dry-bulbtemperature recorded in the period beginning at the time ofthe last reading of the max. and min. thermometers.
Entries are not made on these lines when midnightLST corresponds to either 0000, 0600, 1200, or 1800.
TIM E
G LST
G U TC
TEM P.(°C )
D EWPO IN T
(°C )
TEM P.D R Y
BU LB(0 .1°C )
TEM P.W ET
BU LB(0 .1°C )
(2 )(11) (12) (19) (20)
0355 22 15 22.1 17.8
0456 24 23 24.0 23.3
0551 25 24 24.8 24.5
0656 23 18 23.4 20.0
0752 24 16 23.9 18.3
0858 26 24 26.3 22.8
0958 28 24 28.3 25.0
TIM E
G LST
G U TC
(2 6 )
N O. PRECIP.
(In s.)
SN OW
FA LL
(In s.)
SN OW
DEPTH
(In s.)
M A X.
TEM P.
(0 .1 ° C)
M IN .
TEM P.
(0 .1 ° C)
M ID TO
(2 7 ) (3 3 ) (3 4 ) (3 5 ) (3 1 ) (3 2 )
0345 26.0 18.3
0345 1 28.2 17.7
0945 2 29.3 21.9
1545 3 30.6 28.3
2145 4 33.1 24.3
M ID 24.3 22.5
Maximum Temperature Minimum Temperature
Record the appropriate temperatures in tenths of degrees Celsius. Entries on lines 1, 2, 3, and 4 are the extremes forthe previous 6 hours. The entries on the line marked “MID TO” are the extremes during the period from midnightLST to the time of the first 6-hourly observation. The entries on the line marked “MID” are the extremes for theperoid from the last 6-hourly observation and midnight LST.
SUMMARY OF DAY
24-HR.MAXIMUM
TEMP.(0.1° C)
(57)
24-HR.MINIMUM
TEMP.(0.1° C)
(58)
24-HR.PRECIP.WATEREQUIV.(Ins.)
(59)
24-HR.SNOWFALLUNMLTD.
(Ins.)
(60)
1200 UTCSNOWDEPTH(Ins.)
(61)
33.1 18.3
Maximum Temperature Minimum Temperature
Record the extreme temperatures occurring between midnight and midnight LST to the nearest tenth of degreeCelsius. They may be taken from the entries in columns 31 and 32, disregarding the entries on line 1 if an entry hasbeen made on the line captioned “MID TO.”
Figure 6-10. Entry of Maximum and Minimum Temperatures on MF1M-10.
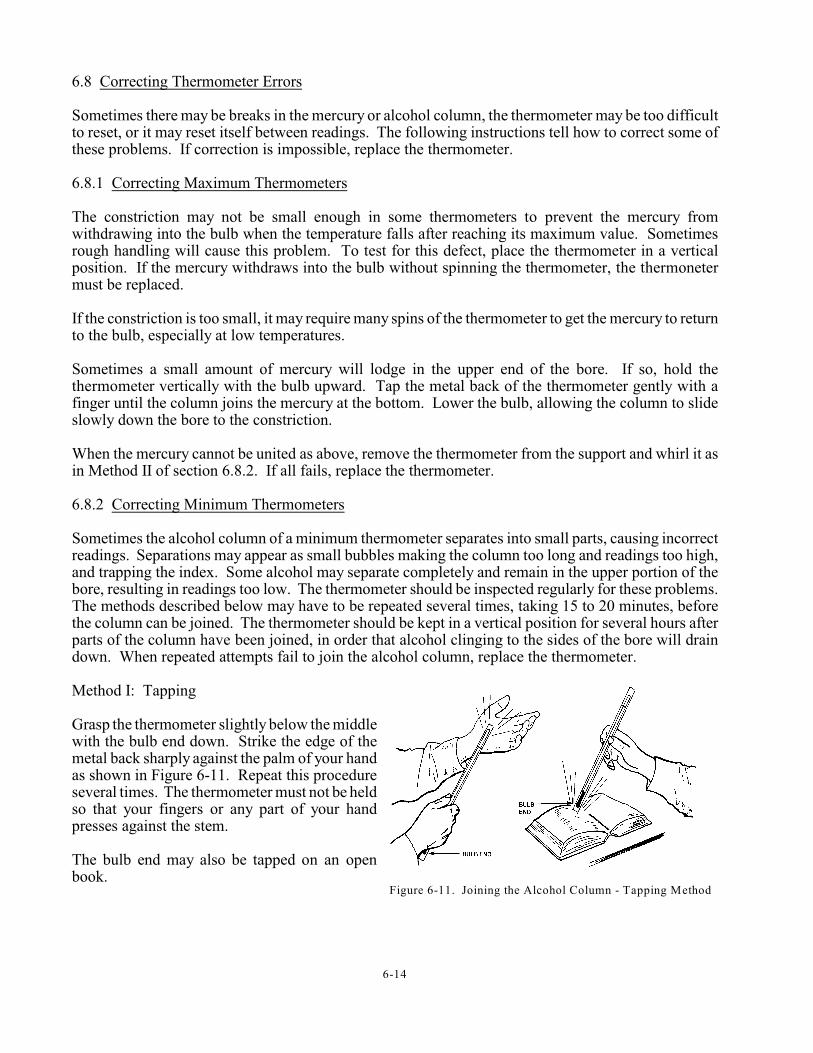
6-14
Figure 6-11. Joining the Alcohol Column - Tapping Method
6.8 Correcting Thermometer Errors
Sometimes there may be breaks in the mercury or alcohol column, the thermometer may be too difficultto reset, or it may reset itself between readings. The following instructions tell how to correct some ofthese problems. If correction is impossible, replace the thermometer.
6.8.1 Correcting Maximum Thermometers
The constriction may not be small enough in some thermometers to prevent the mercury fromwithdrawing into the bulb when the temperature falls after reaching its maximum value. Sometimesrough handling will cause this problem. To test for this defect, place the thermometer in a verticalposition. If the mercury withdraws into the bulb without spinning the thermometer, the thermonetermust be replaced.
If the constriction is too small, it may require many spins of the thermometer to get the mercury to returnto the bulb, especially at low temperatures.
Sometimes a small amount of mercury will lodge in the upper end of the bore. If so, hold thethermometer vertically with the bulb upward. Tap the metal back of the thermometer gently with afinger until the column joins the mercury at the bottom. Lower the bulb, allowing the column to slideslowly down the bore to the constriction.
When the mercury cannot be united as above, remove the thermometer from the support and whirl it asin Method II of section 6.8.2. If all fails, replace the thermometer.
6.8.2 Correcting Minimum Thermometers
Sometimes the alcohol column of a minimum thermometer separates into small parts, causing incorrectreadings. Separations may appear as small bubbles making the column too long and readings too high,and trapping the index. Some alcohol may separate completely and remain in the upper portion of thebore, resulting in readings too low. The thermometer should be inspected regularly for these problems.The methods described below may have to be repeated several times, taking 15 to 20 minutes, beforethe column can be joined. The thermometer should be kept in a vertical position for several hours afterparts of the column have been joined, in order that alcohol clinging to the sides of the bore will draindown. When repeated attempts fail to join the alcohol column, replace the thermometer.
Method I: Tapping
Grasp the thermometer slightly below the middlewith the bulb end down. Strike the edge of themetal back sharply against the palm of your handas shown in Figure 6-11. Repeat this procedureseveral times. The thermometer must not be heldso that your fingers or any part of your handpresses against the stem.
The bulb end may also be tapped on an openbook.
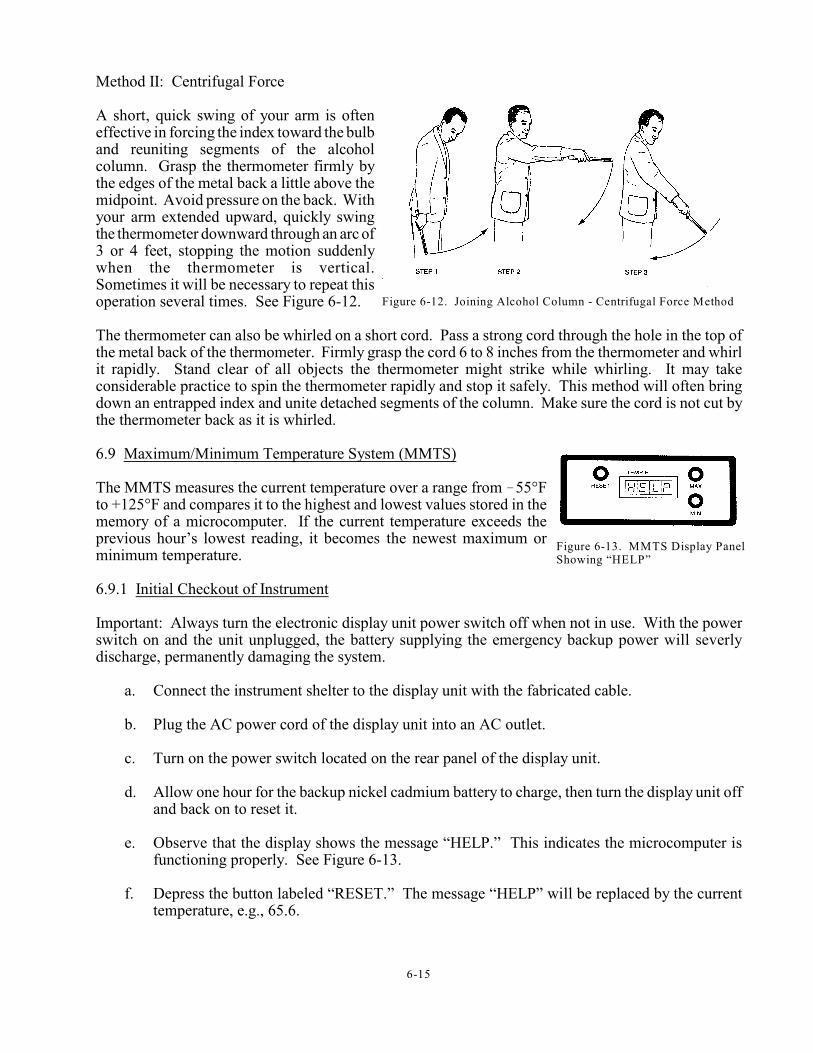
6-15
Figure 6-12. Joining Alcohol Column - Centrifugal Force Method
Figure 6-13. MMTS Display PanelShowing “HELP”
Method II: Centrifugal Force
A short, quick swing of your arm is ofteneffective in forcing the index toward the bulband reuniting segments of the alcoholcolumn. Grasp the thermometer firmly bythe edges of the metal back a little above themidpoint. Avoid pressure on the back. Withyour arm extended upward, quickly swingthe thermometer downward through an arc of3 or 4 feet, stopping the motion suddenlywhen the thermometer is vertical.Sometimes it will be necessary to repeat thisoperation several times. See Figure 6-12.
The thermometer can also be whirled on a short cord. Pass a strong cord through the hole in the top ofthe metal back of the thermometer. Firmly grasp the cord 6 to 8 inches from the thermometer and whirlit rapidly. Stand clear of all objects the thermometer might strike while whirling. It may takeconsiderable practice to spin the thermometer rapidly and stop it safely. This method will often bringdown an entrapped index and unite detached segments of the column. Make sure the cord is not cut bythe thermometer back as it is whirled.
6.9 Maximum/Minimum Temperature System (MMTS)
The MMTS measures the current temperature over a range from !55°Fto +125°F and compares it to the highest and lowest values stored in thememory of a microcomputer. If the current temperature exceeds theprevious hour’s lowest reading, it becomes the newest maximum orminimum temperature.
6.9.1 Initial Checkout of Instrument
Important: Always turn the electronic display unit power switch off when not in use. With the powerswitch on and the unit unplugged, the battery supplying the emergency backup power will severlydischarge, permanently damaging the system.
a. Connect the instrument shelter to the display unit with the fabricated cable.
b. Plug the AC power cord of the display unit into an AC outlet.
c. Turn on the power switch located on the rear panel of the display unit.
d. Allow one hour for the backup nickel cadmium battery to charge, then turn the display unit offand back on to reset it.
e. Observe that the display shows the message “HELP.” This indicates the microcomputer isfunctioning properly. See Figure 6-13.
f. Depress the button labeled “RESET.” The message “HELP” will be replaced by the currenttemperature, e.g., 65.6.
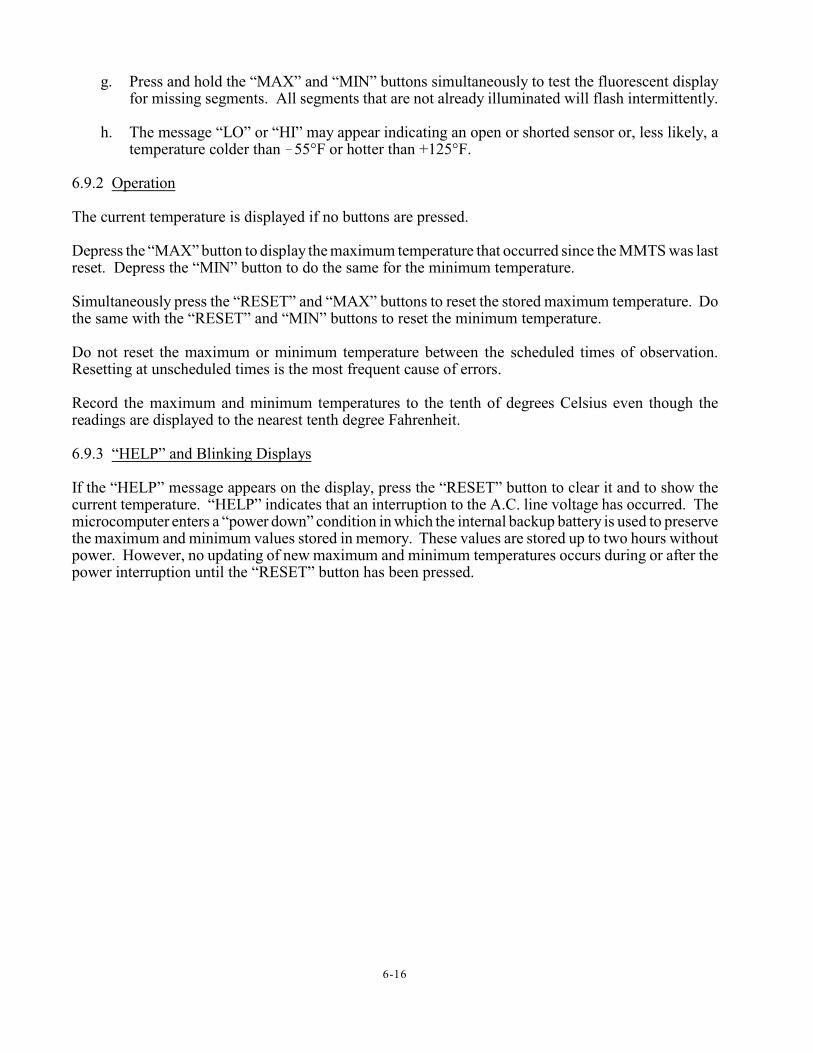
6-16
g. Press and hold the “MAX” and “MIN” buttons simultaneously to test the fluorescent displayfor missing segments. All segments that are not already illuminated will flash intermittently.
h. The message “LO” or “HI” may appear indicating an open or shorted sensor or, less likely, atemperature colder than !55°F or hotter than +125°F.
6.9.2 Operation
The current temperature is displayed if no buttons are pressed.
Depress the “MAX” button to display the maximum temperature that occurred since the MMTS was lastreset. Depress the “MIN” button to do the same for the minimum temperature.
Simultaneously press the “RESET” and “MAX” buttons to reset the stored maximum temperature. Dothe same with the “RESET” and “MIN” buttons to reset the minimum temperature.
Do not reset the maximum or minimum temperature between the scheduled times of observation.Resetting at unscheduled times is the most frequent cause of errors.
Record the maximum and minimum temperatures to the tenth of degrees Celsius even though thereadings are displayed to the nearest tenth degree Fahrenheit.
6.9.3 “HELP” and Blinking Displays
If the “HELP” message appears on the display, press the “RESET” button to clear it and to show thecurrent temperature. “HELP” indicates that an interruption to the A.C. line voltage has occurred. Themicrocomputer enters a “power down” condition in which the internal backup battery is used to preservethe maximum and minimum values stored in memory. These values are stored up to two hours withoutpower. However, no updating of new maximum and minimum temperatures occurs during or after thepower interruption until the “RESET” button has been pressed.
6-17
REVIEW QUESTIONS
INSTRUCTIONS: Select the best answer.
1. In a METAR report, the temperature/dew point group follows the __________ group.
a. windb. temperaturec. sky condition d. pressure
2. Which character is used to separate the temperature and dew point?
a. one spaceb. /c. \d. &
3. If the temperature is missing, the group is _______________ .
a. omittedb. replaced with “M”c. replaced with “MISSING”d. replaced with “?”
4. Temperature is determined to the nearest _____________________________ .
a. whole degree Fahrenheitb. whole degree Celsiusc. tenth of a degree Celsiusd. tenth of a degree Fahrenheit
5. If required, dew point is determined to the nearest _________________________ .
a. whole degree Fahrenheitb. whole degree Celsiusc. tenth of a degree Celsiusd. tenth of a degree Fahrenheit
6. Temperature and dew point are reported in the body of the METAR/SPECI report in ______ .
a. whole degrees Fahrenheitb. whole degrees Celsiusc. tenths of a degree Celsiusd. whole degrees Kelvin
6-18
7. If using Fahrenheit thermometers to obtain temperatures, you must read the thermometers to thenearest ____________.
a. tenth of a degree Fahrenheitb. whole degree Fahrenheitc. whole degree Celsiusd. tenth of a degree Celsius
INSTRUCTIONS: Use your station’s psychrometric calculator to compute the dew point temperature,then use the temperature conversion chart located on the next page to convert the dry bulb and dew pointtemperatures to their Celsius equivalent; finally, code the temperature and dew point as they would betransmitted in a METAR/SPECI report. (The answers were computed using a calculator with a pressurebase of 30 inches of mercury. If you use a calculator with a different pressure base, your answers willdiffer slightly.)
8. Dry Bulb 43.5°F Wet Bulb 38.6°F Depression Dew Point °F
Converstion: TEMP °C DEW POINT °C Coded report:
9. Unfrozen Wick:
Dry Bulb 32.1°F Wet Bulb 31.4°F Depression Dew Point °F
Converstion: TEMP °C DEW POINT °C Coded report:
10. Frozen Wick:
Dry Bulb 30.2°F Wet Bulb 24.9°F Depression Dew Point °F
Converstion: TEMP °C DEW POINT °C Coded report:
INSTRUCTIONS: Use the Dew Point Table provided in Appendix B to compute the dew pointtemperature, then use the temperature conversion chart located at the end of the chapter to convert thedry bulb and dew point temperatures to their Celsius equivalent; finally, code the temperature and dewpoint as they would be transmitted in a METAR/SPECI report.
11. Dry Bulb 94.3°F Wet Bulb 71.7°F Dew Point °F
Conversion: TEMP °C DEW POINT °C Coded report:
12. Dry Bulb 43.8°F Wet Bulb Missing Dew Point °F
Converstion: TEMP °C DEW POINT °C Coded report:
13. Dry Bulb 31.9°F Wet Bulb 30.7°F Dew Point °F
Converstion TEMP °C DEW POINT °C Coded report:
14. Dry Bulb and Wet Bulb temperatures are missing. ____________________
15. When ventilating a psychrometer, when is the dry-bulb thermometer read? Are there any exceptionsto this rule?
6-19
16. Under what conditions is the dew point reported with respect to ice?
17. Under what conditions is it unnecessary to determine the wet-bulb temperature in order to get thedew point?
18. Wet- and dry-bulb thermometers are read to the nearest degrees.
19. When determining the wet- and dry-bulb temperatures, which temperatures is determined first?
20. How should the 24-hour maximum and minimum temperatures be recorded in columns 57 and 58,respectively?
a. whole degrees Celsiusb. whole degrees Fahrenheitc. tenth of degrees Celsiusd. tenth of degrees Fahrenheit
6-20
FAHRENHEIT TO CELSIUS
°F .0°C
.1°C
.2°C
.3°C
.4°C
.5°C
.6°C
.7°C
.8°C
.9°C
°F .0°C
.1°C
.2°C
.3°C
.4°C
.5°C
.6°C
.7°C
.8°C
.9°C
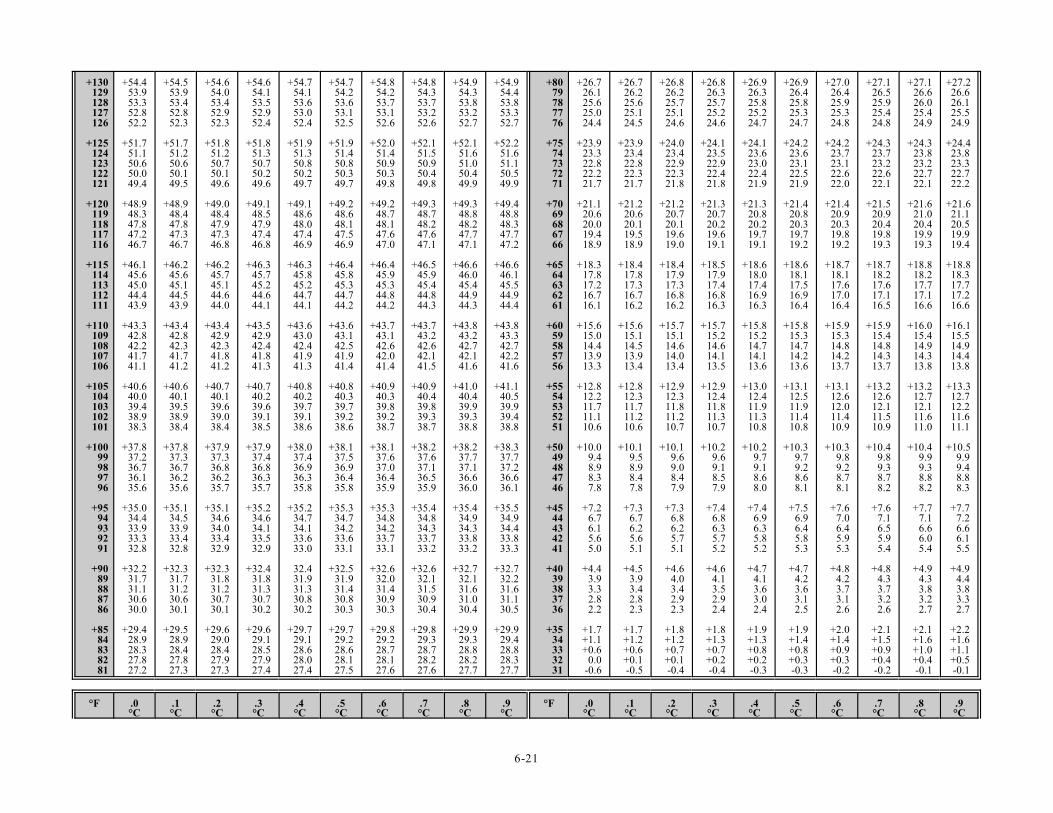
6-21
+130129128127126
+125124123122121
+120119118117116
+115114113112111
+110109108107106
+105104103102101
+10099989796
+9594939291
+9089888786
+8584838281
+54.453.953.352.852.2
+51.751.150.650.049.4
+48.948.347.847.246.7
+46.145.645.044.443.9
+43.342.842.241.741.1
+40.640.039.438.938.3
+37.837.236.736.135.6
+35.034.433.933.332.8
+32.231.731.130.630.0
+29.428.928.327.827.2
+54.553.953.452.852.3
+51.751.250.650.149.5
+48.948.447.847.346.7
+46.245.645.144.543.9
+43.442.842.341.741.2
+40.640.139.538.938.4
+37.837.336.736.235.6
+35.134.533.933.432.8
+32.331.731.230.630.1
+29.528.928.427.827.3
+54.654.053.452.952.3
+51.851.250.750.149.6
+49.048.447.947.346.8
+46.245.745.144.644.0
+43.442.942.341.841.2
+40.740.139.639.038.4
+37.937.336.836.235.7
+35.134.634.033.432.9
+32.331.831.230.730.1
+29.629.028.427.927.3
+54.654.153.552.952.4
+51.851.350.750.249.6
+49.148.547.947.446.8
+46.345.745.244.644.1
+43.542.942.441.841.3
+40.740.239.639.138.5
+37.937.436.836.335.7
+35.234.634.133.532.9
+32.431.831.330.730.2
+29.629.128.527.927.4
+54.754.153.653.052.4
+51.951.350.850.249.7
+49.148.648.047.446.9
+46.345.845.244.744.1
+43.643.042.441.941.3
+40.840.239.739.138.6
+38.037.436.936.335.8
+35.234.734.133.633.0
32.431.931.330.830.2
+29.729.128.628.027.4
+54.754.253.653.152.5
+51.951.450.850.349.7
+49.248.648.147.546.9
+46.445.845.344.744.2
+43.643.142.541.941.4
+40.840.339.739.238.6
+38.137.536.936.435.8
+35.334.734.233.633.1
+32.531.931.430.830.3
+29.729.228.628.127.5
+54.854.253.753.152.6
+52.051.450.950.349.8
+49.248.748.147.647.0
+46.445.945.344.844.2
+43.743.142.642.041.4
+40.940.339.839.238.7
+38.137.637.036.435.9
+35.334.834.233.733.1
+32.632.031.430.930.3
+29.829.228.728.127.6
+54.854.353.753.252.6
+52.151.550.950.449.8
+49.348.748.247.647.1
+46.545.945.444.844.3
+43.743.242.642.141.5
+40.940.439.839.338.7
+38.237.637.136.535.9
+35.434.834.333.733.2
+32.632.131.530.930.4
+29.829.328.728.227.6
+54.954.353.853.252.7
+52.151.651.050.449.9
+49.348.848.247.747.1
+46.646.045.444.944.3
+43.843.242.742.141.6
+41.040.439.939.338.8
+38.237.737.136.636.0
+35.434.934.333.833.2
+32.732.131.631.030.4
+29.929.328.828.227.7
+54.954.453.853.352.7
+52.251.651.150.549.9
+49.448.848.347.747.2
+46.646.145.544.944.4
+43.843.342.742.241.6
+41.140.539.939.438.8
+38.337.737.236.636.1
+35.534.934.433.833.3
+32.732.231.631.130.5
+29.929.428.828.327.7
+8079787776
+7574737271
+7069686766
+6564636261
+6059585756
+5554535251
+5049484746
+4544434241
+4039383736
+3534333231
+26.726.125.625.024.4
+23.923.322.822.221.7
+21.120.620.019.418.9
+18.317.817.216.716.1
+15.615.014.413.913.3
+12.812.211.711.110.6
+10.09.48.98.37.8
+7.26.76.15.65.0
+4.43.93.32.82.2
+1.7+1.1+0.6
0.0-0.6
+26.726.225.625.124.5
+23.923.422.822.321.7
+21.220.620.119.518.9
+18.417.817.316.716.2
+15.615.114.513.913.4
+12.812.311.711.210.6
+10.19.58.98.47.8
+7.36.76.25.65.1
+4.53.93.42.82.3
+1.7+1.2+0.6+0.1-0.5
+26.826.225.725.124.6
+24.023.422.922.321.8
+21.220.720.119.619.0
+18.417.917.316.816.2
+15.715.114.614.013.4
+12.912.311.811.210.7
+10.19.69.08.47.9
+7.36.86.25.75.1
+4.64.03.42.92.3
+1.8+1.2+0.7+0.1-0.4
+26.826.325.725.224.6
+24.123.522.922.421.8
+21.320.720.219.619.1
+18.517.917.416.816.3
+15.715.214.614.113.5
+12.912.411.811.310.7
+10.29.69.18.57.9
+7.46.86.35.75.2
+4.64.13.52.92.4
+1.8+1.3+0.7+0.2-0.4
+26.926.325.825.224.7
+24.123.623.022.421.9
+21.320.820.219.719.1
+18.618.017.416.916.3
+15.815.214.714.113.6
+13.012.411.911.310.8
+10.29.79.18.68.0
+7.46.96.35.85.2
+4.74.13.63.02.4
+1.9+1.3+0.8+0.2-0.3
+26.926.425.825.324.7
+24.223.623.122.521.9
+21.420.820.319.719.2
+18.618.117.516.916.4
+15.815.314.714.213.6
+13.112.511.911.410.8
+10.39.79.28.68.1
+7.56.96.45.85.3
+4.74.23.63.12.5
+1.9+1.4+0.8+0.3-0.3
+27.026.425.925.324.8
+24.223.723.122.622.0
+21.420.920.319.819.2
+18.718.117.617.016.4
+15.915.314.814.213.7
+13.112.612.011.410.9
+10.39.89.28.78.1
+7.67.06.45.95.3
+4.84.23.73.12.6
+2.0+1.4+0.9+0.3-0.2
+27.126.525.925.424.8
+24.323.723.222.622.1
+21.520.920.419.819.3
+18.718.217.617.116.5
+15.915.414.814.313.7
+13.212.612.111.510.9
+10.49.89.38.78.2
+7.67.16.55.95.4
+4.84.33.73.22.6
+2.1+1.5+0.9+0.4-0.2
+27.126.626.025.424.9
+24.323.823.222.722.1
+21.621.020.419.919.3
+18.818.217.717.116.6
+16.015.414.914.313.8
+13.212.712.111.611.0
+10.49.99.38.88.2
+7.77.16.66.05.4
+4.94.33.83.22.7
+2.1+1.6+1.0+0.4-0.1
+27.226.626.125.524.9
+24.423.823.322.722.2
+21.621.120.519.919.4
+18.818.317.717.216.6
+16.115.514.914.413.8
+13.312.712.211.611.1
+10.59.99.48.88.3
+7.77.26.66.15.5
+4.94.43.83.32.7
+2.2+1.6+1.1+0.5-0.1
°F .0°C
.1°C
.2°C
.3°C
.4°C
.5°C
.6°C
.7°C
.8°C
.9°C
°F .0°C
.1°C
.2°C
.3°C
.4°C
.5°C
.6°C
.7°C
.8°C
.9°C
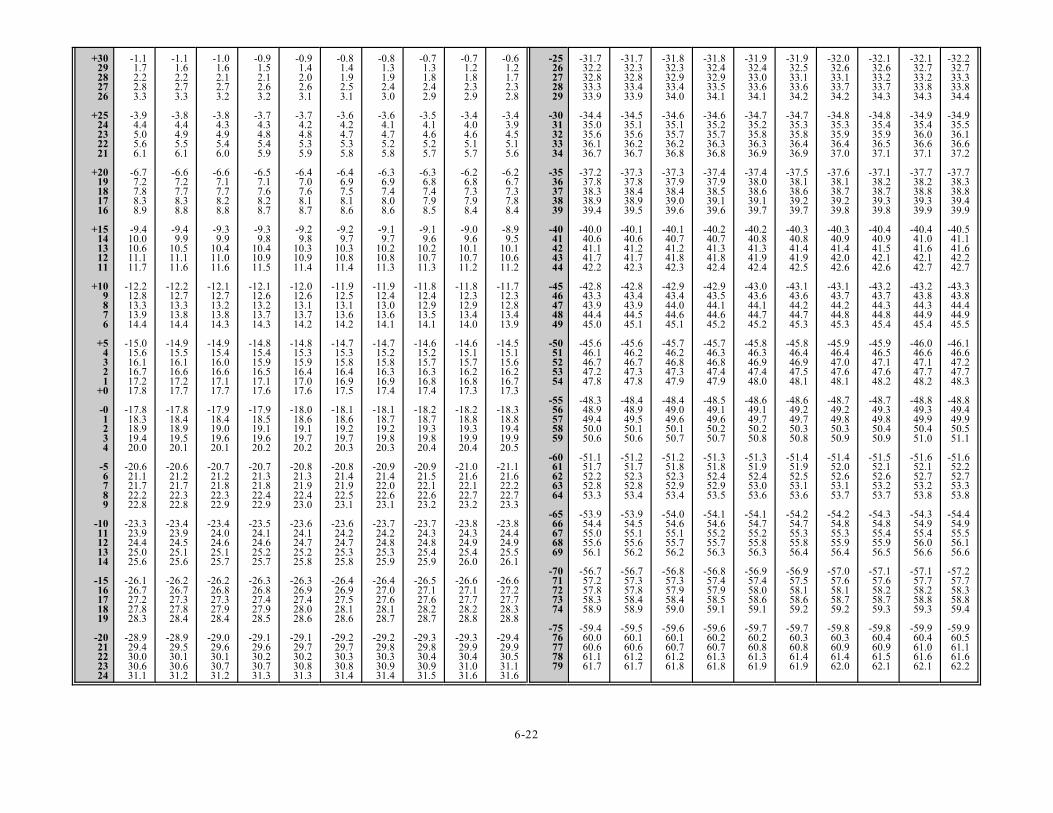
6-22
+3029282726
+2524232221
+2019181716
+1514131211
+109876
+54321
+0
-01234
-56789
-1011121314
-1516171819
-2021222324
-1.11.72.22.83.3
-3.94.45.05.66.1
-6.77.27.88.38.9
-9.410.010.611.111.7
-12.212.813.313.914.4
-15.015.616.116.717.217.8
-17.818.318.919.420.0
-20.621.121.722.222.8
-23.323.924.425.025.6
-26.126.727.227.828.3
-28.929.430.030.631.1
-1.11.62.22.73.3
-3.84.44.95.56.1
-6.67.27.78.38.8
-9.49.9
10.511.111.6
-12.212.713.313.814.4
-14.915.516.116.617.217.7
-17.818.418.919.520.1
-20.621.221.722.322.8
-23.423.924.525.125.6
-26.226.727.327.828.4
-28.929.530.130.631.2
-1.01.62.12.73.2
-3.84.34.95.46.0
-6.67.17.78.28.8
-9.39.9
10.411.011.6
-12.112.713.213.814.3
-14.915.416.016.617.117.7
-17.918.419.019.620.1
-20.721.221.822.322.9
-23.424.024.625.125.7
-26.226.827.327.928.4
-29.029.630.130.731.2
-0.91.52.12.63.2
-3.74.34.85.45.9
-6.57.17.68.28.7
-9.39.8
10.410.911.5
-12.112.613.213.714.3
-14.815.415.916.517.117.6
-17.918.519.119.620.2
-20.721.321.822.422.9
-23.524.124.625.225.7
-26.326.827.427.928.5
-29.129.630.230.731.3
-0.91.42.02.63.1
-3.74.24.85.35.9
-6.47.07.68.18.7
-9.29.8
10.310.911.4
-12.012.613.113.714.2
-14.815.315.916.417.017.6
-18.018.619.119.720.2
-20.821.321.922.423.0
-23.624.124.725.225.8
-26.326.927.428.028.6
-29.129.730.230.831.3
-0.81.41.92.53.1
-3.64.24.75.35.8
-6.46.97.58.18.6
-9.29.7
10.310.811.4
-11.912.513.113.614.2
-14.715.315.816.416.917.5
-18.118.619.219.720.3
-20.821.421.922.523.1
-23.624.224.725.325.8
-26.426.927.528.128.6
-29.229.730.330.831.4
-0.81.31.92.43.0
-3.64.14.75.25.8
-6.36.97.48.08.6
-9.19.7
10.210.811.3
-11.912.413.013.614.1
-14.715.215.816.316.917.4
-18.118.719.219.820.3
-20.921.422.022.623.1
-23.724.224.825.325.9
-26.427.027.628.128.7
-29.229.830.330.931.4
-0.71.31.82.42.9
-3.54.14.65.25.7
-6.36.87.47.98.5
-9.19.6
10.210.711.3
-11.812.412.913.514.1
-14.615.215.716.316.817.4
-18.218.719.319.820.4
-20.921.522.122.623.2
-23.724.324.825.425.9
-26.527.127.628.228.7
-29.329.830.430.931.5
-0.71.21.82.32.9
-3.44.04.65.15.7
-6.26.87.37.98.4
-9.09.6
10.110.711.2
-11.812.312.913.414.0
-14.615.115.716.216.817.3
-18.218.819.319.920.4
-21.021.622.122.723.2
-23.824.324.925.426.0
-26.627.127.728.228.8
-29.329.930.431.031.6
-0.61.21.72.32.8
-3.43.94.55.15.6
-6.26.77.37.88.4
-8.99.5
10.110.611.2
-11.712.312.813.413.9
-14.515.115.616.216.717.3
-18.318.819.419.920.5
-21.121.622.222.723.3
-23.824.424.925.526.1
-26.627.227.728.328.8
-29.429.930.531.131.6
-2526272829
-3031323334
-3536373839
-4041424344
-4546474849
-5051525354
-5556575859
-6061626364
-6566676869
-7071727374
-7576777879
-31.732.232.833.333.9
-34.435.035.636.136.7
-37.237.838.338.939.4
-40.040.641.141.742.2
-42.843.343.944.445.0
-45.646.146.747.247.8
-48.348.949.450.050.6
-51.151.752.252.853.3
-53.954.455.055.656.1
-56.757.257.858.358.9
-59.460.060.661.161.7
-31.732.332.833.433.9
-34.535.135.636.236.7
-37.337.838.438.939.5
-40.140.641.241.742.3
-42.843.443.944.545.1
-45.646.246.747.347.8
-48.448.949.550.150.6
-51.251.752.352.853.4
-53.954.555.155.656.2
-56.757.357.858.458.9
-59.560.160.661.261.7
-31.832.332.933.434.0
-34.635.135.736.236.8
-37.337.938.439.039.6
-40.140.741.241.842.3
-42.943.444.044.645.1
-45.746.246.847.347.9
-48.449.049.650.150.7
-51.251.852.352.953.4
-54.054.655.155.756.2
-56.857.357.958.459.0
-59.660.160.761.261.8
-31.832.432.933.534.1
-34.635.235.736.336.8
-37.437.938.539.139.6
-40.240.741.341.842.4
-42.943.544.144.645.2
-45.746.346.847.447.9
-48.549.149.650.250.7
-51.351.852.452.953.5
-54.154.655.255.756.3
-56.857.457.958.559.1
-59.660.260.761.361.8
-31.932.433.033.634.1
-34.735.235.836.336.9
-37.438.038.639.139.7
-40.240.841.341.942.4
-43.043.644.144.745.2
-45.846.346.947.448.0
-48.649.149.750.250.8
-51.351.952.453.053.6
-54.154.755.255.856.3
-56.957.458.058.659.1
-59.760.260.861.361.9
-31.932.533.133.634.2
-34.735.335.836.436.9
-37.538.138.639.239.7
-40.340.841.441.942.5
-43.143.644.244.745.3
-45.846.446.947.548.1
-48.649.249.750.350.8
-51.451.952.553.153.6
-54.254.755.355.856.4
-56.957.558.158.659.2
-59.760.360.861.461.9
-32.032.633.133.734.2
-34.835.335.936.437.0
-37.638.138.739.239.8
-40.340.941.442.042.6
-43.143.744.244.845.3
-45.946.447.047.648.1
-48.749.249.850.350.9
-51.452.052.653.153.7
-54.254.855.355.956.4
-57.057.658.158.759.2
-59.860.360.961.462.0
-32.132.633.233.734.3
-34.835.435.936.537.1
-37.138.238.739.339.8
-40.440.941.542.142.6
-43.243.744.344.845.4
-45.946.547.147.648.2
-48.749.349.850.450.9
-51.552.152.653.253.7
-54.354.855.455.956.5
-57.157.658.258.759.3
-59.860.460.961.562.1
-32.132.733.233.834.3
-34.935.436.036.637.1
-37.738.238.839.339.9
-40.441.041.642.142.7
-43.243.844.344.945.4
-46.046.647.147.748.2
-48.849.349.950.451.0
-51.652.152.753.253.8
-54.354.955.456.056.6
-57.157.758.258.859.3
-59.960.461.061.662.1
-32.232.733.333.834.4
-34.935.536.136.637.2
-37.738.338.839.439.9
-40.541.141.642.242.7
-43.343.844.444.945.5
-46.146.647.247.748.3
-48.849.449.950.551.1
-51.652.252.753.353.8
-54.454.955.556.156.6
-57.257.758.358.859.4
-59.960.561.161.662.2

6-23
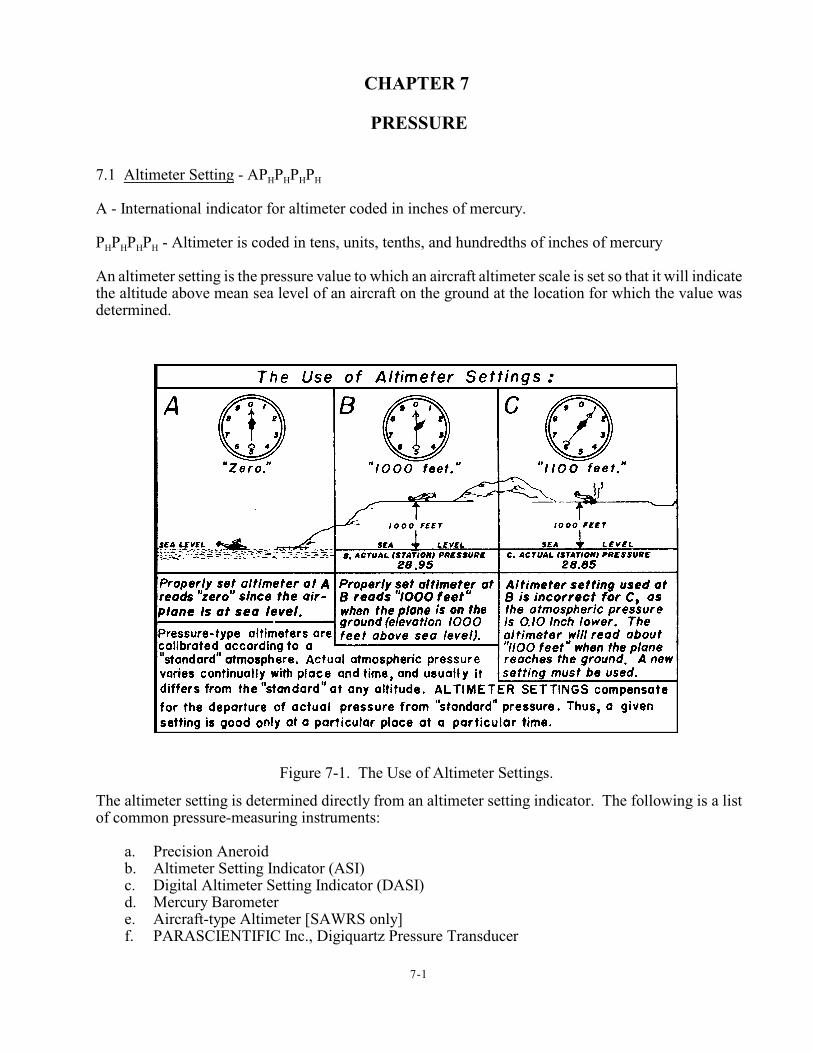
7-1
Figure 7-1. The Use of Altimeter Settings.
CHAPTER 7
PRESSURE
H H H H7.1 Altimeter Setting - AP P P P
A - International indicator for altimeter coded in inches of mercury.
H H H HP P P P - Altimeter is coded in tens, units, tenths, and hundredths of inches of mercury
An altimeter setting is the pressure value to which an aircraft altimeter scale is set so that it will indicatethe altitude above mean sea level of an aircraft on the ground at the location for which the value wasdetermined.
The altimeter setting is determined directly from an altimeter setting indicator. The following is a listof common pressure-measuring instruments:
a. Precision Aneroidb. Altimeter Setting Indicator (ASI)c. Digital Altimeter Setting Indicator (DASI)d. Mercury Barometere. Aircraft-type Altimeter [SAWRS only]f. PARASCIENTIFIC Inc., Digiquartz Pressure Transducer
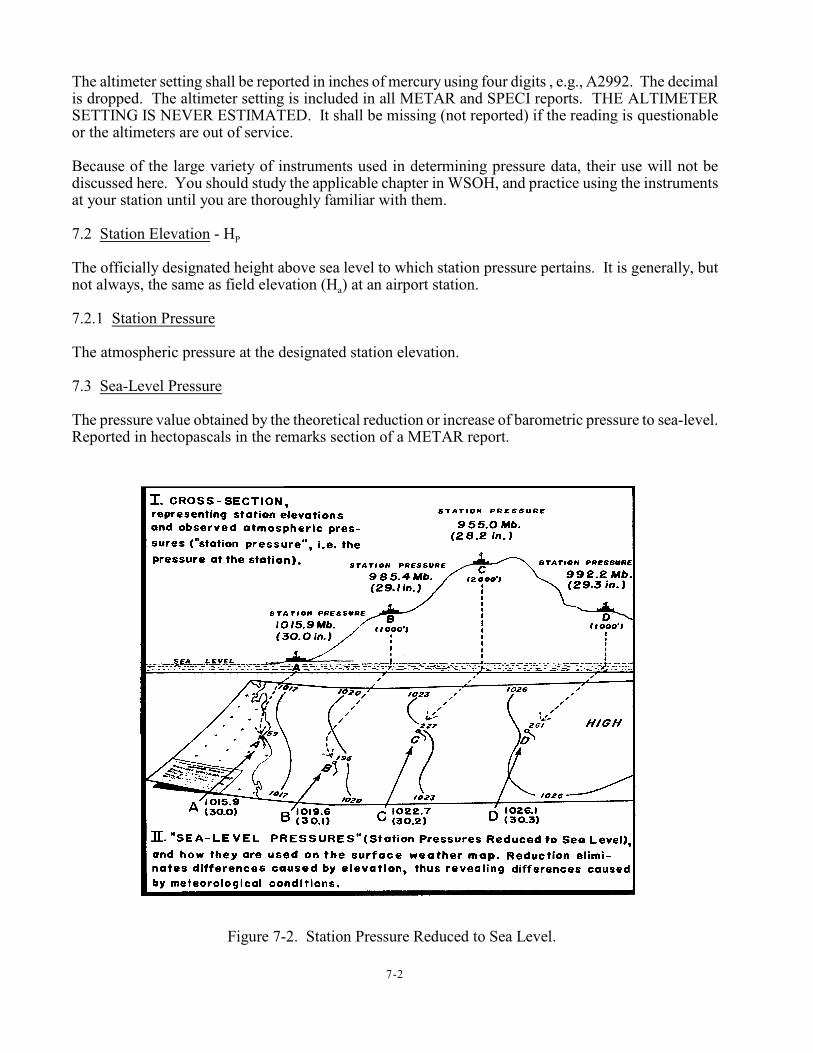
7-2
Figure 7-2. Station Pressure Reduced to Sea Level.
The altimeter setting shall be reported in inches of mercury using four digits , e.g., A2992. The decimalis dropped. The altimeter setting is included in all METAR and SPECI reports. THE ALTIMETERSETTING IS NEVER ESTIMATED. It shall be missing (not reported) if the reading is questionableor the altimeters are out of service.
Because of the large variety of instruments used in determining pressure data, their use will not bediscussed here. You should study the applicable chapter in WSOH, and practice using the instrumentsat your station until you are thoroughly familiar with them.
P7.2 Station Elevation - H
The officially designated height above sea level to which station pressure pertains. It is generally, but
anot always, the same as field elevation (H ) at an airport station.
7.2.1 Station Pressure
The atmospheric pressure at the designated station elevation.
7.3 Sea-Level Pressure
The pressure value obtained by the theoretical reduction or increase of barometric pressure to sea-level.Reported in hectopascals in the remarks section of a METAR report.
7-3
3005
7.4 Difference Between Coded Report and MF1M-10C Entries.
The altimeter group for the transmitted report starts with an A (the international indicator for altimeterin inches of mercury). When the altimeter setting is entered in column 13 of MF1M-10, it does notcontain this designator, only the four-digit group.
Example: Transmitted: A3005 Column 13:
7.5 Altimeter Setting Accuracy.
Because of accuracy requirements for the altimeter setting, it is important that comparison proceduresdescribed in the WSOH be followed. If, for any reason, you don’t make the required comparisons or thetolerance limits are exceeded, omit the altimeter setting.

7-4
7-5
REVIEW QUESTIONS
1. Altimeter setting is recorded in:
a. hectopascalsb. millibarsc. inches of mercury d. centimeters of mercury
2. Altimeter setting is reported:
a. in all METAR/SPECI reportsb. in the remarks section of all METAR reportsc. in METAR reports onlyd. in SPECI reports only
3. If two aneroid instruments are used to determine altimeter settings, how often should they becompared to each other? How often should the comparison be entered in column 65 of MF1M-10?
4. When you read two instruments to determine the altimeter setting and the readings are different,which reading do you use as the altimeter setting? Why?
5. When using the aircraft-type altimeter to determine the altimeter setting, what height should youset it to before reading it? How often should you reset the indicated height?
6. Pressure values are rounded to the next reportable value.
a. downb. upc. either up or downd. carefully
7-6
7. Sea-level pressure is an adjustment to the station pressure to compensate for:
a. density variations in the vertical columnb. the effect of moisture on pressurec. temperature differences over the last 12-hoursd. the difference in elevation between the station and sea-level
8. The 12-hour mean temperature used in the sea-level pressure adjustment is calculated from:
a. the hourly temperatures for the last 12 hoursb. the current ambient temperature and the ambient temperature 12 hours agoc. the high and low temperature for the dayd. the high and low temperature during the last 12 hours
9. A pressure change remark (PRESRR or PRESFR) is reported if the pressure is rising or falling ata rate of at least inch per hour and the pressure change totals inch or more at thetime of observation.
10. The character of a pressure change is based on the observed/recorded change in pressure over thepast:
a. hourb. 3 hoursc. 6 hoursd. 24 hours
11. Indicate the units used with each of the following pressure parameters:
Altimeter Setting a. millibars
Sea-Level Pressure b. hectopascals
Station Pressure c. inches of mercury
d. centimeters of mercury
12. The barograph correction should be entered in column 38 to the nearest:
a. .001b. .01c. .005d. .05
13. Station pressure shall be determined by adjusting the corrected barometric pressure to compensatefor the difference between the height of the barometer and the:
a. designated station elevationb. sea-level pressurec. altimeter settingd. none of the above
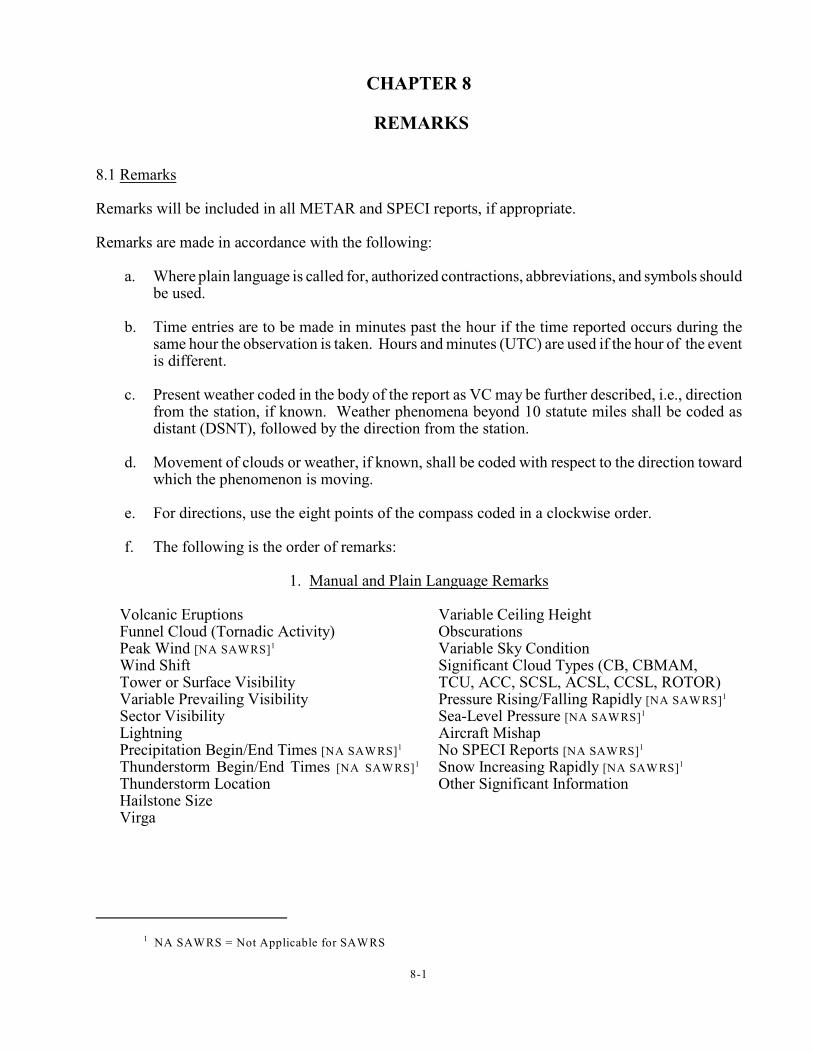
8-1
CHAPTER 8
REMARKS
8.1 Remarks
Remarks will be included in all METAR and SPECI reports, if appropriate.
Remarks are made in accordance with the following:
a. Where plain language is called for, authorized contractions, abbreviations, and symbols shouldbe used.
b. Time entries are to be made in minutes past the hour if the time reported occurs during thesame hour the observation is taken. Hours and minutes (UTC) are used if the hour of the eventis different.
c. Present weather coded in the body of the report as VC may be further described, i.e., directionfrom the station, if known. Weather phenomena beyond 10 statute miles shall be coded asdistant (DSNT), followed by the direction from the station.
d. Movement of clouds or weather, if known, shall be coded with respect to the direction towardwhich the phenomenon is moving.
e. For directions, use the eight points of the compass coded in a clockwise order.
f. The following is the order of remarks:
1. Manual and Plain Language Remarks
Volcanic EruptionsFunnel Cloud (Tornadic Activity)Peak Wind [NA SAWRS]1
Wind ShiftTower or Surface VisibilityVariable Prevailing VisibilitySector VisibilityLightningPrecipitation Begin/End Times [NA SAWRS]1
Thunderstorm Begin/End Times [NA SAWRS]1
Thunderstorm LocationHailstone SizeVirga
Variable Ceiling Height ObscurationsVariable Sky ConditionSignificant Cloud Types (CB, CBMAM, TCU, ACC, SCSL, ACSL, CCSL, ROTOR)Pressure Rising/Falling Rapidly [NA SAWRS]1
Sea-Level Pressure [NA SAWRS]1
Aircraft MishapNo SPECI Reports [NA SAWRS]1
Snow Increasing Rapidly [NA SAWRS]1
Other Significant Information
NA SAWRS = Not Applicable for SAWRS1
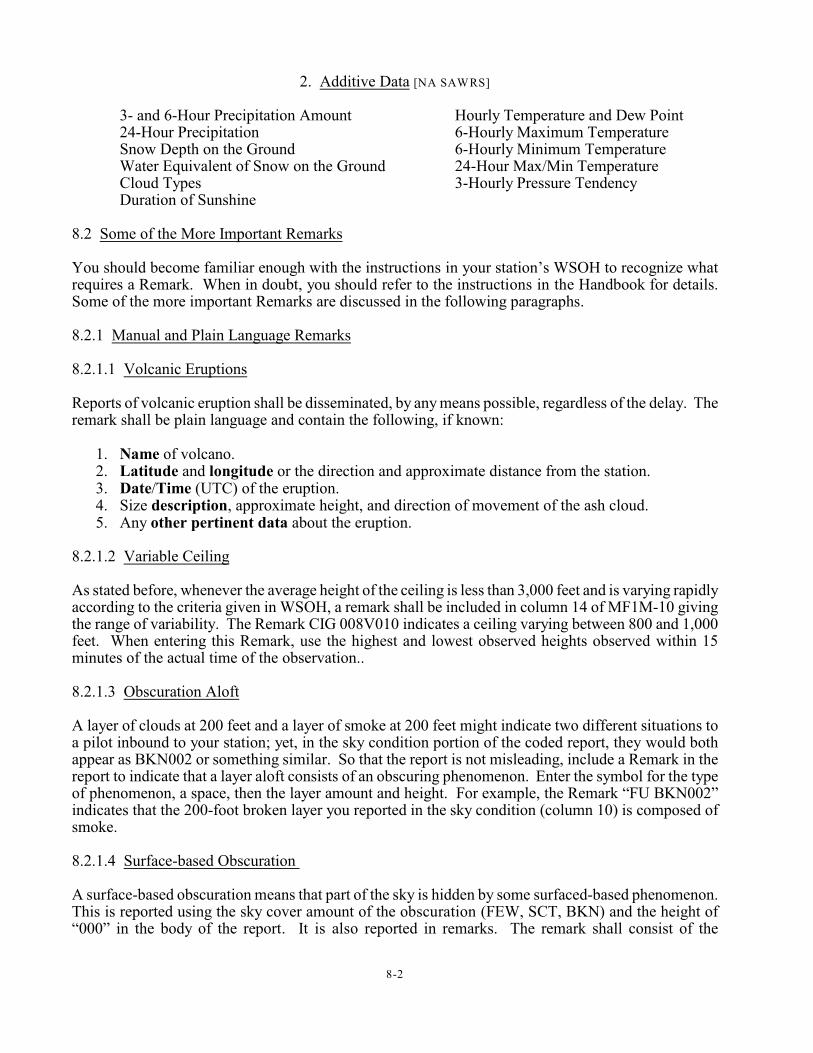
8-2
2. Additive Data [NA SAWRS]
3- and 6-Hour Precipitation Amount Hourly Temperature and Dew Point24-Hour Precipitation 6-Hourly Maximum TemperatureSnow Depth on the Ground 6-Hourly Minimum TemperatureWater Equivalent of Snow on the Ground 24-Hour Max/Min TemperatureCloud Types 3-Hourly Pressure TendencyDuration of Sunshine
8.2 Some of the More Important Remarks
You should become familiar enough with the instructions in your station’s WSOH to recognize whatrequires a Remark. When in doubt, you should refer to the instructions in the Handbook for details.Some of the more important Remarks are discussed in the following paragraphs.
8.2.1 Manual and Plain Language Remarks
8.2.1.1 Volcanic Eruptions
Reports of volcanic eruption shall be disseminated, by any means possible, regardless of the delay. Theremark shall be plain language and contain the following, if known:
1. Name of volcano.2. Latitude and longitude or the direction and approximate distance from the station.3. Date/Time (UTC) of the eruption.4. Size description, approximate height, and direction of movement of the ash cloud.5. Any other pertinent data about the eruption.
8.2.1.2 Variable Ceiling
As stated before, whenever the average height of the ceiling is less than 3,000 feet and is varying rapidlyaccording to the criteria given in WSOH, a remark shall be included in column 14 of MF1M-10 givingthe range of variability. The Remark CIG 008V010 indicates a ceiling varying between 800 and 1,000feet. When entering this Remark, use the highest and lowest observed heights observed within 15minutes of the actual time of the observation..
8.2.1.3 Obscuration Aloft
A layer of clouds at 200 feet and a layer of smoke at 200 feet might indicate two different situations toa pilot inbound to your station; yet, in the sky condition portion of the coded report, they would bothappear as BKN002 or something similar. So that the report is not misleading, include a Remark in thereport to indicate that a layer aloft consists of an obscuring phenomenon. Enter the symbol for the typeof phenomenon, a space, then the layer amount and height. For example, the Remark “FU BKN002”indicates that the 200-foot broken layer you reported in the sky condition (column 10) is composed ofsmoke.
8.2.1.4 Surface-based Obscuration
A surface-based obscuration means that part of the sky is hidden by some surfaced-based phenomenon.This is reported using the sky cover amount of the obscuration (FEW, SCT, BKN) and the height of“000” in the body of the report. It is also reported in remarks. The remark shall consist of the
8-3
phenomenon causing the obscuration, a space, then the layer amount and height. For example, theRemark “HZ SCT000” indicates that haze at the surface is hiding 3/8 to 4/8 of the sky.
8.2.1.5 Significant Cloud Types
Certain types of clouds are of particular importance to pilots. You are expected to be able to recognizethem. The direction of movement is the direction toward which the clouds are moving.
1. Cumulonimbus (CB) with or without an anvil. These are large cumulus-type clouds with darkbases and are threatening in appearance. Report CB followed by direction from station, and ifknown, the movement of the cloud with each entry separated by a space. For example, a CB upto 10 statute miles southeast of the station moving toward the north would be coded “CB VC SEMOV N.” A CB more than 10 statute miles east of the station would be coded “CB DSNT E.”
2. Cumulonimbus Mamma (CBMAM). This is a dark cloud with rounded protuberances hangingdownward from its base. Report CBMAM followed by the direction from the station, and ifknown, the direction of movement of the cloud; e.g., “CBMAM ALQDS MOV N.” Append CBto the cloud layer in the body of the report.
3. Towering Cumulus (TCU). This cloud is similar to “fair weather cumulus” but has a distinctlyshaded, often dark base, and strong vertical development. Report TCU followed by the directionfrom the station; e.g., “TCU NW” or, if a towering cumulus cloud is more than 10 statute mileswest of the station, you would code “TCU DSNT W.”
4. Altocumulus Castellanus (ACC). These clouds are similar to cumulus clouds but are at a higherlevel and are usually smaller. Report ACC followed by the direction from the station. Forexample, an altocumulus cloud 5 to 10 statute miles northeast of the station would be coded“ACC VC NE.”
5. Standing Lenticular, stratocumulus (SCSL), altocumulus (ACSL), or cirrocumulus (CCSL).These clouds usually form in patches in the shape of plates, saucers, lenses, etc. They typicallyform on the lee side of mountains or ridges and are often observed at several levels. Report thecloud type followed by the direction from the station; entries shall be separated by a space. Forexample, stratocumulus standing lenticular clouds observed east through south of the stationwould be coded “SCSL E-S,” and altocumulus standing lenticular clouds over the station wouldbe coded “ACSL OHD.”
6. Rotor Clouds. These clouds form on the lee side of mountains or ridges. Report ROTOR CLDfollowed by the direction from the station. For example, an apparent rotor cloud 5 to 10 statutemiles northwest of the station would be coded “APRNT ROTOR CLD VC NW.”
8.2.2 Additive Data Remarks
8.2.2.1 3- and 6-Hourly Precipitation Amount
The amount of precipitation (water equivalent) accumulated in the past 3 hours is reported in the 3-hourly report, and the amount accumulated in the past 6 hours is reported in the 6-hourly report. Theamount of precipitation is coded in the group 6RRRR, using the tens, units, tenths, and hundredths ofinches. For example, 0.15 inches of precipitation would be coded 60015. If an indeterminable amountof precipitation occurred during the observing period, 6//// is coded. A trace is coded 60000. If noprecipitation occurred during the observing period, the group is omitted.
8-4
8.2.2.2 24-Hour Precipitation Amount
24 24 24 24The 24-hour precipitation amount, 7R R R R , is included in the 1200 UTC report (or otherdesignated time) whenever more than a trace of precipitation (water equivalent) has fallen in the past 24hours. The amount of precipitation is coded using the tens, units, tenths, and hundredths of inches. Forexample, 10.45 inches of precipitation (water equivalent) in the past 24 hours would be coded 71045;0.10 inches of precipitation (water equivalent) in the past 24 hours would be coded 70010. If more thana trace (water equivalent) has fallen and the amount cannot be determined, the group is coded 7////. Ifonly a trace or no precipitation occurred in the past 24 hours, the group is omitted.
8.2.2.3 Snow Depth on the Ground
The total snow depth on the ground group, 4/sss, is coded in the 0000 and 1200 UTC observationwhenever there is more than a trace of snow on the ground. It is also coded in the 0600 and 1800 UTCobservations if there is more than a trace of snow on the ground and more than a trace of precipitation(water equivalent) occurred within the past 6 hours. Report snow depth to the nearest whole inch,rounding up when one-half-inch increments are reached. For example, a snow depth of 0.4 inches wouldbe considered a trace amount, the group would be omitted; a snow depth of 33.5 inches would be coded4/034.
Snow depth on the ground is taken by measuring the total depth of snow on exposed ground by meansof a permanently mounted snow stake or by taking the average of several depth readings at or near thenormal point of observation with a measuring stick. When using a measuring stick, make sure the stickis pushed vertically into the snow until the bottom rests on the ground. Do not mistake an ice layer orcrusted snow as “ground.” The measurement should reflect the average depth of snow, sleet, and glazeice on the ground at your usual measurement site (not disturbed by human activities). Measurementsfrom rooftops, paved areas, and the like should not be made.
When strong winds have blown the snow, take several measurements where the snow was least affectedby drifting and average them. If most exposed areas are blown free of snow while others have drifts, tryto combine visual averaging with measurements to make an estimate.
8.2.2.4 Water Equivalent of Snow on the Ground
The water equivalent of snow on the ground group, 933RRR, is coded each day in the 1800 UTC reportif the average snow depth is 2 inches or more. This group is the water equivalent of snow (i.e., snow,snow pellets, snow grains, ice pellets, ice crystals, and hail) on the ground. The water equivalent iscoded using the tens, units, and tenths of inches, using three digits. If the water equivalent of snowconsists entirely of hail, the group shall not be coded. A water equivalent of 4.7 inches of snow wouldbe coded 933047; a water equivalent of 17.3 would be coded 933173.
This measurement is made by taking a “snow core” of the snow on the ground with the use of theoverflow can of your station’s 8-inch non-recording rain gauge. Use the following procedure to obtainthis measurement:
a. Find an area where drifting is minimal. This will usually be a flat area away from obstructionssuch as trees and buildings, although obstructions at some distance can help drifting.
8-5
b. Invert the overflow can and force it down through the snow. The rim will cut a cylindricalvertical sample. If the snow is very deep, it may be necessary to push the can part way to theground. Then, remove and empty the snow into a container, and insert the can in the same holeto obtain the rest of the snow.
c. Slip a piece of sheet metal or thin wood beneath the mouth of the can to prevent the snow fromfalling out.
d. Take the snow indoors, melt the contents of the can (by adding an accurately measured amountof warm water), then pour the liquid into the funnel and smaller inner measuring tube of the raingauge and measure the amount to the nearest .01 inch. Subtract the amount of warm water addedfrom the total liquid measurement to get your final liquid water equivalent of the snow on theground.
If the melted water equivalent (including any added warm water) exceeds 2 inches (the amountthe measuring tube holds), empty the full measuring tube and pour the remaining liquid from thelarge 8-inch can into the emptied measuring tube. Add the multiple measurements.
Do not measure the melted precipitation directly in the overflow can of the 8-inch gauge. Make sure theinner measuring tube cannot fall over when pouring the liquid into it.
8.3 Measuring Precipitation
The most common types of gauges used to measure liquid precipitation are the 8-inch non-recordinggauge and the universal recording weighing gauge. These provide acceptable accuracy when used tomeasure liquid precipitation. Measuring the most common type of solid precipitation, snow, is moredifficult. You will have to use good judgement when measuring the depth of snow and its waterequivalent. The problem is compounded by the tendency of snow to drift.
8.3.1 8-Inch Non-Recording Gauge
This gauge (see Figure 8-1) consists of a large diameter outer can, a smaller diameter measuring tubeinside it, a funnel that connects them, a measuring stick, and a support. The outer can and top of thefunnel are 8 inches in diameter. The funnel directs precipitation into the measuring tube, which is 20inches tall and holds exactly 2 inches of liquid precipitation (additional rainfall will flow into theoverflow can). This ten-to-one ratio makes it possible to read rainfall amounts to the nearest hundredthof an inch. The measuring stick is marked at .01 inch intervals.
To measure rainfall, remove the funnel and insert the measuring stick into the bottom of the measuringtube, leaving it there for two or three seconds. The water will darken the stick. Remove the stick andread the rainfall amount from the top of the darkened part of the stick. Example: if the stick is darkenedto three marks above the 0.80 inch mark, the rainfall is .83 inch.
If the measuring tube is full (indicating at least two inches of rain), empty the tube carefully to avoidspilling any water back into the overflow can. Allow a few seconds for all the water to drain from thetube, then pour the water from the overflow can into the measuring tube. Measure this amount and addit to the two inches already emptied from the tube. If more than four inches of rain has fallen, themeasuring tube will be filled at least twice.
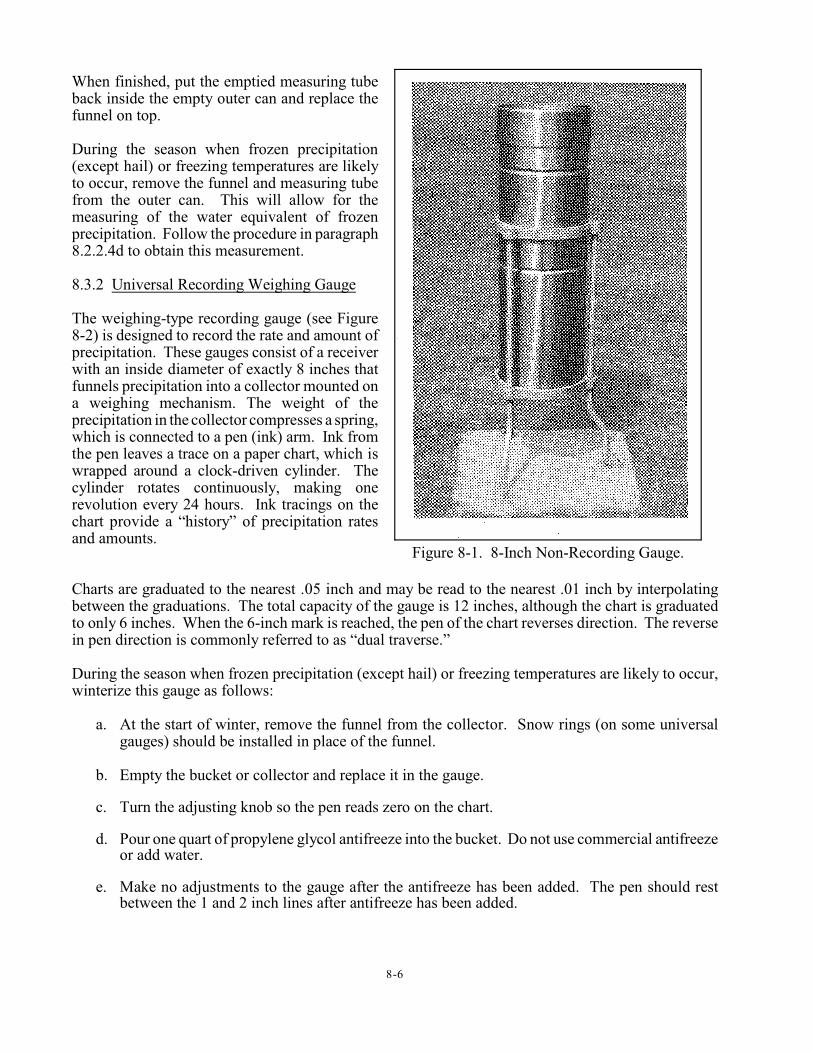
8-6
Figure 8-1. 8-Inch Non-Recording Gauge.
When finished, put the emptied measuring tubeback inside the empty outer can and replace thefunnel on top.
During the season when frozen precipitation(except hail) or freezing temperatures are likelyto occur, remove the funnel and measuring tubefrom the outer can. This will allow for themeasuring of the water equivalent of frozenprecipitation. Follow the procedure in paragraph8.2.2.4d to obtain this measurement.
8.3.2 Universal Recording Weighing Gauge
The weighing-type recording gauge (see Figure8-2) is designed to record the rate and amount ofprecipitation. These gauges consist of a receiverwith an inside diameter of exactly 8 inches thatfunnels precipitation into a collector mounted ona weighing mechanism. The weight of theprecipitation in the collector compresses a spring,which is connected to a pen (ink) arm. Ink fromthe pen leaves a trace on a paper chart, which iswrapped around a clock-driven cylinder. Thecylinder rotates continuously, making onerevolution every 24 hours. Ink tracings on thechart provide a “history” of precipitation ratesand amounts.
Charts are graduated to the nearest .05 inch and may be read to the nearest .01 inch by interpolatingbetween the graduations. The total capacity of the gauge is 12 inches, although the chart is graduatedto only 6 inches. When the 6-inch mark is reached, the pen of the chart reverses direction. The reversein pen direction is commonly referred to as “dual traverse.”
During the season when frozen precipitation (except hail) or freezing temperatures are likely to occur,winterize this gauge as follows:
a. At the start of winter, remove the funnel from the collector. Snow rings (on some universalgauges) should be installed in place of the funnel.
b. Empty the bucket or collector and replace it in the gauge.
c. Turn the adjusting knob so the pen reads zero on the chart.
d. Pour one quart of propylene glycol antifreeze into the bucket. Do not use commercial antifreezeor add water.
e. Make no adjustments to the gauge after the antifreeze has been added. The pen should restbetween the 1 and 2 inch lines after antifreeze has been added.
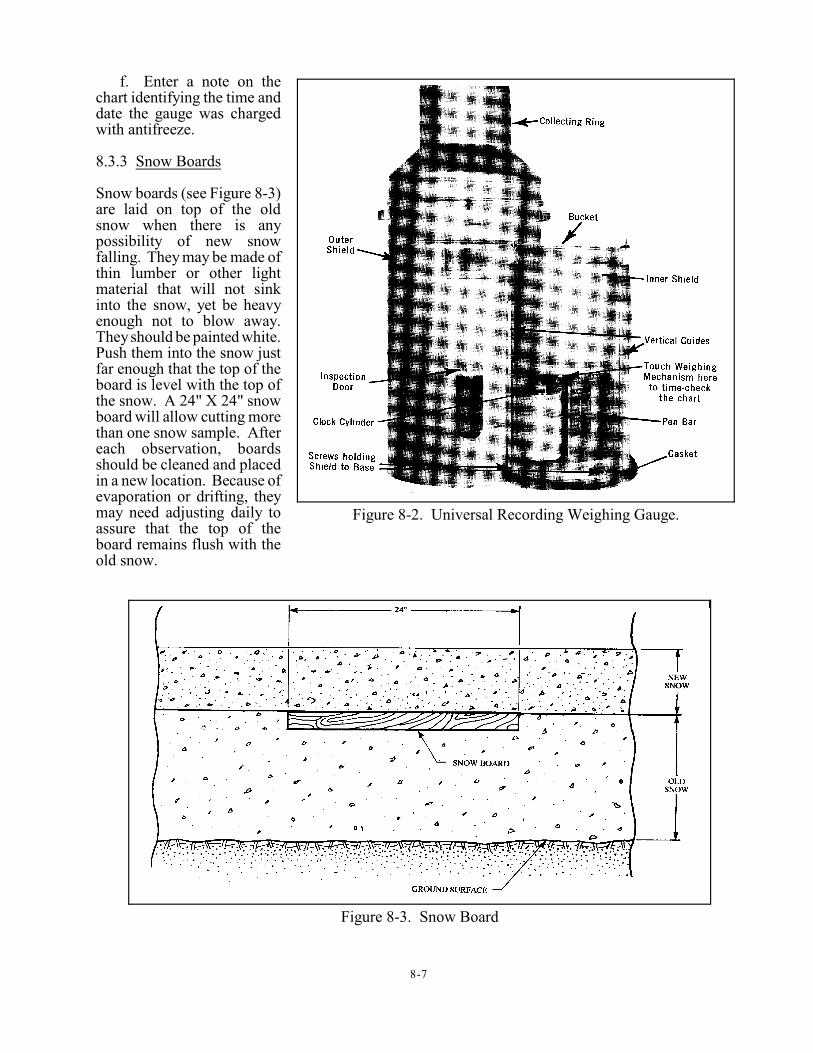
8-7
Figure 8-2. Universal Recording Weighing Gauge.
Figure 8-3. Snow Board
f. Enter a note on thechart identifying the time anddate the gauge was chargedwith antifreeze.
8.3.3 Snow Boards
Snow boards (see Figure 8-3)are laid on top of the oldsnow when there is anypossibility of new snowfalling. They may be made ofthin lumber or other lightmaterial that will not sinkinto the snow, yet be heavyenough not to blow away.They should be painted white.Push them into the snow justfar enough that the top of theboard is level with the top ofthe snow. A 24" X 24" snowboard will allow cutting morethan one snow sample. Aftereach observation, boardsshould be cleaned and placedin a new location. Because ofevaporation or drifting, theymay need adjusting daily toassure that the top of theboard remains flush with theold snow.
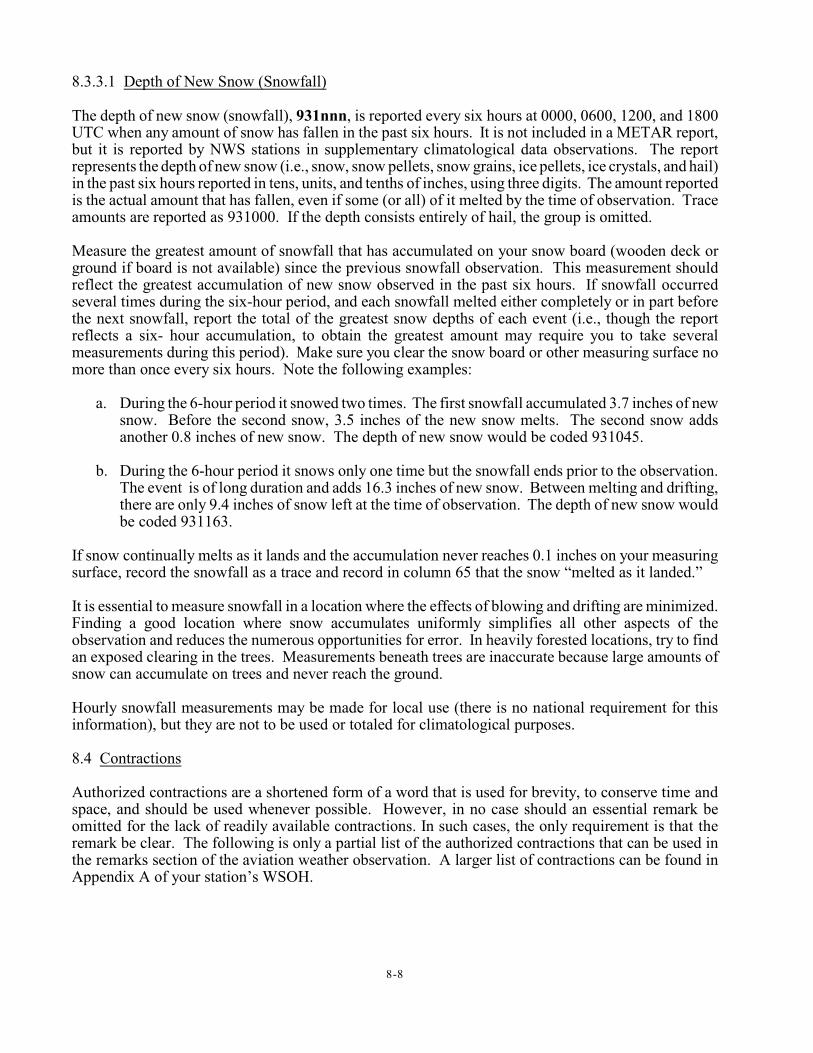
8-8
8.3.3.1 Depth of New Snow (Snowfall)
The depth of new snow (snowfall), 931nnn, is reported every six hours at 0000, 0600, 1200, and 1800UTC when any amount of snow has fallen in the past six hours. It is not included in a METAR report,but it is reported by NWS stations in supplementary climatological data observations. The reportrepresents the depth of new snow (i.e., snow, snow pellets, snow grains, ice pellets, ice crystals, and hail)in the past six hours reported in tens, units, and tenths of inches, using three digits. The amount reportedis the actual amount that has fallen, even if some (or all) of it melted by the time of observation. Traceamounts are reported as 931000. If the depth consists entirely of hail, the group is omitted.
Measure the greatest amount of snowfall that has accumulated on your snow board (wooden deck orground if board is not available) since the previous snowfall observation. This measurement shouldreflect the greatest accumulation of new snow observed in the past six hours. If snowfall occurredseveral times during the six-hour period, and each snowfall melted either completely or in part beforethe next snowfall, report the total of the greatest snow depths of each event (i.e., though the reportreflects a six- hour accumulation, to obtain the greatest amount may require you to take severalmeasurements during this period). Make sure you clear the snow board or other measuring surface nomore than once every six hours. Note the following examples:
a. During the 6-hour period it snowed two times. The first snowfall accumulated 3.7 inches of newsnow. Before the second snow, 3.5 inches of the new snow melts. The second snow addsanother 0.8 inches of new snow. The depth of new snow would be coded 931045.
b. During the 6-hour period it snows only one time but the snowfall ends prior to the observation.The event is of long duration and adds 16.3 inches of new snow. Between melting and drifting,there are only 9.4 inches of snow left at the time of observation. The depth of new snow wouldbe coded 931163.
If snow continually melts as it lands and the accumulation never reaches 0.1 inches on your measuringsurface, record the snowfall as a trace and record in column 65 that the snow “melted as it landed.”
It is essential to measure snowfall in a location where the effects of blowing and drifting are minimized.Finding a good location where snow accumulates uniformly simplifies all other aspects of theobservation and reduces the numerous opportunities for error. In heavily forested locations, try to findan exposed clearing in the trees. Measurements beneath trees are inaccurate because large amounts ofsnow can accumulate on trees and never reach the ground.
Hourly snowfall measurements may be made for local use (there is no national requirement for thisinformation), but they are not to be used or totaled for climatological purposes.
8.4 Contractions
Authorized contractions are a shortened form of a word that is used for brevity, to conserve time andspace, and should be used whenever possible. However, in no case should an essential remark beomitted for the lack of readily available contractions. In such cases, the only requirement is that theremark be clear. The following is only a partial list of the authorized contractions that can be used inthe remarks section of the aviation weather observation. A larger list of contractions can be found inAppendix A of your station’s WSOH.
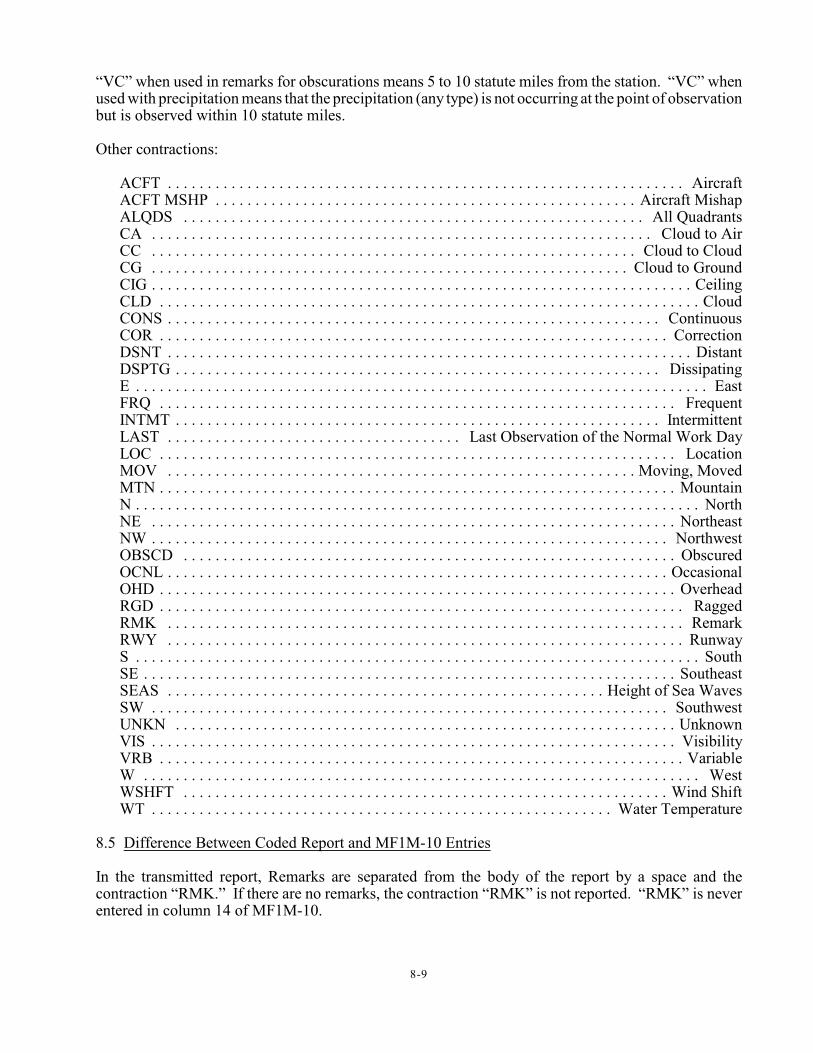
8-9
“VC” when used in remarks for obscurations means 5 to 10 statute miles from the station. “VC” whenused with precipitation means that the precipitation (any type) is not occurring at the point of observationbut is observed within 10 statute miles.
Other contractions:
ACFT . . . . . . . . . . . . . . . . . . . . . . . . . . . . . . . . . . . . . . . . . . . . . . . . . . . . . . . . . . . . . . . . . AircraftACFT MSHP . . . . . . . . . . . . . . . . . . . . . . . . . . . . . . . . . . . . . . . . . . . . . . . . . . . . . Aircraft MishapALQDS . . . . . . . . . . . . . . . . . . . . . . . . . . . . . . . . . . . . . . . . . . . . . . . . . . . . . . . . . . All QuadrantsCA . . . . . . . . . . . . . . . . . . . . . . . . . . . . . . . . . . . . . . . . . . . . . . . . . . . . . . . . . . . . . . . Cloud to AirCC . . . . . . . . . . . . . . . . . . . . . . . . . . . . . . . . . . . . . . . . . . . . . . . . . . . . . . . . . . . . . Cloud to CloudCG . . . . . . . . . . . . . . . . . . . . . . . . . . . . . . . . . . . . . . . . . . . . . . . . . . . . . . . . . . . . Cloud to GroundCIG . . . . . . . . . . . . . . . . . . . . . . . . . . . . . . . . . . . . . . . . . . . . . . . . . . . . . . . . . . . . . . . . . . . . CeilingCLD . . . . . . . . . . . . . . . . . . . . . . . . . . . . . . . . . . . . . . . . . . . . . . . . . . . . . . . . . . . . . . . . . . . . CloudCONS . . . . . . . . . . . . . . . . . . . . . . . . . . . . . . . . . . . . . . . . . . . . . . . . . . . . . . . . . . . . . . ContinuousCOR . . . . . . . . . . . . . . . . . . . . . . . . . . . . . . . . . . . . . . . . . . . . . . . . . . . . . . . . . . . . . . . . CorrectionDSNT . . . . . . . . . . . . . . . . . . . . . . . . . . . . . . . . . . . . . . . . . . . . . . . . . . . . . . . . . . . . . . . . . . DistantDSPTG . . . . . . . . . . . . . . . . . . . . . . . . . . . . . . . . . . . . . . . . . . . . . . . . . . . . . . . . . . . . . DissipatingE . . . . . . . . . . . . . . . . . . . . . . . . . . . . . . . . . . . . . . . . . . . . . . . . . . . . . . . . . . . . . . . . . . . . . . . . EastFRQ . . . . . . . . . . . . . . . . . . . . . . . . . . . . . . . . . . . . . . . . . . . . . . . . . . . . . . . . . . . . . . . . . FrequentINTMT . . . . . . . . . . . . . . . . . . . . . . . . . . . . . . . . . . . . . . . . . . . . . . . . . . . . . . . . . . . . . IntermittentLAST . . . . . . . . . . . . . . . . . . . . . . . . . . . . . . . . . . . . . Last Observation of the Normal Work DayLOC . . . . . . . . . . . . . . . . . . . . . . . . . . . . . . . . . . . . . . . . . . . . . . . . . . . . . . . . . . . . . . . . . LocationMOV . . . . . . . . . . . . . . . . . . . . . . . . . . . . . . . . . . . . . . . . . . . . . . . . . . . . . . . . . . . Moving, MovedMTN . . . . . . . . . . . . . . . . . . . . . . . . . . . . . . . . . . . . . . . . . . . . . . . . . . . . . . . . . . . . . . . . . MountainN . . . . . . . . . . . . . . . . . . . . . . . . . . . . . . . . . . . . . . . . . . . . . . . . . . . . . . . . . . . . . . . . . . . . . . . NorthNE . . . . . . . . . . . . . . . . . . . . . . . . . . . . . . . . . . . . . . . . . . . . . . . . . . . . . . . . . . . . . . . . . . NortheastNW . . . . . . . . . . . . . . . . . . . . . . . . . . . . . . . . . . . . . . . . . . . . . . . . . . . . . . . . . . . . . . . . . NorthwestOBSCD . . . . . . . . . . . . . . . . . . . . . . . . . . . . . . . . . . . . . . . . . . . . . . . . . . . . . . . . . . . . . . ObscuredOCNL . . . . . . . . . . . . . . . . . . . . . . . . . . . . . . . . . . . . . . . . . . . . . . . . . . . . . . . . . . . . . . . OccasionalOHD . . . . . . . . . . . . . . . . . . . . . . . . . . . . . . . . . . . . . . . . . . . . . . . . . . . . . . . . . . . . . . . . . OverheadRGD . . . . . . . . . . . . . . . . . . . . . . . . . . . . . . . . . . . . . . . . . . . . . . . . . . . . . . . . . . . . . . . . . . RaggedRMK . . . . . . . . . . . . . . . . . . . . . . . . . . . . . . . . . . . . . . . . . . . . . . . . . . . . . . . . . . . . . . . . . RemarkRWY . . . . . . . . . . . . . . . . . . . . . . . . . . . . . . . . . . . . . . . . . . . . . . . . . . . . . . . . . . . . . . . . . RunwayS . . . . . . . . . . . . . . . . . . . . . . . . . . . . . . . . . . . . . . . . . . . . . . . . . . . . . . . . . . . . . . . . . . . . . . . SouthSE . . . . . . . . . . . . . . . . . . . . . . . . . . . . . . . . . . . . . . . . . . . . . . . . . . . . . . . . . . . . . . . . . . . SoutheastSEAS . . . . . . . . . . . . . . . . . . . . . . . . . . . . . . . . . . . . . . . . . . . . . . . . . . . . . . . Height of Sea WavesSW . . . . . . . . . . . . . . . . . . . . . . . . . . . . . . . . . . . . . . . . . . . . . . . . . . . . . . . . . . . . . . . . . SouthwestUNKN . . . . . . . . . . . . . . . . . . . . . . . . . . . . . . . . . . . . . . . . . . . . . . . . . . . . . . . . . . . . . . . UnknownVIS . . . . . . . . . . . . . . . . . . . . . . . . . . . . . . . . . . . . . . . . . . . . . . . . . . . . . . . . . . . . . . . . . . VisibilityVRB . . . . . . . . . . . . . . . . . . . . . . . . . . . . . . . . . . . . . . . . . . . . . . . . . . . . . . . . . . . . . . . . . . VariableW . . . . . . . . . . . . . . . . . . . . . . . . . . . . . . . . . . . . . . . . . . . . . . . . . . . . . . . . . . . . . . . . . . . . . . WestWSHFT . . . . . . . . . . . . . . . . . . . . . . . . . . . . . . . . . . . . . . . . . . . . . . . . . . . . . . . . . . . . . Wind ShiftWT . . . . . . . . . . . . . . . . . . . . . . . . . . . . . . . . . . . . . . . . . . . . . . . . . . . . . . . . . . Water Temperature
8.5 Difference Between Coded Report and MF1M-10 Entries
In the transmitted report, Remarks are separated from the body of the report by a space and thecontraction “RMK.” If there are no remarks, the contraction “RMK” is not reported. “RMK” is neverentered in column 14 of MF1M-10.

8-10
8-11
REVIEW QUESTIONS
Select the correct answer.
1. In a METAR report, the remarks section follows the ______________ .
a. temperature and dew pointb. windc. altimeterd. sky condition
2. The remarks section of the transmitted report always begins with the contraction __________ .
a. REb. RMKc. REMARKSd. METAR
3. VC indicates the location of an obscuration phenomena is _______________ .
a. at the usual point of observationb. within 5 miles of the observation pointc. between 5 and 10 statute miles of the point of observationd. beyond 10 miles of the airport
4. “DSNT” indicates the location of weather phenomena is _____________ .
a. beyond 10 miles of the airportb. beyond 20 miles of the airportc. beyond 10 statute miles of the observation pointd. beyond 5 statute miles of the station
Code the following remarks of a METAR/SPECI report.
5. Occasional lightning in the cloud and cloud to ground two miles northwest.
6. Frequent lightning cloud to ground in the vicinity of the station.
7. Continuous lightning occurring cloud to cloud, to the southeast.
8. Occasional lightning cloud to cloud and in the cloud is observed to the distant west.
9. Mt. St. Helens volcano, 70 miles northeast, erupted on the 18th at 1505 Zulu. A large ash cloud isextending to approx. 30,000 feet, moving to the southeast.
8-12
10. A thunderstorm is overhead, moving to the north.
11. A thunderstorm is seven miles northeast, moving to the northeast.
12. A thunderstorm is fifteen miles south, moving to the southeast.
13. Cumulonimbus clouds to the west are moving to the east.
14. Towering cumulus clouds are overhead.
15. A lens-shaped cloud is observed at a height of 9,000 feet southwest of the station.
16. Snow is falling from towering cumulus in all quadrants and is obscuring 5/8 sky.
17. For each of the following, indicate the order in which they are reported:
a. Rotor cloud Sector visibility Wind shift
b. Obscurations Altocumulus castellanus Virga
c. Variable sky condition Variable prevailing visibility Lightning
d. LAST Aircraft mishap Towering cumulus
e. Hailstone size Variable ceiling height Variable prevailing visibility
f. Wind shift Thunderstorm location Lightning
g. Cumulonimbus (CB) Lightning Obscurations
h. Variable sky condition Sector visibility Variable ceiling height
i. Funnel cloud Sector visibility Thunderstorm location
18. The snow depth entered in column 61 of MF1M-10 is measured at what time?
19. The snow depth increased 3 inches in the past hour. How would this be reported in column 14 ifthe total depth of snow on the ground is 8 inches?
8-13
20. How is the 5appp group coded at 1200 UTC if the pressure fell unsteadily .040 inch during the past3 hours?
a. 57040b. 57014c. 52040d. 52014
21. Using the prescribed order, which of the following required remarks would be the first entry incolumn 14 (Remarks)?
a. VIRGA SWb. GR 1/2c. OCNL LTGICCG VCd. WSHFT 1957
22. Which of the following remarks are reported in the proper order?
a. WSHFT 15 VIS 1/2V2 RAB35 BKN014 V OVC ACC NWb. TSB25 RAB15 TWR VIS 3c. CIG 010V016 SLP015 PRESFRd. PK WND 28045/15 OCNL LTGIC NW VIS E-S 2 1/2
23. At 1800 UTC, 0.25 inches of precipitation occurred 12 hours ago. What is recorded in column 14(Remarks)?
a. 70025b. 60025c. 71025d. no report is required
24. A temperature of 18.5° Celsius and a dew point of 10.1° Celsius would be coded in remarks as:
a. T00190010b. T01850101c. T01851101d. T00190100
25. At 0600 UTC there are 21.3 inches of snow on the ground and no precipitation fell during the 6-hour period. What should be reported in remarks?
a. 4/021b. 4/213c. not required to be reportedd. 40213
8-14
26. A 6-hourly maximum temperature of !2.5° Celsius shall be coded in column 14 in the followingformat:
a. 10003b. 11025c. 10025d. 11002
27. When coding the pressure characteristic, if the pressure is lower than 3 hours ago, the code mustbe chosen from one of the following groups:
a. 0, 6, 7, 8b. 4, 5, 6, 7c. 0, 1, 2, 3d. 5, 6, 7, 8
28. The snow depth increased 3 inches between 1300 and 1400 UTC. How would this be reported incolumn 14 if the depth of snow on the ground at 1200 and 1300 UTC was 6 inches?
a. SNINCR 3/9b. SNINCR 3/6c. SNINCR 3/3d. SNINCR 6/3
29. If an undeterminable amount of precipitation has occurred in the past 3-hours, what should berecorded in column 14?
a. 60000b. 6////c. 3////d. missing data, no report is required
30. A 6-hour maximum temperature of 14.5°C and a 6-hour minimum temperature of !1.5°C shouldbe recorded in column 14 as:
a. 10145 21015b. 10015 21002c. 10014 21001d. 10145 20015
31. At 1800 UTC, a trace of precipitation has fallen during the past 6-hours. What should be reportedin remarks?
a. 60000b. 6000/c. 6////d. not required to be reported
8-15
32. Which of the following is a correct entry in Column 14 (Remarks)?
a. FG OVC000b. FU VV005c. GS 1/2d. ACC DSNT NW
33. When reporting lightning in remarks, which of the following items is unnecessary?
a. Frequencyb. Typec. Locationd. Begin/end times
34. In remarks, time entries will use “hours and minutes” if the time reported occurs:
a. during the same hour the observation is takenb. any time within 2 hours of observation timec. during an hour that is different from the observation time hourd. any time (observer’s option)
35. Which of the following is a correct remark?
a. GS 1/2b. PK WND 25025/37c. VIS 1/4V1/2d. RAB1458 TSB1456E31
36. A remark of FRQ LTGCGCC NW in Column 14 would indicate that flashes per minute wereobserved.
a. more than 10b. 6-10c. 1-10d. 1-6
37. What remark is appended to the report to indicate that the observation was not transmitted long-line?
a. SPECIb. LASTc. FIBId. NOSPECI
38. Using the prescribed order, which of the following required remarks would be the first entry?
a. VIRGA SWb. GR 1/2c. OCNL LTGICCG VCd. WSHFT 1957
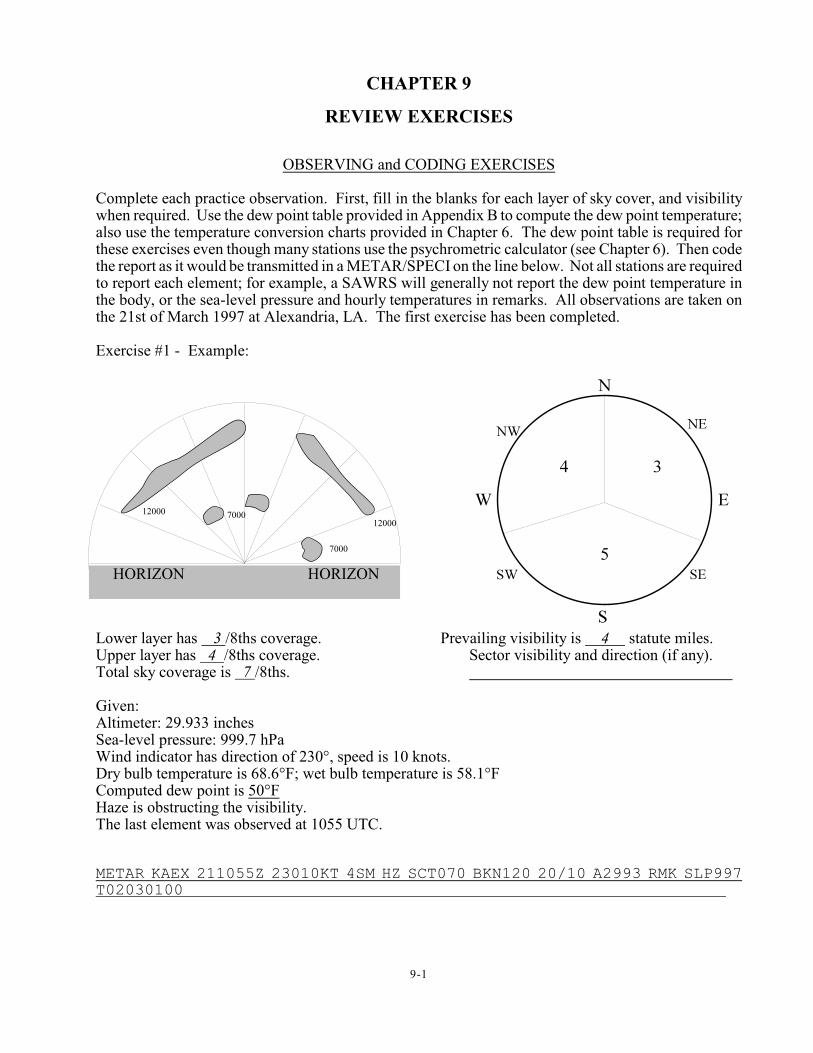
9-1
CHAPTER 9
REVIEW EXERCISES
OBSERVING and CODING EXERCISES
Complete each practice observation. First, fill in the blanks for each layer of sky cover, and visibilitywhen required. Use the dew point table provided in Appendix B to compute the dew point temperature;also use the temperature conversion charts provided in Chapter 6. The dew point table is required forthese exercises even though many stations use the psychrometric calculator (see Chapter 6). Then codethe report as it would be transmitted in a METAR/SPECI on the line below. Not all stations are requiredto report each element; for example, a SAWRS will generally not report the dew point temperature inthe body, or the sea-level pressure and hourly temperatures in remarks. All observations are taken onthe 21st of March 1997 at Alexandria, LA. The first exercise has been completed.
Exercise #1 - Example:
Lower layer has 3 /8ths coverage. Prevailing visibility is 4 statute miles.Upper layer has 4 /8ths coverage. Sector visibility and direction (if any).Total sky coverage is 7 /8ths.
Given:Altimeter: 29.933 inchesSea-level pressure: 999.7 hPaWind indicator has direction of 230°, speed is 10 knots.Dry bulb temperature is 68.6°F; wet bulb temperature is 58.1°FComputed dew point is 50°FHaze is obstructing the visibility.The last element was observed at 1055 UTC.
METAR KAEX 211055Z 23010KT 4SM HZ SCT070 BKN120 20/10 A2993 RMK SLP997T02030100
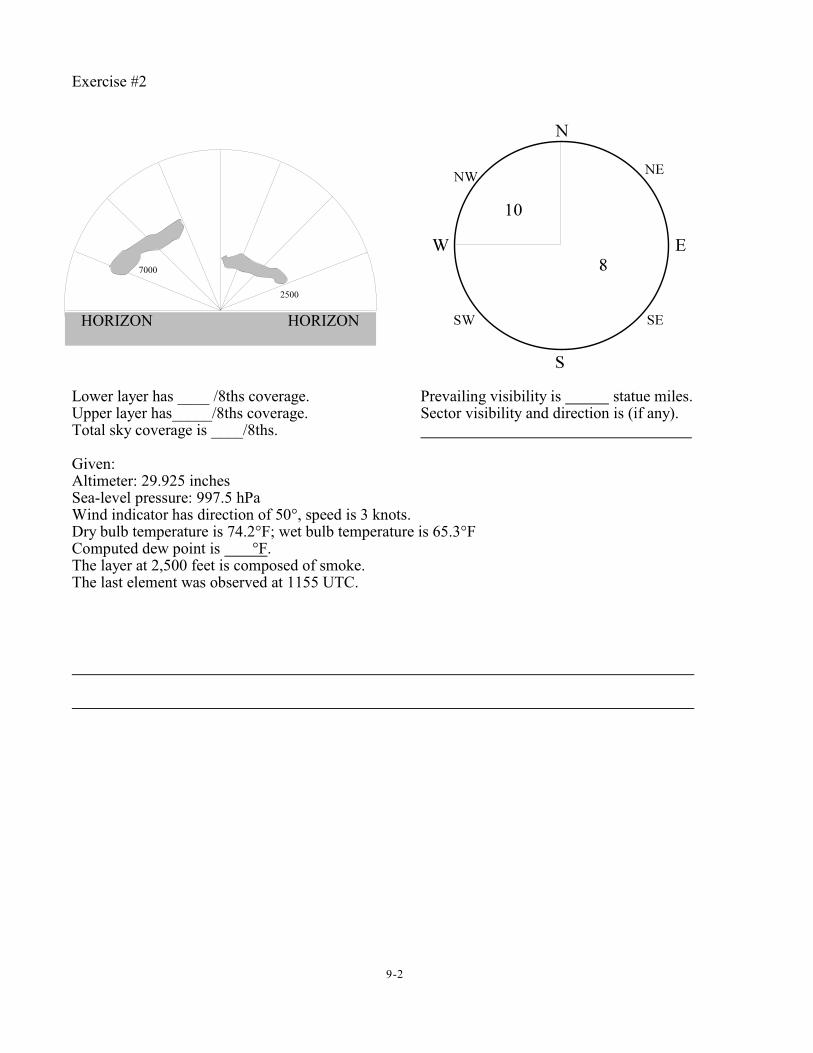
9-2
Exercise #2
Lower layer has ____ /8ths coverage. Prevailing visibility is statue miles.Upper layer has_____/8ths coverage. Sector visibility and direction is (if any).Total sky coverage is ____/8ths.
Given:Altimeter: 29.925 inchesSea-level pressure: 997.5 hPaWind indicator has direction of 50°, speed is 3 knots.Dry bulb temperature is 74.2°F; wet bulb temperature is 65.3°FComputed dew point is °F.The layer at 2,500 feet is composed of smoke.The last element was observed at 1155 UTC.
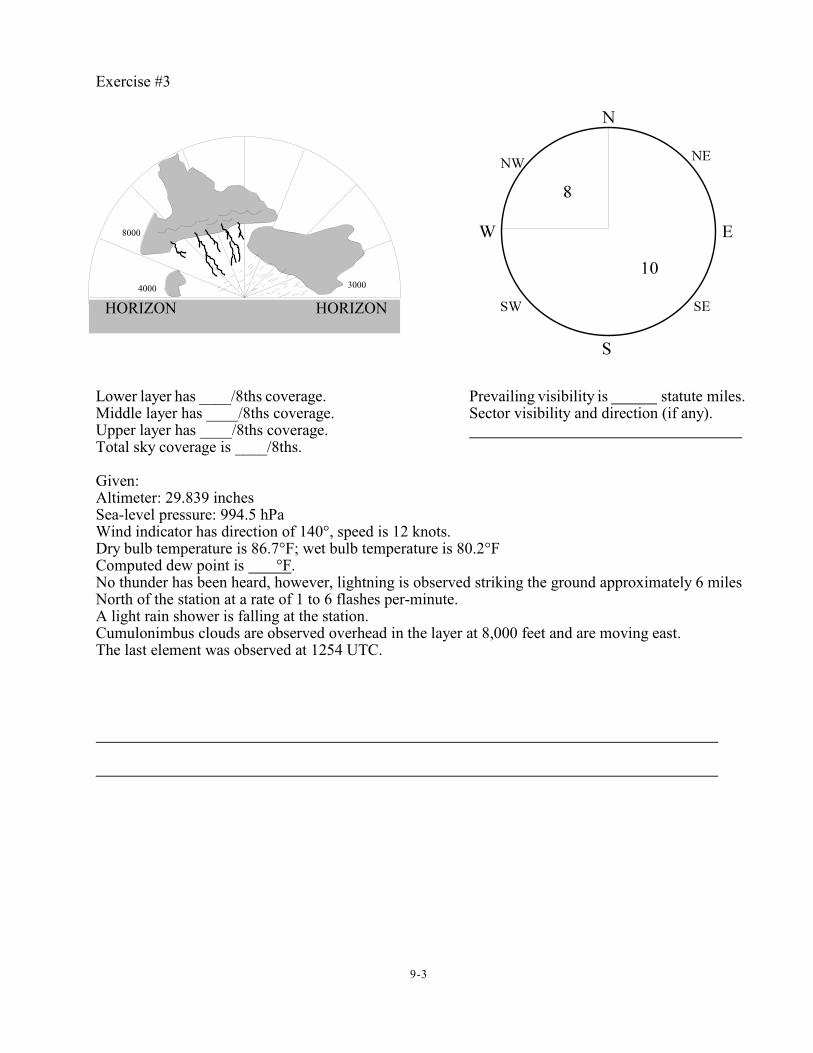
9-3
Exercise #3
Lower layer has ____/8ths coverage. Prevailing visibility is statute miles.Middle layer has ____/8ths coverage. Sector visibility and direction (if any).Upper layer has ____/8ths coverage. Total sky coverage is ____/8ths.
Given: Altimeter: 29.839 inchesSea-level pressure: 994.5 hPaWind indicator has direction of 140°, speed is 12 knots.Dry bulb temperature is 86.7°F; wet bulb temperature is 80.2°FComputed dew point is °F.No thunder has been heard, however, lightning is observed striking the ground approximately 6 milesNorth of the station at a rate of 1 to 6 flashes per-minute.A light rain shower is falling at the station.Cumulonimbus clouds are observed overhead in the layer at 8,000 feet and are moving east.The last element was observed at 1254 UTC.
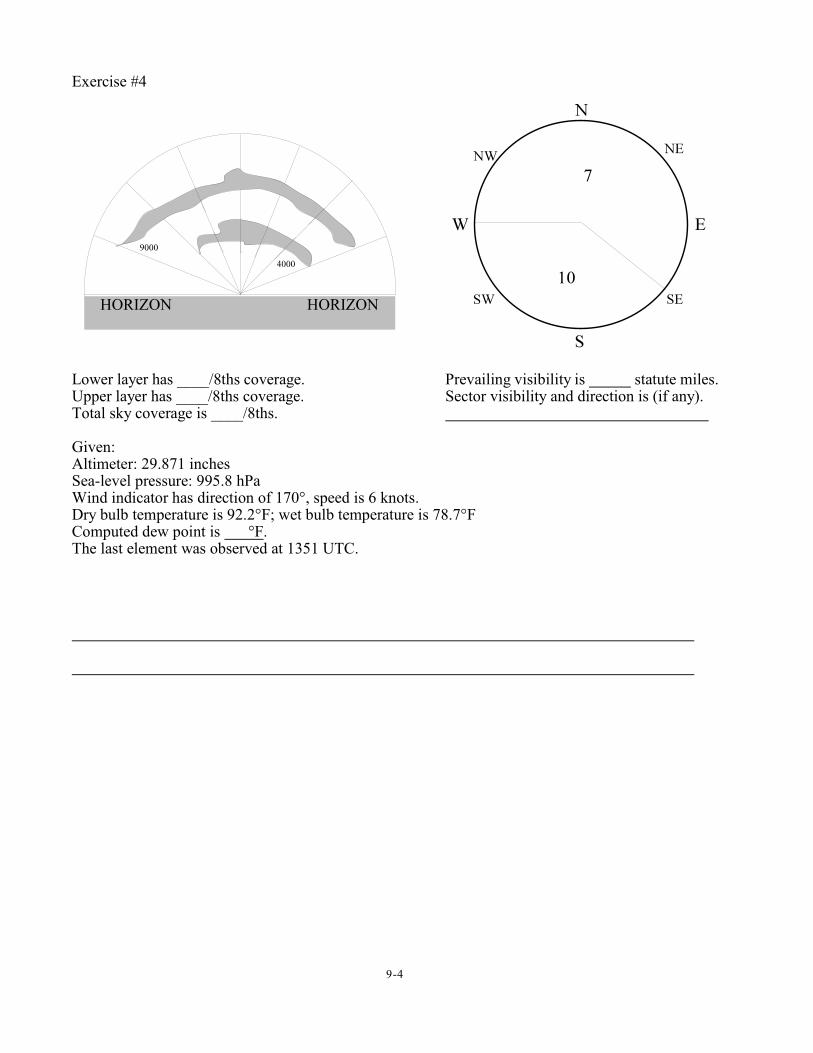
9-4
Exercise #4
Lower layer has ____/8ths coverage. Prevailing visibility is statute miles.Upper layer has ____/8ths coverage. Sector visibility and direction is (if any).Total sky coverage is ____/8ths.
Given:Altimeter: 29.871 inchesSea-level pressure: 995.8 hPaWind indicator has direction of 170°, speed is 6 knots.Dry bulb temperature is 92.2°F; wet bulb temperature is 78.7°F Computed dew point is °F.The last element was observed at 1351 UTC.
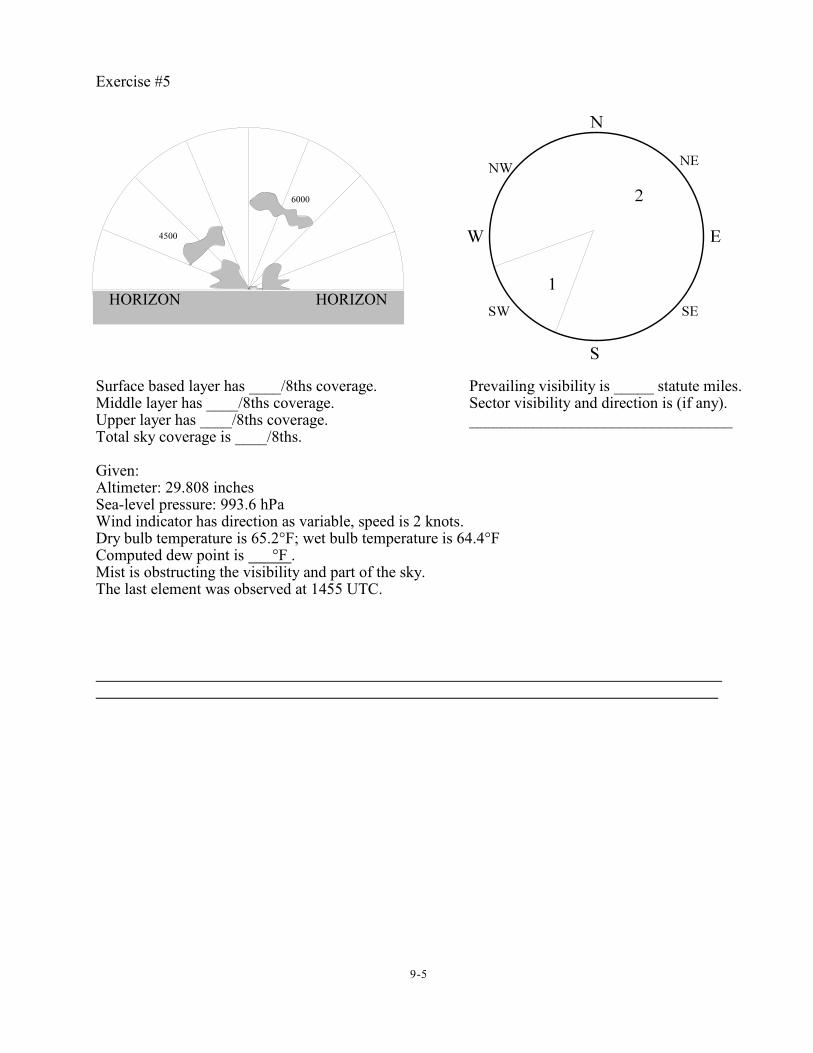
9-5
Exercise #5
Surface based layer has ____/8ths coverage. Prevailing visibility is _____ statute miles.Middle layer has ____/8ths coverage. Sector visibility and direction is (if any).Upper layer has ____/8ths coverage. _________________________________Total sky coverage is ____/8ths.
Given:Altimeter: 29.808 inchesSea-level pressure: 993.6 hPaWind indicator has direction as variable, speed is 2 knots.Dry bulb temperature is 65.2°F; wet bulb temperature is 64.4°FComputed dew point is °F .Mist is obstructing the visibility and part of the sky.The last element was observed at 1455 UTC.
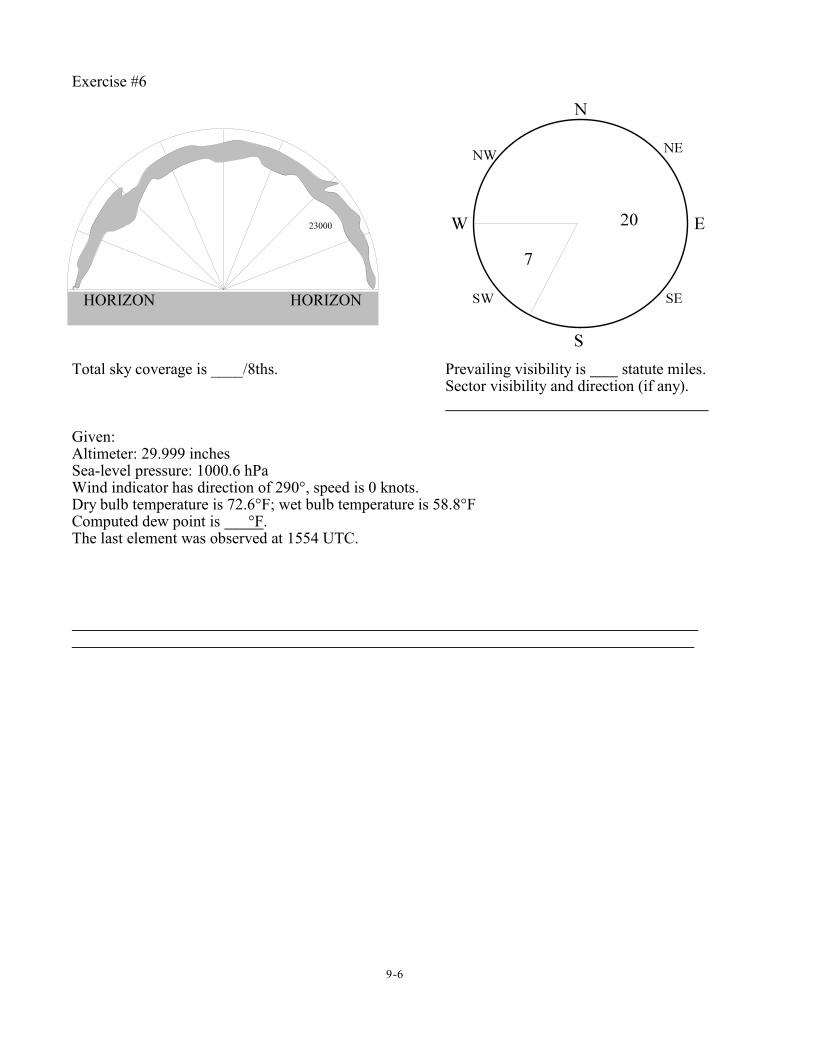
9-6
Exercise #6
Total sky coverage is ____/8ths. Prevailing visibility is statute miles.Sector visibility and direction (if any).
Given:Altimeter: 29.999 inchesSea-level pressure: 1000.6 hPaWind indicator has direction of 290°, speed is 0 knots.Dry bulb temperature is 72.6°F; wet bulb temperature is 58.8°FComputed dew point is °F.The last element was observed at 1554 UTC.
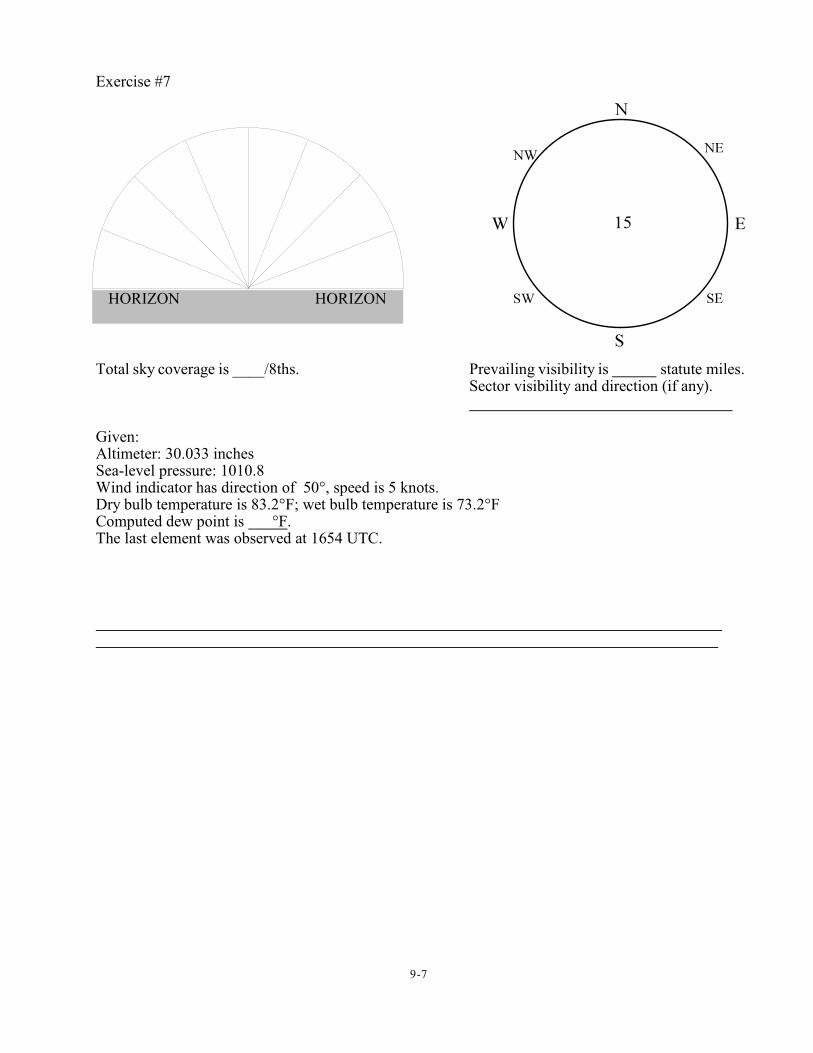
9-7
Exercise #7
Total sky coverage is ____/8ths. Prevailing visibility is statute miles.Sector visibility and direction (if any).
Given:Altimeter: 30.033 inchesSea-level pressure: 1010.8Wind indicator has direction of 50°, speed is 5 knots.Dry bulb temperature is 83.2°F; wet bulb temperature is 73.2°FComputed dew point is °F.The last element was observed at 1654 UTC.
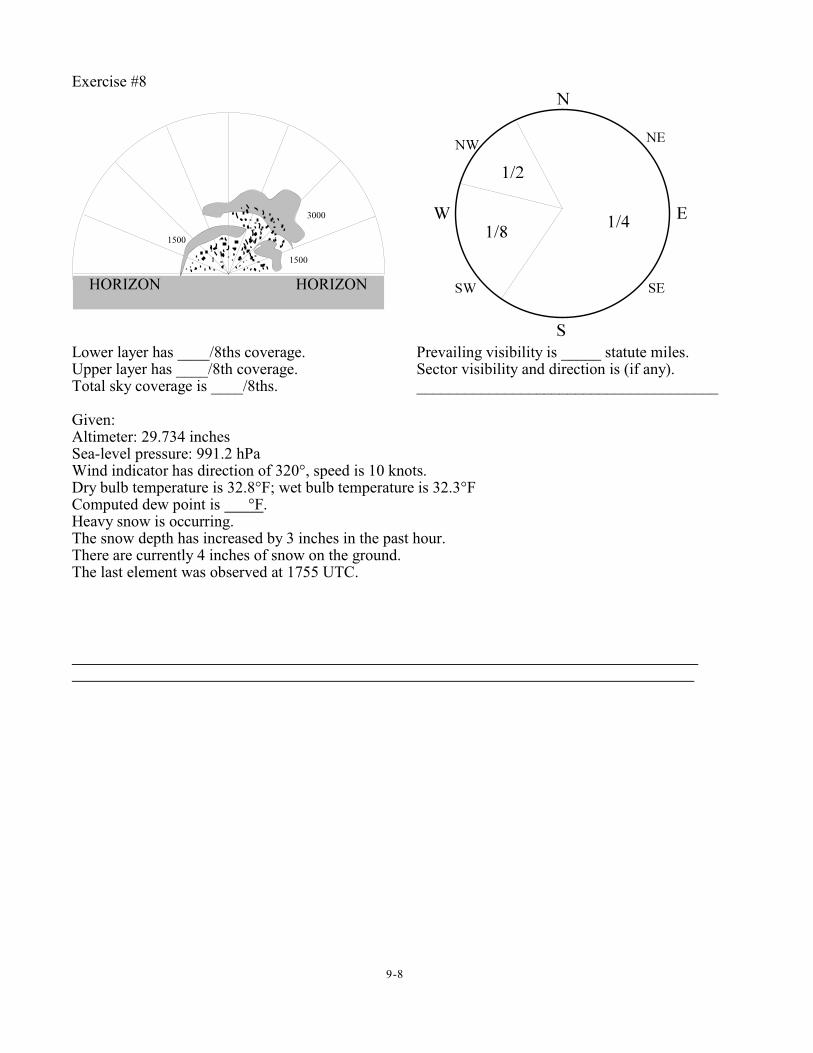
9-8
Exercise #8
Lower layer has ____/8ths coverage. Prevailing visibility is _____ statute miles.Upper layer has ____/8th coverage. Sector visibility and direction is (if any).Total sky coverage is ____/8ths. ______________________________________
Given:Altimeter: 29.734 inchesSea-level pressure: 991.2 hPaWind indicator has direction of 320°, speed is 10 knots.Dry bulb temperature is 32.8°F; wet bulb temperature is 32.3°FComputed dew point is °F.Heavy snow is occurring.The snow depth has increased by 3 inches in the past hour.There are currently 4 inches of snow on the ground.The last element was observed at 1755 UTC.
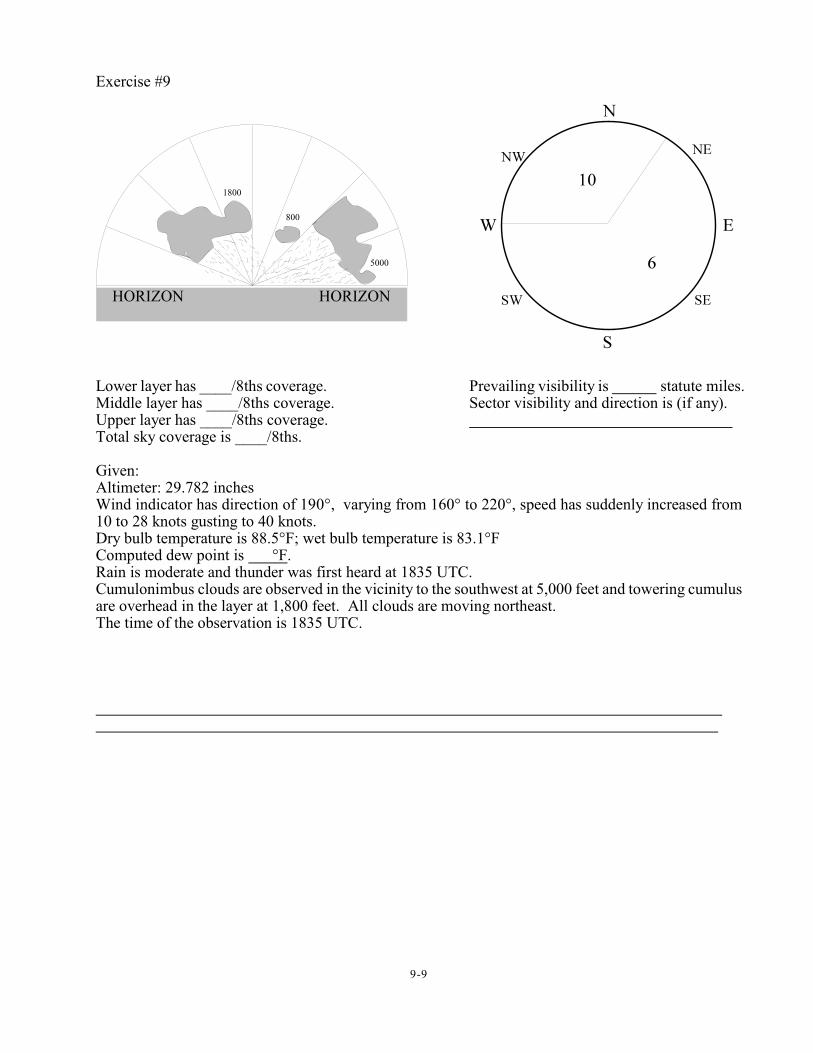
9-9
Exercise #9
Lower layer has ____/8ths coverage. Prevailing visibility is statute miles.Middle layer has ____/8ths coverage. Sector visibility and direction is (if any).Upper layer has ____/8ths coverage. Total sky coverage is ____/8ths.
Given:Altimeter: 29.782 inchesWind indicator has direction of 190°, varying from 160° to 220°, speed has suddenly increased from10 to 28 knots gusting to 40 knots.Dry bulb temperature is 88.5°F; wet bulb temperature is 83.1°FComputed dew point is °F.Rain is moderate and thunder was first heard at 1835 UTC.Cumulonimbus clouds are observed in the vicinity to the southwest at 5,000 feet and towering cumulusare overhead in the layer at 1,800 feet. All clouds are moving northeast.The time of the observation is 1835 UTC.
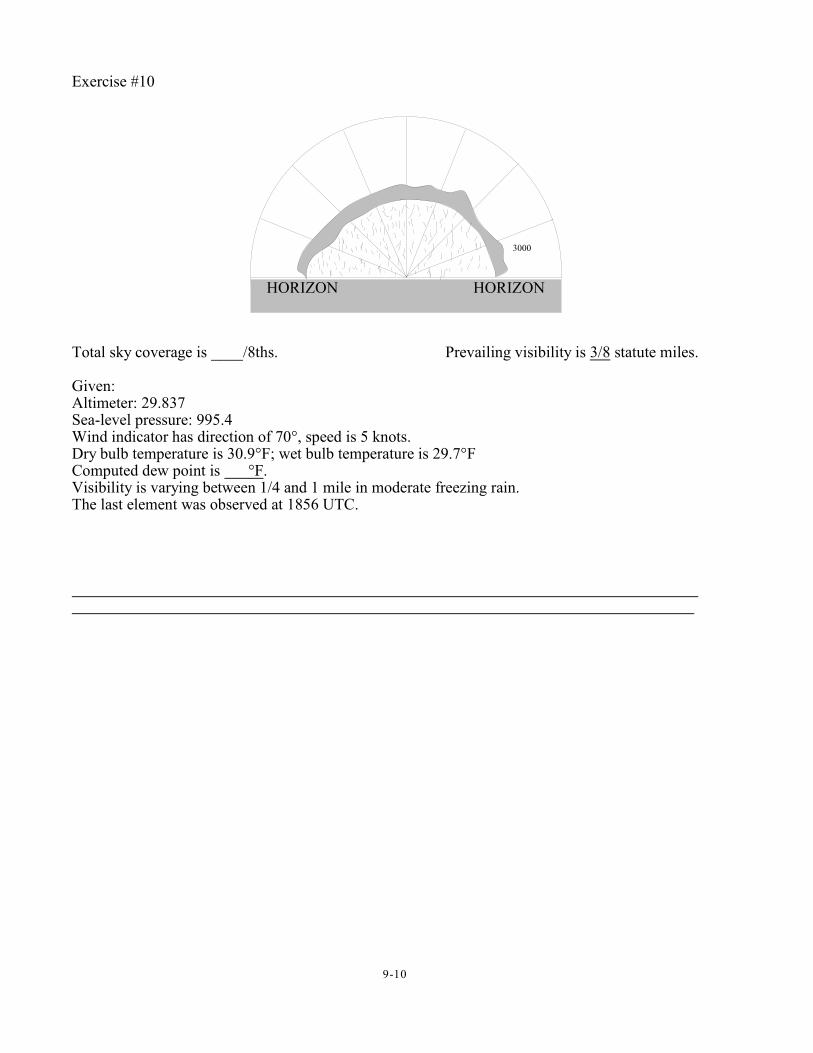
9-10
Exercise #10
Total sky coverage is ____/8ths. Prevailing visibility is 3/8 statute miles. Given:Altimeter: 29.837Sea-level pressure: 995.4Wind indicator has direction of 70°, speed is 5 knots.Dry bulb temperature is 30.9°F; wet bulb temperature is 29.7°FComputed dew point is °F.Visibility is varying between 1/4 and 1 mile in moderate freezing rain.The last element was observed at 1856 UTC.
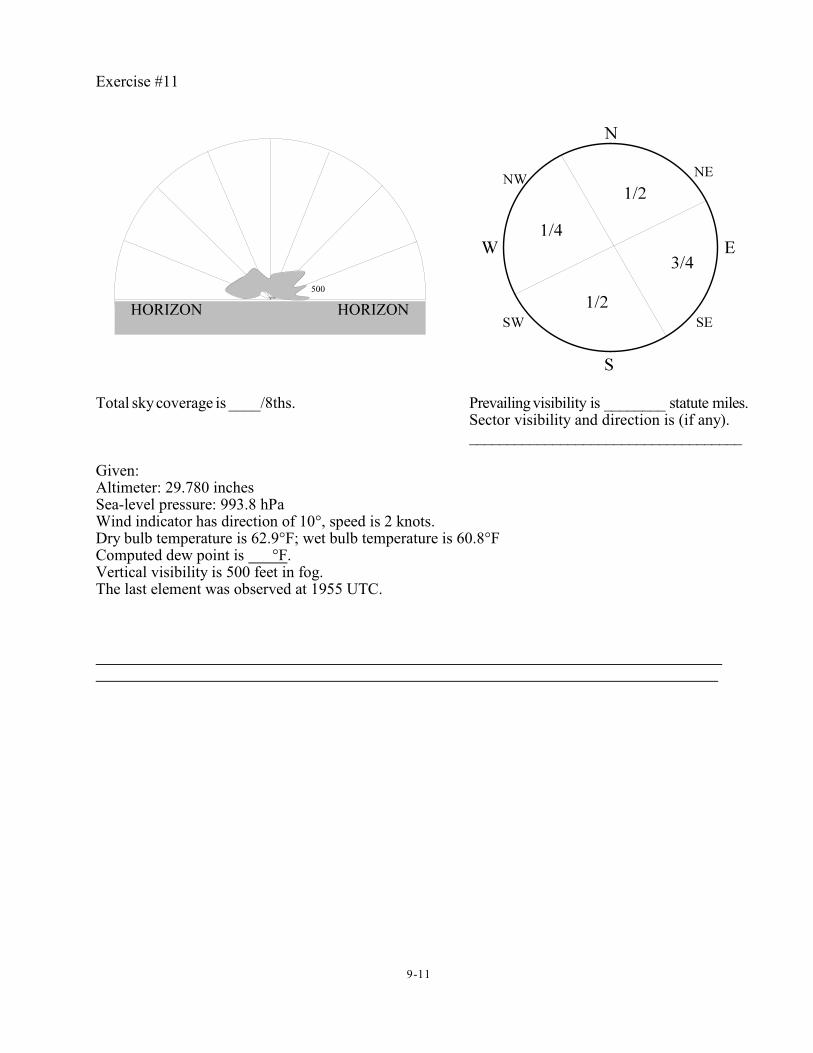
9-11
Exercise #11
Total sky coverage is ____/8ths. Prevailing visibility is ________ statute miles.Sector visibility and direction is (if any).
____________________________________
Given:Altimeter: 29.780 inchesSea-level pressure: 993.8 hPaWind indicator has direction of 10°, speed is 2 knots.Dry bulb temperature is 62.9°F; wet bulb temperature is 60.8°FComputed dew point is °F.Vertical visibility is 500 feet in fog.The last element was observed at 1955 UTC.
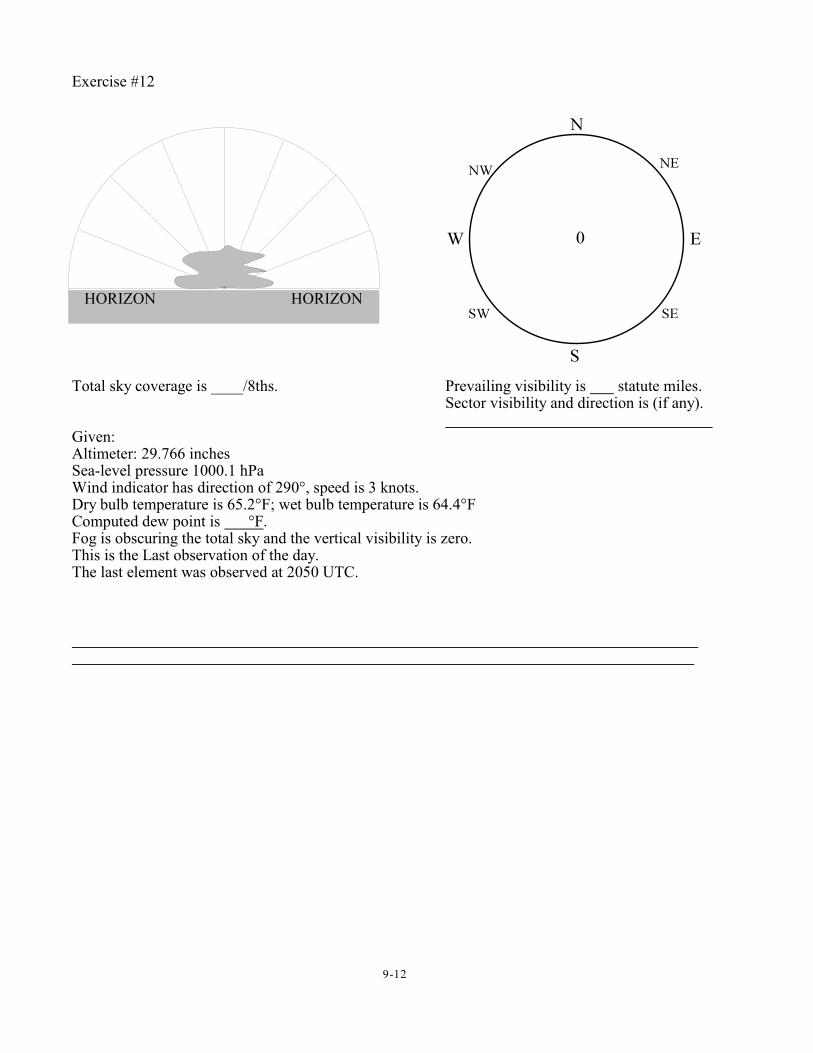
9-12
Exercise #12
Total sky coverage is ____/8ths. Prevailing visibility is statute miles.Sector visibility and direction is (if any).
Given:Altimeter: 29.766 inchesSea-level pressure 1000.1 hPaWind indicator has direction of 290°, speed is 3 knots.Dry bulb temperature is 65.2°F; wet bulb temperature is 64.4°FComputed dew point is °F.Fog is obscuring the total sky and the vertical visibility is zero.This is the Last observation of the day.The last element was observed at 2050 UTC.
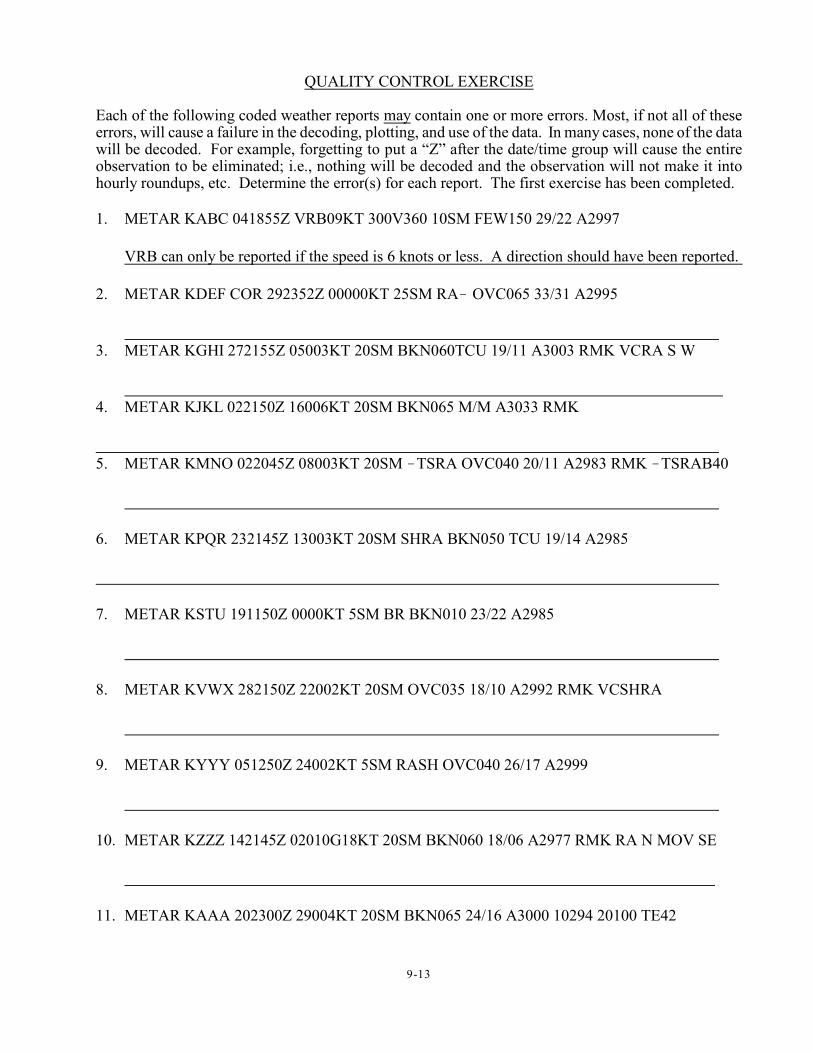
9-13
QUALITY CONTROL EXERCISE
Each of the following coded weather reports may contain one or more errors. Most, if not all of theseerrors, will cause a failure in the decoding, plotting, and use of the data. In many cases, none of the datawill be decoded. For example, forgetting to put a “Z” after the date/time group will cause the entireobservation to be eliminated; i.e., nothing will be decoded and the observation will not make it intohourly roundups, etc. Determine the error(s) for each report. The first exercise has been completed.
1. METAR KABC 041855Z VRB09KT 300V360 10SM FEW150 29/22 A2997
VRB can only be reported if the speed is 6 knots or less. A direction should have been reported.
2. METAR KDEF COR 292352Z 00000KT 25SM RA! OVC065 33/31 A2995
3. METAR KGHI 272155Z 05003KT 20SM BKN060TCU 19/11 A3003 RMK VCRA S W
4. METAR KJKL 022150Z 16006KT 20SM BKN065 M/M A3033 RMK
5. METAR KMNO 022045Z 08003KT 20SM !TSRA OVC040 20/11 A2983 RMK !TSRAB40
6. METAR KPQR 232145Z 13003KT 20SM SHRA BKN050 TCU 19/14 A2985
7. METAR KSTU 191150Z 0000KT 5SM BR BKN010 23/22 A2985
8. METAR KVWX 282150Z 22002KT 20SM OVC035 18/10 A2992 RMK VCSHRA
9. METAR KYYY 051250Z 24002KT 5SM RASH OVC040 26/17 A2999
10. METAR KZZZ 142145Z 02010G18KT 20SM BKN060 18/06 A2977 RMK RA N MOV SE
11. METAR KAAA 202300Z 29004KT 20SM BKN065 24/16 A3000 10294 20100 TE42
9-14
12. METAR KBBB 010052Z COR 19025G35KT 160V220 6SM TSRA SQ FEW008 SCT018TCUBKN050CB 31/28 A2983 RMK WSHFT 25 TS SW TCU OHD MOV NE
13. METAR KCCC 051951Z 00000KT 25SM 065BKN OVC100 29/20 A3045
14. METAR KDDD 152247Z VAR04KT 15SM BKN250 30/22 A2999
15. METAR KEEE 1619150Z 22007KT 7SM SCT025 BKN100 OVC200 25/20 A3002
16. METAR KFFF 312148Z 36005KT 1 1/2 !RA BR BKN005 62/60 A3000
17. METAR KGGG 302055Z 02010G27 1/4SM RA FG SCT002 BKN030 25/25 A2966
18. METAR KHHH 301945Z 05012KT 30SM SCT065 26/M A3034
19. METAR KIII 300748 07005KT 15SM SKC 8/7 A3019
20. METAR KJJJ 281145Z 3508KT 3SM BR BKN025 25/23 A2955
9-15
21. METAR KKKK 282045Z E29006KT 7SM FEW045 SCT110 BKN200 13/10 A3005
22. METAR KLLL 032150Z 18004KT 20SM BKN050 27/09 RMK A3012 VCTS RA N
23. METAR KMMM 141350Z VRB03KT 21/2SM BR BKN005 20/20 A2966
24. METAR KNNN 031246Z 30SM 00000KT FEW180 32/25 A3015
25. METAR KOOO 161645Z VRB04KT 4SM TSHZ BKN060CB 33/28 A2997
26. METAR KPPP 071247Z 00000KT 3/8SM R21S/1400 FG BKN003 OVC015 25/25 A2988
27. METAR KQQQ 192050Z 13010KT 080V170 FEW080 BKN050 30/25 A2991
28. METAR KRRR 271350Z 01010KT 20SM BKN080 16/12 A3013 RMK SLP192 T10580121
29. METAR KSSS 051456 24012KT 3SM FG OVC006 23/22 A2984
30. METAR KTTT 301250Z 06009KT 1SM BR 0VC003 24/24 A3005
31. METAR KUUU 281104Z 23007KT 1/4SM RVRNO FG OVC001 27/27 A2999
9-16
32. METAR KVVV 282247Z VRB05 15SM SHVC FEW20 SCT45 BKN80 BKN150 22/19 3024 RMK OCN L LTGCG NE
33. METAR KWWW 141447Z 11008KT 50SM FEW050 FEW180 18/21 A3021
34. METAR KXXX 312150Z 35006KT 20SM FEW030 SCT070 BKN150 29/15/A3019
35. METAR KYYY 071050Z 32006KT 6SM !R BR SCT030 BKN050 26/24 A3006
36. METAR KZZZ 022048Z 10014G21KT !SHRA 25SM BKN080TCU 29/22 A2985
37. METAR KAAA 261654Z 00000KT 10SM !TS SCT015CB BKN035 28/23 A3009 RMK TSNE MOV E
38. METAR KBBB 030945Z OOOOOKT 3SM BR HZ FEW040CU FEW100 20/ A2988 VIRGASW FIRST
39. METAR KCCC 281047Z 19003KT BCFG SCT000 BKN022 17/16 A2988 RMK SCT000 VIS 1/4V3/
40. METAR KDDD 032255Z VRB24G30KT 260V330 15SM BKN035 BKN100 OVC250 25/19A3045
41. METAR KEEE 231850Z 00000KT 35SM TS SCT050CB SCT100 2708 A3035 RMK TS WMOV S
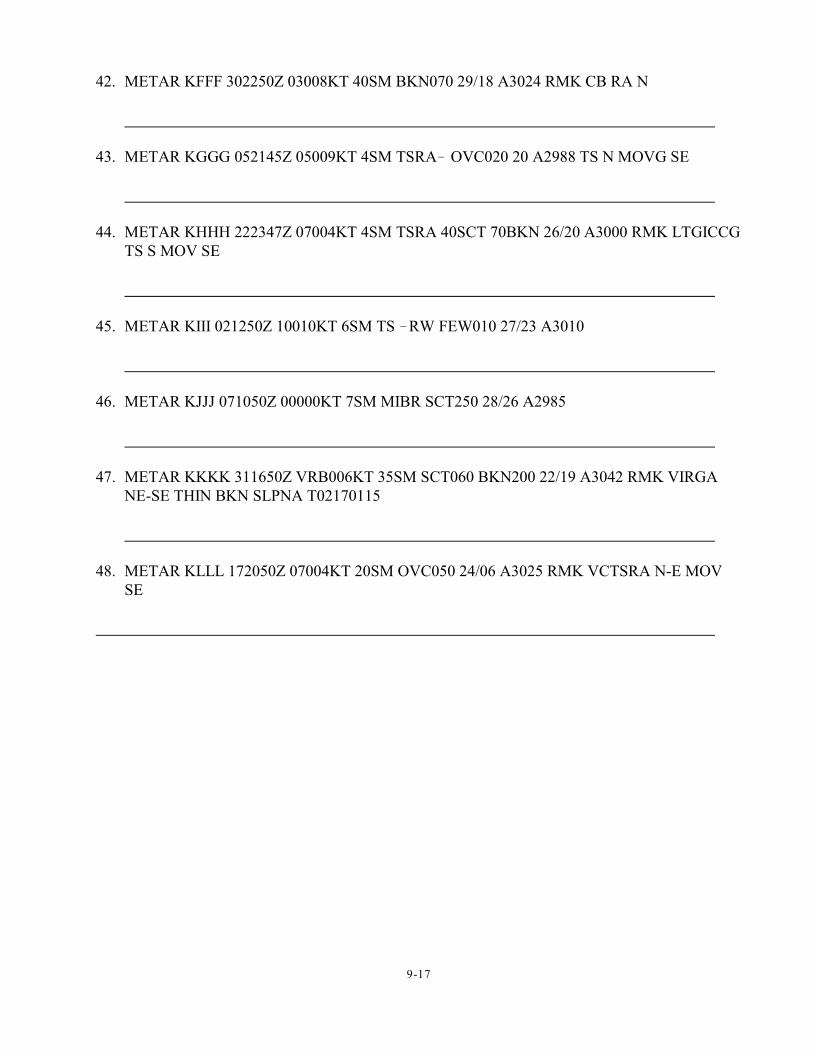
9-17
42. METAR KFFF 302250Z 03008KT 40SM BKN070 29/18 A3024 RMK CB RA N
43. METAR KGGG 052145Z 05009KT 4SM TSRA! OVC020 20 A2988 TS N MOVG SE
44. METAR KHHH 222347Z 07004KT 4SM TSRA 40SCT 70BKN 26/20 A3000 RMK LTGICCGTS S MOV SE
45. METAR KIII 021250Z 10010KT 6SM TS !RW FEW010 27/23 A3010
46. METAR KJJJ 071050Z 00000KT 7SM MIBR SCT250 28/26 A2985
47. METAR KKKK 311650Z VRB006KT 35SM SCT060 BKN200 22/19 A3042 RMK VIRGANE-SE THIN BKN SLPNA T02170115
48. METAR KLLL 172050Z 07004KT 20SM OVC050 24/06 A3025 RMK VCTSRA N-E MOVSE
A-1
APPENDIX A
ANSWERS TO CHAPTER and REVIEW EXERCISES
CHAPTER 1 - GENERAL
1. a. METAR
b. SPECI
2. You must allow time for your eyes to become adjusted to the darkness.
3. If instructions are inappropriate because they are incomplete or do not cover the situation observed,follow the instructions given as closely as possible but exercise your judgment as to what shouldbe reported. WSOH #7 and #8 give minimum requirements.
4. Daily at part-time stations, or once every shift at full-time stations or if there is an aircraft mishap.
5. 90 days is the minimum. SAWRS, however, are encouraged to keep them until visited by an NWSrepresentative. If these forms are available, the NWS representative will be better able to help youimprove your observation program.
6. The lower of the two reportable values. This is done in the interest of safety.
7. a. UTC
8. Only if a METAR or SPECI observation was taken between the occurrences of the aircraft mishapand the time you were notified. If this should happen, it would be to your advantage to enter thetime of notification, in column 65 (e.g., Notified of ACFT MSHP at 1703).
9. d. drawing a line through the erroneous entry and entering the correct data in black.
10. 24-hour
11. a. METAR
12. c. 2, the body of the report and the remarks
13. d. 2, the body of the report and the remarks
14. - wind speed is 15 kt while the wind direction changes by 60 degrees in 10 minutes- a tornado is observed- thunderstorm begins- the ceiling changes from 3,000 ft to 2,500 ft AGL- a new cloud layer is observed below 1,000 ft AGL- an aircraft mishap occurs- squalls occur
15. a. volcanic eruptions
A-2
16. a. METAR
17. b. second
18. d. four
19. d. both METAR and SPECI
20. c time the last element is observed
21. c. when the criteria for a SPECI are met or noted
22. a. same time used in the report being corrected
23. a. 011001Z b. 091755Zc. 152045Zd. 300113Zc. 071625Z
24. d. COR
25. 15
26. b. superseded by a later report
27. (FIBI)
28. c. must be certified by the National Weather Service
29. 3 8 6 1 7 4 10 5 9 2 11
30. c. omitted from the report
31. b. LST.
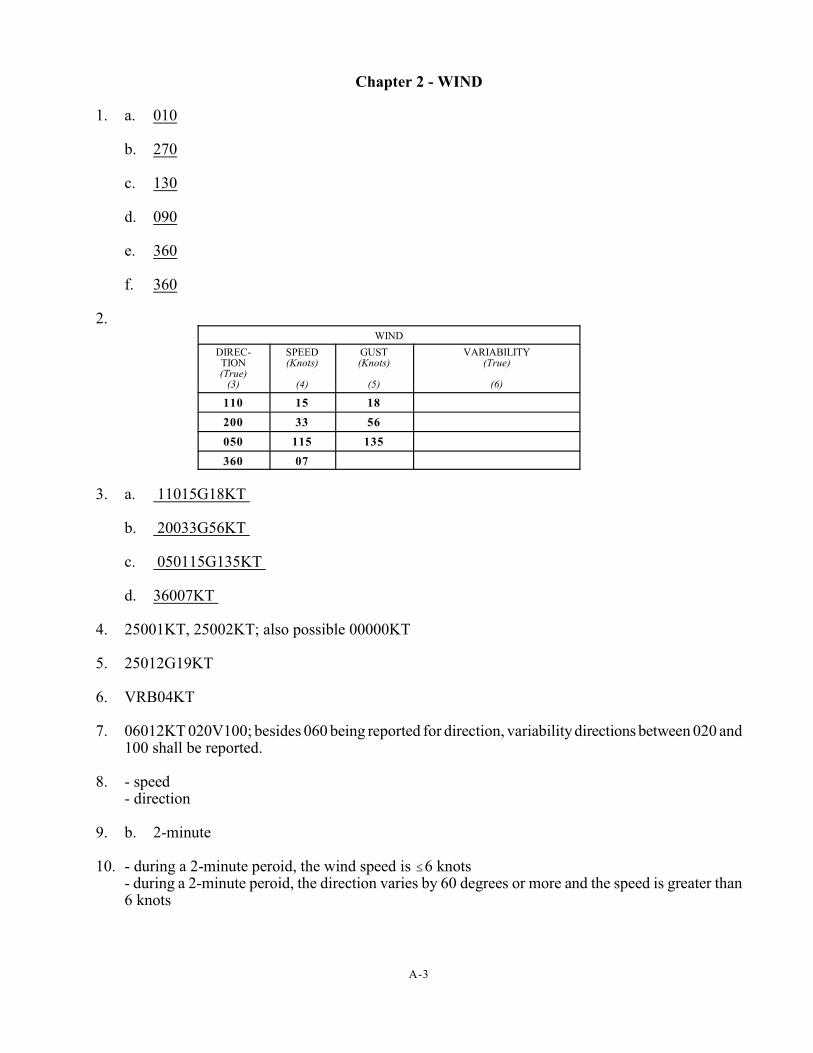
A-3
Chapter 2 - WIND
1. a. 010
b. 270
c. 130
d. 090
e. 360
f. 360
2.WIND
DIREC-TION(True)
(3)
SPEED(Knots)
(4)
GUST(Knots)
(5)
VARIABILITY(True)
(6)
110 15 18
200 33 56
050 115 135
360 07
3. a. 11015G18KT
b. 20033G56KT
c. 050115G135KT
d. 36007KT
4. 25001KT, 25002KT; also possible 00000KT
5. 25012G19KT
6. VRB04KT
7. 06012KT 020V100; besides 060 being reported for direction, variability directions between 020 and100 shall be reported.
8. - speed- direction
9. b. 2-minute
10. - during a 2-minute peroid, the wind speed is #6 knots- during a 2-minute peroid, the direction varies by 60 degrees or more and the speed is greater than6 knots
A-4
11. - a change in wind direction of 45 degrees or more- the change occurs in less than 15 minutes- wind speeds during the change are at least 10 knots
12. b. in the remarks section of METAR and SPECI reports
13. 10
14. 10
15. c. tens of degrees and knots
16. d. PK WND 09036/45
17. c. 25G30
18. b. 36008KT
19. c. squalls
20. d. 27032G44KT SQ (in present weather)
21. a. 00000KT
22. a. 24009KT
23. d. WSHFT 30 FROPA
24. c. the duration of the increased wind speed
25. c. VRB04KT
26. d. none of the above
27. b. 125
28. d. 10
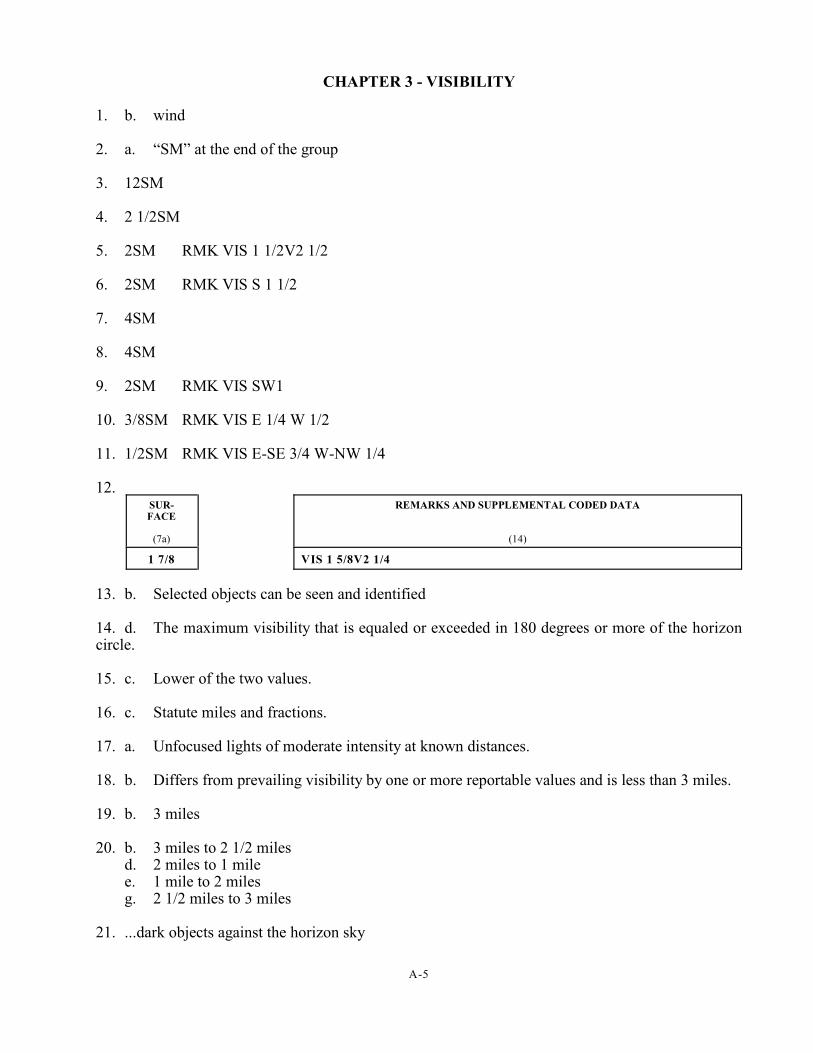
A-5
CHAPTER 3 - VISIBILITY
1. b. wind
2. a. “SM” at the end of the group
3. 12SM
4. 2 1/2SM
5. 2SM RMK VIS 1 1/2V2 1/2
6. 2SM RMK VIS S 1 1/2
7. 4SM
8. 4SM
9. 2SM RMK VIS SW1
10. 3/8SM RMK VIS E 1/4 W 1/2
11. 1/2SM RMK VIS E-SE 3/4 W-NW 1/4
12.SUR-FACE
(7a)
REMARKS AND SUPPLEMENTAL CODED DATA
(14)
1 7/8 VIS 1 5/8V2 1/4
13. b. Selected objects can be seen and identified
14. d. The maximum visibility that is equaled or exceeded in 180 degrees or more of the horizoncircle.
15. c. Lower of the two values.
16. c. Statute miles and fractions.
17. a. Unfocused lights of moderate intensity at known distances.
18. b. Differs from prevailing visibility by one or more reportable values and is less than 3 miles.
19. b. 3 miles
20. b. 3 miles to 2 1/2 milesd. 2 miles to 1 milee. 1 mile to 2 milesg. 2 1/2 miles to 3 miles
21. ...dark objects against the horizon sky
A-6
...unfocused lights of moderate intensity22. visibility is less than 3 miles
visibility is rapidly increasing and decreasing by 1/2 mile or more
23. You must allow time for your eyes to become adjusted to the darkness.
24. b. after the visibility
25. -the prevailing visibility is 1 statute mile or less-the RVR is reported in the body of a METAR/SPECI report
26. R22/2400FT
27. R02L/0600FT
28. No RVR is coded
29. No RVR is coded
30. b. as many locations as practicable.
31. b. SFC VIS = 3, TWR VIS = 2
32. b. Column 8: nothing required; Column 14: RVRNO
33. d. all of the above.
34. b. 3 to 15
35. b. 3/8
36. c. 2 3/4SM
37. d. the average of all observed values.
38. b. 2 1/4SM
39. d. 7/16
40. a. 8
A-7
CHAPTER 4 - PRESENT WEATHER
1. c. Light (!), Moderate ( ), Heavy (+)
2. c. “Heavy rain showers”
3. c. Shallow fog
4. a. Blowing snow
5. b. Thunderstorm, heavy rain, and hail
6. a. Low drifting snow
7. b. Patchy fog
8. b. Showers in the vicinity
9. c. Heavy freezing rain
10. b. Thunderstorm, light rain, and haze
11. c. Thunderstorm, moderate rain, and ice pellets
12. c. Thunderstorm, moderate rain, and small hail
13. a. Light freezing rain and snow
14. b. Volcanic ash and smoke
15. c. Low drifting dust
16. a. Blowing sand
17. a. Blowing spray
18. c. Moderate ice pellet showers
19. b. Partial fog
20. - precipitation- obscuration- well-developed dust/sand whirls- tornadic activity- sandstorm- duststorm
21. b. vicinity
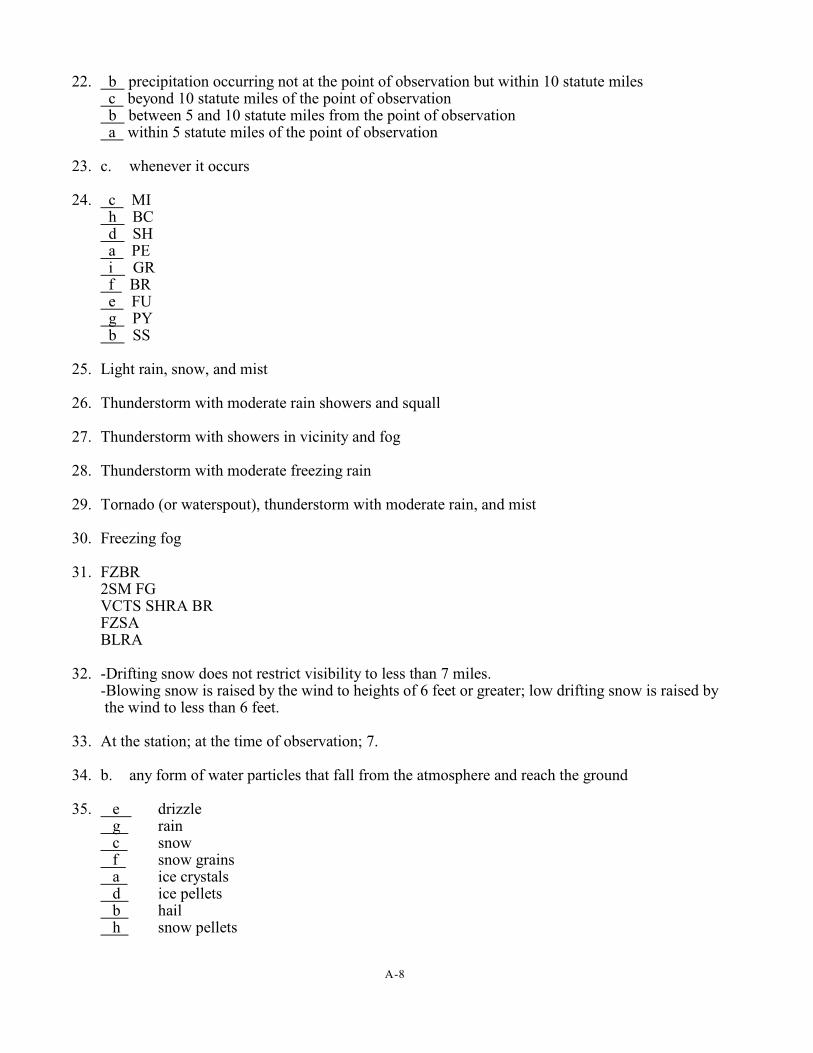
A-8
22. b precipitation occurring not at the point of observation but within 10 statute miles c beyond 10 statute miles of the point of observation b between 5 and 10 statute miles from the point of observation a within 5 statute miles of the point of observation
23. c. whenever it occurs
24. c MI h BC d SH a PE i GR f BR e FU g PY b SS
25. Light rain, snow, and mist
26. Thunderstorm with moderate rain showers and squall
27. Thunderstorm with showers in vicinity and fog
28. Thunderstorm with moderate freezing rain
29. Tornado (or waterspout), thunderstorm with moderate rain, and mist
30. Freezing fog
31. FZBR2SM FGVCTS SHRA BRFZSABLRA
32. -Drifting snow does not restrict visibility to less than 7 miles.-Blowing snow is raised by the wind to heights of 6 feet or greater; low drifting snow is raised by the wind to less than 6 feet.
33. At the station; at the time of observation; 7.
34. b. any form of water particles that fall from the atmosphere and reach the ground
35. e drizzle g rain c snow f snow grains a ice crystals d ice pellets b hail h snow pellets
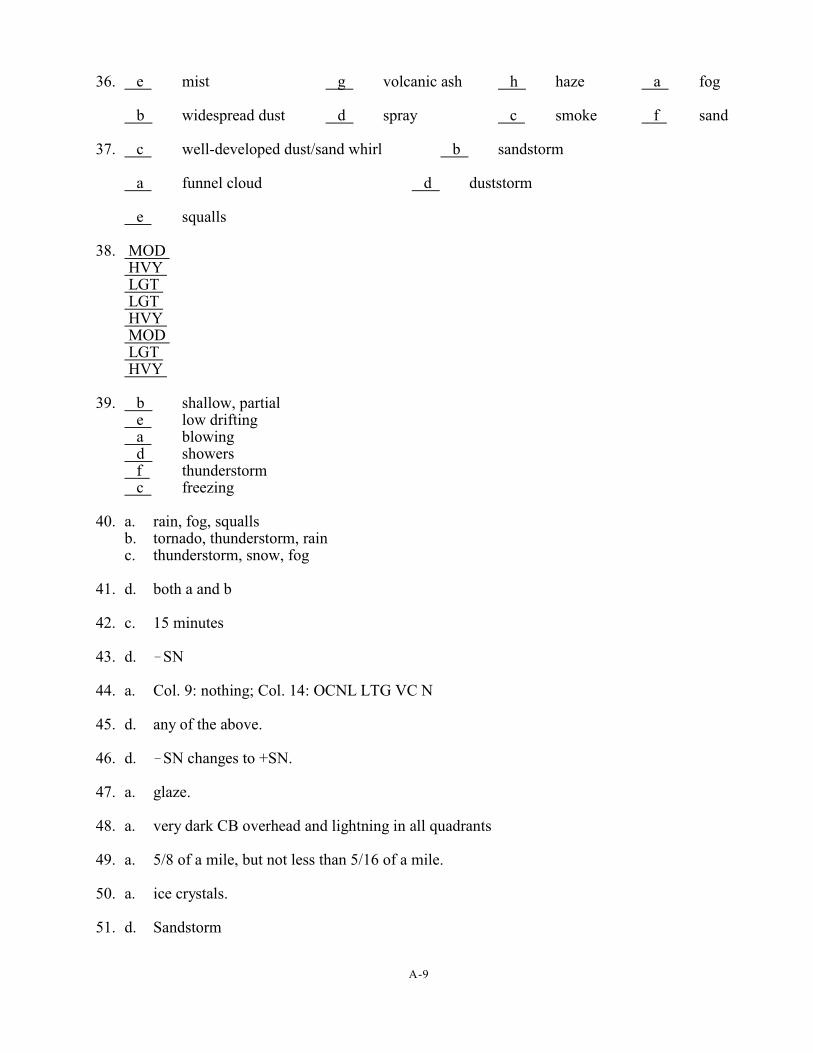
A-9
36. e mist g volcanic ash h haze a fog
b widespread dust d spray c smoke f sand
37. c well-developed dust/sand whirl b sandstorm
a funnel cloud d duststorm
e squalls
38. MOD HVY LGT LGT HVY MOD LGT HVY
39. b shallow, partial e low drifting a blowing d showers f thunderstorm c freezing
40. a. rain, fog, squallsb. tornado, thunderstorm, rainc. thunderstorm, snow, fog
41. d. both a and b
42. c. 15 minutes
43. d. !SN
44. a. Col. 9: nothing; Col. 14: OCNL LTG VC N
45. d. any of the above.
46. d. !SN changes to +SN.
47. a. glaze.
48. a. very dark CB overhead and lightning in all quadrants
49. a. 5/8 of a mile, but not less than 5/16 of a mile.
50. a. ice crystals.
51. d. Sandstorm
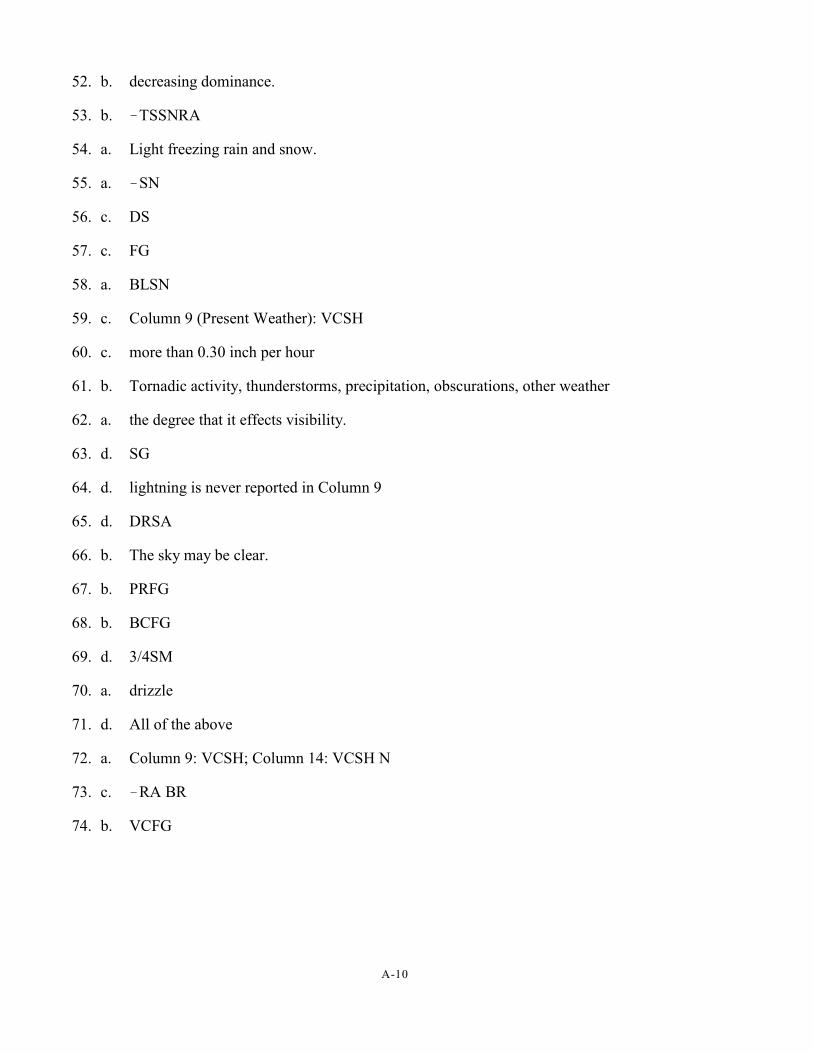
A-10
52. b. decreasing dominance.
53. b. !TSSNRA
54. a. Light freezing rain and snow.
55. a. !SN
56. c. DS
57. c. FG
58. a. BLSN
59. c. Column 9 (Present Weather): VCSH
60. c. more than 0.30 inch per hour
61. b. Tornadic activity, thunderstorms, precipitation, obscurations, other weather
62. a. the degree that it effects visibility.
63. d. SG
64. d. lightning is never reported in Column 9
65. d. DRSA
66. b. The sky may be clear.
67. b. PRFG
68. b. BCFG
69. d. 3/4SM
70. a. drizzle
71. d. All of the above
72. a. Column 9: VCSH; Column 14: VCSH N
73. c. !RA BR
74. b. VCFG
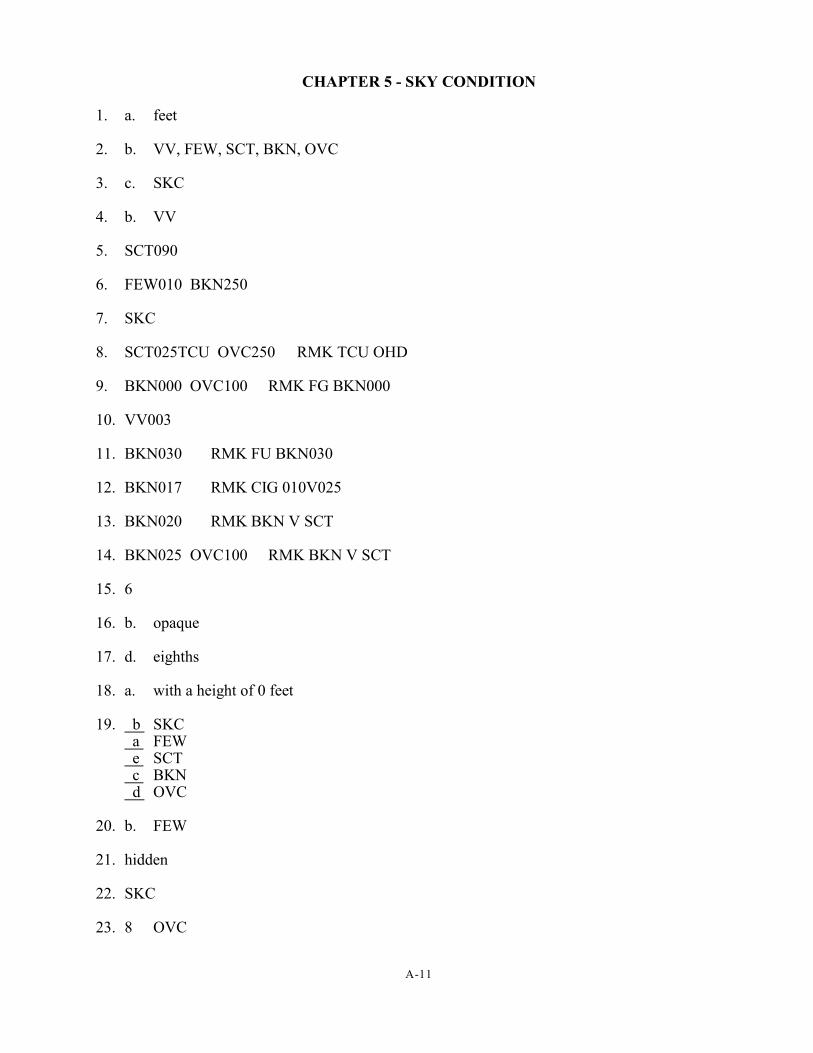
A-11
CHAPTER 5 - SKY CONDITION
1. a. feet
2. b. VV, FEW, SCT, BKN, OVC
3. c. SKC
4. b. VV
5. SCT090
6. FEW010 BKN250
7. SKC
8. SCT025TCU OVC250 RMK TCU OHD
9. BKN000 OVC100 RMK FG BKN000
10. VV003
11. BKN030 RMK FU BKN030
12. BKN017 RMK CIG 010V025
13. BKN020 RMK BKN V SCT
14. BKN025 OVC100 RMK BKN V SCT
15. 6
16. b. opaque
17. d. eighths
18. a. with a height of 0 feet
19. b SKC a FEW e SCT c BKN d OVC
20. b. FEW
21. hidden
22. SKC
23. 8 OVC
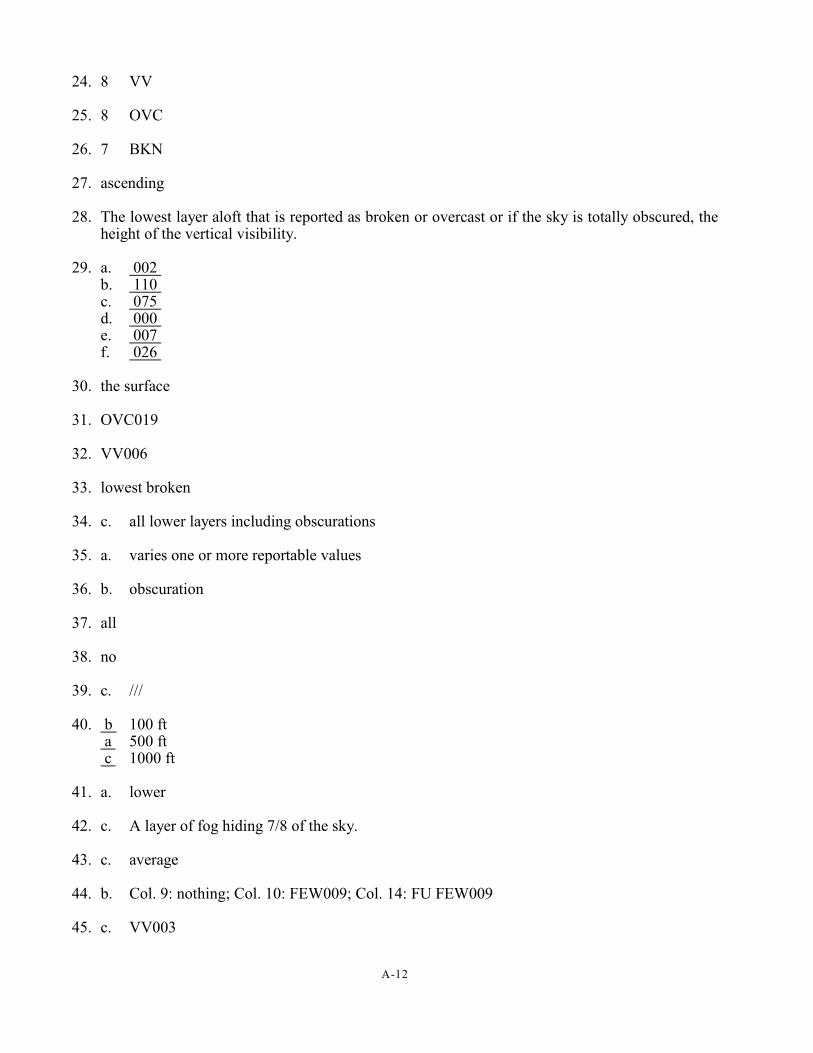
A-12
24. 8 VV
25. 8 OVC
26. 7 BKN
27. ascending
28. The lowest layer aloft that is reported as broken or overcast or if the sky is totally obscured, theheight of the vertical visibility.
29. a. 002 b. 110 c. 075 d. 000 e. 007 f. 026
30. the surface
31. OVC019
32. VV006
33. lowest broken
34. c. all lower layers including obscurations
35. a. varies one or more reportable values
36. b. obscuration
37. all
38. no
39. c. ///
40. b 100 ft a 500 ft c 1000 ft
41. a. lower
42. c. A layer of fog hiding 7/8 of the sky.
43. c. average
44. b. Col. 9: nothing; Col. 10: FEW009; Col. 14: FU FEW009
45. c. VV003
A-13
46. a. the whole sky including the obstructed portion.
47. a. SCT000 BKN005 OVC010 with the remark, BR SCT000.
48. b. OVC040
49. b. convective cloud height diagram.
50. b. a layer of mist hiding 6/8 of the sky

A-14
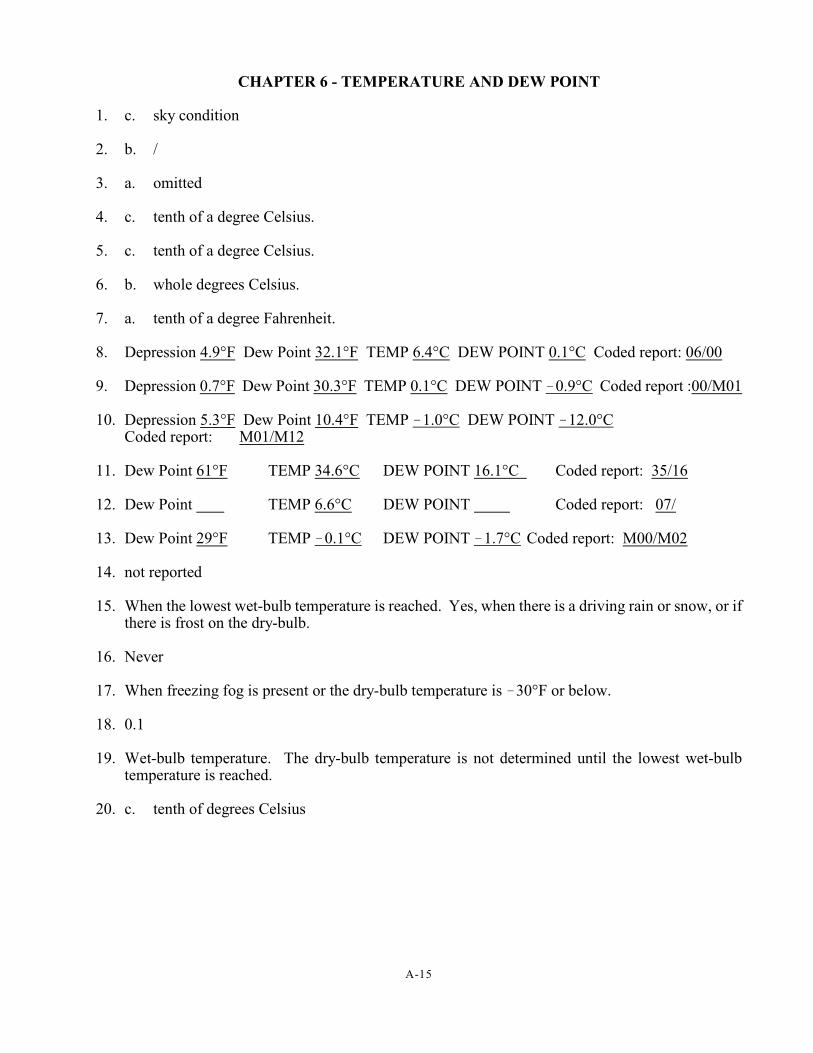
A-15
CHAPTER 6 - TEMPERATURE AND DEW POINT
1. c. sky condition
2. b. /
3. a. omitted
4. c. tenth of a degree Celsius.
5. c. tenth of a degree Celsius.
6. b. whole degrees Celsius.
7. a. tenth of a degree Fahrenheit.
8. Depression 4.9°F Dew Point 32.1°F TEMP 6.4°C DEW POINT 0.1°C Coded report: 06/00
9. Depression 0.7°F Dew Point 30.3°F TEMP 0.1°C DEW POINT !0.9°C Coded report :00/M01
10. Depression 5.3°F Dew Point 10.4°F TEMP !1.0°C DEW POINT !12.0°CCoded report: M01/M12
11. Dew Point 61°F TEMP 34.6°C DEW POINT 16.1°C Coded report: 35/16
12. Dew Point TEMP 6.6°C DEW POINT Coded report: 07/
13. Dew Point 29°F TEMP !0.1°C DEW POINT !1.7°C Coded report: M00/M02
14. not reported
15. When the lowest wet-bulb temperature is reached. Yes, when there is a driving rain or snow, or ifthere is frost on the dry-bulb.
16. Never
17. When freezing fog is present or the dry-bulb temperature is !30°F or below.
18. 0.1
19. Wet-bulb temperature. The dry-bulb temperature is not determined until the lowest wet-bulbtemperature is reached.
20. c. tenth of degrees Celsius

A-16
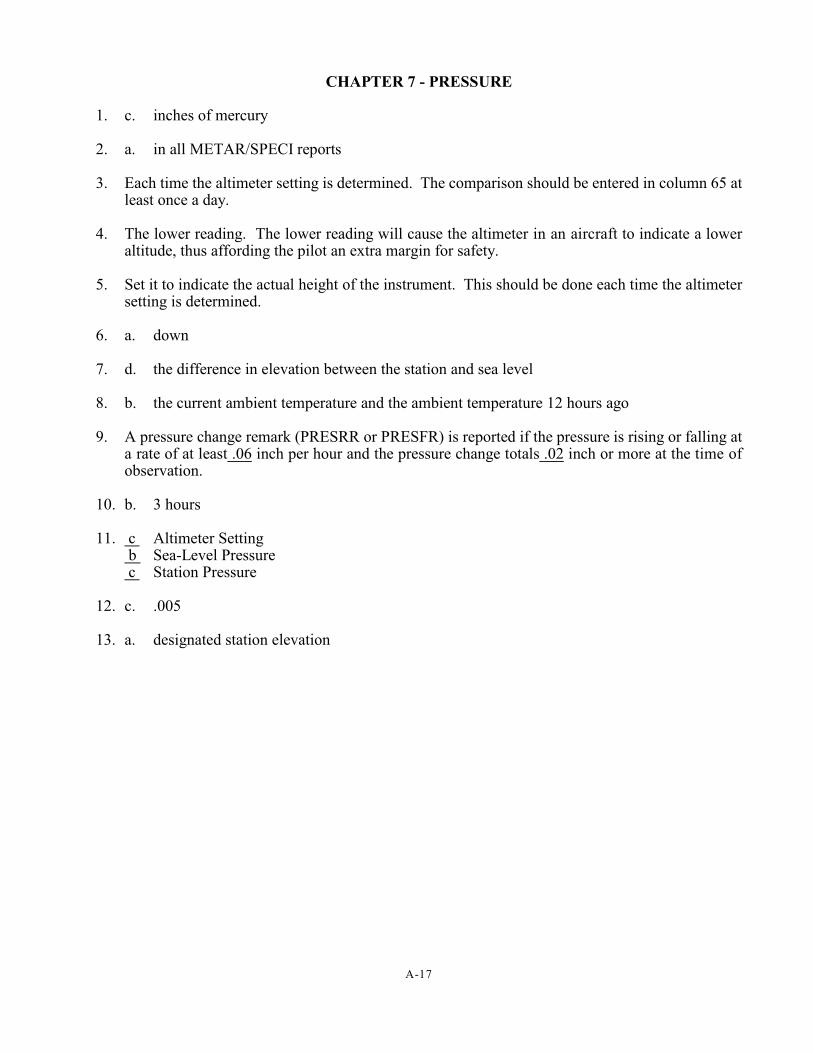
A-17
CHAPTER 7 - PRESSURE
1. c. inches of mercury
2. a. in all METAR/SPECI reports
3. Each time the altimeter setting is determined. The comparison should be entered in column 65 atleast once a day.
4. The lower reading. The lower reading will cause the altimeter in an aircraft to indicate a loweraltitude, thus affording the pilot an extra margin for safety.
5. Set it to indicate the actual height of the instrument. This should be done each time the altimetersetting is determined.
6. a. down
7. d. the difference in elevation between the station and sea level
8. b. the current ambient temperature and the ambient temperature 12 hours ago
9. A pressure change remark (PRESRR or PRESFR) is reported if the pressure is rising or falling ata rate of at least .06 inch per hour and the pressure change totals .02 inch or more at the time ofobservation.
10. b. 3 hours
11. c Altimeter Setting b Sea-Level Pressure c Station Pressure
12. c. .005
13. a. designated station elevation

A-18
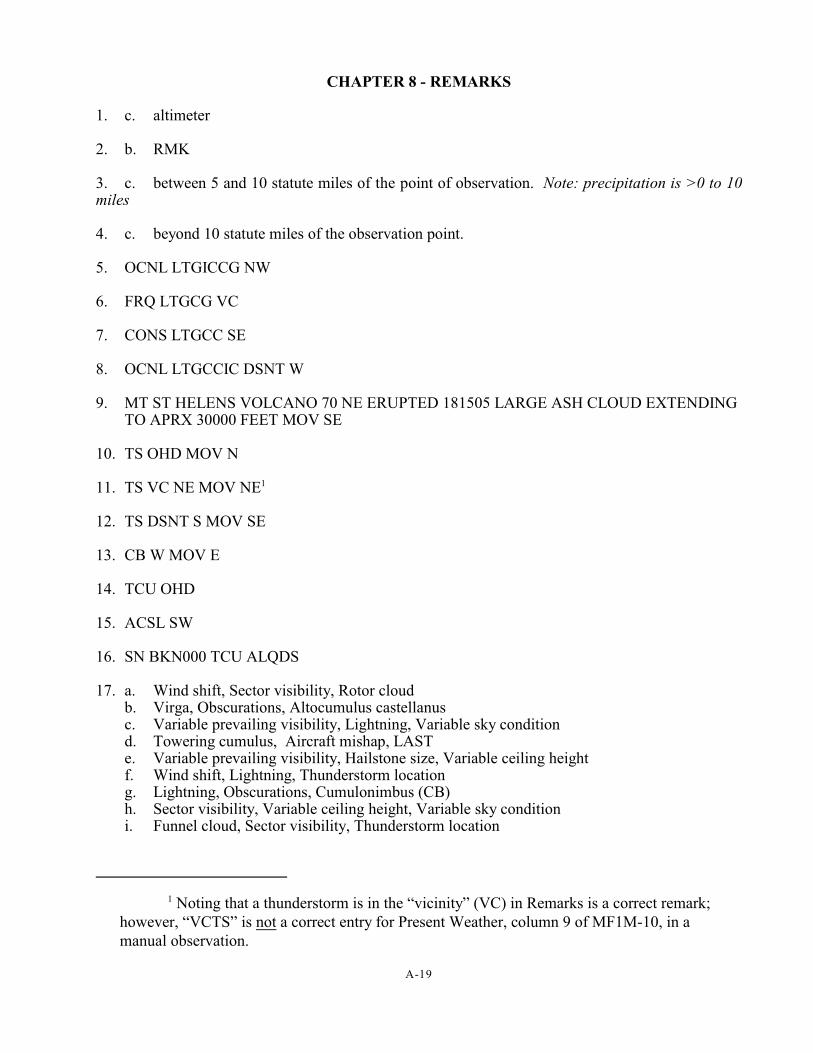
Noting that a thunderstorm is in the “vicinity” (VC) in Remarks is a correct remark;1
however, “VCTS” is not a correct entry for Present Weather, column 9 of MF1M-10, in amanual observation.
A-19
CHAPTER 8 - REMARKS
1. c. altimeter
2. b. RMK
3. c. between 5 and 10 statute miles of the point of observation. Note: precipitation is >0 to 10miles
4. c. beyond 10 statute miles of the observation point.
5. OCNL LTGICCG NW
6. FRQ LTGCG VC
7. CONS LTGCC SE
8. OCNL LTGCCIC DSNT W
9. MT ST HELENS VOLCANO 70 NE ERUPTED 181505 LARGE ASH CLOUD EXTENDINGTO APRX 30000 FEET MOV SE
10. TS OHD MOV N
11. TS VC NE MOV NE1
12. TS DSNT S MOV SE
13. CB W MOV E
14. TCU OHD
15. ACSL SW
16. SN BKN000 TCU ALQDS
17. a. Wind shift, Sector visibility, Rotor cloud b. Virga, Obscurations, Altocumulus castellanusc. Variable prevailing visibility, Lightning, Variable sky conditiond. Towering cumulus, Aircraft mishap, LASTe. Variable prevailing visibility, Hailstone size, Variable ceiling heightf. Wind shift, Lightning, Thunderstorm locationg. Lightning, Obscurations, Cumulonimbus (CB)h. Sector visibility, Variable ceiling height, Variable sky conditioni. Funnel cloud, Sector visibility, Thunderstorm location
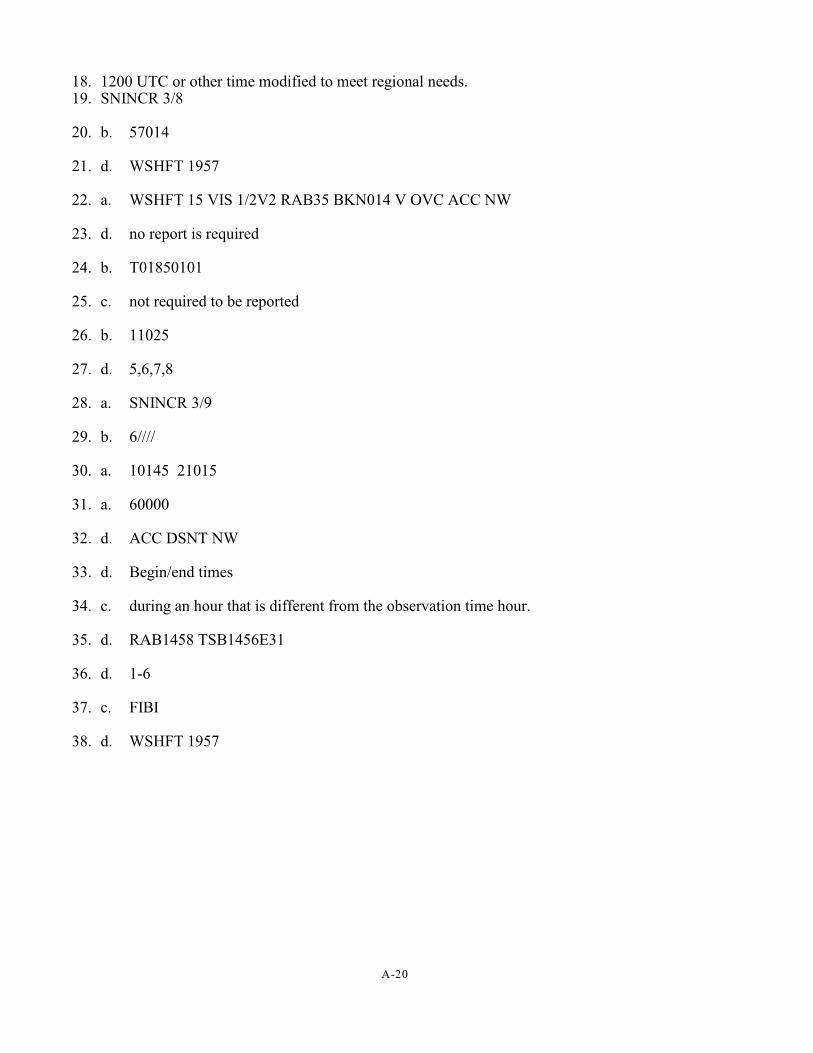
A-20
18. 1200 UTC or other time modified to meet regional needs.19. SNINCR 3/8
20. b. 57014
21. d. WSHFT 1957
22. a. WSHFT 15 VIS 1/2V2 RAB35 BKN014 V OVC ACC NW
23. d. no report is required
24. b. T01850101
25. c. not required to be reported
26. b. 11025
27. d. 5,6,7,8
28. a. SNINCR 3/9
29. b. 6////
30. a. 10145 21015
31. a. 60000
32. d. ACC DSNT NW
33. d. Begin/end times
34. c. during an hour that is different from the observation time hour.
35. d. RAB1458 TSB1456E31
36. d. 1-6
37. c. FIBI
38. d. WSHFT 1957
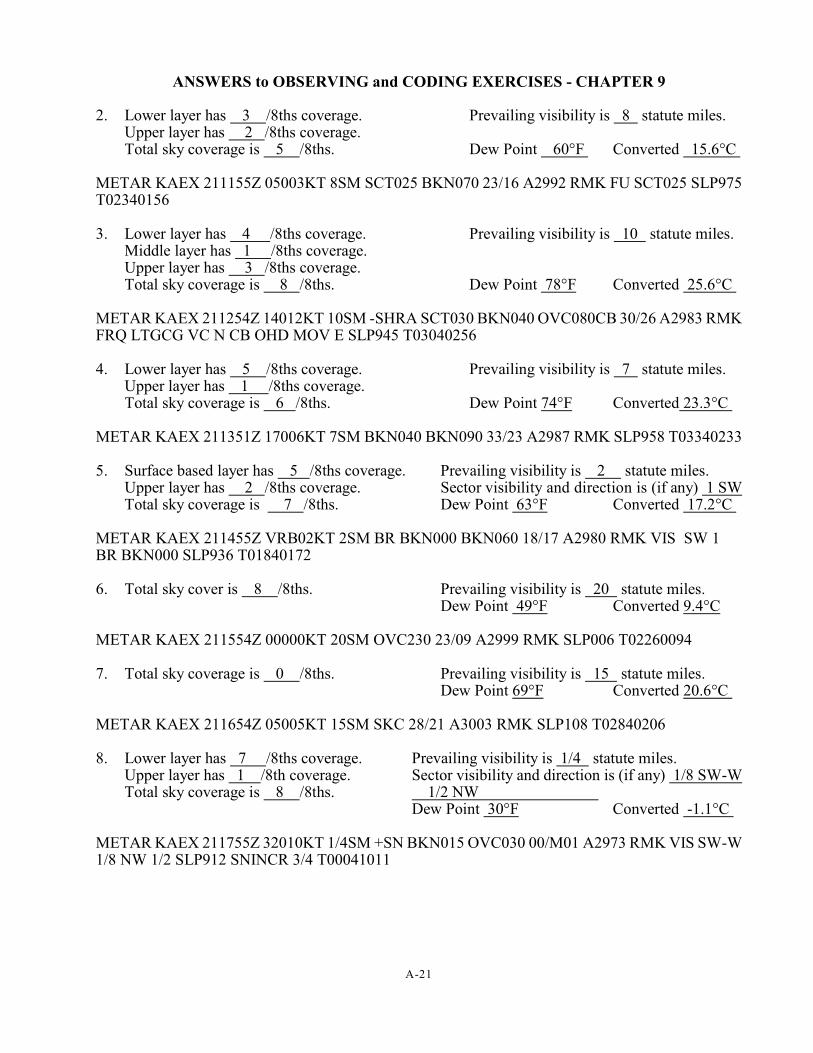
A-21
ANSWERS to OBSERVING and CODING EXERCISES - CHAPTER 9
2. Lower layer has 3 /8ths coverage. Prevailing visibility is 8 statute miles.Upper layer has 2 /8ths coverage. Total sky coverage is 5 /8ths. Dew Point 60°F Converted 15.6°C
METAR KAEX 211155Z 05003KT 8SM SCT025 BKN070 23/16 A2992 RMK FU SCT025 SLP975T02340156
3. Lower layer has 4 /8ths coverage. Prevailing visibility is 10 statute miles.Middle layer has 1 /8ths coverage. Upper layer has 3 /8ths coverage.Total sky coverage is 8 /8ths. Dew Point 78°F Converted 25.6°C
METAR KAEX 211254Z 14012KT 10SM -SHRA SCT030 BKN040 OVC080CB 30/26 A2983 RMKFRQ LTGCG VC N CB OHD MOV E SLP945 T03040256
4. Lower layer has 5 /8ths coverage. Prevailing visibility is 7 statute miles.Upper layer has 1 /8ths coverage.Total sky coverage is 6 /8ths. Dew Point 74°F Converted 23.3°C
METAR KAEX 211351Z 17006KT 7SM BKN040 BKN090 33/23 A2987 RMK SLP958 T03340233
5. Surface based layer has 5 /8ths coverage. Prevailing visibility is 2 statute miles.Upper layer has 2 /8ths coverage. Sector visibility and direction is (if any) 1 SWTotal sky coverage is 7 /8ths. Dew Point 63°F Converted 17.2°C
METAR KAEX 211455Z VRB02KT 2SM BR BKN000 BKN060 18/17 A2980 RMK VIS SW 1BR BKN000 SLP936 T01840172
6. Total sky cover is 8 /8ths. Prevailing visibility is 20 statute miles.Dew Point 49°F Converted 9.4°C
METAR KAEX 211554Z 00000KT 20SM OVC230 23/09 A2999 RMK SLP006 T02260094
7. Total sky coverage is 0 /8ths. Prevailing visibility is 15 statute miles.Dew Point 69°F Converted 20.6°C
METAR KAEX 211654Z 05005KT 15SM SKC 28/21 A3003 RMK SLP108 T02840206
8. Lower layer has 7 /8ths coverage. Prevailing visibility is 1/4 statute miles.Upper layer has 1 /8th coverage. Sector visibility and direction is (if any) 1/8 SW-W
Total sky coverage is 8 /8ths. 1/2 NW Dew Point 30°F Converted -1.1°C
METAR KAEX 211755Z 32010KT 1/4SM +SN BKN015 OVC030 00/M01 A2973 RMK VIS SW-W1/8 NW 1/2 SLP912 SNINCR 3/4 T00041011
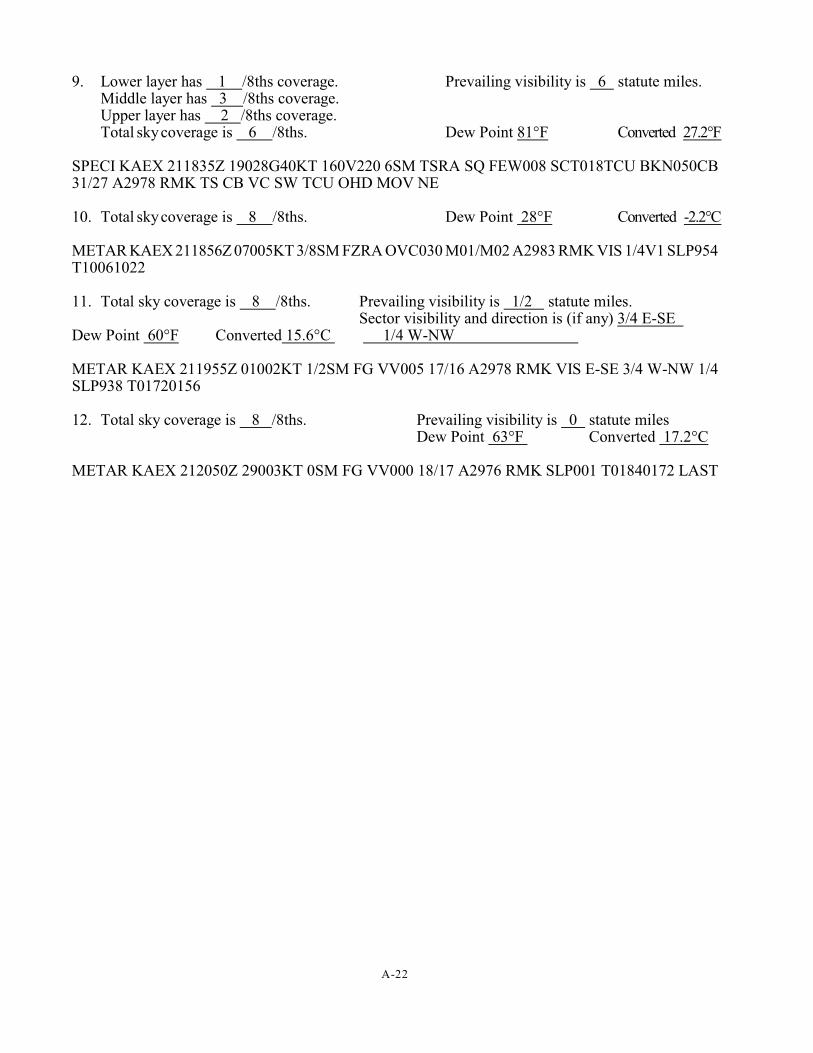
A-22
9. Lower layer has 1 /8ths coverage. Prevailing visibility is 6 statute miles.Middle layer has 3 /8ths coverage.Upper layer has 2 /8ths coverage.Total sky coverage is 6 /8ths. Dew Point 81°F Converted 27.2°F
SPECI KAEX 211835Z 19028G40KT 160V220 6SM TSRA SQ FEW008 SCT018TCU BKN050CB31/27 A2978 RMK TS CB VC SW TCU OHD MOV NE
10. Total sky coverage is 8 /8ths. Dew Point 28°F Converted -2.2°C
METAR KAEX 211856Z 07005KT 3/8SM FZRA OVC030 M01/M02 A2983 RMK VIS 1/4V1 SLP954T10061022
11. Total sky coverage is 8 /8ths. Prevailing visibility is 1/2 statute miles.Sector visibility and direction is (if any) 3/4 E-SE
Dew Point 60°F Converted 15.6°C 1/4 W-NW
METAR KAEX 211955Z 01002KT 1/2SM FG VV005 17/16 A2978 RMK VIS E-SE 3/4 W-NW 1/4SLP938 T01720156
12. Total sky coverage is 8 /8ths. Prevailing visibility is 0 statute milesDew Point 63°F Converted 17.2°C
METAR KAEX 212050Z 29003KT 0SM FG VV000 18/17 A2976 RMK SLP001 T01840172 LAST
A-23
ANSWERS to QUALITY CONTROL EXERCISE - CHAPTER 9
2. METAR KDEF COR 292352Z 00000KT 25SM RA! OVC065 33/31 A2995The contraction COR goes after the date/time group. RA! should be coded !RA.
3. METAR KGHI 272155Z 05003KT 20SM BKN060TCU 19/11 A3003 RMK VCRA S WIf any type of precipitation is observed within 10SM of the station, it shall be reported in the bodyas “VCSH.” It may further be described in remarks. There is no such thing as VCRA.
4. METAR KJKL 022150Z 16006KT 20SM BKN065 M/M A3033 RMKIf the temperature and/or dew point is missing, nothing is to be reported. Never use “M” to reportthese values. Contraction RMK not needed.
5. METAR KMNO 022045Z 08003KT 20SM !TSRA OVC040 20/11 A2983 RMK !TSRAB40 The intensity symbol is not entered in remarks for the begin time of precipitation.
6. METAR KPQR 232145Z 13003KT 20SM SHRA BKN050 TCU 19/14 A2985A space does not go between 050 and TCU. Also, having 20SM visibility with a moderate rainshower is unlikely. The observer should have reported !SHRA instead.
7. METAR KSTU 191150Z 0000KT 5SM BR BKN010 23/22 A2985Calm winds are reported with five zeros.
8. METAR KVWX 282150Z 22002KT 20SM OVC035 18/10 A2992 RMK VCSHRAVCSH should be reported in the body of the report. There is no such combination of descriptorsand weather as VCSHRA. You cannot combine two descriptors into the same group.
9. METAR KYYY 051250Z 24002KT 5SM RASH OVC040 26/17 A2999The descriptor goes before the precipitation, i.e., SHRA.
10. METAR KZZZ 142145Z 02010G18KT 20SM BKN060 18/06 A2977 RMK RA N MOV SERA N MOV SE implies that it is within 10SM of the station and thus it should be reported as VCSHin the body. The VCSH can further be described in remarks.
11. METAR KAAA 202300Z 29004KT 20SM BKN065 24/16 A3000 10294 20100 TE42The contraction RMK is missing.
12. METAR KBBB 010052Z COR 19025G35KT 160V220 6SM TSRA SQ FEW008 SCT018TCUBKN050CB 31/28 A2983 RMK WSHFT 25 TS SW TCU OHD MOV NENo errors.
13. METAR KCCC 051951Z 00000KT 25SM 065BKN OVC100 29/20 A3045The height of the layer goes after the sky cover contraction.
14. METAR KDDD 152247Z VAR04KT 15SM BKN250 30/22 A2999Variable contraction is VRB.
15. METAR KEEE 1619150Z 22007KT 7SM SCT025 BKN100 OVC200 25/20 A3002The date/time group contains too many characters. There should be only seven characters countingthe Z.
A-24
16. METAR KFFF 312148Z 36005KT 1 1/2 !RA BR BKN005 62/60 A3000The visibility group must end with “SM.” Temp/dew point are reported in Celsius not Fahrenheit.
17. METAR KGGG 302055Z 02010G27 1/4SM RA FG SCT002 BKN030 25/25 A2966The “KT” is missing from the wind group.
18. METAR KHHH 301945Z 05012KT 30SM SCT065 26/M A3034“M” is never used in the report to indicate a missing dew point. The group should be 26/.
19. METAR KIII 300748 07005KT 15SM SKC 8/7 A3019The date/time group must end with “Z” and temp/dew point require two digits for each entry, i.e.,08/07.
20. METAR KJJJ 281145Z 3508KT 3SM BR BKN025 25/23 A2955There are not enough characters in the wind group. Should have been reported as 35008KT.
21. METAR KKKK 282045Z E29006KT 7SM FEW045 SCT110 BKN200 13/10 A3005In METAR, estimated winds are not coded with a leading “E” in the group. This group shouldhave been coded as 29006KT.
22. METAR KLLL 032150Z 18004KT 20SM BKN050 27/09 RMK A3012 VCTS RA NThe contraction VCTS is used only by automated stations. If thunder is heard (no matter whatthe distance), it is to be reported in the body of the report as present weather, i.e., TS. The remarkRA N also indicates that precipitation was observed within 10SM of the station. This should havebeen reported in the body of the report as VCSH. The VCSH can further be described in remarks.
23. METAR KMMM 141350Z VRB03KT 21/2SM BR BKN005 20/20 A2966When reporting a visibility that contains a whole number and a fraction, a space must separate
whole miles from fractions. The group should have been reported as 2 1/2SM.
24. METAR KNNN 031246Z 30SM 00000KT FEW180 32/25 A3015The wind group goes before the visibility.
25. METAR KOOO 161645Z VRB04KT 4SM TSHZ BKN060CB 33/28 A2997A space is required between the TS and HZ. HZ is NEVER appended to any descriptor. Locationand movement (if known) of TS are also required in remarks.
26. METAR KPPP 071247Z 00000KT 3/8SM R21S/1400 FG BKN003 OVC015 25/25 A2988Runway visual range uses the approach directions of “R” for right, “L” for left, and “C” for center;also, the group must end with “FT.”
27. METAR KQQQ 192050Z 13010KT 080V170 FEW080 BKN050 30/25 A2991No visibility reported.
28. METAR KRRR 271350Z 01010KT 20SM BKN080 16/12 A3013 RMK SLP192 T10580121Hourly temperature group improperly coded. The group should have been coded T01580121.
29. METAR KSSS 051456 24012KT 3SM FG OVC006 23/22 A2984The date/time group must end with “Z.” You can’t have FG with 3SM. BR is used for visibilitiesof 5/8SM or greater.
A-25
30. METAR KTTT 301250Z 06009KT 1SM BR 0VC003 24/24 A3005A number was used instead of a letter; the entry should be OVC003.
31. METAR KUUU 281104Z 23007KT 1/4SM RVRNO FG OVC001 27/27 A2999RVRNO is a remark and shall never be coded in the body.
32. METAR KVVV 282247Z VRB05 15SM SHVC FEW20 SCT45 BKN80 BKN150 22/19 3024RMK OCN L LTGCG NE“KT” is missing from the wind group. SHVC does not exist (should be VCSH). Cloud heights
need three digits. The altimeter setting must be preceeded by an “A.” There is no space in OCNL.
33. METAR KWWW 141447Z 11008KT 50SM FEW050 FEW180 18/21 A3021Something that will never happen, the dew point higher than the temperature.
34. METAR KXXX 312150Z 35006KT 20SM FEW030 SCT070 BKN150 29/15/A3019A solidus is not to be used to separate the dew point and altimeter.
35. METAR KYYY 071050Z 32006KT 6SM !R BR SCT030 BKN050 26/24 A3006“!RA” is used to indicate light rain.
36. METAR KZZZ 022048Z 10014G21KT -SHRA 25SM BKN080TCU 29/22 A2985Visibility goes before present weather.
37. METAR KAAA 261654Z 00000KT 10SM !TS SCT015CB BKN035 28/23 A3009 RMK TS NEMOV ENo intensity is applied to a TS.
38. METAR KBBB 030945Z OOOOOKT 3SM BR HZ FEW040CU FEW100 20/ A2988 VIRGA SWFIRSTLetters instead of numbers were used in the wind group. CB and TCU are the only authorized cloudcontractions to be appended to a layer. Remarks must be separated from the altimeter by “RMK,”and the remark FIRST is not a valid entry in a METAR report.
39. METAR KCCC 281047Z 19003KT BCFG SCT000 BKN022 17/16 A2988 RMK SCT000 VIS1/4V3/Visibility is missing in the body of the report. The purpose of SCT000 in remarks is not made, maybe FG SCT000. A variable visibility remark does not end with a solidus.
40. METAR KDDD 032255Z VRB24G30KT 260V330 15SM BKN035 BKN100 OVC250 25/19A3045A direction is required. VRB is not acceptable. VRB can be reported only if the speed is 6 knotsor less.
41. METAR KEEE 231850Z 00000KT 35SM TS SCT050CB SCT100 2708 A3035 RMKTS W MOV SA solidus is needed between the temp and dew point. This group should be reported as 27/08.
42. METAR KFFF 302250Z 03008KT 40SM BKN070 29/18 A3024 RMK CB RA NCB should have been appended to the layer. The remark RA N indicates that precipitation wasobserved within 10SM of the station. This should have been reported in the body of the report asVCSH. The VCSH can further be described in remarks.
A-26
43. METAR KGGG 052145Z 05009KT 4SM TSRA! OVC020 20 A2988 TS N MOVG SEThe intensity symbol goes before the descriptor TS (!TSRA). The temp must be followed by asolidus, even if there is no dew point. The contraction “RMK” must be entered whenever there areremarks.
44. METAR KHHH 222347Z 07004KT 4SM TSRA 40SCT 70BKN 26/20 A3000 RMK LTGICCGTS S MOV SEIncorrect format for reporting sky condition. Amount comes before the height and the height mustbe three digits. Frequency (type) of lightning is also missing.
45. METAR KIII 021250Z 10010KT 6SM TS !RW FEW010 27/23 A3010Precipitation must be appended to the TS descriptor, e.g., !TSRA. !RW is from the airways code.TS implies showers in the METAR code.
46. METAR KJJJ 071050Z 00000KT 7SM MIBR SCT250 28/26 A2985There is no such thing as MIBR. MI can only be used with FG.
47. METAR KKKK 311650Z VRB006KT 35SM SCT060 BKN200 22/19 A3042 RMK VIRGA NE-SE THIN BKN SLPNA T02170115There are too many characters in the wind group (VRB06KT). Dew point is incorrect or the “T”group is incorrect. Thin broken is not METAR. No such contraction as SLPNA (use SLPNO).
48. METAR KLLL 172050Z 07004KT 20SM OVC050 24/06 A3025 RMK VCTSRA N-E MOV SEThere is no present weather group VCTSRA. Any precipitation observed within 10SM of thestation shall be reported in the body as VCSH, and any thunderstorm should be reported in the bodyof the report. TS VCSH should have been reported for present weather.
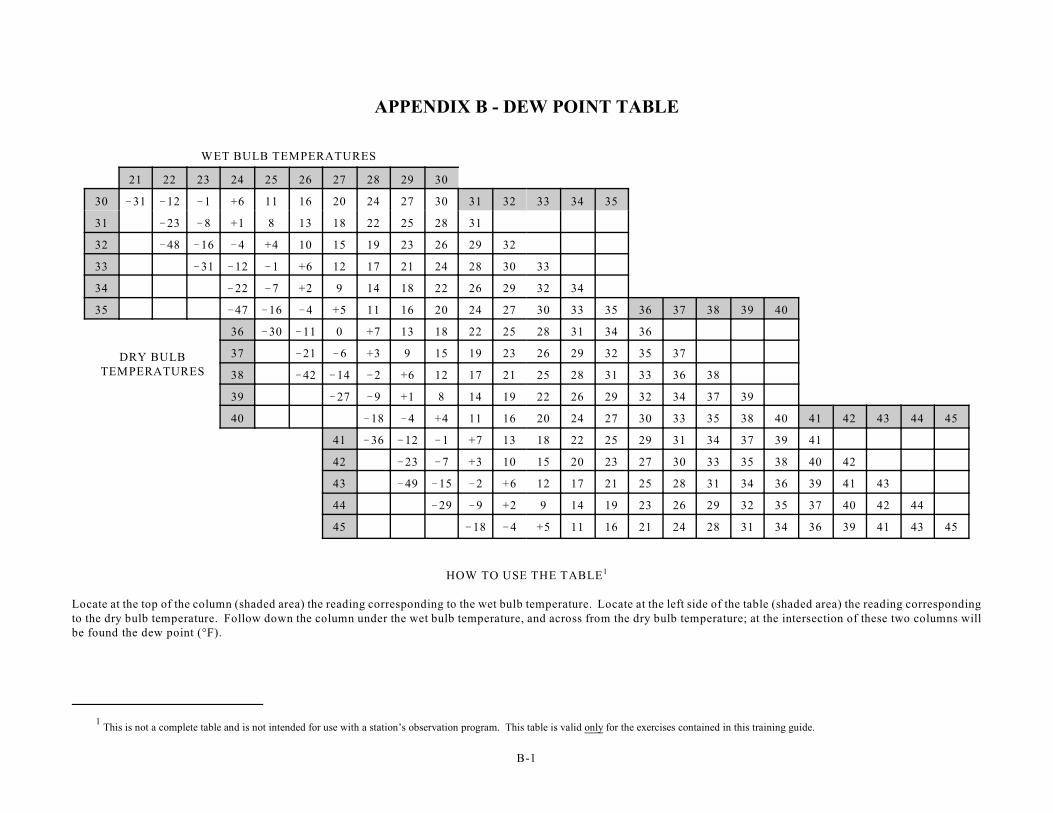
This is not a complete table and is not intended for use with a station’s observation program. This table is valid only for the exercises contained in this training guide.1
B-1
APPENDIX B - DEW POINT TABLE
WET BULB TEMPERATURES
21 22 23 24 25 26 27 28 29 30
30 !31 !12 !1 +6 11 16 20 24 27 30 31 32 33 34 35
31 !23 !8 +1 8 13 18 22 25 28 31
32 !48 !16 !4 +4 10 15 19 23 26 29 32
33 !31 !12 !1 +6 12 17 21 24 28 30 33
34 !22 !7 +2 9 14 18 22 26 29 32 34
35 !47 !16 !4 +5 11 16 20 24 27 30 33 35 36 37 38 39 40
36 !30 !11 0 +7 13 18 22 25 28 31 34 36
DRY BULBTEMPERATURES
37 !21 !6 +3 9 15 19 23 26 29 32 35 37
38 !42 !14 !2 +6 12 17 21 25 28 31 33 36 38
39 !27 !9 +1 8 14 19 22 26 29 32 34 37 39
40 !18 !4 +4 11 16 20 24 27 30 33 35 38 40 41 42 43 44 45
41 !36 !12 !1 +7 13 18 22 25 29 31 34 37 39 41
42 !23 !7 +3 10 15 20 23 27 30 33 35 38 40 42
43 !49 !15 !2 +6 12 17 21 25 28 31 34 36 39 41 43
44 !29 !9 +2 9 14 19 23 26 29 32 35 37 40 42 44
45 !18 !4 +5 11 16 21 24 28 31 34 36 39 41 43 45
HOW TO USE THE TABLE1
Locate at the top of the column (shaded area) the reading corresponding to the wet bulb temperature. Locate at the left side of the table (shaded area) the reading correspondingto the dry bulb temperature. Follow down the column under the wet bulb temperature, and across from the dry bulb temperature; at the intersection of these two columns willbe found the dew point (°F).
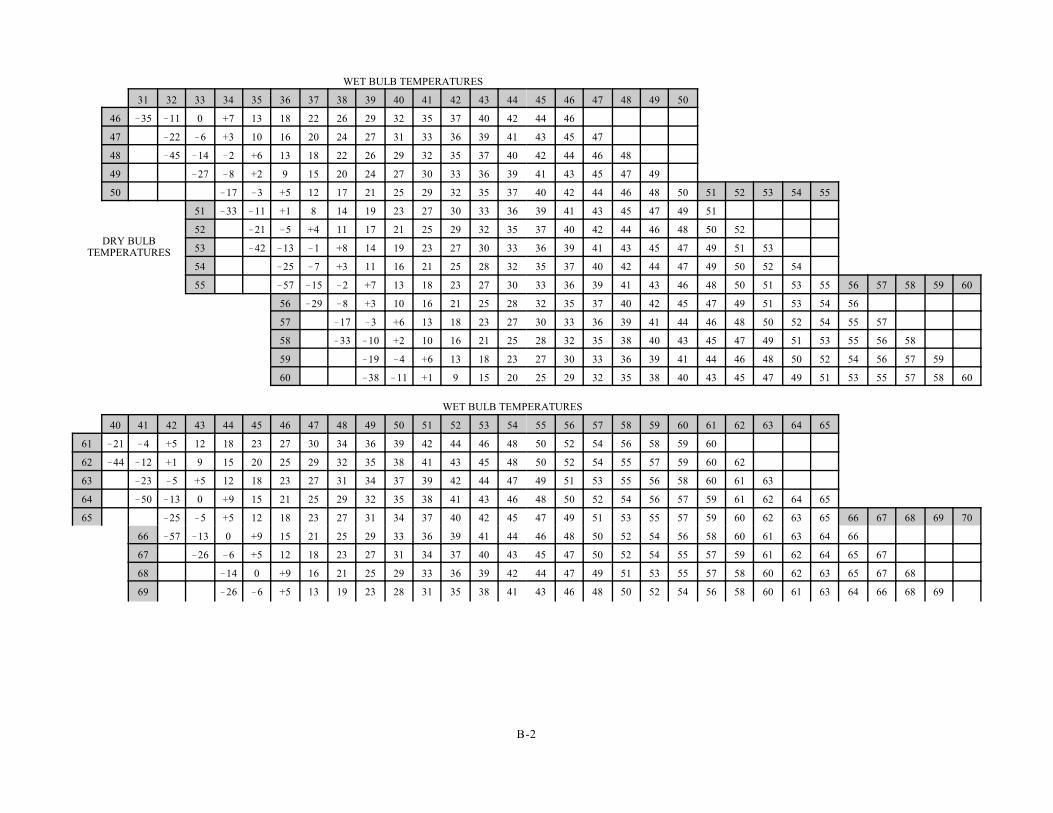
B-2
WET BULB TEMPERATURES
31 32 33 34 35 36 37 38 39 40 41 42 43 44 45 46 47 48 49 50
46 !35 !11 0 +7 13 18 22 26 29 32 35 37 40 42 44 46
47 !22 !6 +3 10 16 20 24 27 31 33 36 39 41 43 45 47
48 !45 !14 !2 +6 13 18 22 26 29 32 35 37 40 42 44 46 48
49 !27 !8 +2 9 15 20 24 27 30 33 36 39 41 43 45 47 49
50 !17 !3 +5 12 17 21 25 29 32 35 37 40 42 44 46 48 50 51 52 53 54 55
51 !33 !11 +1 8 14 19 23 27 30 33 36 39 41 43 45 47 49 51
DRY BULBTEMPERATURES
52 !21 !5 +4 11 17 21 25 29 32 35 37 40 42 44 46 48 50 52
53 !42 !13 !1 +8 14 19 23 27 30 33 36 39 41 43 45 47 49 51 53
54 !25 !7 +3 11 16 21 25 28 32 35 37 40 42 44 47 49 50 52 54
55 !57 !15 !2 +7 13 18 23 27 30 33 36 39 41 43 46 48 50 51 53 55 56 57 58 59 60
56 !29 !8 +3 10 16 21 25 28 32 35 37 40 42 45 47 49 51 53 54 56
57 !17 !3 +6 13 18 23 27 30 33 36 39 41 44 46 48 50 52 54 55 57
58 !33 !10 +2 10 16 21 25 28 32 35 38 40 43 45 47 49 51 53 55 56 58
59 !19 !4 +6 13 18 23 27 30 33 36 39 41 44 46 48 50 52 54 56 57 59
60 !38 !11 +1 9 15 20 25 29 32 35 38 40 43 45 47 49 51 53 55 57 58 60
WET BULB TEMPERATURES
40 41 42 43 44 45 46 47 48 49 50 51 52 53 54 55 56 57 58 59 60 61 62 63 64 65
61 !21 !4 +5 12 18 23 27 30 34 36 39 42 44 46 48 50 52 54 56 58 59 60
62 !44 !12 +1 9 15 20 25 29 32 35 38 41 43 45 48 50 52 54 55 57 59 60 62
63 !23 !5 +5 12 18 23 27 31 34 37 39 42 44 47 49 51 53 55 56 58 60 61 63
64 !50 !13 0 +9 15 21 25 29 32 35 38 41 43 46 48 50 52 54 56 57 59 61 62 64 65
65 !25 !5 +5 12 18 23 27 31 34 37 40 42 45 47 49 51 53 55 57 59 60 62 63 65 66 67 68 69 70
66 !57 !13 0 +9 15 21 25 29 33 36 39 41 44 46 48 50 52 54 56 58 60 61 63 64 66
67 !26 !6 +5 12 18 23 27 31 34 37 40 43 45 47 50 52 54 55 57 59 61 62 64 65 67
68 !14 0 +9 16 21 25 29 33 36 39 42 44 47 49 51 53 55 57 58 60 62 63 65 67 68
69 !26 !6 +5 13 19 23 28 31 35 38 41 43 46 48 50 52 54 56 58 60 61 63 64 66 68 69
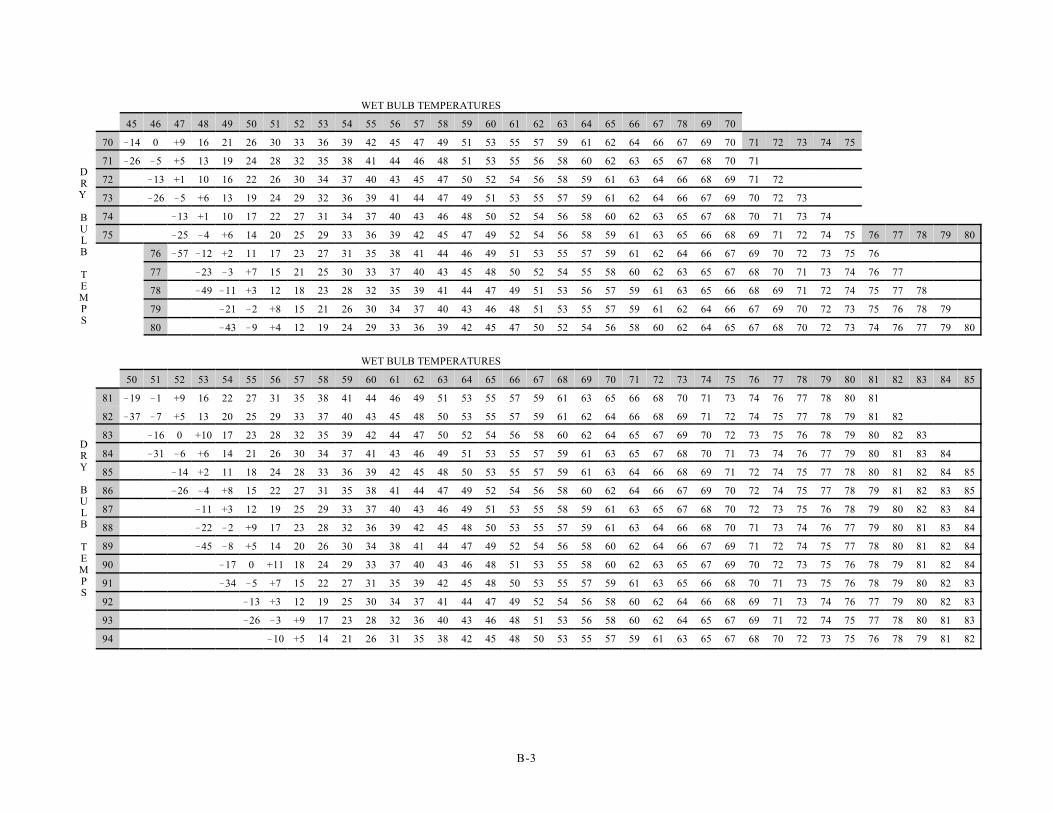
B-3
WET BULB TEMPERATURES
45 46 47 48 49 50 51 52 53 54 55 56 57 58 59 60 61 62 63 64 65 66 67 78 69 70
DRY
BULB
TEMPS
70 !14 0 +9 16 21 26 30 33 36 39 42 45 47 49 51 53 55 57 59 61 62 64 66 67 69 70 71 72 73 74 75
71 !26 !5 +5 13 19 24 28 32 35 38 41 44 46 48 51 53 55 56 58 60 62 63 65 67 68 70 71
72 !13 +1 10 16 22 26 30 34 37 40 43 45 47 50 52 54 56 58 59 61 63 64 66 68 69 71 72
73 !26 !5 +6 13 19 24 29 32 36 39 41 44 47 49 51 53 55 57 59 61 62 64 66 67 69 70 72 73
74 !13 +1 10 17 22 27 31 34 37 40 43 46 48 50 52 54 56 58 60 62 63 65 67 68 70 71 73 74
75 !25 !4 +6 14 20 25 29 33 36 39 42 45 47 49 52 54 56 58 59 61 63 65 66 68 69 71 72 74 75 76 77 78 79 80
76 !57 !12 +2 11 17 23 27 31 35 38 41 44 46 49 51 53 55 57 59 61 62 64 66 67 69 70 72 73 75 76
77 !23 !3 +7 15 21 25 30 33 37 40 43 45 48 50 52 54 55 58 60 62 63 65 67 68 70 71 73 74 76 77
78 !49 !11 +3 12 18 23 28 32 35 39 41 44 47 49 51 53 56 57 59 61 63 65 66 68 69 71 72 74 75 77 78
79 !21 !2 +8 15 21 26 30 34 37 40 43 46 48 51 53 55 57 59 61 62 64 66 67 69 70 72 73 75 76 78 79
80 !43 !9 +4 12 19 24 29 33 36 39 42 45 47 50 52 54 56 58 60 62 64 65 67 68 70 72 73 74 76 77 79 80
WET BULB TEMPERATURES
50 51 52 53 54 55 56 57 58 59 60 61 62 63 64 65 66 67 68 69 70 71 72 73 74 75 76 77 78 79 80 81 82 83 84 85
DRY
BULB
TEMPS
81 !19 !1 +9 16 22 27 31 35 38 41 44 46 49 51 53 55 57 59 61 63 65 66 68 70 71 73 74 76 77 78 80 81
82 !37 !7 +5 13 20 25 29 33 37 40 43 45 48 50 53 55 57 59 61 62 64 66 68 69 71 72 74 75 77 78 79 81 82
83 !16 0 +10 17 23 28 32 35 39 42 44 47 50 52 54 56 58 60 62 64 65 67 69 70 72 73 75 76 78 79 80 82 83
84 !31 !6 +6 14 21 26 30 34 37 41 43 46 49 51 53 55 57 59 61 63 65 67 68 70 71 73 74 76 77 79 80 81 83 84
85 !14 +2 11 18 24 28 33 36 39 42 45 48 50 53 55 57 59 61 63 64 66 68 69 71 72 74 75 77 78 80 81 82 84 85
86 !26 !4 +8 15 22 27 31 35 38 41 44 47 49 52 54 56 58 60 62 64 66 67 69 70 72 74 75 77 78 79 81 82 83 85
87 !11 +3 12 19 25 29 33 37 40 43 46 49 51 53 55 58 59 61 63 65 67 68 70 72 73 75 76 78 79 80 82 83 84
88 !22 !2 +9 17 23 28 32 36 39 42 45 48 50 53 55 57 59 61 63 64 66 68 70 71 73 74 76 77 79 80 81 83 84
89 !45 !8 +5 14 20 26 30 34 38 41 44 47 49 52 54 56 58 60 62 64 66 67 69 71 72 74 75 77 78 80 81 82 84
90 !17 0 +11 18 24 29 33 37 40 43 46 48 51 53 55 58 60 62 63 65 67 69 70 72 73 75 76 78 79 81 82 84
91 !34 !5 +7 15 22 27 31 35 39 42 45 48 50 53 55 57 59 61 63 65 66 68 70 71 73 75 76 78 79 80 82 83
92 !13 +3 12 19 25 30 34 37 41 44 47 49 52 54 56 58 60 62 64 66 68 69 71 73 74 76 77 79 80 82 83
93 !26 !3 +9 17 23 28 32 36 40 43 46 48 51 53 56 58 60 62 64 65 67 69 71 72 74 75 77 78 80 81 83
94 !10 +5 14 21 26 31 35 38 42 45 48 50 53 55 57 59 61 63 65 67 68 70 72 73 75 76 78 79 81 82
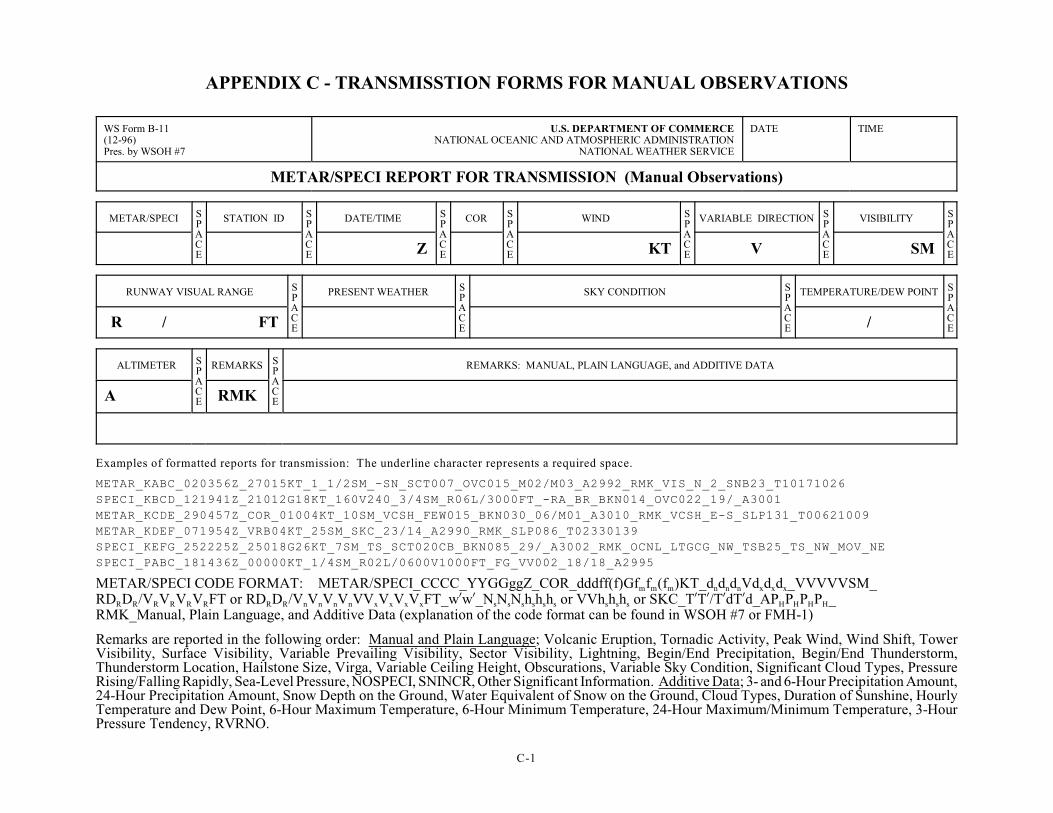
C-1
APPENDIX C - TRANSMISSTION FORMS FOR MANUAL OBSERVATIONS
WS Form B-11(12-96)Pres. by WSOH #7
U.S. DEPARTMENT OF COMMERCENATIONAL OCEANIC AND ATMOSPHERIC ADMINISTRATION
NATIONAL WEATHER SERVICE
DATE TIME
METAR/SPECI REPORT FOR TRANSMISSION (Manual Observations)
METAR/SPECI SPACE
STATION ID SPACE
DATE/TIME SPACE
COR SPACE
WIND SPACE
VARIABLE DIRECTION SPACE
VISIBILITY SPACEZ KT V SM
RUNWAY VISUAL RANGE SPACE
PRESENT WEATHER SPACE
SKY CONDITION SPACE
TEMPERATURE/DEW POINT SPACER / FT /
ALTIMETER SPACE
REMARKS SPACE
REMARKS: MANUAL, PLAIN LANGUAGE, and ADDITIVE DATA
A RMK
Examples of formatted reports for transmission: The underline character represents a required space.
METAR_KABC_020356Z_27015KT_1_1/2SM_-SN_SCT007_OVC015_M02/M03_A2992_RMK_VIS_N_2_SNB23_T10171026
SPECI_KBCD_121941Z_21012G18KT_160V240_3/4SM_R06L/3000FT_-RA_BR_BKN014_OVC022_19/_A3001
METAR_KCDE_290457Z_COR_01004KT_10SM_VCSH_FEW015_BKN030_06/M01_A3010_RMK_VCSH_E-S_SLP131_T00621009
METAR_KDEF_071954Z_VRB04KT_25SM_SKC_23/14_A2990_RMK_SLP086_T02330139
SPECI_KEFG_252225Z_25018G26KT_7SM_TS_SCT020CB_BKN085_29/_A3002_RMK_OCNL_LTGCG_NW_TSB25_TS_NW_MOV_NE
SPECI_PABC_181436Z_00000KT_1/4SM_R02L/0600V1000FT_FG_VV002_18/18_A2995
m m m n n n x x xMETAR/SPECI CODE FORMAT: METAR/SPECI_CCCC_YYGGggZ_COR_dddff(f)Gf f (f )KT_d d d Vd d d _VVVVVSM_
R R R R R R R R n n n n x x x x s s s s s s s s s H H H HRD D /V V V V FT or RD D /V V V V VV V V V FT_w!w!_N N N h h h or VVh h h or SKC_T!T!/T!dT!d_AP P P P _RMK_Manual, Plain Language, and Additive Data (explanation of the code format can be found in WSOH #7 or FMH-1)
Remarks are reported in the following order: Manual and Plain Language; Volcanic Eruption, Tornadic Activity, Peak Wind, Wind Shift, TowerVisibility, Surface Visibility, Variable Prevailing Visibility, Sector Visibility, Lightning, Begin/End Precipitation, Begin/End Thunderstorm,Thunderstorm Location, Hailstone Size, Virga, Variable Ceiling Height, Obscurations, Variable Sky Condition, Significant Cloud Types, PressureRising/Falling Rapidly, Sea-Level Pressure, NOSPECI, SNINCR, Other Significant Information. Additive Data; 3- and 6-Hour Precipitation Amount,24-Hour Precipitation Amount, Snow Depth on the Ground, Water Equivalent of Snow on the Ground, Cloud Types, Duration of Sunshine, HourlyTemperature and Dew Point, 6-Hour Maximum Temperature, 6-Hour Minimum Temperature, 24-Hour Maximum/Minimum Temperature, 3-HourPressure Tendency, RVRNO.
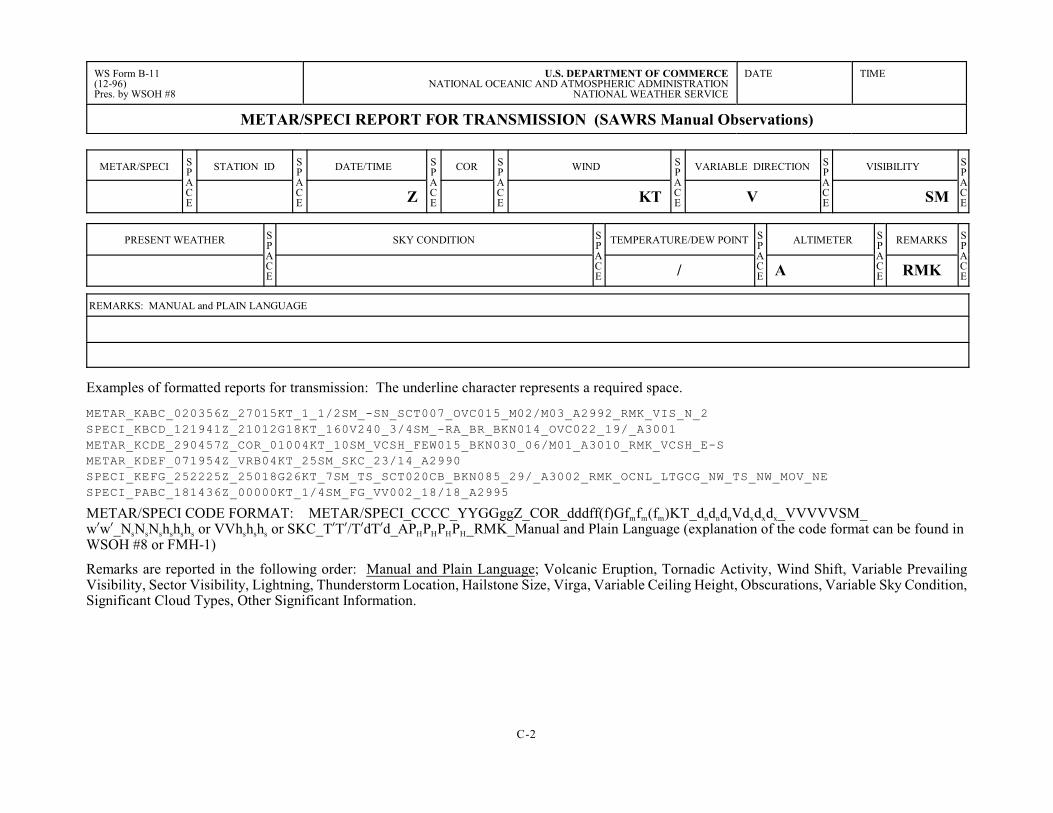
C-2
WS Form B-11(12-96)Pres. by WSOH #8
U.S. DEPARTMENT OF COMMERCENATIONAL OCEANIC AND ATMOSPHERIC ADMINISTRATION
NATIONAL WEATHER SERVICE
DATE TIME
METAR/SPECI REPORT FOR TRANSMISSION (SAWRS Manual Observations)
METAR/SPECI SPACE
STATION ID SPACE
DATE/TIME SPACE
COR SPACE
WIND SPACE
VARIABLE DIRECTION SPACE
VISIBILITY SPACEZ KT V SM
PRESENT WEATHER SPACE
SKY CONDITION SPACE
TEMPERATURE/DEW POINT SPACE
ALTIMETER SPACE
REMARKS SPACE/ A RMK
REMARKS: MANUAL and PLAIN LANGUAGE
Examples of formatted reports for transmission: The underline character represents a required space.
METAR_KABC_020356Z_27015KT_1_1/2SM_-SN_SCT007_OVC015_M02/M03_A2992_RMK_VIS_N_2
SPECI_KBCD_121941Z_21012G18KT_160V240_3/4SM_-RA_BR_BKN014_OVC022_19/_A3001
METAR_KCDE_290457Z_COR_01004KT_10SM_VCSH_FEW015_BKN030_06/M01_A3010_RMK_VCSH_E-S
METAR_KDEF_071954Z_VRB04KT_25SM_SKC_23/14_A2990
SPECI_KEFG_252225Z_25018G26KT_7SM_TS_SCT020CB_BKN085_29/_A3002_RMK_OCNL_LTGCG_NW_TS_NW_MOV_NE
SPECI_PABC_181436Z_00000KT_1/4SM_FG_VV002_18/18_A2995
m m m n n n x x xMETAR/SPECI CODE FORMAT: METAR/SPECI_CCCC_YYGGggZ_COR_dddff(f)Gf f (f )KT_d d d Vd d d _VVVVVSM_
s s s s s s s s s H H H Hw!w!_N N N h h h or VVh h h or SKC_T!T!/T!dT!d_AP P P P _RMK_Manual and Plain Language (explanation of the code format can be found inWSOH #8 or FMH-1)
Remarks are reported in the following order: Manual and Plain Language; Volcanic Eruption, Tornadic Activity, Wind Shift, Variable PrevailingVisibility, Sector Visibility, Lightning, Thunderstorm Location, Hailstone Size, Virga, Variable Ceiling Height, Obscurations, Variable Sky Condition,Significant Cloud Types, Other Significant Information.

C-3
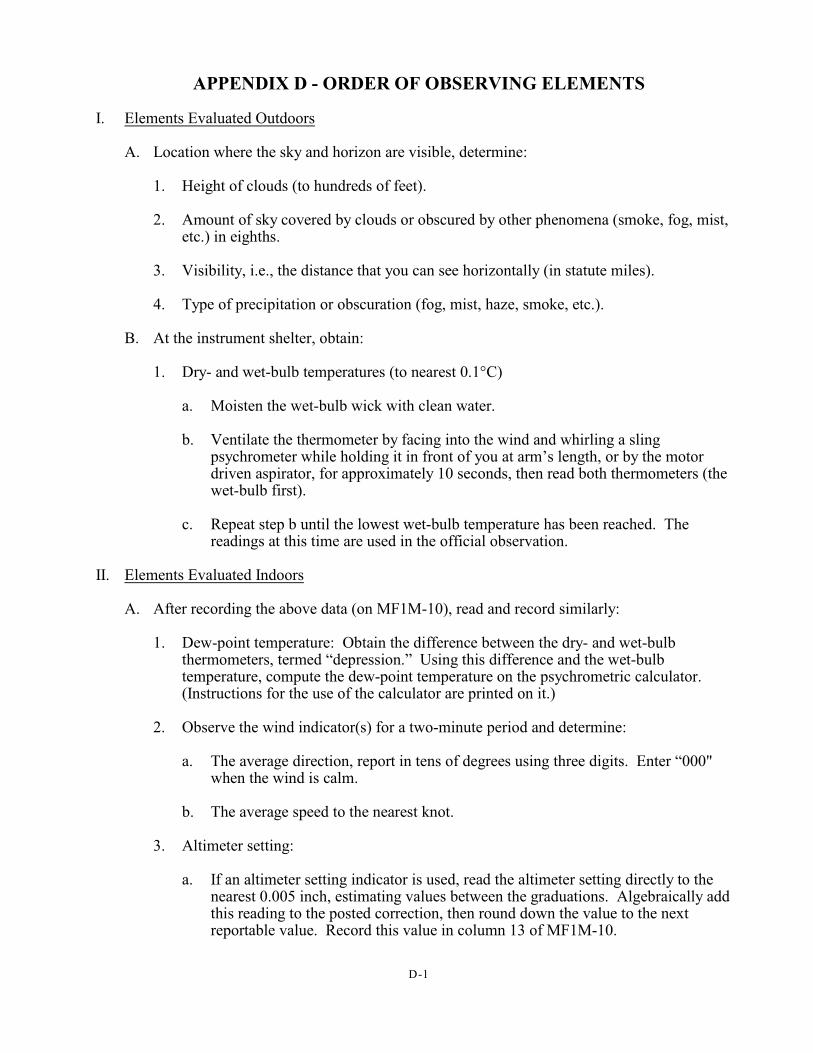
D-1
APPENDIX D - ORDER OF OBSERVING ELEMENTS
I. Elements Evaluated Outdoors
A. Location where the sky and horizon are visible, determine:
1. Height of clouds (to hundreds of feet).
2. Amount of sky covered by clouds or obscured by other phenomena (smoke, fog, mist,etc.) in eighths.
3. Visibility, i.e., the distance that you can see horizontally (in statute miles).
4. Type of precipitation or obscuration (fog, mist, haze, smoke, etc.).
B. At the instrument shelter, obtain:
1. Dry- and wet-bulb temperatures (to nearest 0.1°C)
a. Moisten the wet-bulb wick with clean water.
b. Ventilate the thermometer by facing into the wind and whirling a slingpsychrometer while holding it in front of you at arm’s length, or by the motordriven aspirator, for approximately 10 seconds, then read both thermometers (thewet-bulb first).
c. Repeat step b until the lowest wet-bulb temperature has been reached. Thereadings at this time are used in the official observation.
II. Elements Evaluated Indoors
A. After recording the above data (on MF1M-10), read and record similarly:
1. Dew-point temperature: Obtain the difference between the dry- and wet-bulbthermometers, termed “depression.” Using this difference and the wet-bulbtemperature, compute the dew-point temperature on the psychrometric calculator. (Instructions for the use of the calculator are printed on it.)
2. Observe the wind indicator(s) for a two-minute period and determine:
a. The average direction, report in tens of degrees using three digits. Enter “000"when the wind is calm.
b. The average speed to the nearest knot.
3. Altimeter setting:
a. If an altimeter setting indicator is used, read the altimeter setting directly to thenearest 0.005 inch, estimating values between the graduations. Algebraically addthis reading to the posted correction, then round down the value to the nextreportable value. Record this value in column 13 of MF1M-10.
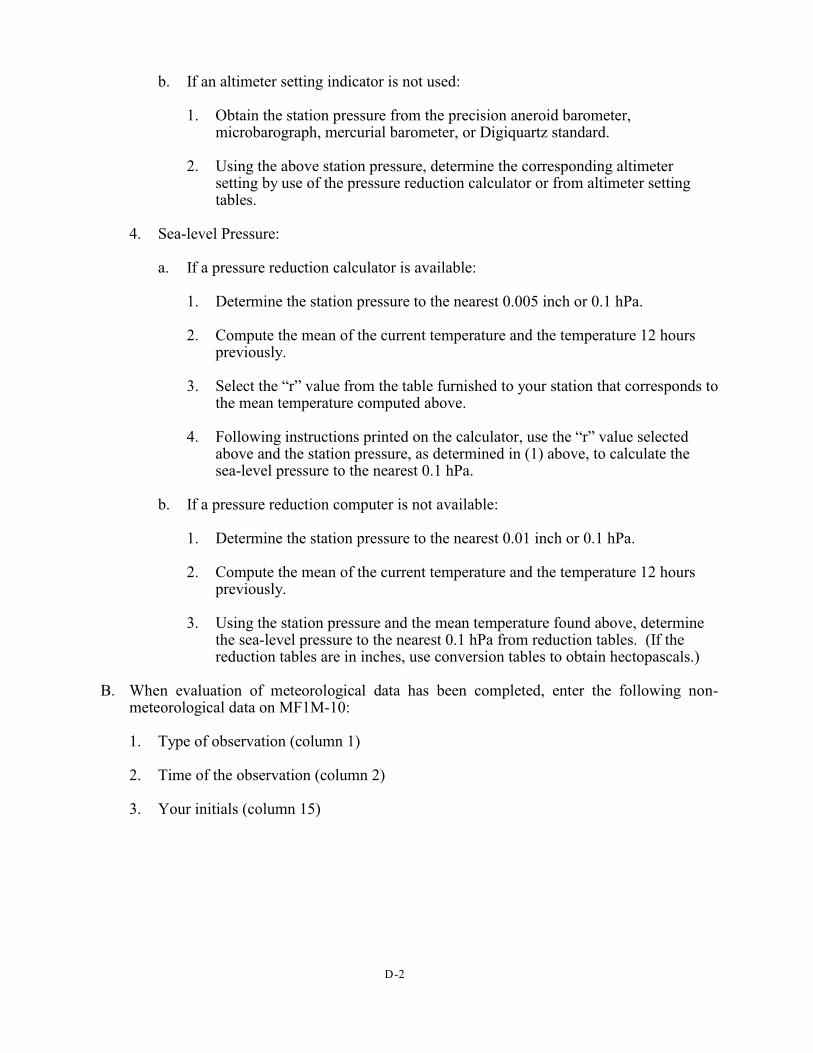
D-2
b. If an altimeter setting indicator is not used:
1. Obtain the station pressure from the precision aneroid barometer,microbarograph, mercurial barometer, or Digiquartz standard.
2. Using the above station pressure, determine the corresponding altimetersetting by use of the pressure reduction calculator or from altimeter settingtables.
4. Sea-level Pressure:
a. If a pressure reduction calculator is available:
1. Determine the station pressure to the nearest 0.005 inch or 0.1 hPa.
2. Compute the mean of the current temperature and the temperature 12 hourspreviously.
3. Select the “r” value from the table furnished to your station that corresponds tothe mean temperature computed above.
4. Following instructions printed on the calculator, use the “r” value selectedabove and the station pressure, as determined in (1) above, to calculate thesea-level pressure to the nearest 0.1 hPa.
b. If a pressure reduction computer is not available:
1. Determine the station pressure to the nearest 0.01 inch or 0.1 hPa.
2. Compute the mean of the current temperature and the temperature 12 hourspreviously.
3. Using the station pressure and the mean temperature found above, determinethe sea-level pressure to the nearest 0.1 hPa from reduction tables. (If thereduction tables are in inches, use conversion tables to obtain hectopascals.)
B. When evaluation of meteorological data has been completed, enter the following non-meteorological data on MF1M-10:
1. Type of observation (column 1)
2. Time of the observation (column 2)
3. Your initials (column 15)