railway safety in the european union interim repo… · 2 | safety overview 2017 safety overview...
TRANSCRIPT

Railway Safety in the European Union
Safety overview 2017
Report

Neither the Agency nor any person acting on behalf of the Agency is responsible for the use which might be made of the following information.
Luxembourg: Publications Office of the European Union, 2017
Print ISBN 978-92-9205-383-3 doi:10.2821/813806 TR-AG-17-101-EN-CPDF ISBN 978-92-9205-384-0 ISSN 2529-6302 doi:10.2821/474487 TR-AG-17-101-EN-N
© European Union Agency for Railways, 2017
Reproduction is authorised provided the source is acknowledged.For any use or reproduction of individual photos, permission must be sought directly from the copyright holders.
Europe Direct is a service to help you find answers to your questions about the European Union.
Freephone number (*):
00 800 6 7 8 9 10 11(*) The information given is free, as are most calls
(though some operators, phone boxes or hotels may charge you).

CONTENTS | 1
Contents
Safety overview ��������������������������������������������������������������������������������������������������������������������� 2
A background note about the data and their collection ����������������������������������������������� 4
Key figures ������������������������������������������������������������������������������������������������������������������������������ 5Accident outcomes .................................................................................................................................................. 5Trend analyses.............................................................................................................................................................. 7Accidents, fatalities and serious injuries ....................................................................................................10Risk levels ......................................................................................................................................................................12Intermodal comparison of risk ........................................................................................................................16
Accident outcomes �������������������������������������������������������������������������������������������������������������� 17Significant accidents ..............................................................................................................................................17Accidents and incidents involving transport of dangerous goods ..........................................20Suicides on railway premises ............................................................................................................................21Casualties (fatalities and serious injuries) from significant accidents ......................................25Precursors to accidents ........................................................................................................................................27Accident costs ............................................................................................................................................................30
Safety of infrastructure ������������������������������������������������������������������������������������������������������ 31
Traffic volumes ��������������������������������������������������������������������������������������������������������������������� 33
Independent accident investigation ������������������������������������������������������������������������������� 39
Serious accidents in 2016 �������������������������������������������������������������������������������������������������� 41
Background information ���������������������������������������������������������������������������������������������������� 44
List of abbreviations ����������������������������������������������������������������������������������������������������������� 46
List of country codes ����������������������������������������������������������������������������������������������������������� 47

2 | SAFETY OVERVIEW 2017
Safety overview
This electronically published overview report complements the biennial report on railway safety performance in the European Union. It sets out the railway safety performance in the European Union for the year 2015. The findings published here are from the common safety indicator (CSI) data for 2015, plus information on significant accidents from the European Railway Accident Information Links (ERAIL) system covering 2016.
We thank the Member States for their cooperation in ensuring that all the CSI data were received on time (30 September 2016).
Overall, the CSI data demonstrated that railway safety in the EU-28 has continued to show a general improvement since 2010. Up to 2015 the number of fatalities and serious injuries was down, as was the number of significant accidents. We are concerned, however, by a stagnation in the reduction of the number of fatalities to:
• level-crossing users, and
• employees.
Neither of these indicators showed improvement in the 3 years from 2013 to 2015. In add-ition, the number of precursor incidents rose sharply, principally driven by track buckles. There are several reasons why such precursors might have become more common, but without further data at EU level it is not possible to know with any certainty what these might be. We can only say at this stage that the trend reflects either:
• better or increased reporting of precursor incidents;
• an increase in railway safety risk; or
• a combination of the above.
Without better safety management data, reporting systems and analysis we cannot begin to address the root causes and drivers of such changes. We hope to work with national safety authorities to achieve better understanding and sharing of what is already collected nationally.
Looking ahead to the data from 2016 on the Agency’s ERAIL system, it is a matter of deep concern that we see an increase in each of the numbers of fatalities in train collisions and derailments and the number of accidents with five or more fatalities. This should serve as a call to action for us all to work harder to control risks and maintain a sustainable and safe railway system.
European Union Agency for Railways
13 July 2017
SAFETY OVERVIEW | 3

4 | SAFETY OVERVIEW 2017
A background note about the data and their collection
We are aware that some national safety authorities (NSAs) experienced problems in up-loading their data to the European Railway Accident Information Links (ERAIL) (1) system (common safety indicator (CSI) section). The Agency is working to ensure these problems will not arise again and, in parallel, we are exploring the options for and costs of a new IT solution as part of the common occurrence reporting project (2), which is intended to develop wider reporting and data sharing over the next 5 years.
In reporting the trends or the direction of trends (upwards or downwards) we have nor-mally used the 2011-2015 period, sometimes with a comparison to the 2015 data. Occa-sionally we have used the 10-year period from 2006 to 2015. In previous reports the norm was to look back over the last 3 years. While, due to a lack of consistent data, this was acceptable when the Agency first started to report, we now have between 6 and 10 years of indicator data supplied to us with consistent definitions. Where we have consistent data for longer time periods we use these to illustrate the medium- and longer-term trends.
(1) ERAIL: European Rail Accidents Information Links is a public database hosted by the Agency in order that the national investigation bodies in each Member State can share information and recommendations relating to safety occurrences in the European railway system.
(2) http://www.era.europa.eu/Core-Activities/Safety/Safety-Performance/Pages/Common-occurrence-reporting.aspx

KEY FIGURES | 5
Key figures
Accident outcomes
Over the last 4 reported years there have been on average just over 2 000 significant acci-dents each year on the railways of the EU Member States. Accidents to persons caused by rolling stock in motion and level-crossing accidents constitute more than three quarters of railway accidents, excluding suicides. In these accidents on average just under 1 100 persons are killed and 900 persons seriously injured each year. There has been a long-term downward trend in all these indicators.
In 2015 all of these CSIs continued to improve across the EU, with 1 808 significant acci-dents resulting in 963 fatalities and 684 persons seriously injured. The year-to-year reduc-tion between 2014 and 2015 is significant for accidents, fatalities and serious injury num-bers. These main outcomes decreased over recent years (Figure 1).
Figure 1: Significant accidents and resulting casualties (EU-28; 2010-2015)
* Not all EU-27 Member States reported during the 2006-2009 period.
In addition to collating and reporting the CSIs from the NSAs, the relevant national inves-tigation bodies (NIBs) report serious and catastrophic accident investigations in the ERAIL system. In 2014 we were able to report, for the first time since the Agency’s inception, that
1 517 1 478 1 383 1 270 1 206 1 135 1 129 1 054 963
1 367 1 380
1 1041 249
1 0501 015 911
819
684
2 292 2 2242 069
1 980 2 076
1 808
0
500
1 000
1 500
2 000
2 500
3 000
3 500
4 000
2007* 2008* 2009* 2010 2011 2012 2013 2014 2015
Fatalities Serious injuries Significant accidents

6 | SAFETY OVERVIEW 2017
there had been no catastrophic railway accidents (3) in the Member States. However, there were two catastrophic collisions or derailments on EU railways in 2015 and three in 2016.
It should be noted that the 2015 data exclude the accident at Eckwersheim (France). This accident took place on 14 November 2015, during the testing phase for a new high-speed line, and involved the derailment of a test train. The Bureau d’enquêtes sur les accidents de transport terrestre (BEA-TT — the French NIB) reported the occurrence in ERAIL (under the category ‘Other’). In October 2016 the Établissement public de sécurité ferroviaire (EPSF — the French NSA) informed us that they considered the accident outside of the scope of the railway safety directive (4) for the purposes of reporting. The final report on the accident was published by BEA-TT on 23 May 2017 (5). There are clearly lessons to be learnt from this accident and a judicial inquiry is still in progress, therefore we have refrained from including this occurrence in the safety statistical reporting.
Although the 2015 and 2016 catastrophic accident outcomes are below the average number of accidents in this category recorded over the past decade, they are nevertheless a deterioration in comparison to the result achieved in 2014 and in the 2010-2014 period (see Figure 2).
The trend in the accident rate per billion train-kilometres for accidents resulting in five or more fatalities is downward over the 1980-2016 period.
The data in Figures 2 and 3 come from the historical archive of railway accidents main-tained by the Agency; they show the number of major accidents and resulting fatalities for the 37 years covering the 1980-2016 period. This historical archive includes not only train collisions and derailments with five or more fatalities, but also major level-crossing acci-dents, train fires and accidents involving groups of persons struck by rolling stock in motion. Figure 2 is a composite graph showing the numbers of railway accidents resulting in more than five fatalities and the total number of fatalities per year. Such accidents are sometimes described as catastrophic due to the size of their impact on society and on the railway sector, although this term is not defined by legislation.
Figure 2: Railway accidents with five or more fatalities (1980-2016) (6)
(3) A catastrophic accident can be described as one with more than five fatalities, but it should be noted that this term is not defined by legislation.
(4) Directive 2004/49/EC of the European Parliament and of the Council of 29 April 2004 on safety on the Community’s railways and amending Council Directive 95/18/EC on the licensing of railway undertakings and Directive 2001/14/EC on the allocation of railway infrastructure capacity and the levying of charges for the use of railway infrastructure and safety certification (railway safety directive).
(5) See http://www.bea-tt.developpement-durable.gouv.fr/IMG/pdf/rapport_beatt_2015-016.pdf(6) All EU Member States, plus Norway and Switzerland, excluding Romania for the 1980-1989 period. Accidents on
railway mainlines not covered by the railway safety directive are also included.
227
8598
52
98
191
33 37
174
66 71
46
86
46
80
40 36
64
121
5238
30
5668
17 22 188
28
68
39
10
38
97
0 10
42
0
50
100
150
200
250
0
2
4
6
8
10
12
14
19801981
19821983
19841985
19861987
19881989
19901991
19921993
19941995
19961997
19981999
20002001
20022003
20042005
20062007
20082009
20102011
20122013
20142015
2016
Fata
lities
Acci
dent
s (≥
five
fata
lities
)
Fatalities Accidents

KEY FIGURES | 7
While the long-term trend is downwards, the number of accidents with multiple fatalities has risen since 2014. This negative trend is of concern to the Agency and others engaged with the oversight of railway safety. While the change in the number of accidents is not statistically significant, this is not true for the change in the number of fatalities occurring in 2016, therefore we consider that robust conclusions can be drawn from this worrying upward trend.
The overall level of railway safety in the EU, as measured by fatal train collisions and derail-ments per billion train-kilometres, has also gradually improved since 1990, although there is considerable scatter from year to year.
Figure 3: Fatal train collisions and derailments per billion train-kilometres (EU-28, Norway and Switzerland (7); 1990-2016 — train-kilometres for 2016 are an estimate based on 2015 data)
The analysis of trends, illustrated in Figure 3, shows a reduction in the accident rate of between 5.7 % (using the 5-year moving average rate of change) and 6.52 % (accident rate for individual years 1980 and 2015) per year. This gives a fall of 75 % from 1990 to 2015. Despite this long-term trend, the Agency is concerned to see that in 2016 there was a stat-istically significant increase in these combined indicators.
For further information regarding fatal train collisions and derailments in 2016 see the section on serious accidents — Table 4.
Trend analyses
The Agency was set up in 2004. For the majority of Member States in the European Union CSI data now exist for the 10 years from 2006 to 2015. We note that three Member States (Greece, Hungary — possibly related to the migrant crisis — and the Netherlands) and the Channel Tunnel had 2015 outcomes for all fatalities that went against the three 5-year global trend averages or the 10-year global trend, and that one Member State, Austria, had a 2015 outcome that was worse than the three 5-year means. The trend analyses are shown in Figure 4.
(7) Figure courtesy of Andrew W. Evans (Imperial College and University College London), based on own database of fatal train accidents and collisions and on the train-kilometre data from ERA, Eurostat and the Union internationale des chemins de fer.
1990
1991
1992
1993
1994
1995
1996
1997
1998
1999
2000
2001
2002
2003
2004
2005
2006
2007
2008
2009
2010
2011
2012
2013
2014
2015
2016
Fata
l tra
in c
ollis
ions
and
der
ailm
ents
per
bill
ion
trai
n-km
Accidents5-year moving averageAccidents / billion train-km
6.0
5.0
4.0
3.0
2.0
1.0
0.0
25
20
15
10
5
0
10
4
65
76
11
6
9
5
87
6
1314
3
17
45
13
11
13
10
14
202019
Acci
dent
s

8 | SAFETY OVERVIEW 2017
Fig
ure
4: R
ailw
ay fa
talit
ies
per m
illio
n tr
ain-
kilo
met
res
(EU
-28,
Nor
way
and
Sw
itzer
land
; 201
5, 5
-yea
r mea
ns a
nd 1
0-ye
ar m
ean
— o
rder
is b
ased
on
2015
per
form
ance
)
Thes
e da
ta a
re fl
agge
d w
ith re
d an
d or
ange
mar
kers
, the
red
indi
catin
g an
indi
vidu
al M
embe
r Sta
te’s
perfo
rman
ce in
201
5 m
ovin
g ag
ains
t the
dow
nwar
d tr
end
for b
oth
the
5- a
nd
10-y
ear a
vera
ges a
nd th
e or
ange
indi
catin
g pe
rform
ance
aga
inst
the
tren
d fo
r onl
y th
e 5-
year
ave
rage
s.
0.0
0.2
0.4
0.6
0.8
1.0
1.2
1.4
1.6
1.8
2.0
2015
2011
- 20
1520
10 -
2014
2009
- 20
1320
06 -
2015
KEY FIGURES | 9
050100
150
200
250
300
AT
BEBG
CHCT
CZD
ED
KEE
ELES
FIFR
HR
HU
IEIT
LTLU
LVN
LN
OPL
PTRO
SESI
SKU
K
Tota
l num
ber
of s
igni
fican
t acc
iden
tsTo
tal n
umbe
r of
per
sons
kill
ed (e
xclu
ding
sui
cide
s) in
all
acci
dent
sTo
tal n
umbe
r of
per
sons
ser
ious
ly in
jure
d (e
xclu
ding
att
empt
ed s
uici
des)
in a
ll ac
cide
nts
Fig
ure
5: N
umbe
r of s
igni
fican
t acc
iden
ts, t
otal
fata
litie
s (in
clud
ing
unau
thor
ised
per
sons
but
exc
ludi
ng s
uici
des)
and
tota
l ser
ious
ly in
jure
d (in
clud
ing
unau
thor
ised
per
sons
, ex
clud
ing
atte
mpt
ed s
uici
des)
on
railw
ays
(EU
-28,
Nor
way
and
Sw
itzer
land
; 201
5)
10 | SAFETY OVERVIEW 2017
Figure 4 illustrates the detection of trends, both negative and positive, in railway safety. This suggests that further improvement in safety performance is possible. We discussed above the negative trends illustrated in the report, but we can also see positive improvements in a number of priority Member States, along with others that had previously exhibited lower levels of railway safety. By looking at the data and statistics in a different way we may be able to help to identify problem areas and, ultimately, drive further improvement in railway safety. These trend analyses are designed to help Member States in their tracking of continuous safety improvement set out in Article 4(1)(a) of Directive (EU) 2016/798.
Accidents, fatalities and serious injuries
The number one strategic objective of the European Union Agency for Railways (ERA) is to make the EU the world leader in railway safety. Although comparative data are not readily available, we believe that to achieve this the number of accidents, fatalities and serious injuries still has to be reduced. We have so far focused our efforts on achieving improve-ment in those Member States not yet performing to the current EU average, where the rate of accidents, passenger fatalities and serious injuries is normalised either by usage or by operational or network parameters (see the report Railway safety performance in the European Union 2016 (8)).
This reduction in the variance of performance would support the wider strategic objective of creating a single European railway area. It is also a striking fact that, based upon the 2011-2015 indicators, if all Member States were to achieve this normalised EU average the actual number of fatalities would have been reduced from 5 487 to 3 151 — more than 450 fewer fatalities per year.
Normalising the data in this way allows an assessment of performance relative to risk ex-posure, or an understanding of the rate at which the railways in Member States are mov-ing passengers and goods without harm. Although undoubtedly a useful form of analysis, this can create a distorted picture of rail safety if used by itself.
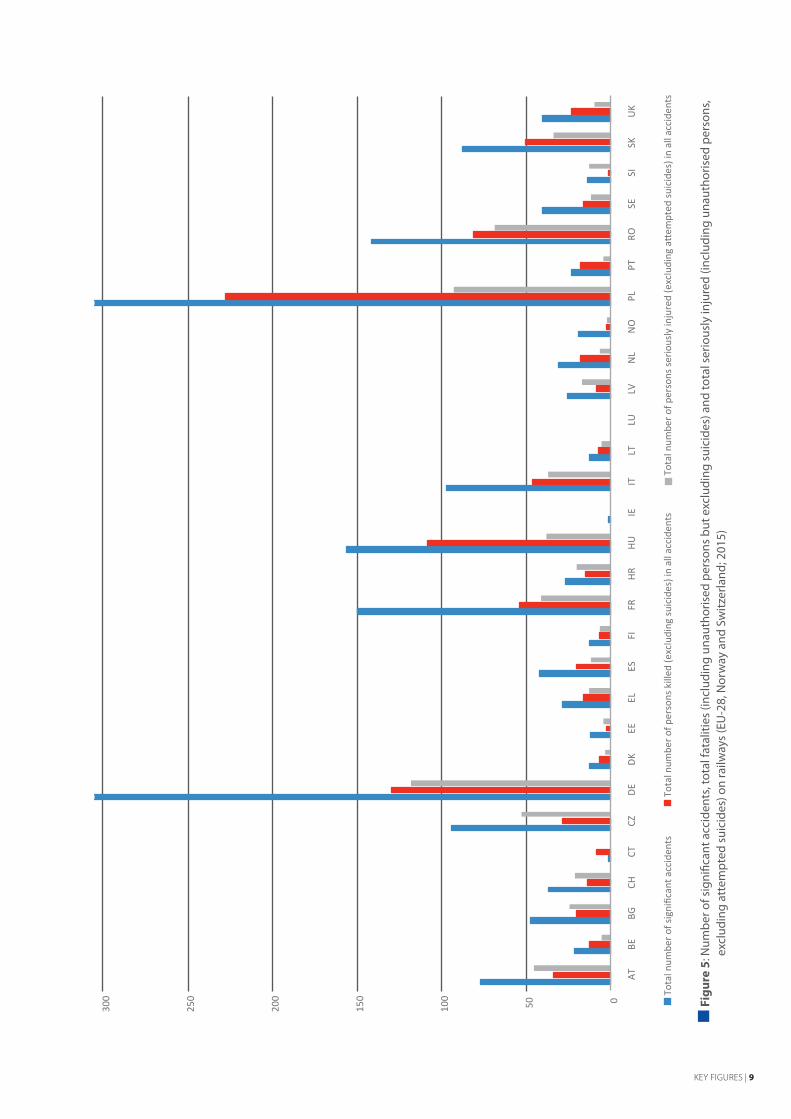
As the Member States previously identified for support (9) on the basis of normalised data improve, additional improvement may be found by targeting those Member States with the highest absolute numbers of accidents, as shown in Figure 5.
(8) http://erail.era.europa.eu/documents/SPR.pdf(9) The priority countries programme.

KEY FIGURES | 11

12 | SAFETY OVERVIEW 2017
One important area in which improvement has not been seen is in the number of worker fatalities (Figure 6).
Figure 6: Fatalities and serious injuries to railway workers (EU-28; 2006-2015)
* Excludes Croatia prior to 2010.
We have analysed the number of fatalities and serious injuries to railway workers over the 10-year period from 2006 to 2015. While the number of workers seriously injured fell from 126 in 2006 to 49 in 2015 (a fall of over 60 %), the number of fatalities fell from 38 in 2006 to 34 in 2015 (just over a 10 % fall). The trend over the 3 years from 2013 saw an increase in the number of worker fatalities of more than 20 % from 28 in 2013 to 34 in 2015. Had the worker fatality outcome trend followed that for worker serious injuries, we would have expected only 15 worker fatalities in 2015, i.e. 19 fewer fatalities than were reported.
Risk levels
Accident risk is expressed as the number of outcomes per exposure. Considering all rail-way fatalities (excluding suicides), the fatality risk per million train-kilometres in the 2011-2015 period was 0.27 fatalities per million train-kilometres in the EU Member States. The figure for 2015 alone is lower at 0.23 fatalities per million train-kilometres. Values of risk vary greatly between Member States, with a more than 30-fold difference between Mem-ber State safety outcomes. The distribution of Member States’ accident risk, expressed as the fatality risk per million train-kilometres over the 5 years from 2011 to 2015, is shown in Figure 7.
38 38 38
29
44
30
46
28 2934
126
110
129
70
96
7782
72
63
49
0
20
40
60
80
100
120
140
2006* 2007* 2008* 2009* 2010 2011 2012 2013 2014 2015
Worker fatalities Worker serious injuries

KEY FIGURES | 13
Figure 7: Railway accident fatality risk on EU railways: fatalities per million train-kilometres (2011-2015)
Personal risk for railway passengers can be expressed in terms of passenger fatalities per passenger-kilometre. For the EU-28 over the 5 years from 2011 to 2015 and 2015 alone, the fatality risk range was between 0 and 0.085 fatalities per 100 billion passenger-kilometres respectively. Figure 8 maps the passenger fatality risk over the 5 years from 2011 to 2015 by Member State.

14 | SAFETY OVERVIEW 2017
Figure 8: Map of personal risk on railways: passenger fatalities per 100 billion passenger-kilometres (EU-28, Norway and Switzerland; 2011-2015)
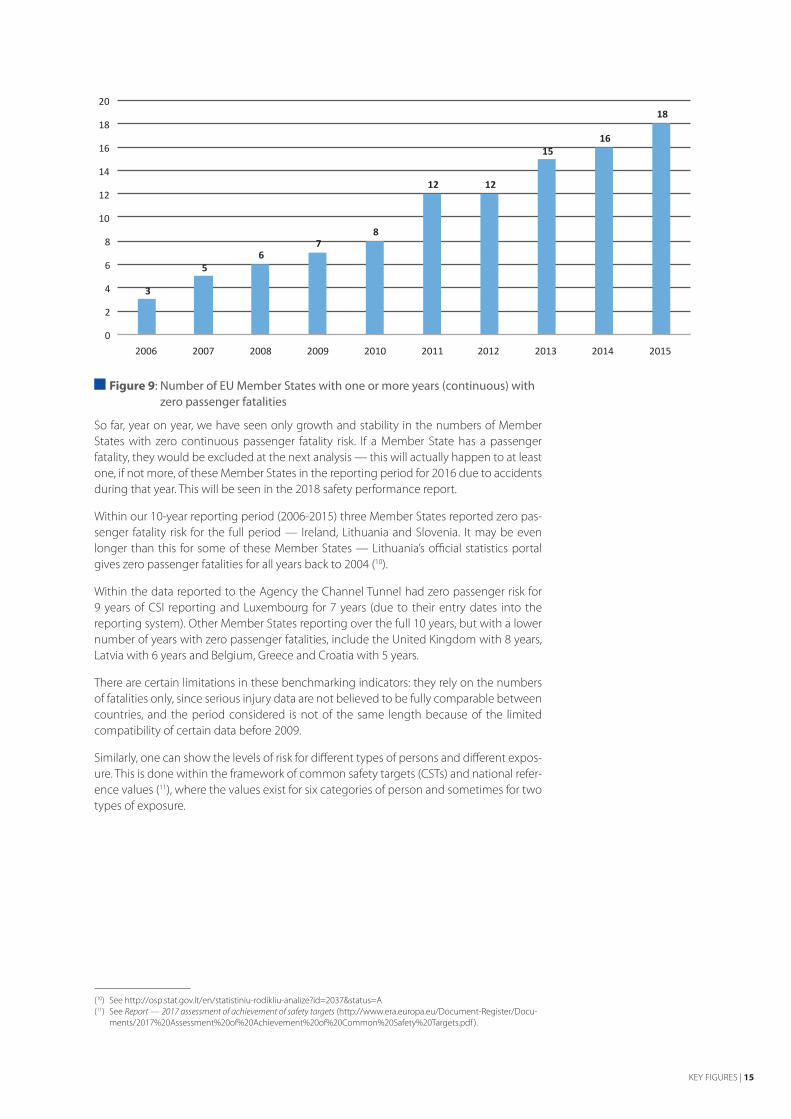
In the last safety overview report (covering the 2006-2013 period) we reported that six Member States and the Channel Tunnel had recorded no passenger fatalities in the review period, thus their passenger fatality risk is zero. In this report we look further into this aspect. We observe an increase in the number of Member States reporting zero passenger fatality risk per year (see Figures 8 and 9).
KEY FIGURES | 15
0
2
4
6
8
10
12
14
16
18
20
2006
3
56
78
12 12
1516
18
2007 2008 2009 2010 2011 2012 2013 2014 2015
Figure 9: Number of EU Member States with one or more years (continuous) with zero passenger fatalities
So far, year on year, we have seen only growth and stability in the numbers of Member States with zero continuous passenger fatality risk. If a Member State has a passenger fatality, they would be excluded at the next analysis — this will actually happen to at least one, if not more, of these Member States in the reporting period for 2016 due to accidents during that year. This will be seen in the 2018 safety performance report.
Within our 10-year reporting period (2006-2015) three Member States reported zero pas-senger fatality risk for the full period — Ireland, Lithuania and Slovenia. It may be even longer than this for some of these Member States — Lithuania’s official statistics portal gives zero passenger fatalities for all years back to 2004 (10).
Within the data reported to the Agency the Channel Tunnel had zero passenger risk for 9 years of CSI reporting and Luxembourg for 7 years (due to their entry dates into the reporting system). Other Member States reporting over the full 10 years, but with a lower number of years with zero passenger fatalities, include the United Kingdom with 8 years, Latvia with 6 years and Belgium, Greece and Croatia with 5 years.
There are certain limitations in these benchmarking indicators: they rely on the numbers of fatalities only, since serious injury data are not believed to be fully comparable between countries, and the period considered is not of the same length because of the limited compatibility of certain data before 2009.
Similarly, one can show the levels of risk for different types of persons and different expos-ure. This is done within the framework of common safety targets (CSTs) and national refer-ence values (11), where the values exist for six categories of person and sometimes for two types of exposure.
(10) See http://osp.stat.gov.lt/en/statistiniu-rodikliu-analize?id=2037&status=A(11) See Report — 2017 assessment of achievement of safety targets (http://www.era.europa.eu/Document-Register/Docu-
ments/2017%20Assessment%20of%20Achievement%20of%20Common%20Safety%20Targets.pdf ).
16 | SAFETY OVERVIEW 2017
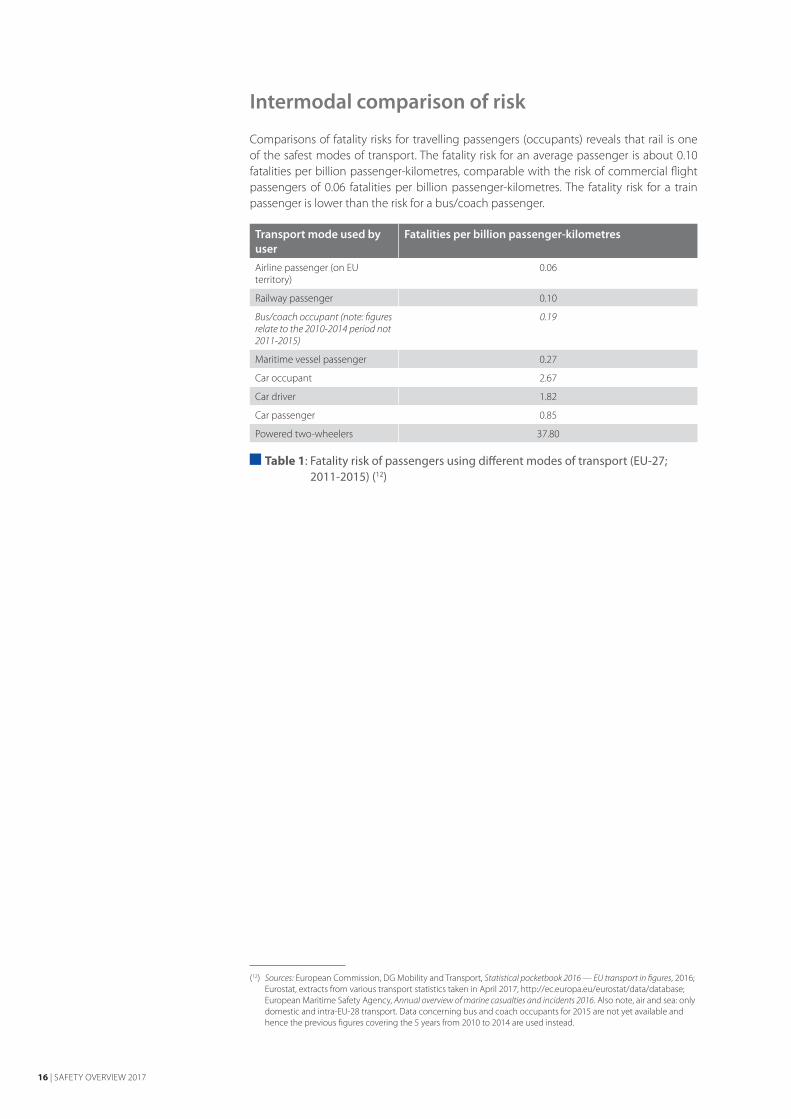
Intermodal comparison of risk
Comparisons of fatality risks for travelling passengers (occupants) reveals that rail is one of the safest modes of transport. The fatality risk for an average passenger is about 0.10 fatalities per billion passenger-kilometres, comparable with the risk of commercial flight passengers of 0.06 fatalities per billion passenger-kilometres. The fatality risk for a train passenger is lower than the risk for a bus/coach passenger.
Transport mode used by user
Fatalities per billion passenger-kilometres
Airline passenger (on EU territory)
0.06
Railway passenger 0.10
Bus/coach occupant (note: figures relate to the 2010-2014 period not 2011-2015)
0.19
Maritime vessel passenger 0.27
Car occupant 2.67
Car driver 1.82
Car passenger 0.85
Powered two-wheelers 37.80
Table 1: Fatality risk of passengers using different modes of transport (EU-27; 2011-2015) (12)
(12) Sources: European Commission, DG Mobility and Transport, Statistical pocketbook 2016 — EU transport in figures, 2016; Eurostat, extracts from various transport statistics taken in April 2017, http://ec.europa.eu/eurostat/data/database; European Maritime Safety Agency, Annual overview of marine casualties and incidents 2016. Also note, air and sea: only domestic and intra-EU-28 transport. Data concerning bus and coach occupants for 2015 are not yet available and hence the previous figures covering the 5 years from 2010 to 2014 are used instead.

ACCIDENT OUTCOMES | 17
Accident outcomes
Significant accidents
The lowest number of significant accidents for the 2011-2015 period was recorded in 2015. Three categories of accidents decreased, i.e. accidents to persons, level-crossing accidents and derailments of trains (see Figure 10). However, there were increases in the numbers of collisions of trains, fires in rolling stock and all other types of accidents. Using standard statistical methods, these decreases in accidents to persons, level-crossing accidents and derailments of trains are statistically significant (13), however the increases relating to colli-sions of trains, fires in rolling stock and other accidents are not. Table 2 below indicates the number of accidents by category in 2015 compared with the mean number of accidents per year over the 5 years from 2011 to 2015, the difference between the actual number in 2015 and the mean, and whether or not the change was statistically significant.
Number of accidents 2015
Mean number of accidents per year 2011-2015
+/– compared to the mean
Statistically significant at the 5 % level
Collisions of trains 123 96 27 No
Derailments of trains 77 99 – 22 Yes
Level-crossing accidents 469 540 – 71 Yes
Accidents to persons 1 024 1 282 – 258 Yes
Fires in rolling stock 30 21 9 No
Other accidents 85 90 – 5 No
All accidents 1 808 2 128 – 320 Yes
Table 2: Comparison of significant accidents in 2015 compared to the 5-year mean (2011-2015) and whether the change observed in 2015 was statistically significant or not
(13) Savage, I., The economics of railroad safety, Kluwer Academic Publishers, Dordrecht, 2014, p. 178. The test examined whether there was a greater than 5 % probability that the decreases did not occur at random at the 95 % significance level for all the accident subclassifications. By using the 5 % probability level we assessed whether such changes could occur at random once in 20 years. See http://faculty.wcas.northwestern.edu/~ipsavage/103-manuscript.pdf

18 | SAFETY OVERVIEW 2017
Fig
ure
10: S
igni
fican
t acc
iden
ts p
er ty
pe o
f acc
iden
t (EU
-28;
201
1-20
15)
0
500
1 00
0
1 50
0
2 00
0
2 50
0
7397
10112
412
3
Colli
sions
of
trai
ns
9197
108
104
77
Dera
ilmen
ts
of tr
ains
517
573 51
050
646
9
Leve
l-cro
ssin
gac
cide
nts
1 45
1 1 20
71 15
5 1 21
1 1 02
4
Acci
dent
s to
per
sons
1614
3031
30
Fire
s in
rolli
ng st
ock
7681
7610
085
Oth
er a
ccid
ents
2 22
4 2 06
91
9802
076 1
808
All a
ccid
ents
2011
2012
2013
2014
2015
ACCIDENT OUTCOMES | 19
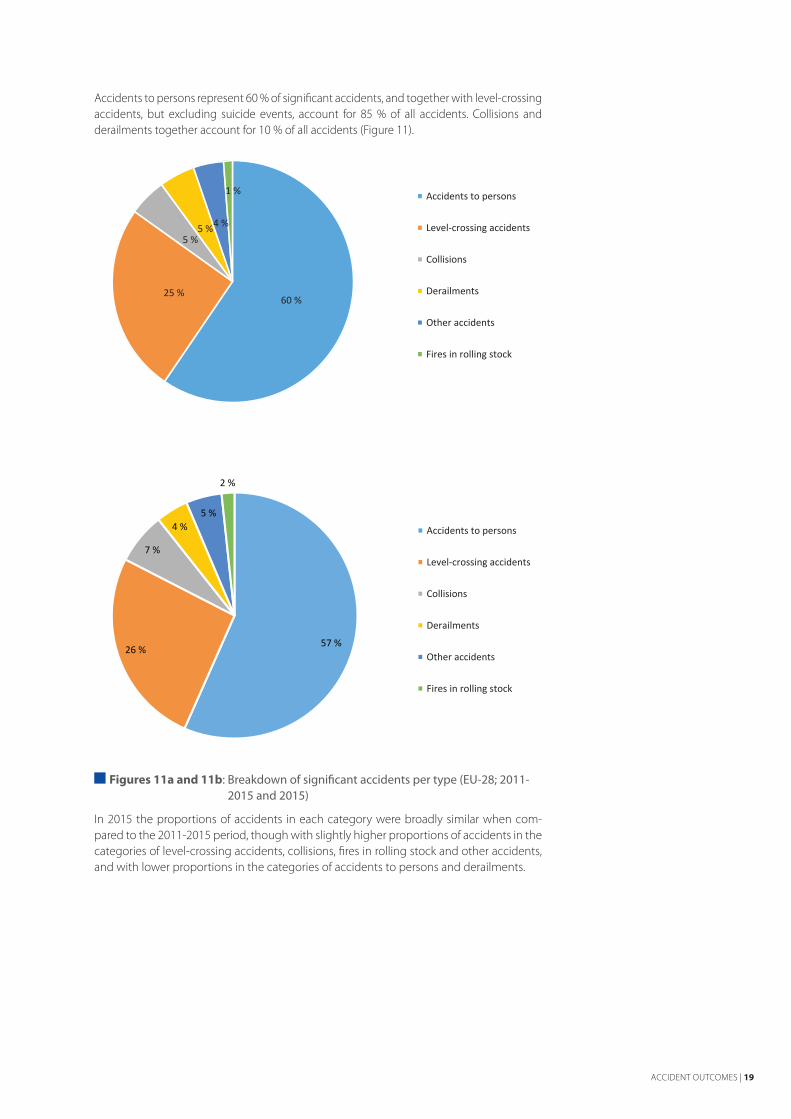
Accidents to persons represent 60 % of significant accidents, and together with level-crossing accidents, but excluding suicide events, account for 85 % of all accidents. Collisions and derailments together account for 10 % of all accidents (Figure 11).
Figures 11a and 11b: Breakdown of significant accidents per type (EU-28; 2011-2015 and 2015)
In 2015 the proportions of accidents in each category were broadly similar when com-pared to the 2011-2015 period, though with slightly higher proportions of accidents in the cat egories of level-crossing accidents, collisions, fires in rolling stock and other accidents, and with lower proportions in the categories of accidents to persons and derailments.
60 %25 %
5 %5 %4 %
1 %
Accidents to persons
Level-crossing accidents
Collisions
Derailments
Other accidents
Fires in rolling stock
57 %26 %
7 %
4 %5 %
2 %
Accidents to persons
Level-crossing accidents
Collisions
Derailments
Other accidents
Fires in rolling stock
20 | SAFETY OVERVIEW 2017
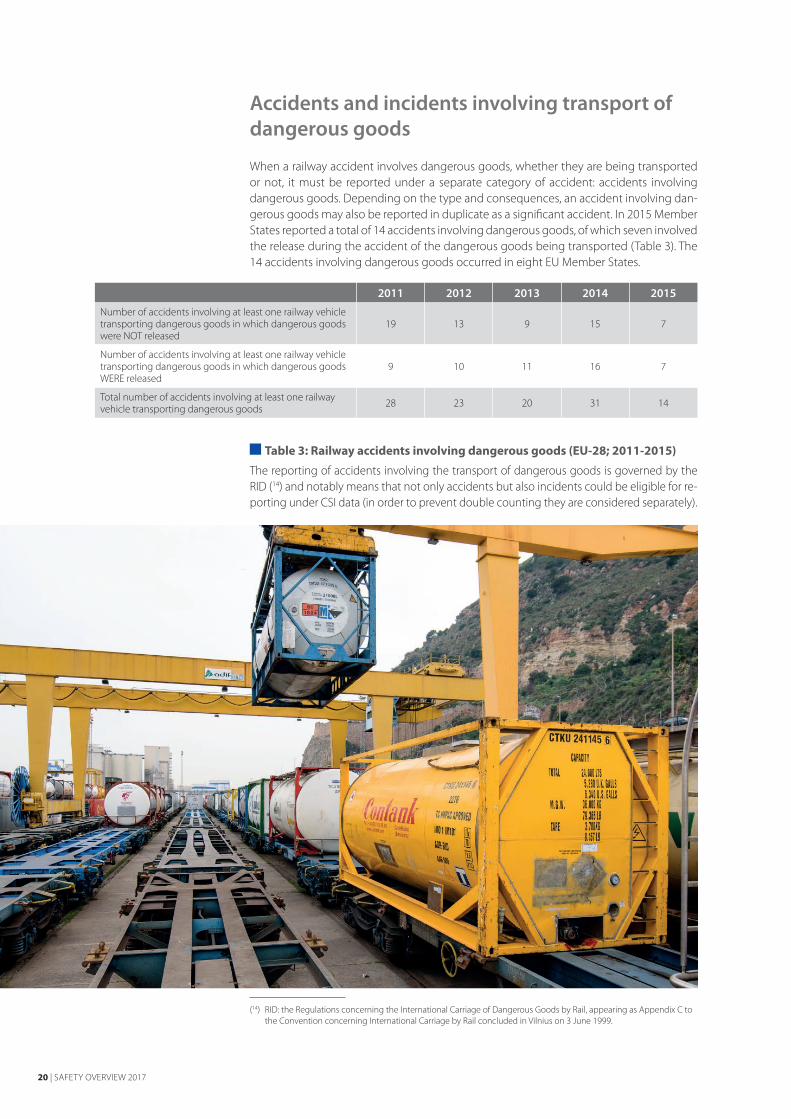
Accidents and incidents involving transport of dangerous goods
When a railway accident involves dangerous goods, whether they are being transported or not, it must be reported under a separate category of accident: accidents involving dangerous goods. Depending on the type and consequences, an accident involving dan-gerous goods may also be reported in duplicate as a significant accident. In 2015 Member States reported a total of 14 accidents involving dangerous goods, of which seven involved the release during the accident of the dangerous goods being transported (Table 3). The 14 accidents involving dangerous goods occurred in eight EU Member States.
2011 2012 2013 2014 2015
Number of accidents involving at least one railway vehicle transporting dangerous goods in which dangerous goods were NOT released
19 13 9 15 7
Number of accidents involving at least one railway vehicle transporting dangerous goods in which dangerous goods WERE released
9 10 11 16 7
Total number of accidents involving at least one railway vehicle transporting dangerous goods 28 23 20 31 14
Table 3: Railway accidents involving dangerous goods (EU-28; 2011-2015)
The reporting of accidents involving the transport of dangerous goods is governed by the RID (14) and notably means that not only accidents but also incidents could be eligible for re-porting under CSI data (in order to prevent double counting they are considered separately).
(14) RID: the Regulations concerning the International Carriage of Dangerous Goods by Rail, appearing as Appendix C to the Convention concerning International Carriage by Rail concluded in Vilnius on 3 June 1999.

ACCIDENT OUTCOMES | 21
Suicides on railway premises
Suicide events are reported separately from other railway accidents. Since the classifica-tion of suicide cases is subject to national practices, there is a high degree of uncertainty about their real numbers as compared to unauthorised person (trespasser) fatalities. For this reason, these data are presented together in Figure 12.
The Det Norske Veritas (DNV) study on the Assessment of the impact of rail suicides on EU railways (15) recommended that:
What would be of benefit is to simplify and harmonise the existing reporting arrangements so that they are clearer and more transparent.
DNV went on to further recommend the use of harmonised definitions, for example the amendment and use of the X81 code of the ICD-10 (International Statistical Classification of Diseases and Related Health Problems, 10th revision) classification system and the har-monisation of the guidance used by police in categorising railway suicides and trespasser fatalities.
Since 2010 suicides have ranged between 2 756 and 2 982 annually. Since the peak in the number of suicides in 2012 of 2 982, they have fallen back to 2 762 in 2015. When assessed at Member State level (see Figure 12a) it is apparent that Member States need to improve and harmonise their classification of suicides. This is vital in understanding their causes and, ultimately, improving the management of this risk.
(15) DNV GL, Review of data quality and approach of the Agency annual report on safety — Assessment of the impact of rail suicides on EU railways, 9 December 2015 (http://www.era.europa.eu/Document-Register/Documents/DNV%20COR%20study%20-%20Task%202%20report.pdf ). See page 53.

22 | SAFETY OVERVIEW 2017
Figure 12: Suicide fatalities and unauthorised persons fatalities on railways (EU-28; 2006-2015)
A positive point that can be taken from Figure 12 is the fall in the numbers of unauthorised persons being killed. In the past 5 years there has been a reduction from 804 (2011) to 591 (2015), a fall of 26 %. Whether or not they are ‘railway caused’, these events are a source of appalling personal tragedy, including the impact on railway staff, along with significant delays and unnecessary costs for the rail system as a whole.
In recent years we have considered the use of different methods to normalise suicide fa-tality statistics (see footnote 15), for example by using the correlation with national overall suicide rates, the availability of the railway to the public expressed by total train-kilometres or traffic density. Figure 12b on the following page shows the comparative analyses of suicides/million train-kilometres for 2015, the three 5-year means for 2015-2011, 2014-2010 and 2013-2009 and the 10-year mean for 2015-2006.
1 874
2 6142 413
2 762 2 756 2 890 2 982 2 819 2 895 2 762
940
855928
849 766804 655
681 704591
0
500
1 000
1 500
2 000
2 500
3 000
3 500
4 000
2006 * 2007 * 2008 * 2009 * 2010 2011 2012 2013 2014 2015
Suicides Unauthorised persons

ACCIDENT OUTCOMES | 23
0
1 00
0
2 00
0
3 00
0
4 00
0
5 00
0
6 00
0
CTIE
LUEE
NO
ELLV
SILT
DK
HR
BGFI
PTSE
SKBE
AT
CHRO
ESIT
HU
NL
CZU
KPL
FRD
E
Suic
ides
Tota
l num
ber
of p
erso
ns k
illed
in a
ll ac
cide
nts
Fig
ure
12a:
All
railw
ay fa
talit
ies
and
suic
ide
fata
litie
s on
railw
ays
(EU
-28,
Nor
way
and
Sw
itzer
land
; 201
1-20
15)

24 | SAFETY OVERVIEW 2017
Fig
ure
12b:
Tre
nds
in ra
ilway
sui
cide
s pe
r mill
ion
trai
n-ki
lom
etre
s on
railw
ays
(EU
-28,
Nor
way
and
Sw
itzer
land
; 201
5, 2
015-
2011
, 201
4-20
10, 2
013-
2009
and
201
5-20
06 —
the
sort
ing
of M
embe
r Sta
tes
is b
ased
upo
n th
eir 2
015
resu
lt)
0.00
0.20
0.40
0.60
0.80
1.00
1.20
1.40
1.60
CT
IE N
O LT
LU
EL
IT P
L D
K U
K R
O H
U E
S S
E LV
FR
AT
BG
CH
SI
DE
BE
FI
EE
PT
SK
CZ
NL
HR
EU
28
2015
2015
-201
120
14-2
010
2013
-200
920
15-2
006

ACCIDENT OUTCOMES | 25
The normalised data show significant increases in the rates of suicides per million train-kilometres in Croatia, Slovakia, Estonia and Latvia. The changes seen in 2015 result from:
• an increase in the number of suicides (Slovakia and Latvia);
• a decrease in the number of train-kilometres operated (Croatia);
• a combination of both of the above (Estonia).
Higher rates of suicide on the railways were seen in 2015 when compared to the short- and medium-term trends in Greece, Poland, Denmark, Sweden, Switzerland, Belgium and the Netherlands. Lower rates in 2015 compared to the short- and medium-term trends are seen in Lithuania, Italy, the United Kingdom, Romania, Austria, Germany and the Czech Republic.
Improvements in 2015 and improving trends were observed in Ireland, Norway, Luxem-bourg, Hungary, Spain, France, Bulgaria, Slovenia, Finland and Portugal.
Casualties (fatalities and serious injuries) from significant accidents
In parallel with the decrease in railway accidents, the total number of casualties, excluding suicides, has fallen steadily in recent years. There were 1 206 fatalities reported for 2011, and by 2015 this had fallen to 963, a reduction of just over 20 %.
Figure 13: Number of fatalities per victim category (EU-28; 2011-2015)
The Agency is particularly concerned with the stagnation in improvement in two categor-ies: level-crossing users and employees.
Level-crossing fatalities represent just under 28 % of railway fatalities, but only about 1 % of road-user fatalities. While we do not currently collect the causes of level-crossing acci-dents, it is commonly asserted that a significant majority of level-crossing accidents are caused by misuse of level crossings by road users. Nevertheless, better understanding of the root causes and human factors of this misuse could support improved management of this significant railway risk. This would undoubtedly include collaboration with actors in the road sector and relevant authorities, although these risks are marginal as a proportion of road-accident risk.
0
200
400
600
800
1 000
1 200
1 400
38 3697
15 27
Passengers
30 46 28 2934
Employees
309373 300
282288
Level-crossing users
804
655681 704
591
Unauthorised persons
25 25 2324 23
Other persons
1 206
1 1351 129
1 054
963
Total persons
2011 2012 2013 2014 2015
26 | SAFETY OVERVIEW 2017
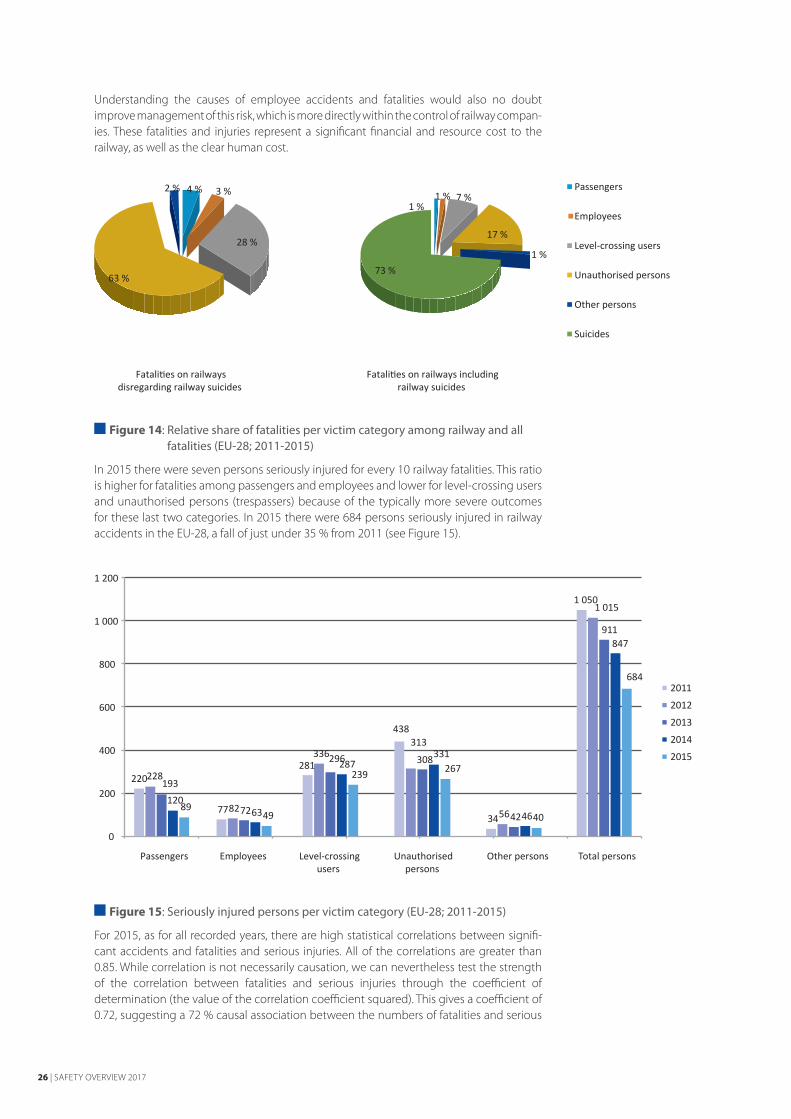
Understanding the causes of employee accidents and fatalities would also no doubt improve management of this risk, which is more directly within the control of railway compan-ies. These fatalities and injuries represent a significant financial and resource cost to the railway, as well as the clear human cost.
Figure 14: Relative share of fatalities per victim category among railway and all fatalities (EU-28; 2011-2015)
In 2015 there were seven persons seriously injured for every 10 railway fatalities. This ratio is higher for fatalities among passengers and employees and lower for level-crossing users and unauthorised persons (trespassers) because of the typically more severe outcomes for these last two categories. In 2015 there were 684 persons seriously injured in railway accidents in the EU-28, a fall of just under 35 % from 2011 (see Figure 15).
Figure 15: Seriously injured persons per victim category (EU-28; 2011-2015)
For 2015, as for all recorded years, there are high statistical correlations between signifi-cant accidents and fatalities and serious injuries. All of the correlations are greater than 0.85. While correlation is not necessarily causation, we can nevertheless test the strength of the correlation between fatalities and serious injuries through the coefficient of determination (the value of the correlation coefficient squared). This gives a coefficient of 0.72, suggesting a 72 % causal association between the numbers of fatalities and serious
1 %1 % 7 %
1 %
Passengers
Employees
Level-crossing users
Unauthorised persons
Other persons
Suicides
Fatalities on railwaysdisregarding railway suicides
Fatalities on railways includingrailway suicides
73 %
17 %
63 %
28 %
4 % 3 %2 %
0
200
400
600
800
1 000
1 200
220228193
12089
Passengers
7782726349
Employees
281336296287
239
Level-crossingusers
438313
308331267
Unauthorisedpersons
3456424640
Other persons
1 0501 015
911847
684
Total persons
2011
2012
2013
2014
2015
ACCIDENT OUTCOMES | 27
injuries, i.e. if there are 10 fatalities there are likely to be seven associated serious injuries. Therefore, if the number of fatalities can be reduced then there is also likely to be a fall in the number of serious injuries.
Precursors to accidents
‘Precursors to accidents’ are incidents that, under other circumstances, could have led to an accident. The indicators reported to the Agency are: broken rails, track buckles, signals passed at danger, wrong-side signalling failures, broken wheels and broken axles (Fig-ure 16).
The reporting of these precursor occurrences is undoubtedly useful. However, the Agency currently has very limited ability to assess the quality or consistency of the reporting of these events. The Agency’s project to develop common occurrence reporting across Eur-ope, which may include an increase in the categories of mandatory reporting set out in EU legislation, should support an increase in data quality and consistency. With that in mind, some of the changes illustrated below may reflect a change in reporting practice rather than the apparent significant changes in underlying risk.

28 | SAFETY OVERVIEW 2017
431
2 42
72
213
4 48
6
9 59
0
472
2 09
6
3 50
5
5 44
2
11 5
59
505
2 06
6
3 71
34
020
10 3
92
559
2 16
1
4 12
04
109
10 9
60
3344
8811
947
6
2 24
3
6 71
2
4 16
9
13 6
09
0
1 00
0
2 00
0
3 00
0
4 00
0
5 00
0
6 00
0
7 00
0
8 00
0
9 00
0
10 0
00
11 0
00
12 0
00
13 0
00
14 0
00
Brok
en w
heel
s an
d ax
les
Wro
ng-s
ide
sign
allin
g fa
ilure
sSi
gnal
s pa
ssed
at d
ange
rTr
ack
buck
les
Brok
en r
ails
To
tal p
recu
rsor
s
2011
2012
2013
2014
2015
Fig
ure
16: R
epor
ted
num
ber o
f pre
curs
ors
(EU
-28;
201
1-20
15)
ACCIDENT OUTCOMES | 29
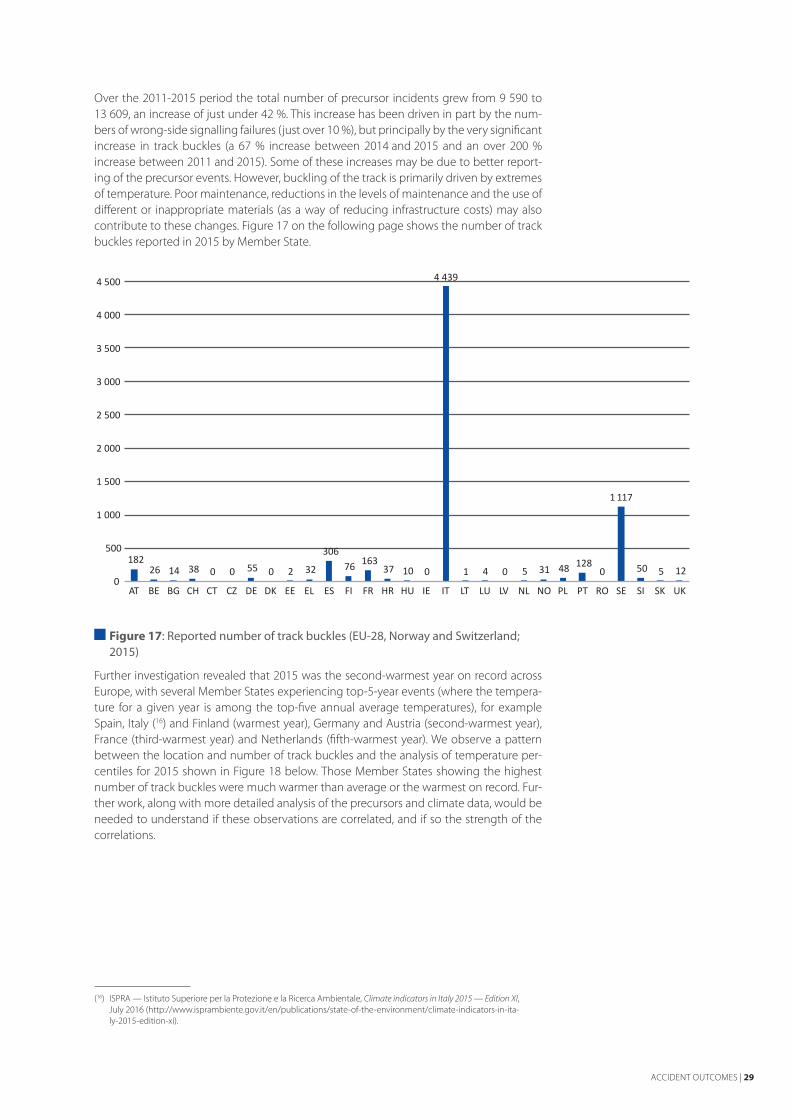
Over the 2011-2015 period the total number of precursor incidents grew from 9 590 to 13 609, an increase of just under 42 %. This increase has been driven in part by the num-bers of wrong-side signalling failures (just over 10 %), but principally by the very significant increase in track buckles (a 67 % increase between 2014 and 2015 and an over 200 % increase between 2011 and 2015). Some of these increases may be due to better report-ing of the precursor events. However, buckling of the track is primarily driven by extremes of temperature. Poor maintenance, reductions in the levels of maintenance and the use of different or inappropriate materials (as a way of reducing infrastructure costs) may also contribute to these changes. Figure 17 on the following page shows the number of track buckles reported in 2015 by Member State.
Figure 17: Reported number of track buckles (EU-28, Norway and Switzerland; 2015)
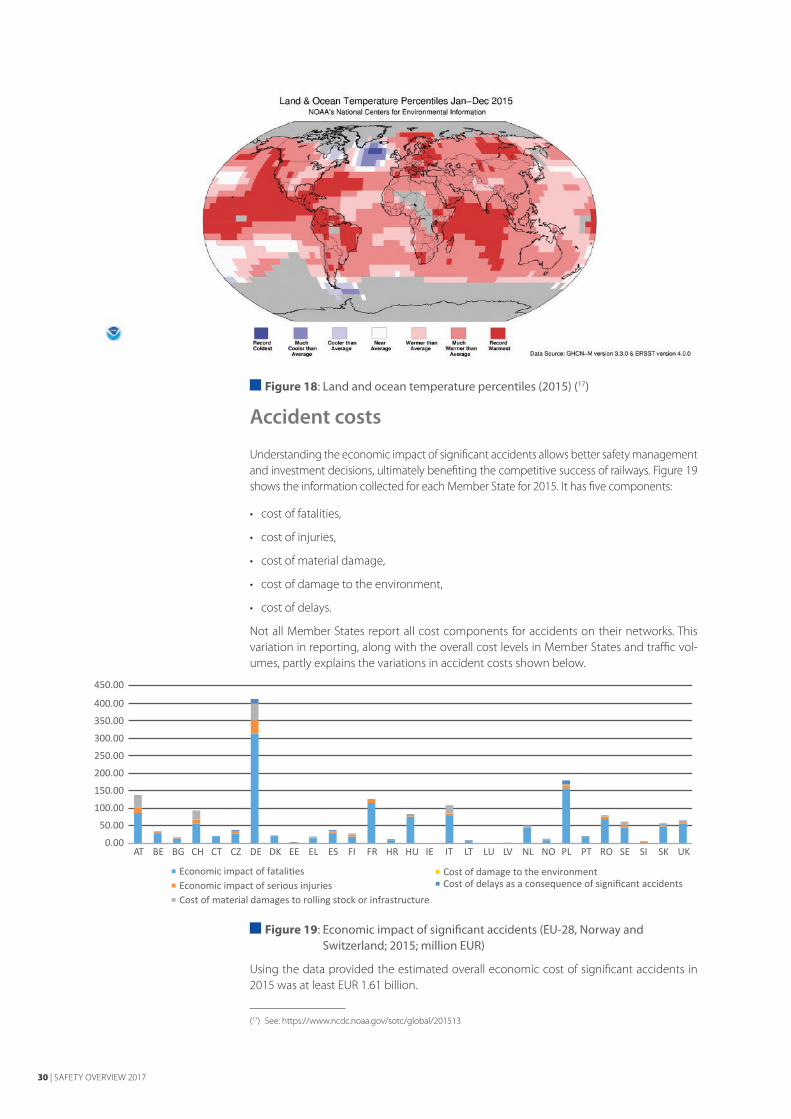
Further investigation revealed that 2015 was the second-warmest year on record across Europe, with several Member States experiencing top-5-year events (where the tempera-ture for a given year is among the top-five annual average temperatures), for example Spain, Italy (16) and Finland (warmest year), Germany and Austria (second-warmest year), France (third-warmest year) and Netherlands (fifth-warmest year). We observe a pattern between the location and number of track buckles and the analysis of temperature per-centiles for 2015 shown in Figure 18 below. Those Member States showing the highest number of track buckles were much warmer than average or the warmest on record. Fur-ther work, along with more detailed analysis of the precursors and climate data, would be needed to understand if these observations are correlated, and if so the strength of the correlations.
(16) ISPRA — Istituto Superiore per la Protezione e la Ricerca Ambientale, Climate indicators in Italy 2015 — Edition XI, July 2016 (http://www.isprambiente.gov.it/en/publications/state-of-the-environment/climate-indicators-in-ita-ly-2015-edition-xi).
18226 14 38 0 0 55 0 2 32
306
76 16337 10 0
4 439
1 4 0 5 31 48 1280
1 117
50 5 120
500
1 000
1 500
2 000
2 500
3 000
3 500
4 000
4 500
AT BE BG CH CT CZ DE DK EE EL ES FI FR HR HU IE IT LT LU LV NL NO PL PT RO SE SI SK UK
30 | SAFETY OVERVIEW 2017
Figure 18: Land and ocean temperature percentiles (2015) (17)
Accident costs
Understanding the economic impact of significant accidents allows better safety management and investment decisions, ultimately benefiting the competitive success of railways. Figure 19 shows the information collected for each Member State for 2015. It has five components:
• cost of fatalities,
• cost of injuries,
• cost of material damage,
• cost of damage to the environment,
• cost of delays.
Not all Member States report all cost components for accidents on their networks. This variation in reporting, along with the overall cost levels in Member States and traffic vol-umes, partly explains the variations in accident costs shown below.
Figure 19: Economic impact of significant accidents (EU-28, Norway and Switzerland; 2015; million EUR)
Using the data provided the estimated overall economic cost of significant accidents in 2015 was at least EUR 1.61 billion.
(17) See: https://www.ncdc.noaa.gov/sotc/global/201513
0.00
50.00
100.00
150.00
200.00
250.00
300.00
350.00
400.00
450.00
AT BE BG CH CT CZ DE DK EE EL ES FI FR HR HU IE IT LT LU LV NL NO PL PT RO SE SI SK UK
Economic impact of fatalities Economic impact of serious injuriesCost of material damages to rolling stock or infrastructure
Cost of damage to the environmentCost of delays as a consequence of significant accidents

SAFETY OF INFRASTRUCTURE | 31
Safety of infrastructure
Installation of automatic train protection (ATP) (18) systems is widely considered to be one of the most effective railway safety measures to reduce the risk of collisions between trains on mainline railways. The penetration of these systems into the national railway network and their use are shown in Figure 20. Since most Member States continue to report the percentage of lines equipped with train protection systems (TPS) (19) that have lower func-tional requirements than ATP systems, direct comparison between them is not possible. The amendment of Annex I of Directive 2014/88/EU (20) introduced a new classification for reporting on different types of TPSs to address this problem. We expect to see these changes reflected in the 2018 safety performance report, to be published in March 2018.
Figure 20: Percentage of main tracks equipped with ATP and percentage of train-kilometres using operational ATP systems (EU-28, Norway and Switzerland; 2015)
The proportion of the European railway network fitted with ATP systems is continuing to grow, however the graph shows a number of Member States with no values. In these cases the Member States did not report a value to the Agency, yet we are aware that some have ATP systems that are in operation, for example the United Kingdom, which has both ETCS- and non-ETCS-compliant systems for ATP.
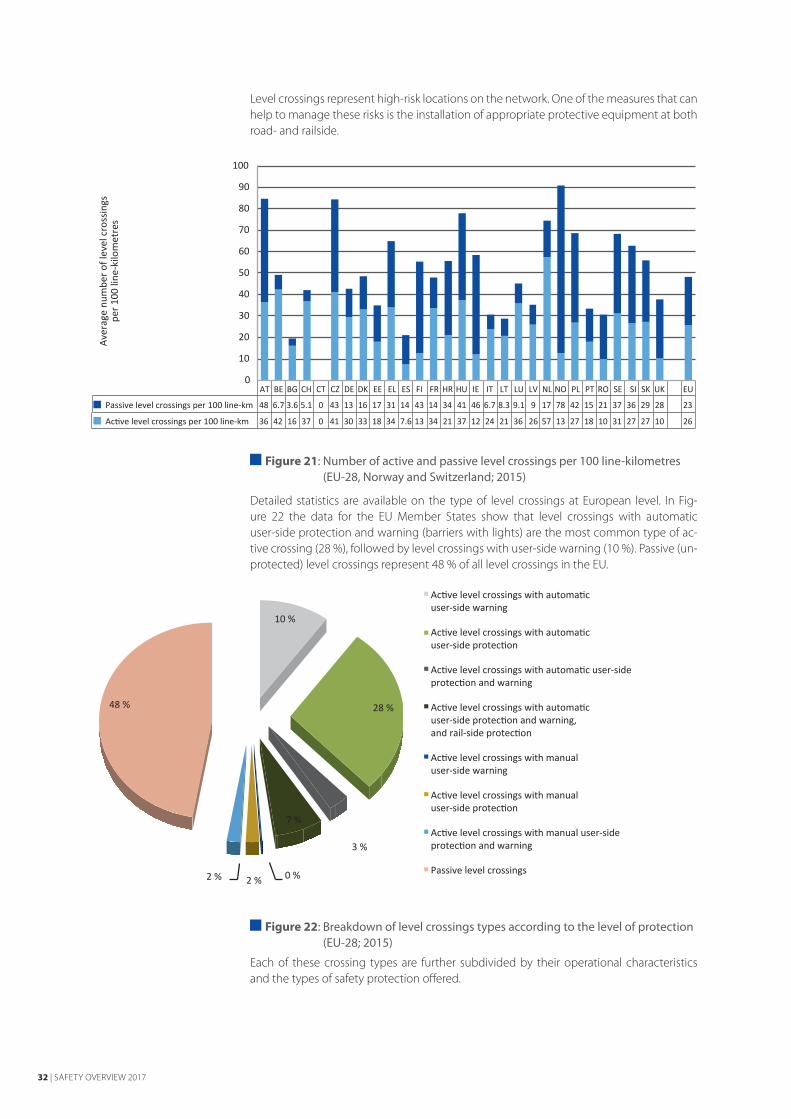
There were 108 196 level crossings (21) in the EU Member States in 2014. On average there are just under five level crossings per 10 line-kilometres in the EU, with active level cross-ings representing just under 53 % of all level crossings (Figure 21).
This year (2017) the Agency will work with NSAs to share analysis of these data and to understand how these risks are being addressed through targeted supervision and railway undertaking and infrastructure manager improvement measures.
(18) ATP means a system that enforces obedience to signals and speed restrictions by speed supervision, including automatic stop at signals. Systems where track signalling information is substituted and/or supplemented by cab signalling are included.
(19) TPS means a system that helps to enforce obedience to signals and speed restrictions with warning, warning and automatic stop or warning, automatic stop and discrete stop supervision.
(20) Commission Directive 2014/88/EU of 9 July 2014 amending Directive 2004/49/EC (railway safety directive) as regards common safety indicators and common methods of calculating accident costs.
(21) Level crossings are divided into two groups — active and passive. Passive level crossings are where roads cross the railway without any form of warning system or protection activated when it is unsafe for the user to traverse the crossing. Active level crossings are those where the crossing users are protected from or warned of the approaching train by devices activated when it is unsafe for the user to traverse the crossing.
0
10
20
30
40
50
60
70
80
90
100
AT BE BG CH CT CZ DE DK EE EL ES FI FR HR HU IE IT LT LU LV NL NO PL
Percentage of tracks with ATP in operation 2015 Percentage of train-kilometres using operational ATP systems 2015
32 | SAFETY OVERVIEW 2017
Level crossings represent high-risk locations on the network. One of the measures that can help to manage these risks is the installation of appropriate protective equipment at both road- and railside.
Figure 21: Number of active and passive level crossings per 100 line-kilometres (EU-28, Norway and Switzerland; 2015)
Detailed statistics are available on the type of level crossings at European level. In Fig-ure 22 the data for the EU Member States show that level crossings with automatic user-side protection and warning (barriers with lights) are the most common type of ac-tive crossing (28 %), followed by level crossings with user-side warning (10 %). Passive (un-protected) level crossings represent 48 % of all level crossings in the EU.
Figure 22: Breakdown of level crossings types according to the level of protection (EU-28; 2015)
Each of these crossing types are further subdivided by their operational characteristics and the types of safety protection offered.
AT BE BG CH CT CZ DE DK EE EL ES FI FR HR HU IE IT LT LU LV NL NO PL PT RO SE SI SK UK EU
Passive level crossings per 100 line-km 48 6.7 3.6 5.1 0 43 13 16 17 31 14 43 14 34 41 46 6.7 8.3 9.1 9 17 78 42 15 21 37 36 29 28 23
Active level crossings per 100 line-km 36 42 16 37 0 41 30 33 18 34 7.6 13 34 21 37 12 24 21 36 26 57 13 27 18 10 31 27 27 10 26
0
10
20
30
40
50
60
70
80
90
100
Aver
age
num
ber o
f lev
el c
ross
ings
per 1
00 li
ne-k
ilom
etre
s
3 %
0 %2 %2 %
Active level crossings with automatic user-side warning
Active level crossings with automatic user-side protection
Active level crossings with automatic user-side protection and warning
Active level crossings with automatic user-side protection and warning, and rail-side protection
Active level crossings with manual user-side warning
Active level crossings with manual user-side protection
Active level crossings with manual user-side protection and warning
Passive level crossings
48 %
10 %
28 %
7 %

TRAFFIC VOLUMES | 33
Traffic volumes
Trains cover more than 4.1 billion kilometres in the EU every year. Passenger trains pro-vided 79 % of the total number of train-kilometres (3.3 billion out of 4.1 billion train-kilo-metres in 2015). The traffic volumes are relatively stable from year to year, thus having an insignificant impact on expected accident outcomes.
Figure 23: Development of train-kilometres (EU-28, Norway and Switzerland; 2011-2015; millions)
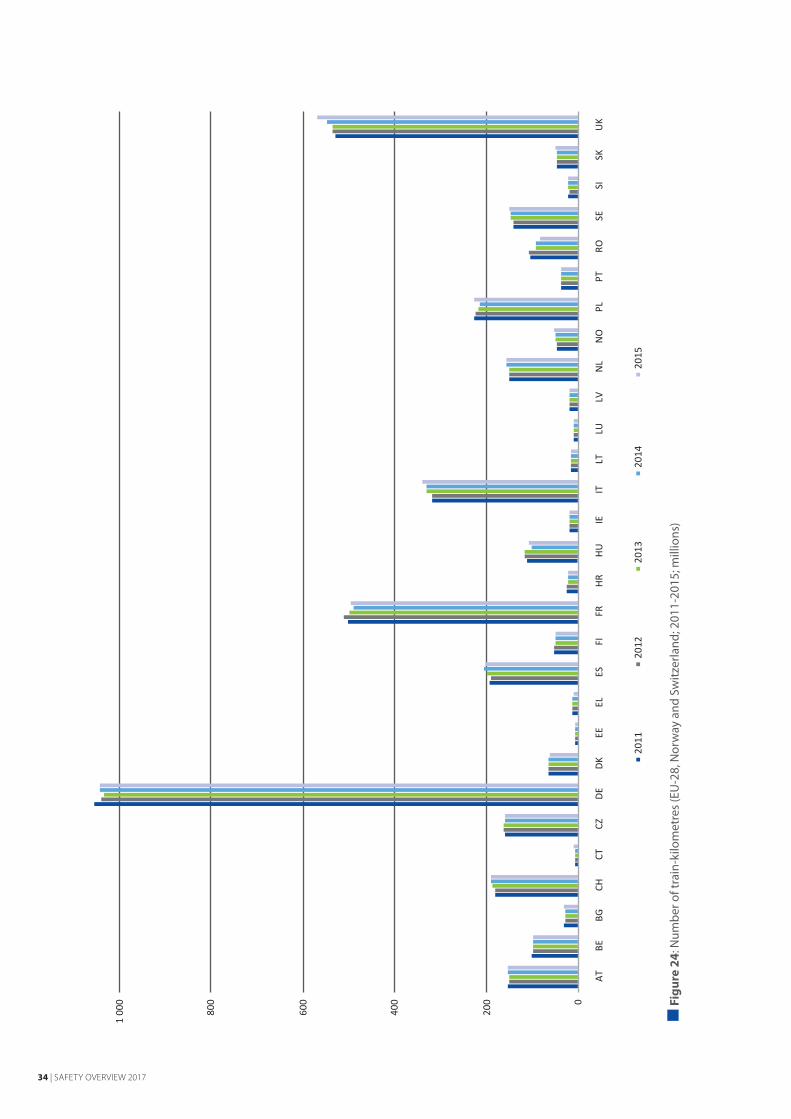
Germany is the country with by far the highest number of train-kilometres, accounting alone for one quarter of all train-kilometres in the EU. It is followed by the United Kingdom and France, each reporting more than 500 million train-kilometres in the 2011-2015 period (Figure 24).
In 2015 passengers travelled 425 billion kilometres on board trains. The number of passen-ger-kilometres has grown by 6.7 % since 2011, reflecting the recovery from the economic recession of 2008-2011. Figure 25 shows the changes by Member State (plus Norway and Switzerland) for each of the last 5 years (2011-2015). Significant increases are seen in Slo-vakia (40 %), Greece (31 %), Luxembourg (21 %) and the United Kingdom (18 %), while substantial falls were seen in Croatia (– 36 %), Estonia (– 24 %), Bulgaria (– 24 %) and Latvia (– 19 %).
Passenger train-kilometres are also reported, which, taken with passenger-kilometres and the various infrastructure measures, allows an understanding of the relative use or density of the railway system. These data can be used as normalisers (allowing a comparative measure for all Member States on an equal basis) for the various occurrences reported, allowing us to measure the exposure incidence in any given year. Across the EU Member States, plus Norway and Switzerland, for the 5-year period from 2011 to 2015, for every passenger train-kilometre operated there were, on average, 125 passengers on board the train. Figure 26 illustrates the range of values by country or reporting entity. The most heavily loaded trains are achieved by the passenger and shuttle train operators using the Channel Tunnel (560), and also in France (199) and Italy (156). The Member States with the lowest load factors are Luxembourg (48), the Czech Republic (57) and Croatia (64).
3000
3200
3400
3600
3800
4000
4200
2011 2012 2013 2014 2015
Passenger train-km Freight train-km Other train-km
Note: Vertical scale begins at 3 000 million train-kilometres
34 | SAFETY OVERVIEW 2017
0
200
400
600
800
1 00
0
2011
20
12
2013
20
14
2015
AT
BE
BG
CH
CT
CZ
DE
DK
EE
EL
ES
FI
FR
HR
HU
IE
IT
LT
LU
LV
NL
NO
PL
PT
RO
SE
SI
SK
UK
Fig
ure
24: N
umbe
r of t
rain
-kilo
met
res
(EU
-28,
Nor
way
and
Sw
itzer
land
; 201
1-20
15; m
illio
ns)

TRAFFIC VOLUMES | 35
Fig
ure
25: N
umbe
r of p
asse
nger
-kilo
met
res
(EU
-28,
Nor
way
and
Sw
itzer
land
; 201
1-20
15; m
illio
ns)
0
10 0
00
20 0
00
30 0
00
40 0
00
50 0
00
60 0
00
70 0
00
80 0
00
90 0
00
AT
BE
BG
CH
CT
CZ
DE
DK
EE
EL
ES
FI
FR
HR
HU
IE
IT
LT
LU
LV
N
L N
O
PL
PT
RO
SE
SI
SK
UK
2011
20
12
2013
20
14
2015

36 | SAFETY OVERVIEW 2017
Fig
ure
26: N
umbe
r of p
asse
nger
-kilo
met
res
per p
asse
nger
trai
n-ki
lom
etre
(EU
-28,
Nor
way
and
Sw
itzer
land
; 201
1-20
15)
0
100
200
300
400
500
600
AT
BE
BG
CH
CT
CZ
DE
DK
EE
EL
ES
FI
FR
HR
HU
IE
IT
LT
LU
LV
N
L N
O
PL
PT
RO
SE
SI
SK
UK
EU-2
8

| 37
Fig
ure
27: N
umbe
r of f
reig
ht to
nne-
kilo
met
res
by c
ount
ry (E
U-2
8, N
orw
ay a
nd S
witz
erla
nd; 2
011-
2015
; mill
ions
)So
urce
: Eur
osta
t.
0
20 0
00
40 0
00
60 0
00
80 0
00
100
000
120
000
AT
BE
BG
CH
CT
CZ
DE
DK
EE
EL
ES
FI
FR
HR
HU
IE
IT
LT
LU
LV
N
L N
O
PL
PT
RO
SE
SK
SI
UK
2011
20
12
2013
20
14
2015

38 | SAFETY OVERVIEW 2017
Following a review of the statistics reported in the CSIs we discovered a number of incon-sistencies in data for freight tonne-kilometres reported between Member States and over time. We are currently investigating the issues. However, in order to report this indicator we have reverted instead to the figures reported to Eurostat by the national statistical offices/administrations for each country using the definition in the Illustrated glossary for transport statistics for ‘gross tonne-kilometre hauled’ (22). The number of freight tonne-kilometres increased from just under 412 million tonne-kilometres in 2014 to 418 million tonne-kilometres in 2015 (an increase of 1.6 %). Between 2014 and 2015, 13 Member states experienced a fall in the number of tonne-kilometres, one experienced no change and 15 saw an increase in the number of freight tonne-kilometres carried.
As with the passenger information, we can also derive the average loads carried per freight train-kilometre operated to gain an understanding of the relative use of freight train capa-city operated over the railway system. Across the EU Member States, plus Norway and Switzerland, for the 5-year period from 2011 to 2015, for every freight train-kilometre operated there were, on average, just over 518 tonnes on board the train.
Figure 28: Number of freight tonne-kilometres per freight train-kilometre (EU-28, Norway and Switzerland; 2011-2015)
Figure 28 illustrates the range of values by country or reporting entity. The most heavily loaded trains are achieved by the freight and shuttle train operators using the Channel Tunnel (3 435 tonnes), and also in Latvia (1 720 tonnes), Lithuania (1 572 tonnes) and Estonia (1 435 tonnes). The Member States with the lowest load factors are Ireland (212 tonnes), Luxembourg (308 tonnes) and Portugal (367 tonnes).
(22) United Nations Economic Commission for Europe/International Transport Forum/Eurostat, Illustrated glossary for transport statistics, fourth edition, 2008.
0
500
1 000
1 500
2 000
2 500
3 000
3 500
AT BE BG CH CT CZ DE DK EE EL ES FI FR HR HU IE IT LT LU LV NL NO PL PT RO SE SK SI UK EU-28
INDEPENDENT ACCIDENT INVESTIGATION | 39
Independent accident investigation
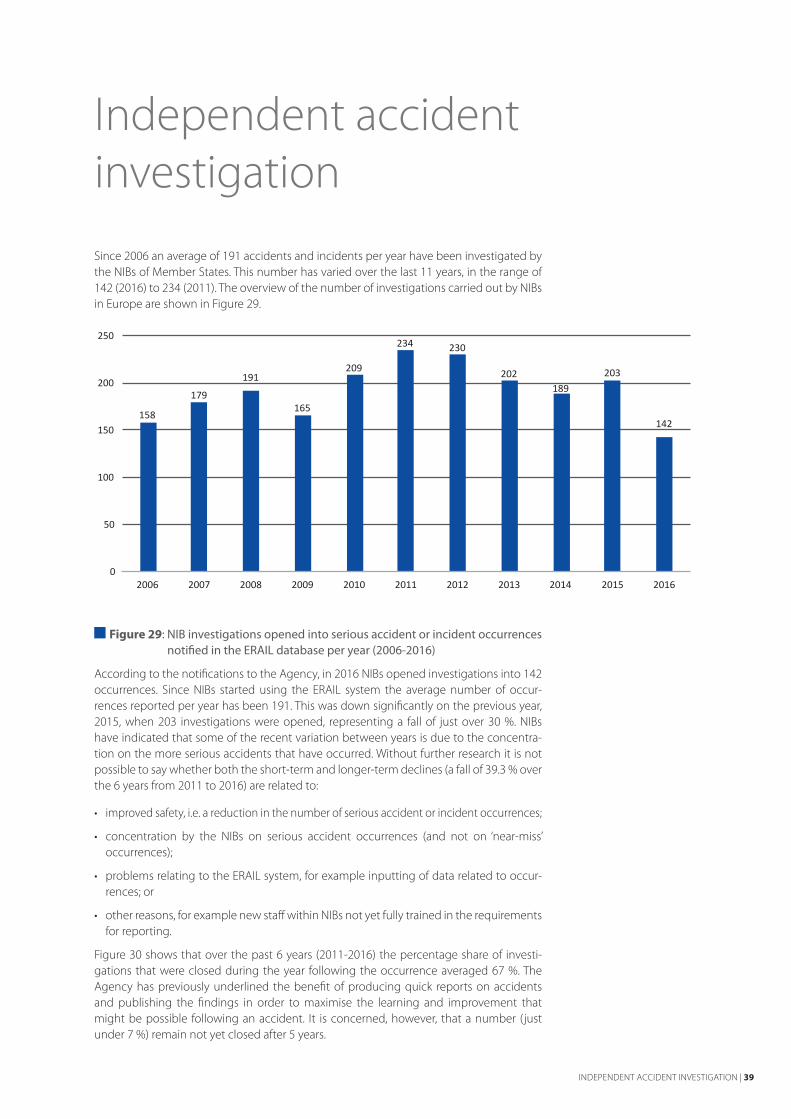
Since 2006 an average of 191 accidents and incidents per year have been investigated by the NIBs of Member States. This number has varied over the last 11 years, in the range of 142 (2016) to 234 (2011). The overview of the number of investigations carried out by NIBs in Europe are shown in Figure 29.
Figure 29: NIB investigations opened into serious accident or incident occurrences notified in the ERAIL database per year (2006-2016)
According to the notifications to the Agency, in 2016 NIBs opened investigations into 142 occurrences. Since NIBs started using the ERAIL system the average number of occur-rences reported per year has been 191. This was down significantly on the previous year, 2015, when 203 investigations were opened, representing a fall of just over 30 %. NIBs have indicated that some of the recent variation between years is due to the concentra-tion on the more serious accidents that have occurred. Without further research it is not possible to say whether both the short-term and longer-term declines (a fall of 39.3 % over the 6 years from 2011 to 2016) are related to:
• improved safety, i.e. a reduction in the number of serious accident or incident occurrences;
• concentration by the NIBs on serious accident occurrences (and not on ‘near-miss’ occurrences);
• problems relating to the ERAIL system, for example inputting of data related to occur-rences; or
• other reasons, for example new staff within NIBs not yet fully trained in the requirements for reporting.
Figure 30 shows that over the past 6 years (2011-2016) the percentage share of investi-gations that were closed during the year following the occurrence averaged 67 %. The Agency has previously underlined the benefit of producing quick reports on accidents and publishing the findings in order to maximise the learning and improvement that might be possible following an accident. It is concerned, however, that a number (just under 7 %) remain not yet closed after 5 years.
158
179
191
165
209
234 230
202 189
203
142
0
50
100
150
200
250
2006 2007 2008 2009 2010 2011 2012 2013 2014 2015 2016

40 | SAFETY OVERVIEW 2017
Fig
ure
30: N
IB in
vest
igat
ions
ope
ned
and
clos
ed (2
011-
2016
)
Not
e: T
he d
arke
r sha
des r
epre
sent
inve
stig
atio
ns th
at h
ave
been
clo
sed,
whi
le th
e lig
hter
shad
es re
pres
ent t
hose
inve
stig
atio
ns th
at a
re o
ngoi
ng o
r not
yet
clo
sed.
30180
161
77
182
222
158
28
27
75
155
227
212
152
25
21
28
52
178
228
220
183
136
21
1820
33
75
188
230
225
190
179
135
17
1716
2733
86
136
050100
150
200
250
300
2011
2012
2013
2014
2015
2016
2012
2013
2014
2015
2016
2013
2014
2015
2016
2014
2015
2016
2015
2016
2016
Occ
urre
nces
from
20
1120
1520
16
2012
2013
2014

SERIOUS ACCIDENTS IN 2016 | 41
Serious accidents in 2016
low resolution
Serious accidents are defined in EU legislation as train collisions and derailments with one fatality or at least five serious injuries, or extensive damage (over EUR 2 million), and any other similar accidents with an obvious impact on railway safety regulation or the management of safety. These accidents are subject to mandatory investigation by NIBs, according to Articles 3(l), 19 and 21 of the railway safety directive, with the requirement to normally deliver the final investigation report within a year. The 2016 accidents meeting the criteria on resulting casualties and material damage, and so categorised as serious, are listed in Table 4 below in chronological order of occurrence.
Date Member State Location AccidentAccident outcomes reported in ERAIL
9.2.2016 Germany Bad Aibling Collision of two passenger trains 12 fatalities (23), 18 seriously injured
23.2.2016 Netherlands Dalfsen Passenger train/crane collision at active level crossing 1 fatality
16.5.2016 Greece Sérres * Collision of two rail vehicles 2 fatalities, 2 seriously injured
5.6.2016 Belgium Hermalle-sous-Huy Passenger/freight train collision 3 fatalities, 10 seriously injured
12.7.2016 Italy Andria — Corato Collision of two passenger trains 23 fatalities, 7 seriously injured
9.9.2016 Spain O Porriño Passenger train derailment 4 fatalities, 13 seriously injured
16.9.2016 Slovakia Vel’ký Meder * Passenger train/lorry collision at active level crossing 1 fatality, 3 seriously injured
28.11.2016 Hungary Nyúl Freight train/lorry collision at passive level crossing 1 fatality
29.11.2016 Romania Bârsești Freight train/light locomotive collision 2 fatalities
10.12.2016 Bulgaria Hitrino Freight train derailment, fire 7 fatalities, 4 seriously injured
Table 4: Serious accidents in Europe (2016)* Information input into ERAIL or further explanation required from NIB.
It was of concern to the Agency to find two accidents not reported or incorrectly reported into the ERAIL system in 2016. These are the accidents at Sérres in Greece and Vel’ký Meder in Slovakia. We are working with the relevant NIBs to understand these concerns.
The ERAIL system is the reporting tool for serious accidents and provides a degree of detail that cannot be obtained from the CSIs. It was noted above, in Figure 4, albeit based upon a forecast of the number of train-kilometres operated in 2016, that there was a likely deteri -oration of railway safety in 2016, although the confirmation of this will have to await the outcome of the assessment of achievement of targets (CSTs) in 2018.
(23) See https://www.eba.bund.de/SharedDocs/Publikationen/EUB/DE/sonstige_Downloads/60_Zwischenbericht_Bad_Aibling.pdf?blob=publicationFile&v=2, where on page 6 of 23 it is noted that one of the fatalities died in hospital 2 months after the accident. This is outside the implementation guidance on CSIs, where a death (killed person) means any person killed immediately or dying within 30 days as a result of an accident, excluding suicides. However, as this fatality was as a direct cause of the accident we have included it in the table.
42 | SAFETY OVERVIEW 2017
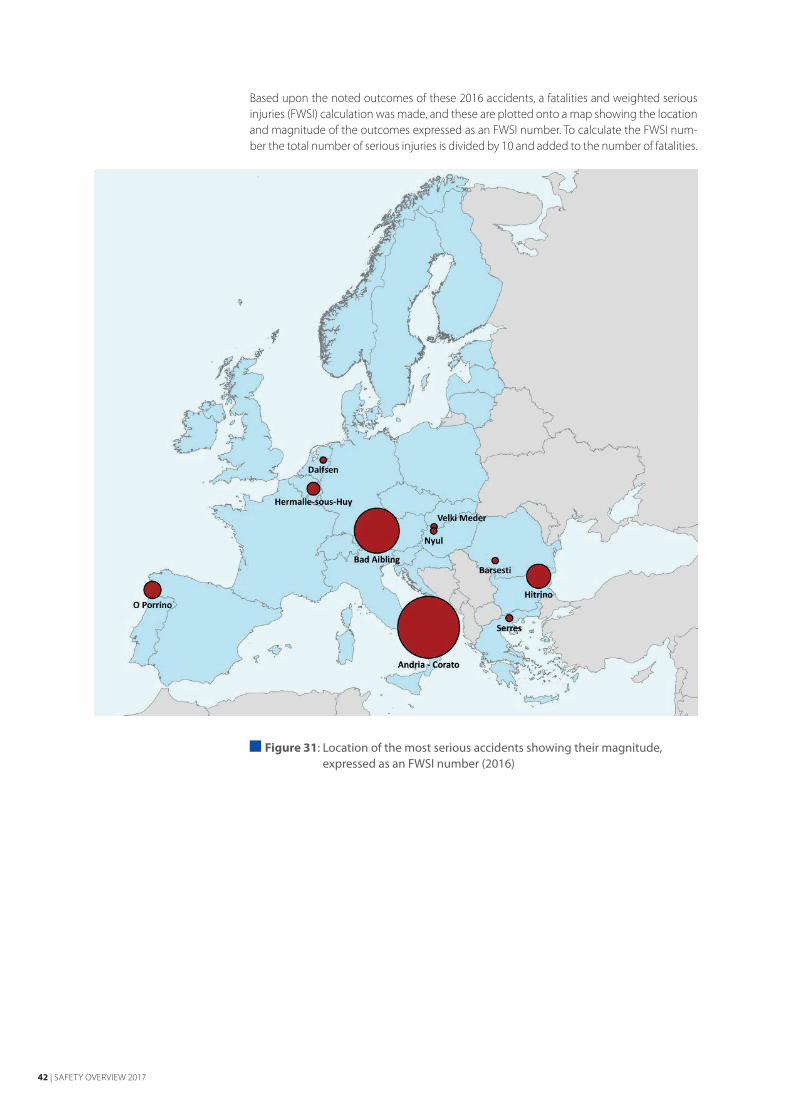
Based upon the noted outcomes of these 2016 accidents, a fatalities and weighted serious injuries (FWSI) calculation was made, and these are plotted onto a map showing the location and magnitude of the outcomes expressed as an FWSI number. To calculate the FWSI num-ber the total number of serious injuries is divided by 10 and added to the number of fatalities.
Figure 31: Location of the most serious accidents showing their magnitude, expressed as an FWSI number (2016)

SERIOUS ACCIDENTS IN 2016 | 43
The location of all serious railway incidents and accidents reported in the ERAIL system (under the requirements set out in Articles 19(1), 19(2) and 21(6) of the railway safety directive) in 2016 is shown in Figure 32 below.
Figure 32: Location of all railway incidents and accidents available in ERAIL (2016)

44 | SAFETY OVERVIEW 2017
Background information
European legislation requires Member States to report to the ERA on significant accidents and serious accidents occurring on their territory. The NSAs must report all significant accidents. The NIBs must investigate all serious accidents, notify the ERA of these investi-gations and, when closed, send the investigation report to the ERA. The term ‘significant accident’ covers a wider range of events than the term ‘serious accident’. The legislation provides the following definitions for these two groups of accident.
Table 5: Accidents reported to the ERA according to EU legislation
The current legislative framework does not require Member States to collect information on all railway accidents. The reporting is often limited to significant accidents and a selection of other events (defined by EU legislation such as CSIs). Additional data on inci-dents are not necessarily collected by railway undertakings/infrastructure managers and the NSAs do not always rely on accident data when planning their supervision activities. Moreover, the information about less-serious accidents and incidents are not systematic-ally collated at EU level.
The Agency is working with stakeholders to identify a broader data-sharing system at EU level, designed to improve risk-based decision-making, particularly focused on the man-agement of multi-fatality accidents and the convergence of Member State safety perform-ance. You can find more information on the Agency’s website (28).
The overview of safety performance is based on the CSI data reported to the ERA as of 31 January 2017. Any changes after that date have not been taken into account. In some rare instances the figures may not be fully consistent with the figures presented in previous annual reports. This is due to the possibility given to NSAs in Annex I to correct wrongly reported data up to 1 year after their original reporting deadline.
(24) Appendix to Annex I to the railway safety directive, Article 1.1.(25) Article 3(l) of the railway safety directive.(26) Article 18 of the railway safety directive.(27) Article 24 of the railway safety directive. (28) http://www.era.europa.eu/Core-Activities/Safety/Safety-Performance/Pages/Common-occurrence-reporting.aspx
Significant accident Serious accident
Directive 2004/49/EC, Commission Directive 2009/149/EC and Regulation (EC) No 91/2003 Directive 2004/49/EC
‘Significant accident’ means any accident involving at least one rail vehicle in motion resulting in at least one killed or seriously injured person, or in significant damage to stock, track, other installations or the environment, or extensive disruptions to traffic. Accidents in workshops, warehouses and depots are excluded (24). Significant damage is damage that is equivalent to EUR 150 000 or more.
‘Serious accident’ means any train collision or derailment of trains resulting in the death of at least one person or serious injuries to five or more persons or extensive damage to rolling stock, the infrastructure or the environment, and any other similar accident with an obvious impact on railway safety regulation or the management of safety; ‘extensive damage’ means damage that can immediately be assessed by the investigating body to cost at least EUR 2 million in total (25).
Reporting of CSIs by NSAs. Accident investigation by NIBs.
Each year the safety authority shall publish an annual report concerning its activities in the preceding year and send it to the Agency by 30 September at the latest. The report shall contain information on the development of railway safety, including an aggregation at Member State level of the CSIs laid down in Annex I (26).
Within 1 week after the decision to open an investigation the investigating body shall inform the Agency thereof. The investigating body shall send the Agency a copy of the final report normally not later than 12 months after the date of the occurrence (27).

BACKGROUND INFORMATION | 45
Information presented on serious accidents and their investigations is based on reports available to the ERA on 31 December 2016. Any event occurring after that day is not covered by this report. This report covers the railways in 26 of the 28 EU Member States; Cyprus and Malta do not have railway systems that are covered by EU legislation. These 26 Member States are referred to as ‘Member States’, ‘EU’ or ‘EU-28’ (even though only 26 Member States with railway systems plus the Channel Tunnel are reported) in the report. The Channel Tunnel is a separate reporting entity, so that relevant data are given separ-ately to the French and United Kingdom data. The data are also reported by Norway and Switzerland. Therefore, there were a total of 29 reporting entities in 2014; the term ‘Europe’ was sometimes used for this complete group in the report.
Figure 33: Overview of the current railway accident reporting in the EU (2016)

46 | SAFETY OVERVIEW 2017
List of abbreviations
ATP automatic train protection
CSI common safety indicator
CSTs common safety targets
CT Channel Tunnel
ETCS European Train Control System
ERA European Railway Agency
ERAIL European Railway Accident Information Links
EU European Union
EU-27 the 27 Member States of the EU as at 2009
EU-28 the 28 current Member States of the EU
FWSI fatalities and weighted serious injuries
NIB national investigation body
NSA national safety authority
TPS train protection system

LIST OF COUNTRY CODES | 47
List of country codes
Belgium BE
Bulgaria BG
Czech Republic CZ
Denmark DK
Germany DE
Estonia EE
Ireland IE
Greece EL
Spain ES
France FR
Croatia HR
Italy IT
Cyprus CY
Latvia LV
Lithuania LT
Luxembourg LU
Hungary HU
Malta MT
Netherlands NL
Austria AT
Poland PL
Portugal PT
Romania RO
Slovenia SI
Slovakia SK
Finland FI
Sweden SE
United Kingdom UK
Norway NO
Switzerland CH
Channel Tunnel CT

HOW TO OBTAIN EU PUBLICATIONS
Free publications:
• one copy: via EU Bookshop (http://bookshop.europa.eu);
• more than one copy or posters/maps: from the European Union’s representations (http://ec.europa.eu/represent_en.htm); from the delegations in non-EU countries (http://eeas.europa.eu/delegations/index_en.htm); by contacting the Europe Direct service (http://europa.eu/europedirect/index_en.htm) or calling 00 800 6 7 8 9 10 11 (freephone number from anywhere in the EU) (*).(*) The information given is free, as are most calls (though some operators, phone boxes or hotels may charge you).
Priced publications:
• via EU Bookshop (http://bookshop.europa.eu).

European Union Agency for Railways120 rue Marc Lefrancq59300 ValenciennesFRANCETel. +33 (0)327096500
era.europa.euTwitter @ERA_railways
Making the railway system work better for society.
For more information, please visit:http://www.era.europa.eu/Core-Activities/Safety/ Safety-Performance/Pages/Monitoring-safety-performance.aspx