radon levels in dwellings - who/ · pdf fileas those with old granite soils ... estimated...
TRANSCRIPT
The presence of radon in dwellings is an important indicator of the exposure of the population at thebeginning and in the course of the process of reducing indoor radon. Considering the linear expo-sure/response relationship between radon and lung cancer risk, the arithmetic mean is the most rele-vant indicator to assess the impact on public health.
The radon action levels of 200 and 400 Bq.m-3 allow for international comparisons, since most of thecountries comply with the European guideline of 400 Bq.m-3 for existing houses and 200 Bq.m-3 forfuture dwellings.
The 200 Bq.m-3 measurement enables a reliable comparison of the proportion of houses that exceedthis level in different geographical areas since it is less sensitive to variability from the size of the sam-ples than the 400 Bq.m-3 measurement.
Average radon levels in dwellings vary widely within and between countries. In most countries theworld average of 40 Bq.m-3 is exceeded (1). Countries with mainly sedimentary soils (e.g. Ger-
many, the Netherlands, Poland and the United Kingdom) present lower or equivalent averages, where-as those with old granite soils (e.g. Austria, the Czech Republic and Finland) are more prone to radonemissions. If a common action level of 200 Bq.m-3 were to be defined, Austria, the Czech Republic andFinland would have to take remedial measures for more than 10% of the houses, as against under 3.5%in countries with sedimentary soil.
RATIONALE
Estimated annual mean of radon levels in dwellings and proportion of dwellings withlevels above 200 Bq.m-3 and 400 Bq.m-3
Radon levels in dwellings FACT SHEET NO. 4.6 · MAY 2007 · CODE: RPG4_RadEx1
KEY MESSAGE
This summary presents an assessment of the estimated radon levels and proportion of dwellings withannual mean levels of radon above 400 Bq.m-3 for existing dwellings and above 200 Bq.m-3 for futuredwellings in 11 European countries.
PRESENTATION OF DATA
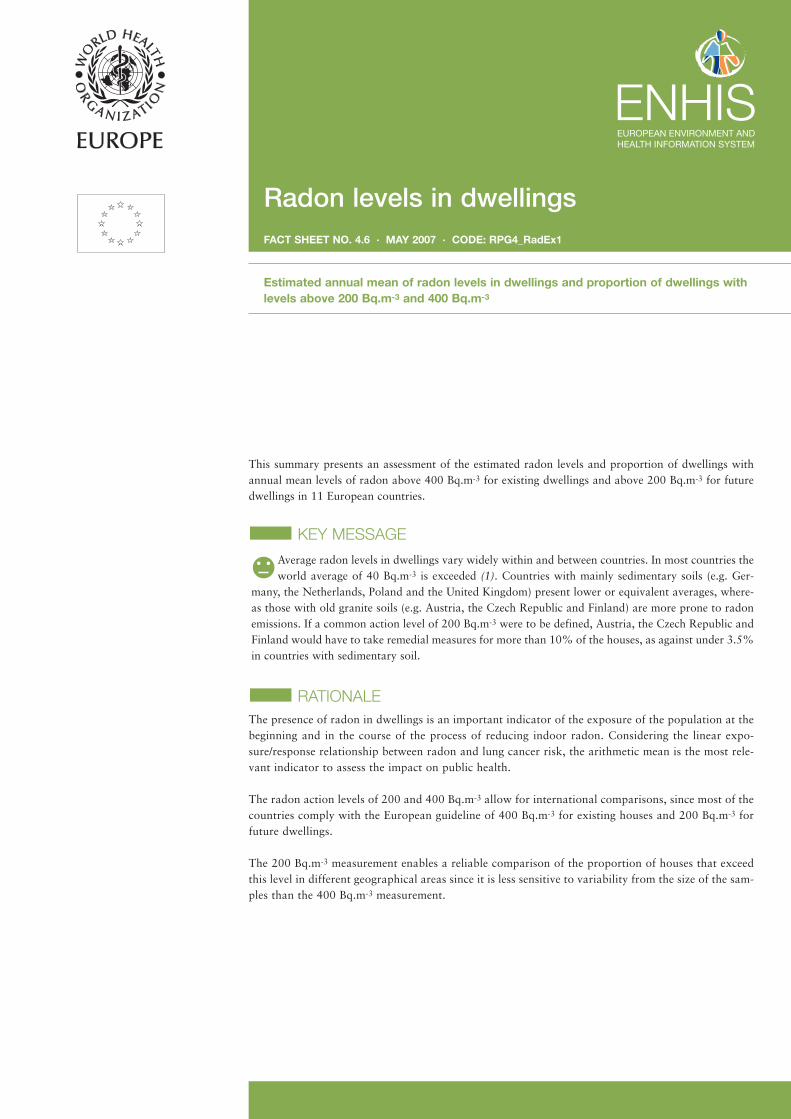
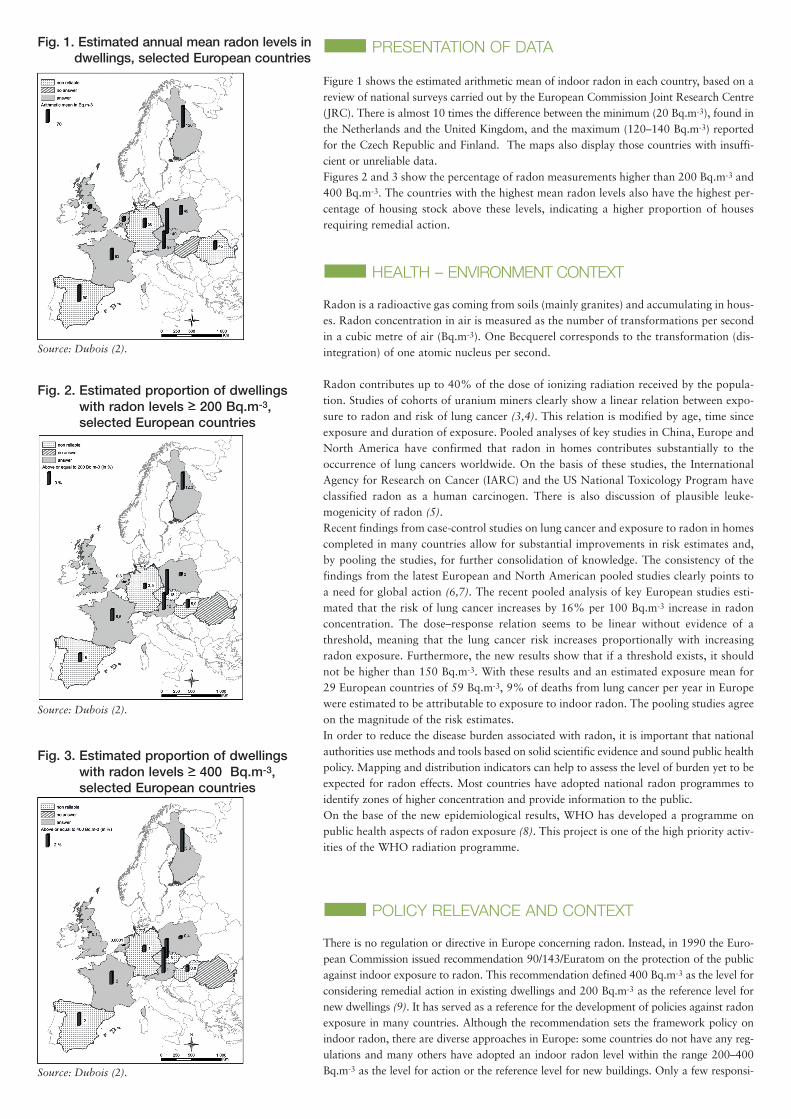
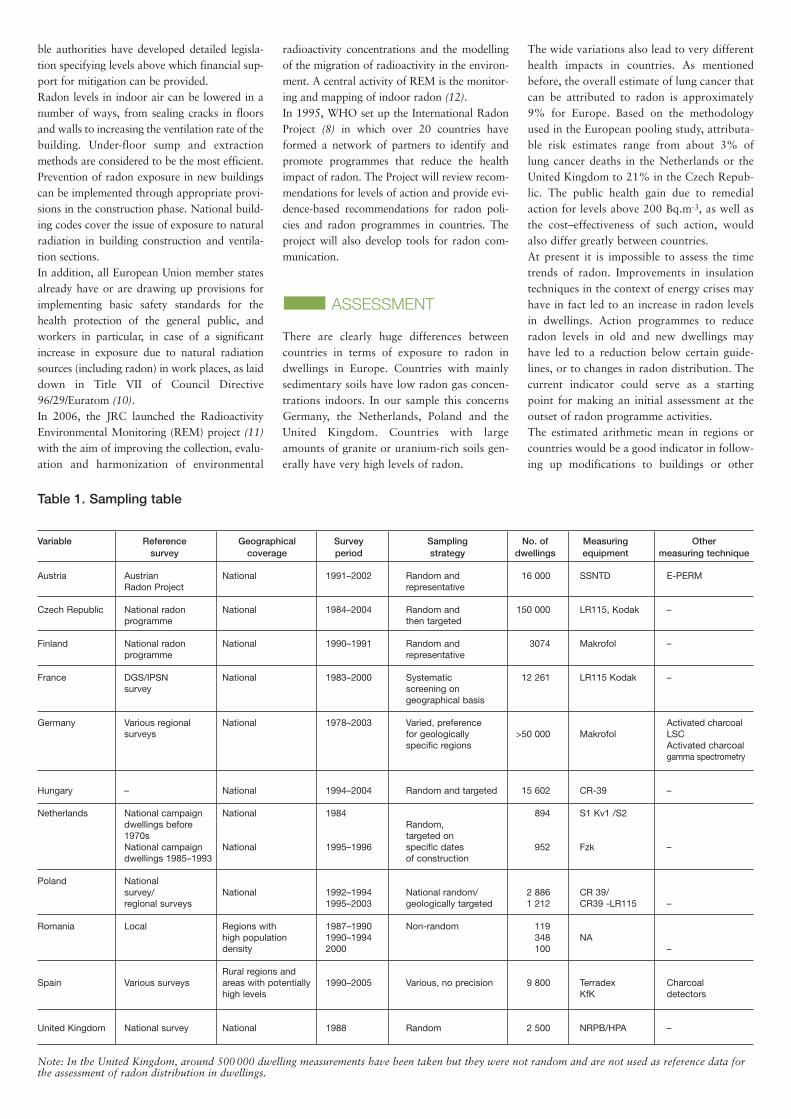
Figure 1 shows the estimated arithmetic mean of indoor radon in each country, based on areview of national surveys carried out by the European Commission Joint Research Centre(JRC). There is almost 10 times the difference between the minimum (20 Bq.m-3), found inthe Netherlands and the United Kingdom, and the maximum (120–140 Bq.m-3) reportedfor the Czech Republic and Finland. The maps also display those countries with insuffi-cient or unreliable data.Figures 2 and 3 show the percentage of radon measurements higher than 200 Bq.m-3 and400 Bq.m-3. The countries with the highest mean radon levels also have the highest per-centage of housing stock above these levels, indicating a higher proportion of housesrequiring remedial action.
HEALTH – ENVIRONMENT CONTEXT
Radon is a radioactive gas coming from soils (mainly granites) and accumulating in hous-es. Radon concentration in air is measured as the number of transformations per secondin a cubic metre of air (Bq.m-3). One Becquerel corresponds to the transformation (dis-integration) of one atomic nucleus per second.
Radon contributes up to 40% of the dose of ionizing radiation received by the popula-tion. Studies of cohorts of uranium miners clearly show a linear relation between expo-sure to radon and risk of lung cancer (3,4). This relation is modified by age, time sinceexposure and duration of exposure. Pooled analyses of key studies in China, Europe andNorth America have confirmed that radon in homes contributes substantially to theoccurrence of lung cancers worldwide. On the basis of these studies, the InternationalAgency for Research on Cancer (IARC) and the US National Toxicology Program haveclassified radon as a human carcinogen. There is also discussion of plausible leuke-mogenicity of radon (5).Recent findings from case-control studies on lung cancer and exposure to radon in homescompleted in many countries allow for substantial improvements in risk estimates and,by pooling the studies, for further consolidation of knowledge. The consistency of thefindings from the latest European and North American pooled studies clearly points toa need for global action (6,7). The recent pooled analysis of key European studies esti-mated that the risk of lung cancer increases by 16% per 100 Bq.m-3 increase in radonconcentration. The dose–response relation seems to be linear without evidence of athreshold, meaning that the lung cancer risk increases proportionally with increasingradon exposure. Furthermore, the new results show that if a threshold exists, it shouldnot be higher than 150 Bq.m-3. With these results and an estimated exposure mean for29 European countries of 59 Bq.m-3, 9% of deaths from lung cancer per year in Europewere estimated to be attributable to exposure to indoor radon. The pooling studies agreeon the magnitude of the risk estimates.In order to reduce the disease burden associated with radon, it is important that nationalauthorities use methods and tools based on solid scientific evidence and sound public healthpolicy. Mapping and distribution indicators can help to assess the level of burden yet to beexpected for radon effects. Most countries have adopted national radon programmes toidentify zones of higher concentration and provide information to the public.On the base of the new epidemiological results, WHO has developed a programme onpublic health aspects of radon exposure (8). This project is one of the high priority activ-ities of the WHO radiation programme.
POLICY RELEVANCE AND CONTEXT
There is no regulation or directive in Europe concerning radon. Instead, in 1990 the Euro-pean Commission issued recommendation 90/143/Euratom on the protection of the publicagainst indoor exposure to radon. This recommendation defined 400 Bq.m-3 as the level forconsidering remedial action in existing dwellings and 200 Bq.m-3 as the reference level fornew dwellings (9). It has served as a reference for the development of policies against radonexposure in many countries. Although the recommendation sets the framework policy onindoor radon, there are diverse approaches in Europe: some countries do not have any reg-ulations and many others have adopted an indoor radon level within the range 200–400Bq.m-3 as the level for action or the reference level for new buildings. Only a few responsi-
Fig. 1. Estimated annual mean radon levels indwellings, selected European countries
Source: Dubois (2).
Fig. 2. Estimated proportion of dwellingswith radon levels > 200 Bq.m-3,selected European countries
Source: Dubois (2).
Fig. 3. Estimated proportion of dwellingswith radon levels > 400 Bq.m-3,selected European countries
Source: Dubois (2).
ble authorities have developed detailed legisla-tion specifying levels above which financial sup-port for mitigation can be provided.Radon levels in indoor air can be lowered in anumber of ways, from sealing cracks in floorsand walls to increasing the ventilation rate of thebuilding. Under-floor sump and extractionmethods are considered to be the most efficient.Prevention of radon exposure in new buildingscan be implemented through appropriate provi-sions in the construction phase. National build-ing codes cover the issue of exposure to naturalradiation in building construction and ventila-tion sections.In addition, all European Union member statesalready have or are drawing up provisions forimplementing basic safety standards for thehealth protection of the general public, andworkers in particular, in case of a significantincrease in exposure due to natural radiationsources (including radon) in work places, as laiddown in Title VII of Council Directive96/29/Euratom (10).In 2006, the JRC launched the RadioactivityEnvironmental Monitoring (REM) project (11)with the aim of improving the collection, evalu-ation and harmonization of environmental
radioactivity concentrations and the modellingof the migration of radioactivity in the environ-ment. A central activity of REM is the monitor-ing and mapping of indoor radon (12).In 1995, WHO set up the International RadonProject (8) in which over 20 countries haveformed a network of partners to identify andpromote programmes that reduce the healthimpact of radon. The Project will review recom-mendations for levels of action and provide evi-dence-based recommendations for radon poli-cies and radon programmes in countries. Theproject will also develop tools for radon com-munication.
ASSESSMENT
There are clearly huge differences betweencountries in terms of exposure to radon indwellings in Europe. Countries with mainlysedimentary soils have low radon gas concen-trations indoors. In our sample this concernsGermany, the Netherlands, Poland and theUnited Kingdom. Countries with largeamounts of granite or uranium-rich soils gen-erally have very high levels of radon.
The wide variations also lead to very differenthealth impacts in countries. As mentionedbefore, the overall estimate of lung cancer thatcan be attributed to radon is approximately9% for Europe. Based on the methodologyused in the European pooling study, attributa-ble risk estimates range from about 3% oflung cancer deaths in the Netherlands or theUnited Kingdom to 21% in the Czech Repub-lic. The public health gain due to remedialaction for levels above 200 Bq.m-3, as well asthe cost–effectiveness of such action, wouldalso differ greatly between countries.At present it is impossible to assess the timetrends of radon. Improvements in insulationtechniques in the context of energy crises mayhave in fact led to an increase in radon levelsin dwellings. Action programmes to reduceradon levels in old and new dwellings mayhave led to a reduction below certain guide-lines, or to changes in radon distribution. Thecurrent indicator could serve as a startingpoint for making an initial assessment at theoutset of radon programme activities.The estimated arithmetic mean in regions orcountries would be a good indicator in follow-ing up modifications to buildings or other
Austria Austrian National 1991–2002 Random and 16 000 SSNTD E-PERMRadon Project representative
Czech Republic National radon National 1984–2004 Random and 150 000 LR115, Kodak –programme then targeted
Finland National radon National 1990–1991 Random and 3074 Makrofol –programme representative
France DGS/IPSN National 1983–2000 Systematic 12 261 LR115 Kodak –survey screening on
geographical basis
Germany Various regional National 1978–2003 Varied, preference Activated charcoalsurveys for geologically >50 000 Makrofol LSC
specific regions Activated charcoal gamma spectrometry
Hungary – National 1994–2004 Random and targeted 15 602 CR-39 –
Netherlands National campaign National 1984 894 S1 Kv1 /S2dwellings before Random, 1970s targeted onNational campaign National 1995–1996 specific dates 952 Fzk –dwellings 1985–1993 of construction
Poland National survey/ National 1992–1994 National random/ 2 886 CR 39/ regional surveys 1995–2003 geologically targeted 1 212 CR39 -LR115 –
Romania Local Regions with 1987–1990 Non-random 119high population 1990–1994 348 NAdensity 2000 100 –
Rural regions and Spain Various surveys areas with potentially 1990–2005 Various, no precision 9 800 Terradex Charcoal
high levels KfK detectors
United Kingdom National survey National 1988 Random 2 500 NRPB/HPA –
Note: In the United Kingdom, around 500 000 dwelling measurements have been taken but they were not random and are not used as reference data forthe assessment of radon distribution in dwellings.
Variable Reference Geographical Survey Sampling No. of Measuring Other survey coverage period strategy dwellings equipment measuring technique
Table 1. Sampling table
activities aimed at lowering radon levels indwellings. Monitoring of the proportion ofdwellings with radon levels above the point atwhich action is required will enable the effec-tiveness of programmes targeted at extremelevels to be evaluated.The indicator provides a good picture of thediscrepancy concerning radon problemsbetween countries and of the proportion ofdwellings with levels above the Europeanguidelines. It thus serves a baseline referencefor future comparison. Countries with contin-uing radon programmes can use the informa-tion as interim monitoring results.
DATA UNDERLYINGTHE INDICATOR
Data sourceThe information comes from the JRC cam-paign to collect nationally available informa-tion for radon mapping in 34 European coun-tries. The focal points in the country institu-tions in the relevant radon areas answered aquestionnaire produced by the JRC. Moreinformation about the database used for eachcountry is available on the European Forumon Radon Mapping web site (12).
Description of dataThe indicator consists of a presentation percountry of three important key values of the dis-tribution of annual radon level in dwellings: esti-mated arithmetic mean of radon concentrationestimated percentage of dwellings with annualmean levels of radon above 200 Bq.m-3
estimated percentage of dwellings with annualmean levels of radon above 400 Bq.m-3.Method of calculating the indicatorThe estimated values are given by institutionswhich deal with indoor radon and maintaininformation about radon distribution over thecountry. The survey reference has been quoted aswell as its period, the number of dwellings con-cerned and the method of sampling (Table 1).Geographical coverageAustria, the Czech Republic, Finland, France,Germany, Hungary, the Netherlands, Poland,Romania, Spain and the United Kingdom.Period of coverageThe data were collected in 2005 but the resultsconcern widely differing periods betweencountries.Frequency of updateNot specified yet.Data qualityIt is important to stress that the radon measure-ments were not made with a standardized pro-
tocol in all countries. In some countries the sam-ple was selected randomly on a national basis,so that the results can be directly extrapolated inorder to generate estimates. In others, the sam-ples were not randomly selected and correctionswere needed to estimate the radon distribution.Some countries relied on information fromregional campaigns and did not give precisedescriptions of the methodology used to assessthe estimated distribution. Direct comparisonsbetween results are, therefore, to be viewed withgreat caution.Radon levels are susceptible to change withmodifications to buildings or the renewal of thebuilding stock, or the efficiency of regional ornational action programmes. Regular nationalsurveys or targeted surveys of new buildings orbuildings of concern are, therefore, necessary toassess the evolution or efficiency of a policy.Coordination between countries is necessary topromote the use of national (and/or regional)survey protocols with a minimum set of stan-dard criteria allowing for direct comparisons.Furthermore, as radon levels are strongly linkedto local geological characteristics, the ideal scaleto assess and compare radon distribution wouldbe the regional one. Regional mapping based ona standardized assessment protocol could be anexcellent tool for making comparisons.
© 2007 World Health OrganizationAll rights reserved. The views expressed do not necessarily represent the decisions, opinions or stated policy of the European Commission or the World Health Organization.
For further information, see the web site of the WHO European Centre for Environment and Health, Bonn www.euro.who.int/ecehbonn.
World Health Organization · Regional Office for EuropeScherfigsvej 8 · DK-2100 Copenhagen Ø · Denmark · Tel.: +45 39 17 17 17 · Fax: +45 39 17 18 18 · [email protected] · www.euro.who.int
References
1. Report of the United Nations Scientific Committee on the Effects of Atomic Radiation. New York, United Nations, 2000(http://daccessdds.un.org/doc/UNDOC/GEN/N00/587/20/IMG/N0058720.pdf?OpenElement, accessed 4 April 2007).
2. Dubois G. An overview of radon surveys in Europe. Luxembourg, Office for Official Publications of the European Communities, 2005 (EUR 21892 EN).
3. Lubin J, Boice JD, Edling JC et al. Radon and lung cancer risk: A joint analysis of 11 underground miner studies. Bethesda, MD, US NationalInstitutes of Health, 1994.
4. Lubin JH, Boice JD, Edling C et al. Radon-exposed underground miners and inverse dose-rate (protraction enhancement) effects. Health Physics, 1995, 69:494-500.
5. Belson M, Kingsley B, Holmes A. Risk factors for acute leukemia in children: a review. Environmental Health Perspectives, 2007, 115:138-145.
6. Darby S et al. Radon in homes and risk of lung cancer: collaborative analysis of individual data from 13 European case-control studies. British Medical Journal, 2005, 330(7485):223.
7. Krewski D et al. Residential radon and risk of lung cancer: a combined analysis of 7 North American case-control studies. Epidemiology, 2005, 16(2):137-145.
8. International Radon Project [web site]. Geneva, World Health Organization, 2007 (http://www.who.int/ionizing_radiation/env/radon/en/, accessed 4 April 2007).
9. Commission recommendation on the protection of the public against indoor exposure to radon (90/143/Euroatom). Brussels, Commission ofthe European Communities, 1990 (http://ec.europa.eu/energy/nuclear/radioprotection/doc/legislation/90143_en.pdf, accessed 4 April 2007).
10. Council Directive 96/29/Euratom laying down basic safety standards for the protection of the health of workers and the general public againstthe dangers arising from ionizing radiation. Brussels, Commission of the European Communities, 1996(http://ec.europa.eu/energy/nuclear/radioprotection/doc/legislation/9629_en.pdf, accessed 4 April 2007).
11. Radioactivity Environmental Monitoring project [web site]. Brussels, European Commission, Joint Research Centre, 2006(http://rem.jrc.cec.eu.int/, accessed 4 April 2007).
12. European Forum on Radon Mapping [web site]. Brussels, European Commission, Joint Research Centre, 2005(http://radonmapping.jrc.it/index.php?id=36, accessed 4 April 2007).
Further informationRadon and cancer. Geneva, World Health Organization, 2005 (Fact sheet No. 291; http://www.who.int/mediacentre/factsheets/fs291/en/, accessed 4 April 2007).
Author: Philippe Pirard, National Institute of Public Health Surveillance, Saint-Maurice, France.