radon in homes in northern ireland: 2016 data report
TRANSCRIPT

Radon in Homes in Northern Ireland: 2016 Data Report
About Public Health England
Public Health England exists to protect and improve the nation’s health and wellbeing, and reduce health inequalities. We do this through world-class science, knowledge and intelligence, advocacy, partnerships and the delivery of specialist public health services. We are an executive agency of the Department of Health, and are a distinct delivery organisation with operational autonomy to advise and support government, local authorities and the NHS in a professionally independent manner.
Public Health England 133–155 Waterloo Road Wellington House London SE1 8UG T: 020 7654 8000
www.gov.uk/phe Twitter: @PHE_uk Facebook: www.facebook.com/PublicHealthEngland
© Crown copyright 2017
You may re-use this information (excluding logos) free of charge in any format or medium, under the terms of the Open Government Licence v3.0. To view this licence, visit OGL or email [email protected]. Where we have identified any third party copyright information you will need to obtain permission from the copyright holders concerned.
Any enquiries regarding this publication should be sent to:
Centre for Radiation, Chemical and Environmental Hazards Public Health England Chilton, Didcot, Oxfordshire OX11 0RQ E: [email protected]
Published: March 2017 PHE publications gateway number: 2016485

PHE-CRCE-033
Centre for Radiation, Chemical and Environmental Hazards Public Health England Chilton, Didcot Oxfordshire OX11 0RQ
Approval: November 2016
This report from the PHE Centre for Radiation, Chemical and Environmental Hazards reflects understanding and evaluation of the current scientific evidence as presented and referenced in this document.
Radon in Homes in Northern Ireland: 2016 Data Report
Miller C A, Rees D M
Abstract
This report provides a summary of just over 24,000 radon measurements made in homes in Northern Ireland between 1983 and 2015. It updates the previous data review published in 2009 and complements the radon atlas of Northern Ireland which was published in 2015. Results are displayed in summary tables for a range of administrative areas, postcodes and NHS bodies and are accompanied by a short descriptive text.


iii
Contents
Abstract i
1 Introduction 1
2 Measurements 1
3 Results 2
4 Conclusions 3
5 Acknowledgements 3
6 References 3
7 Glossary of terms 4
8 Tabular data 4


Measurements
1
1 Introduction
Radon is a naturally occurring radioactive gas that is present in all homes and is the major source of ionising radiation exposure to the UK population. Where high levels are found, a radon Action Level (200 Bq m-3) is used to advise householders on the need to take remedial action in the home. For further information about the sources and properties of radon, its health effects and the UK control strategy, please consult either the general Public Health England (PHE) website www.gov.uk/government/organisations/public-health-england or the dedicated PHE radon website at www.ukradon.org.
This report summarises and presents the data that PHE holds from just over 24,000 radon measurements conducted in homes in Northern Ireland in the period between 1983 and 2015. Results are presented in tabular format to illustrate the range and distribution of radon levels in local Government administrative areas down to electoral ward. Results are also presented using the postcode system down to sector level and by NHS Health and Social Care Trust. To preserve confidentiality, results are not reported when there are fewer than five measurements in the grouping.
This report complements the indicative atlas of Northern Ireland (Daraktchieva et al, 2015) which shows the radon potential in map format and it updates and replaces the data tables contained within the previous result summary (Green et al, 2009).
2 Measurements
Radon measurements are normally made with two passive integrating detectors in each home - one in the main living area and the other in a regularly used bedroom. This reflects the parts of the home that are most occupied. The detectors are left in place for three months and the individual results combined by applying both occupancy ratios to reflect typical occupancy patterns and seasonal correction factors to reflect typical seasonal variations in radon levels (Miles and Howarth, 2008) thereby giving an estimate of the annual average for exposure from radon in the individual home. In some homes multiple measurements have been recorded, for example when radon remedial works are undertaken. Throughout this report only the earliest valid measurement for an address is used. The results rely on the householder placing the detectors in accordance with our instructions.
The measurement results contained within this report have been collected from various measurement programmes conducted by PHE (and previously HPA and NRPB) from 1983 through to 2015. These surveys were undertaken with the aim of finding homes with high radon levels within the radon Affected Areas identified through the publication of radon maps (NRPB, (1993), NRPB (1999a), NRPB (1999b), Green et al (2009), Daraktchieva et al (2015)). These surveys were not designed to be statistically representative of large areas. To date only one fully representative UK survey has been undertaken. That national survey (Wrixon et al, 1988) was designed to obtain a population weighted sample of results throughout the UK. The results from that survey remain the best estimate of the average domestic radon exposure for Northern Ireland.

Radon in Homes in Northern Ireland: 2016 Data Report
2
Within previously published reports, result summaries were prepared alongside radon maps and due to positional uncertainties a small number of results were excluded from the mapping and the associated data. That constraint is not present in this report and therefore allows a more comprehensive summary of the results than in previous publications. Due to data cleaning some results that have appeared in previous reports are no longer contained within this report as information now available indicates that the measurement is invalid.
3 Results
Tables 1 to 6 show the number and distribution of radon measurements in homes grouped by three different boundary systems relating to local authorities, postcodes and NHS bodies.
The tables show
• The total number of homes in the area • How many homes in the area have PHE radon measurements • The arithmetic and geometric average of the measured radon levels in the area • The highest individual measurement in the area • The number of homes measured at or above the Action Level in the area
The data is available in digital format for download on the gov.uk website.
Table of Contents
Table 1 - Results in each home nation Table 2 - Results in Northern Ireland by local authority Table 3 - Results in Northern Ireland by electoral ward Table 4 - Results in Northern Ireland by postcode district Table 5 - Results in Northern Ireland by postcode sector Table 6 - Results in Northern Ireland by NHS health and social care trust General notes
• In tables 1 - 6 the estimates of the number of addresses are derived from the Royal Mail® Postal Address File (PAF®). PAF also provides administrative and health authority information for each delivery point in Great Britain and Northern Ireland • To avoid undue precision, all numbers other than averages have been rounded to two or three significant figures • For tables 3, 4 and 5 only, where there are fewer than 5 results for a particular grouping the data are not presented. For this reason, the sum of the sub-totals for a set of constituent areas may be slightly less than the total for the aggregate data • Royal Mail® postcodes have four parts and read from left to right, representing progressively smaller groups of addresses • Postcodes have two elements (of two parts each) separated by a space
References
3
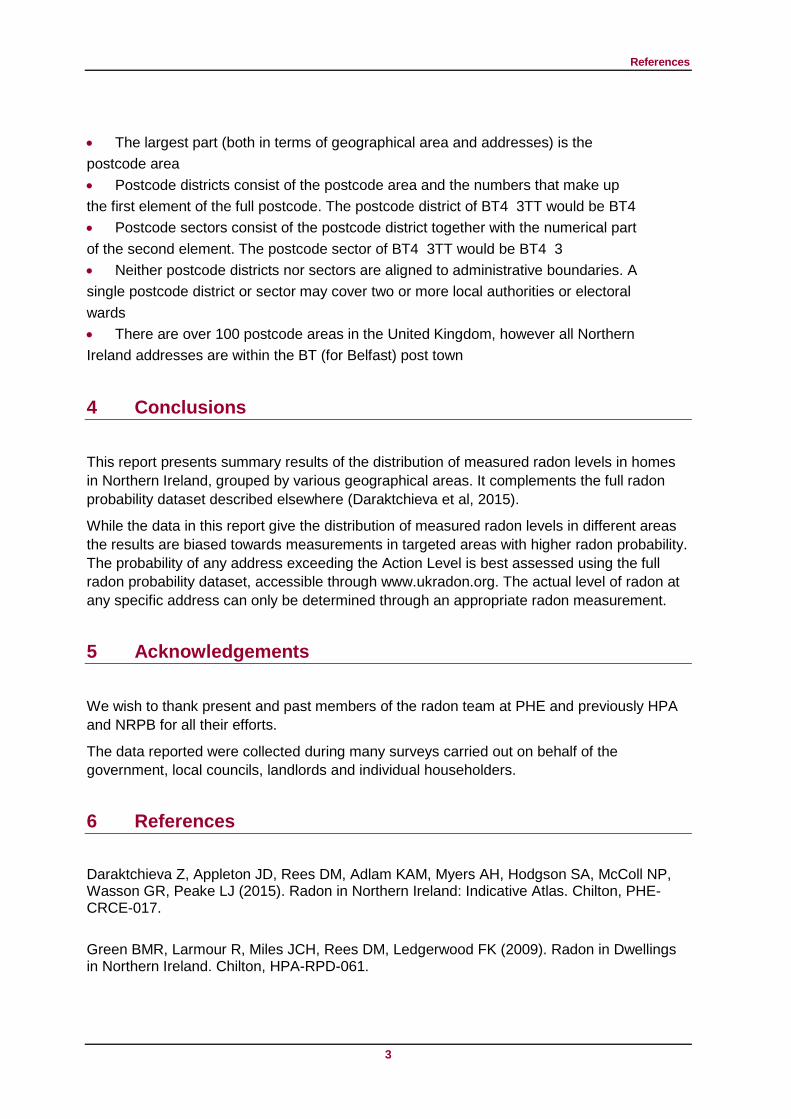
• The largest part (both in terms of geographical area and addresses) is the postcode area • Postcode districts consist of the postcode area and the numbers that make up the first element of the full postcode. The postcode district of BT4 3TT would be BT4 • Postcode sectors consist of the postcode district together with the numerical part of the second element. The postcode sector of BT4 3TT would be BT4 3 • Neither postcode districts nor sectors are aligned to administrative boundaries. A single postcode district or sector may cover two or more local authorities or electoral wards • There are over 100 postcode areas in the United Kingdom, however all Northern Ireland addresses are within the BT (for Belfast) post town
4 Conclusions
This report presents summary results of the distribution of measured radon levels in homes in Northern Ireland, grouped by various geographical areas. It complements the full radon probability dataset described elsewhere (Daraktchieva et al, 2015).
While the data in this report give the distribution of measured radon levels in different areas the results are biased towards measurements in targeted areas with higher radon probability. The probability of any address exceeding the Action Level is best assessed using the full radon probability dataset, accessible through www.ukradon.org. The actual level of radon at any specific address can only be determined through an appropriate radon measurement.
5 Acknowledgements
We wish to thank present and past members of the radon team at PHE and previously HPA and NRPB for all their efforts.
The data reported were collected during many surveys carried out on behalf of the government, local councils, landlords and individual householders.
6 References
Daraktchieva Z, Appleton JD, Rees DM, Adlam KAM, Myers AH, Hodgson SA, McColl NP, Wasson GR, Peake LJ (2015). Radon in Northern Ireland: Indicative Atlas. Chilton, PHE-CRCE-017. Green BMR, Larmour R, Miles JCH, Rees DM, Ledgerwood FK (2009). Radon in Dwellings in Northern Ireland. Chilton, HPA-RPD-061.

Radon in Homes in Northern Ireland: 2016 Data Report
4
Miles JCH and Howarth CB (2008). Validation scheme for organisations making measurements of radon in dwellings: 2008 revision. Chilton, HPA-RPD-047. NRPB (1993). Radon affected areas: Northern Ireland. Doc NRPB, 4, (6), 9-15. NRPB (1999a). Radon Affected Areas: Northern Ireland - 1999 review. Doc NRPB 10, (4). NRPB (1999b). Radon in dwellings in Northern Ireland: Atlas and 1999 review. NRPB-R308 Wrixon, AD, Green BMR, Lomas PR, Miles JCH, Cliff KD, Francis EA, Driscoll CMH, James AC and O'Riordan MC, 1988. Natural radiation exposure in UK dwellings. Chilton, NRPB-R190 (London, HMSO). 7 Glossary of terms
Averages. Within this report numerical data are presented in two ways: arithmetic average and geometric average. The arithmetic average is derived from summing the results by grouped unit then dividing by the number of results. The geometric average is the nth root of the product of n results.
Becquerel. Symbol Bq. The SI unit of radioactivity and measures the activity of a radionuclide transformation or decay. An activity of 1 becquerel denotes an activity of 1 nuclear transformation or decay per second.
Becquerel per cubic metre of air. Symbol Bq m-3. A quantity indicating the amount of radionuclide transformation in each cubic metre of air per second. Often referred to as the activity concentration.
Population-weighted average. The value obtained for the analysis of a sample selected in which each member of the population has an equal chance of inclusion in the sample. In the specific case of the UK National Radon Survey (Wrixon et al 1988), the population was every domestic address in the UK and a systematic sample was taken, ie every Nth address, from all domestic addresses listed in postcode order.
Radon Action Level. The activity concentration of radon in UK homes above which reduction is advised. Its value, expressed as the annual average radon gas concentration in the home, is 200 Bq m-3.
Radon Affected Areas. Parts of the country with a 1% or greater probability of present or future homes being at or above the Action Level.

Tabular data
5
8 Tabular data
Table 1 Summary data by home nation for the United Kingdom
Homes Results Bq m-3
Nation Total Measured Arithmetic Average
Geometric Average
Population Weighted
Average
At or above Action Level
England 23,500,000 525,000 105 55 21 64,900 Northern Ireland 790,000 24,400 70 46 19 1,300
Scotland 2,570,000 27,900 58 28 16 1,400 Wales 1,400,000 18,400 90 51 20 1,900 UK Total 28,260,000 595,700 101 53 20 69,500
Table 2 Summary data by local authority
Homes Results Bq m-3
Local Authority Name
Total Measured Arithmetic Average
Geometric Average Highest
At or above Action Level
Antrim and Newtownabbey 60,000 200 25 18 360 1
Armagh, Banbridge and Craigavon
84,200 1,000 44 33 380 18
Belfast 157,000 54 23 19 73 0
Causeway Coast and Glens
64,600 710 38 27 400 8
Derry and Strabane 60,800 5,000 80 51 4,900 340
Fermanagh and Omagh 49,000 2,300 60 37 3,900 110
Lisburn and Castlereagh 59,800 440 46 34 1,300 3
Mid and East Antrim 59,900 300 24 18 220 2
Mid Ulster 53,800 1,400 57 38 2,000 40
Newry, Mourne and Down 70,300 12,000 78 53 2,500 750
North Down and Ards 71,900 1,000 43 33 460 7

Radon in Homes in Northern Ireland: 2016 Data Report
6
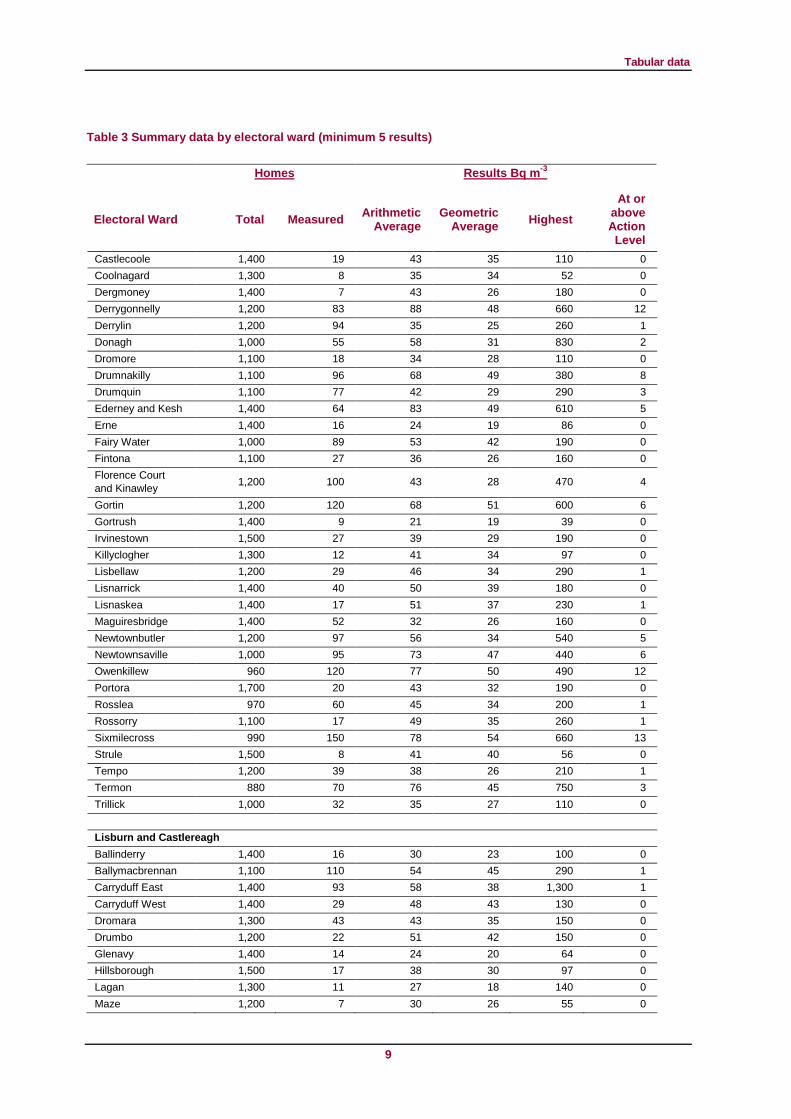
Table 3 Summary data by electoral ward (minimum 5 results)
Homes Results Bq m-3
Electoral Ward Total Measured Arithmetic Average
Geometric Average Highest
At or above Action Level
Antrim and Newtownabbey
Aldergrove 1,600 25 23 19 54 0 Antrim Centre 2,000 8 21 20 29 0 Ballyclare West 1,500 5 21 18 28 0 Ballynure 1,400 7 27 22 57 0 Clady 1,300 11 20 17 53 0 Cranfield 1,200 7 13 11 25 0 Doagh 1,400 13 33 30 59 0 Jordanstown 1,200 8 28 15 130 0 Mallusk 2,300 5 20 16 48 0 Mossley 1,600 8 26 18 66 0 Parkgate 1,200 21 34 24 150 0 Randalstown 1,600 6 11 10 16 0 Shilvodan 1,300 14 17 15 39 0 Templepatrick 1,400 9 66 33 360 1 Toome 1,300 17 28 24 72 0
Armagh, Banbridge and Craigavon
Aghagallon 1,600 13 27 21 71 0 Ballybay 2,300 8 19 17 30 0 Banbridge East 1,600 25 35 29 100 0 Banbridge North 1,800 7 43 35 81 0 Banbridge South 2,200 5 30 28 53 0 Blackwatertown 1,900 68 49 38 220 1 Bleary 1,700 11 31 28 53 0 Brownlow 2,500 5 13 12 23 0 Cathedral 2,000 17 75 58 290 1 Corcrain 2,200 5 19 15 38 0 Demesne 2,200 5 26 24 37 0 Derrytrasna 1,700 12 44 34 190 0 Donaghcloney 1,700 14 35 32 69 0 Dromore 1,900 12 30 26 73 0 Gilford 2,000 14 55 32 330 1 Gransha 1,800 74 45 33 210 2 Hamiltonsbawn 1,800 26 43 32 170 0 Keady 2,200 56 30 24 99 0 Loughbrickland 2,000 80 51 37 380 3 Loughgall 2,000 45 39 29 130 0 Mahon 2,100 7 25 19 62 0 Markethill 2,100 32 47 35 180 0 Navan 1,800 100 61 45 250 5 Quilly 1,800 32 41 30 190 0 Rathfriland 2,000 190 41 33 230 2 Richhill 1,900 20 51 41 180 0 Seagahan 1,900 59 46 33 200 1

Tabular data
7
Table 3 Summary data by electoral ward (minimum 5 results)
Homes Results Bq m-3
Electoral Ward Total Measured Arithmetic Average
Geometric Average Highest
At or above Action Level
Tandragee 2,100 6 20 14 63 0 The Birches 2,100 41 33 27 190 0 The Mall 2,500 32 57 38 230 2 Waringstown 2,100 5 28 26 47 0
Belfast Central 6,100 5 41 38 67 0 Legoniel 2,600 5 16 15 23 0 Causeway Coast and Glens Aghadowey 1,300 27 22 18 60 0 Altahullion 1,200 28 39 30 110 0 Ballykelly 1,200 36 33 24 130 0 Ballymoney North 1,600 8 31 30 46 0 Ballymoney South 1,300 8 21 17 47 0 Castlerock 1,800 11 28 24 77 0 Clogh Mills 1,400 16 20 17 47 0 Dervock 1,500 11 21 17 49 0 Drumsurn 1,400 7 22 19 51 0 Dundooan 1,700 12 32 26 79 0 Dungiven 1,200 25 34 27 93 0 Dunloy 1,200 20 20 18 59 0 Feeny 1,300 84 68 50 310 4 Garvagh 1,400 17 22 19 46 0 Giant's Causeway 2,000 20 31 22 120 0 Greysteel 1,900 57 75 53 400 3 Kilrea 1,400 18 24 21 48 0 Kinbane 1,700 29 45 27 250 1 Loughguile and Stranocum 1,400 20 22 16 74 0
Lurigethan 1,400 36 40 28 170 0 Macosquin 1,300 24 28 25 74 0 Magilligan 1,300 50 31 23 190 0 Portrush and Dunluce 2,700 9 18 14 64 0
Portstewart 2,500 5 25 23 38 0 Rasharkin 1,400 16 17 14 36 0 Route 1,400 5 28 26 54 0 Torr Head and Rathlin 1,600 85 38 30 140 0
Derry and Strabane Artigarvan 1,400 450 83 62 710 30 Ballycolman 1,400 58 26 22 94 0 Ballymagroarty 1,500 7 28 22 52 0 Brandywell 1,600 5 77 51 220 1 Carn Hill 1,300 8 33 24 90 0

Radon in Homes in Northern Ireland: 2016 Data Report
8
Table 3 Summary data by electoral ward (minimum 5 results)
Homes Results Bq m-3
Electoral Ward Total Measured Arithmetic Average
Geometric Average Highest
At or above Action Level
Castlederg 1,600 260 75 54 1,400 14 Caw 1,900 27 70 54 290 2 City Walls 2,100 6 38 32 57 0 Claudy 1,300 300 84 57 840 26 Clondermot 1,400 140 67 48 780 4 Creggan 1,400 5 38 26 59 0 Creggan South 1,500 5 97 74 220 1 Culmore 1,400 50 55 46 160 0 Drumahoe 1,700 290 72 46 1,100 12 Dunnamanagh 1,400 550 135 78 1,500 94 Ebrington 2,000 15 44 32 120 0 Eglinton 1,500 200 54 43 220 5 Enagh 1,600 95 82 50 1,300 4 Finn 1,600 120 89 66 730 10 Foyle Springs 1,200 9 32 30 49 0 Galliagh 1,600 19 28 22 84 0 Glenderg 1,300 270 81 54 1,600 18 Glenelly Valley 1,300 140 77 45 960 9 Kilfennan 1,600 30 44 33 170 0 Lisnagelvin 1,600 36 32 25 140 0 Madam's Bank 1,300 9 32 27 67 0 New Buildings 1,500 250 61 43 610 9 Newtownstewart 1,400 230 72 50 620 13 Northland 2,300 10 32 28 73 0 Park 1,200 270 95 60 2,200 23 Shantallow 1,500 6 32 24 73 0 Shantallow East 1,500 14 48 40 120 0 Sheriff's Mountain 1,300 32 81 50 490 4 Sion Mills 1,600 250 67 44 1,300 9 Skeoge 1,600 7 68 55 170 0 Slievekirk 1,300 330 95 57 4,900 29 Springtown 1,200 5 40 35 66 0 Strabane North 1,800 280 76 54 710 19 Strabane West 1,400 200 34 26 180 0 Victoria 1,900 17 61 40 220 1
Fermanagh and Omagh Ballinamallard 1,200 23 34 29 100 0 Belcoo and Garrison 1,200 160 90 31 3,900 9
Belleek and Boa 1,500 150 61 40 500 7 Beragh 1,100 99 56 42 290 1 Boho, Cleenish and Letterbreen 1,300 88 59 31 1,200 3
Brookeborough 990 44 43 31 140 0 Camowen 1,300 17 46 36 180 0
Tabular data
9
Table 3 Summary data by electoral ward (minimum 5 results)
Homes Results Bq m-3
Electoral Ward Total Measured Arithmetic Average
Geometric Average Highest
At or above Action Level
Castlecoole 1,400 19 43 35 110 0 Coolnagard 1,300 8 35 34 52 0 Dergmoney 1,400 7 43 26 180 0 Derrygonnelly 1,200 83 88 48 660 12 Derrylin 1,200 94 35 25 260 1 Donagh 1,000 55 58 31 830 2 Dromore 1,100 18 34 28 110 0 Drumnakilly 1,100 96 68 49 380 8 Drumquin 1,100 77 42 29 290 3 Ederney and Kesh 1,400 64 83 49 610 5 Erne 1,400 16 24 19 86 0 Fairy Water 1,000 89 53 42 190 0 Fintona 1,100 27 36 26 160 0 Florence Court and Kinawley 1,200 100 43 28 470 4
Gortin 1,200 120 68 51 600 6 Gortrush 1,400 9 21 19 39 0 Irvinestown 1,500 27 39 29 190 0 Killyclogher 1,300 12 41 34 97 0 Lisbellaw 1,200 29 46 34 290 1 Lisnarrick 1,400 40 50 39 180 0 Lisnaskea 1,400 17 51 37 230 1 Maguiresbridge 1,400 52 32 26 160 0 Newtownbutler 1,200 97 56 34 540 5 Newtownsaville 1,000 95 73 47 440 6 Owenkillew 960 120 77 50 490 12 Portora 1,700 20 43 32 190 0 Rosslea 970 60 45 34 200 1 Rossorry 1,100 17 49 35 260 1 Sixmilecross 990 150 78 54 660 13 Strule 1,500 8 41 40 56 0 Tempo 1,200 39 38 26 210 1 Termon 880 70 76 45 750 3 Trillick 1,000 32 35 27 110 0
Lisburn and Castlereagh Ballinderry 1,400 16 30 23 100 0 Ballymacbrennan 1,100 110 54 45 290 1 Carryduff East 1,400 93 58 38 1,300 1 Carryduff West 1,400 29 48 43 130 0 Dromara 1,300 43 43 35 150 0 Drumbo 1,200 22 51 42 150 0 Glenavy 1,400 14 24 20 64 0 Hillsborough 1,500 17 38 30 97 0 Lagan 1,300 11 27 18 140 0 Maze 1,200 7 30 26 55 0

Radon in Homes in Northern Ireland: 2016 Data Report
10
Table 3 Summary data by electoral ward (minimum 5 results)
Homes Results Bq m-3
Electoral Ward Total Measured Arithmetic Average
Geometric Average Highest
At or above Action Level
Moira 1,500 5 34 26 76 0 Moneyreagh 1,100 9 38 30 90 0 Ravernet 1,200 17 36 32 60 0 Stonyford 1,100 8 25 20 56 0 Mid and East Antrim Ahoghill 1,500 5 29 28 35 0 Ardeevin 1,500 10 18 17 28 0 Ballycarry and Glynn 1,500 13 30 22 130 0
Broughshane 1,600 5 24 22 31 0 Cairncastle 1,400 10 31 23 91 0 Carnlough and Glenarm 1,500 35 25 16 220 1
Galgorm 1,300 7 20 18 36 0 Glenravel 1,300 17 21 18 37 0 Glenwhirry 1,200 21 21 16 88 0 Grange 1,300 13 28 19 130 0 Islandmagee 1,400 13 27 25 48 0 Kells 1,400 6 24 22 36 0 Kilwaughter 1,700 22 30 18 220 1 Kirkinriola 1,200 9 24 23 35 0 Maine 1,100 15 24 20 57 0 Portglenone 1,300 8 25 23 48 0 Slemish 1,200 35 20 17 41 0 Woodburn 1,400 11 15 12 25 0
Mid Ulster Ardboe 1,200 24 92 29 1,500 1 Augher and Clogher 1,300 89 62 47 300 2
Aughnacloy 1,300 74 49 35 290 2 Ballygawley 1,300 50 55 35 440 2 Ballymaguigan 1,300 12 34 27 71 0 Ballysaggart 1,900 8 40 38 66 0 Bellaghy 1,200 13 27 21 99 0 Caledon 1,300 110 65 48 330 5 Castlecaulfield 1,200 28 62 44 230 1 Castledawson 1,500 6 30 22 88 0 Coagh 1,200 7 27 24 45 0 Coalisland North 1,400 13 53 38 150 0 Coalisland South 1,700 5 28 23 58 0 Cookstown East 1,500 20 55 44 170 0 Cookstown South 1,400 19 43 34 160 0 Cookstown West 1,500 30 36 32 100 0 Coolshinny 1,200 35 37 28 170 0 Donaghmore 1,300 45 47 36 190 0

Tabular data
11
Table 3 Summary data by electoral ward (minimum 5 results)
Homes Results Bq m-3
Electoral Ward Total Measured Arithmetic Average
Geometric Average Highest
At or above Action Level
Draperstown 1,200 34 91 32 2,000 1 Fivemiletown 1,300 56 49 32 300 1 Killyman 1,300 13 55 37 170 0 Killymeal 1,700 14 47 35 180 0 Lissan 1,300 48 65 44 390 2 Loughry 1,200 31 86 56 430 4 Lower Glenshane 950 46 32 21 280 1 Maghera 1,500 11 23 18 47 0 Moy 1,400 26 51 35 250 2 Moygashel 1,500 9 49 46 80 0 Mullaghmore 1,500 8 45 36 90 0 Oaklands 1,100 150 64 48 970 3 Pomeroy 1,400 180 79 46 960 12 Stewartstown 1,100 36 46 35 130 0 Swatragh 1,100 17 27 24 63 0 Tamlaght O'crilly 1,300 8 22 20 40 0 The Loup 1,400 12 28 24 65 0 Tobermore 1,300 35 40 29 320 1 Valley 1,200 10 31 23 73 0 Washing Bay 1,200 23 33 28 77 0
Newry, Mourne and Down Abbey 1,800 260 66 46 720 11 Annalong 1,700 600 126 90 1,300 94 Ballybot 2,400 300 48 38 440 5 Ballydugan 1,500 190 46 34 330 3 Ballynahinch 2,100 250 45 37 300 2 Ballyward 1,500 130 58 40 920 4 Bessbrook 2,000 230 56 45 300 4 Binnian 1,600 460 139 102 1,100 86 Burren 1,400 390 90 67 2,500 26 Camlough 1,400 180 76 53 860 8 Castlewellan 1,700 41 36 27 140 0 Cathedral 1,900 180 51 35 460 4 Crossgar and Killyleagh 1,900 250 60 46 470 6
Crossmaglen 1,500 43 47 35 250 1 Damolly 1,700 240 53 41 630 3 Derryboy 1,600 250 51 40 320 2 Derryleckagh 1,500 350 99 67 1,900 38 Donard 2,000 400 41 30 370 3 Drumalane 1,900 330 67 50 910 11 Drumaness 1,500 150 49 38 300 2 Dundrum 1,900 270 47 33 320 7 Fathom 1,500 340 118 75 1,900 43 Forkhill 1,400 360 106 72 1,100 35

Radon in Homes in Northern Ireland: 2016 Data Report
12
Table 3 Summary data by electoral ward (minimum 5 results)
Homes Results Bq m-3
Electoral Ward Total Measured Arithmetic Average
Geometric Average Highest
At or above Action Level
Hilltown 1,700 250 69 47 610 9 Kilkeel 1,700 490 91 68 940 38 Kilmore 1,400 230 52 43 180 0 Knocknashinna 1,800 320 78 54 580 22 Lecale 1,800 390 80 51 1,300 26 Lisnacree 1,800 470 95 71 760 37 Mayobridge 1,600 210 54 42 540 4 Mullaghbane 1,600 170 85 58 800 14 Murlough 2,000 350 40 30 370 4 Newtownhamilton 1,500 62 40 33 150 0 Quoile 1,500 310 58 41 390 8 Rostrevor 2,000 620 105 79 2,000 63 Saintfield 1,700 220 50 42 160 0 St. Patrick's 1,900 300 81 59 860 22 Strangford 1,700 460 108 65 1,600 57 Tollymore 1,600 280 51 38 340 5 Warrenpoint 2,100 480 85 64 1,600 29 Whitecross 1,400 210 73 54 450 11
North Down and Ards Ballygowan 1,600 170 56 46 210 2 Ballymagee 1,400 5 28 26 40 0 Ballywalter 2,100 23 23 20 49 0 Carrowdore 1,800 19 32 27 81 0 Comber South 1,600 65 49 43 180 0 Comber West 1,700 5 40 34 65 0 Cronstown 1,600 5 25 24 41 0 Cultra 1,600 5 50 45 92 0 Donaghadee 1,900 7 53 33 220 1 Glen 1,700 5 38 32 67 0 Holywood 2,000 7 33 28 66 0 Killinchy 1,500 220 47 37 180 0 Kircubbin 1,900 57 32 26 120 0 Loughries 1,600 31 41 29 180 0 Movilla 1,700 6 23 22 35 0 Portaferry 1,600 280 41 29 460 4 Portavogie 1,700 29 29 25 71 0 Warren 2,000 21 40 31 140 0

Tabular data
13
Table 4 Summary data by postcode district (minimum 5 results)
Homes Results Bq m-3
Postcode District Totals Measured Arithmetic
Average Geometric
Average Highest At or
above Action Level
BT5 19,100 7 29 26 59 0 BT7 9,500 5 31 28 54 0 BT8 12,300 110 54 35 1,300 1 BT14 14,700 7 14 13 23 0 BT15 12,900 5 16 16 22 0 BT17 13,400 11 21 15 74 0 BT18 6,500 15 37 30 92 0 BT19 16,400 19 30 23 93 0 BT20 12,600 10 19 13 46 0 BT21 3,800 31 46 32 220 1 BT22 9,900 420 37 28 460 4 BT23 23,900 540 50 40 210 2 BT24 7,400 880 49 41 300 3 BT25 6,200 140 42 32 250 1 BT26 3,800 79 46 36 180 0 BT27 9,800 97 50 40 290 1 BT28 18,200 39 28 20 230 1 BT29 5,300 40 23 20 64 0 BT30 14,500 2,500 71 46 1,600 130 BT31 3,400 190 51 34 920 6 BT32 10,500 110 38 29 260 1 BT33 5,400 1,000 43 32 370 16 BT34 23,900 5,300 93 66 2,500 460 BT35 17,800 2,400 77 53 1,900 130 BT36 20,100 24 21 16 66 0 BT37 11,900 16 25 15 130 0 BT38 18,300 34 20 17 62 0 BT39 10,300 67 29 20 360 1 BT40 12,200 54 30 21 220 1 BT41 17,300 89 22 18 130 0 BT42 15,100 86 26 21 150 0 BT43 9,500 44 23 20 80 0 BT44 10,000 170 27 19 220 1 BT45 13,400 190 45 26 2,000 3 BT46 3,900 53 28 22 120 0 BT47 24,600 2,100 74 49 4,900 110 BT48 24,200 200 51 37 490 6 BT49 9,600 110 32 24 190 0 BT51 11,000 100 25 21 77 0 BT52 7,900 9 21 19 33 0 BT53 10,700 92 24 19 95 0 BT54 3,900 74 43 31 250 1 BT55 5,200 6 28 26 48 0 BT56 4,600 11 13 11 35 0 BT57 2,800 25 34 25 120 0 BT60 12,600 310 48 35 250 7

Radon in Homes in Northern Ireland: 2016 Data Report
14
Table 4 Summary data by postcode district (minimum 5 results)
Homes Results Bq m-3
Postcode District Totals Measured Arithmetic
Average Geometric
Average Highest At or
above Action Level
BT61 6,600 100 57 42 290 3 BT62 13,800 93 30 24 190 0 BT63 8,500 29 42 30 330 1 BT65 3,400 5 13 12 23 0 BT66 13,900 27 36 29 190 0 BT67 9,700 31 36 24 160 0 BT68 400 65 77 60 330 4 BT69 1,000 65 54 37 290 3 BT70 8,100 410 73 45 960 23 BT71 15,300 210 49 32 1,500 3 BT74 7,800 170 47 31 710 4 BT75 1,600 55 41 29 160 0 BT76 770 35 54 35 300 1 BT77 520 19 55 41 140 0 BT78 12,300 540 52 38 430 12 BT79 10,500 750 67 46 960 40 BT80 9,300 360 61 45 970 11 BT81 3,300 620 81 56 1,600 42 BT82 10,900 2,000 90 55 1,500 180 BT92 7,700 440 47 31 830 14 BT93 5,100 440 82 39 3,900 33 BT94 6,800 210 38 29 290 2

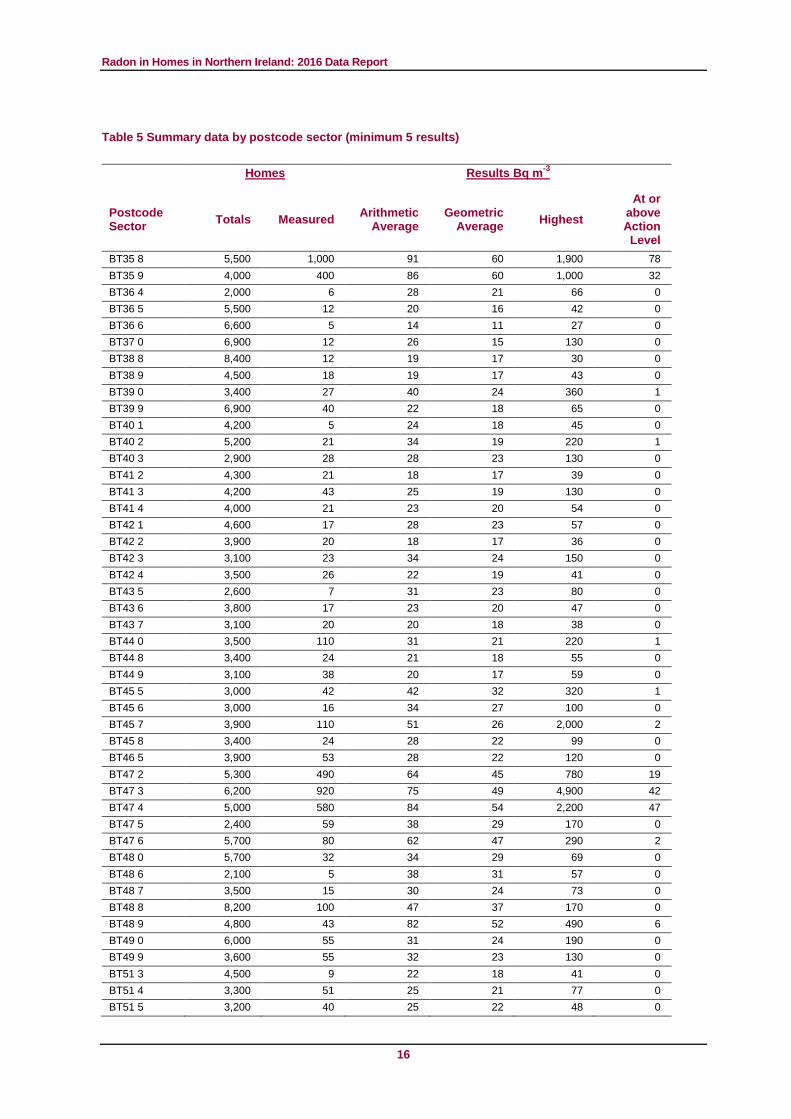
Table 5 Summary data by postcode sector (minimum 5 results)
Homes Results Bq m-3
Postcode Sector Totals Measured Arithmetic
Average Geometric
Average Highest At or
above Action Level
BT8 8 3,900 98 55 36 1,300 1 BT14 8 4,300 7 14 13 23 0 BT17 0 9,300 5 10 8 16 0 BT17 9 4,100 6 30 25 74 0 BT18 0 2,400 8 46 40 92 0 BT18 9 4,200 7 26 22 59 0 BT19 1 6,400 6 32 20 93 0 BT19 6 5,200 5 26 24 40 0 BT19 7 4,800 8 30 25 58 0 BT21 0 3,800 31 46 32 220 1 BT22 1 4,900 360 39 28 460 4 BT22 2 5,000 64 30 24 170 0 BT23 4 6,300 9 27 20 56 0 BT23 5 5,800 140 58 49 210 2 BT23 6 3,200 360 48 39 180 0 BT23 7 4,000 10 41 34 92 0 BT23 8 4,700 20 35 30 90 0 BT24 7 2,300 310 51 43 170 0 BT24 8 5,100 570 48 40 300 3 BT25 1 4,100 68 44 34 190 0 BT25 2 2,100 67 39 30 250 1 BT26 6 3,800 79 46 36 180 0 BT27 5 4,600 26 49 40 150 0 BT27 6 640 68 51 42 290 1 BT28 2 7,000 27 31 22 230 1 BT28 3 6,700 8 22 16 56 0 BT29 4 5,300 40 23 20 64 0 BT30 6 4,700 720 68 46 580 38 BT30 7 3,200 740 91 55 1,600 66 BT30 8 2,300 370 64 41 950 16 BT30 9 4,300 640 53 41 470 10 BT31 9 3,400 190 51 34 920 6 BT32 3 5,400 30 35 26 150 0 BT32 4 3,700 32 36 29 100 0 BT32 5 1,300 49 40 30 260 1 BT33 0 5,400 1,000 43 32 370 16 BT34 1 3,300 520 70 51 860 26 BT34 2 4,500 750 78 55 720 53 BT34 3 5,700 1,600 95 71 2,500 120 BT34 4 6,500 1,900 114 83 1,300 250 BT34 5 3,800 540 58 41 610 14 BT35 0 1,500 54 40 32 120 0 BT35 6 3,500 510 54 41 450 13 BT35 7 3,400 390 65 48 860 11
Radon in Homes in Northern Ireland: 2016 Data Report
16
Table 5 Summary data by postcode sector (minimum 5 results)
Homes Results Bq m-3
Postcode Sector Totals Measured Arithmetic
Average Geometric
Average Highest At or
above Action Level
BT35 8 5,500 1,000 91 60 1,900 78 BT35 9 4,000 400 86 60 1,000 32 BT36 4 2,000 6 28 21 66 0 BT36 5 5,500 12 20 16 42 0 BT36 6 6,600 5 14 11 27 0 BT37 0 6,900 12 26 15 130 0 BT38 8 8,400 12 19 17 30 0 BT38 9 4,500 18 19 17 43 0 BT39 0 3,400 27 40 24 360 1 BT39 9 6,900 40 22 18 65 0 BT40 1 4,200 5 24 18 45 0 BT40 2 5,200 21 34 19 220 1 BT40 3 2,900 28 28 23 130 0 BT41 2 4,300 21 18 17 39 0 BT41 3 4,200 43 25 19 130 0 BT41 4 4,000 21 23 20 54 0 BT42 1 4,600 17 28 23 57 0 BT42 2 3,900 20 18 17 36 0 BT42 3 3,100 23 34 24 150 0 BT42 4 3,500 26 22 19 41 0 BT43 5 2,600 7 31 23 80 0 BT43 6 3,800 17 23 20 47 0 BT43 7 3,100 20 20 18 38 0 BT44 0 3,500 110 31 21 220 1 BT44 8 3,400 24 21 18 55 0 BT44 9 3,100 38 20 17 59 0 BT45 5 3,000 42 42 32 320 1 BT45 6 3,000 16 34 27 100 0 BT45 7 3,900 110 51 26 2,000 2 BT45 8 3,400 24 28 22 99 0 BT46 5 3,900 53 28 22 120 0 BT47 2 5,300 490 64 45 780 19 BT47 3 6,200 920 75 49 4,900 42 BT47 4 5,000 580 84 54 2,200 47 BT47 5 2,400 59 38 29 170 0 BT47 6 5,700 80 62 47 290 2 BT48 0 5,700 32 34 29 69 0 BT48 6 2,100 5 38 31 57 0 BT48 7 3,500 15 30 24 73 0 BT48 8 8,200 100 47 37 170 0 BT48 9 4,800 43 82 52 490 6 BT49 0 6,000 55 31 24 190 0 BT49 9 3,600 55 32 23 130 0 BT51 3 4,500 9 22 18 41 0 BT51 4 3,300 51 25 21 77 0 BT51 5 3,200 40 25 22 48 0

Table 5 Summary data by postcode sector (minimum 5 results)
Homes Results Bq m-3
Postcode Sector Totals Measured Arithmetic
Average Geometric
Average Highest At or
above Action Level
BT52 1 4,100 8 21 20 33 0 BT53 6 3,800 17 26 24 49 0 BT53 7 3,900 32 22 18 54 0 BT53 8 3,000 43 25 18 95 0 BT54 6 3,900 74 43 31 250 1 BT55 7 5,200 6 28 26 48 0 BT56 8 4,600 11 13 11 35 0 BT57 8 2,800 25 34 25 120 0 BT60 1 3,500 42 44 31 220 1 BT60 2 3,100 66 51 37 200 1 BT60 3 3,200 81 32 25 130 0 BT60 4 2,800 120 60 47 250 5 BT61 7 1,500 8 34 32 57 0 BT61 8 2,500 59 62 46 290 2 BT61 9 2,600 33 53 39 230 1 BT62 1 4,400 47 30 25 73 0 BT62 2 2,700 13 21 18 63 0 BT62 3 4,400 11 21 19 38 0 BT62 4 2,200 22 38 27 190 0 BT63 5 6,200 16 32 27 80 0 BT63 6 2,300 13 55 32 330 1 BT66 6 3,800 13 43 33 190 0 BT66 7 6,300 13 31 29 69 0 BT67 0 5,800 25 38 25 160 0 BT67 9 3,900 6 27 21 62 0 BT68 4 400 65 77 60 330 4 BT69 6 1,030 65 54 37 290 3 BT70 1 3,200 59 53 36 440 2 BT70 2 2,700 270 83 50 960 21 BT70 3 2,200 77 51 39 190 0 BT71 4 4,300 37 42 30 150 0 BT71 5 2,400 52 66 33 1,500 1 BT71 6 4,900 56 38 29 180 0 BT71 7 3,800 66 49 36 250 2 BT74 4 1,600 17 47 37 110 0 BT74 5 980 29 66 42 710 1 BT74 6 2,700 34 32 26 86 0 BT74 7 1,800 29 47 32 260 1 BT74 8 350 19 75 49 400 2 BT74 9 300 37 27 20 120 0 BT75 0 1,600 55 41 29 160 0 BT76 0 770 35 54 35 300 1 BT77 0 520 19 55 41 140 0 BT78 1 2,700 32 38 30 190 0 BT78 2 1,700 67 52 38 200 1 BT78 3 2,300 73 33 25 130 0

Radon in Homes in Northern Ireland: 2016 Data Report
18
Table 5 Summary data by postcode sector (minimum 5 results)
Homes Results Bq m-3
Postcode Sector Totals Measured Arithmetic
Average Geometric
Average Highest At or
above Action Level
BT78 4 2,500 270 60 43 430 11 BT78 5 3,200 93 50 40 190 0 BT79 0 3,200 200 70 49 490 12 BT79 7 4,300 220 60 46 600 8 BT79 8 1,100 100 61 37 960 3 BT79 9 2,000 220 73 50 660 17 BT80 0 1,700 19 29 25 65 0 BT80 8 5,100 71 52 40 250 2 BT80 9 2,500 270 66 48 970 9 BT81 7 3,300 620 81 56 1,600 42 BT82 0 2,600 910 116 71 1,500 130 BT82 8 2,600 480 81 57 710 33 BT82 9 5,700 580 55 36 1,300 16 BT92 0 2,000 46 50 38 230 1 BT92 1 310 40 62 40 470 3 BT92 2 630 15 32 26 120 0 BT92 3 340 19 44 29 280 1 BT92 4 500 42 26 20 150 0 BT92 5 430 20 78 29 830 2 BT92 6 530 63 65 37 540 4 BT92 7 930 52 43 33 200 1 BT92 8 840 56 44 32 310 1 BT92 9 1,200 86 36 25 260 1 BT93 0 620 50 91 61 610 4 BT93 1 1,100 64 55 32 470 4 BT93 2 180 18 39 30 110 0 BT93 3 880 76 65 42 500 4 BT93 4 560 53 99 26 1,500 4 BT93 5 530 85 117 42 3,900 6 BT93 6 650 44 45 29 290 2 BT93 7 360 32 145 96 660 9 BT93 8 220 17 38 30 94 0 BT94 1 1,900 51 47 36 180 0 BT94 2 1,400 32 33 28 100 0 BT94 3 1,000 35 32 24 210 1 BT94 4 1,400 47 33 26 130 0 BT94 5 1,100 40 42 29 290 1

Table 6 Summary data by NHS Health and Social Care Trust
Homes Results Bq m-3
Trust Name Totals Measured Arithmetic
Average Geometric
Average Highest At or
above Action Level
Belfast 164,000 190 45 31 1,300 1 Northern 202,000 1,700 42 26 2,000 29 Southern 147,000 9,100 82 56 2,500 630 South Eastern 154,000 5,800 56 39 1,600 160