quantitative bioimage analytics enables measurement of ... · original paper quantitative bioimage...
TRANSCRIPT

ORIGINAL PAPER
Quantitative bioimage analytics enables measurement of targetedcellular stress response induced by celastrol-loaded nanoparticles
Erik Niemelä1,2 & Diti Desai3 & Emine Lundsten1& Jessica M. Rosenholm3
& Pasi Kankaanpää1 & John E. Eriksson1,2
Received: 10 February 2019 /Revised: 12 April 2019 /Accepted: 17 April 2019 /Published online: 11 May 2019# The Author(s) 2019
AbstractThe cellular stress response, which provides protection against proteotoxic stresses, is characterized by the activation of heatshock factor 1 and the formation of nuclear stress bodies (nSBs). In this study, we developed a computerized method to quantifythe formation and size distribution of nSBs, as stress response induction is of interest in cancer research, neurodegenerativediseases, and in other pathophysiological processes. We employed an advanced bioimaging and analytics workflow to enablequantitative detailed subcellular analysis of cell populations even down to single-cell level. This type of detailed analysis requiresautomated single cell analysis to allow for detection of both size and distribution of nSBs. For specific induction of nSB we usedmesoporous silica nanoparticles (MSNs) loaded with celastrol, a plant-derived triterpene with the ability to activate the stressresponse. To enable specific targeting, we employed folic acid functionalized nanoparticles, which yields targeting to folatereceptor expressing cancer cells. In this way, we could assess the ability to quantitatively detect directed and spatio-temporal nSBinduction using 2D and 3D confocal imaging. Our results demonstrate successful implementation of an imaging and analyticsworkflow based on a freely available, general-purpose software platform, BioImageXD, also compatible with other imagingmodalities due to full 3D/4D and high-throughput batch processing support. The developed quantitative imaging analyticsworkflow opens possibilities for detailed stress response examination in cell populations, with significant potential in the analysisof targeted drug delivery systems related to cell stress and other cytoprotective cellular processes.
Keywords Imagequantification .BioImageXD .Nuclearstressbodies .Mesoporoussilicananoparticles .Targeteddrugdelivery .
Celastrol
Introduction
The cellular stress response is an example of a specific cellularprocess that has received broad attention in research related toaging, cancer, neurodegenerative diseases, and other patho-physiological processes. The stress response is characterizedby the formation of nuclear stress bodies (nSBs), which arecharacteristically formed in primate cells upon proteotoxicstress, such as heat shock, oxidative stress, many pharmaco-logical agents, heavy metals, proteasome inhibitors, and ami-no acid analogues (Sarge et al. 1993; Holmberg et al. 2000;Jolly et al. 2002). In this study, we wanted to analyze targetedinduction of nSBs by advanced imaging combined with suit-able software tools to transform the image data produced intomeaningful information (Cardona and Tomancak 2012;Carpenter et al. 2012; Kankaanpää et al. 2012; Myers 2012).Bioimaging has grown to become one of the key methodolo-gies in biomedical research and while there are nowadaysnumerous suitable software packages available, developingtools and workflows for different and specific purposes is still
Electronic supplementary material The online version of this article(https://doi.org/10.1007/s12192-019-00999-9) contains supplementarymaterial, which is available to authorized users.
* Pasi Kankaanpää[email protected]
* John E. [email protected]
Jessica M. [email protected]
1 Cell Biology, Faculty of Science and Engineering, Åbo AkademiUniversity, Turku, Finland
2 Turku Bioscience Centre, University of Turku and Åbo AkademiUniversity, Turku, Finland
3 Pharmaceutical Sciences Laboratory, Faculty of Science andEngineering, Åbo Akademi University, Turku, Finland
Cell Stress and Chaperones (2019) 24:735–748https://doi.org/10.1007/s12192-019-00999-9

often necessary in constantly evolving research scenarios(Upla et al. 2004; Karjalainen et al. 2008; Sukumaran et al.2012; Kankaanpää et al. 2012; Myers 2012).
Heat shock factor 1 (HSF1) is a transcription factor thatactivates the expression of many target genes, and in the caseof classical heat shock response (HSR), HSF1 increases theexpression of molecular chaperones called heat shock proteins(Hsps) that facilitate protein folding and maintenance of afunctional proteostasis during stressed conditions (Cottoet al. 1997; Alastalo et al. 2003; Sandqvist et al. 2009;Biamonti and Vourc'h 2010). A unique feature of the primateheat shock response is that HSF1 not only initiates transcrip-tion of its target Hsp genes, but also binds and accumulates tospecific 9q12 loci at repetitive Satellite III sequences whereHSF1 is responsible for transcribing noncoding Satellite IIIRNAs (Biamonti and Vourc'h 2010). This accumulation ofHSF1 can, in fact, be visualized with fluorescence microscopyas high-intensity spots inside the nucleus, with sizes between0.3 and 3 μm, and this unique subnuclear structure is callednSBs (Holmberg et al. 2000). While counting and measuringnuclear stress bodies (nSBs) are of significant interest in manyresearch situations, the quantification has been limited to man-ual counting (Cotto et al. 1997; Morimoto 1998; Jolly et al.2002; Holmberg et al. 2000; Pirkkala et al. 2001; Alastaloet al. 2003; Sandqvist et al. 2009; Biamonti and Vourc'h2010; Åkerfelt et al. 2010; Mendillo et al. 2012; Baron et al.2013; Vihervaara et al. 2013). Manual quantification is labo-rious, subjective, and limited in terms of the parameters it canreliably produce, especially when estimating sizes of objectsand distances between them (Carpenter et al. 2012; Cardonaand Tomancak 2012; Kankaanpää et al. 2012; Myers 2012).We have now developed a computer-based workflow that en-ables quantification of the cell population positive for nSBs, asa tool for quantitative measurements on how different phar-macological and other stress treatments affect the cellularstress response machinery. Also, other parameters, such assize distribution and location of the nSBs, can easily be ex-tracted with our method. Our solution is based on the combi-nation of standard laser scanning confocal microscopy and aworkflow on a large and versatile open source software plat-form for multi-dimensional bioimages, in this caseBioImageXD. This software natively supports true 3D datain nearly all of its functionality, which includes flexible visu-alization and analysis tools, and batch processing that requiresno programming or scripting (Kankaanpää et al. 2012).BioImageXD has been used in numerous applications in bio-medical research, ranging from virology and nanoparticle in-ternalization studies to cancer medicine and drug development(Upla et al. 2004; Karjalainen et al. 2008; Sukumaran et al.2012; Kankaanpää et al. 2012).
Automated image analysis of nSBs in cell populations,including analysis on single cell level, opens significant pos-sibilities for detailed analysis of HSF1 DNA-binding and
transcription capabilities upon different proteotoxic stressesthat are relevant for pathophysiology or pharmacological de-velopment. Protein aggregates are associated with many neu-rodegenerative diseases and systemic amyloidosis and, conse-quently, there has been significant pharmacological interest tofollow activation of the heat shock response in specific cellsby targeted drug delivery. In this respect, activation of HSF1and thereby synthesis Hsps are of obvious interest as theirinduction will protect the cell from harmful protein aggregatesby promoting renaturation of aggregated proteins back to theirnative conformation (Sarge et al. 1993; Holmberg et al. 2000;Jolly et al. 2002; Trott et al. 2008). Hence, an automatedworkflow to quantify nSB formation would be a significantasset in the field of proteostasis and proteotoxic pathophysi-ology (Jolly et al. 2002; Trott et al. 2008; Singh and Lillard2009; Salminen et al. 2010; Baron et al. 2013; Vihervaaraet al. 2013).
In order to have a pharmacologically relevant context, weutilized nanoparticles as targeted drug delivery systems. Inthis way, we had the possibility to evoke a specific responsein a certain population of cells, while the rest of the cellsremain unaffected (Singh and Lillard 2009; Rosenholm et al.2009, 2010; Bae and Park 2011; Zwicke et al. 2012). In thisstudy, we employed the poorly water-soluble drug celastrol asa model compound to study the cellular stress response andthe formation of nSBs, as it has the ability to efficiently acti-vate the cellular stress response (Westerheide et al. 2004,2009; Niemelä et al. 2015). Target-selectivity was achievedby functionalizing the nanoparticle surface with folic acid(FA), as cells with high folate receptor (FR) expression caninternalize such particles through receptor-mediated endocy-tosis (Leamon and Low 2001; Rosenholm et al. 2009;Kularatne and Low 2010). The majority of cancer cells ex-press FR in significantly higher amounts than most normalcells, and this difference was utilized as a model system toevaluate the specificity of these celastrol-loaded FA-conjugat-ed nanoparticles (Nakajima and Ikada 1995; Kennedy et al.2003; Elnakat and Ratnam 2004; Parker et al. 2005;Rosenholm et al. 2006, 2008; Desai et al. 2014).
By using the imaging-based quantitation method, we couldshow that FA-conjugated nanoparticles were more efficientlyendocytosed by FR-positive cells than FR-negative cells.Furthermore, the imaging-based quantification confirmed thatthe celastrol-loaded nanoparticles induced nSBs formation inFR-positive Hela cells and not in FR-negative A549 cells.Taken together, our results demonstrate that the developedautomated detection workflow achieves detailed quantitativeanalysis of several facets of the heat shock response, as aspecific cellular process, and that analysis was achieved bothon population and single cell level. Because our work is basedon a straightforward imaging modality and freely availableopen source software, our approach can easily be utilizedand adapted by others working in the field of targeted drug
736 E. Niemelä et al.

delivery and cellular stress responses. Furthermore, thetargeted induction of the stress response by celastrol has po-tential ramifications in diseases that are associated with pro-tein aggregates and disturbed proteostasis.
Materials and methods
Cell culture and sample preparations
Hela human cervical carcinoma cells and A549 lung adeno-carcinoma epithelial cells were cultured in Dulbecco’sModified Eagle’s Medium (DMEM; Sigma-Aldrich, St.Louis, MO, USA) supplemented with 10% fetal calf serum(BioClear, Wiltshire, UK), 2 mM L-glutamin, 100 U/ml pen-icillin, 100 μg/ml streptomycin at 37 °C, 5% CO2, and 90%relative humidity. Heat shock treatments were performed aspreviously described at 42 °C in a constant temperature waterbath (Cotto et al. 1997; Holmberg et al. 2000). The mesopo-rous silica nanoparticles (MSNs) were suspended in a HEPESbuffer at neutral pH and ultra-sonicated for 30 min beforeadministration.
Detection of nuclear stress bodies by confocalmicroscopy
Hela and A549 cells were seeded on sterile coverslips thatwere mounted in 24 well cell culture dishes and grown eitherunder control conditions at 37 °C or heat shocked at 42 °C for15 min, 30 min, or 120 min, or then incubated with concen-trations ranging from 0 to 60 μg/ml of MSNs for 3 h. Forindirect immunofluorescence of the treated cells grown onthe coverslips, samples were first washedwith PBS containing0.05% Tween 20, then either fixed and permeabilized for6 min in − 20 °C methanol or with 3.7% paraformaldehydecontaining 0.5% Triton X-100 for 15 min at room tempera-ture. After three washes with PBS 0.05%Tween 20, cells wereincubated for 1 h with blocking solution (10% fetal calf serumin PBS 0.05% Tween 20), then overnight with rabbit anti-HSF1 antibody (1:400 dilution; Holmberg et al. 2000). Afterthree washes with PBS 0.05% Tween 20, samples were incu-bated for 1 h at room temperature with the secondary goatanti-rabbit antibodies in a dilution of 1:5000 (Alexa™ 546,Molecular Probes, Eugene, Oregon, USA). DNAwas stainedwith VECTASHIELD® Mounting Media containing 4′, 6-diamidino-2-phenylindole dihydrochloride (DAPI; VectorLaboratories, Burlingame, California, USA). Images of cellswere taken using a Zeiss LSM510-Meta Axiovert 200M scan-ning confocal microscope (Carl Zeiss Microscopy GmbH,Jena, Germany) equipped with the SP2 software (version3.2) and using a Plan-Apochromat 63x/1.4 Oil DIC objective.Using 405 nm excitation and 420–480 nm emission filteringfor detecting the DAPI channel, and 543 nm excitation and >
560 nm emission filtering for the HSF1 channel, the two chan-nels were separately recorded (multi-tracking). At least threerepresentative images were acquired from three independentexperiments for each sample. Imaging settings, such as laserpowers, detector gains, pixel depth, and pixel density, werekept constant throughout all imaging, with pixel density setaccording to the Nyquist theorem. For 2D imaging, the focalplane was set to the middle of the cells, and for 3D imagingcells were entirely covered by optical sectioning.
The manual counting of nSBs and nSBs-positive cells isbased solely upon visually inspecting 2D confocal images.First, the number of cells per image was counted from theDAPI channel, then from the HSF1 channel the number ofnSBs was counted as high intensity spots inside the cell nu-cleus. For a cell to be classified as nSBs positive there had tobe one or more nSBs inside the nucleus, from which it waspossible to calculate the percentage of nSBs positive cells inthe total population.
Computer-based quantification of nuclear stressbodies
To quantify nSBs, local fluorescence intensity clusters of theHSF1 channel inside the cell nucleus were analyzed. First, cellnuclei were segmented in order to obtain the number of cellsper image and to define the spatial region occupied by thenucleus in each cell, and for this purpose, the DAPI channelwas used. The images were first filtered with Gaussian smooth(radius factor X: 15, Y: 15 Z: 1), and global threshold wasused to divide the image into foreground and background(lower threshold 18, determined by visual evaluation). Afterthat, object separation was used to identify individual nucleiand separate nuclei that were touching each other (segmenta-tion level 10.0, remove objects with less voxels than 200). TheBioImageXD Object separation is a multi-step process thatuses, e.g., distance transform, morphological watershed seg-mentation and masking to create a label image from a binaryimage. It is able to separate objects touching each other, unlikeregular labeling based on connectivity. The small object re-moval threshold in object separation was set to remove objectslikely to be artifacts rather than cell nuclei. The resulting re-labeled images (segmented cell nuclei) were then analyzed toobtain the number of cells per image.
Second, the nSBs were segmented from the HSF1 channel,in order to quantify nSBs and to classify cells into nSBs-positive and negative cells. The images were first mean-filtered (radius X: 5, Y: 5 and Z: 1), and by utilizing dynamicthreshold with a radius of X:5, Y:5, and Z:1 together withthreshold over statistics set on 16, the nSBs were separatedfrom the background (Fig. 1c, d). Dynamic thresholding en-abled the identification of nSBs that vary in intensity but arediscernible in a local intensity environment. After thethresholding, BioImageXD object separation was used to
Quantitative bioimage analytics enables measurement of targeted cellular stress response induced by... 737

identify individual nSBs and to separate nSBs touching eachother (segmentation level 1.0). Objects (nSBs) with lessvoxels than 10 (corresponding to a 0.3-μm object diameter)were removed from the 3D images based on size distributionanalysis, and for the high-throughput quantification based on2D images a lower limit of 30 voxels (corresponding to0.6 μm object diameter) was used.
Third, BioImageXD Object colocalization was employedto analyze the segmented nSBs and the segmented cell nucleiwith respect to each other. Object colocalization analyzes thecolocalization of two segmented channels (as opposed to con-ventional pixel/voxel-based colocalization analyses), and oneof the many outputs of this procedure is that it can quantify thenumber of nSBs inside each cell’s nucleus, which in turnmakes it possible to count the percentages of nSBs-positivecells within the sample population. In addition, each nSBswasquantitatively analyzed for object area. By utilizing the basic
formula d ¼ 2ffiffiffi
Ap
=π, the diameter (d) of each nSBs was cal-culated from the area (A), producing quantifiable size distri-butions of the nSBs in the samples.
Synthesis and characterization of mesoporous silicananoparticles
The mesoporous silica nanoparticles were synthetized accord-ing to our previously published methods (Rosenholm et al.
2006, 2008, 2009). The synthesis was conducted under inertatmosphere conditions, where 1.152 ml of tetramethylorthosilicate (TMOS) was mixed with 0.155 ml of APTMS(3-aminopropyl-trimethoxysilane) together with 2.5 mg fluo-rescein isothiocyanate (FITC), to create inherently fluorescentparticles. The solution was mixed with an alkaline solutioncontaining the structure-directing agent cetyltrimethyl ammo-nium chloride (CTACl) and methanol. The synthesis mixtureused had a molar ratio of 0.9 TMOS: 0.1 APTMS: 1.27CTACl: 0.26 NaOH: 1439 MeOH: 2560 H2O. The synthesissolution was stirred overnight at room temperature; thereafter,the particles were separated by centrifugation and washedwith ethanol. The structure-directing agent was removed byultrasonication in acidic (HCl) ethanol, centrifuged, and thisprocess was repeated three times to further eliminate any re-sidual surfactant. After that, the particles were washed withethanol and vacuum-dried at room temperature overnight.Poly(ethylene imine), PEI, was grown onto the MSNs byhyperbranching surface polymerization of aziridine accordingto our previously described procedures (Rosenholm et al.2006, 2008, 2009). After functionalization, the particles werewashed repeatedly with ethanol and vacuum-dried at roomtemperature overnight. The amount of PEI-functionalizationand celastrol loading degree was calculated on the basis ofthermogravimetric analysis (TGA; Netzsch TG 209, Selb,Germany), using temperature intervals of 150 to 700 °C.
Fig. 1 Quantification of nuclearstress bodies. The number of cells(n) per image was calculated fromthe DAPI channel a using globalthresholding and objectseparation, resulting in eachnucleus being represented by aseparate object, with arbitrarycoloring facilitating visualinspection b. The nSBs weresegmented from thecorresponding channel c bydynamic thresholding and objectseparation, for detecting localHSF1 intensity spots of varyingintensity d. Object-based co-lo-calization was used to analyze theoverlapping nSBs objects withnucleus objects and cells with atleast one stress granule in thenucleus were classified asstressed, images are maximumintensity projections of 3Ddatasets
738 E. Niemelä et al.

PEI-functionalization was further confirmed by zeta potentialmeasurements (Malvern ZetaSizer NanoZS, MalvernInstruments Ltd., Worcestershire, UK). Folic acid was cova-lently attached to the terminal amino groups of the PEIbranches through carbodiimide coupling chemistry accordingto previous publications (Rosenholm et al. 2008, 2009, 2010).The hydrodynamic size of the particles, indicating theredispersibility in a HEPES buffer at pH 7.2, was confirmedby dynamic light scattering (DLS) measurements (MalvernZe taS iz e r NanoZS , Ma lve rn Ins t rumen t s L td . ,Worcestershire, UK). In order to estimate the size, morpholo-gy, and monodispersity of these MSNs, scanning electron mi-croscopy (SEM; Jeol JSM-6335F, Jeol Ltd., Tokyo, Japan)and transmission electron microscopy (TEM; JEM 1400-Plus, JEOL Ltd., Tokyo, Japan) were employed. The amountof folic acid conjugated onto the particle surface was calculat-ed using UV-Vis spectroscopy.
Assessment of particle endocytosis
Hela and A549 cells were seeded in 12 well culture dishes in1 ml of cell medium for 24 h before the experiment. MSNswere suspended in cell medium at 1 μg/ml concentration andsonicated; thereafter, the medium containing particles or vehi-cle control (0.2% DMSO) was applied to 50–60% confluentcells and incubated for 3 h at 37 °C. Then, cells weretrypsinized and harvested and the extracellular fluorescencewas quenched by resuspension in trypan blue (200 μg/ml;Sigma-Aldrich, St. Louis, MO, USA) for 10 min at roomtemperature. The cells were washed and resuspended in phos-phate buffer saline (PBS) and the amount of endocytosed par-ticles inside cells was analyzed by BD FACSCalibur flowcytometer (FITC emission was detected with FL-1 channel;BD Pharmingen, San Diego, CA, USA). Then the data wasanalyzed with BD CellQuest Pro™ software (BDPharmingen, San Diego, CA, USA) for acquiring percentagesof FITC positive cells.
For validating particle endocytosis in folate receptor posi-tive cells, confocal microscopy was employed on Hela cellsthat were grown on sterile coverslips and incubated with10 μg/ml particles for 3 h. Extracellular fluorescence wasquenched with trypan blue (200 μg/ml) for 10 min at roomtemperature. Cells were then washed with PBS and labeledwith rhodamine-lectin (Vector Laboratories, Burlingame,California, USA) for 15 min at 37 °C. Thereafter, the cellswere washed and fixed with 3.7% paraformaldehyde contain-ing 0.5% Triton X-100 for 15 min at room temperature. Thecells were washed and then mounted on glass slides usingVECTASHIELD® mounting media containing DAPI(Vector Laboratories, Burlingame, California, USA). The par-ticle endocytosis was imaged using a Zeiss LSM510 METAconfocal microscope (Carl Zeiss Microscopy GmbH, Jena,Germany) with a 63× oil objective, utilizing an excitation
wavelength of 488 nm and a bandwidth emission filter with500–550 nm for detecting the FITC channel.
Induced heat shock measurement by Western blot
Celastrol-loaded MSNs ability to increase the Hsp70 proteinlevels in both cell lines were investigated by Western blot(WB). Hela and A549 cells were incubated with celastrol-loaded nanoparticles or empty particles for 6 h in order toobtain similar treatment conditions to that of the immunoflu-orescences images. Cells were thereafter lysed with laemmlibuffer containing β-mercaptoethanol and samples weredenaturated at 95 °C for 10 min. Ten micrograms of wholecell lysate was separated by 10% SDS-PAGE and the proteinswere transferred to nitrocellulose membranes. Primary anti-body Hsp70 (SPA-810; Stressgen Biotechnologies,California, USA) was used at a 1:10000 dilution and anti-β-actin antibody (Sigma-Aldrich, St. Louis, MO, USA) wasused at a 1:1000 dilution as loading control. Secondary sheepanti-mouse antibody (GE healthcare, Buckinghamshire, UK)was used in a 1:50000 dilution, and the signal was detectedusing enhanced chemiluminescence (Amersham BiosciencesCorp., Piscataway, NJ, USA).
Statistical analysis
Statistical significance (P value) was determined by one-wayanalysis of variance with Bonferroni post hoc test, usingGraphPad Prism® 5.0 (San Diego, California, USA). Theerror bars represent plus-minus the standard error of the mean(±SEM) of either number (n) of samples, cells or nSBs ana-lyzed. Frequency distribution was used for representing thesize distributions of nSBs from the quantified 3D images.
Results
Validation of the automated nuclear stress bodiesquantification method
The 2D confocal images of the heat-treated samples were firstquantifiedmanually, and the results were then compared to thecomputer-based automated quantification using the same im-age datasets. For the computer-based counting of nSBs andnSBs-positive cells, multi-step workflows were developed inthe BioImageXD software, version 1.0RC3 (Kankaanpääet al. 2012). In short, cell number and cell nucleus were de-tected from the DAPI channel and the nSBs were measuredwith dynamic thresholding and object separation from theHSF1 channel. Then by object-based co-localization, it waspossible to calculate the percentages of the cell population thathad one or more stress granule(s) in the nucleus (Fig. 1).
Quantitative bioimage analytics enables measurement of targeted cellular stress response induced by... 739

The results from the heat-shocked samples show that bothmethods give similar mean values, and there is no statisticaldifference between the two quantifications, demonstrating theaccuracy of the computer-based method (Fig. 2). In addition,both quantifications show that there is a temperature and time-dependent induction of nSBs in Hela cells that correlates withprevious publications, further validating the usefulness of thecomputer-based method in measuring nSBs formation kinet-ics under different treatments (Fig. 2b; Cotto et al. 1997;Holmberg et al. 2000). More importantly by utilizing our au-tomated workflow it was possible to acquire detailed informa-tion regarding the size distribution of the 3D dataset, whichwould have been laborious, subjective, and limited in terms of
reproducibility if done manually (Fig. 2d). All quantitativeanalyses were carried out with BioImageXD built-in proce-dure lists, which enable setting up multi-step processing andanalysis workflows as command pipelines with full parametercontrol, without the need for programming. Utilizing multipleprocedure lists that can be run simultaneously for a large num-ber of files with the BioImageXD batch processor, opens upthe possibility for complex and high-throughput applications.
Possibilities with 3D image analysis of nSBs
As BioImageXD has been designed to operate with 2D/3Dand 4D data, all workflows presented in this paper are directly
Fig. 2 Formation kinetics of nSBs in heat shocked Hela cells. a Thekinetics shows that cells that have been heat treated for 15 min at 42 °Conly have a few HSF1 accumulations in the nucleus, whereas 30 and120 min of heat shock induces clear formation of nSBs in almost allcells. Control cells that have been cultured in 37 °C does not formnSBs, scale bar 15μm. bBothmanual and computer-based quantification
show similar heat shock induced nSBs kinetics, as there is no significant(ns) difference between the two methods. Manually analyzed cell number(n = 338), computer-based analyzed cell number (n = 357), error bars rep-resents mean ± SEM. c Size distribution in μMof nSBs in Hela cells after120 min of 42 °C heat shock, quantified from 3D datasets (n = 332)
740 E. Niemelä et al.

applicable to both 2D and 3D data. With 3D data, analyses arealso automatically always conducted in 3D, not by repeating a2D analysis for every Bslice^ of a 3D stack. In the context ofnSBs, automated quantification that could open up numerouspossibilities, as for instance accurate 3D size distributions ofnSBs, could be measured without the need of programming.Here, we demonstrate this by analyzing true 3D size distribu-tion of nSBs from 3D image datasets, acquired after 120 minof 42 °C heat-treated Hela cells. Such quantification would bevery time consuming and nearly impossible to do accuratelymanually (Fig. 2c). The result of the size distribution showsthat there is a slightly bimodal distribution, where most of thenSBs are in the size range of 1.4 μm; however, another distri-bution peak is seen in 3.2 μm size range. Interestingly theminimum nSBs size analyzed was exactly 0.373 μm andwas therefore rounded up to the 0.4 μm size class and themaximum size was around 4.0 μm, taking together these re-sults validates the already published observations of nSBs sizedistribution between 0.3 and 3 μm (Fig. 2c; Cotto et al. 1997;Morimoto 1998; Holmberg et al. 2000; Jolly et al. 2002). Suchsize distributions analysis can potentially be used to identifystress response kinetics of different treatments as the diameterand intensity of the nSBs correlates to the severity of the stresscells are subjected to (Cotto et al. 1997; Holmberg et al. 2000).While there is promising potential for the use of nSBs sizedistribution quantification, it should be noted that especiallyfrom 3D objects numerous other parameters can also be easilycalculated. For instance, our protocols would enable quickquantification of the spatial distribution of nSBs within thenucleus, and shape analysis or volumes of different objects.While such parameters may not have been indicated to haveany biological relevance in this paper, they might be worthinvestigating in the future.
Celastrol induces the formation of nuclear stressbodies
It is well studied that celastrol has the ability to induce thetranscription of heat shock proteins; however, the ability ofcelastrol to induce the nSBs formation has remained ratherelusive (Trott et al. 2008; Salminen et al. 2010). In this study,we show that celastrol had the ability induce nSBs in similarmanner as 42 °C heat shock (Figs. 2 and 3). Furthermore, wedetermined the formation kinetics of nSBs induced by increas-ing concentrations of celastrol on human cells, and the resultsshowed that 6 h of treatment with concentrations below3.55μMcelastrol did not lead to nSBs formation in Hela cells,as no high intensity accumulation of HSF1 could be visuallydistinguished (Fig. 3a). However, concentrations over5.33 μM celastrol clearly induced the formation of nSBs inHela cells, which were detectable as high intensive HSF1 dotsin the cell nuclei (Fig. 3a). The highest dose of 7.1 μM alsoshowed nSBs inside the cell nucleus; however, there were
fewer cells in those samples, indicating that there might besome toxicity and/or detachment from such a high concentra-tion of celastrol (Fig. 3a).
The quantifications show that Hela cells without any treat-ment (control) exhibit very low percentage of nSBs positivecells in both manual and computer-based quantification; whilevehicle treated (0.2% DMSO) cells exhibit around 20% nSBspositive cells in the computer-based quantification and only5% in the manual quantification (Fig. 3b, c). Based on thisobservation, there might be some artifacts in the DMSO-treated samples that the more sensitive computer-based quan-tifications give higher positive output for, as this is the onlygroup in the whole study that has a significant difference in thetwo different quantification methods (Fig. 3b, c). More impor-tantly, the quantifications of these immunofluorescence im-ages validate what is seen in Fig. 3; that concentration below3 μM celastrol does not induce formation of nSBs in Helacells (Fig. 3b, c). However, a clear increase in nSBs positiveHela cells is observed in the high dose of celastrol-treatedcells, suggesting that concentrations ranging from 5.33 to7.1 μM celastrol are capable of activating the formation ofnSBs in Hela cells (Fig. 3). The kinetics for both manuallycounted and computer-based quantifications is very similar asthere is no significant difference between the two drug-treatedgroups, strengthening the hypothesis that this computerizedworkflow-based quantification method is reliable for countingnSBs positive cells (Fig. 3b, c).
To further investigate celastrol’s ability to induce formation ofnSBs in FR-negative A549 cells (lung epithelial cells), the sameconcentrations of celastrol as in the experiments with Hela cellswas employed for 6 h. The confocal images indicate that concen-trations under 3.55 μM celastrol does not lead to formation ofnSBs in A549 cells, as no accumulation of HSF1 is detectedinside nucleus of these cells (Fig. 4a). Concentrations over5.33 μM of celastrol were necessary for induction of nSBs inA549 cells, and similarly as the Hela samples, the DMSO-treated A549 cells cause occasionally nSBs-like artifacts in someof the cells (Fig. 4). Results show that these A549 cells need ahigher concentration of celastrol for an effective induction ofnSBs formation, compared to Hela cells (Figs. 3 and 4). Boththe manual- and computer-based quantification shows that con-centrations under 3.55 μM celastrol do not induce the formationof nSBs in A549 cells (Fig. 4b, c). However, celastrol concentra-tions above 5.33 μM clearly induce nSBs formation in A549cells, proven by bothmanual- and computer-based quantification(Fig. 4b, c). On the other hand, the highest dose of celastrol(7.1 μM) did not further induce the nSBs formation comparedto 5.33μMinbothHela andA549 cells, and therefore the highestdose was excluded from further experiments, both as free-drugand drug-loaded MSNs (Figs. 3 and 4). The computer-basedquantification shows also artifacts in the DMSO-treated A549cells, detected as 15% of nSBs positive population, comparedwith the manual estimation that gives less than 5% nSBs positive
Quantitative bioimage analytics enables measurement of targeted cellular stress response induced by... 741

cells (Fig. 4c). This issue could be minimized with highercelastrol stock solution so that the final concentration of DMSOis lower in all samples or then by changing the solvent used in thestock solution to ethanol for example, as the safety of DMSOhave recently been questioned (Galvao et al. 2013). Regardlessof the mild DMSO effect, the results shows that the formation ofnSBs is caused by celastrol as the number of nSBs positive cellsare significantly higher in the highdrug concentration treated cellsthan vehicle treated in both cell lines and both quantificationmethods (Figs. 3c and 4c). The results show that both heat shockand celastrol have the ability to induce the formation of nSBs inhuman cells and that quantitative imagingworkflows can be used
as an accurate method of counting nSBs positive cells that havebeen subjected with different conditions.
Characterization of mesoporous silica nanoparticles
Mesoporous silica nanoparticles (MSNs) were chosen astargeted drug delivery system based on their already establishedability to deliver hydrophobic cargo to target cells in vitro withminimal off-target effects (Rosenholm et al. 2009; Niemelä et al.2015). In this case, folic acid conjugated, poly(ethylene imine),PEI, functionalized MSNs were synthesized and characterizedaccording to previously described methods (Rosenholm et al.
Fig. 3 Celastrol induces nSBs formation in Hela cells after 6 h treatment.a Confocal images shows that nSBs forms in Hela cells afteradministration of 3–7 μM of celastrol, lower concentration of celastrol(0.88–2.66μM) does not clearly induce nSBs formation, scale bar 15μm.b Manually counted nSBs positive Hela cells shows that concentrationsover 3.55 μM of celastrol induces significantly more nSBs positive cells
than control or DMSO. cComputer-based quantification of nSBs positiveHela cells shows that over 5 μMyields significantly higher nSBs positivecell amount than DMSO (0.2% v/v) treatment. Manually analyzed Helacells (n = 1031), computer-analyzed Hela cells (n = 1084), mean ± SEM,*P ≤ 0.05, ***P ≤ 0.001, ****P ≤ 0.0001
742 E. Niemelä et al.

2006, 2008, 2009). Particle size and morphology was deter-mined by scanning and transmission electron microscopy(SEM and TEM), revealing the porous structure of the nanopar-ticles with a diameter of 300 nm (Fig. 5a, b). The PEI andcelastrol amount (in weight % with respect to the whole particlesystem) was determined by thermogravimetrical analysis(TGA). The PEI amount was estimated to be around 20 wt%and the celastrol loading degree was deduced to be 4.1 wt%.Successful PEI functionalization was further confirmed bychange in zeta potential of MSNs from ~ 0 to + 40 mV inHEPES buffer at neutral pH, determined by dynamic light scat-tering (DLS) technique.
Cellular uptake of nanoparticles by flow cytometryand confocal microscopy
In order to investigate the cellular uptake of FA-PEI-MSNs inFR-positive Hela cells compared to FR-negative A549 cells,flow cytometry was employed. Cells were subjected to a con-centration of 1 μg/ml particles with 3 h incubation; showingthat the FR-positive Hela cells had significantly higher particleuptake than FR-negative A549 cells (Fig. 6a). To further val-idate the specific uptake of these particles in FR-positive cells,confocal microscopy was utilized, showing that these particleswere indeed internalized by Hela cells (Fig. 6b). The results
Fig. 4 Celastrol induces nSBs formation inA549 cells after 6 h treatment.a Confocal images shows that nSBs are clearly formed whenadministering 5–7 μM of celastrol to A549 cells. Lower concentrationof celastrol does not induce nSBs formation in these cells, scale bar15 μm. b Manually counted nSBs positive A549 cells shows that over5 μM of celastrol is necessary for inducing nSBs in A549 cells. c
Computer-based quantification of nSBs positive A549 cells shows thatover 5 μM celastrol yields significantly higher nSBs positive cell amountthan DMSO (0.2% v/v) treatment. Manually analyzed A549 cells (n =901), computer-analyzed A549 cells (n = 904), mean ± SEM, ****P ≤0.0001
Quantitative bioimage analytics enables measurement of targeted cellular stress response induced by... 743

demonstrate that FR-positive Hela cells and FR-negativeA549 cells work well as model systems for further studyingthe targeted induction of nSBs formation by celastrol-loadedFA-conjugated nanoparticles for validating our computerizedquantification method.
Celastrol-loaded MSNs induce targeted nSBsformation
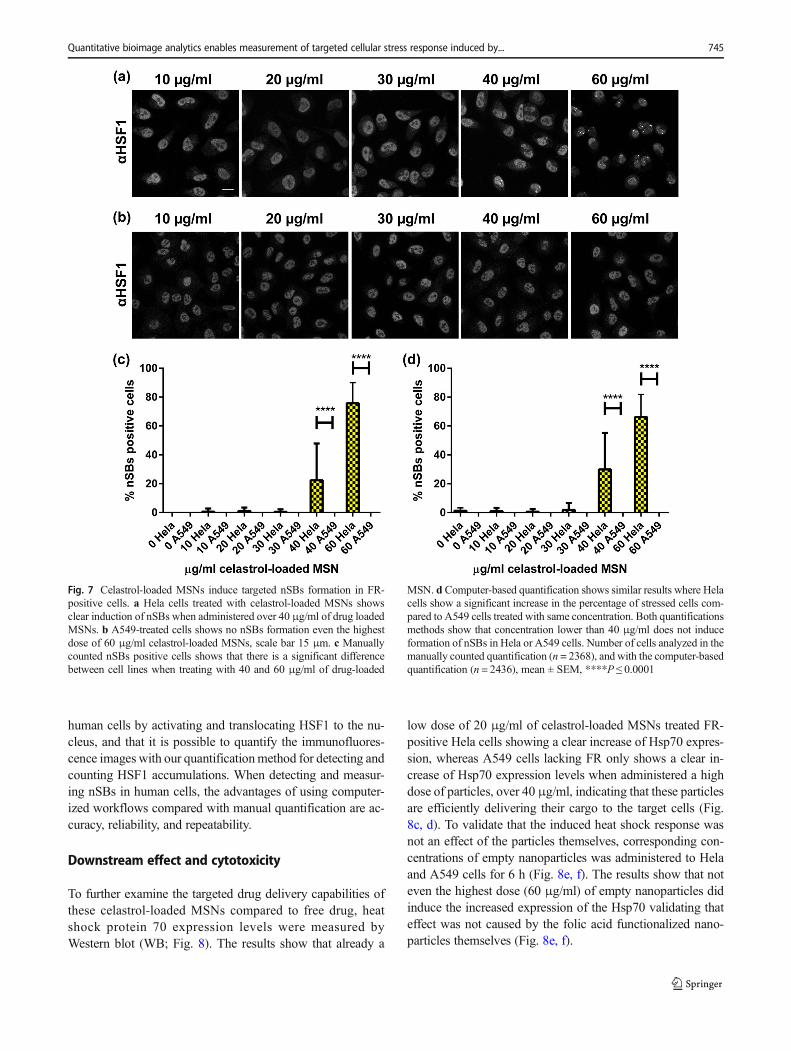
A major benefit of targeted drug delivery is that the drugconcentration in the target tissue is higher compared to theoff-target cells, giving rise to a higher efficacy with less sideeffects, which could be useful in personalized medicine(Singh and Lillard 2009; Rosenholm et al. 2009, 2010; Baeand Park 2011; Zwicke et al. 2012). To examine whether thesecelastrol-loaded nanoparticles could serve as a targeted induc-er of nuclear stress body formation in FR-positive cells, weutilized this computer-based quantification in order to evalu-ate the target selectivity towards Hela cells and the off-targeteffect on A549 cells. In comparing the percentage of nSBspositive cells after 6 h treatment of celastrol-loaded nanopar-ticles in both cell lines, a significant induction of nSBs forma-tion in Hela cells can be detected but not in A549 cells (Fig. 7).
Already at 40 μg/ml of celastrol-loaded nanoparticles (around3.55 μM celastrol), both the manual and computer-basedquantifications give a 20% nSBs positive population of Helacells (Fig. 7c, d). Hela cells treated with 60 μg/ml of celastrol-loaded MSNs (~ 5.33 μM celastrol) had over 60% nSBs pos-itive cells, while A549 cells treated even with the highest dose(60 μg/ml) of drug-loaded particles did not induce any detect-able nSBs (Fig. 7c, d). The significant differences in the per-centage of nSBs positive cells that can be observed betweenHela and A549 cells validates that cells expressing folate re-ceptors are in fact internalizing these celastrol-loaded nano-particles in higher quantities, which in turn leads to activationand relocalization of the HSF1 to the nucleus that can bedetected as nSBs.
Some minor differences between the percentages of nSBspositive cells can be detected with the different quantificationmethods, as well as variation in the total amount of cells ana-lyzed (Figs. 2, 3, 4, and 7). The most plausible reason for thisis because a human is more likely to dismiss a partial cell andmight not register a weaker HSF1 signal inside the cell nucle-us as an nSBs compared with the more sensitive computer-based quantification. Taken together, the results show thatcelastrol has the ability to induce the formation of nSBs in
Fig. 6 Cellular uptake of FA-PEI-MSNs in cells after 3 h incubation. aFlow cytometry quantification showing mean % of FITC positive Helaand A549 cells using 1 μg/ml of nanoparticles or untreated cells (control),independent experiments conducted (n ≥ 4), mean ±SEM, ****P ≤
0.0001. b Confocal microscopy images of FA-PEI-MSN endocytosis inHela cells at 10μg/ml concentrations, usingDAPI nuclear staining (blue),rhodamine-lectin plasma membrane staining (magenta) and particles con-jugated with FITC (green), scale bar 10 μm
Fig. 5 Characterization of the synthetized MSNs. a Transmissionelectron microscopy (TEM) image of the MSNs revealing the porousstructure with radially aligned mesopores, scale bar 100 nm. b
Scanning electron microscopy (SEM) showing multiple MSNs of uni-form size with a diameter of 300 nm, scale bar 200 nm
744 E. Niemelä et al.
human cells by activating and translocating HSF1 to the nu-cleus, and that it is possible to quantify the immunofluores-cence images with our quantificationmethod for detecting andcounting HSF1 accumulations. When detecting and measur-ing nSBs in human cells, the advantages of using computer-ized workflows compared with manual quantification are ac-curacy, reliability, and repeatability.
Downstream effect and cytotoxicity
To further examine the targeted drug delivery capabilities ofthese celastrol-loaded MSNs compared to free drug, heatshock protein 70 expression levels were measured byWestern blot (WB; Fig. 8). The results show that already a
low dose of 20 μg/ml of celastrol-loaded MSNs treated FR-positive Hela cells showing a clear increase of Hsp70 expres-sion, whereas A549 cells lacking FR only shows a clear in-crease of Hsp70 expression levels when administered a highdose of particles, over 40 μg/ml, indicating that these particlesare efficiently delivering their cargo to the target cells (Fig.8c, d). To validate that the induced heat shock response wasnot an effect of the particles themselves, corresponding con-centrations of empty nanoparticles was administered to Helaand A549 cells for 6 h (Fig. 8e, f). The results show that noteven the highest dose (60 μg/ml) of empty nanoparticles didinduce the increased expression of the Hsp70 validating thateffect was not caused by the folic acid functionalized nano-particles themselves (Fig. 8e, f).
Fig. 7 Celastrol-loaded MSNs induce targeted nSBs formation in FR-positive cells. a Hela cells treated with celastrol-loaded MSNs showsclear induction of nSBs when administered over 40 μg/ml of drug loadedMSNs. b A549-treated cells shows no nSBs formation even the highestdose of 60 μg/ml celastrol-loaded MSNs, scale bar 15 μm. c Manuallycounted nSBs positive cells shows that there is a significant differencebetween cell lines when treating with 40 and 60 μg/ml of drug-loaded
MSN. d Computer-based quantification shows similar results where Helacells show a significant increase in the percentage of stressed cells com-pared to A549 cells treated with same concentration. Both quantificationsmethods show that concentration lower than 40 μg/ml does not induceformation of nSBs in Hela or A549 cells. Number of cells analyzed in themanually counted quantification (n = 2368), and with the computer-basedquantification (n = 2436), mean ± SEM, ****P ≤ 0.0001
Quantitative bioimage analytics enables measurement of targeted cellular stress response induced by... 745

To confirm that the drug dosage, solvent amount, and particleconcentration as well as the time point used in this study does notinduce significant toxicity to the selected cell lines; propidiumiodide staining by flow cytometry was employed. The action offree celastrol andDMSOvehicle control was first investigated onHela andA549 cells, and then the toxicity of both empty particlesand celastrol-loaded particles was administered and measured onboth cell lines. The propidium iodide cytotoxicity assay showsthat free celastrol and DMSO only have a minor toxicity in Helacells and negligible toxicity in A549 cells after 6 h incubation(Supp. Fig. 2). Some toxicity was observed with celastrol-loadedMSN in Hela cells, due to the high uptake of these celastrol-loaded particles in Hela cells, further validating the specificityof these drug-loaded nanoparticles towards FR-positive cells.However, celastrol at higher concentrations has the ability to in-duce cell death in cancer cells through destabilizing the mitoticspindle and bydisrupting topoisomerase II function, thereby lead-ing to DNA fragmentation (Nicoletti et al. 1991; Krysko et al.2008; Jo et al. 2010; Galluzzi et al. 2012; Niemelä et al. 2015).Regardless of the toxicity of these celastrol-loaded MSN in Helacells, the apoptotic fractionwas still under 15%and should not beamajor problem in this work since the focus for this studywas toquantify the formation of nSBs, not the toxic effect of celastrol oncancer cells. Furthermore, the empty particles themselves did notshow any cytotoxicity measured by flow cytometry, detected asless than 5% apoptotic cells from the total population (Supp. Fig.2). The empty particles also did not induce the formation of nSBsin the selected cell lines, even if the highest dosage of 60 μg/mlnon-loadedMSNswas used for 6 h (Supp. Fig. 3). Taking togeth-er, the result shows that these folic acid functionalized celastrol-
loadedMSNsworks efficiently as targeted drug delivery systemstowards folate receptor positive cells with onlyminimal off-targeteffects in folate receptor negative cells.
Discussion
We have investigated the use of a tailor-made BioImageXD-based quantification method for counting and analyzing nuclearstress bodies (nSBs) in human cells, utilizing folic acid (FA)functionalized celastrol-loaded mesoporous silica nanoparticles(MSNs) for targeted induction of the heat shock response in folatereceptor (FR) positive cells. First, we validated the computerizedquantificationmethod by comparing the nSBs formation kineticsinduced by heat shock with the manually based method. Theresults showed that there is no significant difference betweenthe two methods, which demonstrates that our automated imageanalysis workflow is accurate, reliable, and versatile for detectingand quantifying nSBs in human cells. Secondly, we utilizedcelastrol, a pharmacologically active substance that has the abilityto activate the heat shock response, in order to validate the specificdrug delivery capabilities of these folic acid conjugated MSNs.Thirdly and most importantly, our BioImageXD-based quantifi-cation validates that theseMSNs indeed have the ability to deliverthe poorly soluble drug celastrol specifically toHela cells express-ing folate receptors, with only minimal off-target effect in folatereceptor negative A549 cells. This was demonstrated with a sta-tistically significant difference between the nSBpositiveHela cellpopulation and the A549 population after administration of thesecelastrol-loadedMSNs. Furthermore, the downstream effect was
Fig. 8 Celastrol-loaded MSNs induces targeted heat shock response inFR-positive cells. a Hela and b A549 cells treated with increasing con-centration (μM) of free celastrol for 6 h shows a stepwise induction ofHsp70 expression. c Hela cells treated with increasing concentration(μg/ml) of celastrol-loaded MSNs for 6 h shows an induction of Hsp70
expression in concentrations over 20 μg/ml. d A549 cells treated withcelastrol-loaded MSNs increases the expression of Hsp70 only at higherconcentrations around 40–60 μg/ml. (c and d) Both Hela and A549 cellstreated with empty MSNs does not increase the expression of Hsp70compared to untreated cells (control)
746 E. Niemelä et al.

studied byWestern blot indicating that the celastrol-loadedMSNsincreased the heat shock protein levels in Hela cells already at alow dose, and that such low concentrations did not properly in-duce the stress response in A549 cells.
Overall, this work demonstrates how robust image analysisworkflows can be developed and implemented easily in softwaresuch as BioImageXD, without the need for programming skills.We also demonstrated the benefits of computerized image anal-ysis compared to manual quantification such as size distributiondata; illustrating the usefulness and potential of the additionalinformation obtainable through analyzing 3D data, and that byutilizing batch processing function enabling even high-throughput image processing. Taken together, the results of thisstudy shows that celastrol-loaded MSNs could potentially bebeneficial for patients with protein aggregate-associated diseases,such as certain neurodegenerative conditions, by inducing a spe-cific and effective heat shock response in the target tissue. Bycombining the targeted drug delivery capabilities of these MSNswith our computerized image quantification methods for detect-ing and characterizing nSBs positive cells, such a theranosticapproach could open up possibilities for future automated diag-nostics and personalized medicine.
Acknowledgments The personnel of the Cell Imaging Core (CIC) atTurku Center for Biotechnology; especially, Jouko Sandholm, MarkkuSaari and Ketlin Adel, as well as Helena Saarento (Cell Biology, ÅboAkademi University) are thanked for technical support and advice.
Funding information Open access funding provided by Åbo AkademiUniversity (ABO). This work was financially supported by the SigridJusélius Foundation, Otto A. Malm Foundation, Swedish CulturalFoundation, Waldemar von Frenckell Foundation, K. Albin JohanssonsFoundation, Paulo Foundation, Finnish Cultural Foundation, CancerSociety of Finland, Jane and Aatos Erkko Foundation, Academy ofFinland (projects #284542, 309374), the Foundation of the ÅboAkademi University, and the Turku Doctoral Network in MolecularBiosciences.
Compliance with ethical standards
Conflict of interest The authors have no conflicts of interest to report.
Open Access This article is distributed under the terms of the CreativeCommons At t r ibut ion 4 .0 In te rna t ional License (h t tp : / /creativecommons.org/licenses/by/4.0/), which permits unrestricted use,distribution, and reproduction in any medium, provided you giveappropriate credit to the original author(s) and the source, provide a linkto the Creative Commons license, and indicate if changes were made.
References
Åkerfelt M, Morimoto RI, Sistonen L (2010) Heat shock factors: integra-tors of cell stress, development and lifespan. Nat Rev Mol Cell Biol11(8):545–555. https://doi.org/10.1038/nrm2938
Alastalo TP, HellesuoM, Sandqvist A, Hietakangas V, KallioM, SistonenL (2003) Formation of nuclear stress granules involves HSF2 and
coincides with the nucleolar localization of Hsp70. J Cell Sci 116(Pt17):3557–3570
Bae YH, Park K (2011) Targeted drug delivery to tumors: myths, realityand possibility. J Control Release 153(3):198–205. https://doi.org/10.1016/j.jconrel.2011.06.001
Baron DM, Kaushansky LJ, Ward CL, Sama RR, Chian RJ, Boggio KJ,Quaresma AJ, Nickerson JA, Bosco DA (2013) Amyotrophic lateralsclerosis-linked FUS/TLS alters stress granule assembly and dy-namics. Mol Neurodegener 8:30. https://doi.org/10.1186/1750-1326-8-30
Biamonti G, Vourc'h C (2010) Nuclear stress bodies. Cold Spring HarbPerspect Biol 2(6):a000695. https://doi.org/10.1101/cshperspect.a000695
Cardona A, Tomancak P (2012) Current challenges in open-sourcebioimage informatics. Nat Methods 9(7):661–665. https://doi.org/10.1038/nmeth.2082
Carpenter AE, Kamentsky L, Eliceiri KW (2012) A call for bioimagingsoftware usability. Nat Methods 9(7):666–670. https://doi.org/10.1038/nmeth.2073
Cotto J, Fox S, Morimoto R (1997) HSF1 granules: a novel stress-induced nuclear compartment of human cells. J Cell Sci 110(Pt23):2925–2934
Desai D, Sen KaramanD, Prabhakar N, Tadayon S, DuchanoyA, ToivolaD, Rajput S, Näreoja T, Rosenholm J (2014) Design considerationsfor mesoporous silica nanoparticulate systems in facilitating bio-medical applications. Mesoporous Biomater 1:16–43. https://doi.org/10.2478/mesbi-2014-0001
Elnakat H, Ratnam M (2004) Distribution, functionality and gene regu-lation of folate receptor isoforms: implications in targeted therapy.Adv Drug Deliv Rev 56(8):1067–1084
Galluzzi L, Vitale I, Abrams JM, Alnemri ES, Baehrecke EH,Blagosklonny MV, Dawson TM, Dawson VL, el-Deiry WS, FuldaS, Gottlieb E, Green DR, Hengartner MO, Kepp O, Knight RA,Kumar S, Lipton SA, Lu X, Madeo F, Malorni W, Mehlen P,Nuñez G, Peter ME, Piacentini M, Rubinsztein DC, Shi Y, SimonHU, Vandenabeele P, White E, Yuan J, Zhivotovsky B, Melino G,Kroemer G (2012) Molecular definitions of cell death subroutines:recommendations of the nomenclature committee on cell death2012. Cell Death Differ 19(1):107–120. https://doi.org/10.1038/cdd.2011.96
Galvao J, Davis B, Tilley M, Normando E, Duchen MR, Cordeiro MF(2013) Unexpected low-dose toxicity of the universal solventDMSO. FASEB J 28(3):1317–1330. https://doi.org/10.1096/fj.13-235440
Holmberg CI, Illman SA, Kallio M, Mikhailov A, Sistonen L (2000)Formation of nuclear HSF1 granules varies depending on stressstimuli. Cell Stress Chaperones 5(3):219–228
Jo H, Loison F, Hattori H, Silberstein LE, Yu H, Luo HR (2010) Naturalproduct celastrol destabilizes tubulin heterodimer and facilitates mi-totic cell death triggered by microtubule-targeting anti-cancer drugs.PLoS One 5(4):e10318. https://doi.org/10.1371/journal.pone.0010318
Jolly C, Konecny L, Grady DL, Kutskova YA, Cotto JJ, Morimoto RI,Vourc'h C (2002) In vivo binding of active heat shock transcriptionfactor 1 to human chromosome 9 heterochromatin during stress. JCell Biol 156(5):775–781
Kankaanpää P, Paavolainen L, Tiitta S, Karjalainen M, Päivärinne J,Nieminen J, Marjomäki V, Heino J, White DJ (2012)BioImageXD: an open, general-purpose and high-throughput im-age-processing platform. Nat Methods 9(7):683–689. https://doi.org/10.1038/nmeth.2047
KarjalainenM, Kakkonen E, Upla P, Paloranta H, Kankaanpää P, LiberaliP, Renkema GH, Hyypiä T, Heino J, Marjomäki V (2008) A raft-derived, Pak1-regulated entry participates in alpha2beta1 integrin-dependent sorting to caveosomes. Mol Biol Cell 19(7):2857–2869.https://doi.org/10.1091/mbc.E07-10-1094
Quantitative bioimage analytics enables measurement of targeted cellular stress response induced by... 747

KennedyMD, Jallad KN, Lu J, LowPS, Ben-Amotz D (2003) Evaluationof folate conjugate uptake and transport by the choroid plexus ofmice. Pharm Res 20(5):714–719
Krysko DV, Vanden Berghe T, D'Herde K, Vandenabeele P (2008)Apoptosis and necrosis: detection, discrimination and phagocytosis.Methods 44(3):205–221. https://doi.org/10.1016/j.ymeth.2007.12.001
Kularatne SA, Low PS (2010) Targeting of nanoparticles: folate receptor.Methods Mol Biol 624:249–265. https://doi.org/10.1007/978-1-60761-609-2_17
Leamon CP, Low PS (2001) Folate-mediated targeting: from diagnosticsto drug and gene delivery. Drug Discov Today 6(1):44–51
Mendillo ML, Santagata S, Koeva M, Bell GW, Hu R, Tamimi RM,Fraenkel E, Ince TA, Whitesell L, Lindquist S (2012) HSF1 drivesa transcriptional program distinct from heat shock to support highlymalignant human cancers. Cell 150(3):549–562. https://doi.org/10.1016/j.cell.2012.06.031
Morimoto RI (1998) Regulation of the heat shock transcriptional re-sponse: cross talk between a family of heat shock factors, molecularchaperones, and negative regulators. Genes Dev 12(24):3788–3796
Myers G (2012) Why bioimage informatics matters. Nat Methods 9(7):659–660
Nakajima N, Ikada Y (1995) Mechanism of amide formation bycarbodiimide for bioconjugation in aqueous media. BioconjugChem 6(1):123–130
Nicoletti I, Magliorati G, Pagliacci M, Grignani F, Riccardi C (1991) Arapid and simple method for measuring thymocyte apoptosis bypropidium iodide staining and flow cytometry. J ImmunolMethods 139:271–279
Niemelä E, Desai D, Nkizinkiko Y, Eriksson JE, Rosenholm JM (2015)Sugar-decorated mesoporous silica nanoparticles as delivery vehi-cles for the poorly soluble drug celastrol enables targeted inductionof apoptosis in cancer cells. Eur J Pharm Biopharm 96:11–21.https://doi.org/10.1016/j.ejpb.2015.07.009
Parker N, Turk MJ, Westrick E, Lewis JD, Low PS, Leamon CP (2005)Folate receptor expression in carcinomas and normal tissues deter-mined by a quantitative radioligand binding assay. Anal Biochem338(2):284–293
Pirkkala L, Nykänen P, Sistonen L (2001) Roles of the heat shock tran-scription factors in regulation of the heat shock response and be-yond. FASEB J 15(7):1118–1131
Rosenholm J, Penninkangas A, Lindén M (2006) Amino-functionalization of large-pore mesoscopically ordered silica by aone-step hyperbranching polymerization of a surface-grownpolyethyleneimine. Chem Commun (Camb) 37:3909–3911
Rosenholm J, Duchanoy A, Lindén M (2008) Hyperbranching surfacepolymerization as a tool for preferential functionalization of theouter surface of mesoporous silica. Chem Mater 20:1126–1133.https://doi.org/10.1021/cm7021328
Rosenholm JM, Meinander A, Peuhu E, Niemi R, Eriksson JE, SahlgrenC, Lindén M (2009) Targeting of porous hybrid silica nanoparticlesto cancer cells. ACS Nano 3(1):197–206. https://doi.org/10.1021/nn800781r
Rosenholm JM, Sahlgren C, Lindén M (2010) Towards multifunctional,targeted drug delivery systems using mesoporous silicananoparticles–opportunities & challenges. Nanoscale 2(10):1870–1883. https://doi.org/10.1039/c0nr00156b
Salminen A, Lehtonen M, Paimela T, Kaarniranta K (2010 Apr 9)Celastrol: molecular targets of thunder god vine. Biochem BiophysRes Commun 394(3):439–442. https://doi.org/10.1016/j.bbrc.2010.03.050
Sandqvist A, Björk JK, Akerfelt M, Chitikova Z, Grichine A, Vourc'h C,Jolly C, Salminen TA, Nymalm Y, Sistonen L (2009)Heterotrimerization of heat-shock factors 1 and 2 provides a tran-scriptional switch in response to distinct stimuli. Mol Biol Cell20(5):1340–1347. https://doi.org/10.1091/mbc.E08-08-0864
Sarge KD, Murphy SP, Morimoto RI (1993) Activation of heat shockgene transcription by heat shock factor 1 involves oligomerization,acquisition of DNA-binding activity, and nuclear localization andcan occur in the absence of stress. Mol Cell Biol 13(3):1392–1407
Singh R, Lillard JW Jr (2009) Nanoparticle-based targeted drug delivery.Exp Mol Pathol 86(3):215–223. https://doi.org/10.1016/j.yexmp.2008.12.004
Sukumaran P, Löf C, Kemppainen K, Kankaanpää P, Pulli I, Näsman J,Viitanen T, Törnquist K (2012) Canonical transient receptor poten-tial channel 2 (TRPC2) as a major regulator of calcium homeostasisin rat thyroid FRTL-5 cells: importance of protein kinase C δ(PKCδ) and stromal interaction molecule 2 (STIM2). J Biol Chem287(53):44345–44360. https://doi.org/10.1074/jbc.M112.374348
Trott A, West JD, Klaić L,Westerheide SD, Silverman RB, Morimoto RI,Morano KA (2008) Activation of heat shock and antioxidant re-sponses by the natural product celastrol: transcriptional signaturesof a thiol-targeted molecule. Mol Biol Cell 19(3):1104–1112. https://doi.org/10.1091/mbc.E07-10-1004
Upla P, Marjomäki V, Kankaanpää P, Ivaska J, Hyypiä T, Van Der GootFG, Heino J (2004) Clustering induces a lateral redistribution ofalpha 2 beta 1 integrin from membrane rafts to caveolae and subse-quent protein kinase C-dependent internalization. Mol Biol Cell15(2):625–636
Vihervaara A, Sergelius C, Vasara J, BlomMA, ElsingAN, Roos-MattjusP, Sistonen L (2013) Transcriptional response to stress in the dynam-ic chromatin environment of cycling and mitotic cells. Proc NatlAcad Sci U S A 110(36):E3388–E3397. https://doi.org/10.1073/pnas.1305275110
Westerheide SD, Bosman JD, Mbadugha BN, Kawahara TL, MatsumotoG, Kim S, Gu W, Devlin JP, Silverman RB, Morimoto RI (2004)Celastrols as inducers of the heat shock response and cytoprotection.J Biol Chem 279(53):56053–56060
Westerheide SD, Anckar J, Stevens SM Jr, Sistonen L, Morimoto RI(2009) Stress-inducible regulation of heat shock factor 1 by thedeacetylase SIRT1. Science 323(5917):1063–1066. https://doi.org/10.1126/science.1165946
Zwicke GL, Mansoori GA, Jeffery CJ (2012) Utilizing the folate receptorfor active targeting of cancer nanotherapeutics. Nano Rev 3. https://doi.org/10.3402/nano.v3i0.18496
Publisher’s note Springer Nature remains neutral with regard tojurisdictional claims in published maps and institutional affiliations.
748 E. Niemelä et al.