primer selection enables quantitative, ultra-high - applied and
TRANSCRIPT

Improved Selection of Internal Transcribed Spacer-Specific PrimersEnables Quantitative, Ultra-High-Throughput Profiling of FungalCommunities
Nicholas A. Bokulich, David A. Mills
Department of Viticulture and Enology, Department of Food Science and Technology, and Foods for Health Institute, University of California, Davis, California, USA
Ultra-high-throughput sequencing (HTS) of fungal communities has been restricted by short read lengths and primer amplifica-tion bias, slowing the adoption of newer sequencing technologies to fungal community profiling. To address these issues, weevaluated the performance of several common internal transcribed spacer (ITS) primers and designed a novel primer set andwork flow for simultaneous quantification and species-level interrogation of fungal consortia. Primer comparison and valida-tion were predicted in silico and by sequencing a “mock community” of mixed yeast species to explore the challenges of ampli-con length and amplification bias for reconstructing defined yeast community structures. The amplicon size and distribution ofthis primer set are smaller than for all preexisting ITS primer sets, maximizing sequencing coverage of hypervariable ITS do-mains by very-short-amplicon, high-throughput sequencing platforms. This feature also enables the optional integration ofquantitative PCR (qPCR) directly into the HTS preparatory work flow by substituting qPCR with these primers for standardPCR, yielding quantification of individual community members. The complete work flow described here, utilizing any of thequalified primer sets evaluated, can rapidly profile mixed fungal communities and capably reconstructed well-characterized beerand wine fermentation fungal communities.
Fungi comprise a critical component of most food and beveragefermentation systems, including beer (1), wine (2), and cheese
(3). High-throughput, “next-generation” sequencing (HTS) toolshave recently emerged, enabling sensitive profiling of microbialcommunities on an unprecedented scale by massively parallel se-quencing of short (100- to 600-bp) DNA fragments amplified byPCR. The large number of sequences delivered by a single HTS run(104 to 108 reads) allows more sensitive description of diversemicrobial communities and greater multiplexing, admittinggreater per-run sequencing capacity. Pyrosequencing (4) has beenused most frequently to study fungal communities of foods (5),the human gut (6), and soils (7), as 454 Life Sciences pyrosequenc-ing platforms yield longer sequences (400 to 600 bp), which arepresumably necessary for accurate identification of fungi. How-ever, the greater sequencing coverage of Illumina sequencing plat-forms (�108 reads/lane on the HiSeq2000) compared to pyrose-quencing (�106 reads/run) enables multiplexing of more samplesper run and a magnitudes-lower cost per sample, popularizingthese platforms for analysis of bacterial communities. No studiesto date have utilized the superior coverage of Illumina sequencingplatforms to analyze fungal communities, presumably because theshorter read length may compromise taxonomic resolution. How-ever, the level of taxonomic discrimination of fungi achievableusing such short amplicons must be established to confirm theirutility for ultra-high-throughput diversity analysis of fungal com-munities.
Primer choice and taxonomic classification (8, 9) have beenextensively described for HTS of bacterial communities, butthese aspects have not been well established for fungi. Ampli-fication bias exhibited by PCR primers toward different groupsof fungi is a well-known phenomenon, including with short-amplicon sequences (10). The impact of different computa-tional methods on taxonomic assignment of HTS reads has alsobeen described previously (11). The influence of primer choice
on accurate taxonomic assignment of very short HTS reads(e.g., those produced on Illumina platforms) has been testedfor fungal large-subunit (LSU) ribosomal DNA (rDNA) (12)but has not been fully established for the internal transcribedspacer (ITS) region, the official fungal “barcode of life” (13).Optimal primer selection for short-amplicon HTS applicationsrelies on several criteria: high coverage, taxonomic resolution,and accuracy and short amplicon length (14). The last concernis particularly important with very-short-amplicon HTS plat-forms (Illumina and Ion Torrent), to choose a DNA targetyielding maximal taxonomic heterogeneity within a very shortfragment (�250 bp). In response to this, Ihrmark and cowork-ers (15) designed and compared several new primer sets target-ing the ITS2 locus (see Fig. S1 in the supplemental material) tothe commonly used ITS1/ITS4 primer pair by pyrosequencingof artificial mixed fungal communities, demonstrating morereliable community reconstruction with the shorter ITS2 locusamplicons amplified by their primers. Toju et al. (16) also de-signed and evaluated the taxonomic coverage of novel ITSprimers in silico. However, none of these authors evaluated theaccurate taxonomic resolution of ITS primers for short-ampli-con HTS.
To confirm the usability of very-short-amplicon HTS reads forultra-high-throughput analysis of fungal communities, we evalu-
Received 1 January 2013 Accepted 30 January 2013
Published ahead of print 1 February 2013
Address correspondence to David A. Mills, [email protected].
Supplemental material for this article may be found at http://dx.doi.org/10.1128/AEM.03870-12.
Copyright © 2013, American Society for Microbiology. All Rights Reserved.
doi:10.1128/AEM.03870-12
April 2013 Volume 79 Number 8 Applied and Environmental Microbiology p. 2519–2526 aem.asm.org 2519
Dow
nloa
ded
from
http
s://j
ourn
als.
asm
.org
/jour
nal/a
em o
n 14
Jan
uary
202
2 by
82.
55.2
.39.

ated the amplification frequency, amplicon length, taxonomiccoverage, and taxonomic assignment accuracy of artificial se-quence reads in silico and tested the effect of commonly used ITSprimers on accurate taxonomic assignment of a defined yeastmock community. We developed a new ITS primer set deliveringhigh coverage and accurate taxonomic assignment of very short(150- to 250-bp) fungal amplicons and a work flow integratingpaired quantitative PCR (qPCR)-HTS, enabling simultaneousquantification and characterization of complex fungal communi-ties. The results demonstrate the utility of several ITS primer setsfor short-amplicon HTS—particularly those targeting the ITS1locus—as many exhibit high coverage and taxonomic classifica-tion accuracy. However, all primers tested failed to accurately pro-file the mock community, underlining the dangers of amplifica-tion and sequencing bias faced with HTS of ITS amplicons.
MATERIALS AND METHODSReference sequence database. A modified reference sequence databasewas constructed from the public UNITE fungal ITS database (24 Septem-ber 2012 release; http://unite.ut.ee/) (17, 18). Sequences were removedthat contained the taxonomy terms “unidentified,” “compost,” “fungalsp.,” “endophyte,” “isolate,” “enrichment,” “fungus,” “soil,” “glacial,”“leaf,” “mycorrhizal,” “mycorrhizae,” “ectomycorrhiza,” “clone,” “cul-ture,” “Antarctic,” “sterile,” “symbiont,” and “cf” or the incomplete tax-onomic hierarchies “mycota sp.,” “mycote sp.,” “mycete sp.,” “mycetessp.,” “ales sp.,” “aceae sp.,” “idea sp.,” and “mycotina sp.” This was per-
formed to remove sequences with incomplete or absent taxonomies, aswell as environmental samples, which can hinder useful taxonomic clas-sification when used as reference sequences, particularly for primer eval-uation. Sequences containing strings of ambiguous characters of �5 nu-cleotides (nt) were also removed. A taxonomy training file, exactly sixlevels deep (root, subphylum, order, family, genus, and species), was gen-erated from the corresponding taxonomy strings (located in the sequencelocus tags provided by UNITE) to be compatible with implementation inthe HTS analysis pipeline QIIME (19). Both files were hand checked foraccuracy and consistency. The database contains 158,874 sequences cov-ering all fungal lineages, and taxonomic composition to the genus level isdetailed in the supplemental material. Only publicly available sequencesfrom the UNITE database were used in our reference database, and theycan be replicated by following the filtering criteria defined above.
Primer design and analysis. A list of primers used in this study ispresented in Table 1. These primers were selected for analysis as the mostcommonly used ITS primer sets, as well as several recently publishedprimers. In addition, they were chosen to represent primer pairs targetingthe small-subunit (SSU) rDNA, 5.8S rDNA, and LSU rDNA flanks of theITS, in order to evaluate primers across the entire ITS. Figure S1 in thesupplemental material presents the orientation of these primer sets rela-tive to the fungal ITS region. The BITS2F/B58S3 primer set was designedbased on an alignment of representative ITS sequences from the UNITEITS reference database clustered at 90% similarity, using the de novoprimer design function of Primer Prospector (20) (http://pprospector.sourceforge.net/). Primer specificity, amplicon size distribution, and tax-onomic coverage were predicted using the primer analysis modules of
TABLE 1 Mean frequency of primer homology to UNITE database ITS sequences
rDNA Primer Sequence (5=¡3=) Referencea
Non-3=mismatch 3= mismatch 3= gaps
Non-3=gaps
Weightedscoreb
SSU BITS ACCTGCGGARGGATCA 2.511 0.886 0.028 0.008 2.642ITS1 TCCGTAGGTGAACCTGCGG 24 3.940 1.153 0.055 0.003 3.431ITS5 GGAAGTAAAAGTCGTAACAAGG 24 6.458 1.038 0.053 0.000 4.173ITS1-F_KYO2 TAGAGGAAGTAAAAGTCGTAA 16 6.111 1.448 0.027 0.002 4.238ITS1-F_KYO1 CTHGGTCATTTAGAGGAASTAA 16 6.353 1.508 0.138 0.003 5.340NSI1 GATTGAATGGCTTAGTGAGG 23 6.108 1.498 0.056 0.001 5.565ITS1F CTTGGTCATTTAGAGGAAGTAA 22 6.858 1.598 0.108 0.005 5.910NSA3 AAACTCTGTCGTGCTGGGGATA 23 7.225 1.519 0.111 0.005 6.077
5.8S Reverse ITS2_KYO1 CTRYGTTCTTCATCGDT 16 0.429 0.132 0.013 0.000 0.425ITS2_KYO2 TTYRCTRCGTTCTTCATC 16 0.438 0.146 0.010 0.001 0.492B58S3 GAGATCCRTTGYTRAAAGTT 0.533 0.165 0.012 0.000 0.53458A2 CTGCGTTCTTCATCGAT 23 0.495 0.187 0.011 0.001 0.545ITS2 GCTGCGTTCTTCATCGATGC 24 0.644 0.195 0.027 0.001 0.704
5.8S Forward ITS3_KYO2 GATGAAGAACGYAGYRAA 16 0.502 0.109 0.011 0.000 0.399gITS7 GTGAATCATCGARTCTTTG 15 0.506 0.135 0.014 0.000 0.461ITS3_KYO1 AHCGATGAAGAACRYAG 16 0.402 0.142 0.012 0.001 0.478fITS7 GAACACAGCGAAATGTGA 15 0.575 0.135 0.016 0.000 0.49758A2 ATCGATGAAGAACGCAG 23 0.502 0.185 0.012 0.001 0.53158A1 GCATCGATGAAGAACGC 23 0.514 0.191 0.010 0.001 0.569ITS3 GCATCGATGAAGAACGCAGC 24 0.667 0.198 0.027 0.001 0.640fITS9 GAACACAGCGAAATGTGA 15 1.629 1.085 0.016 0.001 1.901
LSU ITS4_KYO1 TCCTCCGCTTWTTGWTWTGC 16 4.274 1.107 0.039 0.002 3.846ITS4 TCCTCCGCTTATTGATATGC 24 4.489 1.480 0.057 0.004 4.070ITS4_KYO2 RBTTTCTTTTCCTCCGCT 16 4.181 1.351 0.015 0.001 4.253ITS4_KYO3 CTBTTVCCKCTTCACTCG 16 3.804 1.446 0.016 0.002 4.703NLB4 GGATTCTCACCCTCTATGAC 23 6.410 0.819 0.025 0.002 5.228ITS4B CAGGAGACTTGTACACGGTCCAG 22 7.528 1.694 0.127 0.005 6.198
a In cases where no reference is listed, this study is meant.b Weighted score � (non-3= mismatches � 0.4) � 3= mismatches � non-3= gaps � (3= gaps � 3.0) � (final 3= base mismatch � 3.0).
Bokulich and Mills
2520 aem.asm.org Applied and Environmental Microbiology
Dow
nloa
ded
from
http
s://j
ourn
als.
asm
.org
/jour
nal/a
em o
n 14
Jan
uary
202
2 by
82.
55.2
.39.

Primer Prospector (default settings), checking against a representativesubset of the UNITE ITS reference database clustered at 97% identity.Taxonomic accuracy of in silico PCR hits from the UNITE database wasevaluated by trimming each individual hit to 150 bp or 250 bp, assigningtaxonomy using BLAST against the UNITE reference database, and thencomparing the accuracy of each assignment lineage at each taxonomiclevel from class to species. Primer Prospector was also used to generatelinker sequences without homology to fungal sequences at the 5= terminusof the primer binding site (limiting primer bias), check for bar code andprimer secondary structure (eliminating bar codes with a �G of ��5kcal/mol), and optimize degenerate primer bases, using the appropriateprogram modules. The resulting primer set designed for this study isdelineated in Table S1 in the supplemental material.
HTS work flow. Samples of beer (1) and wine (2) were collected andprepared as described previously. Samples were amplified using the BITS/B58S3 primer set. Each forward primer contained a unique 8-nt bar codeto enable sample multiplexing. A list of the bar codes used is presented inTable S1 in the supplemental material. PCR mixtures contained 5 to 100ng of DNA template, 1� GoTaq Green master mix (Promega, Madison,WI), 1 mM MgCl2, and 5 pmol of each primer. Reaction conditions con-sisted of an initial 95°C for 2 min, followed by 35 cycles of 95°C for 30 s,55°C for 30 s, and 72°C for 60 s, and a final extension of 72°C for 5 min.This PCR may be replaced with qPCR (see below) to achieve simultaneouscommunity quantification. All samples were amplified in triplicate andcombined prior to purification. Amplicons were mixed at roughly equiv-alent ratios based on electrophoretic band intensity and purified using aQiaquick purification kit (Qiagen, Valencia, CA). Pooled samples weresubmitted to the University of California Berkeley Vincent Coates Ge-nome Sequencing Laboratory for library preparation using the Illuminapaired-end kit, cluster generation, and 150-bp paired-end sequencing onan Illumina HiSeq2000. Image analysis, base calling, and error estimationwere performed using CASAVA 1.8.
In order to directly compare the short-sequence accuracies of theprimer sets, a “mock community” was generated, consisting of DNA fromeight yeast species deliberately combined at known ratios. These yeastswere grown and extracted as described in a previous report (2). rRNAoperon copy number was enumerated by quantitative PCR as previouslydescribed (21) and DNA combined at known rRNA operon copy numberratios. Mock communities were amplified by five different 8-nt-bar-coded primer sets (BITS/B58S3, ITS1/ITS4, NSI1/58A2, ITS1F/ITS4, and58A2/NLB4) using the thermal cycler programs previously described foreach (22–24) and the reaction mixture listed above. Amplicons were pre-pared as described above and submitted to the University of CaliforniaDavis Genome Center DNA technologies core for paired-end librarypreparation, cluster generation, and 250-bp paired-end sequencing on anIllumina MiSeq system. Image analysis, base calling, and error estimationwere performed using CASAVA 1.8.
Data analysis. Raw Illumina fastq files were demultiplexed, qualityfiltered, and analyzed using QIIME 1.5.0 (19). The 150-bp reads weretruncated at any site of more than three sequential bases receiving a qual-ity score of �Q20, and any read containing ambiguous base calls or barcode or primer errors were discarded, as were reads with �75% (of totalread length) consecutive high-quality base calls (25). Primer sequenceswere trimmed from the ends of each sequence, and operational taxonomicunits (OTUs) were assigned using the QIIME implementation ofUCLUST (26), with a threshold of 97% pairwise identity. OTUs wereclassified taxonomically using a QIIME-based wrapper of BLAST (27)against the UNITE (17) database. Unassigned sequences (consisting ofplant-associated sequences in the food samples) and any OTU comprisingless than 0.001% of total sequences for each run were removed prior tofurther analysis, calibrating against a known mock community sample ineach run (25). QIIME was used to calculate abundance-weighted Jaccarddistance and binary Bray-Curtis dissimilarity between samples and toconstruct principal coordinate plots (PCoA).
Quantitative PCR. To concurrently enumerate total fungal popula-tions, qPCR may optionally replace classical PCR for amplicon generationin the work flow presented above. qPCR was performed in 20-�l reactionmixtures containing 2 �l of DNA template, 5 pmol of each respectiveprimer, and 10 �l of TaKaRa SYBR 2� Perfect Real Time master mix(TaKaRa Bio Inc.). Reaction conditions involved an initial step at 95°C for10 min, followed by 40 cycles of 30 s at 95°C, 30 s at 55°C, and 60 s at 72°C.Cell concentration was calculated by comparing sample threshold values(CT) to a standard curve of serially diluted genomic DNA extracted froma known concentration of Saccharomyces cerevisiae UCD522. All reactionswere performed in triplicate in optical-grade 96-well plates on an ABIPrism 7500 Fast Real-Time PCR system (Applied Biosystems). The instru-ment automatically calculated cycle threshold (CT), efficiency (E), andconfidence intervals. When integrated into the complete qPCR-HTSpipeline, amplicons generated by qPCR were pooled with other ampli-cons, purified, and processed as described above.
TRFLP. As a comparison of HTS to a previously established methodfor profiling food fermentations, terminal restriction fragment lengthpolymorphism (TRFLP) of beer (1) and wine (2) samples was performedas described for previous studies utilizing these samples. Briefly, PCRamplification was performed in triplicate with primers ITS1HEX (5=-[5HEX]TCCGTAGGTGAACCTGCGG-3=) and ITS4 (5=-TCCTCCGCTTATTGATATGC-3=) (24); purified using a QIAquick PCR purificationkit (Qiagen, Valencia, CA); digested using the restriction enzymes HaeIII,DdeI, and HinfI; and submitted to the UC Davis Sequencing Core for ABI3100 capillary electrophoresis fragment analysis. Taxonomic assignmentsof TRFLP peaks were made against an empirical ITS-TRFLP database (2).HaeIII profiles were used to construct plots and calculate distance matri-ces (as described for HTS data analysis above).
RESULTSPrimer analysis. Amplification bias is a well-known phenomenonin fungal ITS primer sets (10), but only a few efforts (15, 16) havebeen made to design alternative primers with enhanced coverage,and no effort has been made to comprehensively evaluate the cov-erage, taxonomic resolution, and accuracy of existing ITS primersfor very-short-amplicon HTS read lengths (�250 bp). We de-signed an alternative ITS primer set based on a multiple alignmentof the UNITE database and computationally predicted its cover-age of known fungal sequences in comparison with previouslyestablished ITS primers. To ascertain the usefulness of eachprimer for describing fungal communities, all primers were bioin-formatically analyzed to assess overall taxonomic coverage of allfungal clades contained in the reference database. First, all primerslisted in Table 1 were tested for overall database matches using thePrimer Prospector “analyze primers” module (20). The weightedscore calculated by this module is based on alignment againstreference database sequences to predict overall coverage. AmongITS primers binding in the SSU rDNA, BITS exhibited the lowestweighted score, indicating increased coverage and diminished tax-onomic bias through a lower mean count of gaps and mismatchesacross all species in the sequence database, but several other prim-ers also scored very well, including ITS1 and ITS5 (Table 1).Among primers targeting the 5.8S rDNA, most primers had verylow weighted scores, with ITS2_KYO1, ITS2_KYO2, and B58S3 asthe lowest-scoring reverse primers. Among primers targeting theLSU rDNA, ITS4_KYO1 and ITS4 displayed the lowest weightedscores. Several primers exhibited very low database hits (as highweighted scores) and were eliminated from further testing.
Next, we used the taxonomic coverage module of Primer Pros-pector to predict the coverage of all fungal clades in both referencedatabases for each primer. Figure 1 presents the taxonomic cov-
High-Throughput Fungal Sequencing Primer Evaluation
April 2013 Volume 79 Number 8 aem.asm.org 2521
Dow
nloa
ded
from
http
s://j
ourn
als.
asm
.org
/jour
nal/a
em o
n 14
Jan
uary
202
2 by
82.
55.2
.39.

erage predicted for all fungal subphyla in the UNITE referencedatabase, indicating very good coverage (�60% relative coverageof most subphyla) by most primers matching the 5.8S rDNA (withthe exception of fITS9). Agaricomycotina, Pezizomycotina, and Us-tilaginomycotina exhibit the highest coverage (80%) by the 5.8Sprimers (except fITS9 and ITS2), and primers B58S3, 58A2,ITS2_KYO1, and ITS3_KYO1 score highest among all 5.8S prim-ers for all subphyla. In the SSU rDNA, BITS and ITS1 demonstratehighest relative coverage (19.1 to 63.3%) of all subphyla comparedto other primers in the same binding region, but all primers dis-play low relative coverage (2.9 to 19.1%) of Taphrinomycotina,suggesting potential amplification bias against this clade. In theLSU rDNA, ITS4 and ITS4_KYO1 showed the highest coverage(22 to 47%) for all subphyla, particularly the Pucciniomycotina(47% coverage). No hits were predicted for any primers for bac-terial SSU/LSU sequences (data not shown), ensuring specificityfor Eukarya. The complete results, presenting relative taxonomiccoverage of all sequences at each hierarchical level from subphy-lum to genus, are provided in the supplemental material.
To assess the taxonomic usefulness of HTS reads from eachprimer, the classification accuracy of all primer hits predictedagainst the UNITE database was evaluated at each taxonomiclevel. Artificial 150-bp and 250-bp amplicons were generated fromthe primer hits predicted by Primer Prospector and taxonomicallyclassified using BLAST against the UNITE reference database. Thetop BLAST hits were compared to the actual taxonomic lineage ofeach sequence at each taxonomic level. Net accuracy for the prim-ers against all fungi is presented in Fig. 2, and that for all fungalclasses is presented in Fig. S2 in the supplemental material. Allprimer pairs evaluated exhibited genus-level accuracies of 90%(95% for ITS1 primers) for 150-bp reads and 95% for 250-bpreads. Primer pairs targeting the ITS1 locus exhibited species-levelaccuracy of 90% with both fragment sizes, but those targeting
the ITS2 had much lower species-level accuracy (70 to 85%) with150-bp reads, though this recovered to �90 to 95% with 250-bpreads (Fig. 2). The same trends could be observed when categoriz-ing assignment accuracy by individual taxonomic classes (see Fig.S2 in the supplemental material). In general, ITS1 locus primerpairs displayed greater accuracy for most classes at the species andgenus levels than did the equivalent read length of ITS2 ampli-cons, with the exception of NSI1/58A2. Species-level classificationof Basidiomycota performed more reliably than those of Ascomy-cota and non-Dikarya, in general, by a narrow margin (see Fig. S2).The primer pairs 58A1/NLB4 and 58A2/NLB4 performed poorly,with �70% accurate classification of Dothidiomycetes, Sordario-mycetes, and Glomeromycetes from 150-bp reads. These resultsdemonstrate that ITS1 HTS sequences achieve a high species- andgenus-level assignment success rate using BLAST for taxonomicclassification of most fungal groups.
Amplicon length unevenness can promote preferential ampli-fication of shorter sequences (10), and shorter amplicons are pref-erential for maximizing read coverage of ultravariable DNA lociby the short read lengths employed by Illumina platforms. Shortamplicon length is also crucial for efficient quantification withqPCR (28). Thus, amplicon lengths were predicted for all databasematches for each primer to determine which primer sets wouldyield the shortest and most even amplicons. In general, whole-ITSand ITS1 subdomain amplicons displayed a greater distributionrange of amplicon lengths than ITS2, but ITS1 amplicons weresubstantially shorter than ITS2 or whole-ITS amplicons (Table 2).This coincides with the findings of Bellemain and coworkers (10),who concluded that ITS1 was a preferential target for HTS efforts,as the shorter amplicon length and distribution would minimizepreferential amplification of Ascomycota, which they found tocontain systematically shorter ITS2 and whole-ITS regions thanBasidiomycota. Amplicons were routinely longer for Basidiomy-
FIG 1 Predicted subphylum coverage of UNITE database ITS sequences by primers located in terminal SSU (A), 5.8S (B), and terminal LSU (C) loci of the rRNAoperon. Abbreviations for subphyla: Agar., Agaricomycotina; Ent., Entomophthoromycotina; In., incertae sedis; Kick., Kickxellomycotina; Muc., Mucoromycotina;Pezz., Pezizomycotina; Pucc., Pucciniomycotina; Sacc., Saccharomycotina; Taph., Taphrinomycotina; Ust., Ustilaginomycotina.
Bokulich and Mills
2522 aem.asm.org Applied and Environmental Microbiology
Dow
nloa
ded
from
http
s://j
ourn
als.
asm
.org
/jour
nal/a
em o
n 14
Jan
uary
202
2 by
82.
55.2
.39.

cota than Ascomycota by 15 to 40 bp (ITS1 locus) and 30 to 50 bp(ITS2 locus). The shortest mean amplicon lengths were yielded bythe BITS/B58S3 primer pair designed for this study, with a meanlength of 183.6 (46.8) bp, suggesting that most of these ampli-cons would be fully covered by current short sequencing reads.This primer pair is located at the 5= terminus of the SSU rDNA,maximizing the amount of hypervariable ITS target sequence cov-ered by a short sequencing read. Additionally, the amplicon isshort enough to be efficiently amplified and quantified by qPCR,unlike the longer amplicons generated by other ITS primers, en-abling qPCR quantification of the target.
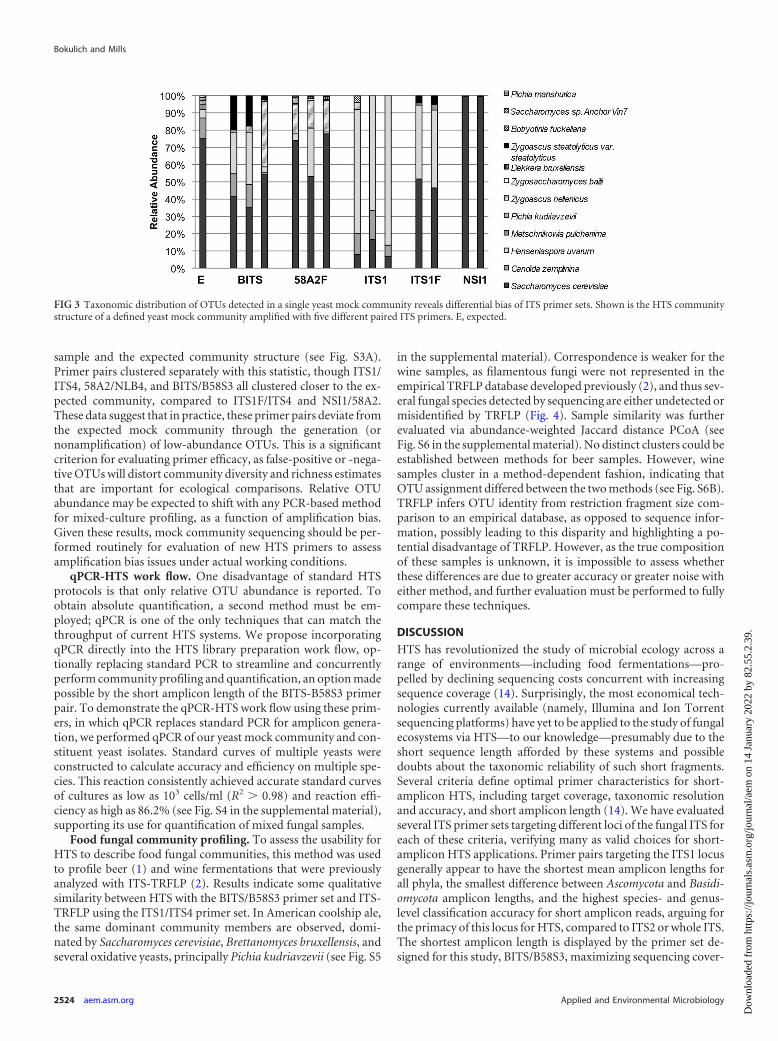
Mock community testing. Computational analysis of primercoverage and specificity cannot adequately predict behavior undermixed biological conditions, so we tested the accuracy of theseprimers profiling a defined yeast community in a single 250-bpMiSeq run. Several highly scoring primer pairs were selected (rep-resenting ITS1, ITS2, and whole ITS) to directly compare theirefficacies at reconstructing the taxonomic distribution of a known
mock community comprising eight yeast strains mixed at knownrRNA operon copy number ratios. No primer pair could recon-struct the known taxonomic distribution of this mock communitywith perfect accuracy (Fig. 3; see also Table S2 in the supplementalmaterial), whether due to primer bias/mismatch, amplicon lengthbias, or computational bias (e.g., clustering of similar species as asingle OTU), but most adequately profiled the dominant commu-nity members. To evaluate the accuracy of dominant-membermock community reconstruction by each primer pair, abun-dance-weighted Jaccard distance was calculated between eachsample and used to construct principal coordinate plots (PCoA)to visualize the relationship to the expected community structure(see Fig. S3A in the supplemental material). 58A2/NLB4, BITS/B58S3, and ITS1F/ITS4 clustered close together with the expectedcommunity, indicating that these primer pairs are most effectiveat detecting the most dominant community members. To evalu-ate the accuracy of unweighted community profiling, a binaryBray-Curtis dissimilarity PCoA was also calculated between each
FIG 2 Average predicted taxonomic classification accuracy of selected primer sets against UNITE database sequences across all phyla. Predicted primer hitsagainst database were trimmed to 150 bp (A) or 250 bp (B) and classified using BLAST. Accuracy represents the fraction of scores matching the correct taxon ateach taxonomic level. Primer sets represent intended pairs targeting the ITS1 or ITS2.
TABLE 2 Amplicon length distribution of primer hits categorized by ITS locus
ITS locus Forward primer Reverse primer
Amplicon length distribution (mean SD)
Ascomycota Basidiomycota Non-Dikaryaa
ITS1 BITS B58S3 183.6 46.8 219.8 56.9 215.0 95.9ITS1 ITS2 218.1 54.4 253.3 60.0 201.0 71.8NSI1 58A2 357.2 128.9 386.5 105.7 269.1 24.1ITS1F_KYO1 ITS2_KYO1 275.3 103.2 285.3 50.1 200.3 54.2ITS1F_KYO2 ITS2_KYO2 270.6 90.5 284.5 42.1 216.4 94.4
ITS2 58A1 NLB4 478.8 23.9 528.1 30.358A2 NLB4 476.8 23.9 525.9 30.4ITS3F_KYO1 ITS4_KYO1 310.5 29.9 362.2 35.3 376.0 57.4fITS7f ITS4 258.5 27.3 309.8 35.6 312.7 47.2gITS7f ITS4 259.9 22.5 307.6 34.7 312.9 47.4fITS9f ITS4 324.4 11.7 354.6 32.9
Whole ITS BITS ITS4 535.8 81.8 618.0 72.6 573.0 132.4ITS1 ITS4 547.2 93.0 624.8 79.7 582.4 132.0NSI1 NLB4 1,066.6 313.9 927.3 182.6ITS1F_KYO1 ITS4_KYO1 612.4 131.1 664.9 57.8 589.8 155.6
a Missing values are due to noncoverage of non-Dikarya by that primer.
High-Throughput Fungal Sequencing Primer Evaluation
April 2013 Volume 79 Number 8 aem.asm.org 2523
Dow
nloa
ded
from
http
s://j
ourn
als.
asm
.org
/jour
nal/a
em o
n 14
Jan
uary
202
2 by
82.
55.2
.39.
sample and the expected community structure (see Fig. S3A).Primer pairs clustered separately with this statistic, though ITS1/ITS4, 58A2/NLB4, and BITS/B58S3 all clustered closer to the ex-pected community, compared to ITS1F/ITS4 and NSI1/58A2.These data suggest that in practice, these primer pairs deviate fromthe expected mock community through the generation (ornonamplification) of low-abundance OTUs. This is a significantcriterion for evaluating primer efficacy, as false-positive or -nega-tive OTUs will distort community diversity and richness estimatesthat are important for ecological comparisons. Relative OTUabundance may be expected to shift with any PCR-based methodfor mixed-culture profiling, as a function of amplification bias.Given these results, mock community sequencing should be per-formed routinely for evaluation of new HTS primers to assessamplification bias issues under actual working conditions.
qPCR-HTS work flow. One disadvantage of standard HTSprotocols is that only relative OTU abundance is reported. Toobtain absolute quantification, a second method must be em-ployed; qPCR is one of the only techniques that can match thethroughput of current HTS systems. We propose incorporatingqPCR directly into the HTS library preparation work flow, op-tionally replacing standard PCR to streamline and concurrentlyperform community profiling and quantification, an option madepossible by the short amplicon length of the BITS-B58S3 primerpair. To demonstrate the qPCR-HTS work flow using these prim-ers, in which qPCR replaces standard PCR for amplicon genera-tion, we performed qPCR of our yeast mock community and con-stituent yeast isolates. Standard curves of multiple yeasts wereconstructed to calculate accuracy and efficiency on multiple spe-cies. This reaction consistently achieved accurate standard curvesof cultures as low as 103 cells/ml (R2 0.98) and reaction effi-ciency as high as 86.2% (see Fig. S4 in the supplemental material),supporting its use for quantification of mixed fungal samples.
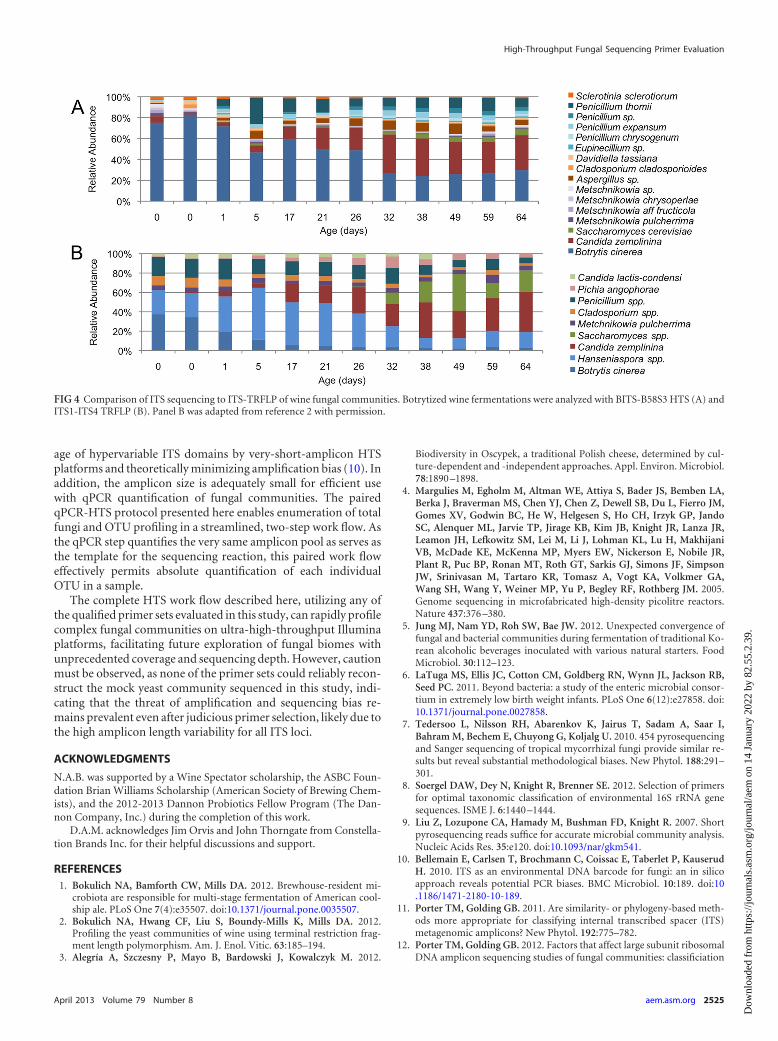
Food fungal community profiling. To assess the usability forHTS to describe food fungal communities, this method was usedto profile beer (1) and wine fermentations that were previouslyanalyzed with ITS-TRFLP (2). Results indicate some qualitativesimilarity between HTS with the BITS/B58S3 primer set and ITS-TRFLP using the ITS1/ITS4 primer set. In American coolship ale,the same dominant community members are observed, domi-nated by Saccharomyces cerevisiae, Brettanomyces bruxellensis, andseveral oxidative yeasts, principally Pichia kudriavzevii (see Fig. S5
in the supplemental material). Correspondence is weaker for thewine samples, as filamentous fungi were not represented in theempirical TRFLP database developed previously (2), and thus sev-eral fungal species detected by sequencing are either undetected ormisidentified by TRFLP (Fig. 4). Sample similarity was furtherevaluated via abundance-weighted Jaccard distance PCoA (seeFig. S6 in the supplemental material). No distinct clusters could beestablished between methods for beer samples. However, winesamples cluster in a method-dependent fashion, indicating thatOTU assignment differed between the two methods (see Fig. S6B).TRFLP infers OTU identity from restriction fragment size com-parison to an empirical database, as opposed to sequence infor-mation, possibly leading to this disparity and highlighting a po-tential disadvantage of TRFLP. However, as the true compositionof these samples is unknown, it is impossible to assess whetherthese differences are due to greater accuracy or greater noise witheither method, and further evaluation must be performed to fullycompare these techniques.
DISCUSSION
HTS has revolutionized the study of microbial ecology across arange of environments—including food fermentations—pro-pelled by declining sequencing costs concurrent with increasingsequence coverage (14). Surprisingly, the most economical tech-nologies currently available (namely, Illumina and Ion Torrentsequencing platforms) have yet to be applied to the study of fungalecosystems via HTS—to our knowledge—presumably due to theshort sequence length afforded by these systems and possibledoubts about the taxonomic reliability of such short fragments.Several criteria define optimal primer characteristics for short-amplicon HTS, including target coverage, taxonomic resolutionand accuracy, and short amplicon length (14). We have evaluatedseveral ITS primer sets targeting different loci of the fungal ITS foreach of these criteria, verifying many as valid choices for short-amplicon HTS applications. Primer pairs targeting the ITS1 locusgenerally appear to have the shortest mean amplicon lengths forall phyla, the smallest difference between Ascomycota and Basidi-omycota amplicon lengths, and the highest species- and genus-level classification accuracy for short amplicon reads, arguing forthe primacy of this locus for HTS, compared to ITS2 or whole ITS.The shortest amplicon length is displayed by the primer set de-signed for this study, BITS/B58S3, maximizing sequencing cover-
FIG 3 Taxonomic distribution of OTUs detected in a single yeast mock community reveals differential bias of ITS primer sets. Shown is the HTS communitystructure of a defined yeast mock community amplified with five different paired ITS primers. E, expected.
Bokulich and Mills
2524 aem.asm.org Applied and Environmental Microbiology
Dow
nloa
ded
from
http
s://j
ourn
als.
asm
.org
/jour
nal/a
em o
n 14
Jan
uary
202
2 by
82.
55.2
.39.
age of hypervariable ITS domains by very-short-amplicon HTSplatforms and theoretically minimizing amplification bias (10). Inaddition, the amplicon size is adequately small for efficient usewith qPCR quantification of fungal communities. The pairedqPCR-HTS protocol presented here enables enumeration of totalfungi and OTU profiling in a streamlined, two-step work flow. Asthe qPCR step quantifies the very same amplicon pool as serves asthe template for the sequencing reaction, this paired work floweffectively permits absolute quantification of each individualOTU in a sample.
The complete HTS work flow described here, utilizing any ofthe qualified primer sets evaluated in this study, can rapidly profilecomplex fungal communities on ultra-high-throughput Illuminaplatforms, facilitating future exploration of fungal biomes withunprecedented coverage and sequencing depth. However, cautionmust be observed, as none of the primer sets could reliably recon-struct the mock yeast community sequenced in this study, indi-cating that the threat of amplification and sequencing bias re-mains prevalent even after judicious primer selection, likely due tothe high amplicon length variability for all ITS loci.
ACKNOWLEDGMENTS
N.A.B. was supported by a Wine Spectator scholarship, the ASBC Foun-dation Brian Williams Scholarship (American Society of Brewing Chem-ists), and the 2012-2013 Dannon Probiotics Fellow Program (The Dan-non Company, Inc.) during the completion of this work.
D.A.M. acknowledges Jim Orvis and John Thorngate from Constella-tion Brands Inc. for their helpful discussions and support.
REFERENCES1. Bokulich NA, Bamforth CW, Mills DA. 2012. Brewhouse-resident mi-
crobiota are responsible for multi-stage fermentation of American cool-ship ale. PLoS One 7(4):e35507. doi:10.1371/journal.pone.0035507.
2. Bokulich NA, Hwang CF, Liu S, Boundy-Mills K, Mills DA. 2012.Profiling the yeast communities of wine using terminal restriction frag-ment length polymorphism. Am. J. Enol. Vitic. 63:185–194.
3. Alegría A, Szczesny P, Mayo B, Bardowski J, Kowalczyk M. 2012.
Biodiversity in Oscypek, a traditional Polish cheese, determined by cul-ture-dependent and -independent approaches. Appl. Environ. Microbiol.78:1890 –1898.
4. Margulies M, Egholm M, Altman WE, Attiya S, Bader JS, Bemben LA,Berka J, Braverman MS, Chen YJ, Chen Z, Dewell SB, Du L, Fierro JM,Gomes XV, Godwin BC, He W, Helgesen S, Ho CH, Irzyk GP, JandoSC, Alenquer ML, Jarvie TP, Jirage KB, Kim JB, Knight JR, Lanza JR,Leamon JH, Lefkowitz SM, Lei M, Li J, Lohman KL, Lu H, MakhijaniVB, McDade KE, McKenna MP, Myers EW, Nickerson E, Nobile JR,Plant R, Puc BP, Ronan MT, Roth GT, Sarkis GJ, Simons JF, SimpsonJW, Srinivasan M, Tartaro KR, Tomasz A, Vogt KA, Volkmer GA,Wang SH, Wang Y, Weiner MP, Yu P, Begley RF, Rothberg JM. 2005.Genome sequencing in microfabricated high-density picolitre reactors.Nature 437:376 –380.
5. Jung MJ, Nam YD, Roh SW, Bae JW. 2012. Unexpected convergence offungal and bacterial communities during fermentation of traditional Ko-rean alcoholic beverages inoculated with various natural starters. FoodMicrobiol. 30:112–123.
6. LaTuga MS, Ellis JC, Cotton CM, Goldberg RN, Wynn JL, Jackson RB,Seed PC. 2011. Beyond bacteria: a study of the enteric microbial consor-tium in extremely low birth weight infants. PLoS One 6(12):e27858. doi:10.1371/journal.pone.0027858.
7. Tedersoo L, Nilsson RH, Abarenkov K, Jairus T, Sadam A, Saar I,Bahram M, Bechem E, Chuyong G, Koljalg U. 2010. 454 pyrosequencingand Sanger sequencing of tropical mycorrhizal fungi provide similar re-sults but reveal substantial methodological biases. New Phytol. 188:291–301.
8. Soergel DAW, Dey N, Knight R, Brenner SE. 2012. Selection of primersfor optimal taxonomic classification of environmental 16S rRNA genesequences. ISME J. 6:1440 –1444.
9. Liu Z, Lozupone CA, Hamady M, Bushman FD, Knight R. 2007. Shortpyrosequencing reads suffice for accurate microbial community analysis.Nucleic Acids Res. 35:e120. doi:10.1093/nar/gkm541.
10. Bellemain E, Carlsen T, Brochmann C, Coissac E, Taberlet P, KauserudH. 2010. ITS as an environmental DNA barcode for fungi: an in silicoapproach reveals potential PCR biases. BMC Microbiol. 10:189. doi:10.1186/1471-2180-10-189.
11. Porter TM, Golding GB. 2011. Are similarity- or phylogeny-based meth-ods more appropriate for classifying internal transcribed spacer (ITS)metagenomic amplicons? New Phytol. 192:775–782.
12. Porter TM, Golding GB. 2012. Factors that affect large subunit ribosomalDNA amplicon sequencing studies of fungal communities: classificiation
FIG 4 Comparison of ITS sequencing to ITS-TRFLP of wine fungal communities. Botrytized wine fermentations were analyzed with BITS-B58S3 HTS (A) andITS1-ITS4 TRFLP (B). Panel B was adapted from reference 2 with permission.
High-Throughput Fungal Sequencing Primer Evaluation
April 2013 Volume 79 Number 8 aem.asm.org 2525
Dow
nloa
ded
from
http
s://j
ourn
als.
asm
.org
/jour
nal/a
em o
n 14
Jan
uary
202
2 by
82.
55.2
.39.

method, primer choice, and error. PLoS One 7(4):e35749. doi:10.1371/journal.pone.0035749.
13. Schoch CL, Seifert KA, Huhndorf S, Robert V, Spouge JL, Levesque CA,Chen W. 2012. Nuclear ribosomal internal transcribed spacer (ITS) re-gion as a universal DNA barcode marker for Fungi. Proc. Natl. Acad. Sci.U. S. A. 109:6241– 6246.
14. Bokulich NA, Mills DA. 2012. Next-generation approaches to the micro-bial ecology of food fermentations. BMB Rep. 45:377–389.
15. Ihrmark K, Bodeker ITM, Cruz-Martinez K, Friberg H, Kubartova A,Schenck J, Strid Y, Stenlid J, Brandstrom-Durling M, Clemmensen KE,Lindahl BD. 2012. New primers to amplify the fungal ITS2 region—evaluation by 454-sequencing of artificial and natural communities.FEMS Microbiol. Ecol. 82:666 – 677.
16. Toju H, Tanabe AS, Yamamoto S, Sato H. 2012. High-coverage ITSprimers for the DNA-based identification of Ascomycetes and Basidiomy-cetes in environmental samples. PLoS One 7(7):e40863. doi:10.1371/journal.pone.0040863.
17. Kõljalg U, Larsson KH, Abarenkov K, Nilsson RH, Alexander IJ, Eber-hardt U, Erland S, Hoiland K, Kjoller R, Larsson E, Pennanen T, Sen R,Taylor AF, Tedersoo L, Vralstad T, Ursing BM. 2005. UNITE: a databaseproviding web-based methods for the molecular identification of ectomy-corrhizal fungi. New Phytol. 166:1063–1068.
18. Abarenkov K, Nilsson RH, Larsson K-H, Alexander IJ, Eberhardt U,Erland S, Høiland K, Kjøller R, Larsson E, Pennanen T, Sen R, TaylorAFS, Tedersoo L, Ursing BM, Vralstad T, Liimatainen K, Peintner U,Kõljalg U. 2010. The UNITE database for molecular identification offungi—recent updates and future perspectives. New Phytol. 186:1447–1452.
19. Caporaso JG, Kuczynski J, Stombaugh J, Bittinger K, Bushman FD,Costello EK, Fierer N, Gonzalez Pena A, Goodrich JK, Gordon JI,Huttley GA, Kelley ST, Knights D, Koenig JE, Ley RE, Lozupone CA,McDonald D, Muegge BD, Pirrung M, Reeder J, Sevinsky JR, Turn-
baugh PJ, Walters WA, Widmann J, Yatsunenko T, Zaneveld J, KnightR. 2010. Qiime allows analysis of high-throughput community sequencedata. Nat. Methods 7:335–336.
20. Walters WA, Caporaso JG, Lauber CL, Berg-Lyons D, Fierer N, KnightJR. 2011. PrimerProspector: de novo design and taxonomic analysis ofbarcoded polymerase chain reaction primers. Bioinformatics 27:1159 –1161.
21. Hierro N, Esteve-Zarzoso B, Gonzalez A, Mas A, Guillamon JM. 2006.Real-time quantitative PCR (QPCR) and reverse transcription-QPCR fordetection and enumeration of total yeasts in wine. Appl. Environ. Micro-biol. 72:7148 –7155.
22. Gardes M, Bruns T. 1993. ITS primers with enhanced specificity forbasidiomycetes—application to the identification of mycorrhizae andrusts. Mol. Ecol. 2:113–118.
23. Martin KJ, Rygiewicz PT. 2005. Fungal-specific PCR primers developedfor analysis of the ITS region of environmental DNA extracts. BMC Mi-crobiol. 5:28. doi:10.1186/1471-2180-5-28.
24. White T, Burns T, Lee S, Taylor J. 1990. Amplification and directsequencing of fungal ribosomal RNA genes for phylogenetics, p 315–322.In Innis MA, Gelfand DH, Sninsky JJ, White TJ (ed), PCR protocols: aguide to methods and applications. Academic Press, San Diego, CA.
25. Bokulich NA, Subramanian S, Faith JJ, Gevers D, Gordon JI, Knight R,Mills DA, Caporaso JG. 2013. Quality-filtering vastly improves diversityestimates from Illumina amplicon sequencing. Nat. Methods 10:57–59.
26. Edgar RC. 2010. Search and clustering orders of magnitude faster thanBLAST. Bioinformatics 26:2460 –2461.
27. Altschul SF, Gish W, Miller W, Myers EW, Lipman DJ. 1990. Basic localalignment search tool. J. Mol. Biol. 215:403– 410.
28. D’haene B, Vandesompele J, Hellemans J. 2010. Accurate and objectivecopy number profiling using real-time quantitative PCR. Methods 50:262–270.
Bokulich and Mills
2526 aem.asm.org Applied and Environmental Microbiology
Dow
nloa
ded
from
http
s://j
ourn
als.
asm
.org
/jour
nal/a
em o
n 14
Jan
uary
202
2 by
82.
55.2
.39.