quantifying the effects of eucalyptus plantations and...
TRANSCRIPT
Quantifying the effects of Eucalyptus plantations andmanagement on water resources at plot and catchment scales
Auro C. Almeida,1* Philip J. Smethurst,1 Anders Siggins,2 Rosane B. L. Cavalcante3 andNorton Borges Jr3
1 CSIRO, Sandy Bay, TAS, Australia2 CSIRO, Clayton, VIC, Australia
3 CMPC Celulose Riograndense, Guaiba, RS, Brazil
Abstract:
Our aim was to quantify the effects of forest plantation and management (clear cut or 30% partial harvest) in relation to pasture,on catchment discharge in southeast Rio Grande do Sul state, Brazil. A paired-catchment approach was implemented in tworegions (Eldorado do Sul and São Gabriel municipalities) where discharge was measured for 4 years at three catchments in eachregion, two of which were predominantly eucalypt plantation (mainly Eucalyptus saligna, rotation of approximately 7–9 years)with native forest and grass in streamside zones. The third catchment was covered with grazed pasture. Weather, soils, canopyinterception, groundwater level, tree growth, and leaf area index were also measured.The 3-PG process-based forest productivity model was adapted to predict spatial daily plantation and pasture water balanceincluding precipitation interception, soil evaporation, transpiration, soil moisture, drainage, discharge, and monthly plantationgrowth. The TOPMODEL framework was used to simulate water pools and fluxes in the catchments.Discharge was higher under pasture than pre-harvesting plantation and increased for 1–2 years after complete plantation harvest;this change was less pronounced in the catchments under partial harvest. The ratio of discharge to precipitation before harvestingvaried from 7% to 13% in the eucalypt catchments and 28% to 29% under pasture. The ratio increases to 23–24% after totalharvest, and to 17% after partial harvesting. The ratio under pasture also increases during this period (to 32–44%) owing toincreased precipitation. The baseflow, in relation to total discharge, varied from 28% to 62% under Eucalyptus and from 38% to43% in the pasture catchments. Hence, eucalypt plantations in these regions can be expected to influence discharge regimes whencompared with pasture land use, and modelling suggests that partial harvesting would moderate the magnitude of dischargevariation compared with a full catchment plantation harvesting. The model efficiency coefficient (Nash–Sutcliffe modelefficiency coefficient) varied from 0.665 to 0.799 for the total period of the study. Simulation of alternative harvesting scenariossuggested that at least 20% of the catchment planted area must be harvested to increase discharge. This model could be a usefulpractical tool in various plantation forestry contexts around the world. Copyright © 2016 John Wiley & Sons, Ltd.
KEY WORDS water; discharge; catchment; Eucalyptus; pasture; native forest; modelling; 3-PG; harvesting
Received 11 December 2015; Accepted 15 August 2016
INTRODUCTION
Common in many parts of the world, there is pressure inBrazil to understand and minimize potential conflictassociated with the impact of plantations on waterresources and water availability for downstream uses,particularly in regions where land use has beentraditionally grassland (Soares and Almeida, 2001;Almeida and Soares, 2003; Engel et al., 2005; Farleyet al., 2005; Nosetto et al., 2005). Therefore, managementstrategies for maximizing plantation water use efficiency(biomass production per volume of water used by the
trees) and minimizing risks to streamflows are currentobjectives for plantation managers. Reducing the risk ofwater shortages for local communities is part of corporatesocial responsibility that can minimize communityconflicts over plantation water use. Such strategies needto be based on a quantitative understanding of catchment-specific plantation and hydrological behaviour in associ-ation with alternative forest management plans.Plantation forestry as a driver of change in land use is
of particular concern because it is well recognized thatevapotranspiration from some forested catchments can behigher than evapotranspiration from grassland (Zhanget al., 2001; Whitehead and Beadle, 2004; Jackson et al.,2005; van Dijk and Keenan, 2007). This difference arisesbecause forest plantations in general, as well as nativeforest, compared with grass, intercept more radiation and
*Correspondence to: Auro C. Almeida, CSIRO, Sandy Bay, TAS,Australia.E-mail: [email protected]
HYDROLOGICAL PROCESSESHydrol. Process. 30, 4687–4703 (2016)Published online 18 October 2016 in Wiley Online Library(wileyonlinelibrary.com) DOI: 10.1002/hyp.10992
Copyright © 2016 John Wiley & Sons, Ltd.

precipitation, are aerodynamically rougher and thus wellcoupled to the atmosphere, and have deeper root systemsthat allow them to exploit larger soil water volumes.Zhang et al. (2001) analysed runoff data from tropical
and temperate ecosystems in more than 250 catchmentsfrom 28 countries and developed relationships betweenprecipitation and annual evapotranspiration for forestedand grassed catchments. These curves have been appliedto estimate the impact of afforestation on streamflow andshow that for precipitation above 600mmyear�1, evapo-transpiration from forested catchments was higher thanthat from grassed catchments. While insightful, thesegeneralised relationships are difficult to apply at localisedscales as they do not consider the many secondary factorsthat influence evapotranspiration within catchments suchas local biophysical characteristics or management prac-tices (Vanclay, 2009). However, not all climates (tropicalto temperate) and soils (shallow and deep) were represent-ed across the full range of precipitation, and the curvesdescribe a steady-state water balance that is not applicablefor dynamic assessments of impacts on water resourceswhere changes in land use, plantation age, plantationmanagement and climate occur (Greenwood et al, 2011).Although Smethurst et al. (2015) showed that planta-
tion harvest did not affect discharge in a Braziliancatchment (probably owing to interception of lateral sub-surface flows by native forest in the streamside zone),many studies indicate that catchment harvesting canincrease the discharge regime (Scott and Lesch, 1997;Brown et al., 2005; Brown et al., 2007; Ferraz et al.,2013). These contrasting behaviours indicate a need formore intensive investigations of water use by plantationsand modelling tools in order to better understand theeffects of management options on hydrology underspecific catchment conditions. This is particularly impor-tant in South America where plantations are expandingrapidly in drier regions (Almeida et al., 2007).Polglase and Benyon (2009), in Australia, note that in
large catchments, the impacts of plantation establishmenton catchment water balance have been somewhatoverstated, finding that while plantations are likely tohave localized impacts, plantation forests generallyoccupied only a small proportion of catchment area, andthus, their impacts on catchment water yield weretypically less than would be otherwise expected basedon conventional wisdom.We developed and applied a modelling framework that
integrates the spatial version of the 3-PG forest process-based model (Landsberg and Waring, 1997; Sands andLandsberg, 2002; Landsberg and Sands, 2010; Almeidaand Sands, 2015) with TOPMODEL (TOPographic basedhydrological MODEL) (Beven and Kirkby, 1979; Quinnet al., 1991; Beven and Freer, 2001). This frameworkprovides the advantage of predicting forest growth, a full
water balance for plantation, native forest, and pasture atplot and catchment scales. Other process-based modellingframeworks have been developed to link plot-scalegrowth of forest plantations, pasture, or crops tocatchment-scale water outcomes (Paydar and Gallant,2008; Wang et al., 2008; Feikema et al., 2009; Feikemaet al., 2010). Feikema et al. (2010) integrated an earlierversion of 3-PG model (3-PG+) into a catchment model[Catchment Analysis Tool (CAT] (Beverly et al., 2005).The 3-PG+/CAT model predicted plantation growth anddischarge in six catchments supporting eucalypt or pineplantations (Feikema et al., 2007), and later forcatchments containing multi-species native forest(Feikema et al., 2009). The 3-PGH model used in thecurrent study is similar in concept to 3-PG+/CAT butincludes a newer version of 3-PG, the potential forsmaller spatial resolution, and application to harvestingscenarios in a tropical climate.In more of an agricultural context, Paydar and Gallant
(2008) and Wang et al. (2008) linked plot-scale crop,tree, or pasture simulations (using the APSIM model)with a catchment model called FLUSH. Their interestincluded groundwater levels and discharge. Theyconcluded that increasing tree cover in an agriculturalcatchment was likely to lower water tables and reducedischarge.However, it appears that there has been no substantial
model development of application beyond these studies.The current study demonstrates the usefulness of linkingplot-scale simulations to a catchment model. As 3-PG iswidely used by the plantation forestry industry, linking ofthe newest version (Almeida and Sands, 2015) tocatchment hydrology offers the potential for wider usethan those previously developed with the other 1D–3Dframeworks.In this study, we aimed to measure and model the
effects of forest plantation and management (clear cut or30% partial harvest), in relation to pasture, on catchmentdischarge in southeast Rio Grande do Sul state, Brazil.
METHODOLOGY
A paired-catchment approach was implemented in tworegions where the predominant land use is pasture (forcattle production) or short-rotation eucalypt plantations(for pulp production). Calibrated and automaticallylogged weirs measured discharge for 4 years at sixcatchments in Eldorado and São Gabriel municipalitiesin Rio Grande do Sul State in southern Brazil (seeFigure 1 and Table I for details). The weirs were locatedin three catchments in each region, two of which werepredominately eucalypt plantation (Eucalyptus saligna,and hybrids of Eucalyptus urophylla and Eucalyptus
4688 A. C. ALMEIDA ET AL.
Copyright © 2016 John Wiley & Sons, Ltd. Hydrol. Process. 30, 4687–4703 (2016)

globulus) with native forest and grass in streamside zones.The third catchment was covered with pasture with smallstreamside protection zone. Catchments were instrument-ed to measure precipitation, air temperature and relativehumidity, wind speed and direction and solar radiation,soil moisture, precipitation canopy interception, ground-water level, tree growth, and leaf area index (LAI). Soiland geophysical characteristics including soil texture,hydraulic conductivity, and altimetry and groundwatercatchment boundaries were mapped in all catchments.Observations and modelling in these six catchments wereused to quantify water balance and Eucalyptus plantationgrowth at plot and catchment scales.
Terra Dura and Ponta das Canas experimental catchments
The Terra Dura (TD) region in the Eldorado do Sulmunicipality has a long history of plantation development(third rotation at the start of this catchment experiment).The Ponta das Canas (PC) region in São Gabrielmunicipality, in contrast, was in the first rotation at thestart of the experiment. For establishing a baselinecomparison of water use between catchments, it wasdesirable to have several years of discharge data prior toplantation establishment, but this was not possible asplantations had already been established at TD and at theinitial phase of the first rotation at PC.At TD, TE100 was a sub-catchment (nested) of the
larger catchment (TE30) and TP was under pasture; thenumbers 100 and 30 in the treatment code denote thepercentage of area harvested (Figure 1). In PC, the twoeucalypt catchments and pasture catchment (PP) wereindependent and plantation harvest followed as planned,
i.e. 100% of the planted area in PE100 and 30% in PE30.The catchments within each region had similar total andplanted area, predominant soil type, slope, riparian zonevegetation, planted and harvest dates, main plantedspecies and respective stocking, and the harvest ormanagement regime of each catchment (Table I).
Soil characteristics
Soil maps (1:10 000) and characteristics such as texture,hydraulic conductivity, and water retention curves aredescribed in other studies (Costa et al., 2009; Santos et al.,2013). The predominant soil in both TD and PCcatchments was Haplic Acrisol with loam surface textures(Table I) and high saturated hydraulic conductivity.
Meteorological data
The meteorological variables, precipitation (mm), airtemperature (°C), air relative humidity (%), solar radiation(MJm�2 day�1), wind speed (m s�1), and wind direction(°) were measured by an automatic weather stationinstalled above the tree canopy in each TD and PCcatchment. The instruments were scanned each minute,and the data averaged for various time intervals from 0.5hourly to annually. Precipitation was also measured in atleast one rain gauge (TB4 model) close to the weir in eachcatchment at 10-min intervals.
Soil water content
Soil water content (SWC) was measured in eachcatchment using capacitance probes (Diviner 2000 SentekPty Ltd, Australia) in fixed access tubes. Six tubes wereinstalled in each catchment along a typical transect from
Figure 1. Terra Dura (TD) and Ponta das Canas (PC) experimental catchments locations and boundaries in Rio Grande do Sul State, south of Brazil
4689EUCALYPT MANAGEMENT CATCHMENT WATER
Copyright © 2016 John Wiley & Sons, Ltd. Hydrol. Process. 30, 4687–4703 (2016)

the top to the bottom of the slope. In plantations, accesstubes were located between trees on the tree rows.Measurements were made approximately fortnightly at0.1-m intervals down to 1.6-m depth from the soilsurface. Calibrations based on soils collected in dry,moist, and wet conditions produced region-specificcalibration equations.
Groundwater
A geophysical study established the sub-surfaceboundaries of each catchment and identified the ground-water flow directions (CMPC, unpublished report). Asmall number of piezometers for measuring depth togroundwater surfaces were installed in each catchment(Figure 5). Each piezometer was instrumented with aLevelogger Model Gold (Solinst Limited Canada,Georgetown, Ontario, Canada). Monthly manual mea-surements of water levels were used to check the accuracyof the automatic data.
Interception
Precipitation canopy interception, throughfall,stemflow, and litter interception were measured atPE100 from August 2012 to September 2013. Precipita-tion was measured by three rain gauges in the catchmentwithout interference of the plantation. Throughfall wasmeasured using six linear rain gauges in an area of900m2, three rain gauges were installed in the line of thetrees and three between lines, and the area of the each raingauge was 10 cm width by 290 cm length. Stemflow wasmeasured on 12 trees distributed in the same area ofthroughfall measurements. A similar setup was used inthe riparian zones. Details of these measurements arepresented in Peláez (2014).
Discharge
In each catchment, a V-notch weir was installed thatwas built to cope with at least a 1-in-10-year high-flowevent and instrumented with a water level CS410-L shaftencoder, datalogger (CR 1000, Campbell ScientificInstruments), and rain gauge model TB4 (HydrologicalServices Ltd, Australia). Discharge and precipitation weremeasured at 10-min intervals in each catchment. InTE100 and TP catchments, previously existing weirs wererefurbished and instrumented. Streamflow was calculatedbased on measured water height and specific conversionequations developed for each weir.
Plantation growth
Measurements of stem diameter and height in perma-nent sample plots (PSPs) were used to calculate stemvolume at different ages of each stand during the rotationin all planted catchments. Genotype-specific allometrics
Table
I.Catchmentcharacteristics.
Region
Catchment
name
Total
area
(ha)
Planted
area
(ha)
%planted
area
Locationof
theweir
Predominant
soilclasses
Slope
(°)
Riparian
zone
onditio
nDates
harvest
andreplant
Mainspecies
Stocking
(treeha
�1)
Managem
ent
Terra
Dura
TE30
95.04
80.44
84.8
30.1769°S
Ferralic
Cam
bisol,
Haplic
Acrisol,
Molic
Leptisol
8.8
Medium
stageof
alteredrainforest
1/11/2012
Eucalyptus
urophylla
×Eucalyptus
globulus
hybrid
1445
Eucalyptus
unharvested
except
inTE30
51.6130°W
15/06/2013
TE100
39.87
33.6
84.3
30.1789°S
Ferralic
Cam
bisol,
Haplic
Acrisol,
Molic
Leptisol
9.1
Medium
stageof
alteredrainforest
1/11/2012
E.urophylla×
E.globulus
hybrid
1445
Eucalyptus
100%
harvested
51.6089°W
15/06/2013
TP
14.82
——
30.1876°S
Haplic
Acrisol,
Molic
Leptisol
7.7
Degradedpasture
andsignsof
soil
erosion
—Planted
grass
—Low
intensity
usepasture
51.6013°W
Ponta
das
Canas
PE30
75.81
51.02
61.0
30.5101°S
Ferralic
Cam
bisol,
Haplic
Acrisol,
Molic
Leptisol
5.1
Grass
andsome
isolated
trees,soil
wellcovered
1/02/2014
Eucalyptus
salig
nahybrid
1225
Eucalyptus
30%
harvested
54.1657°W
16/05/2014
PE100
79.96
49.2
62.4
30.5069°S
Ferralic
Cam
bisol,
Haplic
Acrisol,
Molic
Leptisol
4.1
Grass
andsome
isolated
trees,soil
wellcovered
1/02/2014
E.saligna
hybrid
1225
Eucalyptus
100%
harvested
54.1679°W
16/05/2014
PP
99.49
——
30.5151°S
Molic
Leptisol
3.2
Nativegrass
—Planted
grass
—Pasture
54.1614°W
4690 A. C. ALMEIDA ET AL.
Copyright © 2016 John Wiley & Sons, Ltd. Hydrol. Process. 30, 4687–4703 (2016)

were used for most planted genotypes. The PSPs at PCwere measured at ages 2.5, 4.5, and 6.5 years. At TD, thePSPs were measured from December 2010 in blocks withages varying at 3.3, 4.9, 6.7, 8.3, and 8.9 years.
Leaf area index
Leaf area index (m2m�2) was monitored seasonallyusing an LAI-2000 plant canopy analyser in a selection oftree plots per catchment with eucalypt plantations. Thetwo-sensor method (Li-Cor, 1992) was used, with areference sensor collecting data in a nearby open area andthe measuring sensor located below the canopy. Valuesobtained from the LAI-2000 were modified using theequation described in Almeida et al. (2007) to convertplant canopy data to LAI.
Modelling description
Our modelling approach to quantify tree growth andwater balance at plot scale, and discharge at catchmentscale, combined the spatial version of the 3-PG forestprocess-based model (Landsberg and Waring, 1997;Sands and Landsberg, 2002; Landsberg and Sands,2010; Almeida and Sands, 2015) with TOPMODEL(Beven and Kirkby, 1979; Quinn et al., 1991; Beven andFreer, 2001). The 3-PG model was developed to predictplantation growth and water balance spatially (3-PGS) byintegrating it with a geographic information system andspatial input layers for soil attributes, plantation age,species or genotype and daily or monthly precipitation,solar radiation, temperature, vapour pressure deficit, andoccurrence of frost (Almeida et al., 2010). The 3-PGSmodel generates tree growth data outputs of stand volume(SV), mean annual increment, current volume increment,diameter at breast height, basal area, and LAI. The modelalso generates water balance predictions represented ascanopy interception (I), tree transpiration (T), soilevaporation (E), evapotranspiration (ET) (the sum ofI +T+E), drainage (D), SWC, and available soil water(ASW).Specific parameter fileswere developed to estimate growth
and water use by the planted genotypes and for an adaptationof the parameter set for native forest modified from Forresterand Tang (2015). A simple pasture submodel was based onpasture LAI and stomatal conductance.The 3-PGS was run at a daily time step using specific
parameterization for each planted genotype and, nativeforest, or pasture, to predict ET for every landscape cell.Owing to limitations on the resolution of the climate andsoils data available, the finest spatial resolution possiblewas 5m by 5m. A lumped daily ET for the catchmentwas then generated from the 3-PGS output. The R
statistical TOPMODEL module was then used to predictthe discharge at weir locations, using the lumped
catchment rainfall, the lumped catchment ET, and adigital elevation model to calculate the topographic index(Beven and Kirkby, 1979; Ambroise et al., 1996; Bevenand Freer, 2001). As the TOPMODEL parameters foreach study catchment were unknown, initial bounds onthe parameters were based on data from literature, and aMonte Carlo simulation was run to determine the bestmodel parameters for each catchment based on Nash–Sutcliffe model efficiency coefficient (NSE) predictionsagainst observed streamflow data. The combination of3-PGS and TOPMODEL is referred to as 3PGH.Modelling of TD used the actual planting date of each
block at TE30 and TE100, which ranged from 1989 to2004, and harvesting of 100% of TE100 plantation inNovember 2012, when 73% of the plantation was10years old. The harvested area was equivalent to 30%of TE30. For the PC catchments, PE100 and PE30 wereplanted in August 2006 and harvested in February 2014(100% PE100 and 30% PE30). The model assumed nochange in the streamside zone. A new plantation wasestablished in the harvested blocks in June 2013 atTE100, and in May 2014 at PE100 and PE30.The 3-PGH ran at a daily time step using the actual
plantation management dates, soil types, and genotypes.During the period between harvesting and replanting, themodel assumed bare soil (except on riparian zones covered byaggrading native rainforest at TD and mainly grass at PC),with daily ET being based on soil evaporation estimates.
Flow separation
We used the recursive digital filter developed by Lyneand Hollick (1979) to separate the components ofdischarge and estimate baseflow and quickflow of thethree catchments each at TD and PC.
Model evaluation
The NSE (Nash and Sutcliffe, 1970; Pushpalatha et al.,2012; Ritter and Muñoz-Carpena, 2013) was used toassess model efficiency for predicted discharge. Thisindex is commonly used to assess the predictive power ofhydrological models. The value of NSE can range from�∞ to 1, and the closer NSE is to 1, the more accurate themodel. Linear regression between observed and predictedmonthly and annual discharge was also used to indicatemodel efficiency. The model performance was comple-mentary indicated by the coefficient of determination (R2)and the root-mean-square error (RMSE) obtained in eachcatchment for the periods before and after harvesting andfor the total period of the study (Table II).
Plantation management scenarios
To quantify the predicted effects of plantation man-agement on water resources, we ran scenarios of
4691EUCALYPT MANAGEMENT CATCHMENT WATER
Copyright © 2016 John Wiley & Sons, Ltd. Hydrol. Process. 30, 4687–4703 (2016)

harvesting in one of the catchments (PE100) thatsimulated harvesting of 100% (as occurred), 75%, 45%,and 20% of the planted area.
RESULTS
Climate
Owing to the short distances between catchmentswithin each region, precipitation amongst all TD andamongst all PC catchments was highly correlated, butwith some minor day-to-day variations. Averaging thethree catchments in each region, mean annual precipita-tion from 2002 to 2014 was 1600mmyear�1 at TD and1580mmyear�1 at PC from 2007 to 2014 (Figure 2). The
years 2012 and 2013 had lower precipitation thanhistorical mean annual precipitation, 1252 and1391mm, respectively, at TD, and 1236 and 1189mmat PC; but in 2014, TD received 1716 and PC 1889mm.Compared with PC catchments, TD catchments
received slightly less solar radiation and were approxi-mately 5 °C warmer (Figure 2).
Soil water
Soil water content measurements in TE100 had highertemporal than spatial variability within a slope transect. InTP, the mid-slope positions were consistently moisterthan upper or lower slope positions, showing highvariability of soil water between access tubes in the sameperiod (Figure 3).
Table II. Precipitation, observed and predicted discharge, discharge : precipitation ratio, and baseflow before and after plantation harvestand for the total period of monitoring for the six catchments.
TE30 TE100 TP PE100 PE30 PP
Before harvest Precipitation (mm) 2446 2359 2348 3593 3526 3907Observed discharge (mm) 242 160 656 248 483 1146Observed % of discharge 9.9 6.8 27.9 6.9 13.7 29.3Predicted discharge (mm) 169 172 699 273 469 1216Predicted % of discharge 6.9 7.3 29.8 7.6 13.3 31.1NSE 0.692 0.587 0.643 0.536 0.619 0.774RMSE 0.587 0.652 2.157 0.554 0.477 1.361R2 0.712 0.774 0.668 0.578 0.621 0.775Intercept 0.035 0.053 0.265 0.162 0.148 0.322Slope 0.793 1.438 0.796 0.423 0.654 0.774Number of days (n) 668 639 669 1027 1034 1023Baseflow (mm) 113 45 282 76 295 434% of baseflow 47.2 28.5 43.5 30.5 62.2 38.7
After harvest Precipitation (mm) 3430 3349 3537 1958 2500 1978Observed discharge (mm) 580 819 1140 459 433 883Observed % of discharge 16.9 24.5 32.2 23.5 17.3 44.6Predicted discharge (mm) 653 816 1231 455 394 814Predicted % of discharge 19.0 24.4 34.8 23.2 15.7 41.1NSE 0.757 0.935 0.777 0.682 0.690 0.650RMSE 0.984 0.966 2.387 0.879 0.779 2.28R2 0.759 0.809 0.777 0.718 0.703 0.653Intercept 0.251 0.379 0.401 0.119 0.1285 0.511Slope 0.757 0.79 0.785 0.879 0.7823 0.676Number of days (n) 852 877 851 424 424 424Baseflow (mm) 243 230 382 236 251 333% of baseflow 41.7 28.2 33.5 51.4 57.8 37.8
Total Precipitation (mm) 5870 5707 5852 5552 6026 5885Observed discharge (mm) 822 979 1788 708 916 2028Observed % of discharge 14.0 17.2 30.6 12.8 15.2 34.5Predicted discharge (mm) 821 988 1931 728 859 2030Predicted % of discharge 14.0 17.3 33.0 13.1 14.3 34.5NSE 0.748 0.799 0.739 0.665 0.680 0.726RMSE 0.833 1.326 2.288 0.665 0.581 1.682R2 0.748 0.774 0.742 0.670 0.685 0.726Intercept 0.123 0.245 0.342 0.148 0.129 0.376Slope 0.771 0.769 0.789 0.727 0.735 0.733Number of days (n) 1520 1516 1520 1451 1458 1447Baseflow (mm) 356 276 664 312 551 767% of baseflow 47.2 28.5 43.5 44.0 60.2 38.3
4692 A. C. ALMEIDA ET AL.
Copyright © 2016 John Wiley & Sons, Ltd. Hydrol. Process. 30, 4687–4703 (2016)

Soil water in PE100 and PE30 had similar trends; i.e.lower elevation (McVicar and Körner, 2013) tubes wereslighter drier than the ones at higher altitudes. Also, forthe last few measurements in 2015, SWC was higher thanin the previous months and years, which coincided withharvesting and replanting, but also with higher precipi-tation than the previous period. In contrast, in PP,variability was less pronounced and soil moisture ingeneral was higher than in PE100 and PE30 (Figure 3).Soil samples collected close to the access tubes show thatsoils at higher altitudes had higher clay contents thanthose at lower altitudes.Although 3-PGmodelling of SWC andASW considered
only a depth of 1.6m, model predictions were highlycorrelated with observations (R2 = 0.79 to 0.81) (Figure 4).
Groundwater
Some groundwater levels fluctuated during the mea-surement period in response to precipitation, butresponses and levels depended mainly on vegetation type(pasture versus plantation) and slope position (Figure 5).At TD, there was up to an 18-m difference betweencatchments or topographic positions, but there were nodiscernible effects of harvesting. Water levels at a highslope position in TE30 (and therefore unaffected byharvesting in TE100) varied between 3.5 and 13m belowthe soil surface. During the 6months following harvest-ing, water levels dropped 4m and then increased. Thispattern appears to be related to precipitation amounts andintensity, and the same relative behaviour occurred in all
Figure 2. Annual average (left) and monthly average (right) air temperature (°C) (red), solar radiation (MJm2 day�1) (green), vapour pressure deficit(mb) (grey), and precipitation (mm year�1) (blue bars). For both figures, Terra Dura is represented by squares or dark blue bars, and Ponta das Canas by
circles and light blue bars
Figure 3. Temporal patterns of observed soil water content measured from the high to low slope positions in the catchments TE100, TP, PE100,PE30, and PP. Vertical dotted line represents the date of plantation harvest for the plantation catchments. The table shows tube locations and
elevation (m asl)
4693EUCALYPT MANAGEMENT CATCHMENT WATER
Copyright © 2016 John Wiley & Sons, Ltd. Hydrol. Process. 30, 4687–4703 (2016)

three slope positions, but with different absolute levels.At PC, groundwater levels were also more stronglyinfluenced by precipitation than by vegetation. Waterlevels under pasture (PP) at both slope positions wereconsistently higher than in the catchments with Eucalyp-tus (PE100 and PE30). After plantation harvest, ground-water levels rose by about 1m at PE100, but at the topslope position in PE30 levels, it rose more than 3m within6months after harvesting (Figure 5). Concurrently, thepasture catchment (PP) had an increase of approximately0.5m in groundwater level that coincided with higherprecipitation during the period after harvesting ofEucalyptus in PE100 and PE30.
Discharge
Daily discharge in the pasture catchments was usuallyhigher than in the eucalypt catchments prior to harvestingin both regions (Figure 6). In the pre-harvest period, thepeak flows in the TP catchment were 90–130 and 50–120mmmonth�1 in PP, but 45mmmonth�1 in TE30 andTE100 and 30–40mmmonth�1 in PE30 and PE100. Atpost-harvesting, peak flows in PP (pasture) were120–170 mm month�1 in TP compared wi th110–190mmmonth�1 in TE100 and 44–63mmmonth�1
in TE30 and 43–101mmmonth�1 in PE100 and28–78mmmonth�1 in PE30 (Figure 7).The importance of precipitation as a determinant of
discharge is accounted for to some degree by examiningdischarge monthly ratios (discharge : precipitation), i.e.discharge per unit of precipitation. Prior to harvesting ofTE100, PE100, and PE30, this ratio was consistentlyhighest in the pasture catchments. At PE30, the ratio washigher than at PE100 (Figure 7 and Table II).With a delay of 6months, harvesting markedly
increased daily and monthly flows and discharge ratiosin the 100% harvest catchment (TE100) compared withthat of the other two catchments at TD (Figure 8). Thisdelay was in part related to the dry period immediatelyafter harvesting. The hydrologic behaviour of the 100%harvest catchment (TE100) was then similar to the pasturecatchment for about 14months, persisting until the end of2014. During the same period, patterns in the 30%harvested catchment (TE30 that included the nested andtotally harvested catchment TE100) were intermediate ofthe other two catchments. In the case of PC, there was anincrease on the percentage of discharge after harvest atPE100 and less pronounced in PE30. Surprisingly, therewas a marked increase in the discharge ratio of the pasturecatchment (PP) from 29% to 45%. This result may be
Figure 4. Comparison of observed and 3-PG-predicted soil water content (SWC) and available soil water (ASW) at (a) TE100 and (b) PE30 in themiddle of the transects in relation to the 1:1 line
4694 A. C. ALMEIDA ET AL.
Copyright © 2016 John Wiley & Sons, Ltd. Hydrol. Process. 30, 4687–4703 (2016)

related to high-intensity precipitation events that occurredduring March and July of 2014, and infiltration ratesunder pasture were probably lower than those underplantations. At PE100, after 30% plantation harvesting,there was an increase in discharge ratio compared withPE30 (100% harvesting), but the difference took around5months to develop.Daily discharge became similar between PE100 and
PE30 catchments around 6–7months after harvesting.During the last 6months of measurements (September2014 to February 2015), PP had a much more similardischarge : precipitation ratio of PE100 than the previousperiod, and also a quicker reduction in discharge than atthe plantation catchments (PE100 and PE30).
Flow duration curves from TE30, TE100, and TP for theperiod fromApril 2011 to November 2012 (before harvest)show that TP (pasture) had 100% of the time producedminimum discharge of at least 0.2mmday�1 and only 20%of the time at discharge ≥1mmday�1. At the TE30 andTE100 catchments, discharge was ≥1mmday�1 only 7%of the time. Discharge at TE30 was, almost all the time,higher than at TE100, e.g. flows of >0.1mmday�1
occurred 80% of the time at TE30 and only 27% of thetime in TE100 (Figure 8). This result is unexpectedconsidering that TE100 flow contributes to TE30.Before harvesting, low flows (assumed as flows that
exceeded 75% of the time) were lowest in the catchmentTE30, intermediate in the TE100, and highest in the
Figure 5. Groundwater levels measured at the top, middle, and bottom slope positions, and precipitation at Terra Dura (top) and Ponta das Canas(bottom) catchments
4695EUCALYPT MANAGEMENT CATCHMENT WATER
Copyright © 2016 John Wiley & Sons, Ltd. Hydrol. Process. 30, 4687–4703 (2016)

pasture catchment (TP). The flow duration curves fromTE30, TE100, and TP for the period after harvesting(from December 2012 to February 2015) were verysimilar across all catchments for at least 60% of the time,showing that in the harvested catchments, mainly inTE100, there was a shift towards a greater proportion ofhigh flows.By comparing the flow duration curves of PP for the
period before and after the eucalypt harvesting, therewas an increase in both high flows and lower flows.This change probably has been influenced by theprecipitation events of higher intensity since a compar-ison (not shown) of PP flow duration curves, usingperiods with similar total precipitations for beforeharvesting that match with after harvesting, showssimilar patterns. Before harvesting, the catchmentPE100 exhibited a much lower proportion of both lowand high flows than in the pasture catchment. The flow
duration curve for PP was more similar to that in thePE30 before harvest, but after harvest, PE100 becamevery similar with PP and PE30; this is an evident effectof the harvesting (Figure 8).Before harvest, flows of magnitude of 0.5mmday�1
were exceeded only 10% of the time in PE100, 22% inPE30, and 50% in PP; this indicates the differencebetween vegetation and between other characteristics ofthe plantation catchments. After harvest, flows of0.5mmday�1 were exceeded 60% of the time inPE100, 63% of the time in PE30, and 72% of the timein PP. In PP, the percentage of time flow exceeded0.5mmday�1 increased by 22% when compared with theobserved period before harvest; this indicates the effect ofprecipitation for the two periods, and it is important totake into consideration that the period before harvestaccounts for 34months of data and post-harvest only14months. The same comparison for PE100 shows a
Figure 6. Daily average precipitation (mm day�1) and daily discharge (logarithmic scale) for Terra Dura catchments (top; TE30, TE100, and TP) fromFebruary 2011 to March 2015, and for Ponta das Canas catchments (bottom; PE100, PE30, and PP) from February 2011 to March 2015. Vertical dotted
lines represent the date of plantation harvest for the plantation catchments
4696 A. C. ALMEIDA ET AL.
Copyright © 2016 John Wiley & Sons, Ltd. Hydrol. Process. 30, 4687–4703 (2016)
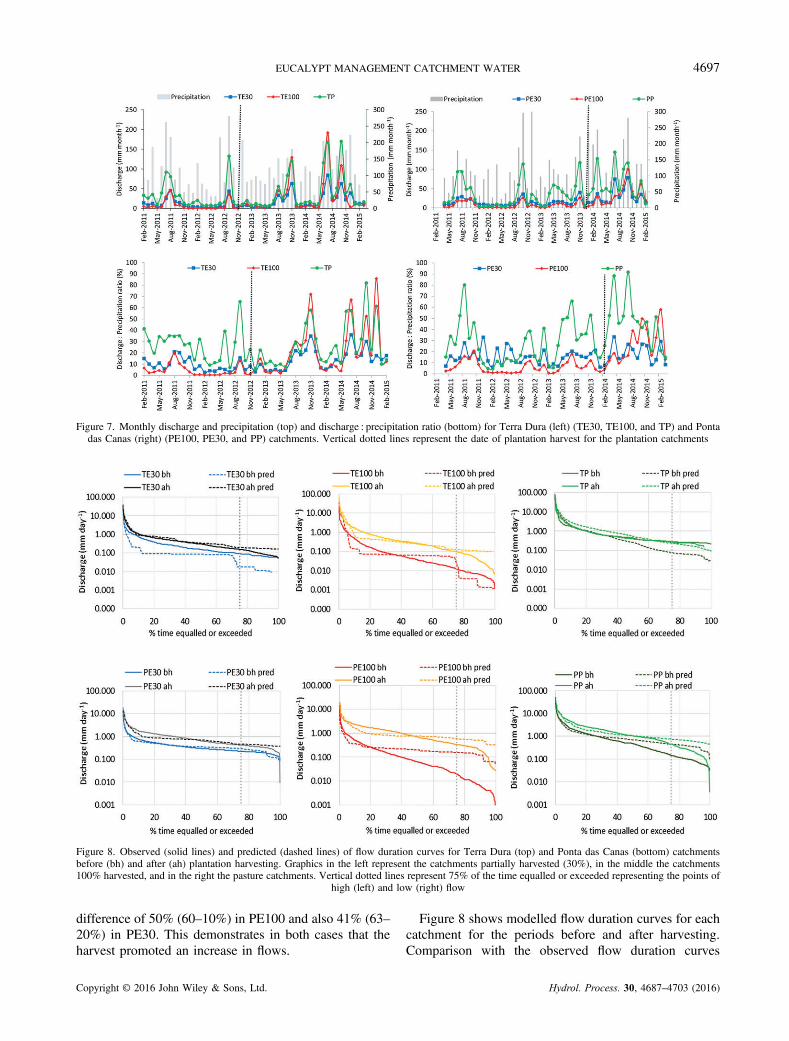
difference of 50% (60–10%) in PE100 and also 41% (63–20%) in PE30. This demonstrates in both cases that theharvest promoted an increase in flows.
Figure 8 shows modelled flow duration curves for eachcatchment for the periods before and after harvesting.Comparison with the observed flow duration curves
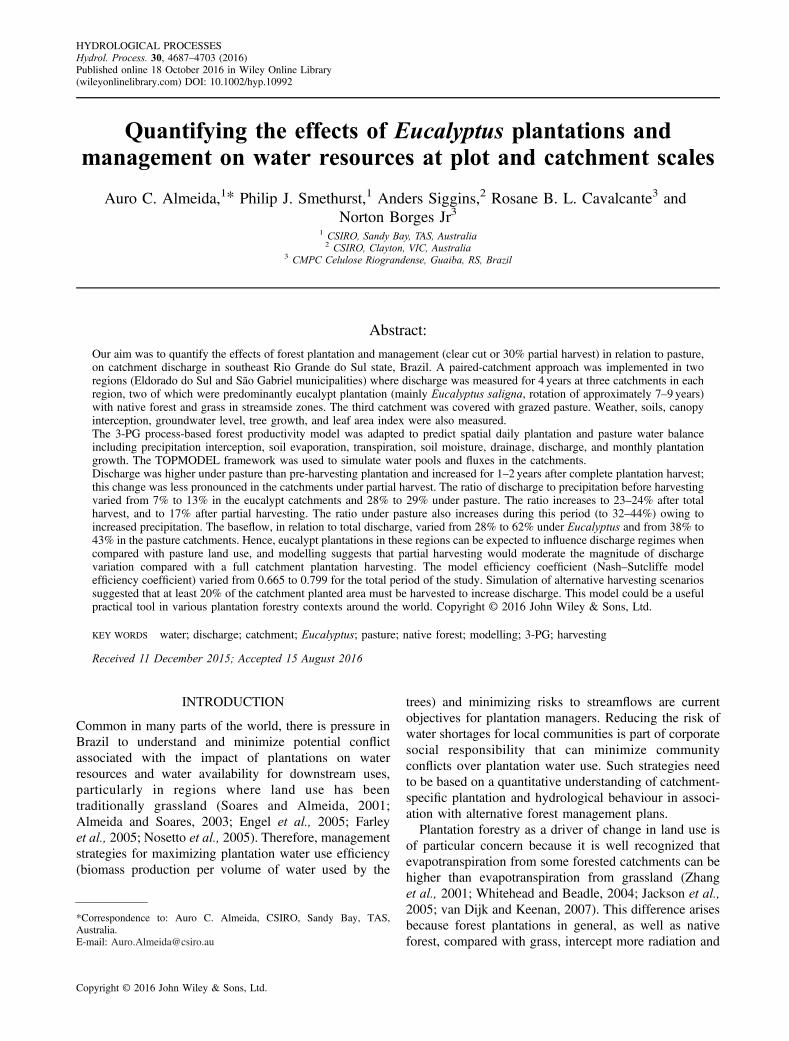
Figure 7. Monthly discharge and precipitation (top) and discharge : precipitation ratio (bottom) for Terra Dura (left) (TE30, TE100, and TP) and Pontadas Canas (right) (PE100, PE30, and PP) catchments. Vertical dotted lines represent the date of plantation harvest for the plantation catchments
Figure 8. Observed (solid lines) and predicted (dashed lines) of flow duration curves for Terra Dura (top) and Ponta das Canas (bottom) catchmentsbefore (bh) and after (ah) plantation harvesting. Graphics in the left represent the catchments partially harvested (30%), in the middle the catchments100% harvested, and in the right the pasture catchments. Vertical dotted lines represent 75% of the time equalled or exceeded representing the points of
high (left) and low (right) flow
4697EUCALYPT MANAGEMENT CATCHMENT WATER
Copyright © 2016 John Wiley & Sons, Ltd. Hydrol. Process. 30, 4687–4703 (2016)

indicates that the model overestimated the lower flows inPE100 and PP and underestimate in TE30TP and TE100,in the period before harvesting.Monthly precipitation, discharge, and discharge : pre-
cipitation ratio for the six catchments are used to producethe data shown Table II.
Baseflow
Flow separation analysis for quickflow and baseflowshowed a clear difference between the TD catchments. Asa percentage of total flow, baseflow was 47% at TE30,28% at TE100, and 43% at TP for the period beforeharvesting of TE100. The percentage of baseflow atTE100 remained constant despite harvesting. Baseflowbefore harvesting at PC was also different betweencatchments. At TE30, only 30% of total flow wasbaseflow, 62% at PE30, and 38% at PP. An increase to
51% of baseflow occurred at PE100 after harvesting, butthis did not occur for 30% harvesting at PE30, whichactually decreased slightly to 58% (Figure 9).
Simulated and observed discharge
The results of modelled and observed monthlydischarge for each catchment during the total period ofmonitoring are presented in Figure 10, and the basicstatistics of the observed versus predicted regressionlines, coefficient of determination (R2), RMSE, and NSEare presented in Table II.
Plantation growth and water balance
Predicted and observed plantation growth at PC isshown for SV for the most planted clone in Figure 11.The modelling framework enabled us to spatially predictgrowth (monthly time step), of which an example is also
Figure 9. Predicted baseflow (bf) discharge at Terra Dura (left) and Ponta das Canas (right) catchments
Figure 10. Monthly observed and predicted discharge of the individual catchments
4698 A. C. ALMEIDA ET AL.
Copyright © 2016 John Wiley & Sons, Ltd. Hydrol. Process. 30, 4687–4703 (2016)

provided in Figure 11, i.e. predicted stem volume beforethe harvesting in February 2014.Prediction of water balance of the eucalypt catchments
at TD and PC using 3-PG at plot scale for the entirerotation shows that evapotranspiration processes usedaround 80% of total precipitation (Table III).Comparison of observed monthly canopy interception
(Peláez, 2014) and its prediction by 3-PG for a period of9months between June 2012 to February 2014 shows asimilar average ratio of interception : precipitation.Observed interception was 13.8% of the precipitation,and modelled was 14.1%.
Management scenarios
As an example of model application, the virtualexperiment compared the effects of different levels ofharvesting in PE100 (Figure 12). There were intermediateeffects of smaller percentages of harvesting, but smalldifferences in flows between 20% and 45% and 75%
harvesting suggests there may be a threshold percentagebefore flows increase.
DISCUSSION
Long-term monitoring of stand growth and waterresources such as soil moisture, groundwater, anddischarge was essential to develop, calibrate, and validatethe modelling presented in this study and to understandand quantify the factors that influence discharge in thecatchments. This combined, process-based, model con-currently simulated wood and water outcomes at spatialand temporal resolution consistent with previouslyseparate models. The datasets came from paired-catchment studies that are known to be robust inquantifying and understanding water balance in catch-ments and the effects of land-use change. However, assuch studies are expensive, the complementary modellingframework linking plot-scale plantation production andwater balance to catchment-scale water discharge couldbecome an important tool for applying this knowledge toother catchments and regions. This approach enablesvirtual experiments examining the effects of vegetationtype (pasture and native forest) and management(harvesting, replanting, fertilizing, etc.) on water re-sources and provides essential information to improve thedecision-making processes in order to optimize woodproduction and water availability.Predictions of plantation growth at plot scale using
3-PG are useful, and species-specific growth parametersare required, as has been shown in other studies ofeucalypt plantations in Brazil and other countries (Stapeet al., 2003; Almeida et al., 2004a, b; Fontes et al., 2006;
Figure 11. Predicted (black line) and observed (red dots) stand volume (left), and map of predicted wood production before harvest at Ponta das CanasPE100 and PE30 catchments (right). The value 0 in the legend represents an unplanted area covered with native forest or grass
Table III. 3-PG-predicted water balance for the rotation cycle,from May 2005 to October 2012, at TE30 and from September
2007 to January 2014 at PE100.
TE30 PE100
mm % mm %
Precipitation (mm) 12 199 10 032Evapotranspiration 9732 79.8 8189 81.6Soil evaporation 1372 11.2 1477 14.7Transpiration 6030 49.4 5362 53.4Interception 2330 19.1 1350 13.5Drainage 2446 20.1 1846 18.4
4699EUCALYPT MANAGEMENT CATCHMENT WATER
Copyright © 2016 John Wiley & Sons, Ltd. Hydrol. Process. 30, 4687–4703 (2016)

Almeida and Sands, 2015). Spatial applications also havebeen used elsewhere (Coops and Waring, 2001; Tickleet al., 2001; Almeida et al., 2010; González-García et al.,2015), and the model is used for research and operationsby some forest plantation companies (Almeida et al.,2004b; Almeida et al., 2010). However, 3-PG integrationwith a hydrological model (TOPMODEL) allowspredictions of water balance at catchment scale that cantake account of different land-use and managementoptions. Results demonstrate that the model was able toadequately predict both growth and water balance whencompared with observed data of SV, soil moisture, anddischarge. We recognize that the pasture component ofthe model is simplistic and should be improved withexisting pasture growth models, e.g. as in APSIM orDAIRYMOD (Johnson et al., 2008; Holzworth et al.,2014). With the addition of crop models, 3-PGH couldbecome useful also in agroforestry contexts, as recentlycalled for by Luedeling et al. (2016).The nested paired-catchment design of TD adapted
from a previous catchment study required that theharvested proportion of the plantation was concentratedin the most up-stream section of the catchment. The un-nested paired-catchment design used in PC betterfacilitated the interpretation of results, as the catchmentswere independent of each other. However, harvesting inthe PC catchment coincided with a change from a periodof low-precipitation years to a high volume and intense-precipitation year that affected hydrology in all PCcatchments, and the effect of partial harvesting was lessclear than in the nested design. Intense precipitationsoccur with relative high frequency in this region (Zepkaet al., 2014) and need to be carefully considered in themodelling predictions and interpretation of dischargeaffected by these events.These results demonstrate that there are many factors
that influence discharge and water use by plantation and
pasture (Vanclay, 2009), such as precipitation distributionand intensity, age of plantation, LAI, stocking, soilcharacteristics, riparian zone vegetation, slope, andlitterfall, which need to be adequately considered andunderstood. Some of these factors can be influenced byhow plantations are managed, such as age distribution andharvesting proportion and location in the catchment, aswell as the vegetation characteristics and size of the APP.Soil water content increased after eucalypt harvesting
in both regions, but this period coincided with increasedprecipitation that produced a similar signal in pasturecatchments (TP and PP). Although SWC under pastureduring the dry years was higher than that underplantation, its increase after substantial rain was to levelssimilar to those under harvested plantation. There was anincrease in soil moisture over 2 years at TE100 afterharvest, relative to TP; however, part of the increase inboth catchments was due to increased precipitation.Despite establishment of the new plantation in June2013 in TE100 and in June 2014 in PE100 and PE30, soilmoisture still increased compared with the pre-harvestperiod. These results indicate that precipitation distribu-tion and intensity, and soil type, were more determinantof soil moisture content than vegetation or topographicposition.Data collected in the piezometers indicated that, despite
the harvest of TE100, PE100, and PE30, there was noevidence of large changes in the level of the groundwaterdirectly related to the harvesting as identified in one otherstudy in Brazil (Almeida et al., 2007; Smethurst et al.,2015). In the current study, values of groundwater riseafter eucalypt harvesting are less but quicker than thosefound in a study in the Aracruz catchment in the EspíritoSanto state on the east coast of Brazil. Althoughvariations in groundwater levels were not associated withharvesting at TD, levels at the bottom of the transectvaried in the range 1.8–2.5m despite this period
Figure 12. Simulated scenarios of discharge for harvest of 100% (P100), 75% (P75), 45% (P45), and 20% (P20) of the area of the plantation at PE100
4700 A. C. ALMEIDA ET AL.
Copyright © 2016 John Wiley & Sons, Ltd. Hydrol. Process. 30, 4687–4703 (2016)

coinciding with relatively low annual precipitation. At thestart of monitoring at this point, groundwater was closerto the surface, which occurred after 4 years of relativelyhigh precipitation. Higher up in the transect, groundwaterlevels were deeper (measured down to 13.4m) and alsoresponsive to precipitation over periods of severalmonths. At PC with about a 6-month delay, groundwaterlevels reflected the increase in SWC after harvesting andincreased precipitation, but absolute levels were highestin the pasture catchment, with no apparent effect ofincreased precipitation on water levels at the bottom ofthe transect, which was always relatively shallow.Overall, groundwater levels in this study did not provideclear insights into the links between discharge andvegetation, management, or precipitation.Our study showed that discharge was affected by
eucalypt harvesting, as has been shown in other studiesin South America (Iroumé et al., 2005; Ferraz et al.,2013). However, patterns of precipitation (duration andintensity) can have substantial effects on discharge thatwere evidenced here before and after the harvest ofTE100 in 2012 and at PE100 and PE30 in 2014. Thesepatterns of precipitation appeared to account for somechanges in flow at TD when comparing 2012 with 2013,as these years had relatively low and similar totalprecipitation (i.e. at least 2 years of lower-than-averageprecipitation), yet the pattern of precipitation in 2012included 3months of higher monthly values and manymonths of lower precipitation compared with 2013 thathad a more even distribution of monthly precipitation.Discharge was higher in 2013 than in 2012 and wasrestricted to the second half of 2013, which was afterseveral months of soil wetting up in 2013 and that of theprevious year following harvest. The 3-PGH modelworks on a daily time step for precipitation, which wasproven to incorporate an adequate level of precipitationintensity and distribution information for this type ofmodelling.Flow duration curves for the pasture catchment at TD
(TP) did not change at the time of harvest, and the curvechanged little in response to partial harvest (TE30).However, the curve for the 100% harvested catchment(TE100) showed a substantial increase in both high andlow flows. Hence, flow characteristics appear not to revertcompletely to the pastured condition after harvesting,which is probably due to the retention of forested cover inthe area of permanent preservation (APP) (approximately15% of catchment area) even after 100% harvesting of theplantation part of the TE100 catchment. Pasturedcatchments are also generally known to have lowerinfiltration rates associated with stock traffic (Greenwoodand McKenzie, 2001) causing soil compaction and loss ofstructure, increasing surface runoff with more likelihoodof soil erosion (van Dijk and Keenan, 2007).
The flow duration curves for the pasture catchment atPC (PP) changed at the time of harvest as effect ofprecipitation intensity, and the curve also had similarchange in response to partial harvest (PE30). The changeat PE30 has increased both low and high flowproportionally. However, the curve for the 100%harvested catchment (PE100) showed a marked increasealso in high and low flows. With this change, flowcharacteristics reverted almost completely closer to thepastured condition after harvesting, which may reflect thelow vigour of forest cover in much of the APP(approximately 15% of catchment area) at this site.Using the control (pasture) catchment to account for
precipitation effects on the discharge : precipitation ratioafter harvesting (which was 15% higher in TP), actualdischarge was 3.3 times higher in TE100 and 1.4 timeshigher in TE30 (with partial harvest). Hence, partialharvest (approximately 30%) had a similar proportionaleffect on discharge : precipitation ratio. In contrast, fullharvesting at PC (PE100) led to 2.2 times the increase inflow compared with that expected due to precipitationalone in the pasture catchment (PP), and partial harvesting(PE30) led to only 1.03 of the flows. Ferraz et al. (2013)suggested that a maximum 30% reduction in annualdischarge occurred in the Tinga catchment due toplantation growth (i.e. conversely a maximum 1.4-foldincrease due to harvesting), which is less than ourobservation for full harvesting in the TD and PCcatchments. However, the basis of the Ferraz et al.(2013) comparison is questionable, because discharge inthe year immediately after harvesting coincided with theyear of highest annual precipitation.The results of Smethurst et al. (2015) for a catchment
in Espírito Santo state in Brazil are also in contrast tocurrent results. In that catchment, plantation harvestinghad no effect on discharge or discharge : precipitationratios, despite a large response in groundwater levelsunder the harvested plantation. The lack of responsewas attributed to very low slope and very deep soilsunder the plantation with high capacity for waterstorage, and a wide and heavily forested area of deeproot native vegetation next to the stream. Together, thecurrent results and those of Smethurst et al. (2015) andFerraz et al. (2013) emphasize that plantation establish-ment and management links to catchment wateroutcomes can be very catchment specific, requiringquantitative integration of temporal and spatial compo-nents of water balance. This reinforces the need ofrobust modelling framework to adequately predict thewater availability and the uncertainties of generaliza-tions or application of empirical curves of water usebased on vegetation type.It is clear that discharge increases are not linearly
related to the proportion of plantation area harvested. To
4701EUCALYPT MANAGEMENT CATCHMENT WATER
Copyright © 2016 John Wiley & Sons, Ltd. Hydrol. Process. 30, 4687–4703 (2016)

better understand and quantify this relationship for thecurrent catchments, it would be useful to complete theresearch program for several more partial harvests andcomplete one whole plantation.Based on current results, it appears likely that frequent
partial harvesting (approximately two-yearly) will mod-erate the hydrological response compared with lessfrequent complete harvesting, i.e. a more even flowregime with fewer harvested- and regrowth-related highand low flows. However, the hydrological signal ofharvesting was not outside the range of daily, seasonal,and annual variability resulting from landscape andclimate variability. If an aim of a management is tominimize the hydrological response to plantation man-agement, or maintain low–medium flows, partial harvest-ing should be considered, but many factors will come intoplay that have not been studied, especially the value ofmoderating the hydrological response and the cost ofdoing so.
CONCLUSIONS
A paired and nested catchment study was effective forquantifying the impacts of plantation management inrelation to pasture, and it provided reliable informationfor validating linked forest and hydrological process-based models. Such a combination of observation andsimulation offers the opportunity to improve catchmentwater outcomes while increasing wood production.Catchments covered with pasture produced higher
discharge than the eucalypt catchments. That thisoccurred even after harvesting indicates that pasture soilsmight have lower water infiltration rates and higher andmore variable surface flow.The model developed and applied in this study is a tool
for testing scenarios of plantation management in diversecatchments or regions. Here, we simulated the effects ofclear cutting or partial harvesting on discharge thatincorporated climate variability impacts on plantationproductivity and water availability. Partial harvesting inthe study catchments moderated flow patterns, which wasadequately simulated by the linked models.
ACKNOWLEDGEMENTS
We thank CMPC Celulose Riograndense and staff forimplementing and maintaining the experimental catch-ments and datasets, andWalter Lídio Nunes for his supportin conducting this project. We thank Dave McJannet,Patrick Mitchell, and two anonymous reviewers forconstructive comments and suggestions on earlier draftsof the manuscript. Earlier model development wassupported by the CRC for Forestry, Australia.
REFERENCES
Almeida A, Soares J, Landsberg J, Rezende G. 2007. Growth and waterbalance of Eucalyptus grandis hybrid plantations in Brazil during arotation for pulp production. Forest Ecology and Management 251:10–21.
Almeida AC, Landsberg JJ, Sands PJ. 2004a. Parameterisation of 3-PGmodel for fast-growing Eucalyptus grandis plantations. Forest Ecologyand Management 193: 179–195.
Almeida AC, Landsberg JJ, Sands PJ, Ambrogi MS, Fonseca S, BarddalSM, Bertolucci FL. 2004b. Needs and opportunities for using a process-based productivity model as a practical tool in Eucalyptus plantations.Forest Ecology and Management 193: 167–177.
Almeida AC, Sands PJ. 2015. Improving the ability of 3-PG to model thewater balance of forest plantations in contrasting environments.Ecohydrology DOI:10.1002/eco.1661
Almeida AC, Siggins A, Batista TR, Beadle C, Fonseca S, Loos R. 2010.Mapping the effect of spatial and temporal variation in climate and soilson Eucalyptus plantation production with 3-PG, a process-based growthmodel. Forest Ecology and Management 259: 1730–1740.
Almeida AC, Soares JV. 2003. Comparação entre o uso de água emplantações de Eucaliptus grandis e floresta ombrófila densa (MataAtlântica) na costa leste do Brasil. Revista Árvore 27: 159–170.
Ambroise B, Beven K, Freer J. 1996. Toward a generalization of theTOPMODEL concepts: topographic indices of hydrological similarity.Water Resources Research 32: 2135–2145. DOI:10.1029/95WR03716
Beven K, Freer J. 2001. A dynamic TOPMODEL. Hydrological Processes15: 1993–2011.
Beven KJ, Kirkby MJ. 1979. A physically based, variable contributingarea model of basin hydrology/Un modèle à base physique de zoned'appel variable de l'hydrologie du bassin versant. HydrologicalSciences Bulletin 24: 43–69. DOI:10.1080/02626667909491834
Beverly C, Bari M, Christy B, Hocking M, Smettem K. 2005. Salinityimpacts from land use change; comparison between a rapid assessmentapproach and a detailed modelling framework. Australian Journal ofExperimental Agriculture 45: 1453–1469. DOI:10.1071/EA04192
Brown AE, Podger GM, Davidson AJ, Dowling TI, Zhang L. 2007.Predicting the impact of plantation forestry on water users at local andregional scales: an example for the Murrumbidgee River Basin,Australia. Forest Ecology and Management 251: 82–93.
Brown AE, Zhang L, McMahon TA, Western AW, Vertessy RA. 2005. Areview of paired catchment studies for determining changes in wateryield resulting from alterations in vegetation. Journal of Hydrology 310:28–61.
Coops NC, Waring RH. 2001. Assessing forest growth across southwest-ern Oregon under a range of current and future global change scenariosusing a process model, 3-PG. Global Change Biology 7: 15–29.
Costa AM, Curi N, Menezes MD, Araújo EF, Marques JJ. 2009.Levantamento detalhado de solos da microbacia hidrográfica do hortoflorestal Terra Dura (RS) e considerações sobre escalas de mapeamento.Ciencia e Agrotecnologia 33: 1272–1279.
Engel V, Jobbágy EG, Stieglitz M, Williams M, Jackson RB. 2005.Hydrological consequences of Eucalyptus afforestation in the ArgentinePampas. Water Resources Research 41: DOI:10.1029/2004WR003761
FarleyKA, JobbágyEG, JacksonRB. 2005. Effects of afforestation onwateryield: a global synthesis with implications for policy. Global ChangeBiology 11: 1565–1576. DOI:10.1111/j.1365-2486.2005.01011.x
Feikema P, Lane P, Beverly C, Baker T. 2009. Application of Macaqueand 3PG+ in CAT catchment-scale hydrological models: limitationsand opportunities. 18th World IMACS Congress and MODSIM09INternational Congress on Modelling and Simulation: Cairns, Australia.
Feikema PM, Beverly CR, Morris JD, Collopy JJ, Baker TG, Lane PNJ,Oxley L, Kulasiri D. 2007. Predicting the impacts of plantations oncatchment water balances using the 3PG forest growth model.Modelling and Simulation Society of Australia and New Zealand.
Feikema PM, Morris JD, Beverly CR, Collopy JJ, Baker TG, Lane PNJ.2010. Validation of plantation transpiration in south-eastern Australiaestimated using the 3PG+ forest growth model. Forest Ecology andManagement 260: 663–678.
Ferraz SFB, Lima WDP, Rodrigues CB. 2013. Managing forest plantationlandscapes for water conservation. Forest Ecology and Management301: 58–66.
4702 A. C. ALMEIDA ET AL.
Copyright © 2016 John Wiley & Sons, Ltd. Hydrol. Process. 30, 4687–4703 (2016)

Fontes L, Landsberg J, Tomé J, Tomé M, Pacheco CA, Soares P, AraujoC. 2006. Calibration and testing of a generalized process-based modelfor use in Portuguese Eucalyptus plantations. Canadian Journal ofForest Research 36: 3209–3221.
Forrester DI, Tang X. 2015. Analysing the spatial and temporal dynamicsof species interactions in mixed-species forests and the effects of standdensity using the 3-PG model. Ecological Modelling DOI:10.1016/j.ecolmodel.2015.07.010
González-García M, Almeida AC, Hevia A, Majada J, Beadle C. 2015.Application of a process-based model for predicting the productivity ofEucalyptus nitens bioenergy plantations in Spain. GCB BioenergyDOI:10.1111/gcbb.12256
Greenwood AJB, Benyon RG, Lane NJ. 2011. A method for assessing thehydrological impact of afforestation using mean annual data andempirical rainfall-runoff curves. Journal of Hydrology 411: 49–65.
Greenwood KL, McKenzie BM. 2001. Grazing effects on soil physicalproperties and the consequences for pastures: a review. Australian Journal ofExperimental Agriculture 41: 1231–1250. DOI:10.1071/EA00102
Holzworth DP, Huth NI, deVoil PG, Zurcher EJ, Herrmann NI, McLeanG, Chenu K, van Oosterom EJ, Snow V, Murphy C, Moore AD, BrownH, Whish JPM, Verrall S, Fainges J, Bell LW, Peake AS, Poulton PL,Hochman Z, Thorburn PJ, Gaydon DS, Dalgliesh NP, Rodriguez D,Cox H, Chapman S, Doherty A, Teixeira E, Sharp J, Cichota R, VogelerI, Li FY, Wang E, Hammer GL, Robertson MJ, Dimes JP, WhitbreadAM, Hunt J, van Rees H, McClelland T, Carberry PS, Hargreaves JNG,MacLeod N, McDonald C, Harsdorf J, Wedgwood S, Keating BA.2014. APSIM – evolution towards a new generation of agriculturalsystems simulation. Environmental Modelling & Software 62: 327–350.DOI:10.1016/j.envsoft.2014.07.009
Iroumé A, Huber A, Schulz K. 2005. Summer flows in experimentalcatchments with different forest covers, Chile. Journal of Hydrology300: 300–313. DOI:10.1016/j.jhydrol.2004.06.014
Jackson RBJ, Esteban G, Avissar R, Roy SB, Barrett DJ, Cook CW,Farley KA, le Maitre DC, McCarl BA, Murray BC. 2005. Trading waterfor carbon with biological carbon sequestration. Science 310:1944–1947. DOI:10.1126/science.1119282
Johnson IR, Chapman DF, Snow VO, Eckard RJ, Parsons AJ, LambertMG, Cullen BR. 2008. DairyMod and EcoMod: biophysical pasture-simulation models for Australia and New Zealand. Australian Journalof Experimental Agriculture 48: 621–631. DOI:10.1071/EA07133
Landsberg J, Sands P. 2010. Physiological ecology of forest production. InPrinciples, Processes and Models. Elsevier: London, 352 pp.
Landsberg JJ, Waring RH. 1997. A generalised model of forest productivityusing simplified concepts of radiation-use efficiency, carbon balance andpartitioning. Forest Ecology and Management 95: 209–228.
Lyne V, Hollick M. 1979. Stochastic timevariable rainfall-runoffmodelling, Proceedings of the Hydrology and Water ResourcesSymposium, Perth, 10-12 September, Institution of Engineers NationalConference Publication, No. 79/10, pp. 89–92.
Luedeling E, Smethurst PJ, Baudron F, Bayala J, Huth NI, van NoordwijkM, Ong CK, Mulia R, Lusiana B, Muthuri C, Sinclair FL. 2016. Field-scale modeling of tree–crop interactions: challenges and developmentneeds. Agricultural Systems 142 : 51–69. DOI:10.1016/j.agsy.2015.11.005
McVicar TR, Körner C. 2013. On the use of elevation, altitude, and heightin the ecological and climatological literature. Oecologia 171: 335–337.DOI:10.1007/s00442-012-2416-7
Nash JE, Sutcliffe JV. 1970. Riverflow forecasting through conceptualmodelspart I – a discussion of principles. Journal of Hydrology 10: 282–290.
Nosetto MD, Jobbágy EG, Paruelo JM. 2005. Land-use change and waterlosses: the case of grassland afforestation across a soil textural gradient incentral Argentina.Global Change Biology 11: 1101–1117. DOI:10.1111/j.1365-2486.2005.00975.x
Paydar Z, Gallant J. 2008. A catchment framework for one-dimensionalmodels: introducing FLUSH and its application. Hydrological Process-es 22: 2094–2104.
Peláez JJZ. 2014. Hidrologia comparativa em bacias hidrográficas comeucalipto e campo. PhD Thesis. In Centro de Ciências Rurais.Universidade Federal de Santa Maria: RS, Brazil, 156 pp.
Polglase PJ, Benyon RG. 2009. The impacts of plantations and nativeforests on water security: review and scientific assessment of regionalissues and research needs.pp: 72.
Pushpalatha R, Perrin C, Moine NL, Andréassian V. 2012. A review ofefficiency criteria suitable for evaluating low-flow simulations.Journal of Hydrology, 420–421: 171–182. DOI: 10.1016/j.jhydrol.2011.11.055.
Quinn P, Beven K, Chevallier P, Planchon O. 1991. The prediction ofhillslope flow paths for distributed hydrological modelling using digitalterrain models. Hydrological Processes 5: 59–79.
Ritter A, Muñoz-Carpena R. 2013. Performance evaluation of hydrolog-ical models: statistical significance for reducing subjectivity ingoodness-of-fit assessments. Journal of Hydrology 480: 33–45.DOI:10.1016/j.jhydrol.2012.12.004
Sands PJ, Landsberg JJ. 2002. Parameterisation of 3-PG for plantationgrown Eucalyptus globulus. Forest Ecology and Management 163:273–292.
Santos WJR, Curi N, Silva SHG, Araújo EF, Marques JJ. 2013.Pedotransfer functions for water retention in different soil classes fromthe center-southern Rio Grande do Sul State. Ciencia e Agrotecnologia37: 49–60.
Scott DF, Lesch W. 1997. Streamflow responses to afforestation withEucalyptus grandis and Pinus patula and to felling in the Mokobulaanexperimental catchments, South Africa. Journal of Hydrology 199:360–377.
Smethurst PJ, Almeida AC, Loos RA. 2015. Stream flow unaffected byEucalyptus plantation harvesting implicates water use by the nativeforest streamside reserve. Journal of Hydrology: Regional Studies 3:187–198. DOI:10.1016/j.ejrh.2014.11.002
Soares JV, Almeida AC. 2001. Modeling the water balance and soil waterfluxes in a fast growing Eucalyptus plantation in Brazil. Journal ofHydrology 253: 130–147.
Stape JL, Ryan MG, Binkley D. 2003. Testing the 3-PG process-basedmodel to simulate Eucalyptus growth with an objective approach to thesoil fertility rating parameter. Forest Ecology and Management 193:219–234. DOI:10.1016/j.foreco.2004.01.031
Tickle PK, Coops NC, Hafner SD, Team TBS. 2001. Assessing forestproductivity at local scales across a native eucalypt forest using aprocess model, 3PG-SPATIAL. Forest Ecology and Management 152:275–291.
van Dijk AIJM, Keenan RJ. 2007. Planted forests and water inperspective. Forest Ecology and Management 251: 1–9.
Vanclay JK. 2009. Managing water use from forest plantations. ForestEcology and Management 257: 385–389.
Wang E, Cresswell H, Paydar Z, Gallant J. 2008. Opportunities formanipulating catchment water balance by changing vegetation type on atopographic sequence: a simulation study. Hydrological Processes 22:736–749.
Whitehead D, Beadle CL. 2004. Physiological regulation of productivityand water use in Eucalyptus: a review. Forest Ecology andManagement 193: 113–140.
Zepka GS, Azambuja RR, Jr VRV, Saraiva ACV, Jr OP. 2014. Predictingheavy precipitation and lightning for a mesoscale convective systemcase over Southern Brazil.
Zhang L, Dawes WR, Walker GR. 2001. Response of mean annualevapotranspiration to vegetation changes at catchment scale. WaterResources Research 37: 701–708. DOI:10.1029/2000WR900325
4703EUCALYPT MANAGEMENT CATCHMENT WATER
Copyright © 2016 John Wiley & Sons, Ltd. Hydrol. Process. 30, 4687–4703 (2016)