,qfoxvlrq - public-health.uiowa.edu
TRANSCRIPT
2 0 2 0F A C U L T Y A N D S T A F FD I V E R S I T Y , E Q U I T Y , A N D I N C L U S I O NC A M P U S C L I M A T E S U R V E Y
Excellence Diversity, Equity, & Inclusionthrough

University of Iowa Faculty and StaffDiversity, Equity, and Inclusion Campus
Climate Survey
College of Public HealthOctober 2020
College of Public Health
ContentsExecutive Summary 1
Campus composition and survey respondents by identity 4
Value 8Q1: I feel valued as an individual at the University of Iowa . . . . . . . . . . . . . . . . . . . . . . . . . 9Reluctance 12Q6: I am reluctant to bring up issues that concern me for fear that it will affect my performanceevaluation or promotion . . . . . . . . . . . . . . . . . . . . . . . . . . . . . . . . . . . . . . . . . 13Experience Bias 15Q16: Ability or disability status . . . . . . . . . . . . . . . . . . . . . . . . . . . . . . . . . . . . . . . . . 19Q17: Age . . . . . . . . . . . . . . . . . . . . . . . . . . . . . . . . . . . . . . . . . . . . . . . . . . . . . 20Q18: Gender identity or gender expression . . . . . . . . . . . . . . . . . . . . . . . . . . . . . . . . . . 21Q19: Immigrant or international status or national origin . . . . . . . . . . . . . . . . . . . . . . . . . . 22Q20: Military or veteran status . . . . . . . . . . . . . . . . . . . . . . . . . . . . . . . . . . . . . . . . . 23Q21: Political opinions, beliefs, or ideology . . . . . . . . . . . . . . . . . . . . . . . . . . . . . . . . . . 24Q22: Racial or ethnic identity . . . . . . . . . . . . . . . . . . . . . . . . . . . . . . . . . . . . . . . . . . 25Q23: Religion . . . . . . . . . . . . . . . . . . . . . . . . . . . . . . . . . . . . . . . . . . . . . . . . . . . 26Q24: Sexual orientation . . . . . . . . . . . . . . . . . . . . . . . . . . . . . . . . . . . . . . . . . . . . . 27Bias Impact 28Q26: Eroded my confidence in my abilities . . . . . . . . . . . . . . . . . . . . . . . . . . . . . . . . . . 28Q27: Affected my physical health . . . . . . . . . . . . . . . . . . . . . . . . . . . . . . . . . . . . . . . 30Q28: Affected my mental health . . . . . . . . . . . . . . . . . . . . . . . . . . . . . . . . . . . . . . . . 32Q29: Caused me to consider leaving the University of Iowa . . . . . . . . . . . . . . . . . . . . . . . . 34Q30: Interfered with my work performance . . . . . . . . . . . . . . . . . . . . . . . . . . . . . . . . . 36Leaving UI 39Q32: In the past 12 months, I have seriously considered leaving the University of Iowa . . . . . . . . 39Reasons to Leave 43Q33 (if Yes to Q32): I have considered leaving due to: . . . . . . . . . . . . . . . . . . . . . . . . . . . . 44DEI Importance 48Q34: Achieving diversity, equity, and inclusion at the University of Iowa is personally important to me 48DEI Commitment 51Q52: The University of Iowa has a strong commitment to diversity, equity, and inclusion . . . . . . . 51Q53: My unit/department has a strong commitment to diversity, equity, and inclusion . . . . . . . . . 53Environment 56Q56: The University of Iowa provides an environment for the free and open expression of ideas,opinions, and beliefs . . . . . . . . . . . . . . . . . . . . . . . . . . . . . . . . . . . . . . . . . . . 56Satisfaction 59Q57: In the past 12months, howsatisfied have youbeenwith the overall campus climate/environmentthat you have experienced at the University of Iowa? . . . . . . . . . . . . . . . . . . . . . . . . . 59Unit Response Comparison 63Areas of Strength . . . . . . . . . . . . . . . . . . . . . . . . . . . . . . . . . . . . . . . . . . . . . . . . 64Q7: I have a voice in the decision-making process that affects the direction ofmy department/unit. 65NA . . . . . . . . . . . . . . . . . . . . . . . . . . . . . . . . . . . . . . . . . . . . . . . . . . . . . . 67
i

College of Public Health
Q54: There is too much emphasis put on issues of diversity, equity, and inclusion at the Univer-sity of Iowa. . . . . . . . . . . . . . . . . . . . . . . . . . . . . . . . . . . . . . . . . . . . . 69Areas of Growth . . . . . . . . . . . . . . . . . . . . . . . . . . . . . . . . . . . . . . . . . . . . . . . . . 71Q39: From religious affiliations other than Christian? . . . . . . . . . . . . . . . . . . . . . . . . . 72Q46: People of color? . . . . . . . . . . . . . . . . . . . . . . . . . . . . . . . . . . . . . . . . . . . 73Technical Notes 74
Acknowledgements 75
ii

College of Public Health
Executive SummaryOverviewFrom this report, we hope that colleges and units are able to benchmark themselves against the larger campus as well as consider where they need additional attention and what strengths to leverage.As is true with all data, this report is just a starting point. Addressing important findings is essential and will take intentional and sustained effort from your college or unit. This unit report should be used in conjunction with the overall Faculty and Staff 2020 Campus Climate data and Spring 2021 student climate data.Core QuestionsGiven departmental climate is the number one reason individuals on campus consider leaving the university, it is important to highlight results of questions connected to local culture. The ten core questions for the college and unit reports focus primarily on possible contributing factors to a sense of belonging, including if individuals feel valued, are satisfied, or have considered leaving. Unit reports also consider other cultural components that may be influencing an employee’s experience, such as ability to report issues, experiencing bias, the ability to openly express oneself, and the importance of and commitment to diversity, equity, and inclusion. Core questions include 1, 6, 16-30, 32-34, 52, 53, 56, 57, and several with notable results are presented below.Areas of Strength and Areas of GrowthIn addition to the analysis of the core questions, this report identifies up to three “Areas of Strength” and three “Areas of Growth” for your unit. These include survey items not in the set of core questions and highlight results more and less favorable as compared to the University as a whole.PartcipationThe Faculty and Staff Diversity, Equity, and Inclusion 2020 Campus Climate Survey was distributed to 382 individuals in the College of Public Health. The survey had a response rate of 38% with 144 surveys completed.
• 48 Faculty (73% response rate)• 3 Merit Staff (60% response rate)• 103 Professional and Scientific Staff (57% response rate)• 2 SEIU Staff (67% response rate)• 1 Postdoctoral Scholars (17% response rate)
1

College of Public Health
Findings: Core QuestionsQ1: I feel valued as an individual at the University of Iowa
Overall, 71% of College of Public Health respondents feel valued as individuals at the University ofIowa compared to the 80% of campus respondents. A lower percentage of faculty (87%) reportedfeeling valued as an individual than staff (95%).Q6: I am reluctant to bring up issues that concern me for fear that it will affect my performance evaluation orpromotion
Overall, 20% of College of Public Health respondents are reluctant to bring up issues compared to40% of campus respondents.Q16-24: Experience Bias: In the past 12 months, have you personally experienced biased, intimidating, or hos-tile treatment at the University of Iowa based on your...?
Overall, 5% of College of Public Health respondents indicated that they experienced at least oneform of bias. Faculty respondents reported highest percentages related to age (19%) and gender(14%). Staff respondents reported highest percentages related to gender (10%) and political beliefs(8%). At a closer look, 24% of respondents under 40 compared to 17% of respondents over 60 and5% of respondent ages 40-59 reported experiencing age-based biased treatment. About 15% ofwomen compared to 2% of men indicated gender-based biased treatment. About 20% of conser-vatives compared to 7% of liberals and 5% of moderates reported experiencing biased treatmentrelated to political beliefs.Impacts from the biased treatment experience that had the highest percentages of respondentsincludedmental health (100% of faculty, 80% of white respondents, 89% of women), eroding confi-dence (93% of faculty, 80% of women), and work performance (79% faculty). Although not one ofthe highest percentages overall, 93% of faculty indicated that the biased treatment they experiencecased them to consider leaving the University of Iowa.
Q32: In the past 12 months, I have seriously considered leaving the University of IowaOverall, 33% of College of Public Health respondents have seriously considered leaving in the past12 months compared to 41% of campus respondents. Notably, more than half of faculty (52%)have considered leaving. Career Advancement was the number one reason for staff (18%), faculty(18%), women (18%),men (18%), heterosexual (19%), ages 40-59 (19%), over 60 (19%), liberals (19%),and individuals identifying as non-religious (27%). Formoderates, location was the number reasonto consider leaving (23%).
Q34: Achieving diversity, equity, and inclusion at the University of Iowa is personally important to meOverall, 99% of College of Public Health respondents believe achieving diversity, equity, and in-clusion is personally important compared to 94% of campus respondents. Notably, 100% of re-spondents from every political orientation believe that achieving diversity, equity, and inclusion ispersonally important.
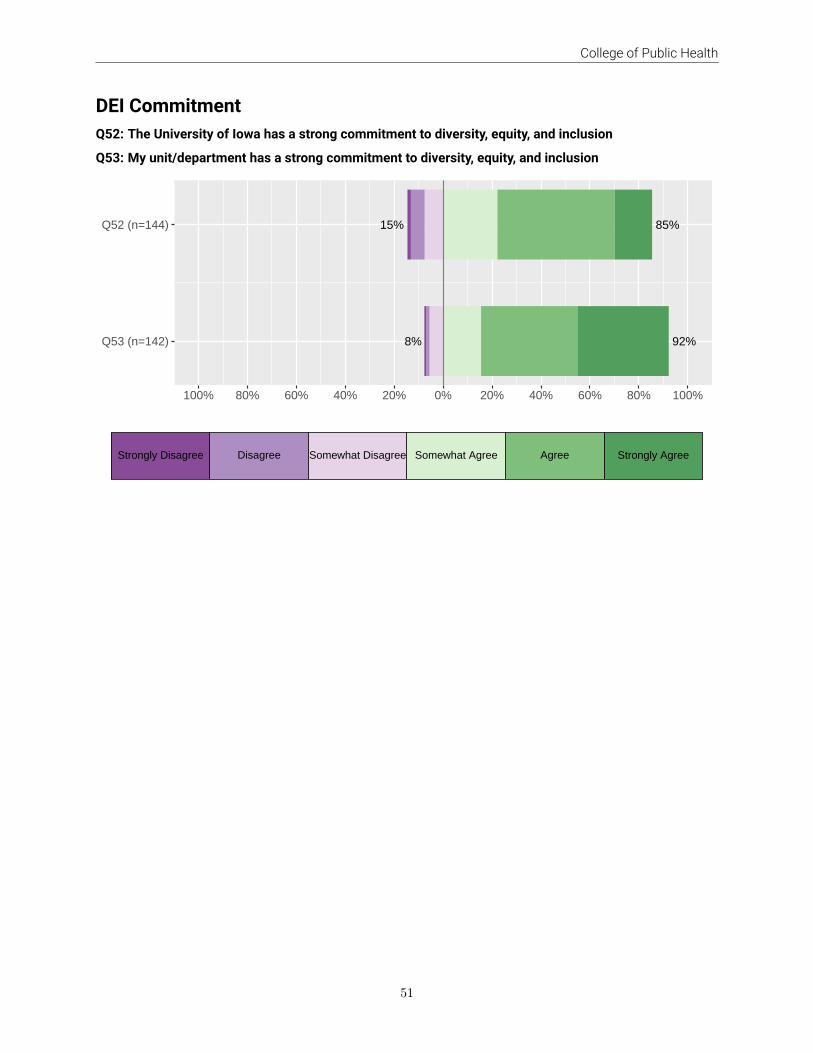
Q53: My unit/department has a strong commitment to diversity, equity, and inclusionOverall, 92% of College of Public Health respondents believe that their unit has a strong commit-ment to diversity, equity, and inclusion compared to 86% of campus respondents.
Findings: Areas of StrengthQ7: I have a voice in the decision-making process that affects the direction of my department/unit.
College of Public Health’s average response is distant from the average UI response. Additionally,your unit’s average response is the highest of the unit averages on campus regarding having avoice in the decision-making process that affects the direction of my unit.Q10: In comparison to my colleagues/co-workers, I have to work harder to have my ideas heard.
2

College of Public Health
College of Public Health’s average response is close to the average UI response. Additionally, yourunit’s average response is the lowest of the unit averages on campus regarding having to workharder to have ideas heard.Q54: There is too much emphasis put on issues of diversity, equity, and inclusion at the University of Iowa.
College of Public Health’s average response is close to the average UI response. Additionally, yourunit’s average response is among the lowest unit averages on campus indicating there is toomuchemphasis put on issues of diversity, equity, and inclusion.Findings: Areas of GrowthQ39: How would you rate the climate at the University of Iowa for people who identify as From religious affili-ations other than Christian?
College of Public Health’s average response is close to the average UI response. Additionally, yourunit’s average response is near the median unit averages on campus regarding the climate at theUniversity of Iowa for people who identity as from religious affiliations other than Christian.Q55: Attention to diversity, equity, and inclusion distracts us from achieving our academic mission.
College of Public Health’s average response is close to the average UI response. Additionally, yourunit’s average response is near the median unit averages on campus regarding the climate at theUniversity of Iowa for people who identity as people of color.In the area of growth and area of strength graphs, the average response of your unit relative to the UI reflectsthe overall experiences of people in your department. These graphs conceal how this experience differs bysocial identities and statues. To better understand how your areas of strength and growth vary in your unit,compare your area of growth and area of strength graphs disaggregated by social identity.
3
College of Public Health
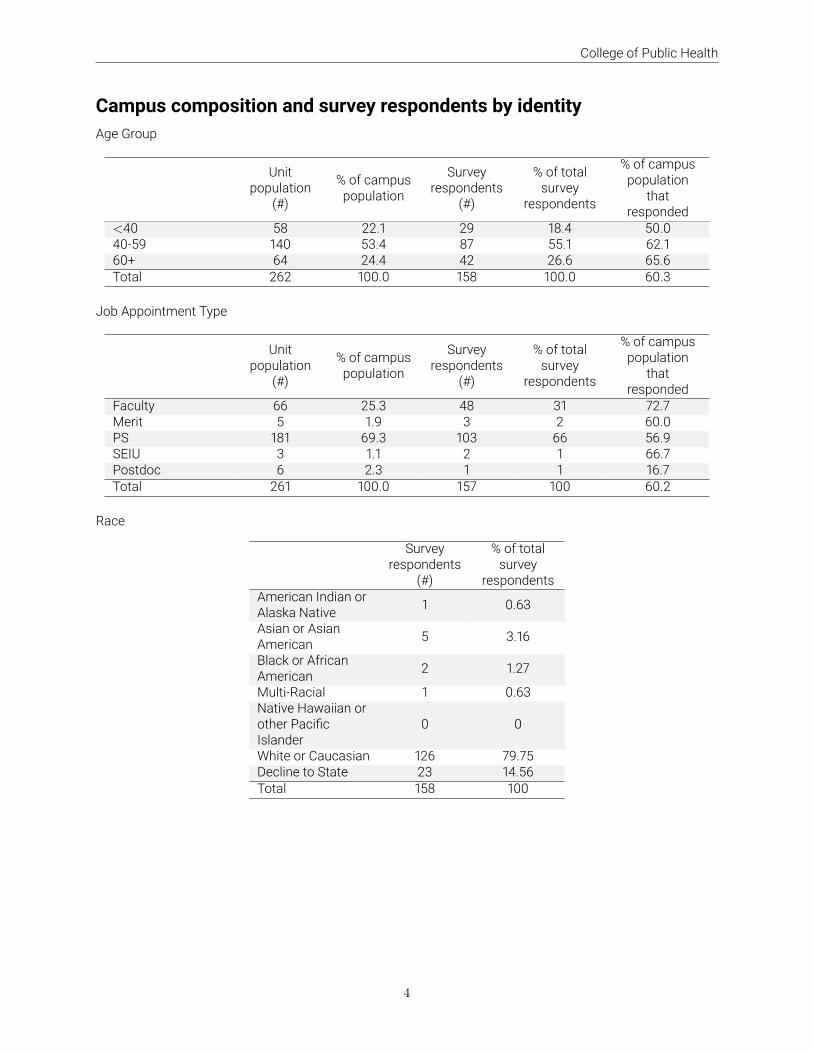
Campus composition and survey respondents by identityAge Group
Unitpopulation(#)% of campuspopulation
Surveyrespondents(#)% of totalsurveyrespondents
% of campuspopulationthatresponded<40 58 22.1 29 18.4 50.040-59 140 53.4 87 55.1 62.160+ 64 24.4 42 26.6 65.6Total 262 100.0 158 100.0 60.3
Job Appointment TypeUnitpopulation(#)
% of campuspopulationSurveyrespondents(#)
% of totalsurveyrespondents% of campuspopulationthatrespondedFaculty 66 25.3 48 31 72.7Merit 5 1.9 3 2 60.0PS 181 69.3 103 66 56.9SEIU 3 1.1 2 1 66.7Postdoc 6 2.3 1 1 16.7Total 261 100.0 157 100 60.2
RaceSurveyrespondents(#)
% of totalsurveyrespondentsAmerican Indian orAlaska Native 1 0.63Asian or AsianAmerican 5 3.16Black or AfricanAmerican 2 1.27Multi-Racial 1 0.63Native Hawaiian orother PacificIslander 0 0White or Caucasian 126 79.75Decline to State 23 14.56Total 158 100
4

College of Public Health
EthnicitySurveyrespondents(#)
% of totalsurveyrespondentsHispanic orLatino/a/x 1 0.6Not Hispanic orLatino/a/x 131 82.9Decline to State 26 16.5Total 158 100
GenderSurveyrespondents (#) % of total surveyrespondentsMan 48 30.38Woman 90 56.96Trans Man 0 0Trans Woman 0 0Genderqueer 0 0GenderNon-Conforming 0 0
Non-Binary 0 0Multi-Gender 1 0.63Decline to State 19 12.03Total 158 100Sexual Orientation or Identity
Surveyrespondents(#)% of totalsurveyrespondentsBisexual 2 1.3Gay or lesbian 2 1.3Heterosexual orstraight 129 81.6
Questioning 0 0Queer 1 0.6Decline to State 24 15.2Total 158 100
5

College of Public Health
Identity Having DisabilitySurveyrespondents (#) % of total surveyrespondentsNot Disabled 135 85.4Disabled 6 3.8Decline to State 17 10.8Total 158 100.0
Political OrientationSurveyrespondents(#)
% of totalsurveyrespondentsVery Liberal 23 14.6Liberal 50 31.6Slightly Liberal 24 15.2Moderate 23 14.6Slightly Conservative 5 3.2Conservative 5 3.2Very Conservative 0 0Decline to State 28 17.7Total 158 100Religion/Spiritual Affiliation
Surveyrespondents(#)% of totalsurveyrespondentsNo preference 18 11.4Agnostic/Atheist 28 17.7Buddhist 0 0Christian (e.g., Catholic,Protestant) 75 47.5
Hindu 0 0Jewish 2 1.3Muslim 1 0.6Spiritual (no specific religion) 10 6.3Decline to State 24 15.2Total 158 100
6
College of Public Health
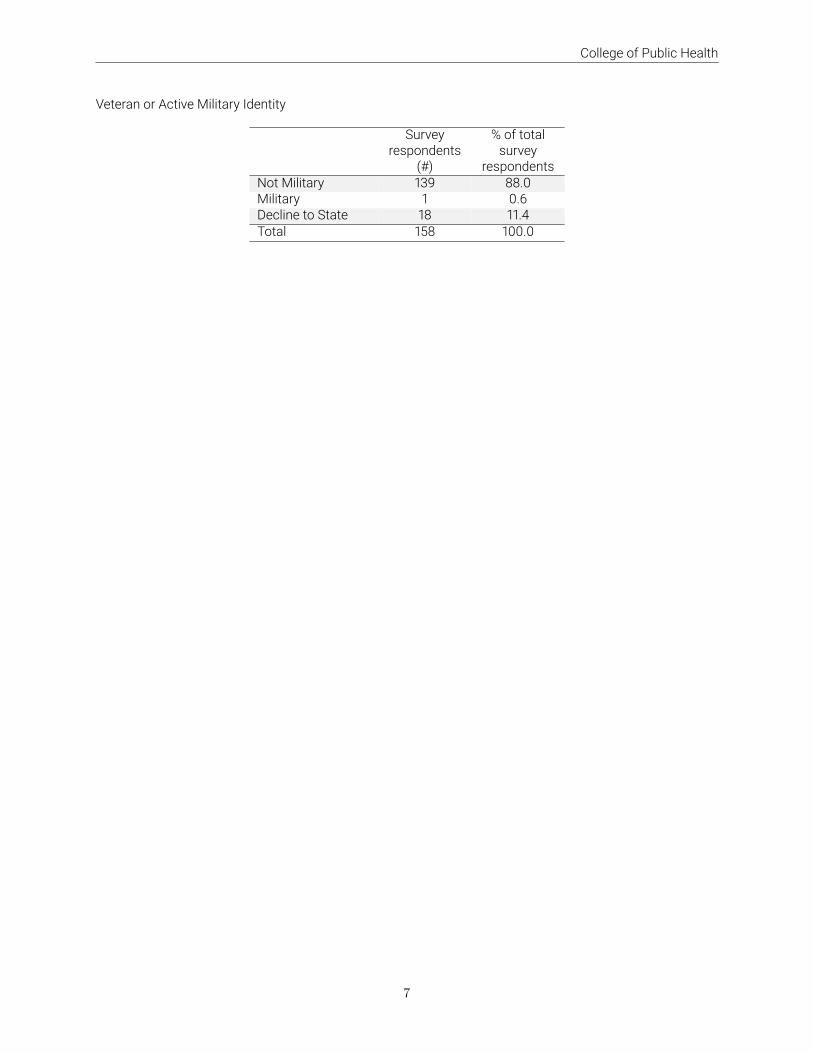
Veteran or Active Military IdentitySurveyrespondents(#)
% of totalsurveyrespondentsNot Military 139 88.0Military 1 0.6Decline to State 18 11.4Total 158 100.0
7

College of Public Health
ValueQ1: I feel valued as an individual at the University of Iowa
8% 93%Q1 (n=148)
100%80%60%40%20%0%20%40%60%80%100%
Strongly Disagree Disagree Somewhat Disagree Somewhat Agree Agree Strongly Agree
8

College of Public Health
Q1: I feel valued as an individual at the University of Iowa
Strongly Disagree Disagree Somewhat Disagree Somewhat Agree Agree Strongly Agree
Unit
UI
All Respondents
0 50 100
*** 4% 22% 51% 20%*** 7% 9% 28% 40% 11%
Faculty
Postdoc
Staff
Appointment Type
0 50 100
5% 8% 21% 42% 24%
< 10 Respondents
** ** 20% 56% 19%
60+
40−59
<40
Age
0 50 100
** 5% 22% 45% 25%
5% *** 18% 56% 18%
*** 32% 46% 18%
Asian
Latinx
Multi−Racial
URM
White
Race
0 50 100
< 10 Respondents
< 10 Respondents
< 10 Respondents
< 10 Respondents
* ** 21% 54% 21%
Response proportions less than 4% are displayed by asterisks with:“”=<1%, *=1%-2%, **=2%-3%, ***=3%-4%
9

College of Public Health
Q1: I feel valued as an individual at the University of Iowa
Strongly Disagree Disagree Somewhat Disagree Somewhat Agree Agree Strongly Agree
Man
TGNC
Woman
Gender
0 50 100
** 14% 55% 29%
< 10 Respondents
* 6% 22% 52% 20%
Heterosexual
LGBQ
Sexual Orientation
0 50 100
* *** 20% 53% 21%
< 10 Respondents
No
Yes
Disability Identity
0 50 100
* ** 21% 52% 23%
< 10 Respondents
Conservative
Liberal
Moderate
Political Orientation
0 50 100
10% 10% 70% 10%
4% 24% 52% 20%
14% 57% 29%
Response proportions less than 4% are displayed by asterisks with:“”=<1%, *=1%-2%, **=2%-3%, ***=3%-4%
10
College of Public Health
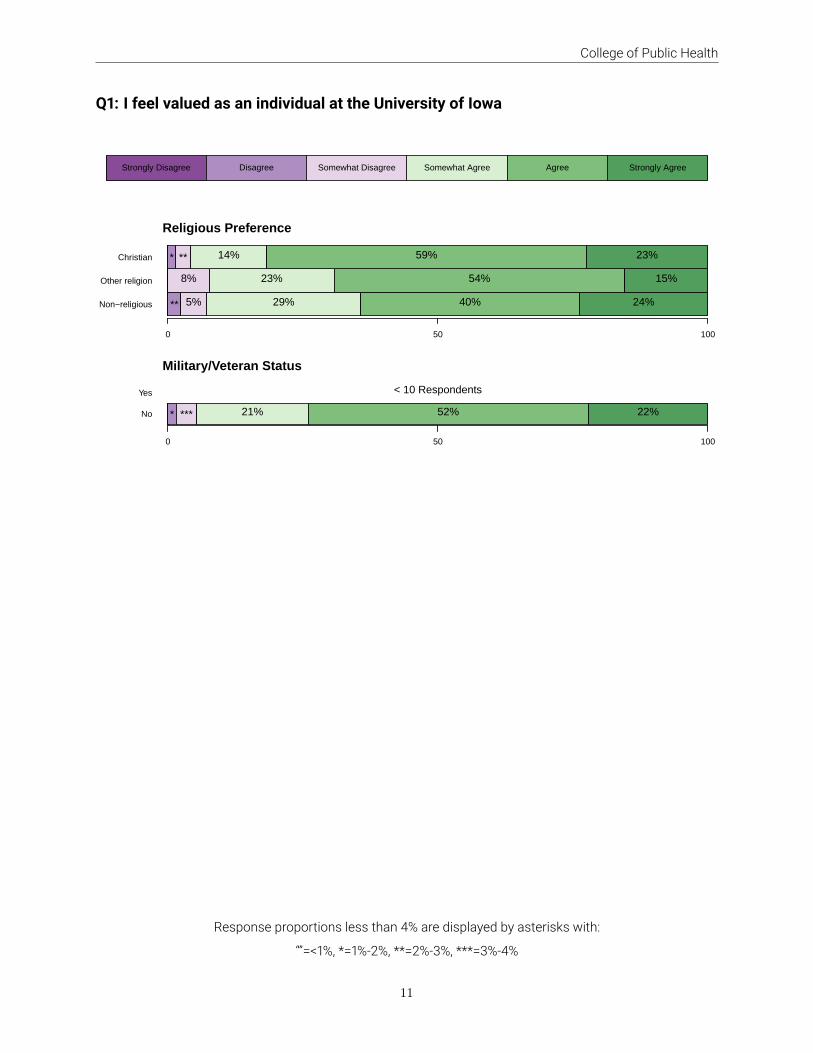
Q1: I feel valued as an individual at the University of Iowa
Strongly Disagree Disagree Somewhat Disagree Somewhat Agree Agree Strongly Agree
Non−religious
Other religion
Christian
Religious Preference
0 50 100
** 5% 29% 40% 24%
8% 23% 54% 15%
* ** 14% 59% 23%
No
Yes
Military/Veteran Status
0 50 100
* *** 21% 52% 22%
< 10 Respondents
Response proportions less than 4% are displayed by asterisks with:“”=<1%, *=1%-2%, **=2%-3%, ***=3%-4%
11

College of Public Health
ReluctanceQ6: I am reluctant to bring up issues that concern me for fear that it will affect my performance evaluationor promotion
80% 20%Q6 (n=158)
100%80%60%40%20%0%20%40%60%80%100%
Strongly Disagree Disagree Somewhat Disagree Somewhat Agree Agree Strongly Agree
*** The color scheme is flipped so that green corresponds to the more favorable response ***
12

College of Public Health
Q6: I am reluctant to bring up issues that concern me for fear that it will affect my per-formance evaluation or promotion
*** The color scheme is flipped so that green corresponds to the more favorable response ***Strongly Disagree Disagree Somewhat Disagree Somewhat Agree Agree Strongly Agree
Unit
UI
All Respondents
0 50 100
21% 45% 15% 11% 7% *
13% 32% 15% 22% 11% 7%
Faculty
Postdoc
Staff
Appointment Type
0 50 100
19% 31% 23% 12% 15%
< 10 Respondents
22% 50% 11% 11% *** *
60+
40−59
<40
Age
0 50 100
21% 43% 14% 10% 10% **
22% 40% 17% 14% 6% *
17% 62% 7% 7% 7%
Asian
Latinx
Multi−Racial
URM
White
Race
0 50 100
< 10 Respondents
< 10 Respondents
< 10 Respondents
< 10 Respondents
24% 47% 14% 9% 5%
Response proportions less than 4% are displayed by asterisks with:“”=<1%, *=1%-2%, **=2%-3%, ***=3%-4%
13

College of Public Health
Q6: I am reluctant to bring up issues that concern me for fear that it will affect my per-formance evaluation or promotion
*** The color scheme is flipped so that green corresponds to the more favorable response ***
Strongly Disagree Disagree Somewhat Disagree Somewhat Agree Agree Strongly Agree
Man
TGNC
Woman
Gender
0 50 100
27% 44% 15% 4% 8% **
< 10 Respondents
21% 49% 12% 11% 6% *
Heterosexual
LGBQ
Sexual Orientation
0 50 100
21% 48% 14% 9% 6% *
< 10 Respondents
Response proportions less than 4% are displayed by asterisks with:“”=<1%, *=1%-2%, **=2%-3%, ***=3%-4%
14

College of Public Health
Experience Bias: In the past 12 months, have you personally experiencedbiased, intimidating, or hostile treatment at the University of Iowa basedon your...?Q16: Ability or disability status
Q17: Age
Q18: Gender identity or gender expression
Q19: Immigrant or international status or national origin
Q20: Military or veteran status
Q21: Political opinions, beliefs, or ideology
Q22: Racial or ethnic identity
Q23: Religion
Q24: Sexual orientation
Q25: Socioeconomic Status or Social Class
15

College of Public Health
All Respondents
95% 5%Q16−Q25 (n=1385)
100%80%60%40%20%0%20%40%60%80%100%
Experienced At Least OneForm Of Bias
Did Not Experience Bias
Faculty
95%
100%
95%
96%
95%
100%
93%
86%
81%
98%
5%
5%
4%
5%
7%
14%
19%
2%
Q25 (n=43)
Q24 (n=43)
Q23 (n=43)
Q22 (n=44)
Q21 (n=43)
Q20 (n=43)
Q19 (n=43)
Q18 (n=44)
Q17 (n=43)
Q16 (n=43)
100%80%60%40%20%0%20%40%60%80%100%
16

College of Public Health
Staff
97%
98%
99%
97%
92%
100%
98%
90%
93%
97%
3%
2%
1%
3%
8%
2%
10%
7%
3%
Q25 (n=95)
Q24 (n=93)
Q23 (n=94)
Q22 (n=93)
Q21 (n=96)
Q20 (n=93)
Q19 (n=93)
Q18 (n=95)
Q17 (n=97)
Q16 (n=94)
100%80%60%40%20%0%20%40%60%80%100%
Postdoc
<10 respondents for this question
17

College of Public Health
Per
cent
20
40
60
80
100
No Yes
94%
6%
Faculty
No Yes
96%
4%
Staff
Postdoc not displayed due to small countsOf those who said yes to this question, what is the source?
Per
cent
20
40
60
80
100
Facu
lty o
r Ins
tructo
r
Other
Univ
ersit
y Em
ploye
e
Prefer
not
to Id
entify
Sou
rce
Stude
nt
36% 36%
14% 14%
Faculty
Facu
lty o
r Ins
tructo
r
Other
Univ
ersit
y Em
ploye
e
Prefer
not
to Id
entify
Sou
rce
Stude
nt
27%
49%
10%14%
Staff
Note: Respondents can check more than one, so the percentages add up to more than 100%.
18

College of Public Health
Q16: In the past 12 months, have you personally experienced biased, intimidating, orhostile treatment at the University of Iowa based on your Ability or disability status
<10 respondents for this question
19

College of Public Health
Q17: In the past 12 months, have you personally experienced biased, intimidating, orhostile treatment at the University of Iowa based on your Age
Per
cent
20
40
60
80
100
No Yes
76%
24%
<40
No Yes
95%
5%
40−59
No Yes
83%
17%
60+
Of those who said yes to this question, what is the source?
Per
cent
20
40
60
80
100
Facu
lty o
r Ins
tructo
r
Other
Univ
ersit
y Em
ploye
e
Prefer
not
to Id
entify
Sou
rce
Stude
nt
29%
43%
14% 14%
<40
Facu
lty o
r Ins
tructo
r
Other
Univ
ersit
y Em
ploye
e
Prefer
not
to Id
entify
Sou
rce
Stude
nt
0%
75%
0%
25%
40−59
Facu
lty o
r Ins
tructo
r
Other
Univ
ersit
y Em
ploye
e
Prefer
not
to Id
entify
Sou
rce
Stude
nt
43%
14%
43%
0%
60+
Note: Respondents can check more than one, so the percentages add up to more than 100%.
20

College of Public Health
Q18: In the past 12 months, have you personally experienced biased, intimidating, orhostile treatment at the University of Iowa based on your Gender identity or gender ex-pression
Per
cent
20
40
60
80
100
No Yes
98%
2%
Man
No Yes
85%
15%
Woman
TGNC not displayed due to small countsOf those who said yes to this question, what is the source?
Per
cent
20
40
60
80
100
Facu
lty o
r Ins
tructo
r
Other
Univ
ersit
y Em
ploye
e
Prefer
not
to Id
entify
Sou
rce
Stude
nt
0%
100%
0% 0%
Man
Facu
lty o
r Ins
tructo
r
Other
Univ
ersit
y Em
ploye
e
Prefer
not
to Id
entify
Sou
rce
Stude
nt
47%40%
7% 7%
Woman
Note: Respondents can check more than one, so the percentages add up to more than 100%.
21

College of Public Health
Q19: In the past 12months, have you personally experienced biased, intimidating, or hos-tile treatment at the University of Iowa based on your Immigrant or international statusor national origin
<10 respondents for this question
22

College of Public Health
Q20: In the past 12 months, have you personally experienced biased, intimidating, orhostile treatment at the University of Iowa based on your Military or veteran status
<10 respondents for this question
23

College of Public Health
Q21: In the past 12 months, have you personally experienced biased, intimidating, orhostile treatment at the University of Iowa based on your Political opinions, beliefs, orideology
Per
cent
20
40
60
80
100
No Yes
80%
20%
Conservative
No Yes
93%
7%
Liberal
No Yes
95%
5%
Moderate or middle of the road
Of those who said yes to this question, what is the source?
Per
cent
20
40
60
80
100
Facu
lty o
r Ins
tructo
r
Other
Univ
ersit
y Em
ploye
e
Stude
nt
25%
50%
25%
Conservative
Facu
lty o
r Ins
tructo
r
Other
Univ
ersit
y Em
ploye
e
Stude
nt
67%
33%
0%
Liberal
Facu
lty o
r Ins
tructo
r
Other
Univ
ersit
y Em
ploye
e
Stude
nt
50% 50%
0%
Moderate or middle of the road
Note: Respondents can check more than one, so the percentages add up to more than 100%.
24

College of Public Health
Q22: In the past 12 months, have you personally experienced biased, intimidating, orhostile treatment at the University of Iowa based on your Racial or ethnic identity
<10 respondents for this question
25
College of Public Health
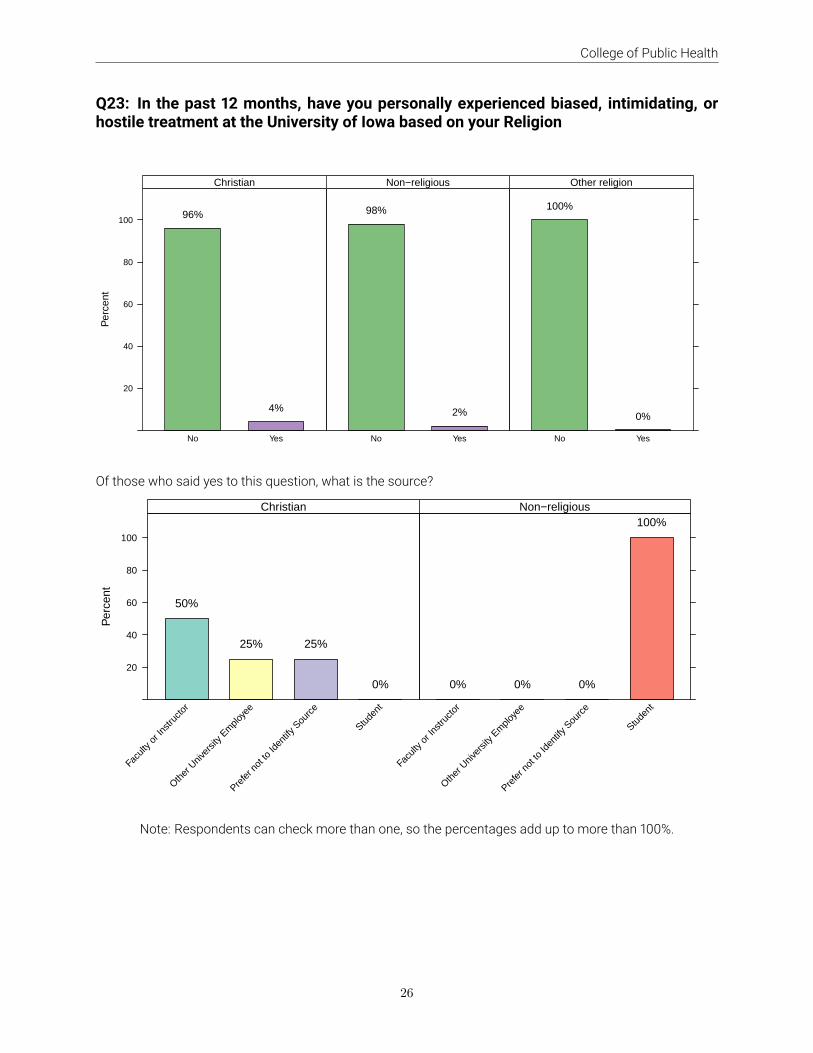
Q23: In the past 12 months, have you personally experienced biased, intimidating, orhostile treatment at the University of Iowa based on your Religion
Per
cent
20
40
60
80
100
No Yes
96%
4%
Christian
No Yes
98%
2%
Non−religious
No Yes
100%
0%
Other religion
Of those who said yes to this question, what is the source?
Per
cent
20
40
60
80
100
Facu
lty o
r Ins
tructo
r
Other
Univ
ersit
y Em
ploye
e
Prefer
not
to Id
entify
Sou
rce
Stude
nt
50%
25% 25%
0%
Christian
Facu
lty o
r Ins
tructo
r
Other
Univ
ersit
y Em
ploye
e
Prefer
not
to Id
entify
Sou
rce
Stude
nt
0% 0% 0%
100%Non−religious
Note: Respondents can check more than one, so the percentages add up to more than 100%.
26

College of Public Health
Q24: In the past 12 months, have you personally experienced biased, intimidating, orhostile treatment at the University of Iowa based on your Sexual orientation
<10 respondents for this question
27

College of Public Health
Bias Impact: During the past 12 months, to what extent has the biased,intimidating, or hostile treatment that you experienced impacted you inthe following areas:Q26: Eroded my confidence in my abilities
Q27: Affected my physical health
Q28: Affected my mental health
Q29: Caused me to consider leaving the University of Iowa
Q30: Interfered with my work performance
25%
30%
35%
38%
65%
75%
70%
65%
62%
35%
Q30
Q29
Q28
Q27
Q26
100 50 0 50 100Percentage
Not at all
To a very small extent
To a small extent
To a moderate extent
To a large extent
To a very large extent
28

College of Public Health
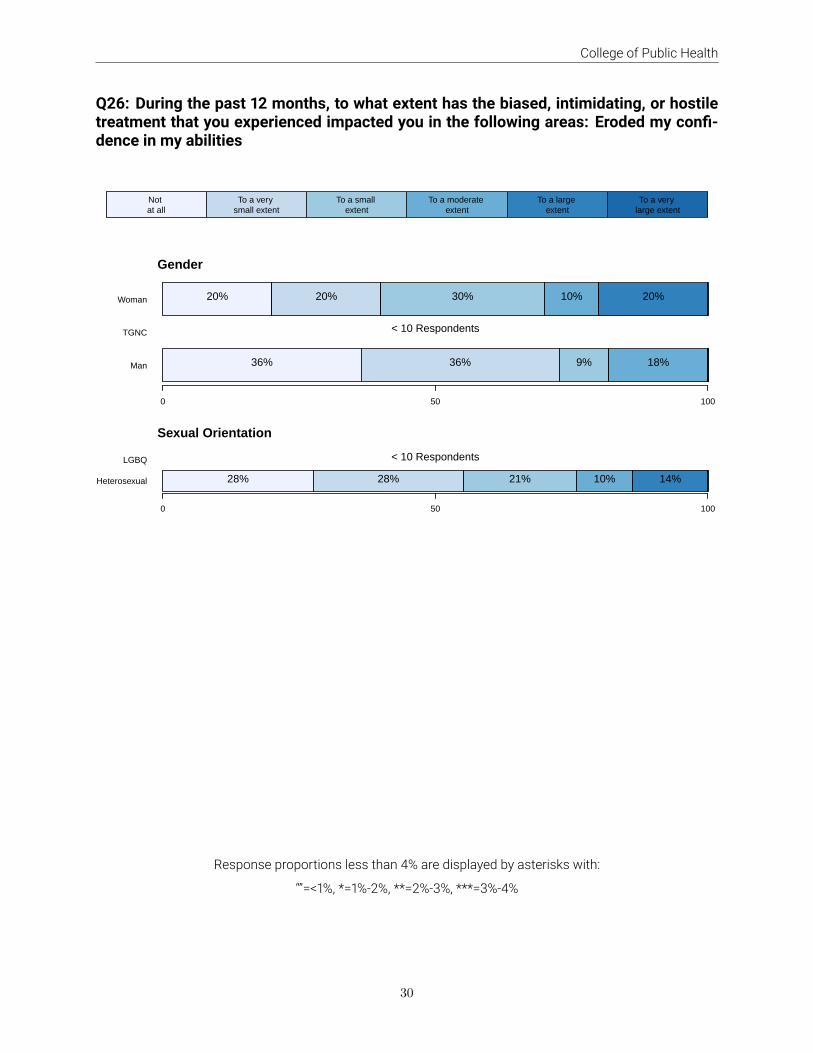
Q26: During the past 12 months, to what extent has the biased, intimidating, or hostiletreatment that you experienced impacted you in the following areas: Eroded my confi-dence in my abilities
Not at all
To a very small extent
To a small extent
To a moderate extent
To a large extent
To a very large extent
Unit
UI
All Respondents
0 50 100
30% 22% 22% 11% 14% **
32% 14% 18% 17% 11% 7%
Faculty
Postdoc
Staff
Appointment Type
0 50 100
7% 14% 29% 14% 36%
< 10 Respondents
45% 27% 14% 9% 5%
60+
40−59
<40
Age
0 50 100
< 10 Respondents
33% 19% 19% 10% 14% 5%
< 10 Respondents
Asian
Latinx
Multi−Racial
URM
White
Race
0 50 100
< 10 Respondents
< 10 Respondents
< 10 Respondents
< 10 Respondents
32% 28% 20% 8% 12%
Response proportions less than 4% are displayed by asterisks with:“”=<1%, *=1%-2%, **=2%-3%, ***=3%-4%
29
College of Public Health
Q26: During the past 12 months, to what extent has the biased, intimidating, or hostiletreatment that you experienced impacted you in the following areas: Eroded my confi-dence in my abilities
Not at all
To a very small extent
To a small extent
To a moderate extent
To a large extent
To a very large extent
Man
TGNC
Woman
Gender
0 50 100
36% 36% 9% 18%
< 10 Respondents
20% 20% 30% 10% 20%
Heterosexual
LGBQ
Sexual Orientation
0 50 100
28% 28% 21% 10% 14%
< 10 Respondents
Response proportions less than 4% are displayed by asterisks with:“”=<1%, *=1%-2%, **=2%-3%, ***=3%-4%
30

College of Public Health
Q27: During the past 12 months, to what extent has the biased, intimidating, or hostiletreatment that you experienced impacted you in the following areas: Affected my phys-ical health
Not at all
To a very small extent
To a small extent
To a moderate extent
To a large extent
To a very large extent
Unit
UI
All Respondents
0 50 100
65% 8% 8% 14% ** **
49% 12% 14% 12% 7% 6%
Faculty
Postdoc
Staff
Appointment Type
0 50 100
29% 21% 21% 14% 7% 7%
< 10 Respondents
86% 14%
60+
40−59
<40
Age
0 50 100
< 10 Respondents
67% 14% 5% 10% 5%
< 10 Respondents
Asian
Latinx
Multi−Racial
URM
White
Race
0 50 100
< 10 Respondents
< 10 Respondents
< 10 Respondents
< 10 Respondents
80% 4% 12% 4%
Response proportions less than 4% are displayed by asterisks with:“”=<1%, *=1%-2%, **=2%-3%, ***=3%-4%
31

College of Public Health
Q27: During the past 12 months, to what extent has the biased, intimidating, or hostiletreatment that you experienced impacted you in the following areas: Affected my phys-ical health
Not at all
To a very small extent
To a small extent
To a moderate extent
To a large extent
To a very large extent
Man
TGNC
Woman
Gender
0 50 100
64% 9% 18% 9%
< 10 Respondents
70% 5% 10% 10% 5%
Heterosexual
LGBQ
Sexual Orientation
0 50 100
72% *** 7% 14% ***
< 10 Respondents
Response proportions less than 4% are displayed by asterisks with:“”=<1%, *=1%-2%, **=2%-3%, ***=3%-4%
32

College of Public Health
Q28: During the past 12 months, to what extent has the biased, intimidating, or hostiletreatment that you experienced impacted you in the following areas: Affectedmymentalhealth
Not at all
To a very small extent
To a small extent
To a moderate extent
To a large extent
To a very large extent
Unit
UI
All Respondents
0 50 100
25% 31% 17% 17% 11%26% 17% 18% 18% 12% 10%
Faculty
Postdoc
Staff
Appointment Type
0 50 100
23% 23% 38% 15%
< 10 Respondents
41% 32% 14% 5% 9%
60+
40−59
<40
Age
0 50 100
< 10 Respondents
33% 24% 14% 14% 14%
< 10 Respondents
Asian
Latinx
Multi−Racial
URM
White
Race
0 50 100
< 10 Respondents
< 10 Respondents
< 10 Respondents
< 10 Respondents
21% 38% 17% 21% 4%
Response proportions less than 4% are displayed by asterisks with:“”=<1%, *=1%-2%, **=2%-3%, ***=3%-4%
33
College of Public Health
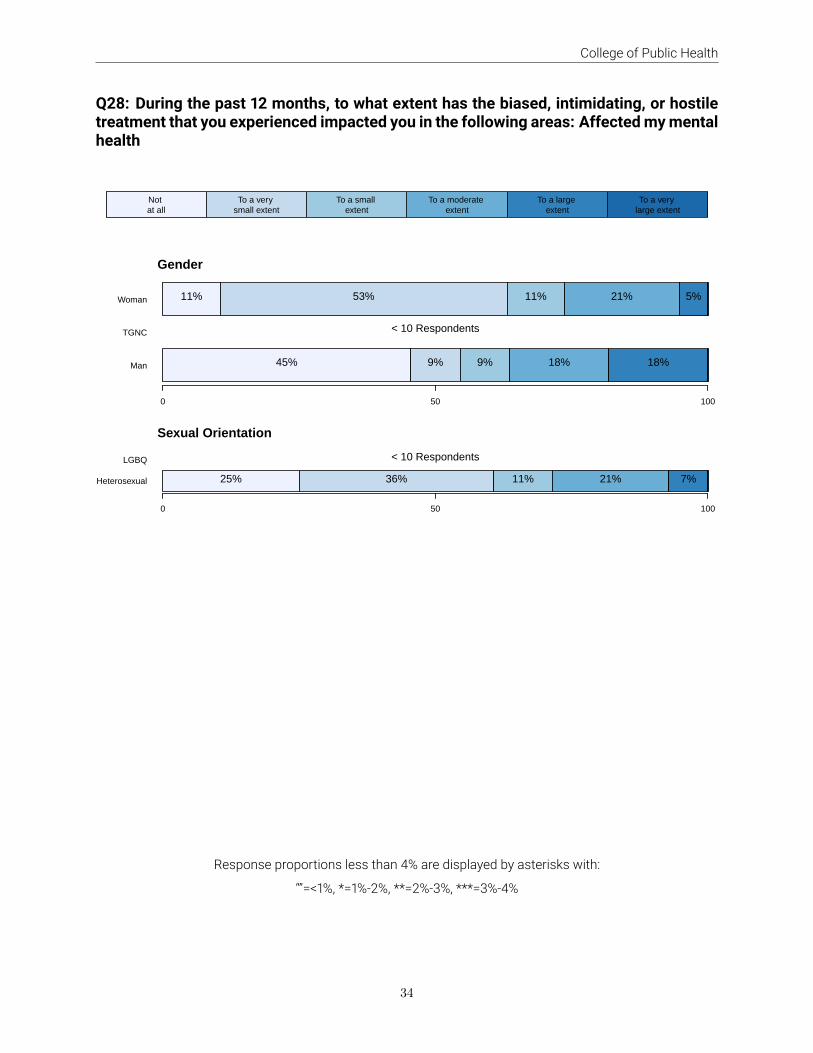
Q28: During the past 12 months, to what extent has the biased, intimidating, or hostiletreatment that you experienced impacted you in the following areas: Affectedmymentalhealth
Not at all
To a very small extent
To a small extent
To a moderate extent
To a large extent
To a very large extent
Man
TGNC
Woman
Gender
0 50 100
45% 9% 9% 18% 18%
< 10 Respondents
11% 53% 11% 21% 5%
Heterosexual
LGBQ
Sexual Orientation
0 50 100
25% 36% 11% 21% 7%
< 10 Respondents
Response proportions less than 4% are displayed by asterisks with:“”=<1%, *=1%-2%, **=2%-3%, ***=3%-4%
34

College of Public Health
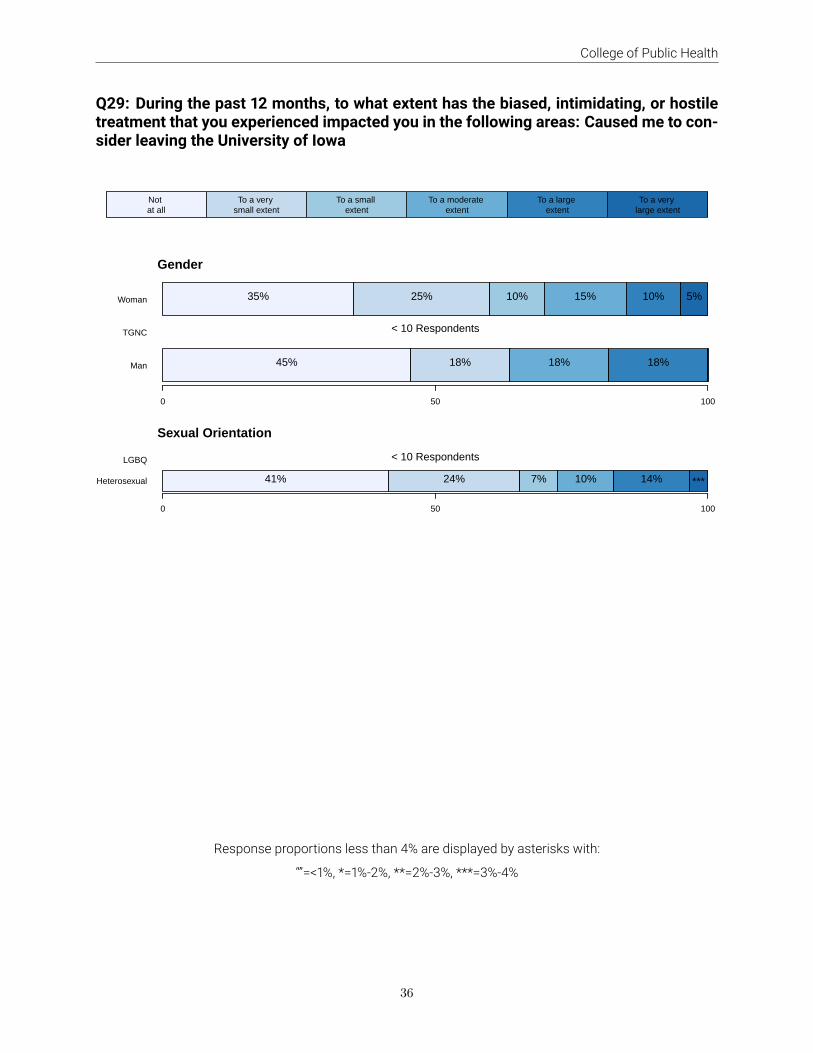
Q29: During the past 12 months, to what extent has the biased, intimidating, or hostiletreatment that you experienced impacted you in the following areas: Caused me to con-sider leaving the University of Iowa
Not at all
To a very small extent
To a small extent
To a moderate extent
To a large extent
To a very large extent
Unit
UI
All Respondents
0 50 100
38% 19% 8% 16% 16% **
31% 13% 11% 14% 12% 19%
Faculty
Postdoc
Staff
Appointment Type
0 50 100
7% 14% 14% 29% 29% 7%
< 10 Respondents
55% 23% 5% 9% 9%
60+
40−59
<40
Age
0 50 100
< 10 Respondents
38% 19% 5% 24% 14%
< 10 Respondents
Asian
Latinx
Multi−Racial
URM
White
Race
0 50 100
< 10 Respondents
< 10 Respondents
< 10 Respondents
< 10 Respondents
44% 24% 8% 12% 8% 4%
Response proportions less than 4% are displayed by asterisks with:“”=<1%, *=1%-2%, **=2%-3%, ***=3%-4%
35
College of Public Health
Q29: During the past 12 months, to what extent has the biased, intimidating, or hostiletreatment that you experienced impacted you in the following areas: Caused me to con-sider leaving the University of Iowa
Not at all
To a very small extent
To a small extent
To a moderate extent
To a large extent
To a very large extent
Man
TGNC
Woman
Gender
0 50 100
45% 18% 18% 18%
< 10 Respondents
35% 25% 10% 15% 10% 5%
Heterosexual
LGBQ
Sexual Orientation
0 50 100
41% 24% 7% 10% 14% ***
< 10 Respondents
Response proportions less than 4% are displayed by asterisks with:“”=<1%, *=1%-2%, **=2%-3%, ***=3%-4%
36

College of Public Health
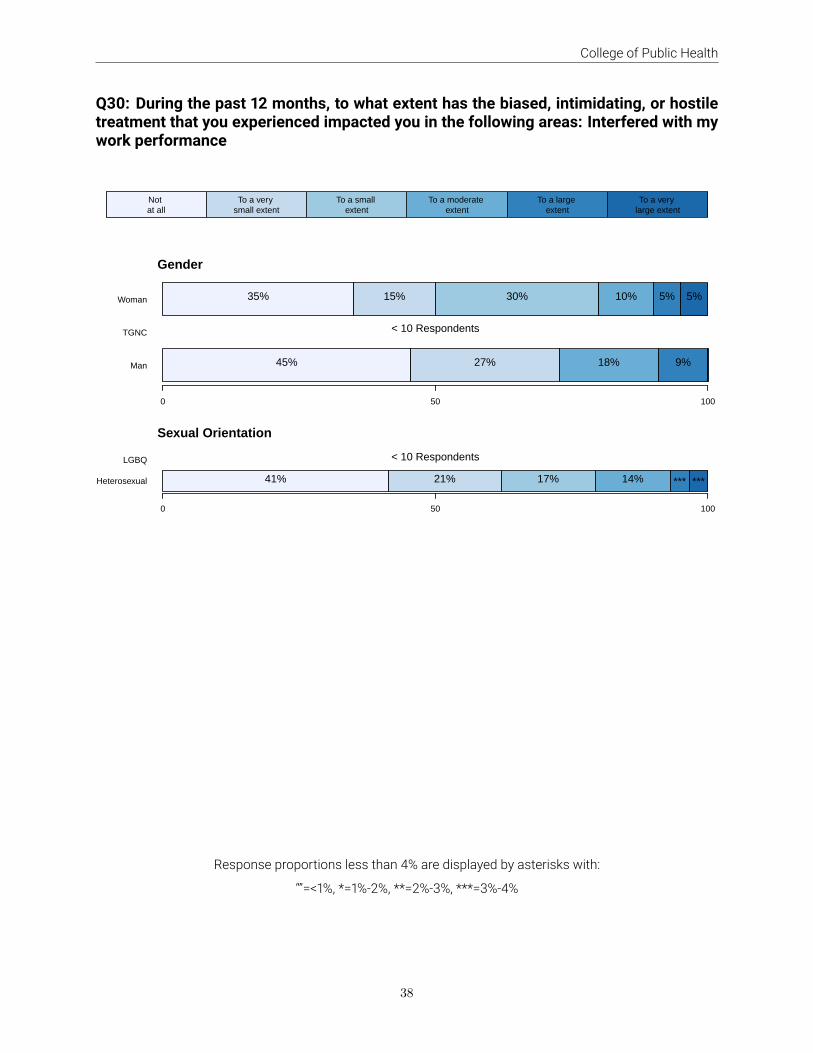
Q30: During the past 12 months, to what extent has the biased, intimidating, or hostiletreatment that you experienced impacted you in the following areas: Interfered with mywork performance
Not at all
To a very small extent
To a small extent
To a moderate extent
To a large extent
To a very large extent
Unit
UI
All Respondents
0 50 100
35% 22% 19% 11% 11% **
34% 17% 16% 15% 10% 9%
Faculty
Postdoc
Staff
Appointment Type
0 50 100
21% 14% 14% 21% 21% 7%
< 10 Respondents
45% 23% 23% 5% 5%
60+
40−59
<40
Age
0 50 100
< 10 Respondents
29% 24% 19% 10% 19%
< 10 Respondents
Asian
Latinx
Multi−Racial
URM
White
Race
0 50 100
< 10 Respondents
< 10 Respondents
< 10 Respondents
< 10 Respondents
36% 28% 20% 12% 4%
Response proportions less than 4% are displayed by asterisks with:“”=<1%, *=1%-2%, **=2%-3%, ***=3%-4%
37
College of Public Health
Q30: During the past 12 months, to what extent has the biased, intimidating, or hostiletreatment that you experienced impacted you in the following areas: Interfered with mywork performance
Not at all
To a very small extent
To a small extent
To a moderate extent
To a large extent
To a very large extent
Man
TGNC
Woman
Gender
0 50 100
45% 27% 18% 9%
< 10 Respondents
35% 15% 30% 10% 5% 5%
Heterosexual
LGBQ
Sexual Orientation
0 50 100
41% 21% 17% 14% *** ***
< 10 Respondents
Response proportions less than 4% are displayed by asterisks with:“”=<1%, *=1%-2%, **=2%-3%, ***=3%-4%
38

College of Public Health
Leaving UIQ32: In the past 12 months, I have seriously considered leaving the University of Iowa
67% 33%Q32 (n=150)
100%80%60%40%20%0%20%40%60%80%100%
No Yes
39

College of Public Health
Q32: In the past 12 months, I have seriously considered leaving the University of Iowa
No Yes
Unit
UI
All Respondents
0 50 100
67% 33%59% 41%
Faculty
Postdoc
Staff
Appointment Type
0 50 100
48% 52%
< 10 Respondents
76% 24%
60+
40−59
<40
Age
0 50 100
76% 24%
68% 32%
52% 48%
Asian
Latinx
Multi−Racial
URM
White
Race
0 50 100
< 10 Respondents
< 10 Respondents
< 10 Respondents
< 10 Respondents
70% 30%
40
College of Public Health
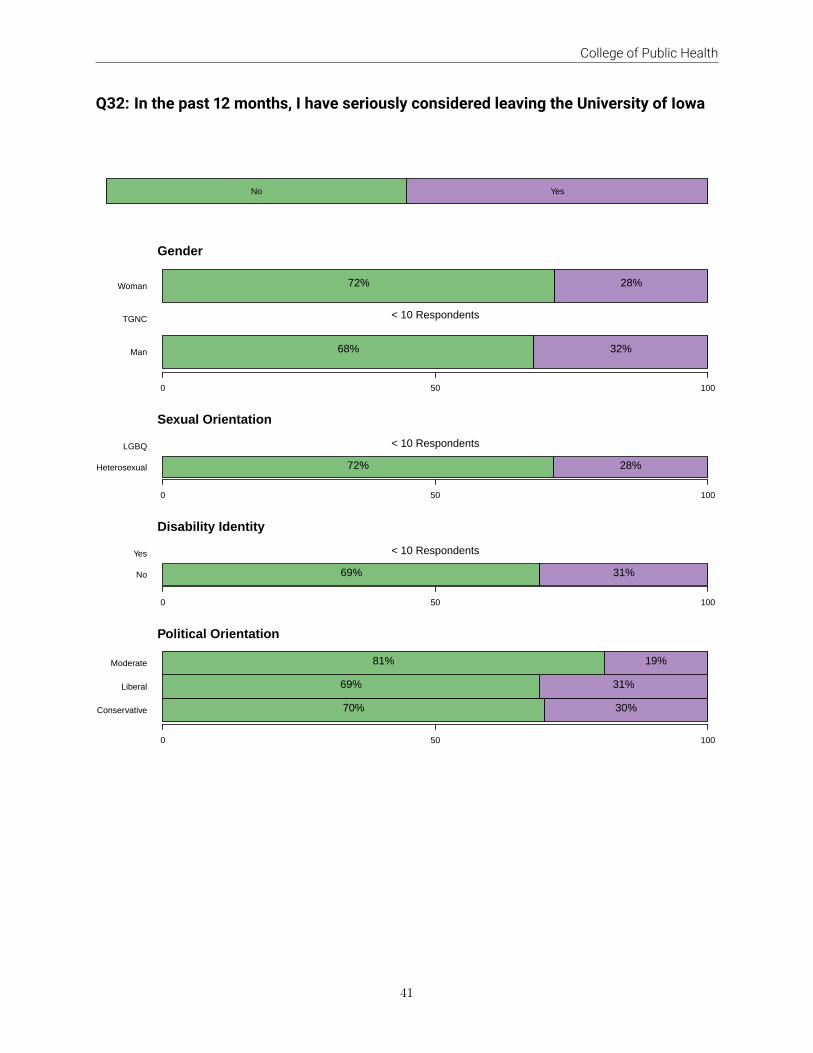
Q32: In the past 12 months, I have seriously considered leaving the University of Iowa
No Yes
Man
TGNC
Woman
Gender
0 50 100
68% 32%
< 10 Respondents
72% 28%
Heterosexual
LGBQ
Sexual Orientation
0 50 100
72% 28%
< 10 Respondents
No
Yes
Disability Identity
0 50 100
69% 31%
< 10 Respondents
Conservative
Liberal
Moderate
Political Orientation
0 50 100
70% 30%
69% 31%
81% 19%
41
College of Public Health
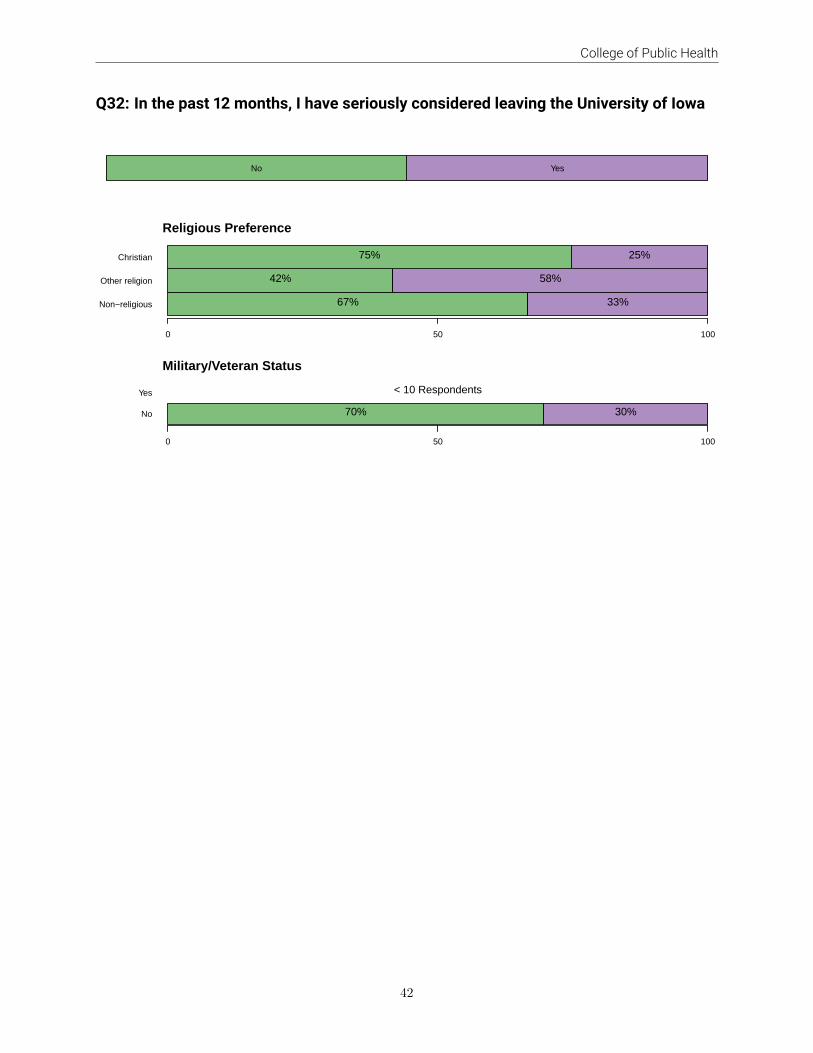
Q32: In the past 12 months, I have seriously considered leaving the University of Iowa
No Yes
Non−religious
Other religion
Christian
Religious Preference
0 50 100
67% 33%
42% 58%
75% 25%
No
Yes
Military/Veteran Status
0 50 100
70% 30%
< 10 Respondents
42
College of Public Health
Reasons to LeaveQ33 (if Yes to Q32): I have considered leaving due to:
Those who answered “Yes” to Q32 are prompted with follow-up questions to understand their motives forleaving. The following graphics display the proportions of each reason given by a demographic. The coloringscheme allows the reader to quickly evaluate areas of concern based on higher reporting percentage withina group. The reasons for leaving are abbreviated to save space and are defined as follows:Bias - Bias against individuals like meCampus - Campus climate/cultureCareer - Career advancement opportunityDepartment - Departmental climate/cultureSupport - Lack of professional supportFamily - Personal/family reasonsRecruit - Recruitment by a different institution/employerSalary - Salary/better compensationLocation - Seeking more desirable geographic locationConflict - Unresolved conflict with colleagues/co-workers
43
College of Public Health
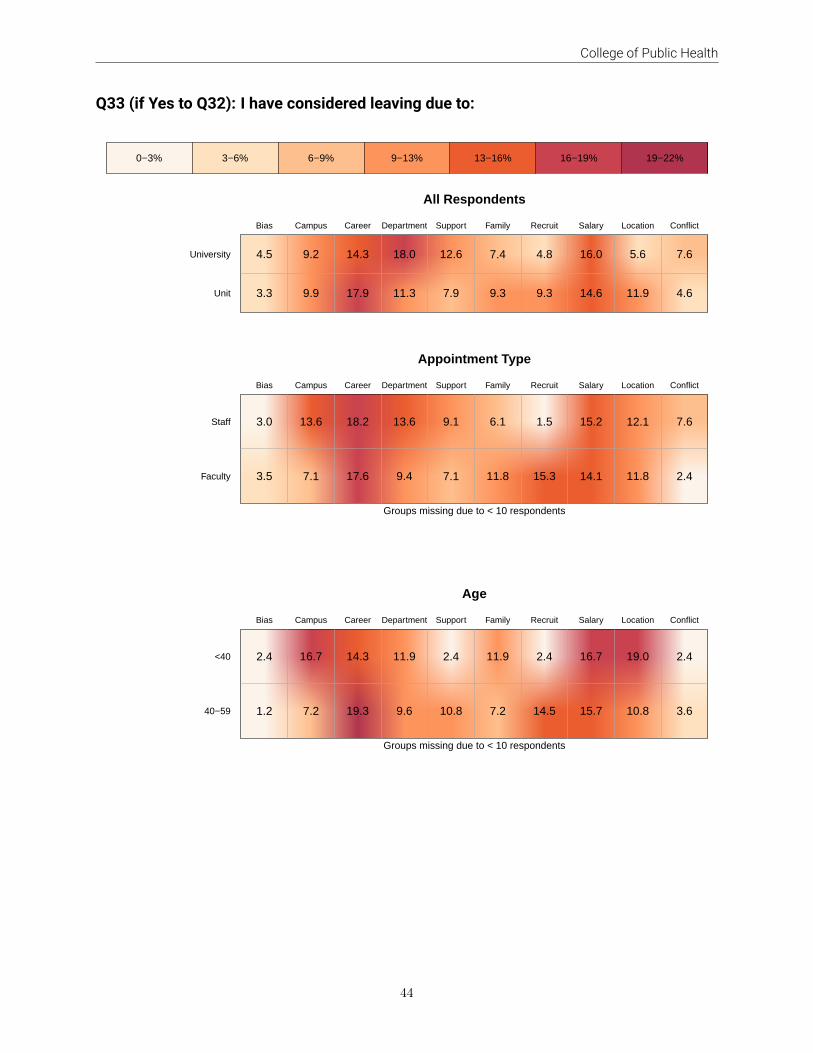
Q33 (if Yes to Q32): I have considered leaving due to:
0−3% 3−6% 6−9% 9−13% 13−16% 16−19% 19−22%
All Respondents
Bias Campus Career Department Support Family Recruit Salary Location Conflict
Unit
University
3.3 9.9 17.9 11.3 7.9 9.3 9.3 14.6 11.9 4.6
4.5 9.2 14.3 18.0 12.6 7.4 4.8 16.0 5.6 7.6
Appointment Type
Bias Campus Career Department Support Family Recruit Salary Location Conflict
Faculty
Staff
3.5 7.1 17.6 9.4 7.1 11.8 15.3 14.1 11.8 2.4
3.0 13.6 18.2 13.6 9.1 6.1 1.5 15.2 12.1 7.6
Groups missing due to < 10 respondents
Age
Bias Campus Career Department Support Family Recruit Salary Location Conflict
40−59
<40
1.2 7.2 19.3 9.6 10.8 7.2 14.5 15.7 10.8 3.6
2.4 16.7 14.3 11.9 2.4 11.9 2.4 16.7 19.0 2.4
Groups missing due to < 10 respondents
44

College of Public Health
Q33 (if Yes to Q32): I have considered leaving due to:
0−3% 3−6% 6−9% 9−13% 13−16% 16−19% 19−22%
Gender
Bias Campus Career Department Support Family Recruit Salary Location Conflict
Man
Woman
6.1 4.1 18.4 8.2 4.1 14.3 12.2 12.2 14.3 6.1
1.4 14.1 18.3 12.7 5.6 8.5 7.0 15.5 12.7 4.2
Groups missing due to < 10 respondents
Sexual Orientation
Bias Campus Career Department Support Family Recruit Salary Location Conflict
Heterosexual or straight 3.8 9.4 18.9 10.4 4.7 9.4 9.4 16.0 13.2 4.7
Groups missing due to < 10 respondents
Disability Identity
Bias Campus Career Department Support Family Recruit Salary Location Conflict
No 3.2 9.6 18.4 10.4 4.8 11.2 9.6 14.4 14.4 4.0
Groups missing due to < 10 respondents
45

College of Public Health
Q33 (if Yes to Q32): I have considered leaving due to:
0−3% 3−6% 6−9% 9−13% 13−16% 16−19% 19−22%
Political Orientation
Bias Campus Career Department Support Family Recruit Salary Location Conflict
Liberal 1.2 11.6 18.6 12.8 3.5 12.8 7.0 12.8 14.0 5.8
Groups missing due to < 10 respondents
Religious Preference
Bias Campus Career Department Support Family Recruit Salary Location Conflict
Christian
Non−religious
7.4 11.1 16.7 11.1 1.9 11.1 13.0 13.0 11.1 3.7
0.0 8.5 21.3 8.5 8.5 12.8 4.3 14.9 17.0 4.3
Groups missing due to < 10 respondents
Military/Veteran Status
Bias Campus Career Department Support Family Recruit Salary Location Conflict
No 3.1 9.4 18.0 10.9 5.5 10.9 9.4 14.1 14.1 4.7
Groups missing due to < 10 respondents
46
College of Public Health
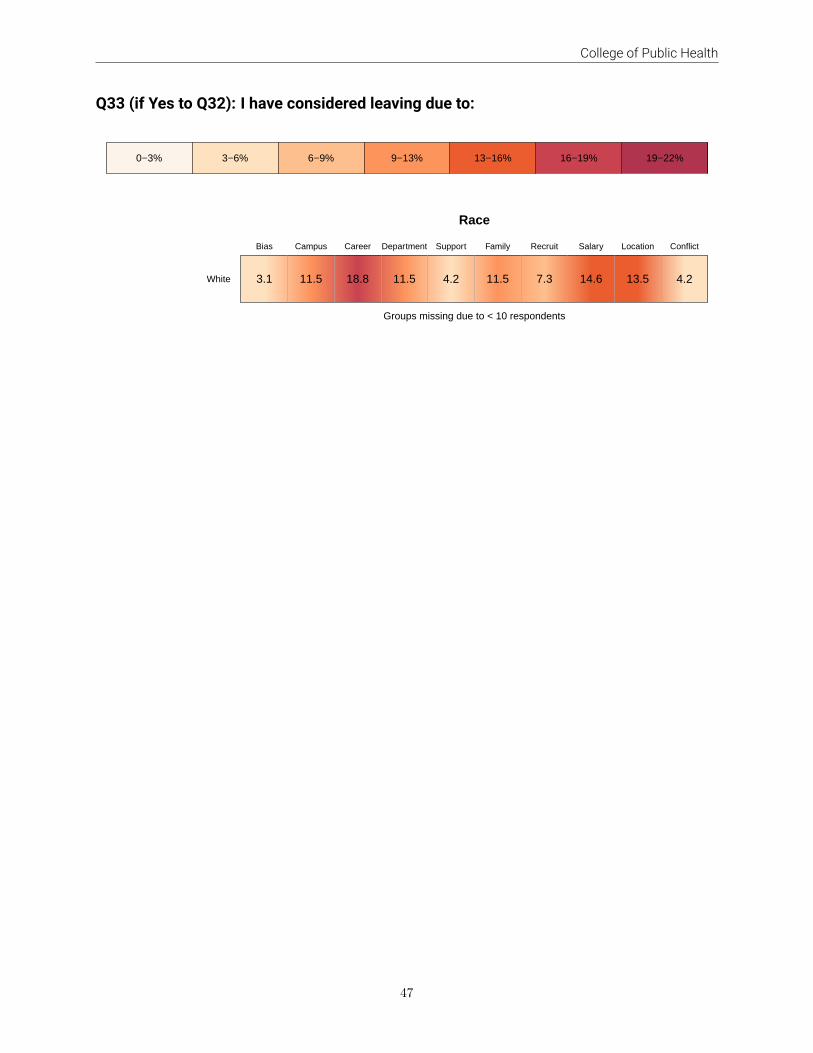
Q33 (if Yes to Q32): I have considered leaving due to:
0−3% 3−6% 6−9% 9−13% 13−16% 16−19% 19−22%
Race
Bias Campus Career Department Support Family Recruit Salary Location Conflict
White 3.1 11.5 18.8 11.5 4.2 11.5 7.3 14.6 13.5 4.2
Groups missing due to < 10 respondents
47

College of Public Health
DEI ImportanceQ34: Achieving diversity, equity, and inclusion at the University of Iowa is personally important to me
1% 99%Q34 (n=150)
100%80%60%40%20%0%20%40%60%80%100%
Strongly Disagree Disagree Somewhat Disagree Somewhat Agree Agree Strongly Agree
48

College of Public Health
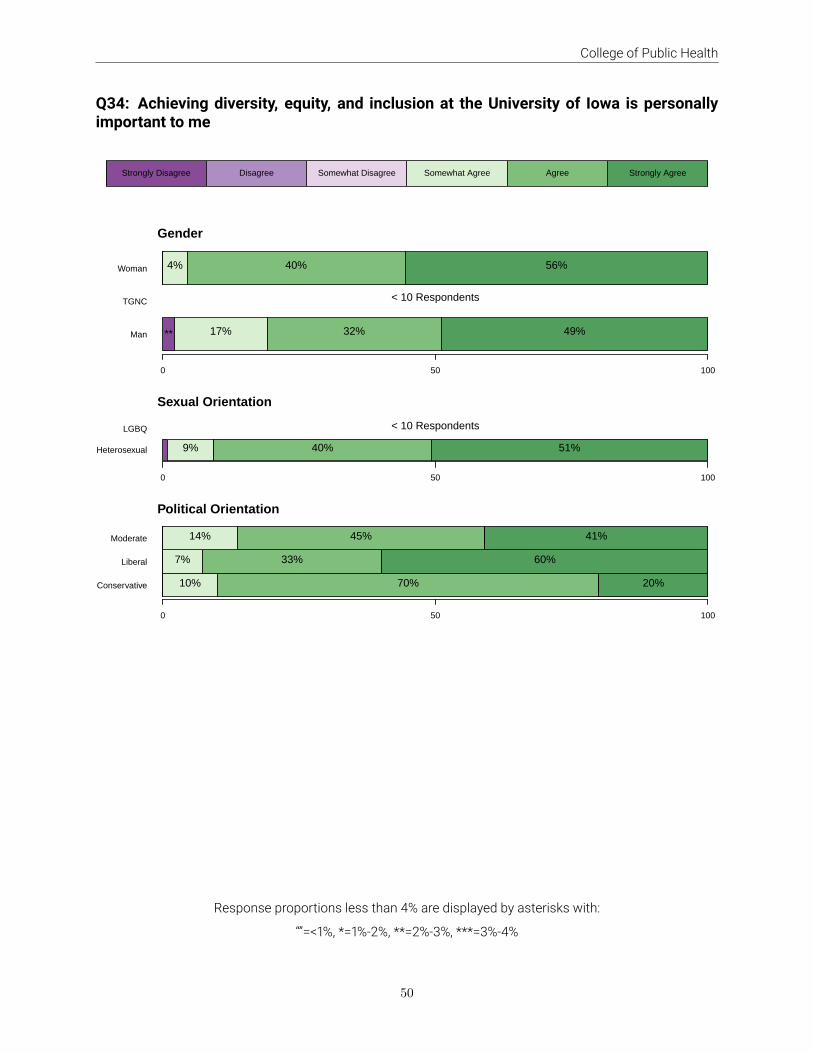
Q34: Achieving diversity, equity, and inclusion at the University of Iowa is personallyimportant to me
Strongly Disagree Disagree Somewhat Disagree Somewhat Agree Agree Strongly Agree
Unit
UI
All Respondents
0 50 100
10% 37% 52%* * ** 14% 38% 42%
Faculty
Postdoc
Staff
Appointment Type
0 50 100
11% 21% 68%
< 10 Respondents
10% 45% 44%
60+
40−59
<40
Age
0 50 100
** 22% 30% 46%
7% 41% 52%
*** 37% 59%
Asian
Latinx
Multi−Racial
URM
White
Race
0 50 100
< 10 Respondents
< 10 Respondents
< 10 Respondents
< 10 Respondents
9% 40% 50%
Response proportions less than 4% are displayed by asterisks with:“”=<1%, *=1%-2%, **=2%-3%, ***=3%-4%
49
College of Public Health
Q34: Achieving diversity, equity, and inclusion at the University of Iowa is personallyimportant to me
Strongly Disagree Disagree Somewhat Disagree Somewhat Agree Agree Strongly Agree
Man
TGNC
Woman
Gender
0 50 100
** 17% 32% 49%
< 10 Respondents
4% 40% 56%
Heterosexual
LGBQ
Sexual Orientation
0 50 100
9% 40% 51%
< 10 Respondents
Conservative
Liberal
Moderate
Political Orientation
0 50 100
10% 70% 20%
7% 33% 60%
14% 45% 41%
Response proportions less than 4% are displayed by asterisks with:“”=<1%, *=1%-2%, **=2%-3%, ***=3%-4%
50
College of Public Health
DEI CommitmentQ52: The University of Iowa has a strong commitment to diversity, equity, and inclusion
Q53: My unit/department has a strong commitment to diversity, equity, and inclusion
8%
15%
92%
85%
Q53 (n=142)
Q52 (n=144)
100%80%60%40%20%0%20%40%60%80%100%
Strongly Disagree Disagree Somewhat Disagree Somewhat Agree Agree Strongly Agree
51
College of Public Health
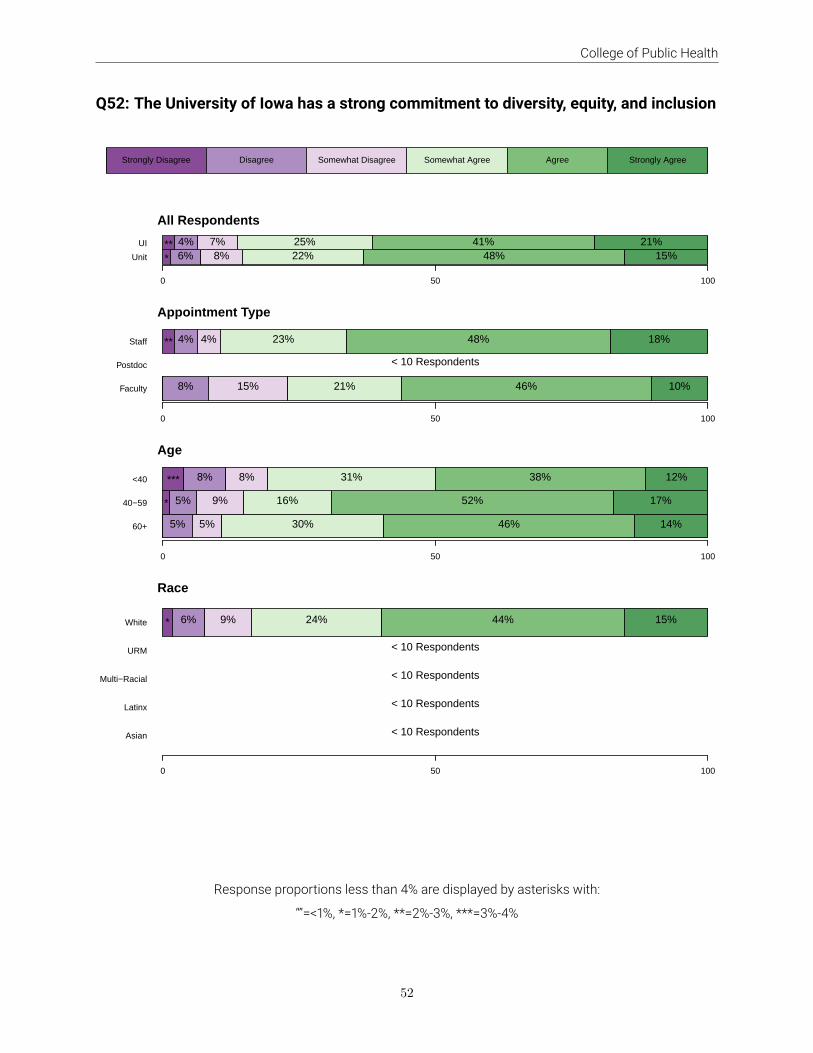
Q52: The University of Iowa has a strong commitment to diversity, equity, and inclusion
Strongly Disagree Disagree Somewhat Disagree Somewhat Agree Agree Strongly Agree
Unit
UI
All Respondents
0 50 100
* 6% 8% 22% 48% 15%** 4% 7% 25% 41% 21%
Faculty
Postdoc
Staff
Appointment Type
0 50 100
8% 15% 21% 46% 10%
< 10 Respondents
** 4% 4% 23% 48% 18%
60+
40−59
<40
Age
0 50 100
5% 5% 30% 46% 14%
* 5% 9% 16% 52% 17%
*** 8% 8% 31% 38% 12%
Asian
Latinx
Multi−Racial
URM
White
Race
0 50 100
< 10 Respondents
< 10 Respondents
< 10 Respondents
< 10 Respondents
* 6% 9% 24% 44% 15%
Response proportions less than 4% are displayed by asterisks with:“”=<1%, *=1%-2%, **=2%-3%, ***=3%-4%
52

College of Public Health
Q52: The University of Iowa has a strong commitment to diversity, equity, and inclusion
Strongly Disagree Disagree Somewhat Disagree Somewhat Agree Agree Strongly Agree
Man
TGNC
Woman
Gender
0 50 100
6% 6% 13% 60% 15%
< 10 Respondents
** 4% 9% 28% 42% 14%
Heterosexual
LGBQ
Sexual Orientation
0 50 100
* 5% 8% 23% 49% 13%
< 10 Respondents
Conservative
Liberal
Moderate
Political Orientation
0 50 100
10% 60% 30%
** 5% 8% 31% 43% 10%
4% 4% 61% 30%
Response proportions less than 4% are displayed by asterisks with:“”=<1%, *=1%-2%, **=2%-3%, ***=3%-4%
53

College of Public Health
Q53: My unit/department has a strong commitment to diversity, equity, and inclusion
Strongly Disagree Disagree Somewhat Disagree Somewhat Agree Agree Strongly Agree
Unit
UI
All Respondents
0 50 100
* 6% 15% 39% 37%** 4% 7% 22% 38% 26%
Faculty
Postdoc
Staff
Appointment Type
0 50 100
4% 9% 13% 33% 41%
< 10 Respondents
* 4% 17% 43% 35%
60+
40−59
<40
Age
0 50 100
** 6% 14% 43% 34%
* * 5% 16% 37% 40%
8% 15% 42% 35%
Asian
Latinx
Multi−Racial
URM
White
Race
0 50 100
< 10 Respondents
< 10 Respondents
< 10 Respondents
< 10 Respondents
6% 16% 40% 36%
Response proportions less than 4% are displayed by asterisks with:“”=<1%, *=1%-2%, **=2%-3%, ***=3%-4%
54

College of Public Health
Q53: My unit/department has a strong commitment to diversity, equity, and inclusion
Strongly Disagree Disagree Somewhat Disagree Somewhat Agree Agree Strongly Agree
Man
TGNC
Woman
Gender
0 50 100
** 9% 49% 40%
< 10 Respondents
* ** 7% 19% 35% 36%
Heterosexual
LGBQ
Sexual Orientation
0 50 100
6% 16% 41% 36%
< 10 Respondents
Conservative
Liberal
Moderate
Political Orientation
0 50 100
20% 30% 50%
* ** 6% 17% 39% 35%
5% 50% 45%
Response proportions less than 4% are displayed by asterisks with:“”=<1%, *=1%-2%, **=2%-3%, ***=3%-4%
55

College of Public Health
EnvironmentQ56: The University of Iowa provides an environment for the free and open expression of ideas, opinions,and beliefs
20% 80%Q56 (n=142)
100%80%60%40%20%0%20%40%60%80%100%
Strongly Disagree Disagree Somewhat Disagree Somewhat Agree Agree Strongly Agree
56
College of Public Health
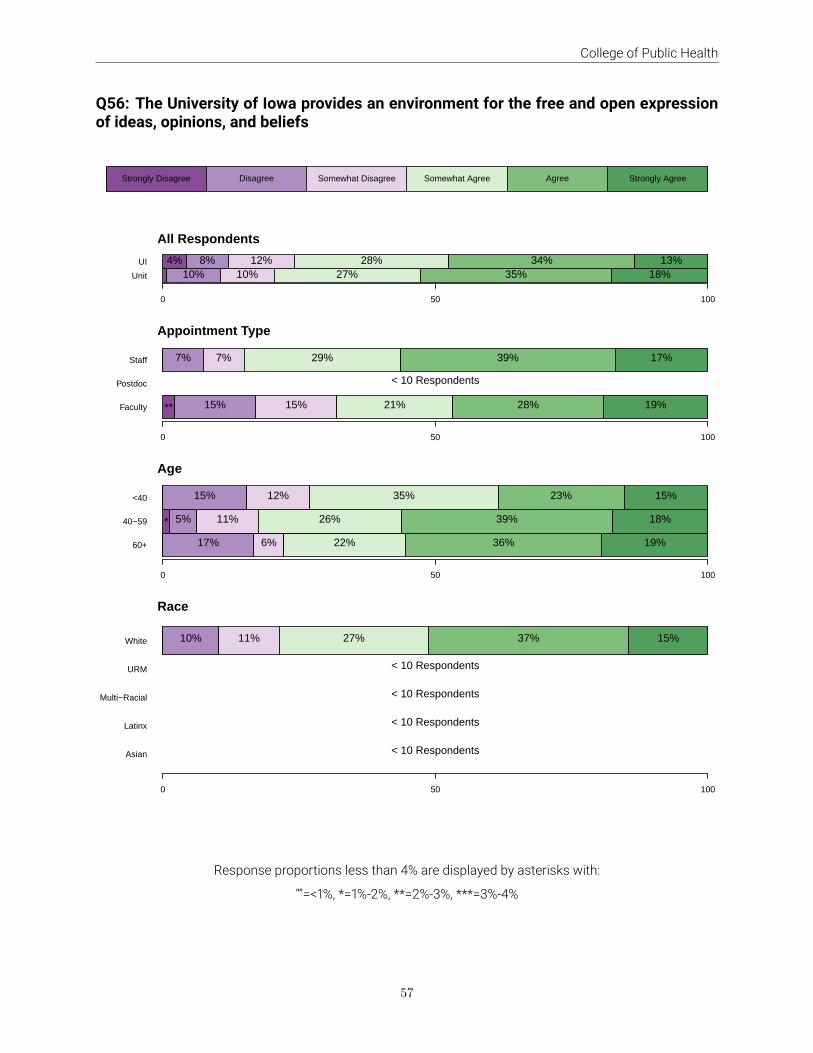
Q56: The University of Iowa provides an environment for the free and open expressionof ideas, opinions, and beliefs
Strongly Disagree Disagree Somewhat Disagree Somewhat Agree Agree Strongly Agree
Unit
UI
All Respondents
0 50 100
10% 10% 27% 35% 18%4% 8% 12% 28% 34% 13%
Faculty
Postdoc
Staff
Appointment Type
0 50 100
** 15% 15% 21% 28% 19%
< 10 Respondents
7% 7% 29% 39% 17%
60+
40−59
<40
Age
0 50 100
17% 6% 22% 36% 19%
* 5% 11% 26% 39% 18%
15% 12% 35% 23% 15%
Asian
Latinx
Multi−Racial
URM
White
Race
0 50 100
< 10 Respondents
< 10 Respondents
< 10 Respondents
< 10 Respondents
10% 11% 27% 37% 15%
Response proportions less than 4% are displayed by asterisks with:“”=<1%, *=1%-2%, **=2%-3%, ***=3%-4%
57

College of Public Health
Q56: The University of Iowa provides an environment for the free and open expressionof ideas, opinions, and beliefs
Strongly Disagree Disagree Somewhat Disagree Somewhat Agree Agree Strongly Agree
Man
TGNC
Woman
Gender
0 50 100
15% 9% 21% 34% 21%
< 10 Respondents
7% 11% 30% 36% 16%
Heterosexual
LGBQ
Sexual Orientation
0 50 100
10% 9% 27% 37% 17%
< 10 Respondents
Conservative
Liberal
Moderate
Political Orientation
0 50 100
20% 10% 60% 10%
9% 11% 32% 31% 16%
9% 4% 13% 43% 30%
Response proportions less than 4% are displayed by asterisks with:“”=<1%, *=1%-2%, **=2%-3%, ***=3%-4%
58
College of Public Health
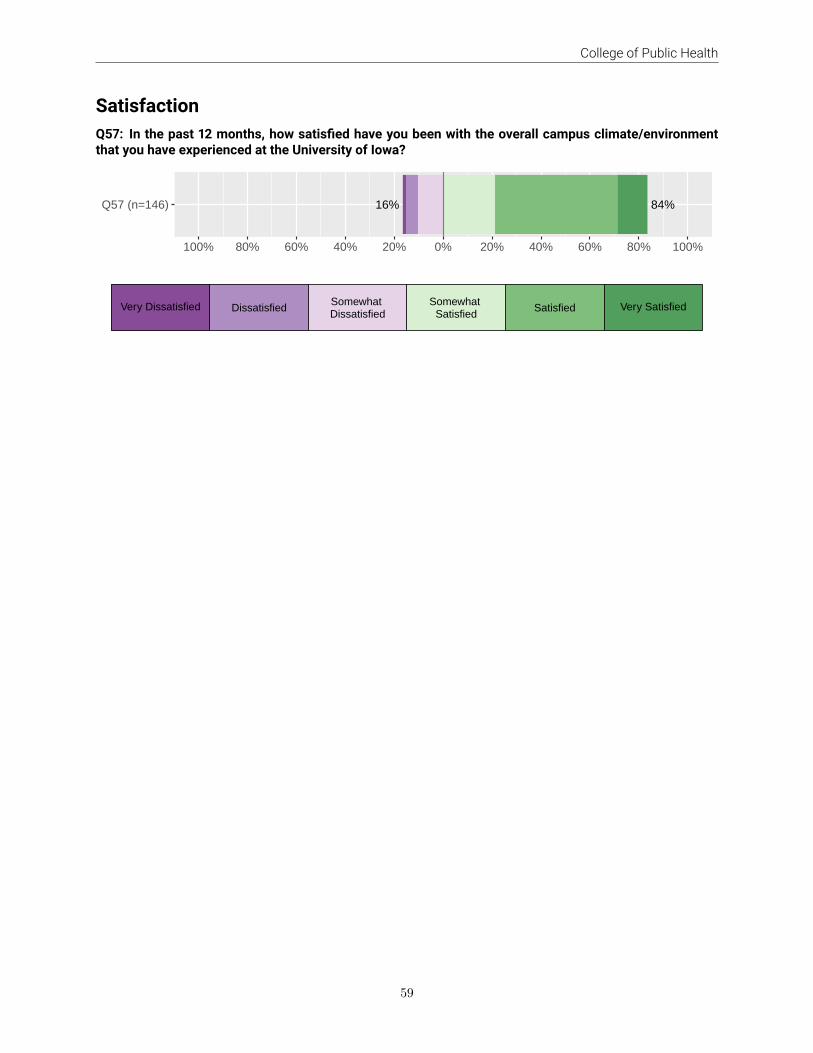
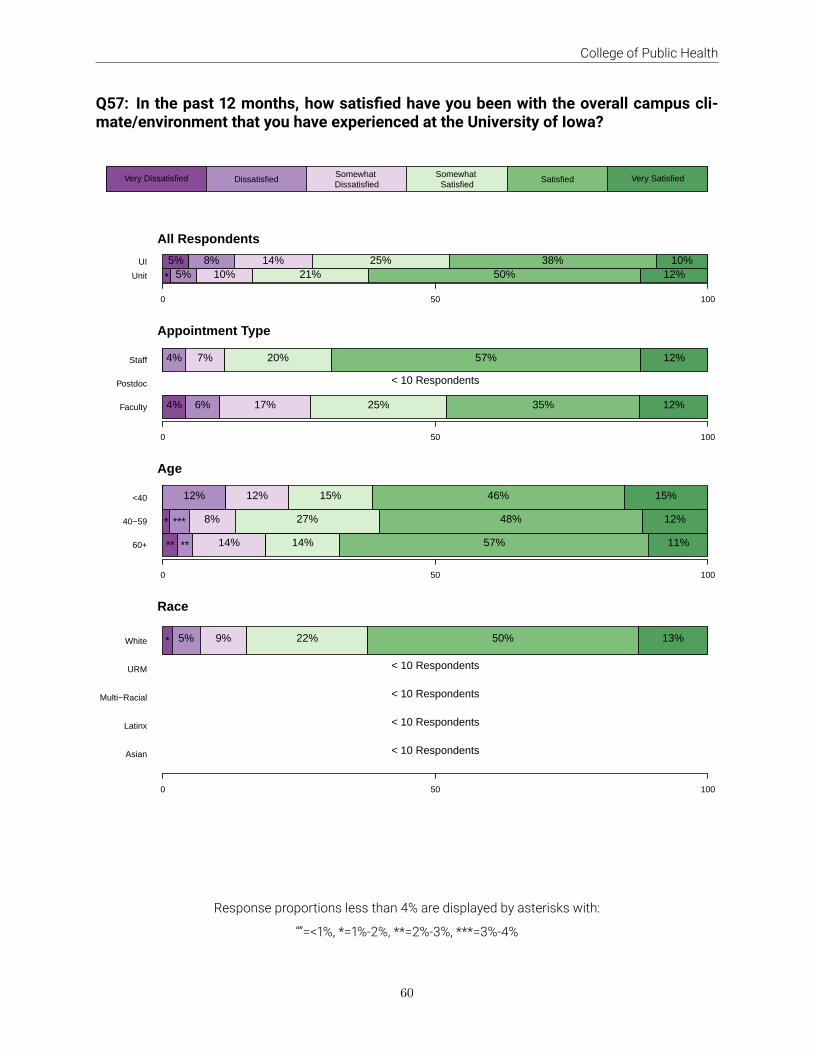
SatisfactionQ57: In the past 12 months, how satisfied have you been with the overall campus climate/environmentthat you have experienced at the University of Iowa?
16% 84%Q57 (n=146)
100%80%60%40%20%0%20%40%60%80%100%
Very Dissatisfied Dissatisfied Somewhat Dissatisfied
Somewhat Satisfied Satisfied Very Satisfied
59
College of Public Health
Q57: In the past 12 months, how satisfied have you been with the overall campus cli-mate/environment that you have experienced at the University of Iowa?
Very Dissatisfied DissatisfiedSomewhat Dissatisfied
Somewhat Satisfied
Satisfied Very Satisfied
Unit
UI
All Respondents
0 50 100
* 5% 10% 21% 50% 12%5% 8% 14% 25% 38% 10%
Faculty
Postdoc
Staff
Appointment Type
0 50 100
4% 6% 17% 25% 35% 12%
< 10 Respondents
4% 7% 20% 57% 12%
60+
40−59
<40
Age
0 50 100
** ** 14% 14% 57% 11%
* *** 8% 27% 48% 12%
12% 12% 15% 46% 15%
Asian
Latinx
Multi−Racial
URM
White
Race
0 50 100
< 10 Respondents
< 10 Respondents
< 10 Respondents
< 10 Respondents
* 5% 9% 22% 50% 13%
Response proportions less than 4% are displayed by asterisks with:“”=<1%, *=1%-2%, **=2%-3%, ***=3%-4%
60
College of Public Health
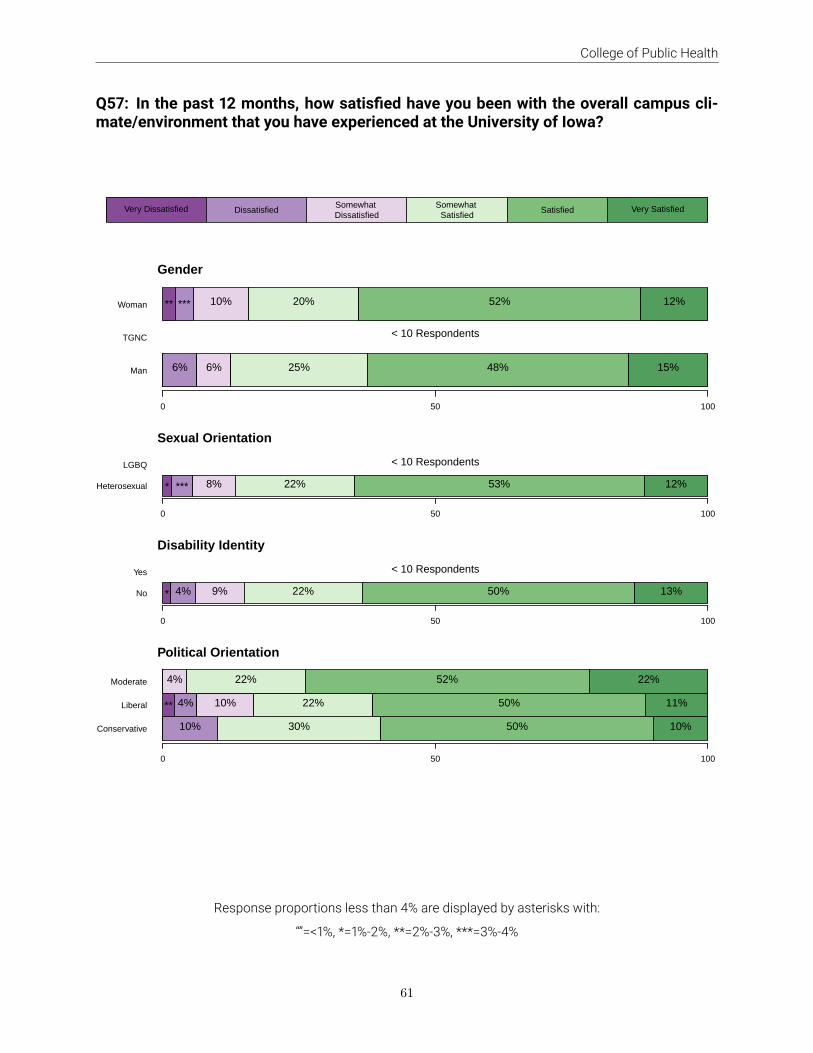
Q57: In the past 12 months, how satisfied have you been with the overall campus cli-mate/environment that you have experienced at the University of Iowa?
Very Dissatisfied DissatisfiedSomewhat Dissatisfied
Somewhat Satisfied
Satisfied Very Satisfied
Man
TGNC
Woman
Gender
0 50 100
6% 6% 25% 48% 15%
< 10 Respondents
** *** 10% 20% 52% 12%
Heterosexual
LGBQ
Sexual Orientation
0 50 100
* *** 8% 22% 53% 12%
< 10 Respondents
No
Yes
Disability Identity
0 50 100
* 4% 9% 22% 50% 13%
< 10 Respondents
Conservative
Liberal
Moderate
Political Orientation
0 50 100
10% 30% 50% 10%
** 4% 10% 22% 50% 11%
4% 22% 52% 22%
Response proportions less than 4% are displayed by asterisks with:“”=<1%, *=1%-2%, **=2%-3%, ***=3%-4%
61
College of Public Health
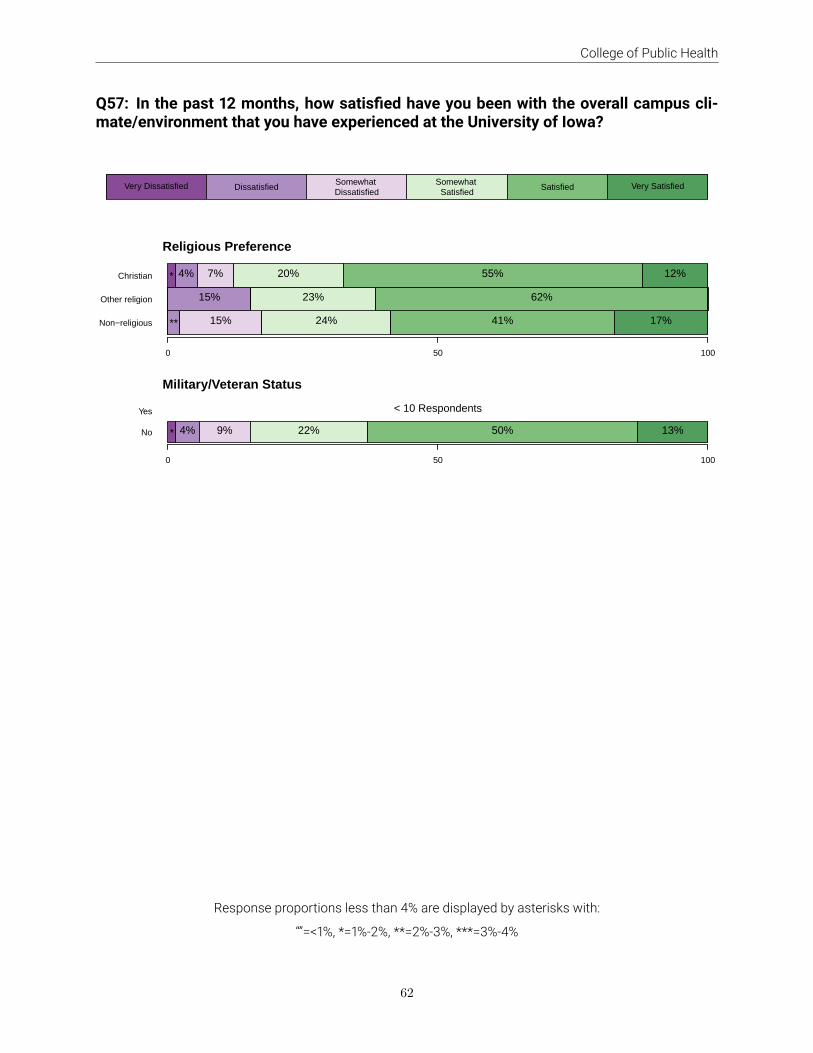
Q57: In the past 12 months, how satisfied have you been with the overall campus cli-mate/environment that you have experienced at the University of Iowa?
Very Dissatisfied DissatisfiedSomewhat Dissatisfied
Somewhat Satisfied
Satisfied Very Satisfied
Non−religious
Other religion
Christian
Religious Preference
0 50 100
** 15% 24% 41% 17%
15% 23% 62%
* 4% 7% 20% 55% 12%
No
Yes
Military/Veteran Status
0 50 100
* 4% 9% 22% 50% 13%
< 10 Respondents
Response proportions less than 4% are displayed by asterisks with:“”=<1%, *=1%-2%, **=2%-3%, ***=3%-4%
62

College of Public Health
Unit Response ComparisonIn addition to the analysis of the core questions, this report identifies up to three “Areas of Strength” and three“Areas of Growth” for your unit. Your “Areas of Strength” reflect the survey items for which your unit’s averageresponse is higher than the University average for the same items. Your “Areas of Growth” indicate surveyitems for which your unit’s average response is lower than the University average for the same items. Thegraphs for each area of strength and area of growth depict where your unit average (as measured by likertscale values) falls in comparison to the UI campus overall and in comparison to the major colleges and unitson campus (names of other units are not listed to maintain the anonymity of units). The Areas of Strengthand Areas of Growth only include survey items not included in the core questions.The likert scales range from 1 to 6 (except Question 31, which is 1 to 5), where higher values indicate a positivedirection. Some questions have a reverse scale where lower values indicate a positive direction, and these areindicated in the title of the bar plot.
63

College of Public Health
Areas of Strength
Q7: I have a voice in the decision-making process that affects the direction of my department/unit.
Q10: In comparison to my colleagues/co-workers, I have to work harder to have my ideas heard.
Q54: There is too much emphasis put on issues of diversity, equity, and inclusion at the University of Iowa.
Q7Higher value is positive direction
1 2 3 4 5 6
3.8
4.5
UI
YourUnit
Q10Scales are reversed for this question
Lower value is postive direction
1 2 3 4 5 6
2.9
3.3
YourUnit
UI
Q54Scales are reversed for this question
Lower value is postive direction
1 2 3 4 5 6
2.4
2.8
YourUnit
UI
64

College of Public Health
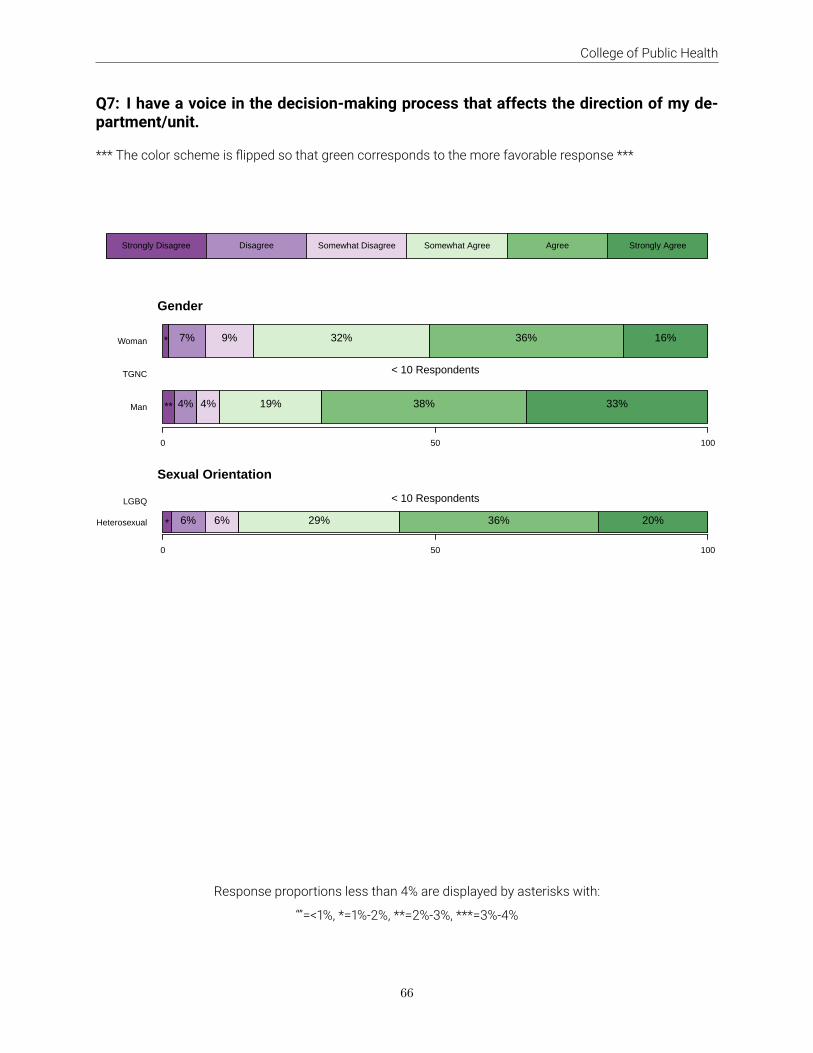
Q7: I have a voice in the decision-making process that affects the direction of my de-partment/unit.
*** The color scheme is flipped so that green corresponds to the more favorable response ***Strongly Disagree Disagree Somewhat Disagree Somewhat Agree Agree Strongly Agree
Unit
UI
All Respondents
0 50 100
* 6% 8% 30% 35% 20%9% 12% 13% 29% 26% 11%
Faculty
Postdoc
Staff
Appointment Type
0 50 100
4% 10% 23% 31% 31%
< 10 Respondents
* 6% 7% 32% 37% 15%
60+
40−59
<40
Age
0 50 100
10% 7% 31% 31% 21%
** 6% 9% 25% 37% 21%
*** 7% 41% 34% 14%
Asian
Latinx
Multi−Racial
URM
White
Race
0 50 100
< 10 Respondents
< 10 Respondents
< 10 Respondents
< 10 Respondents
* 6% 7% 27% 37% 21%
Response proportions less than 4% are displayed by asterisks with:“”=<1%, *=1%-2%, **=2%-3%, ***=3%-4%
65
College of Public Health
Q7: I have a voice in the decision-making process that affects the direction of my de-partment/unit.
*** The color scheme is flipped so that green corresponds to the more favorable response ***
Strongly Disagree Disagree Somewhat Disagree Somewhat Agree Agree Strongly Agree
Man
TGNC
Woman
Gender
0 50 100
** 4% 4% 19% 38% 33%
< 10 Respondents
* 7% 9% 32% 36% 16%
Heterosexual
LGBQ
Sexual Orientation
0 50 100
* 6% 6% 29% 36% 20%
< 10 Respondents
Response proportions less than 4% are displayed by asterisks with:“”=<1%, *=1%-2%, **=2%-3%, ***=3%-4%
66

College of Public Health
Q10: In comparison tomy colleagues/co-workers, I have to work harder to havemy ideasheard.
Strongly Disagree Disagree Somewhat Disagree Somewhat Agree Agree Strongly Agree
Unit
UI
All Respondents
0 50 100
14% 38% 14% 18% 11% ***
10% 31% 16% 20% 14% 10%
Faculty
Postdoc
Staff
Appointment Type
0 50 100
12% 38% 15% 15% 12% 8%
< 10 Respondents
15% 39% 14% 19% 10% *
60+
40−59
<40
Age
0 50 100
15% 48% 12% 10% 10% 5%
16% 31% 15% 22% 13% ***
7% 48% 15% 19% 7% ***
Asian
Latinx
Multi−Racial
URM
White
Race
0 50 100
< 10 Respondents
< 10 Respondents
< 10 Respondents
< 10 Respondents
18% 39% 12% 19% 10% **
Response proportions less than 4% are displayed by asterisks with:“”=<1%, *=1%-2%, **=2%-3%, ***=3%-4%
67

College of Public Health
Q10: In comparison tomy colleagues/co-workers, I have to work harder to havemy ideasheard.
Strongly Disagree Disagree Somewhat Disagree Somewhat Agree Agree Strongly Agree
Man
TGNC
Woman
Gender
0 50 100
19% 46% 15% 8% 8% 4%
< 10 Respondents
14% 34% 11% 24% 11% 4%
Heterosexual
LGBQ
Sexual Orientation
0 50 100
16% 39% 12% 19% 11% 5%
< 10 Respondents
Response proportions less than 4% are displayed by asterisks with:“”=<1%, *=1%-2%, **=2%-3%, ***=3%-4%
68

College of Public Health
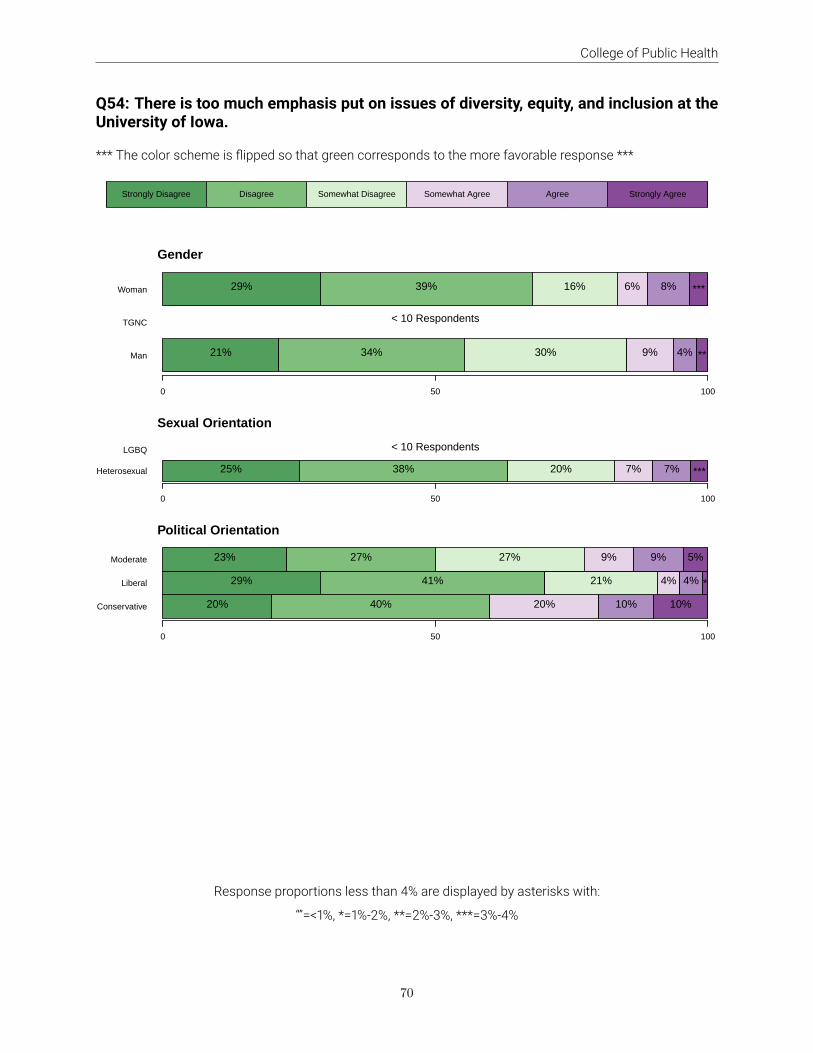
Q54: There is too much emphasis put on issues of diversity, equity, and inclusion at theUniversity of Iowa.
*** The color scheme is flipped so that green corresponds to the more favorable response ***Strongly Disagree Disagree Somewhat Disagree Somewhat Agree Agree Strongly Agree
Unit
UI
All Respondents
0 50 100
25% 38% 21% 6% 6% **
24% 28% 17% 15% 8% 8%
Faculty
Postdoc
Staff
Appointment Type
0 50 100
28% 35% 33% ** **
< 10 Respondents
24% 40% 16% 8% 8% 4%
60+
40−59
<40
Age
0 50 100
17% 46% 17% 11% 6% **
21% 44% 23% *** 5% ***
50% 12% 19% 8% 12%
Asian
Latinx
Multi−Racial
URM
White
Race
0 50 100
< 10 Respondents
< 10 Respondents
< 10 Respondents
< 10 Respondents
26% 40% 18% 7% 5% ***
Response proportions less than 4% are displayed by asterisks with:“”=<1%, *=1%-2%, **=2%-3%, ***=3%-4%
69
College of Public Health
Q54: There is too much emphasis put on issues of diversity, equity, and inclusion at theUniversity of Iowa.
*** The color scheme is flipped so that green corresponds to the more favorable response ***Strongly Disagree Disagree Somewhat Disagree Somewhat Agree Agree Strongly Agree
Man
TGNC
Woman
Gender
0 50 100
21% 34% 30% 9% 4% **
< 10 Respondents
29% 39% 16% 6% 8% ***
Heterosexual
LGBQ
Sexual Orientation
0 50 100
25% 38% 20% 7% 7% ***
< 10 Respondents
Conservative
Liberal
Moderate
Political Orientation
0 50 100
20% 40% 20% 10% 10%
29% 41% 21% 4% 4% *
23% 27% 27% 9% 9% 5%
Response proportions less than 4% are displayed by asterisks with:“”=<1%, *=1%-2%, **=2%-3%, ***=3%-4%
70
College of Public Health
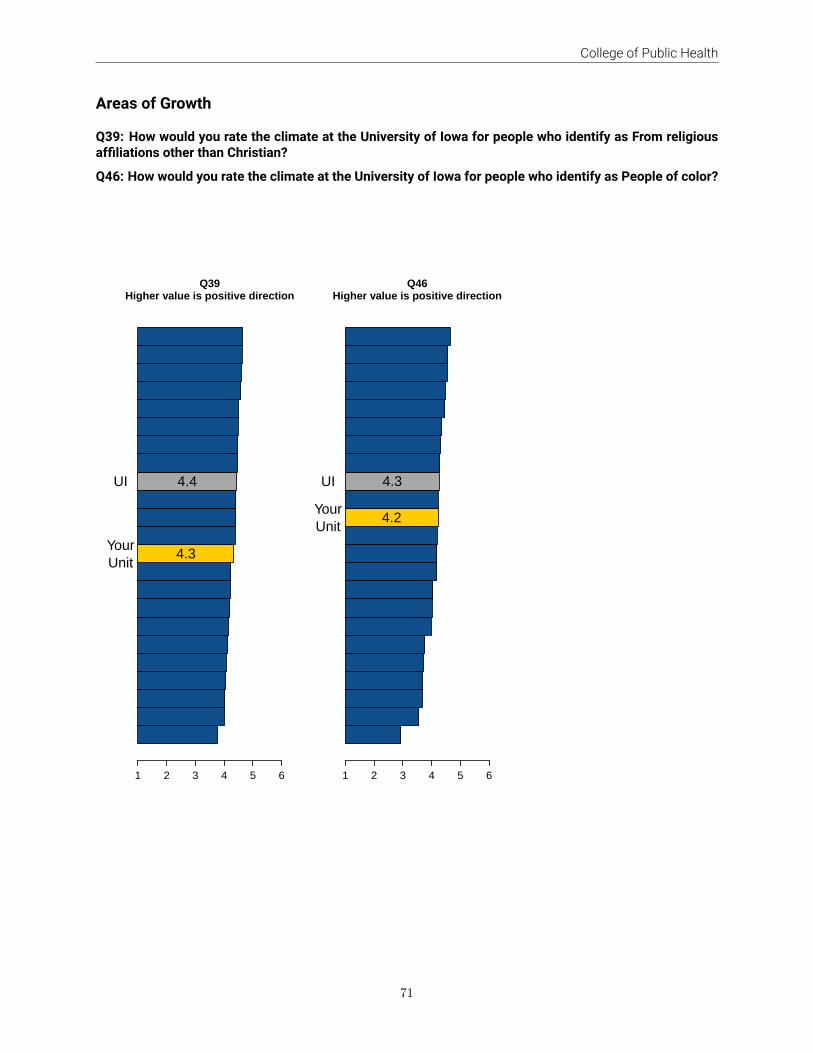
Areas of Growth
Q39: How would you rate the climate at the University of Iowa for people who identify as From religiousaffiliations other than Christian?
Q46: How would you rate the climate at the University of Iowa for people who identify as People of color?
Q39Higher value is positive direction
1 2 3 4 5 6
4.3
4.4
YourUnit
UI
Q46Higher value is positive direction
1 2 3 4 5 6
4.2
4.3
YourUnit
UI
71

College of Public Health
Q39: How would you rate the climate at the University of Iowa for people who identify asFrom religious affiliations other than Christian?
Very Disrespectful
Disrespectful Somewhat Disrespectful
Somewhat Respectful
Respectful Very Respectful
Unit
UI
All Respondents
0 50 100
17% 37% 38% 7%** 10% 31% 50% 5%
Fre
q
10
20
30
40
50
Very Disr
espectf
ul
Disresp
ectful
Somewhat D
isresp
ectful
Somewhat R
espectf
ul
Respectf
ul
Very Resp
ectful
0% 0%
17%
38%35%
10%
Member
Very Disr
espectf
ul
Disresp
ectful
Somewhat D
isresp
ectful
Somewhat R
espectf
ul
Respectf
ul
Very Resp
ectful
0%2%
14%
36%
42%
6%
Non−Member
<10 respondents for this question
Member: Not Christian; Non-Member: Christian
72
College of Public Health
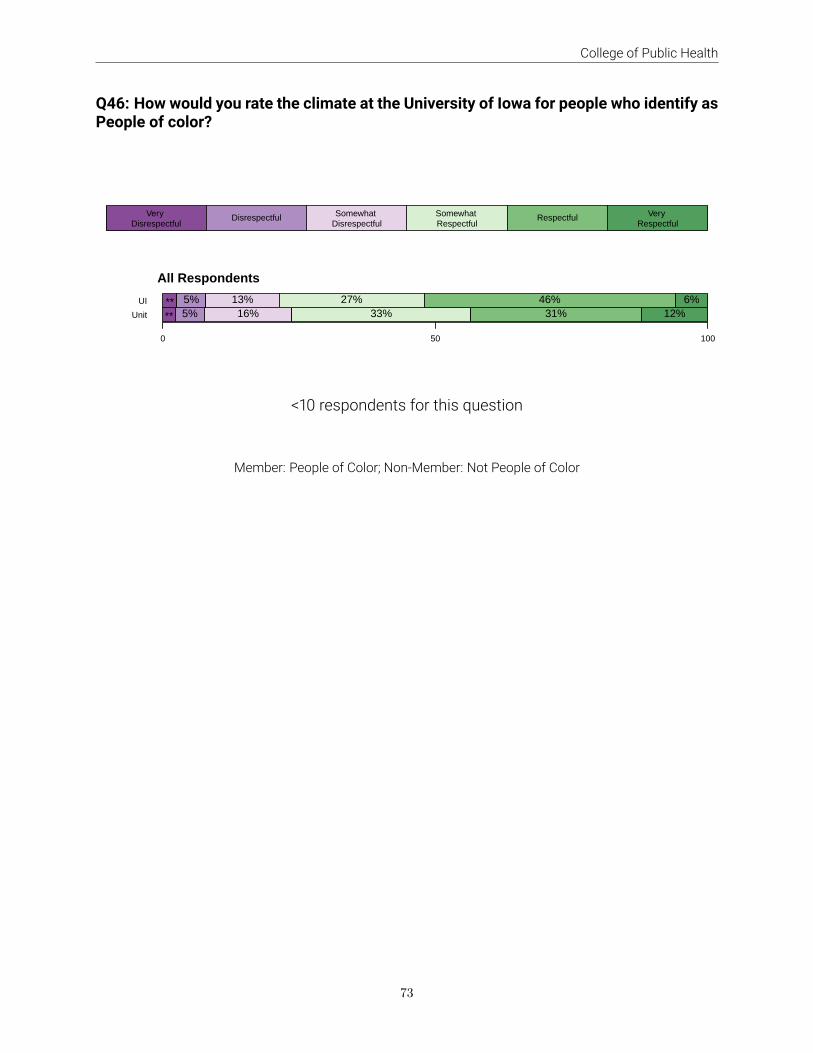
Q46: How would you rate the climate at the University of Iowa for people who identify asPeople of color?
Very Disrespectful
Disrespectful Somewhat Disrespectful
Somewhat Respectful
Respectful Very Respectful
Unit
UI
All Respondents
0 50 100
** 5% 16% 33% 31% 12%** 5% 13% 27% 46% 6%
<10 respondents for this question
Member: People of Color; Non-Member: Not People of Color
73

College of Public Health
Technical Notes1. Each survey itemmust have ten (10) respondents for percentage data to be displayed. Survey itemswithfewer than ten respondents do not have data displayed, but those respondents are included in reportsfor larger units of which they are members.2. The demographics presented in the “Campus composition and survey respondents by identity” sectionpresent as many groupings as possible to provide an overview of the population characteristics. Toaccount for insufficient number of responses (see (1)), many of these groupings are collapsed into um-brella categories:
(a) Postdoc (Postdoctoral scholar)(b) Staff (Merit, Professional, Scientific, SEIU)(c) URM (Underrepresented minority): American Indian or Alaska Native, Black or African American,Native Hawaiian or other Pacific Islander(d) TGNC: Trans Man, Trans Woman, Genderqueer, Gender Non-Conforming, Non-Binary, and if se-lected more than one category for the “Gender” question(e) LGBQ: Bisexual, Gay or Lesbian, Questioning, Queer(f) Multi-Racial: If respondents selected more than one category for the “Race” question
74
College of Public Health
AcknowledgementsThis initiative could not have been completed without the commitment, support, and countless hours of cam-pus community individuals. Thank you to the faculty, staff, and postdoctoral scholars across campus whotook the time to complete the survey, especially in a time when you have been inundated with surveys. Thankyou to everyone who took it upon themselves to encourage others to complete the survey. Key partners in thiseffort have included the Division of Diversity, Equity, and Inclusion, University Human Resources, the Office ofthe Provost, and the College of Public Health.There were also five working groups who were all instrumental in the revisioning of this survey and efforts togather as much data as possible. The following individuals who played key roles include:Survey Tool Review and Revision
• Maria Bruno | Division of Student Life• Sarah Hansen | Division of Student Life• Wayne Jacobson | Office of Assessment• Bria Marcelo | Division of Diversity, Equity, and Inclusion• Joni Troester | University Human Resources• Teri Schnelle | Division of Student Life• Nichole Singer | University Human Resources• Tanya Uden-Holman | University College• Brenda Ulin | Information Technology Services• KaLeigh White | Graduate College
Survey Analysis and Report Development
• Jacob Clark | College of Public Health• Steven Edwards | Division of Diversity, Equity, and Inclusion• Lois Geist | Office of the Provost• Jiongting Hu | University Human Resources• Wayne Jacobson | Office of Assessment• Zhuangzhuang Liu | College of Public Health• Bria Marcelo | Division of Diversity, Equity, and Inclusion• Jennifer Modestou | Division of Diversity, Equity, and Inclusion• Jacob Oleson | College of Public Health• Nichole Singer | University Human Resources• Joni Troester | University Human Resources• Brenda Ulin | Information Technology Services• Yashwant Prakash Vyas | Division of Diversity, Equity, and Inclusion• KaLeigh White | Graduate College
Survey Administration
• Bruce Drummond | University Human Resources• Bria Marcelo | Division of Diversity, Equity, and Inclusion
75

College of Public Health
• Nichole Singer | University Human Resources• KaLeigh White | Graduate College
Survey Communication
• Lois Geist | Office of the Provost• Emily Gries | University of Iowa Hospitals and Clinics• Crystal Hardinger | University of Iowa Hospitals and Clinics• Nikole Mac | University Human Resources• Bria Marcelo | Division of Diversity, Equity, and Inclusion• Katie McCullough | Division of Diversity, Equity, and Inclusion• Cristobal McKinney | College of Liberal Arts and Sciences• Kimberly Nye | Office of the Provost• Nichole Singer | University Human Resources• Spencer Stumpf | University Human Resources• Heidi Zahner-Younts | University Human Resources
Report Review Group
• Bradley Cramer | College of Liberal Arts of Sciences• Wayne Jacobson | Office of Assessment• Danielle Martinez | Academic Support and Retention• Maurine Neiman | College of Liberal Arts and Sciences• Jill Robinson | Division of Diversity, Equity, and Inclusion• Deb Tiemens | Office of the Provost• Elizabeth Tovar | Division of Diversity, Equity, and Inclusion• Brenda Ulin | Information Technology Services• KaLeigh White | Graduate College
76