public disclosure authorizeddocuments.worldbank.org/curated/en/... · public disclosure authorized...
TRANSCRIPT
Pub
lic D
iscl
osur
e A
utho
rized
Pub
lic D
iscl
osur
e A
utho
rized
Pub
lic D
iscl
osur
e A
utho
rized
Pub
lic D
iscl
osur
e A
utho
rized
Pub
lic D
iscl
osur
e A
utho
rized
Pub
lic D
iscl
osur
e A
utho
rized
Pub
lic D
iscl
osur
e A
utho
rized
Pub
lic D
iscl
osur
e A
utho
rized
MICROFINANCEHANDBOOK

MICROFINANCEHANDBOOKAn Institutional and Financial Perspective
Joanna Ledgerwood
T H E W O R L D B A N K
W A S H I N G T O N , D . C .
SUSTAINABLE BANKING with the POOR
Copyright © 1999The International Bank for Reconstructionand Development/THE WORLD BANK1818 H Street, N.W.Washington, D.C. 20433, U.S.A.
All rights reservedManufactured in the United States of AmericaFirst printing December 1998Second printing July 1999Third printing July 2000
The findings, interpretations, and conclusions expressed in this paper are entirely those of theauthor and should not be attributed in any manner to the World Bank, to its affiliated organiza-tions, or to members of its Board of Executive Directors of the countries they represent. TheWorld Bank does not guarantee the accuracy of the data included in this publication and acceptsno responsibility for any consequence of their use.
The boundaries, colors, denominations, and other information shown on any map in this volumedo not imply on the part of the World Bank Group any judgment on the legal status of any terri-tory or the endorsement or acceptance of such boundaries.
The material in this publication is copyrighted. Requests for permission to reproduce portions ofit should be sent to the Office of the Publisher at the address shown in the copyright notice above.The World Bank encourages dissemination of its work and will normally give permission prompt-ly and, when the reproduction is for noncommercial purposes, without asking a fee. Permission tocopy portions for classroom use is granted through the Copyright Clearance Center, Inc., Suite910, 222 Rosewood Drive, Danvers, Massachusetts 01923, U.S.A.
Joanna Ledgerwood is consultant to the Sustainable Banking with the Poor Project, World Bank,for Micro Finance International, Toronto, Canada.
Library of Congress Cataloging-in-Publication Data
Ledgerwood, Joanna.Microfinance handbook: an institutional and financial perspective/Joanna Ledgerwood.p. cm.—(Sustainable banking with the poor)
Includes bibliographical references and index.ISBN 0-8213-4306-81. Microfinance. 2. Financial institutions. I. Title.
II. Series.HG178.2.L43 1998 98–21754332.1—dc21 CIP
Contents
Foreword xv
Preface xvi
Introduction 1
PART I—ISSUES TO CONSIDER WHEN PROVIDING MICROFINANCE 9
Chapter 1 Understanding the Country Context 11Suppliers of Financial Intermediation Services 12Existing Microfinance Providers 14What Role Do Donors Play in Microfinance? 16
Financial Sector Policies and Legal Enforcement 17Interest Rate Policies 18Government Mandates for Sectoral Credit Allocations 19Legal Enforcement of Financial Contracts 19
Financial Sector Regulation and Supervision 20When Should MFIs Be Subject to Regulation? 21Considerations When Regulating MFIs 23Country Approaches to Regulating MFIs 25
Economic and Social Policy Environment 26Economic and Political Stability 26Poverty Levels 28Investment in Infrastructure and Human Resource Development 28Government View of the Microenterprise Sector 29
Appendix 1. Risks in the Microfinance Industry 30Sources and Further Reading 31
Chapter 2 The Target Market and Impact Analysis 33Objectives of the Microfinance Institution 33Direct and Indirect Targeting 34The Importance of Adequate Cash Flow and the Capacity to Service Debt 35
v
vi C O N T E N T S
Minimal Equity Requirement 36Moral Hazard 36Market Size 36
Identifying the Target Market 37Characteristics of the Population Group 37Types of Microenterprises 42
Impact Analysis 46Kinds of Impacts 47What Kinds of Impacts Have We Seen with Microfinance? 48Impact Proxies 49Client-Oriented Impact Analysis 49When Should Impact Be Assessed? 52Methods of Impact Assessment 53Fundamental Characteristics of Qualitative Approaches 53Fundamental Characteristics of Quantitative Approaches 54Comparisons of Quantitative and Qualitative Approaches 56Integrating Methodologies 56The Choice of Unit of Analysis 56
Appendix 1. Quantitative Impact Assessment 58Sources and Further Reading 59
Chapter 3 Products and Services 63The Systems Framework 64Microfinance Institutions—Minimalist or Integrated? 65Financial Intermediation 66Credit 66Savings 71Insurance 74Credit Cards and Smart Cards 74Payment Services 75
Social Intermediation 76Enterprise Development Services 78Social Services 81Appendix 1. Microfinance Approaches 82Appendix 2. Matching Enterprise Development Services to Demand 86Sources and Further Reading 90
Chapter 4 The Institution 93The Importance of Institutions 93Attributes of a Good Institution 94The Importance of Partner Institutions 94
Institutional Types 97Formal Financial Institutions 97Semiformal Financial Institutions 101Informal Financial Providers 104
C O N T E N T S vii
Institutional Growth and Transformation 106Expansion Within an Existing Structure 106Creating an Apex Institution 106Creating a Formal Financial Intermediary 109Governance and Ownership 110Accessing Capital Markets 113
Institutional Capacity Building 117Appendix 1. MFI Operational Review 118Appendix 2. Manual for Elaboration of a Business Plan 123Sources and Further Reading 128
PART II—DESIGNING AND MONITORING FINANCIAL PRODUCTS AND SERVICES 131
Chapter 5 Designing Lending Products 133Cash Patterns, Loan Terms, and Payment Frequency 133Client Cash Patterns and Loan Amounts 133How Does the Loan Term Affect the Borrower’s Ability to Repay? 134Frequency of Loan Payments 136Working Capital and Fixed Asset Loans 136
Loan Collateral 137Collateral Substitutes 137Alternative Forms of Collateral 138
Loan Pricing 138Calculating Interest Rates 140How Do Fees or Service Charges Affect the Borrower and the MFI? 142Cross-Subsidization of Loans 143
Calculating Effective Rates 143Estimating the Effective Rate 144Calculating the Effective Interest Rate with Compulsory Savings or Other Loan Variables 146Calculating the Effective Interest Rate with Varying Cash Flows 147How Does the Effective Cost for the Borrower Differ from the Effective Yield to the Lender? 148
Appendix 1. How Can an MFI Set a Sustainable Rate on Its Loans? 149Appendix 2. Calculating an Effective Interest Rate Using the Internal Rate of Return Method 150Appendix 3. Calculating the Effective Rate with Varying Cash Flows 152Sources and Further Reading 153
Chapter 6 Designing Savings Products 155Demand for Savings Services 156Is There an Enabling Environment? 157Legal Requirements for Offering Voluntary Savings Services 157Deposit Insurance 158
Does the MFI Have the Necessary Institutional Capacity to Mobilize Savings? 160Ownership and Governance 160Organizational Structure 160Human Resources 161Marketing 162Infrastructure 163
viii C O N T E N T S
Security and Internal Controls 163Management Information Systems 163Risk Management and Treasury 163
Sequencing the Introduction of Savings Services 164Types of Savings Products for Microentrepreneurs 164Liquid Accounts 165Semiliquid Accounts 165Fixed-Term Deposits 166
Costs of Mobilizing Voluntary Savings 166Pricing Savings Products 167Sources and Further Reading 168
Chapter 7 Management Information Systems 169An Overview of Issues Related to Management Information Systems 170Three Areas of Management Information Systems 171Accounting Systems 171Credit and Savings Monitoring Systems 172Client Impact Tracking Systems 178
Installing a Management Information System 178Institutional Assessment 178Configuration 178Software Modifications 179Testing 179Data Transfer 179Training 180Parallel Operations 180Ongoing Support and Maintenance 180
Appendix 1. Overview of Commercial Management Information System Software Packages 180Appendix 2. Criteria for Evaluating Loan Tracking Software 183Sources and Further Reading 183
PART III—MEASURING PERFORMANCE AND MANAGING VIABILITY 185
Chapter 8 Adjusting Financial Statements 187Accounting Adjustments 188Accounting for Loan Losses 188Accounting for Depreciation of Fixed Assets 192Accounting for Accrued Interest and Accrued Interest Expense 193
Adjusting for Subsidies and Inflation 194Accounting for Subsidies 195Accounting for Inflation 197
Restating Financial Statements in Constant Currency Terms 199Appendix 1. Sample Financial Statements Adjusted for Subsidies 200Appendix 2. Sample Financial Statements Adjusted for Inflation 202Sources and Further Reading 204
Chapter 9 Performance Indicators 205Portfolio Quality 206Repayment Rates 206Portfolio Quality Ratios 207Loan Loss Ratios 211
Productivity and Efficiency Ratios 212Productivity Ratios 212Efficiency Ratios 213
Financial Viability 215Financial Spread 216Two Levels of Self-Sufficiency 216Subsidy Dependence Index 218
Profitability Ratios 220Return on Assets Ratio 221Return on Business Ratio 222Return on Equity Ratio 223
Leverage and Capital Adequacy 223Leverage 224Capital Adequacy Standards 224
Scale and Depth of Outreach Indicators 225Performance Standards and Variations 227Appendix 1. Sample Balance Sheet 233Appendix 2. Sample Income Statement 234Appendix 3. Sample Portfolio Report 235Appendix 4. Adjusted Sample Financial Statements (Combined) 236Appendix 5. Analyzing an MFI’s Return on Assets 238Sources and Further Reading 241
Chapter 10 Performance Management 243Delinquency Management 243The Effect of Delinquency on an MFI’s Profitability 244Controlling Delinquency 245Rescheduling or Refinancing Loans 246
Productivity and Efficiency Management 248Improving Staff Productivity 248Managing Costs 251
Risk Management 254Asset and Liability Management 254Operating Risk Management 258
Appendix 1. Gap Analysis 260Sources and Further Reading 261
GLOSSARY 263
INDEX 271
C O N T E N T S ix
Boxes1.1 Formal Sector Suppliers in Rural Mexico 141.2 Do Microfinance Clients Need Subsidized Interest Rates? 151.3 Credit Institutions as a Political Tool: Debt Foregiveness in India 151.4 Microfinance in Indonesia 161.5 Multilateral Development Banks’ Strategies for Microfinance 181.6 The Consultative Group to Assist the Poorest 191.7 Usury Laws in West Africa 191.8 Alexandria Business Association: Legal Sanctions 201.9 Regulating MFIs: The Case of Finansol 221.10 Enhancing the Effectiveness of Oversight 231.11 Private Financial Funds in Bolivia 251.12 Nonbank Financial Institutions in Ghana 261.13 Microfinance in Areas of Political Unrest 271.14 The Albanian Development Fund 281.15 Tax Laws in Argentina 292.1 Targeted Credit Activities 342.2 U.S. Agency for International Development Findings on Female Borrowers 382.3 The Kenya Rural Enterprise Programme 402.4 The Influence of Ethnicity and Language in Microfinance 412.5 Islamic Banking 422.6 The Association for the Development of Microenterprises’ Work with Existing Microenterprises 432.7 Foundation for Enterprise Finance and Development’s Approach to Sector Development 462.8 The Impact of Finance on the Rural Economy of India 472.9 PRODEM’s Impact and Market Analysis Project 503.1 Principles of Financially Viable Lending to Poor Entrepreneurs 673.2 Individual Loans at Fédération des Caisses d’Epargne et de Crédit Agricole Mutuel, Benin 693.3 The Association for the Development of Microenterprises 693.4 Rotating Savings and Credit Associations 703.5 Repayment Instability in Burkina Faso 713.6 The Role of Groups in Financial Intermediation 723.7 Caisses Villageoises, Pays Dogon, Mali 733.8 Self-Employed Women’s Association Insurance 753.9 The Association for the Development of Microenterprises’ MasterCard 753.10 Swazi Business Growth Trust Smart Cards 763.11 Demand for Payment Services at the Fédération des Caisses d’Epargne
et de Crédit Agricole Mutuel, Benin 763.12 Village Banks: An Example of a Parallel System 773.13 Social Intermediation in a Social Fund in Benin 783.14 Business Skills Training 793.15 Direct and Indirect Business Advisory Services 793.16 Cattle Dealers in Mali 793.17 Who Offers Social Services? 813.18 Freedom From Hunger—Providing Nutrition Training with Microfinance 81A3.1.1 Training for Replicators in West Africa 83A3.2.1 Policy Dialogue in El Salvador 90
x C O N T E N T S
4.1 Freedom From Hunger: Partnering with Local Institutions 964.2 Types of Financial Institutions 974.3 Development Banks 984.4 Tulay sa Pag-Unlad’s Transformation into a Private Development Bank 994.5 The Savings Bank of Madagascar 994.6 Caja Social: A Colombian Commercial Bank Reaching the Poor 1004.7 Caja de Ahorro y Prestamo Los Andes 1014.8 Accion Comunitaria del Peru 1014.9 The Rehabilitation of a Credit Union in Benin 1024.10 CARE Guatemala: The Women’s Village Banking Program 1044.11 The Use of Self-Help Groups in Nepal 1054.12 Using the Nongovernmental Organization as a Strategic Step in Expansion 1074.13 Catholic Relief Services: Using the Apex Model for Expansion 1084.14 Transformation from a Nongovernmental Organization to Financiera Calpía 1104.15 Catholic Relief Services’ Guatemala Development Bank 1104.16 BancoADEMI Ownership Structure 1124.17 Guarantee Scheme in Sri Lanka 1144.18 Key Measures for Accessing Commercial Financing 1144.19 Accessing Capital Markets by Issuing Financial Paper 1154.20 ProFund—an Equity Investment Fund for Latin America 1154.21 The Calvert Group—a Screened Mutual Fund 1164.22 DEVCAP—a Shared-Return Fund 1164.23 Credit Unions Retooled 118A4.2.1 Suggested Business Plan Format 125A4.2.2 Estimating the Market: An Example from Ecuador 1265.1 The Association for the Development of Microenterprises’ Collateral Requirements 1395.2 Cross-Subsidization of Loans 1436.1 Deposit Collectors in India 1566.2 Savings Mobilization at Bank Rakyat Indonesia 1586.3 Deposit Insurance in India 1596.4 Security of Deposits in the Bank for Agriculture and Agricultural Cooperatives, Thailand 1596.5 Ownership and Governance at the Bank for Agriculture and Agricultural Cooperatives, Thailand 1616.6 Using Local Human Resources in Caisses Villageoises d’Epargne et de Crédit Autogérées, Mali 1626.7 The Sequencing of Voluntary Savings Mobilization 1646.8 Bank Rakyat Indonesia Savings Instruments 1656.9 The Choice of Savings Products in Pays Dogon, Mali 1666.10 Administrative Costs for Banco Caja Social, Colombia 1677.1 Determining the Information Needs of an MFI 1707.2 Microfinance Institutions with Developed “In-House” Systems 1747.3 Improving Reporting Formats: Experience of the Workers Bank of Jamaica 1767.4 Management Information Systems at the Association for the Development
of Microenterprises, Dominican Republic 1777.5 Framework for a Management Information System at Freedom From Hunger 1787.6 Running Parallel Operations in the Fédération des Caisses d’Epargne et de Crédit Agricole Mutuel, Benin 1808.1 The Impact of Failure to Write Off Bad Debt 1918.2 Cash and Accrual Accounting for Microfinance Institutions 194
C O N T E N T S xi
9.1 Repayment Rates Compared with Portfolio Quality Ratios 2089.2 The Effect of Write-off Policies 2119.3 Computation of the Subsidy Dependence Index 2209.4 CARE Guatemala’s Subsidy Dependence Index 2219.5 Outreach Indicators 2269.6 Depth of Outreach Diamonds 2289.7 CAMEL System, ACCION 2299.8 Financial Ratio Analysis for Microfinance Institutions, Small Enterprise and Promotion Network 2309.9 PEARLS System, World Council of Credit Unions 2319.10 Tracking Performance through Indicators, Consultative Group to Assist the Poorest 232A9.5.1 Analyzing a Financial Institution’s Return on Assets 23810.1 Fifteen Steps to Take in a Delinquency Crisis 24610.2 Unusual Gains in Efficiency at Women’s World Banking, Cali, Colombia 24810.3 Performance Incentives at the Association for the Development of Microenterprises, Dominican Republic 25010.4 Performance Incentive Schemes at Tulay Sa Pag-Unlad Inc., the Philippines 25110.5 Credit Officer Reports at the Association for the Development of Microenterprises 25210.6 Transfer Pricing at Bank Rakyat Indonesia and Grameen Bank in Bangladesh 25310.7 Standardization at Grameen Bank 25410.8 Institution Vulnerability to Fraud 25910.9 Fraud Control at Mennonite Economic Development Association 260
Figures1 Relationship between Level of Analysis and Technical Complexity in this Book 51.1 Understanding the Country Context 112.1 Client Characteristics 382.2 Types of Microenterprises 423.1 Minimalist and Integrated Approaches to Microfinance 653.2 Group Social Intermediation 78A3.2.1 The Entrepreneur’s Context 86
Tables1.1 Providers of Financial Intermediation Services 131.2 Private Institutions in Microenterprise Development 172.1 Enterprise Sector Credit Characteristics 454.1 Key Characteristics of a Strong Microfinance Institution 954.2 What Is at Stake for Microfinance Owners? 112A4.2.1 Financial Cost as a Weighted Average 1285.1 Examples of Loan Uses 1375.2 Declining Balance Method 1405.3 Flat Method 1415.4 Effective Rate Estimate, Declining Balance 1455.5 Effective Rate Estimate, Flat Method 1455.6 Change in Loan Fee and Loan Term Effect 1465.7 Variables Summary 147A5.3.1 Internal Rate of Return with Varying Cash Flows (Grace Period) 152A5.3.2 Internal Rate of Return with Varying Cash Flows (Lump Sum) 1528.1 Sample Portfolio Report 188
xii C O N T E N T S

8.2 Sample Loan Loss Reserve Calculation, December 31, 1995 1909.1 Sample Portfolio Report with Aging of Arrears 2099.2 Sample Portfolio Report with Aging of Portfolio at Risk 2099.3 Calculating Portfolio at Risk 2109.4 Calculating Portfolio Quality Ratios 2129.5 Calculating Productivity Ratios 2139.6 Calculating Efficiency Ratios 2159.7 Calculating Viability Ratios 2199.8 Effect of Leverage on Return on Equity 224A9.5.1 Breakdown of a Microfinance Institution’s Profit Margin and Asset Utilization 239A9.5.2 Analysis of ADEMI’s Return on Assets 24010.1 Cost of Delinquency, Example 1 24410.2 Cost of Delinquency, Example 2 24510.3 On-Time and Late or No Payments 24710.4 Branch Cash Flow Forecasts 256
C O N T E N T S xiii

xv
Foreword
The Sustainable Banking with the Poor Project(SBP) began several years ago as a rather unusualjoint effort by a regional technical department,
Asia Technical, and a central department, Agriculture andNatural Resources. Through the years and the institution-al changes, the project has maintained the support of theAsia Region and the Rural Development Department inthe Environmentally and Socially SustainableDevelopment vice presidency and the endorsement of theFinance, Private Sector and Infrastructure Network.An applied research and dissemination project, SBP
aims at improving the ability of donors, governments,and practitioners to design and implement policies andprograms to build sustainable financial institutions thateffectively reach the poor. While its main audience hasbeen World Bank Group staff, the project has con-tributed significantly to the knowledge base in themicrofinance and rural finance fields at large.More than 20 case studies of microfinance institutions
have been published and disseminated worldwide, manyof them in two languages; a seminar series at the WorldBank has held more than 30 sessions on microfinance andrural finance good practice and new developments; threeregional conferences have disseminated SBP products inAsia and Africa, while fostering and benefiting from exten-
sive discussions with practitioners, policymakers, anddonors. SBP also co-produced with the ConsultativeGroup to Assist the Poorest the "Microfinance PracticalGuide," today a regular source of practical reference forWorld Bank Group task team leaders and staff workingon microfinance operations or project components thatinvolve the provision of financial services to the poor.This volume, Microfinance Handbook: An
Institutional and Financial Perspective, represents in away a culmination of SBP work in pursuit of its princi-pal aim. A comprehensive source for donors, policymak-ers, and practitioners, the handbook first covers thepolicy, legal, and regulatory issues relevant to micro-finance development and subsequently treats rigorouslyand in depth the key elements in the process of buildingsustainable financial institutions with effective outreachto the poor.The handbook focuses on the institutional and finan-
cial aspects of microfinance. Although impact analysis isreviewed briefly, a thorough discussion of poverty target-ing and of the poverty alleviation effects of microfinance isleft to other studies and publications.We are confident that this handbook will contribute
significantly to the improvement of policies and prac-tices in the microfinance field.
Ian JohnsonVice PresidentEnvironmentally and Socially Sustainable Development
Masood AhmedActing Vice PresidentFinance, Private Sector and Infrastructure
Jean-Michel SeverinoVice PresidentEast Asia and Pacific Region
Mieko NishimizuVice PresidentSouth Asia Region
Preface
The Microfinance Handbook, one of the majorproducts of the World Bank’s SustainableBanking with the Poor Project, gathers and pre-
sents up-to-date knowledge directly or indirectly con-tributed by leading experts in the field of microfinance.It is intended as a comprehensive source for donors, poli-cymakers, and practitioners, as it covers in depth matterspertaining to the regulatory and policy framework andthe essential components of institutional capacity build-ing—product design, performance measuring and moni-toring, and management of microfinance institutions.The handbook was developed with contributions
from other parts of the World Bank, including theConsultative Group to Assist the Poorest. It also benefit-ed from the experience of a wide range of practitionersand donors from such organizations as ACCIONInternational, Calmeadow, CARE, Women’s WorldBanking, the Small Enterprise Education and PromotionNetwork, the MicroFinance Network, the U.S. Agencyfor International Development, Deutsche Gesellschaftfür Technische Zusammenarbeit, Caisse Française deDéveloppement, and the Inter-American DevelopmentBank.Special thanks are due to the outside sponsors of the
Sustainable Banking with the Poor Project—the SwissAgency for Development and Cooperation, the RoyalMinistry of Foreign Affairs of Norway, and the FordFoundation—for their patience, encouragement, andsupport.I would like to thank the many individuals who con-
tributed substantially to this handbook. A first draft wasprepared by staff members at both the SustainableBanking with the Poor Project and the Consultative
Group to Assist the Poorest. I am grateful to MikeGoldberg and Gregory Chen for their initial contribu-tions. Thomas Dichter wrote the sections on impactanalysis and enterprise development services and provid-ed comments on other chapters. Tony Sheldon wrotethe chapter on management information systems andprovided comments on the first draft. ReinhardtSchmidt contributed substantially to the chapter oninstitutions.I wish to thank especially Cecile Fruman for her ini-
tial and ongoing contributions, comments, and support.I also appreciate the support and flexibility of Carlos E.Cuevas, which were vital in keeping the process going.Thanks are extended to Julia Paxton and StephanieCharitonenko Church for their contributions as well asto the many people who reviewed various chapters andprovided comments, including Jacob Yaron, LynnBennett, Mohini Malhotra, McDonald Benjamin,Jeffrey Poyo, Jennifer Harold, Bikki Randhawa, JoyitaMukherjee, Jennifer Isern, and Joakim Vincze.I would also like to thank Laura Gomez for her con-
tinued support in formatting the handbook and manag-ing its many iterations.The book was edited, designed, and typeset by Com-
munications Development Inc.
*****
The Sustainable Banking with the Poor Project team isled by Lynn Bennett and Jacob Yaron, task managers.Carlos E. Cuevas is the technical manager and CecileFruman is the associate manager. Laura Gomez is theadministrative assistant.
xvi
1
Introduction
Ithas been estimated that there are 500 million econom-ically active poor people in the world operatingmicroenterprises and small businesses (Women’s World
Banking 1995). Most of them do not have access to ade-quate financial services. To meet this substantial demand forfinancial services by low-income microentrepreneurs,microfinance practitioners and donors alike must adopt along-term perspective. The purpose of this handbook is tobring together in a single source guiding principles and toolsthat will promote sustainable microfinance and create viableinstitutions.The goal of this book is to provide a comprehensive
source for the design, implementation, evaluation, andmanagement of microfinance activities.1
The handbook takes a global perspective, drawing onlessons learned from the experiences of microfinancepractitioners, donors, and others throughout the world.It offers readers relevant information that will help themto make informed and effective decisions suited to theirspecific environment and objectives.
Microfinance Defined
Microfinance has evolved as an economic developmentapproach intended to benefit low-income women andmen. The term refers to the provision of financial servicesto low-income clients, including the self-employed.
Financial services generally include savings and credit;however, some microfinance organizations also provideinsurance and payment services. In addition to financialintermediation, many MFIs provide social intermediationservices such as group formation, development of self-confidence, and training in financial literacy and manage-ment capabilities among members of a group. Thus thedefinition of microfinance often includes both financialintermediation and social intermediation. Microfinance isnot simply banking, it is a development tool.Microfinance activities usually involve:
� Small loans, typically for working capital� Informal appraisal of borrowers and investments� Collateral substitutes, such as group guarantees orcompulsory savings
� Access to repeat and larger loans, based on repaymentperformance
� Streamlined loan disbursement and monitoring� Secure savings products.Although some MFIs provide enterprise development
services, such as skills training and marketing, and socialservices, such as literacy training and health care, theseare not generally included in the definition of microfi-nance. (However, enterprise development services andsocial services are discussed briefly in chapter 3, as someMFIs provide these services.)MFIs can be nongovernmental organizations
(NGOs), savings and loan cooperatives, credit unions,
1. The term “microfinance activity” is used throughout to describe the operations of a microfinance institution, a microfinance pro-ject, or a microfinance component of a project. When referring to an organization providing microfinance services, whether regulat-ed or unregulated, the term “microfinance institution” (MFI) is used.
2 M I C R O F I N A N C E H A N D B O O K
government banks, commercial banks, or nonbankfinancial institutions. Microfinance clients are typicallyself-employed, low-income entrepreneurs in both urbanand rural areas. Clients are often traders, street vendors,small farmers, service providers (hairdressers, rickshawdrivers), and artisans and small producers, such as black-smiths and seamstresses. Usually their activities providea stable source of income (often from more than oneactivity). Although they are poor, they are generally notconsidered to be the “poorest of the poor.”Moneylenders, pawnbrokers, and rotating savings and
credit associations are informal microfinance providersand important sources of financial intermediation butthey are not discussed in detail in this handbook. Rather,the focus is on more formal MFIs.
Background
Microfinance arose in the 1980s as a response todoubts and research findings about state delivery ofsubsidized credit to poor farmers. In the 1970s govern-ment agencies were the predominant method of pro-viding productive credit to those with no previousaccess to credit facilities—people who had been forcedto pay usurious interest rates or were subject to rent-seeking behavior. Governments and internationaldonors assumed that the poor required cheap creditand saw this as a way of promoting agricultural pro-duction by small landholders. In addition to providingsubsidized agricultural credit, donors set up creditunions inspired by the Raiffeisen model developed inGermany in 1864. The focus of these cooperativefinancial institutions was mostly on savings mobiliza-tion in rural areas in an attempt to “teach poor farmershow to save.”Beginning in the mid-1980s, the subsidized, targeted
credit model supported by many donors was the objectof steady criticism, because most programs accumulatedlarge loan losses and required frequent recapitalization tocontinue operating. It became more and more evidentthat market-based solutions were required. This led to anew approach that considered microfinance as an inte-gral part of the overall financial system. Emphasis shiftedfrom the rapid disbursement of subsidized loans to targetpopulations toward the building up of local, sustainableinstitutions to serve the poor.
At the same time, local NGOs began to look for amore long-term approach than the unsustainable income-generation approaches to community development. InAsia Dr. Mohammed Yunus of Bangladesh led the waywith a pilot group lending scheme for landless people.This later became the Grameen Bank, which now servesmore than 2.4 million clients (94 percent of themwomen) and is a model for many countries. In LatinAmerica ACCION International supported the develop-ment of solidarity group lending to urban vendors, andFundación Carvajal developed a successful credit andtraining system for individual microentrepreneurs.Changes were also occurring in the formal financial
sector. Bank Rakyat Indonesia, a state-owned, ruralbank, moved away from providing subsidized credit andtook an institutional approach that operated on marketprinciples. In particular, Bank Rakyat Indonesia devel-oped a transparent set of incentives for its borrowers(small farmers) and staff, rewarding on-time loan repay-ment and relying on voluntary savings mobilization as asource of funds.Since the 1980s the field of microfinance has grown
substantially. Donors actively support and encouragemicrofinance activities, focusing on MFIs that are com-mitted to achieving substantial outreach and financialsustainability. Today the focus is on providing financialservices only, whereas the 1970s and much of the 1980swere characterized by an integrated package of credit andtraining—which required subsidies. Most recently,microfinance NGOs (including PRODEM/BancoSol inBolivia, K-REP in Kenya, and ADEMI/BancoADEMIin the Dominican Republic) have begun transforminginto formal financial institutions that recognize the needto provide savings services to their clients and to accessmarket funding sources, rather than rely on donor funds.This recognition of the need to achieve financial sustain-ability has led to the current “financial systems”approach to microfinance. This approach is characterizedby the following beliefs:� Subsidized credit undermines development.� Poor people can pay interest rates high enough tocover transaction costs and the consequences of theimperfect information markets in which lendersoperate.
� The goal of sustainability (cost recovery and eventu-ally profit) is the key not only to institutional perma-
I N T R O D U C T I O N 3
nence in lending, but also to making the lendinginstitution more focused and efficient.
� Because loan sizes to poor people are small, MFIsmust achieve sufficient scale if they are to becomesustainable.
� Measurable enterprise growth, as well as impacts onpoverty, cannot be demonstrated easily or accurately;outreach and repayment rates can be proxies for impact.One of the main assumptions in the above view is
that many poor people actively want productive creditand that they can absorb and use it. But as the field ofmicrofinance has evolved, research has increasinglyfound that in many situations poor people want securesavings facilities and consumption loans just as much asproductive credit and in some cases instead of produc-tive credit. MFIs are beginning to respond to thesedemands by providing voluntary savings services andother types of loans.
Size of the Microfinance Industry
During 1995 and 1996 the Sustainable Banking withthe Poor Project compiled a worldwide inventory ofMFIs. The list included nearly 1,000 institutions thatprovided microfinance services, reached at least 1,000clients, and had operated for a minimum of three years.From this inventory, more than 200 institutionsresponded to a two-page questionnaire covering basicinstitutional characteristics.According to the survey results, by September 1995
about US$7 billion in outstanding loans had been pro-vided to more than 13 million individuals and groups.In addition, more than US$19 billion had been mobi-lized in 45 million active deposit accounts.The general conclusions of the inventory were:
� Commercial and savings banks were responsible forthe largest share of the outstanding loan balance anddeposit balance.
� Credit unions represented 11 percent of the totalnumber of loans in the sample and 13 percent of theoutstanding loan balance.
� NGOs made up more than half of the sample, butthey accounted for only 9 percent of the total num-ber of outstanding loans and 4 percent of the out-standing loan balance.
� Sources of funds to finance loan portfolios differed bytype of institution. NGOs relied heavily on donorfunding or concessional funds for the majority of theirlending. Banks, savings banks, and credit unions fund-ed their loan portfolios with client and memberdeposits and commercial loans.
� NGOs offered the smallest loan sizes and relativelymore social services than banks, savings banks, orcredit unions.
� Credit unions and banks are leaders in serving largenumbers of clients with small deposit accounts.The study also found that basic accounting capacities
and reporting varied widely among institutions, in manycases revealing an inability to report plausible cost andarrears data. This shortcoming, notably among NGOs,highlights the need to place greater emphasis on financialmonitoring and reporting using standardized practices (aprimary purpose of this handbook). Overall, the findingssuggest that favorable macroeconomic conditions, man-aged growth, deposit mobilization, and cost control, incombination, are among the key factors that contributeto the success and sustainability of many microfinanceinstitutions.
Why is Microfinance Growing?
Microfinance is growing for several reasons:1. The promise of reaching the poor. Microfinance activi-ties can support income generation for enterprisesoperated by low-income households.
2. The promise of financial sustainability. Microfinanceactivities can help to build financially self-sufficient,subsidy-free, often locally managed institutions.
3. The potential to build on traditional systems. Micro-finance activities sometimes mimic traditional systems(such as rotating savings and credit associations). Theyprovide the same services in similar ways, but withgreater flexibility, at a more affordable price tomicroenterprises and on a more sustainable basis. Thiscan make microfinance services very attractive to alarge number of low-income clients.
4. The contribution of microfinance to strengthening andexpanding existing formal financial systems. Micro-finance activities can strengthen existing formalfinancial institutions, such as savings and loan coop-
4 M I C R O F I N A N C E H A N D B O O K
eratives, credit union networks, commercial banks,and even state-run financial institutions, by expand-ing their markets for both savings and credit—and,potentially, their profitability.
5. The growing number of success stories. There is anincreasing number of well-documented, innovativesuccess stories in settings as diverse as ruralBangladesh, urban Bolivia, and rural Mali. This is instark contrast to the records of state-run specializedfinancial institutions, which have received largeamounts of funding over the past few decades buthave failed in terms of both financial sustainabilityand outreach to the poor.
6. The availability of better financial products as a resultof experimentation and innovation. The innovationsthat have shown the most promise are solving theproblem of lack of collateral by using group-basedand character-based approaches; solving problems ofrepayment discipline through high frequency ofrepayment collection, the use of social and peerpressure, and the promise of higher repeat loans;solving problems of transaction costs by movingsome of these costs down to the group level and byincreasing outreach; designing staff incentives toachieve greater outreach and high loan repayment;and providing savings services that meet the needs ofsmall savers.
What Are the Risks of Microfinance?
Sound microfinance activities based on best practices playa decisive role in providing the poor with access to finan-cial services through sustainable institutions. However,there have been many more failures than successes:� Some MFIs target a segment of the population thathas no access to business opportunities because of lackof markets, inputs, and demand. Productive credit isof no use to such people without other inputs.
� Many MFIs never reach either the minimal scale orthe efficiency necessary to cover costs.
� Many MFIs face nonsupportive policy frameworks anddaunting physical, social, and economic challenges.
� Some MFIs fail to manage their funds adequatelyenough to meet future cash needs and, as a result,they confront a liquidity problem.
� Others develop neither the financial management sys-tems nor the skills required to run a successful operation.
� Replication of successful models has at times proveddifficult, due to differences in social contexts and lackof local adaptation.Ultimately, most of the dilemmas and problems
encountered in microfinance have to do with how clear theorganization is about its principal goals. Does an MFI pro-vide microfinance to lighten the heavy burdens of poverty?Or to encourage economic growth? Or to help poorwomen develop confidence and become empowered with-in their families? And so on. In a sense, goals are a matterof choice; and in development, an organization can chooseone or many goals—provided its constituents, governancestructure, and funding are all in line with those goals.
About This Book
This handbook was written for microfinance practition-ers, donors, and the wider readership of academics, con-sultants, and others interested in microfinance design,implementation, evaluation, and management. It offers aone-stop guide that covers most topics in enough detailthat most readers will not need to refer to other sources.At first glance it might seem that practitioners and
donors have very different needs and objectives and thuscould not possibly benefit equally from one book.The objectives of many donors who support microfi-
nance activities are to reduce poverty and empower spe-cific segments of the population (for example, women,indigenous peoples). Their primary concerns traditional-ly have been the amount of funds they are able to dis-burse and the timely receipt of requested (and, it ishoped, successful) performance indicators. Donors arerarely concerned with understanding the details ofmicrofinance. Rather, it is often enough for them tobelieve that microfinance simply works.Practitioners need to know how actually to operate a
microfinance institution. Their objectives are to meetthe needs of their clients and to continue to operate inthe long term.Given the purpose of this handbook, it seems to be
directed more toward practitioners than toward donors.However, donors are beginning to realize that MFIcapacity is a more binding constraint than the availability
of funds, making it essential for donors and practitionersto operate from the same perspective if they are to meeteffectively the substantial need for financial services. Infact, if we look briefly at the evolution of microfinance, itis apparent that both donors and practitioners need tounderstand how microfinance institutions operate.When microfinance first emerged as a development tool,
both donors and practitioners focused on the cumulativeamount of loans disbursed, with no concern for how well theloans suited borrower needs and little concern about whetheror not loans were repaid. Donors were rewarded for disburs-ing funds, and practitioners were rewarded for on-lendingthose funds to as many people (preferably women) as possi-ble. Neither was particularly accountable for the long-termsustainability of the microfinance institution or for the long-term effect on borrowers or beneficiaries.Now that the field of microfinance is more mature, it is
becoming clear that effective, efficient, and sustainableinstitutions are needed to provide financial services wellsuited to the demands of low-income clients. Both donorsand practitioners are beginning to be held accountable forresults. The focus is no longer solely on quantity—on theamount disbursed—but on the quality of operations. Thisview is based on the notion that borrowers will buy micro-finance products if they value the service; that is, if theproduct is right for them. Borrowers are now being treatedas clients rather than beneficiaries. Thus if they are to beeffective and truly meet their development objectives,donors must support MFIs that are “doing it right.” Todo so, they need to understand how to both recognize andevaluate a good microfinance provider.As it turns out, both donors and practitioners are real-
ly on the same side—their joint goal is to make availableappropriate services to low-income clients. Therefore, itfalls to donors and practitioners themselves to define bestpractices and to advocate policies that will encouragegrowth, consistency, and accountability in the field. Theintent of this handbook is to provide a basis of commonunderstanding among all stakeholders.
Organization of the Book
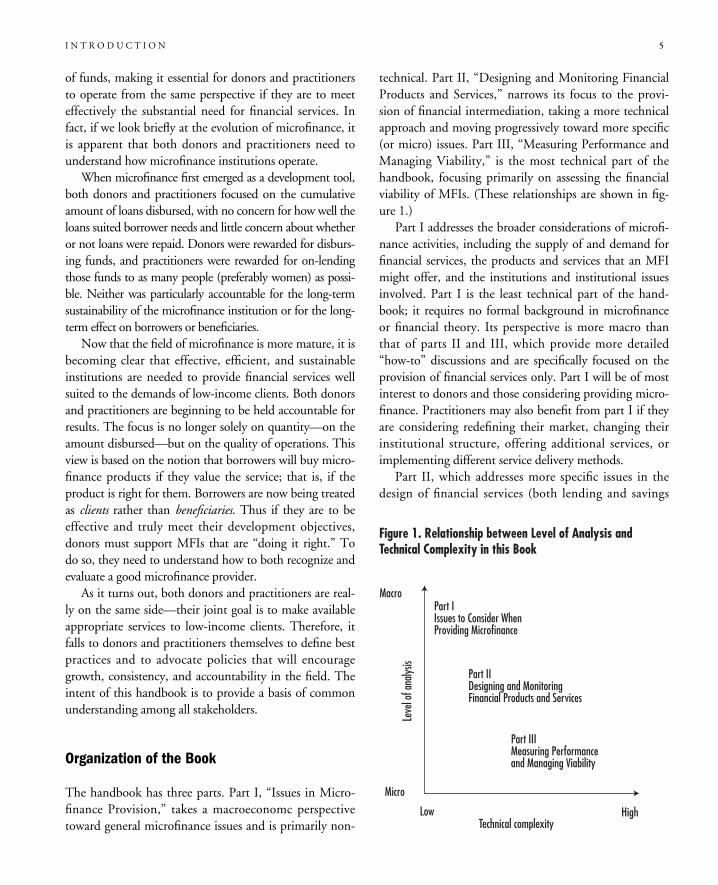
The handbook has three parts. Part I, “Issues in Micro-finance Provision,” takes a macroeconomc perspectivetoward general microfinance issues and is primarily non-
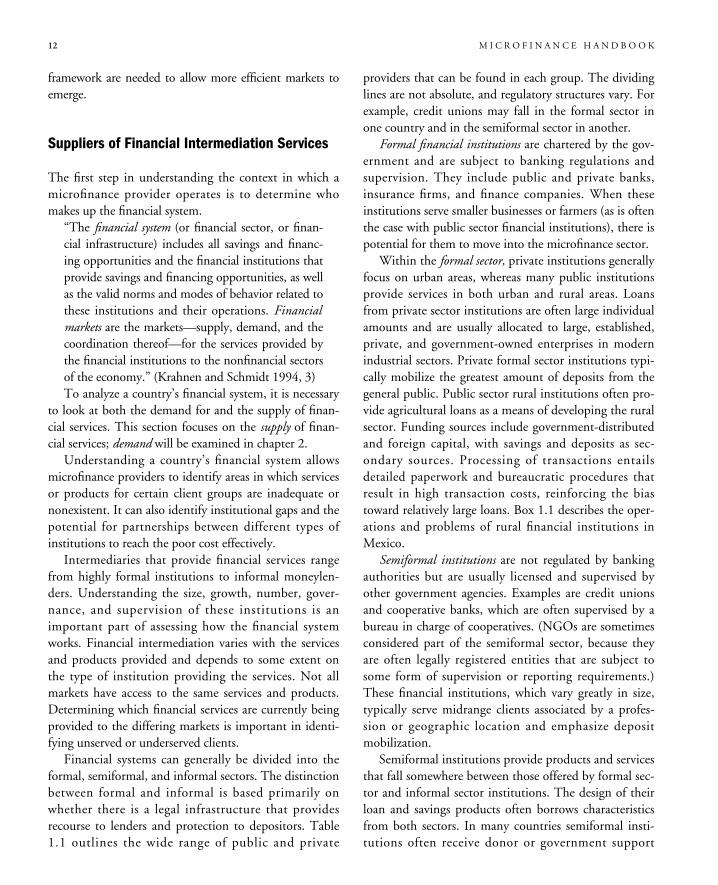
technical. Part II, “Designing and Monitoring FinancialProducts and Services,” narrows its focus to the provi-sion of financial intermediation, taking a more technicalapproach and moving progressively toward more specific(or micro) issues. Part III, “Measuring Performance andManaging Viability,” is the most technical part of thehandbook, focusing primarily on assessing the financialviability of MFIs. (These relationships are shown in fig-ure 1.)Part I addresses the broader considerations of microfi-
nance activities, including the supply of and demand forfinancial services, the products and services that an MFImight offer, and the institutions and institutional issuesinvolved. Part I is the least technical part of the hand-book; it requires no formal background in microfinanceor financial theory. Its perspective is more macro thanthat of parts II and III, which provide more detailed“how-to” discussions and are specifically focused on theprovision of financial services only. Part I will be of mostinterest to donors and those considering providing micro-finance. Practitioners may also benefit from part I if theyare considering redefining their market, changing theirinstitutional structure, offering additional services, orimplementing different service delivery methods.Part II, which addresses more specific issues in the
design of financial services (both lending and savings
I N T R O D U C T I O N 5
Figure 1. Relationship between Level of Analysis andTechnical Complexity in this Book
Macro
Micro
Low High
Leve
lofa
nalys
is
Technical complexity
Part IIssues to Consider WhenProviding Microfinance
Part IIDesigning and MonitoringFinancial Products and Services
Part IIIMeasuring Performanceand Managing Viability
6 M I C R O F I N A N C E H A N D B O O K
products) and the development of management informa-tion systems, will be of most interest to practitioners whoare developing, modifying, or refining their financial prod-ucts or systems, and donors or consultants who are evalu-ating microfinance organizations and the appropriatenessof the products and services that they provide. Part IIincorporates some basic financial theory and, accordingly,readers should have a basic understanding of financialmanagement. Readers should also be familiar with using afinancial calculator, computer spreadsheet, or both.Part III provides tools for evaluating the financial health
of an MFI and a means of managing operational issues.The material focuses primarily on financial intermediation(that is, credit and savings services, based on the assump-tion that the main activity of an MFI is the provision offinancial services). Social intermediation and enterprisedevelopment services are not addressed directly. However,basic financial theory that is relevant to the financial man-agement of MFIs delivering these services is provided aswell. The material also underscores the importance of theinterrelationship between serving clients well and movingtowards institutional and financial self-sufficiency. Thesetwo goals serve each other; neither is sufficient on its own.As the most technical section of the handbook, part
III will be of particular interest to practitioners and con-sultants. Donors will also benefit from part III if theywant to understand how MFIs should be adjusting theirfinancial statements and calculating performance indica-tors. While the technical information is fairly basic,some understanding of financial statements and finan-cial analysis is required.The overall purpose of part III is to improve the
level of financial understanding and management inMFI operations. As donors come to understand boththe complexity of microfinance and that it can be deliv-ered in a financially sustainable manner, knowledge ofthe more technical aspects of microfinance will becomeincreasingly important to them in deciding whether tosupport institutions and programs.Each chapter is designed to be used alone or in con-
junction with other chapters, depending on the specificneeds of the reader. A list of sources and additionalreading material is provided at the end of each chapter.Many of the publications listed at the end of each
chapter can be accessed through the following organiza-tions, either by mail or through their Web sites:
ACCION Publications Department733 15th Street NW, Suite 700Washington D.C. 20005Phone: 1 202 393 5113, Fax 1 202 393 5115Web: www.accion.orgE-mail: [email protected]
Calmeadow Resource Center365 Bay Street, Suite 600Toronto, Canada M5H 2V1Phone: 1 416 362 9670, Fax: 1 416 362 0769Web: www.calmeadow.comE-mail: [email protected]
CGAP SecretariatRoom G4-115, The World Bank1818 H Street NWWashington D.C. 20433Phone: 1 202 473 9594, Fax: 1 202 522 3744Web: www.worldbank.org/html/cgap/cgap.htmlE-mail: [email protected]
Micro Finance Network733 15th Street NW, Suite 700Washington D.C. 20005Phone: 1 202 347 2953, Fax 1 202 347 2959Web: www.bellanet.org/partners/mfnE-mail: [email protected]
PACT Publications777 United Nations PlazaNew York, NY 10017Phone: 1 212 697 6222, Fax: 1 212 692 9748Web: www.pactpub.comE-mail: [email protected]
Part I—Issues in Microfinance Provision
Chapter 1–The Country Context provides a frameworkfor analyzing contextual factors. It focuses on issues thataffect the supply of microfinance, including the finan-cial sector, financial sector policies and legal enforce-ment, financial sector regulation and supervision, andeconomic and social policies.
Chapter 2–The Target Market and Impact Analysislooks at the demand for financial services among low-

I N T R O D U C T I O N 7
income populations and presents ways of identifying atarget market based on client characteristics and thetypes of enterprises they operate. It also discusses impactanalysis and how the desired impact affects an MFI’schoice of target market.
Chapter 3–Products and Services considers the variousservices that low-income entrepreneurs might demand,including financial and social intermediation, enterprisedevelopment, and social services. An overview of well-known microfinance approaches is presented in theappendix.
Chapter 4–The Institution discusses the various typesof institutions that can effectively provide and managethe provision of microfinance activities. It addressesissues such as legal structures, governance, and institu-tional capacity, and also provides information on access-ing capital markets for funding.
Part II—Designing and Monitoring Financial Productsand Services
Chapter 5–Designing Lending Products provides informa-tion on how to design or modify lending products formicroentrepreneurs both to meet their needs and toensure financial sustainability of the MFI.
Chapter 6–Designing Savings Products provides infor-mation on the legal requirements to provide savings,types of savings products, and operational considerationsfor providing savings, including pricing. This chapterfocuses on the provision of voluntary savings; it does notaddress forced or compulsory savings often associatedwith lending products.
Chapter 7–Management Information Systems (MIS)presents an overview of effective MIS, includingaccounting systems, loan-tracking systems, and client-impact tracking systems. It also provides a brief discus-sion on the process of installing an MIS and a summaryevaluation of existing software packages.
Part III—Measuring Performance and Managing Viability
Chapter 8–Adjusting Financial Statements presents theadjustments to financial statements that are required toaccount for loan losses, depreciation, accrued interest,inflation, and subsidies. Adjustments are presented intwo groups: standard entries that should be included inthe financial statements and adjustments that restate
financial results to reflect more accurately the financialposition of an MFI.
Chapter 9–Performance Indicators details how to mea-sure and evaluate the financial performance of the MFI,focusing on ratio analysis to determine how successful isthe institution’s performance and which areas could beimproved. In addition, it provides various outreach indi-cators that can be monitored.
Chapter 10–Performance Management presents waysin which to improve the financial and resource manage-ment of microfinance institutions. It discusses delin-quency management, staff productivity and incentives,and risk management, including asset and liability man-agement.
A Necessary Caveat
Microfinance has recently become the favorite interven-tion for development institutions, due to its uniquepotential for poverty reduction and financial sustainabil-ity. However, contrary to what some may claim, micro-finance is not a panacea for poverty alleviation. In fact, apoorly designed microfinance activity can make thingsworse by disrupting informal markets that have reliablyprovided financial services to poor households over thepast couple of centuries, albeit at a high cost.There are many situations in which microfinance is
neither the most important nor the most feasible activi-ty for a donor or other agency to support. Infra-structure, health, education, and other social services arecritical to balanced economic development; and each inits own way contributes to a better environment formicrofinance activities in the future. Care should betaken to ensure that the provision of microfinance istruly demand driven, rather than simply a means to sat-isfy donors’ agendas.
Sources and Further Reading
Gonzalez-Vega, Claudio, and Douglas H. Graham. 1995.“State-Owned Agricultural Development Banks: Lessonsand Opportunities for Microfinance.” Occasional Paper2245. Ohio State University, Department of AgriculturalEconomics, Columbus, Ohio.

Mutua, Kimanthi, Pittayapol Nataradol, and Maria Otero.1996. “The View from the Field: Perspectives fromManagers of Microfinance Institutions.” In Lynn Bennettand Carlos Cuevas, eds., Journal of InternationalDevelopment 8 (2): 195–210.
Paxton, Julia. 1996. “A Worldwide Inventory of Microfinance
Institutions.” Sustainable Banking with the Poor, WorldBank, Washington, D.C.
Women’s World Banking Global Policy Forum. 1995.“The Missing Links: Financial Systems That Work forthe Majority.” Women’s World Banking (April). NewYork.
8 M I C R O F I N A N C E H A N D B O O K
Part I–Issues to Consider WhenProviding Microfinance

11
Understanding theCountry Context
C H A P T E R O N E
The overall political and economic environment ofa country affects how microfinance is provided.Government economic and social polices, as well
as the development level of the financial sector, influencemicrofinance organizations in the delivery of financial ser-vices to the poor. Understanding these factors and theireffect on microfinance is called assessing the country con-text. This process asks the following questions:� Who are the suppliers of financial services? Whatproducts and services do they supply? What role dogovernments and donors play in providing financialservices to the poor?
� How do existing financial sector policies affect theprovision of financial services, including interest ratepolicies, government mandates for sectoral credit allo-cation, and legal enforcement policies?
� What forms of financial sector regulation exist, andare MFIs subject to these regulations?
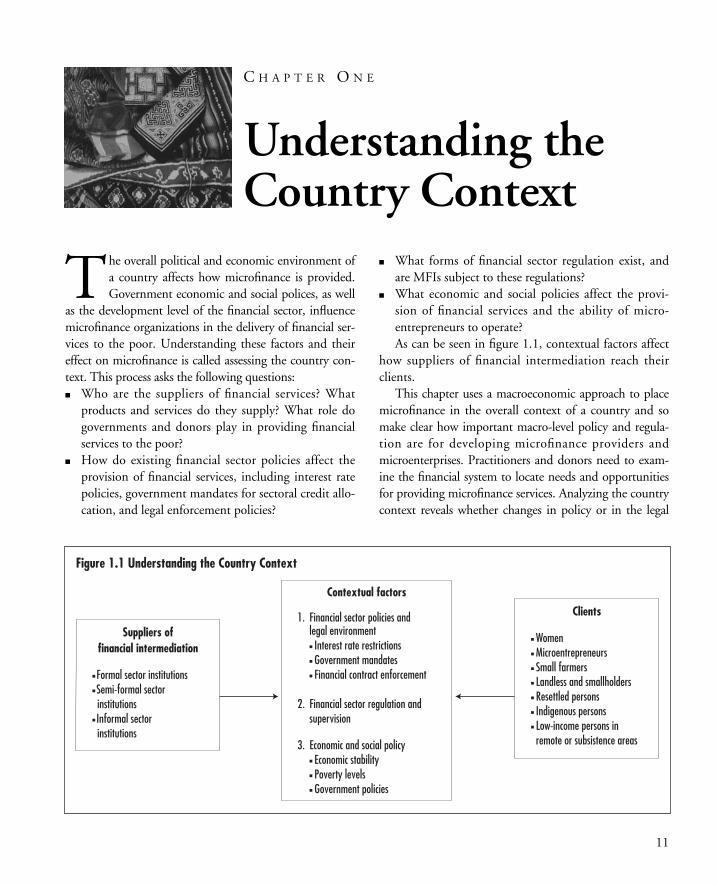
� What economic and social policies affect the provi-sion of financial services and the ability of micro-entrepreneurs to operate?As can be seen in figure 1.1, contextual factors affect
how suppliers of financial intermediation reach theirclients.This chapter uses a macroeconomic approach to place
microfinance in the overall context of a country and somake clear how important macro-level policy and regula-tion are for developing microfinance providers andmicroenterprises. Practitioners and donors need to exam-ine the financial system to locate needs and opportunitiesfor providing microfinance services. Analyzing the countrycontext reveals whether changes in policy or in the legal
Figure 1.1 Understanding the Country Context
Contextual factors
1. Financial sector policies andlegal environmentn Interest rate restrictionsn Government mandatesn Financial contract enforcement
2. Financial sector regulation andsupervision
3. Economic and social policyn Economic stabilityn Poverty levelsn Government policies
Clients
n Womenn Microentrepreneursn Small farmersn Landless and smallholdersn Resettled personsn Indigenous personsn Low-income persons inremote or subsistence areas
Suppliers offinancial intermediation
n Formal sector institutionsn Semi-formal sectorinstitutions
n Informal sectorinstitutions
12 M I C R O F I N A N C E H A N D B O O K
framework are needed to allow more efficient markets toemerge.
Suppliers of Financial Intermediation Services
The first step in understanding the context in which amicrofinance provider operates is to determine whomakes up the financial system.“The financial system (or financial sector, or finan-cial infrastructure) includes all savings and financ-ing opportunities and the financial institutions thatprovide savings and financing opportunities, as wellas the valid norms and modes of behavior related tothese institutions and their operations. Financialmarkets are the markets—supply, demand, and thecoordination thereof—for the services provided bythe financial institutions to the nonfinancial sectorsof the economy.” (Krahnen and Schmidt 1994, 3)To analyze a country’s financial system, it is necessary
to look at both the demand for and the supply of finan-cial services. This section focuses on the supply of finan-cial services; demand will be examined in chapter 2.Understanding a country’s financial system allows
microfinance providers to identify areas in which servicesor products for certain client groups are inadequate ornonexistent. It can also identify institutional gaps and thepotential for partnerships between different types ofinstitutions to reach the poor cost effectively.Intermediaries that provide financial services range
from highly formal institutions to informal moneylen-ders. Understanding the size, growth, number, gover-nance, and supervision of these institutions is animportant part of assessing how the financial systemworks. Financial intermediation varies with the servicesand products provided and depends to some extent onthe type of institution providing the services. Not allmarkets have access to the same services and products.Determining which financial services are currently beingprovided to the differing markets is important in identi-fying unserved or underserved clients.Financial systems can generally be divided into the
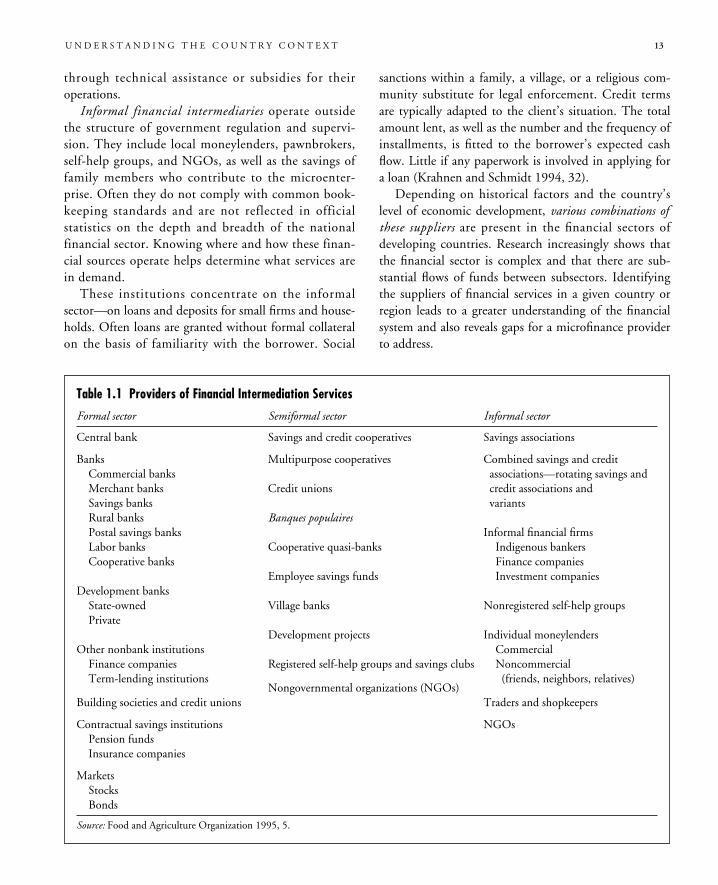
formal, semiformal, and informal sectors. The distinctionbetween formal and informal is based primarily onwhether there is a legal infrastructure that providesrecourse to lenders and protection to depositors. Table1.1 outlines the wide range of public and private
providers that can be found in each group. The dividinglines are not absolute, and regulatory structures vary. Forexample, credit unions may fall in the formal sector inone country and in the semiformal sector in another.
Formal financial institutions are chartered by the gov-ernment and are subject to banking regulations andsupervision. They include public and private banks,insurance firms, and finance companies. When theseinstitutions serve smaller businesses or farmers (as is oftenthe case with public sector financial institutions), there ispotential for them to move into the microfinance sector.Within the formal sector, private institutions generally
focus on urban areas, whereas many public institutionsprovide services in both urban and rural areas. Loansfrom private sector institutions are often large individualamounts and are usually allocated to large, established,private, and government-owned enterprises in modernindustrial sectors. Private formal sector institutions typi-cally mobilize the greatest amount of deposits from thegeneral public. Public sector rural institutions often pro-vide agricultural loans as a means of developing the ruralsector. Funding sources include government-distributedand foreign capital, with savings and deposits as sec-ondary sources. Processing of transactions entailsdetailed paperwork and bureaucratic procedures thatresult in high transaction costs, reinforcing the biastoward relatively large loans. Box 1.1 describes the oper-ations and problems of rural financial institutions inMexico.
Semiformal institutions are not regulated by bankingauthorities but are usually licensed and supervised byother government agencies. Examples are credit unionsand cooperative banks, which are often supervised by abureau in charge of cooperatives. (NGOs are sometimesconsidered part of the semiformal sector, because theyare often legally registered entities that are subject tosome form of supervision or reporting requirements.)These financial institutions, which vary greatly in size,typically serve midrange clients associated by a profes-sion or geographic location and emphasize depositmobilization.Semiformal institutions provide products and services
that fall somewhere between those offered by formal sec-tor and informal sector institutions. The design of theirloan and savings products often borrows characteristicsfrom both sectors. In many countries semiformal insti-tutions often receive donor or government support
through technical assistance or subsidies for theiroperations.
Informal financial intermediaries operate outsidethe structure of government regulation and supervi-sion. They include local moneylenders, pawnbrokers,self-help groups, and NGOs, as well as the savings offamily members who contribute to the microenter-prise. Often they do not comply with common book-keeping standards and are not reflected in officialstatistics on the depth and breadth of the nationalfinancial sector. Knowing where and how these finan-cial sources operate helps determine what services arein demand.These institutions concentrate on the informal
sector—on loans and deposits for small firms and house-holds. Often loans are granted without formal collateralon the basis of familiarity with the borrower. Social
sanctions within a family, a village, or a religious com-munity substitute for legal enforcement. Credit termsare typically adapted to the client’s situation. The totalamount lent, as well as the number and the frequency ofinstallments, is fitted to the borrower’s expected cashflow. Little if any paperwork is involved in applying fora loan (Krahnen and Schmidt 1994, 32).Depending on historical factors and the country’s
level of economic development, various combinations ofthese suppliers are present in the financial sectors ofdeveloping countries. Research increasingly shows thatthe financial sector is complex and that there are sub-stantial flows of funds between subsectors. Identifyingthe suppliers of financial services in a given country orregion leads to a greater understanding of the financialsystem and also reveals gaps for a microfinance providerto address.
U N D E R S T A N D I N G T H E C O U N T R Y C O N T E X T 13
Table 1.1 Providers of Financial Intermediation Services
Formal sector Semiformal sector Informal sector
Central bank Savings and credit cooperatives Savings associations
Banks Multipurpose cooperatives Combined savings and creditCommercial banks associations—rotating savings andMerchant banks Credit unions credit associations andSavings banks variantsRural banks Banques populairesPostal savings banks Informal financial firmsLabor banks Cooperative quasi-banks Indigenous bankersCooperative banks Finance companies
Employee savings funds Investment companiesDevelopment banksState-owned Village banks Nonregistered self-help groupsPrivate
Development projects Individual moneylendersOther nonbank institutions CommercialFinance companies Registered self-help groups and savings clubs NoncommercialTerm-lending institutions (friends, neighbors, relatives)
Nongovernmental organizations (NGOs)Building societies and credit unions Traders and shopkeepers
Contractual savings institutions NGOsPension fundsInsurance companies
MarketsStocksBonds
Source: Food and Agriculture Organization 1995, 5.
Existing Microfinance Providers
Microfinance providers are found in both the publicand the private sectors. To identify market gaps whenproviding or considering providing financial services tomicroentrepreneurs, it is important to determine whothe existing providers are and how well the needs ofthe market are being met. Donors can determine whois active in microfinance and who might require sup-port or funding. In areas where there is no microfi-nance activity, practitioners can determine who theircompetitors are and the effects they have on the mar-ketplace (such as developing awareness, increasing
demand, oversupplying, saturating or distorting themarket).
THE EFFECT OF GOVERNMENT PROGRAMS ON PRIVATE PRO-VIDERS. Depending on their approach, government-runmicrofinance programs can either contribute to or be detri-mental to successful microfinance activities. Governmentsthat operate subsidized, inefficient microfinance programsthrough health, social services, or other nonfinancial state-run ministries or departments (or through a state-run bank-ing system) negatively influence the provision of sustainablemicrofinance services (see box 1.2). Governments oftenhave little or no experience with implementing microfi-
14 M I C R O F I N A N C E H A N D B O O K
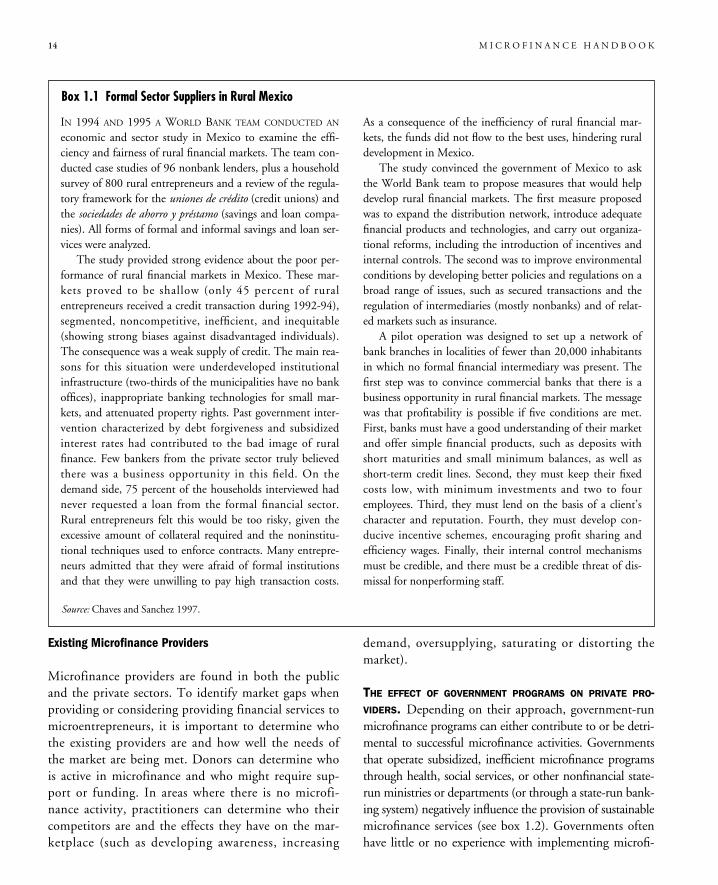
IN 1994 AND 1995 A WORLD BANK TEAM CONDUCTED AN
economic and sector study in Mexico to examine the effi-ciency and fairness of rural financial markets. The team con-ducted case studies of 96 nonbank lenders, plus a householdsurvey of 800 rural entrepreneurs and a review of the regula-tory framework for the uniones de crédito (credit unions) andthe sociedades de ahorro y préstamo (savings and loan compa-nies). All forms of formal and informal savings and loan ser-vices were analyzed.The study provided strong evidence about the poor per-
formance of rural financial markets in Mexico. These mar-kets proved to be shallow (only 45 percent of ruralentrepreneurs received a credit transaction during 1992-94),segmented, noncompetitive, inefficient, and inequitable(showing strong biases against disadvantaged individuals).The consequence was a weak supply of credit. The main rea-sons for this situation were underdeveloped institutionalinfrastructure (two-thirds of the municipalities have no bankoffices), inappropriate banking technologies for small mar-kets, and attenuated property rights. Past government inter-vention characterized by debt forgiveness and subsidizedinterest rates had contributed to the bad image of ruralfinance. Few bankers from the private sector truly believedthere was a business opportunity in this field. On thedemand side, 75 percent of the households interviewed hadnever requested a loan from the formal financial sector.Rural entrepreneurs felt this would be too risky, given theexcessive amount of collateral required and the noninstitu-tional techniques used to enforce contracts. Many entrepre-neurs admitted that they were afraid of formal institutionsand that they were unwilling to pay high transaction costs.
As a consequence of the inefficiency of rural financial mar-kets, the funds did not flow to the best uses, hindering ruraldevelopment in Mexico.The study convinced the government of Mexico to ask
the World Bank team to propose measures that would helpdevelop rural financial markets. The first measure proposedwas to expand the distribution network, introduce adequatefinancial products and technologies, and carry out organiza-tional reforms, including the introduction of incentives andinternal controls. The second was to improve environmentalconditions by developing better policies and regulations on abroad range of issues, such as secured transactions and theregulation of intermediaries (mostly nonbanks) and of relat-ed markets such as insurance.A pilot operation was designed to set up a network of
bank branches in localities of fewer than 20,000 inhabitantsin which no formal financial intermediary was present. Thefirst step was to convince commercial banks that there is abusiness opportunity in rural financial markets. The messagewas that profitability is possible if five conditions are met.First, banks must have a good understanding of their marketand offer simple financial products, such as deposits withshort maturities and small minimum balances, as well asshort-term credit lines. Second, they must keep their fixedcosts low, with minimum investments and two to fouremployees. Third, they must lend on the basis of a client’scharacter and reputation. Fourth, they must develop con-ducive incentive schemes, encouraging profit sharing andefficiency wages. Finally, their internal control mechanismsmust be credible, and there must be a credible threat of dis-missal for nonperforming staff.
Box 1.1 Formal Sector Suppliers in Rural Mexico
Source: Chaves and Sanchez 1997.
nance programs and no incentive to maintain long-termsustainability. Also, government microfinance programs areoften perceived as social welfare, as opposed to economicdevelopment efforts. Some government programs grow toolarge, without the necessary institutional base, and fail tocoordinate efforts with local NGOs or self-help groups.Governments that forgive existing debts of the poor
to state banks can have a tremendous effect on privatesector MFIs, whose borrowers may mistakenly under-stand that their loans need not be repaid either. In gen-eral, both donors and practitioners should determine theconsequences of existing or past credit subsidies or debtforgiveness (see box 1.3).Much discussion surrounds the involvement of gov-
ernment in the provision of microfinance. Some peopleargue that the government’s role is to create an enablingenvironment for the success of both microenterprises and
private sector microfinance organizations and that govern-ments should not lend funds directly to the poor. Othersargue that the government should provide financial ser-vices to microentrepreneurs but must do so on a commer-cial basis to provide continued access to microfinance andto avoid distorting the financial markets. Some advan-tages of government involvement include the capacity todisseminate the program widely and obtain political sup-port, the ability to address broader policy and regulatoryconcerns, and the capacity to obtain a significant amountof funds (Stearns and Otero 1990). A good example of asuccessfully run government operation is the Bank RakyatIndonesia, a profitable state bank in Indonesia that serveslow-income clients (box 1.4).
U N D E R S T A N D I N G T H E C O U N T R Y C O N T E X T 15
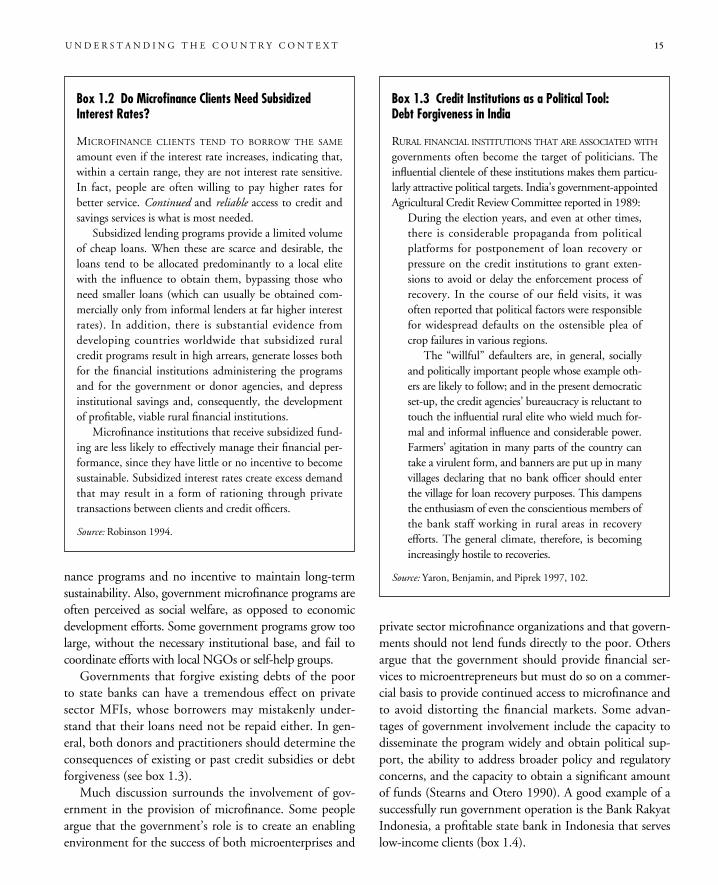
Box 1.2 Do Microfinance Clients Need SubsidizedInterest Rates?
MICROFINANCE CLIENTS TEND TO BORROW THE SAME
amount even if the interest rate increases, indicating that,within a certain range, they are not interest rate sensitive.In fact, people are often willing to pay higher rates forbetter service. Continued and reliable access to credit andsavings services is what is most needed.Subsidized lending programs provide a limited volume
of cheap loans. When these are scarce and desirable, theloans tend to be allocated predominantly to a local elitewith the influence to obtain them, bypassing those whoneed smaller loans (which can usually be obtained com-mercially only from informal lenders at far higher interestrates). In addition, there is substantial evidence fromdeveloping countries worldwide that subsidized ruralcredit programs result in high arrears, generate losses bothfor the financial institutions administering the programsand for the government or donor agencies, and depressinstitutional savings and, consequently, the developmentof profitable, viable rural financial institutions.Microfinance institutions that receive subsidized fund-
ing are less likely to effectively manage their financial per-formance, since they have little or no incentive to becomesustainable. Subsidized interest rates create excess demandthat may result in a form of rationing through privatetransactions between clients and credit officers.
Source: Robinson 1994.
Box 1.3 Credit Institutions as a Political Tool:Debt Forgiveness in India
RURAL FINANCIAL INSTITUTIONS THAT ARE ASSOCIATED WITHgovernments often become the target of politicians. Theinfluential clientele of these institutions makes them particu-larly attractive political targets. India’s government-appointedAgricultural Credit Review Committee reported in 1989:During the election years, and even at other times,there is considerable propaganda from politicalplatforms for postponement of loan recovery orpressure on the credit institutions to grant exten-sions to avoid or delay the enforcement process ofrecovery. In the course of our field visits, it wasoften reported that political factors were responsiblefor widespread defaults on the ostensible plea ofcrop failures in various regions.The “willful” defaulters are, in general, socially
and politically important people whose example oth-ers are likely to follow; and in the present democraticset-up, the credit agencies’ bureaucracy is reluctant totouch the influential rural elite who wield much for-mal and informal influence and considerable power.Farmers’ agitation in many parts of the country cantake a virulent form, and banners are put up in manyvillages declaring that no bank officer should enterthe village for loan recovery purposes. This dampensthe enthusiasm of even the conscientious members ofthe bank staff working in rural areas in recoveryefforts. The general climate, therefore, is becomingincreasingly hostile to recoveries.
Source: Yaron, Benjamin, and Piprek 1997, 102.
THE EFFECT OF PRIVATE MICROFINANCE PROVIDERS ON
OTHER SUPPLIERS. Private sector MFIs are often indige-nous groups or NGOs operated by local leaders in theircommunities. They are frequently supported by interna-tional donors and international NGOs that providetechnical assistance or funding, particularly in the start-up phase. Some private MFIs still subsidize interest ratesor deliver subsidized services; others create self-sufficientoperations and rely less and less on external donorfunds. A few are beginning to access funding throughcommercial banks and international money markets. Inaddition to NGOs, both banks and nonbank financialintermediaries may provide financial services to themicrosector.Private sector MFIs that have operated in or are cur-
rently operating in the country or region influence thesuccess of new providers by establishing client (or bene-ficiary) expectations. For example, in Bangladesh theGrameen Bank is so well known within the village pop-ulation that other microfinance providers routinelyadopt the Grameen lending model, and when GrameenBank changes its interest rate or adds a new product,clients of other MFIs demand the same. Microfinanceorganizations should be aware of the services offered byother MFIs and the effects they may have on the effec-tive delivery of financial services (see table 1.2).
What Role Do Donors Play in Microfinance?
Donors’ interest in microfinance has increased substan-tially over the past few years. Virtually all donors,including local, bilateral, and multilateral governmentdonors and local and international NGOs, supportmicrofinance activities in some way, providing one ormore of the following services:� Grants for institutional capacity building� Grants to cover operating shortfalls� Grants for loan capital or equity� Concessional loans to fund on-lending� Lines of credit� Guarantees for commercial funds� Technical assistance.Because donors are the primary funders of microfi-
nance activities (since most MFIs do not collect savingsand are not yet financially viable enough to access com-mercial funding), the approach they take to microfi-nance and the requirements they set for MFIs to accessfunding can greatly affect the development of the fieldof microfinance. Most donors have moved away fromsubsidized lending and are focusing more on capacitybuilding and the provision of loan capital. However,there is a variety of microfinance providers and a varietyof approaches taken by donors. In fact, most MFIs work
16 M I C R O F I N A N C E H A N D B O O K
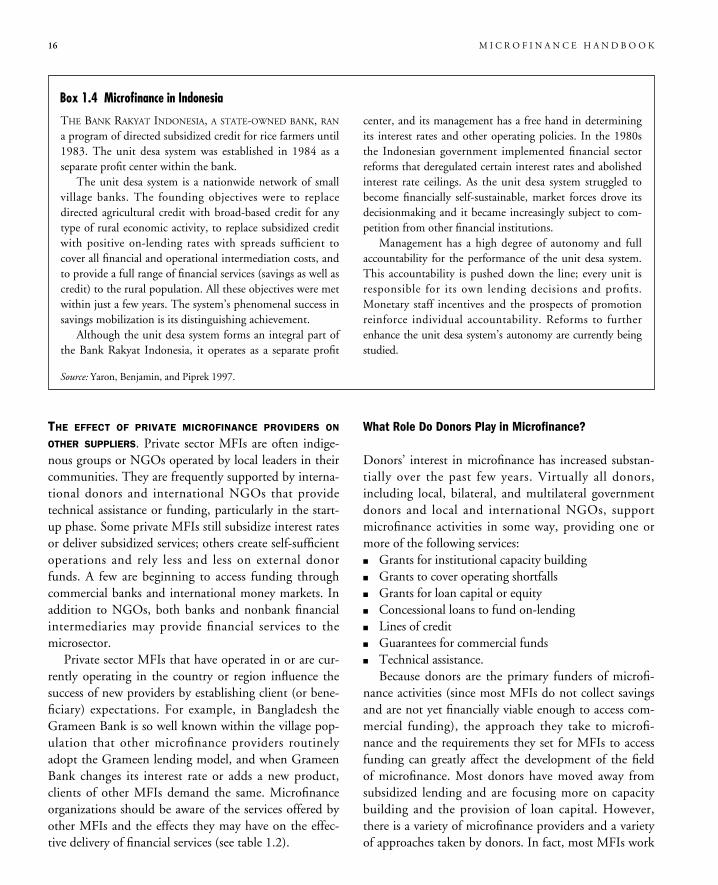
THE BANK RAKYAT INDONESIA, A STATE-OWNED BANK, RANa program of directed subsidized credit for rice farmers until1983. The unit desa system was established in 1984 as aseparate profit center within the bank.The unit desa system is a nationwide network of small
village banks. The founding objectives were to replacedirected agricultural credit with broad-based credit for anytype of rural economic activity, to replace subsidized creditwith positive on-lending rates with spreads sufficient tocover all financial and operational intermediation costs, andto provide a full range of financial services (savings as well ascredit) to the rural population. All these objectives were metwithin just a few years. The system’s phenomenal success insavings mobilization is its distinguishing achievement.Although the unit desa system forms an integral part of
the Bank Rakyat Indonesia, it operates as a separate profit
center, and its management has a free hand in determiningits interest rates and other operating policies. In the 1980sthe Indonesian government implemented financial sectorreforms that deregulated certain interest rates and abolishedinterest rate ceilings. As the unit desa system struggled tobecome financially self-sustainable, market forces drove itsdecisionmaking and it became increasingly subject to com-petition from other financial institutions.Management has a high degree of autonomy and full
accountability for the performance of the unit desa system.This accountability is pushed down the line; every unit isresponsible for its own lending decisions and profits.Monetary staff incentives and the prospects of promotionreinforce individual accountability. Reforms to furtherenhance the unit desa system’s autonomy are currently beingstudied.
Box 1.4 Microfinance in Indonesia
Source: Yaron, Benjamin, and Piprek 1997.
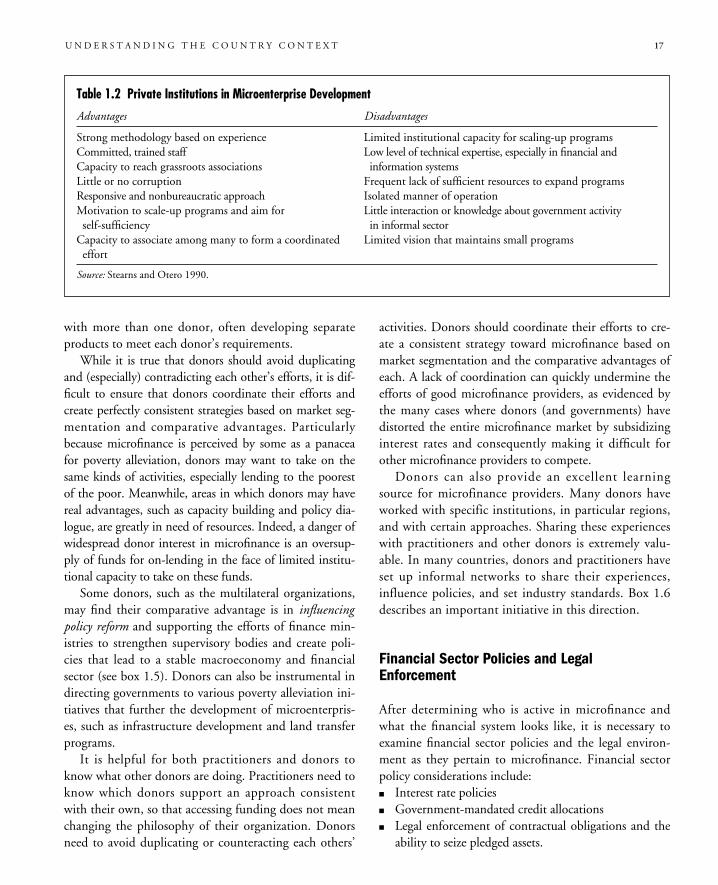
with more than one donor, often developing separateproducts to meet each donor’s requirements.While it is true that donors should avoid duplicating
and (especially) contradicting each other’s efforts, it is dif-ficult to ensure that donors coordinate their efforts andcreate perfectly consistent strategies based on market seg-mentation and comparative advantages. Particularlybecause microfinance is perceived by some as a panaceafor poverty alleviation, donors may want to take on thesame kinds of activities, especially lending to the poorestof the poor. Meanwhile, areas in which donors may havereal advantages, such as capacity building and policy dia-logue, are greatly in need of resources. Indeed, a danger ofwidespread donor interest in microfinance is an oversup-ply of funds for on-lending in the face of limited institu-tional capacity to take on these funds.Some donors, such as the multilateral organizations,
may find their comparative advantage is in influencingpolicy reform and supporting the efforts of finance min-istries to strengthen supervisory bodies and create poli-cies that lead to a stable macroeconomy and financialsector (see box 1.5). Donors can also be instrumental indirecting governments to various poverty alleviation ini-tiatives that further the development of microenterpris-es, such as infrastructure development and land transferprograms.It is helpful for both practitioners and donors to
know what other donors are doing. Practitioners need toknow which donors support an approach consistentwith their own, so that accessing funding does not meanchanging the philosophy of their organization. Donorsneed to avoid duplicating or counteracting each others’
activities. Donors should coordinate their efforts to cre-ate a consistent strategy toward microfinance based onmarket segmentation and the comparative advantages ofeach. A lack of coordination can quickly undermine theefforts of good microfinance providers, as evidenced bythe many cases where donors (and governments) havedistorted the entire microfinance market by subsidizinginterest rates and consequently making it difficult forother microfinance providers to compete.Donors can also provide an excellent learning
source for microfinance providers. Many donors haveworked with specific institutions, in particular regions,and with certain approaches. Sharing these experienceswith practitioners and other donors is extremely valu-able. In many countries, donors and practitioners haveset up informal networks to share their experiences,influence policies, and set industry standards. Box 1.6describes an important initiative in this direction.
Financial Sector Policies and LegalEnforcement
After determining who is active in microfinance andwhat the financial system looks like, it is necessary toexamine financial sector policies and the legal environ-ment as they pertain to microfinance. Financial sectorpolicy considerations include:� Interest rate policies� Government-mandated credit allocations� Legal enforcement of contractual obligations and theability to seize pledged assets.
U N D E R S T A N D I N G T H E C O U N T R Y C O N T E X T 17
Table 1.2 Private Institutions in Microenterprise Development
Advantages Disadvantages
Strong methodology based on experience Limited institutional capacity for scaling-up programsCommitted, trained staff Low level of technical expertise, especially in financial andCapacity to reach grassroots associations information systemsLittle or no corruption Frequent lack of sufficient resources to expand programsResponsive and nonbureaucratic approach Isolated manner of operationMotivation to scale-up programs and aim for Little interaction or knowledge about government activityself-sufficiency in informal sectorCapacity to associate among many to form a coordinated Limited vision that maintains small programseffort
Source: Stearns and Otero 1990.
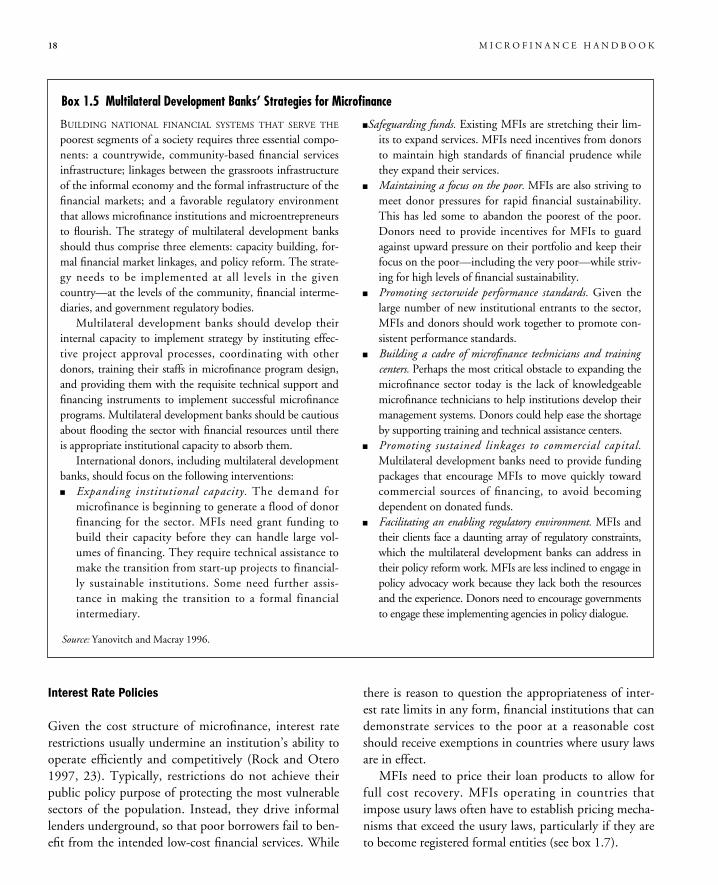
Interest Rate Policies
Given the cost structure of microfinance, interest raterestrictions usually undermine an institution’s ability tooperate efficiently and competitively (Rock and Otero1997, 23). Typically, restrictions do not achieve theirpublic policy purpose of protecting the most vulnerablesectors of the population. Instead, they drive informallenders underground, so that poor borrowers fail to ben-efit from the intended low-cost financial services. While
there is reason to question the appropriateness of inter-est rate limits in any form, financial institutions that candemonstrate services to the poor at a reasonable costshould receive exemptions in countries where usury lawsare in effect.MFIs need to price their loan products to allow for
full cost recovery. MFIs operating in countries thatimpose usury laws often have to establish pricing mecha-nisms that exceed the usury laws, particularly if they areto become registered formal entities (see box 1.7).
18 M I C R O F I N A N C E H A N D B O O K
BUILDING NATIONAL FINANCIAL SYSTEMS THAT SERVE THE
poorest segments of a society requires three essential compo-nents: a countrywide, community-based financial servicesinfrastructure; linkages between the grassroots infrastructureof the informal economy and the formal infrastructure of thefinancial markets; and a favorable regulatory environmentthat allows microfinance institutions and microentrepreneursto flourish. The strategy of multilateral development banksshould thus comprise three elements: capacity building, for-mal financial market linkages, and policy reform. The strate-gy needs to be implemented at all levels in the givencountry—at the levels of the community, financial interme-diaries, and government regulatory bodies.Multilateral development banks should develop their
internal capacity to implement strategy by instituting effec-tive project approval processes, coordinating with otherdonors, training their staffs in microfinance program design,and providing them with the requisite technical support andfinancing instruments to implement successful microfinanceprograms. Multilateral development banks should be cautiousabout flooding the sector with financial resources until thereis appropriate institutional capacity to absorb them.International donors, including multilateral development
banks, should focus on the following interventions:� Expanding institutional capacity. The demand formicrofinance is beginning to generate a flood of donorfinancing for the sector. MFIs need grant funding tobuild their capacity before they can handle large vol-umes of financing. They require technical assistance tomake the transition from start-up projects to financial-ly sustainable institutions. Some need further assis-tance in making the transition to a formal financialintermediary.
�Safeguarding funds. Existing MFIs are stretching their lim-its to expand services. MFIs need incentives from donorsto maintain high standards of financial prudence whilethey expand their services.
� Maintaining a focus on the poor. MFIs are also striving tomeet donor pressures for rapid financial sustainability.This has led some to abandon the poorest of the poor.Donors need to provide incentives for MFIs to guardagainst upward pressure on their portfolio and keep theirfocus on the poor—including the very poor—while striv-ing for high levels of financial sustainability.
� Promoting sectorwide performance standards. Given thelarge number of new institutional entrants to the sector,MFIs and donors should work together to promote con-sistent performance standards.
� Building a cadre of microfinance technicians and trainingcenters. Perhaps the most critical obstacle to expanding themicrofinance sector today is the lack of knowledgeablemicrofinance technicians to help institutions develop theirmanagement systems. Donors could help ease the shortageby supporting training and technical assistance centers.
� Promoting sustained linkages to commercial capital.Multilateral development banks need to provide fundingpackages that encourage MFIs to move quickly towardcommercial sources of financing, to avoid becomingdependent on donated funds.
� Facilitating an enabling regulatory environment. MFIs andtheir clients face a daunting array of regulatory constraints,which the multilateral development banks can address intheir policy reform work. MFIs are less inclined to engage inpolicy advocacy work because they lack both the resourcesand the experience. Donors need to encourage governmentsto engage these implementing agencies in policy dialogue.
Box 1.5 Multilateral Development Banks’ Strategies for Microfinance
Source: Yanovitch and Macray 1996.
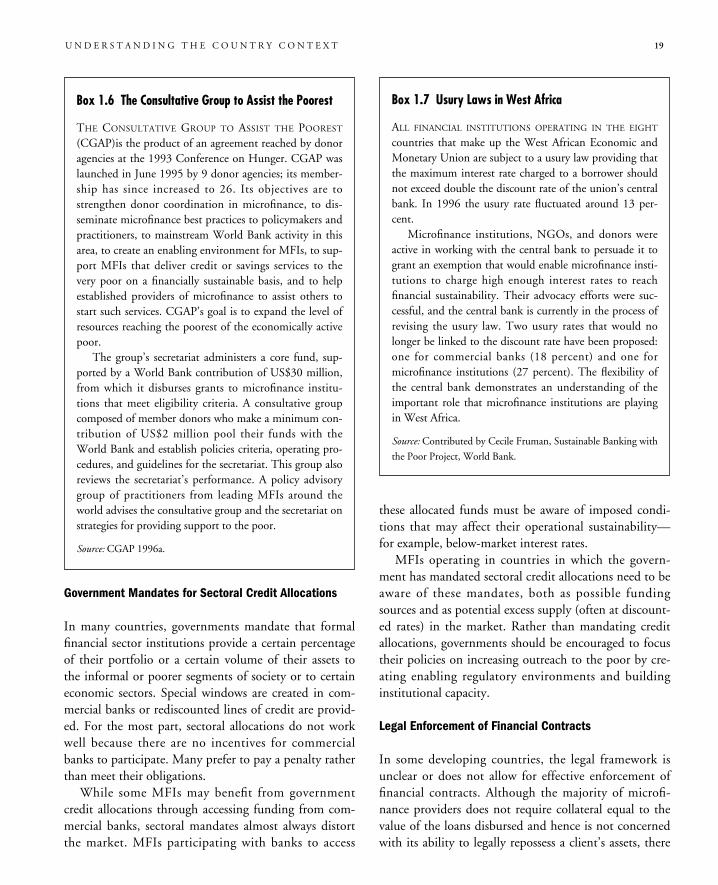
Government Mandates for Sectoral Credit Allocations
In many countries, governments mandate that formalfinancial sector institutions provide a certain percentageof their portfolio or a certain volume of their assets tothe informal or poorer segments of society or to certaineconomic sectors. Special windows are created in com-mercial banks or rediscounted lines of credit are provid-ed. For the most part, sectoral allocations do not workwell because there are no incentives for commercialbanks to participate. Many prefer to pay a penalty ratherthan meet their obligations.While some MFIs may benefit from government
credit allocations through accessing funding from com-mercial banks, sectoral mandates almost always distortthe market. MFIs participating with banks to access
these allocated funds must be aware of imposed condi-tions that may affect their operational sustainability—for example, below-market interest rates.MFIs operating in countries in which the govern-
ment has mandated sectoral credit allocations need to beaware of these mandates, both as possible fundingsources and as potential excess supply (often at discount-ed rates) in the market. Rather than mandating creditallocations, governments should be encouraged to focustheir policies on increasing outreach to the poor by cre-ating enabling regulatory environments and buildinginstitutional capacity.
Legal Enforcement of Financial Contracts
In some developing countries, the legal framework isunclear or does not allow for effective enforcement offinancial contracts. Although the majority of microfi-nance providers does not require collateral equal to thevalue of the loans disbursed and hence is not concernedwith its ability to legally repossess a client’s assets, there
U N D E R S T A N D I N G T H E C O U N T R Y C O N T E X T 19
Box 1.6 The Consultative Group to Assist the Poorest
THE CONSULTATIVE GROUP TO ASSIST THE POOREST(CGAP)is the product of an agreement reached by donoragencies at the 1993 Conference on Hunger. CGAP waslaunched in June 1995 by 9 donor agencies; its member-ship has since increased to 26. Its objectives are tostrengthen donor coordination in microfinance, to dis-seminate microfinance best practices to policymakers andpractitioners, to mainstream World Bank activity in thisarea, to create an enabling environment for MFIs, to sup-port MFIs that deliver credit or savings services to thevery poor on a financially sustainable basis, and to helpestablished providers of microfinance to assist others tostart such services. CGAP’s goal is to expand the level ofresources reaching the poorest of the economically activepoor.The group’s secretariat administers a core fund, sup-
ported by a World Bank contribution of US$30 million,from which it disburses grants to microfinance institu-tions that meet eligibility criteria. A consultative groupcomposed of member donors who make a minimum con-tribution of US$2 million pool their funds with theWorld Bank and establish policies criteria, operating pro-cedures, and guidelines for the secretariat. This group alsoreviews the secretariat’s performance. A policy advisorygroup of practitioners from leading MFIs around theworld advises the consultative group and the secretariat onstrategies for providing support to the poor.
Source: CGAP 1996a.
Box 1.7 Usury Laws in West Africa
ALL FINANCIAL INSTITUTIONS OPERATING IN THE EIGHT
countries that make up the West African Economic andMonetary Union are subject to a usury law providing thatthe maximum interest rate charged to a borrower shouldnot exceed double the discount rate of the union’s centralbank. In 1996 the usury rate fluctuated around 13 per-cent.Microfinance institutions, NGOs, and donors were
active in working with the central bank to persuade it togrant an exemption that would enable microfinance insti-tutions to charge high enough interest rates to reachfinancial sustainability. Their advocacy efforts were suc-cessful, and the central bank is currently in the process ofrevising the usury law. Two usury rates that would nolonger be linked to the discount rate have been proposed:one for commercial banks (18 percent) and one formicrofinance institutions (27 percent). The flexibility ofthe central bank demonstrates an understanding of theimportant role that microfinance institutions are playingin West Africa.
Source: Contributed by Cecile Fruman, Sustainable Banking with
the Poor Project, World Bank.
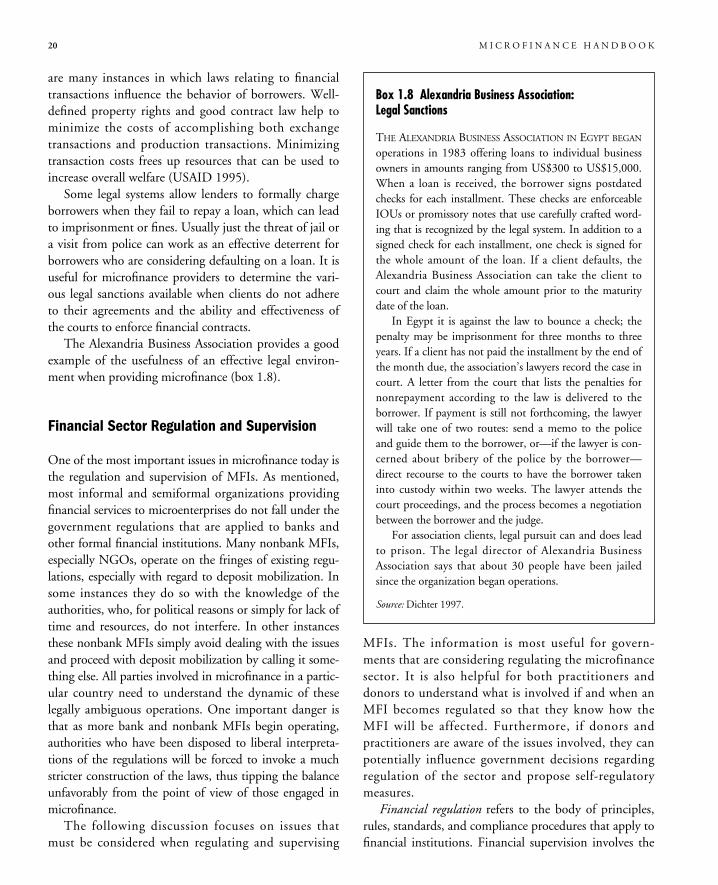
20 M I C R O F I N A N C E H A N D B O O K
are many instances in which laws relating to financialtransactions influence the behavior of borrowers. Well-defined property rights and good contract law help tominimize the costs of accomplishing both exchangetransactions and production transactions. Minimizingtransaction costs frees up resources that can be used toincrease overall welfare (USAID 1995).Some legal systems allow lenders to formally charge
borrowers when they fail to repay a loan, which can leadto imprisonment or fines. Usually just the threat of jail ora visit from police can work as an effective deterrent forborrowers who are considering defaulting on a loan. It isuseful for microfinance providers to determine the vari-ous legal sanctions available when clients do not adhereto their agreements and the ability and effectiveness ofthe courts to enforce financial contracts.The Alexandria Business Association provides a good
example of the usefulness of an effective legal environ-ment when providing microfinance (box 1.8).
Financial Sector Regulation and Supervision
One of the most important issues in microfinance today isthe regulation and supervision of MFIs. As mentioned,most informal and semiformal organizations providingfinancial services to microenterprises do not fall under thegovernment regulations that are applied to banks andother formal financial institutions. Many nonbank MFIs,especially NGOs, operate on the fringes of existing regu-lations, especially with regard to deposit mobilization. Insome instances they do so with the knowledge of theauthorities, who, for political reasons or simply for lack oftime and resources, do not interfere. In other instancesthese nonbank MFIs simply avoid dealing with the issuesand proceed with deposit mobilization by calling it some-thing else. All parties involved in microfinance in a partic-ular country need to understand the dynamic of theselegally ambiguous operations. One important danger isthat as more bank and nonbank MFIs begin operating,authorities who have been disposed to liberal interpreta-tions of the regulations will be forced to invoke a muchstricter construction of the laws, thus tipping the balanceunfavorably from the point of view of those engaged inmicrofinance.The following discussion focuses on issues that
must be considered when regulating and supervising
MFIs. The information is most useful for govern-ments that are considering regulating the microfinancesector. It is also helpful for both practitioners anddonors to understand what is involved if and when anMFI becomes regulated so that they know how theMFI will be affected. Furthermore, if donors andpractitioners are aware of the issues involved, they canpotentially influence government decisions regardingregulation of the sector and propose self-regulatorymeasures.
Financial regulation refers to the body of principles,rules, standards, and compliance procedures that apply tofinancial institutions. Financial supervision involves the
Box 1.8 Alexandria Business Association:Legal Sanctions
THE ALEXANDRIA BUSINESS ASSOCIATION IN EGYPT BEGANoperations in 1983 offering loans to individual businessowners in amounts ranging from US$300 to US$15,000.When a loan is received, the borrower signs postdatedchecks for each installment. These checks are enforceableIOUs or promissory notes that use carefully crafted word-ing that is recognized by the legal system. In addition to asigned check for each installment, one check is signed forthe whole amount of the loan. If a client defaults, theAlexandria Business Association can take the client tocourt and claim the whole amount prior to the maturitydate of the loan.In Egypt it is against the law to bounce a check; the
penalty may be imprisonment for three months to threeyears. If a client has not paid the installment by the end ofthe month due, the association’s lawyers record the case incourt. A letter from the court that lists the penalties fornonrepayment according to the law is delivered to theborrower. If payment is still not forthcoming, the lawyerwill take one of two routes: send a memo to the policeand guide them to the borrower, or—if the lawyer is con-cerned about bribery of the police by the borrower—direct recourse to the courts to have the borrower takeninto custody within two weeks. The lawyer attends thecourt proceedings, and the process becomes a negotiationbetween the borrower and the judge.For association clients, legal pursuit can and does lead
to prison. The legal director of Alexandria BusinessAssociation says that about 30 people have been jailedsince the organization began operations.
Source: Dichter 1997.
examination and monitoring of organizations for compli-ance with financial regulation.Prudential regulation and supervision are designed to
(Chavez and Gonzalez-Vega 1995):� Avoid a banking crisis and maintain the integrity ofthe payments system
� Protect depositors� Encourage financial sector competition and efficiency.To create an environment that is conducive to finan-
cial intermediation, governments and policymakers mustensure that financial regulation does not result in finan-cial repression—in regulations that distort financial mar-kets and reduce the efficiency of financial institutions.Examples of financial repression are imposed interest rateceilings, subsidized credit, and tax structures that dis-courage investment in microfinance. Governments mustalso ensure that supervisory bodies have the authorityand the capacity to implement the regulatory standards(Chavez and Gonzalez-Vega 1994).Despite some success stories, MFIs probably reach
less than 5 percent of the potential clients in the worldtoday. Serving this market will require access to fundingfar beyond what donors and governments can provide.Thus many MFIs want to expand their outreach by rais-ing funds from commercial sources, including deposits.Most MFIs are significantly different from commer-
cial banks in institutional structure. Furthermore, man-aging a microloan portfolio differs in important waysfrom managing a conventional bank portfolio. MFIsand microloan portfolios cannot be safely funded withcommercial sources, especially public deposits, unlessappropriate regulation and supervision regimes aredeveloped.Even MFIs that do not mobilize deposits may benefit
from entry rules that ensure the adoption of accepted goodpractices, as well as adequate recordkeeping and reporting.
When Should MFIs Be Subject to Regulation?
MFIs should be regulated if and when they mobilizedeposits from the public. Individual depositors cannotbe expected to monitor the financial health of an MFIand necessarily rely on the state to do this. MFIs shouldalso be regulated when standards of good practice areclearly needed, whether because there are no practicingorganizations or institutions or because existing practi-tioners are not operating effectively. The latter com-
monly occurs when donors push “programs” and targetcredit, rather than focus on meeting existing demand forfinancial services.MFIs should also be regulated when they reach the
size at which their failure would have consequences thatreach far beyond owners and creditors. Finansol inColombia is a good example of the importance of regu-lating growing financial intermediaries (box 1.9).The Finansol case highlights important lessons
regarding the regulation of MFIs created out of NGOs.“An NGO (nongovernmental organization) is notinherently bound to the same standards of eco-nomic performance or financial prudence that maybe reasonably expected in the business sector.While this concern is not insurmountable, theNGO parent must ensure that it sets standardsappropriate to the financial sector in dealing withits regulated microfinance subsidiary. From theFinansol experience, it is apparent that NGOsshould not be owners of MFIs unless they areoperated separately, and the only financial link isownership. This relationship must be transparent,and any financial exchange must include propertransfer pricing. Also, NGOs should not fully con-trol the board and management of an MFI. Itwould be appropriate for regulators to monitor thefinancial health of an NGO when it is the majorityowner of a regulated financial entity and in somecases to require consolidated financial reporting bepresented so that an accurate assessment of thefinancial health of the regulated financial interme-diary may be determined.” (Barenbach andChurchill 1997, 47)Furthermore the Finansol experience shows how reg-
ulatory restrictions such as usury laws and limits on assetgrowth can greatly affect the success of an MFI. It alsohighlights the importance of having owners with some-thing at risk who are able to monitor their investmentand who can help if there is a crisis. And finally, itdemonstrates the importance of flexibility on the part ofthe superintendency.“When regulation is warranted, it requires coherentprudential guidelines that will further the growth ofthe microfinance sector while protecting the inter-est of small savers and supporting the integrity ofthe financial sector as a whole.” (Barenbach andChurchill 1997, 1)
U N D E R S T A N D I N G T H E C O U N T R Y C O N T E X T 21
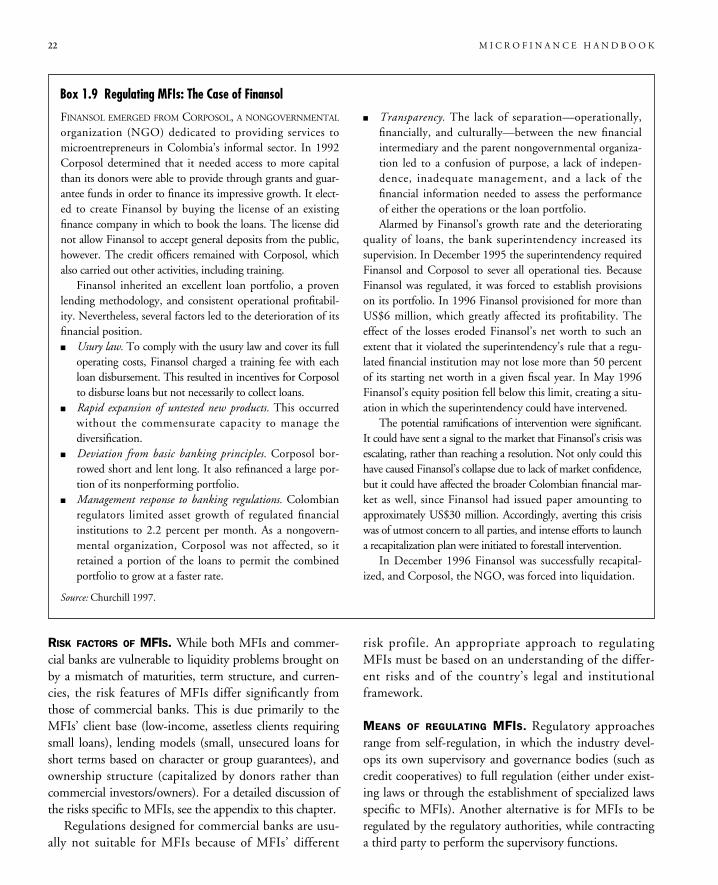
RISK FACTORS OF MFIS. While both MFIs and commer-cial banks are vulnerable to liquidity problems brought onby a mismatch of maturities, term structure, and curren-cies, the risk features of MFIs differ significantly fromthose of commercial banks. This is due primarily to theMFIs’ client base (low-income, assetless clients requiringsmall loans), lending models (small, unsecured loans forshort terms based on character or group guarantees), andownership structure (capitalized by donors rather thancommercial investors/owners). For a detailed discussion ofthe risks specific to MFIs, see the appendix to this chapter.Regulations designed for commercial banks are usu-
ally not suitable for MFIs because of MFIs’ different
risk profile. An appropriate approach to regulatingMFIs must be based on an understanding of the differ-ent risks and of the country’s legal and institutionalframework.
MEANS OF REGULATING MFIS. Regulatory approachesrange from self-regulation, in which the industry devel-ops its own supervisory and governance bodies (such ascredit cooperatives) to full regulation (either under exist-ing laws or through the establishment of specialized lawsspecific to MFIs). Another alternative is for MFIs to beregulated by the regulatory authorities, while contractinga third party to perform the supervisory functions.
22 M I C R O F I N A N C E H A N D B O O K
FINANSOL EMERGED FROM CORPOSOL, A NONGOVERNMENTALorganization (NGO) dedicated to providing services tomicroentrepreneurs in Colombia’s informal sector. In 1992Corposol determined that it needed access to more capitalthan its donors were able to provide through grants and guar-antee funds in order to finance its impressive growth. It elect-ed to create Finansol by buying the license of an existingfinance company in which to book the loans. The license didnot allow Finansol to accept general deposits from the public,however. The credit officers remained with Corposol, whichalso carried out other activities, including training.Finansol inherited an excellent loan portfolio, a proven
lending methodology, and consistent operational profitabil-ity. Nevertheless, several factors led to the deterioration of itsfinancial position.� Usury law. To comply with the usury law and cover its fulloperating costs, Finansol charged a training fee with eachloan disbursement. This resulted in incentives for Corposolto disburse loans but not necessarily to collect loans.
� Rapid expansion of untested new products. This occurredwithout the commensurate capacity to manage thediversification.
� Deviation from basic banking principles. Corposol bor-rowed short and lent long. It also refinanced a large por-tion of its nonperforming portfolio.
� Management response to banking regulations. Colombianregulators limited asset growth of regulated financialinstitutions to 2.2 percent per month. As a nongovern-mental organization, Corposol was not affected, so itretained a portion of the loans to permit the combinedportfolio to grow at a faster rate.
� Transparency. The lack of separation—operationally,financially, and culturally—between the new financialintermediary and the parent nongovernmental organiza-tion led to a confusion of purpose, a lack of indepen-dence, inadequate management, and a lack of thefinancial information needed to assess the performanceof either the operations or the loan portfolio.Alarmed by Finansol’s growth rate and the deteriorating
quality of loans, the bank superintendency increased itssupervision. In December 1995 the superintendency requiredFinansol and Corposol to sever all operational ties. BecauseFinansol was regulated, it was forced to establish provisionson its portfolio. In 1996 Finansol provisioned for more thanUS$6 million, which greatly affected its profitability. Theeffect of the losses eroded Finansol’s net worth to such anextent that it violated the superintendency’s rule that a regu-lated financial institution may not lose more than 50 percentof its starting net worth in a given fiscal year. In May 1996Finansol’s equity position fell below this limit, creating a situ-ation in which the superintendency could have intervened.The potential ramifications of intervention were significant.
It could have sent a signal to the market that Finansol’s crisis wasescalating, rather than reaching a resolution. Not only could thishave caused Finansol’s collapse due to lack of market confidence,but it could have affected the broader Colombian financial mar-ket as well, since Finansol had issued paper amounting toapproximately US$30 million. Accordingly, averting this crisiswas of utmost concern to all parties, and intense efforts to launcha recapitalization plan were initiated to forestall intervention.In December 1996 Finansol was successfully recapital-
ized, and Corposol, the NGO, was forced into liquidation.
Box 1.9 Regulating MFIs: The Case of Finansol
Source: Churchill 1997.
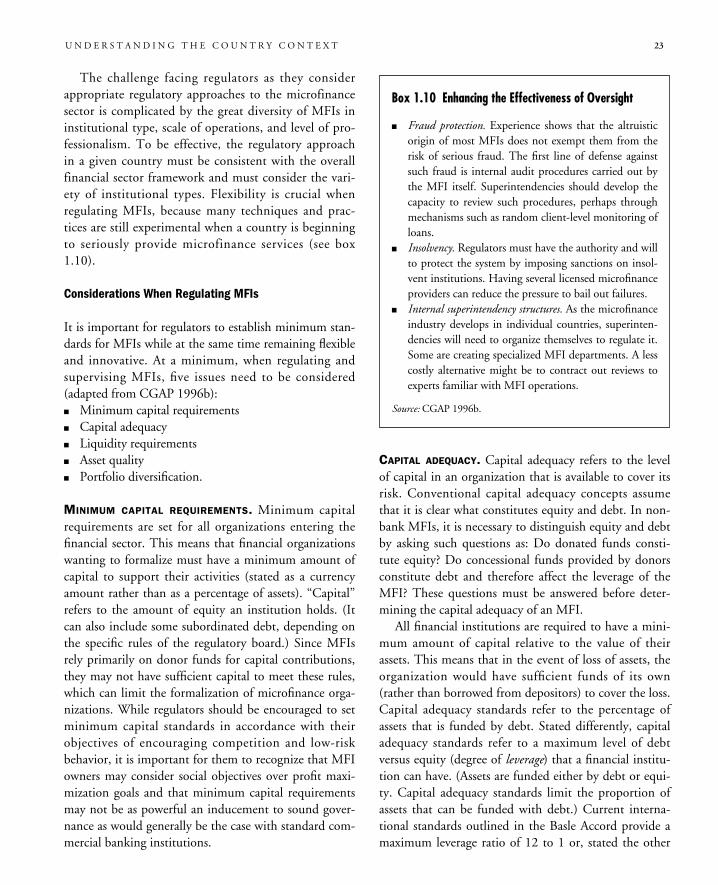
The challenge facing regulators as they considerappropriate regulatory approaches to the microfinancesector is complicated by the great diversity of MFIs ininstitutional type, scale of operations, and level of pro-fessionalism. To be effective, the regulatory approachin a given country must be consistent with the overallfinancial sector framework and must consider the vari-ety of institutional types. Flexibility is crucial whenregulating MFIs, because many techniques and prac-tices are still experimental when a country is beginningto seriously provide microfinance services (see box1.10).
Considerations When Regulating MFIs
It is important for regulators to establish minimum stan-dards for MFIs while at the same time remaining flexibleand innovative. At a minimum, when regulating andsupervising MFIs, five issues need to be considered(adapted from CGAP 1996b):� Minimum capital requirements� Capital adequacy� Liquidity requirements� Asset quality� Portfolio diversification.
MINIMUM CAPITAL REQUIREMENTS. Minimum capitalrequirements are set for all organizations entering thefinancial sector. This means that financial organizationswanting to formalize must have a minimum amount ofcapital to support their activities (stated as a currencyamount rather than as a percentage of assets). “Capital”refers to the amount of equity an institution holds. (Itcan also include some subordinated debt, depending onthe specific rules of the regulatory board.) Since MFIsrely primarily on donor funds for capital contributions,they may not have sufficient capital to meet these rules,which can limit the formalization of microfinance orga-nizations. While regulators should be encouraged to setminimum capital standards in accordance with theirobjectives of encouraging competition and low-riskbehavior, it is important for them to recognize that MFIowners may consider social objectives over profit maxi-mization goals and that minimum capital requirementsmay not be as powerful an inducement to sound gover-nance as would generally be the case with standard com-mercial banking institutions.
CAPITAL ADEQUACY. Capital adequacy refers to the levelof capital in an organization that is available to cover itsrisk. Conventional capital adequacy concepts assumethat it is clear what constitutes equity and debt. In non-bank MFIs, it is necessary to distinguish equity and debtby asking such questions as: Do donated funds consti-tute equity? Do concessional funds provided by donorsconstitute debt and therefore affect the leverage of theMFI? These questions must be answered before deter-mining the capital adequacy of an MFI.All financial institutions are required to have a mini-
mum amount of capital relative to the value of theirassets. This means that in the event of loss of assets, theorganization would have sufficient funds of its own(rather than borrowed from depositors) to cover the loss.Capital adequacy standards refer to the percentage ofassets that is funded by debt. Stated differently, capitaladequacy standards refer to a maximum level of debtversus equity (degree of leverage) that a financial institu-tion can have. (Assets are funded either by debt or equi-ty. Capital adequacy standards limit the proportion ofassets that can be funded with debt.) Current interna-tional standards outlined in the Basle Accord provide amaximum leverage ratio of 12 to 1 or, stated the other
U N D E R S T A N D I N G T H E C O U N T R Y C O N T E X T 23
Box 1.10 Enhancing the Effectiveness of Oversight
� Fraud protection. Experience shows that the altruisticorigin of most MFIs does not exempt them from therisk of serious fraud. The first line of defense againstsuch fraud is internal audit procedures carried out bythe MFI itself. Superintendencies should develop thecapacity to review such procedures, perhaps throughmechanisms such as random client-level monitoring ofloans.
� Insolvency. Regulators must have the authority and willto protect the system by imposing sanctions on insol-vent institutions. Having several licensed microfinanceproviders can reduce the pressure to bail out failures.
� Internal superintendency structures. As the microfinanceindustry develops in individual countries, superinten-dencies will need to organize themselves to regulate it.Some are creating specialized MFI departments. A lesscostly alternative might be to contract out reviews toexperts familiar with MFI operations.
Source: CGAP 1996b.
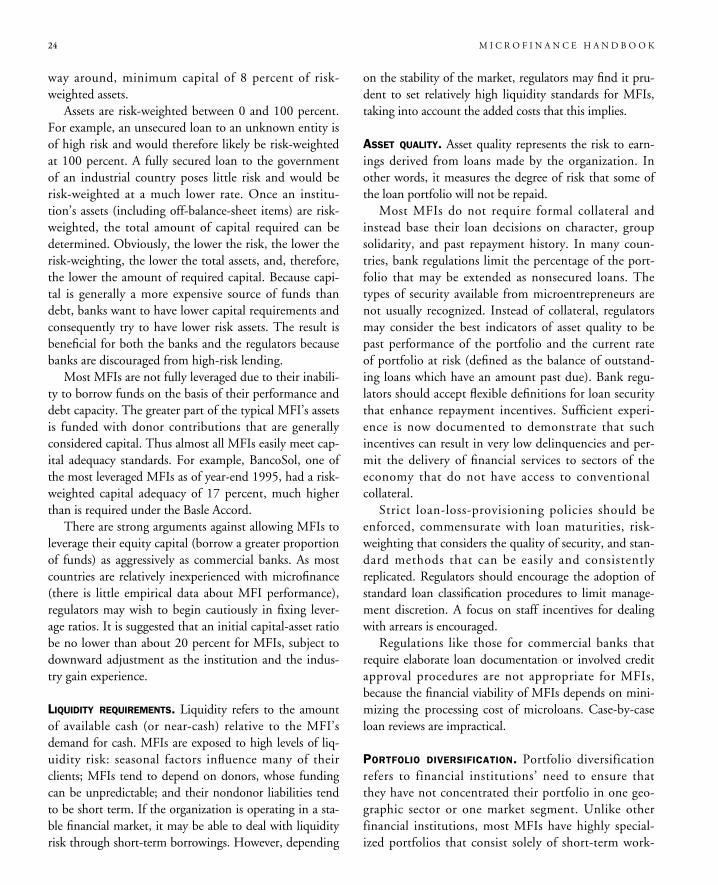
way around, minimum capital of 8 percent of risk-weighted assets.Assets are risk-weighted between 0 and 100 percent.
For example, an unsecured loan to an unknown entity isof high risk and would therefore likely be risk-weightedat 100 percent. A fully secured loan to the governmentof an industrial country poses little risk and would berisk-weighted at a much lower rate. Once an institu-tion’s assets (including off-balance-sheet items) are risk-weighted, the total amount of capital required can bedetermined. Obviously, the lower the risk, the lower therisk-weighting, the lower the total assets, and, therefore,the lower the amount of required capital. Because capi-tal is generally a more expensive source of funds thandebt, banks want to have lower capital requirements andconsequently try to have lower risk assets. The result isbeneficial for both the banks and the regulators becausebanks are discouraged from high-risk lending.Most MFIs are not fully leveraged due to their inabili-
ty to borrow funds on the basis of their performance anddebt capacity. The greater part of the typical MFI’s assetsis funded with donor contributions that are generallyconsidered capital. Thus almost all MFIs easily meet cap-ital adequacy standards. For example, BancoSol, one ofthe most leveraged MFIs as of year-end 1995, had a risk-weighted capital adequacy of 17 percent, much higherthan is required under the Basle Accord.There are strong arguments against allowing MFIs to
leverage their equity capital (borrow a greater proportionof funds) as aggressively as commercial banks. As mostcountries are relatively inexperienced with microfinance(there is little empirical data about MFI performance),regulators may wish to begin cautiously in fixing lever-age ratios. It is suggested that an initial capital-asset ratiobe no lower than about 20 percent for MFIs, subject todownward adjustment as the institution and the indus-try gain experience.
LIQUIDITY REQUIREMENTS. Liquidity refers to the amountof available cash (or near-cash) relative to the MFI’sdemand for cash. MFIs are exposed to high levels of liq-uidity risk: seasonal factors influence many of theirclients; MFIs tend to depend on donors, whose fundingcan be unpredictable; and their nondonor liabilities tendto be short term. If the organization is operating in a sta-ble financial market, it may be able to deal with liquidityrisk through short-term borrowings. However, depending
on the stability of the market, regulators may find it pru-dent to set relatively high liquidity standards for MFIs,taking into account the added costs that this implies.
ASSET QUALITY. Asset quality represents the risk to earn-ings derived from loans made by the organization. Inother words, it measures the degree of risk that some ofthe loan portfolio will not be repaid.Most MFIs do not require formal collateral and
instead base their loan decisions on character, groupsolidarity, and past repayment history. In many coun-tries, bank regulations limit the percentage of the port-folio that may be extended as nonsecured loans. Thetypes of security available from microentrepreneurs arenot usually recognized. Instead of collateral, regulatorsmay consider the best indicators of asset quality to bepast performance of the portfolio and the current rateof portfolio at risk (defined as the balance of outstand-ing loans which have an amount past due). Bank regu-lators should accept flexible definitions for loan securitythat enhance repayment incentives. Sufficient experi-ence is now documented to demonstrate that suchincentives can result in very low delinquencies and per-mit the delivery of financial services to sectors of theeconomy that do not have access to conventionalcollateral.Strict loan-loss-provisioning policies should be
enforced, commensurate with loan maturities, risk-weighting that considers the quality of security, and stan-dard methods that can be easily and consistentlyreplicated. Regulators should encourage the adoption ofstandard loan classification procedures to limit manage-ment discretion. A focus on staff incentives for dealingwith arrears is encouraged.Regulations like those for commercial banks that
require elaborate loan documentation or involved creditapproval procedures are not appropriate for MFIs,because the financial viability of MFIs depends on mini-mizing the processing cost of microloans. Case-by-caseloan reviews are impractical.
PORTFOLIO DIVERSIFICATION. Portfolio diversificationrefers to financial institutions’ need to ensure thatthey have not concentrated their portfolio in one geo-graphic sector or one market segment. Unlike otherfinancial institutions, most MFIs have highly special-ized portfolios that consist solely of short-term work-
24 M I C R O F I N A N C E H A N D B O O K
ing capital loans to informal sector clients. Althoughan MFI may have thousands of loans to diverse indus-tries, externalities could affect the entire market.Regulators should encourage MFIs to diversify theirloan portfolios through the development of guidelinesthat limit sector concentration.
Country Approaches to Regulating MFIs
Although most countries have not yet established anapproach to regulating MFIs, Bolivia, Peru, and theWest African Economic and Monetary Union havedetermined that a new type of legal institution wasrequired for MFIs that wanted to begin mobilizing
savings (box 1.11 describes Bolivia’s initiative). InSouth Africa and the Philippines local MFIs haveformed associations as a first step toward educatingregulators and promoting policy dialogue. InIndonesia and Peru a third party has been engaged toperform supervisory functions, either in place of oralong with the bank superintendency (Berenbach andChurchill 1997).In all countries that are considering establishing
new types of institutions, one of the main issues is thelimited capacity of bank superintendencies to super-vise an increasingly large number of small and highlydecentralized institutions. This is the case in Ghana(box 1.12).
U N D E R S T A N D I N G T H E C O U N T R Y C O N T E X T 25
THE BOLIVIAN GOVERNMENT RECENTLY CREATED A NEW
type of institution, private financial funds, to “channelresources to finance the activities of small businesses andmicroenterprises in the productive and commercial sectors,as well as to make loans to individuals for soft durable goodspurchases. As an additional means of facilitating access tocredit for individuals, [private financial funds] may alsoengage in small-scale consumer credit operations” (from thelaw setting up the funds).
Incorporation. Private financial funds will be organizedas corporations—an ideal form for financial intermedia-tion because of the legal stability of a commercial entityin civil society, and because it allows for timely increasesor replenishment of equity when required by theSuperintendency of Banks and Financial Institutions.
Minimum operating equity. To incorporate and functionprivate financial funds require the capital equivalent to atleast US$1 million. This is significantly less than the US$3.2million required for incorporating a bank. This start-up cap-ital, together with a strict and prudential framework thatestablishes credit limits lower than those established forbanks and a prohibition on making loans to the privatefinancial fund’s own shareholders and managers, represents areasonable combination of equity backing and spreading ofcredit risks.Private financial funds should maintain net worth equiv-
alent to at least 10 percent of their assets and contingenciesweighted on the basis of risk; institutions already in opera-tion shall have three years to bring their equity levels intoline with this new legal requirement.
Financial operations. Private financial funds hold broadoperational powers allowing for financial leasing, traditionallending, certificates of deposit to guarantee performance, andfactoring. This diversity of credit instruments will make itpossible to adapt credit supply to the specific needs of smallborrowers in both the productive and commercial sectors,including wage earners.Private financial funds may provide for their clients finan-
cial services such as drafts and payment orders, foreignexchange operations, and the purchase and sale of foreigncurrencies. In addition, they may receive savings and timedeposits and contract obligations with second-tier bankinginstitutions pursuant to the limits set by these intermediaries.
Limits. To avoid risks that jeopardize their main purposeand are incompatible with the large amount of capital theyinvolve, private financial funds are restricted from severaltypes of banking operations. These include capture ofdemand deposits, foreign trade operations, trust operationsand other charges of fiduciary duty, investments in enter-prise capital, participation in the underwriting and place-ment of securities, and mutual fund management.A single loan may not exceed 3 percent of the net worth
of the private financial fund; credits with personal guaranteesmay not exceed 1 percent of the fund’s net worth; a privatefinancial fund may not maintain a credit relationship withan institution of the national financial system for more than20 percent of its net worth; and shareholders, statutory audi-tors, directors and managers, and individuals or entities asso-ciated with a private financial fund may not obtain loansfrom the institution.
Box 1.11 Private Financial Funds in Bolivia
Source: Loubiere 1995.
Economic and Social Policy Environment
After examining the supply of microfinance services, finan-cial sector policies and the legal environment, and regula-tion and supervision issues, the final area to examinewithin the country context is the economic and social poli-cy environment. Economic and social policies influenceboth the ability of an MFI to effectively provide financialservices and the types of activities microenterprises under-take. For example, economic policies that affect the rate ofinflation in a country, the growth of the economy, or thedegree of openness to market forces all influence therequired interest rate of loans as well as the ability ofmicroentrepreneurs to successfully operate their businessesand thus utilize financial services. The government’sinvestment in infrastructure development, the scale anddepth of poverty in a country, and access to social servicesalso affect the way in which a microfinance organizationoperates. If because of poor roads microentrepreneurs arenot able to reach markets, access health care services, orsend their children to school, their activities are affectedand so, too, is their use of financial services.
Economic and Political Stability
Volatility in all markets affects the risk and hence the choic-es made by business owners and financial institutions. Ingeneral, the stability of financial and other markets makesmicroenterprises and consequently microfinance servicesmore viable (Yaron, Benjamin, and Piprek 1997).MFIs should understand how various economic con-
siderations and policies affect the poor. For most coun-tries, there are numerous reports highlighting theeconomic situation and the various policies that affectthe economy. Reports produced by the World Bank,governments, and research institutions should be gath-ered to develop an overall assessment of the economicsituation in a country. Two measures commonly consid-ered are the rate of inflation and the rate of growth ofgross domestic product (GDP). These measures providesome indication of the economic stability of a country.
INFLATION. Some degree of inflation is usually present inall economies and must be considered when designingand pricing loan and savings products. Both practitionersand donors should be aware of the inflation rate in coun-tries where they are working, as inflation results in a real
26 M I C R O F I N A N C E H A N D B O O K
Box 1.12 Nonbank Financial Institutions in Ghana
IN 1993 THE GOVERNMENT OF GHANA ENACTED THE
Nonbank Financial Institutions Law to create an alterna-tive financial market that would cater to the needs of thebroad sector of the Ghanaian economy that was notbeing served by traditional financial institutions. Thiswas a bold and laudable attempt to introduce diversity inthe financial markets by creating an enabling environ-ment for local private participation.However, the prudential regulations that accompa-
nied the law contained serious mismatches. In Ghanapeople regularly pay informal savings collectors to pro-vide a daily savings service. Instead of receiving intereston their deposits, customers pay a commission to havetheir savings collected and kept safe. As a consequence,60 percent of Ghana’s money supply is outside the for-mal banking sector. However, the original regulationsthat governed savings and loans institutions limited thefrequency of deposits to once a week. To address thisissue, regulated institutions lobbied for changes in thelegislation to permit unlimited client deposits.In addition, there was concern by some nonbank
financial institutions that the minimum capital require-ment—US$100,000—was too low. After advocacyefforts by the financial sector, the capital requirement isbeing reconsidered. High reserve ratios were also man-dated by the superintendency, requiring nonbank finan-cial institutions to place 57 percent of their deposits infirst and secondary reserves, leaving the institution withtoo little to invest in productive activities.Another issue with the banking regulation involves
the reporting format. The superintendency is trying tosupervise nine separate categories of financial institu-tions with an omnibus prudential guideline and report-ing format. Since mortgage companies, commercialbanks, and savings and loan institutions, for example,provide very different services, they cannot report thesame information. To respond to this issue, nonbankfinancial institutions have created an association to act asan advocate on their behalf.These observations lead to the following conclusions:
� Bank supervisors need to learn how to supervise thespecial characteristics of MFIs.
� There is a need for a more involved and active super-visory service provided perhaps by an apex institu-tion or subcontracted to an external body.
Source: Dadson 1997.
cost to MFIs (and their clients) that must be covered bythe interest generated on loans.MFIs can and do operate in countries with high rates
of inflation. One possible means of addressing hyperin-flation is to index the loan contract to a hard currencysuch as the U.S. dollar or to a commodity. Other meansinclude maintaining funding and assets in U.S. dollars,utilizing debt rather than equity (if possible), and provid-ing short-term loans (ensuring that they match theclients cash flow needs), which allow for periodic adjust-ment of interest rates.If MFIs borrow funds in a currency other than their
own (such as U.S. dollars), inflation can result in eitherforeign exchange gains or losses. Both donors and practi-tioners need to determine who will benefit from thesepotential gains or will cover these losses.
GROWTH RATE. A country’s annual GDP growth providesan indication of that country’s economic stability andfuture growth prospects. Examining the rate of growthgives both donors and practitioners an indication of thepotential opportunities available to microentrepreneursand hence can affect the forecasted growth and fundingrequirements of the MFI.Although positive GDP growth is always preferred,
stagnant economies can be potential markets for the provi-sion of microfinance services if unemployment increasesand more people become self-employed. However, stag-nant or falling GDP levels also result in lower incomes andless demand for products and services, which could resultin the failure of microenterprises. Furthermore, volatilityin the economy affects the risk and hence choices of finan-cial institutions and microentrepreneurs. In general, thestability of financial and other markets makes microenter-prises and consequently microfinance services more viable.
TRANSITION AND POLITICAL UNREST. Transition economiesand situations of conflict or political unrest, where exist-ing systems of social networks have broken down andneed to be reestablished, pose additional concerns forMFIs (see box 1.13). Transition economies, by definition,are beginning to develop private sector markets and busi-nesses. Often the population is not familiar with businesstransactions and is generally not entrepreneurial in nature.MFIs need to develop trust among their clients andensure that borrowers understand the responsibilities asso-ciated with financial transactions. This will likely require
additional time spent with borrowers, at least initially,which in turn may increase costs. (For detailed informa-tion regarding the provision of microfinance in transitioneconomies, see Carpenter 1996.) Both donors and practi-tioners should be aware of this.General instability, corruption, civil war, party or trib-
al rivalries—all have obvious direct economic effects suchas internal migration, outmigration, capital flight, andcurrency instability. However, there are also less tangiblesocial and psychological effects. How people see theirfuture, where they want to invest, the degree to whichthey are willing to set up shop on a permanent basis, thevery kinds of products they will trade in, and what peopleare willing to buy with whatever assets they have availablewill all be affected by the political atmosphere.During periods of severe political unrest, MFI activi-
ties may need to be postponed until a more stable envi-ronment ensues, particularly where concern for the safetyof both staff and clients exists. Donors must understandthe need to postpone activities or slow down growth andnot pressure the MFI to continue to meet growth targetsduring periods of civil unrest (see box 1.14).
U N D E R S T A N D I N G T H E C O U N T R Y C O N T E X T 27
Box 1.13 Microfinance in Areas of Political Unrest
IN THE WESTERN PART OF KENYA, MICROFINANCEoperations exist, but they seem to be reaching limits ofboth outreach and sustainability. Initial loan uptake ishigh, but the market for repeat loans and especially forscaling up enterprise productivity is limited. Part of thereason has to do with the general neglect of the area bythe government, which in turn is a function of politicaland tribal rivalry. As a result, public sector investment andother development efforts go elsewhere, and in these con-ditions, more and more people enter the informal econo-my, not with an ambition to become entrepreneurs, butsimply as a means of survival. An MFI wishing to operatein this area needs to make strategic decisions that mayinvolve compromising the orthodoxies of sustainability.For example, it would make sense to reduce objectivesso that in the medium term, the objectives would beto use microfinance as a means to smooth consumptionand alleviate poverty, with the hope that as conditions im-prove, a more viable market for a true MFI might becomepossible.
Source: Contributed by Thomas Dichter, Sustainable Banking
with the Poor Project, World Bank.
Poverty Levels
When examining the country context, it is importantfor both practitioners and donors to understand thedepth of poverty in the country in which they areoperating and to determine government and donorpolicies that work toward alleviating or reducingpoverty. An understanding of the degree of poverty ina country helps in estimating the size and needs of thepotential market for microfinancial services and may
also help to clarify or establish an MFI’s or donor’sobjectives.
Investment in Infrastructure and Human ResourceDevelopment
An important consideration when providing microfi-nance services is the existence of adequate infrastructure(roads, communications facilities, water and sewer sys-tems) and of affordable social services such as health,education, and nutrition.“Improving rural roads and electricity, or provid-ing matching grants for village-determined invest-ments such as watershed management, to increasethe earnings capacity of poor households is oftenmore cost-effective than providing financial ser-vices, particularly where infrastructure is underde-veloped. Similarly, providing or upgrading ruralprimary education and health facilities can achievelonger-term benefits for the rural poor, especiallyfor the poorest of the poor, by increasing the pro-ductivity of labor, the main asset of the poor.”(Yaron, Benjamin, and Piprek 1997, 42)A lack of roads, electricity, communication facilities,
and other infrastructure will affect the means by whichan MFI and the microenterprises it supports operate andshould be taken into consideration by both donors andpractitioners.Identifying the availability of and access to social ser-
vices for an MFI’s client base helps to determine whetherclients’ needs for services are being met and whether theobjectives of the MFI are suitable (that is, whether theMFI can provide only financial services while other gov-ernmental organizations and NGOs provide other need-ed services). For example, the availability of educationand health services greatly influences the capacity ofmicroentrepreneurs to increase their enterprise activities.Any provision of financial services to the poor shouldconsider the availability of other nonfinancial servicesand the environment in which the MFI and the clientsoperate.Some MFIs form relationships with other service orga-
nizations to coordinate the provision of financial services,nonfinancial services, or social services, taking advantage ofthe comparative strengths of each organization. However,it should be noted that the provision of social services suchas health, education, and family planning should not be
28 M I C R O F I N A N C E H A N D B O O K
Box 1.14 The Albanian Development Fund
IN LATE 1992, AS ALBANIA ENTERED ITS TRANSITION TO Amarket economy, the Albanian Development Fund’s ruralcredit program began forming village associations for thepurpose of lending. By the end of 1996 the fund wasactive in 170 villages in 10 districts and had close to7,000 outstanding loans totaling more than US$2.4 mil-lion (243 million lek). In spite of a general lack of under-standing of market forces in Albania, the AlbanianDevelopment Fund has achieved commendable loanrepayment, with only one village fund failing to repay.This success stems from a good understanding of the vil-lage networks and from the initial design of the project,which required full loan repayment before disbursementof further loans.In 1992 Albania recorded an inflation rate of 237 per-
cent a year, and its GDP growth was negative –7 percent.It was during this time that the Albanian DevelopmentFund began lending. To address such high rates of infla-tion and their effect on the value of its capital, the fundset the interest rate at 5 percent per year, with repaymentof principal pegged to the U.S. dollar. In 1995 inflationhad decreased to 6 percent, and the AlbanianDevelopment Fund began charging 10 percent, with loanrepayment no longer pegged to the U.S. dollar.Beginning in 1997 Albania experienced civil unrest
caused by the collapse of pyramid savings schemes.Although all borrowing was halted, credit officers contin-ued to maintain contact with borrowers. Repayment ofloans in January and February (when the pyramid schemeswere beginning to collapse) continued to be 100 percent inrural areas and remained high in urban areas. Thisoccurred despite an estimated 80 percent participation rateof farmers in the pyramid schemes and is testimony to thestrength of the Albanian Development Fund system.
Source: Ledgerwood 1997.
directly combined with the provision of financial services(a point discussed in more detail in chapter 3).
Government View of the Microenterprise Sector
It is important to determine the government’s positionregarding the informal sector and microenterprise devel-opment, as this affects policies that may influence thebehavior of microentrepreneurs. Some governments rec-ognize the positive contribution of microenterprises tothe economy and may actively include informal sectordevelopment in the national plan. However, in manycountries informal sector issues and their relationship togovernment policy receive little attention. Most policyframeworks favor large manufacturing sectors and arebiased against the informal sector and small enterprises.Most governments want to encourage the develop-
ment of businesses in their countries. Some governmentssupplement general policy goals that apply to businesswith specific policies and programs aimed at micro andsmall enterprises. It is helpful if policies are in place thatestablish a favorable climate for the start-up of new busi-nesses and the growth of existing businesses. Examplesare policies that minimize the costs of licensing and regis-tering a business, provide easy access to informationabout laws and regulations, and facilitate commercialcodes, which establish rules to minimize the cost ofdoing business by defining the rights and responsibilitiesof all parties to a transaction (USAID 1995).The decision of governments to become actively
involved in microenterprise development through cred-it programs or other enterprise development servicescan affect the environment for private microfinanceproviders, either by negatively distorting the market orby positively contributing to the supply of services.Alternatively, governments can choose to support theinformal sector through macropolicies, the allocation ofresources that affect microproduction, or work withNGOs that provide services and training.“Active collaboration in this sense involves theestablishment of a favorable climate to enablethese institutions to continue and expand theirwork with support but no interference from gov-ernment entities. This can include national recog-nition of the microenterprise sector, support todiscuss the issue, funding research, and scaling uppilot programs.” (Stearns and Otero 1990, 27)
Microenterprises and small businesses may be affectedby government policies, including excessive regulation,prohibitive levels of taxation, inadequate government pro-tection against cheap imported products, laxity aboutblack markets (which results in unfair competition for themicrobusiness sector), harassment by government officialsfor operating businesses on the streets, and inadequateservices and high user fees in public market structures.Many of these regulations work effectively to encouragemicroenterprises to remain outside the legal or formalmainstream (see the discussion of Argentina’s tax laws inbox 1.15).When policies and practices negatively affect clients’
businesses, an MFI or donor may choose to undertakeenvironment-level interventions, such as policy andadvocacy work, in addition to providing or supportingthe provision of financial services. Advocacy can includehelping clients organize to protest unfair policies ortreatment. MFIs can influence policy by working alone
U N D E R S T A N D I N G T H E C O U N T R Y C O N T E X T 29
Box 1.15 Tax Laws in Argentina
IN ARGENTINA ALL FORMAL ENTERPRISES MUST BE
registered with the Dirección General Impositiva, the taxbureau, and must comply with various tax requirements.The most important tax is the impuesto al valor añadido, a21 percent value-added tax. Businesses must charge thistax on their sales and pay it on all products they buy. Thenet difference between the two is due to the tax bureauannually.Small businesses, including small farmers, that are not
formalized enterprises are strongly penalized by this sys-tem. When purchasing supplies, they must pay the tax upfront and are sometimes charged a surtax of 50 percent onpurchases as a penalty for not being registered enterprises,raising the effective value-added tax to 31.5 percent. Theyare then unable to deduct the amount of tax paid fromtheir revenue because, as nonregistered entities, they can-not charge a value-added tax on the sale of their productsor services. Buyers purchasing crops from these unregis-tered businesses (small farmers) offer low prices, arguingthat they are taking a risk in buying from them and maybe penalized for doing so. The number of buyers willingto work with the informal sector is hence restricted, offer-ing a limited range of channels for commercialization.
Source: Contributed by Cecile Fruman, Sustainable Banking with
the Poor Project, World Bank.
or through coalitions of similar organizations to lobbyappropriate government or regulatory bodies on behalfof their clients (Waterfield and Duval 1996).
Appendix 1. Risks in the MicrofinanceIndustry
There are four main areas of risk that are specific toMFIs: portfolio risk, ownership and governance, man-agement, and “new industry.” Portfolio risk was dis-cussed in the main text of chapter 1. The remaining risksare discussed below. The following discussion is takenfrom Berenbach and Churchill 1997.
Ownership and Governance
Although effective external regulation and supervision byregulatory bodies are important to the health of the finan-cial system, no amount of external oversight can replaceaccountability that stems from proper governance andsupervision performed by the owners of financial institu-tions. The following points highlight issues of ownershipand governance relative to adequate supervision of MFIs:� Adequate oversight of management. Often, investors in
MFIs are motivated by social objectives. As a result,they may not hold this investment to the same stan-dards that they apply to commercial investments.Regulators should encourage meaningful participationof private investors, particularly local business leaders.These private investors are an important source oflocal governance and a valuable resource if the MFIencounters difficulties. Furthermore, MFIs benefitfrom the participation of several significant sharehold-ers who bring diverse backgrounds and perspectives tothe governance process. In addition to private inves-tors, regulators should encourage investment by otherprivate or public development-oriented institutionswith microfinance or related development financeexperience.
� Organizational and ownership structures. If a socialorganization, which is funded with public resourcesand does not have owners, oversees the manage-ment and determines the policies of the regulatedfinancial intermediary, social objectives may takepriority over financial objectives. This may make itdifficult to determine the true performance of the
regulated financial intermediary, hindering bankregulators from gaining an accurate financial pro-file of the regulated entity. Successful arrangementsbetween the social organization (the nongovern-mental organization) and the regulated MFI can beattained if the structure adheres to certain basicprinciples, including transparency, arm’s-lengthtransactions, honest transfer pricing, and opera-tional independence. The regulated MFI mustmaintain independent management and oversightof its financial services. Regulators can require thatthe composition of the MFI’s board of directorsinclude professional individuals who are preparedto define sound policies and to oversee manage-ment. All directors should be held legally liable forthe performance of the MFI, as is the case fordirectors of private sector companies.
� Sufficient financial depth. MFIs may be capable of rais-ing the initial capital requirements from their found-ing shareholders. However, these owners may lack thefinancial depth or the motivation to respond to addi-tional calls for capital as required. Development insti-tutions may require a lengthy approval process tosecure disbursement of funds. Regulators can intro-duce measures to compensate for the owners’ limitedcapacity to provide additional capital. This can beaddressed by the following options: establishing addi-tional reserve funds, limiting dividend distributionuntil capital benchmarks are reached, and requiringstandby financing commitments by MFI owners.
Management Risks
The management risks that apply to MFIs are generatedby the specific methods of providing financial services.� Decentralized operational systems. A decentralized
organizational structure that permits the provision offinancial services directly at the borrower’s or saver’slocation is central to microfinance. Consequently,senior management must train and supervise mid-level management, introduce appropriate reportingsystems, and maintain adequate communication sys-tems so that uniform policies and procedures areadopted. Furthermore, decentralized operating meth-ods create an environment that can easily be subjectto fraudulent practices. Regulators should requireMFIs to maintain strong internal auditing capabili-
30 M I C R O F I N A N C E H A N D B O O K
U N D E R S T A N D I N G T H E C O U N T R Y C O N T E X T 31
ties and aggressive internal auditing procedures.Guidelines should be established for the performanceof external audits for MFIs. Finally, adequate mea-sures of internal communications and financial con-trols are essential.
� Management efficiency. MFIs offer a high-volume,repetitive service that operates on very tight margins.If funds are not relent promptly, earnings will suffer.Regulators should ensure a high quality of manage-ment to ensure that brisk and timely services areprovided.
� Management information. Decentralized operatingmethods, high volume of short-term loans, rapidportfolio turnover, and the requirement for effi-cient service delivery make accurate and currentportfolio information essential for effective MFImanagement. In general, MFIs have not focusedon providing adequate and appropriate financialinformation for making judgments about theirfinancial viability. Government regulators, donors,potential depositors, and other types of potentialcreditors all need fairly standard informationabout financial viability in order to make informedjudgments. Reporting requirements for regulatedinstitutions make it necessary for MFIs to be ableto produce accurate, useful, and timely manage-ment information.
New Industry
A number of the risks that face MFIs stem from the factthat microfinance is a relatively new field. Formal finan-cial services may also be new to the micro market.� Growth management. MFIs that expand into newmarkets often face little competition. These institu-tions can experience dramatic growth in their initialyears of operation. Regulators should closely monitorMFIs that dramatically surpass the growth projectionspresented in the license application.
� New products and services. Although this industry hasmade considerable advances in the design of appropri-ate microfinance products and services, the fieldremains relatively young and untested. It is difficult toassess when a new product, or service is an ill-conceived deviation from an existing model or abreakthrough in new services for the market. Newproducts and services must be well tested before being
implemented on a broad scale. It may be appropriateto limit the number of new products or services thatare introduced at any one time. The challenge facingMFIs is to conduct a large volume of very small trans-actions and to do so sustainably. Given this challenge,it is most appropriate to limit MFIs to relatively sim-ple products and services that can be easily mastered.
Sources and Further Reading
Basle Committee on Banking Regulations and SupervisoryPractices. 1988. “International Convergence of CapitalMeasurement and Capital Standards.” Basle, Switzerland.
Berenbach, Shari, and Craig Churchill. 1997. Regulation andSupervision of Microfinance Institutions: Experience fromLatin America, Asia and Africa. Occasional Paper 1.Washington, D.C.: MicroFinance Network.
Carpenter, Janney. 1996.Microcredit in Transitional Economies.Organisation for Economic Co-operation andDevelopment, Centre for Co-operation with the Economiesin Transition, Paris, France.
CGAP (Consultative Group to Assist the Poorest). 1996a.“The Consultative Group to Assist the Poorest—AMicrofinance Program.” CGAP Focus Note 1. WorldBank, Washington, D.C.
———. 1996b. “Regulation & Supervision of Micro-FinanceInstitutions: Stabilizing a New Financial Market.” CGAPFocus Note 4. World Bank, Washington, D.C.
———. 1997. “How CGAP Member Donors Fund Micro-finance Institutions.” CGAP Focus Note 11. World Bank,Washington, D.C.
Chaves, Rodrigo A., and Claudio Gonzalez-Vega. 1993.“Should Principles of Regulation and PrudentialSupervision Be Different for Microenterprise FinanceOrganizations?” GEMINI Working Paper 38. U.S.Agency for International Development, Washington,D.C.
———. 1994. “Principles of Regulation and PrudentialSupervision and their Relevance for MicroenterpriseFinance Organizations.” In Maria Otero and ElisabethRhyne, eds., New World of Microenterprise Finance. WestHartford, Conn.: Kumarian Press.
———. 1995. “Making the Leap into the Formal FinancialSystem: Structuring Regulation and Prudential Supervisionfor Microenterprise Finance Organizations.” GEMINIMicroenterprise Development Brief 19. U.S. Agency forInternational Development, Washington, D.C.
Chaves, Rodrigo, and Susana Sánchez. 1997. “Formal SectorSuppliers in Rural Mexico.” World Bank, Latin America and
32 M I C R O F I N A N C E H A N D B O O K
the Caribbean Region, Finance, Private Sector, andInfrastructure Unit, Washington, D.C.
Christen, Robert P. 1995. “Issues in the Regulation andSupervision of Microfinance.” Paper presented at the con-ference on Regulation and Supervision of MicrofinanceInstitutions, sponsored by ACCION International,November 27–28, Washington, D.C.
Churchill, Craig, ed. 1997. Regulation and Supervision ofMicrofinance Institutions Case Studies. Occasional Paper 2.Washington, D.C.: MicroFinance Network.
Cuevas, Carlos E. 1996. “Enabling Environment andMicrofinance Institutions: Lessons from Latin Amer-ica.” Journal of International Development 8 (2): 195–210.
Dadson, Christine. 1997. “Citi Savings and Loans, Ghana.”Adapted from Craig Churchill, ed., “Establishing aMicrofinance Industry.” MicroFinance Network,Washington, D.C.
Dichter, Thomas. 1997. “Alexandria Business Association”Case Study for the Sustainable Banking with the PoorProject. World Bank, South Asia Social Development Unit,Washington, D.C.
Drake, Deborah, and Maria Otero. 1992. Alchemists for thePoor: NGOs as Financial Institutions. Monograph Series 6.Washington, D.C.: ACCION International.
FAO (Food and Agriculture Organization). 1995.“Safeguarding Deposits: Learning from Experience.” FAOAgricultural Services Bulletin 116. Rome.
Gray, Tom, and Matt Gamser. 1994. “Building anInstitutional and Policy Framework to Support Small andMedium Enterprises: Learning from Other Cultures.”Implementing Policy Change Project. DevelopmentAlternatives, Inc., Bethesda, Md.
Krahnen, Jan Pieter, and Reinhard H. Schmidt. 1994.Development Finance as Institution Building: A New Approachto Poverty-Oriented Lending. Boulder, Colo.: Westview Press.
Krutzfeldt, Herman. 1995. “The Experience of BancoSol.”Paper presented at the MicroFinance Network Conference,November, Manila.
Ledgerwood, Joanna. 1997. “Albania Development Fund.”Case Study for the Sustainable Banking with the PoorProject. World Bank, South Asia Social DevelopmentUnit, Washington, D.C.
Lobíere, Jacques Trigo. 1995. “Supervision and Regulationof Microfinance Institutions: The Bolivian Experience.”Paper presented at the conference on Regulation andSupervision of Microfinance Institutions, sponsored by
ACCION International, November 27–28, Washington,D.C.
Rhyne, Elisabeth. 1995. “Major Issues in Supervision andRegulation.” Paper presented at the MicroFinance NetworkConference, November, Manila.
Robinson, Marguerite. 1994. “Savings Mobilization andMicroenterprise Finance: The Indonesian Experience.” In MariaOtero and Elisabeth Rhyne, eds., The New World of Micro-enterprise Finance.WestHartford, Conn.: Kumarian Press.
Rock, Rachel, and Maria Otero, eds. 1997. From Margin toMainstream: The Regulation and Supervision of Microfinance.Monograph Series 11. Washington, D.C.: ACCIONInternational.
Rosenberg, Richard. 1994. “Beyond Self-Sufficiency: LicensedLeverage and Microfinance Strategy.” U.S. Agency forInternational Development, Washington, D.C.
Stearns, Katherine, and Maria Otero, eds. 1990. The CriticalConnection: Governments, Private Institutions, and theInformal Sector in Latin America. Monograph Series 5.Washington, D.C.: ACCION International.
USAID (U.S. Agency for International Development). 1995.“Policy Goals, Reform, and Microenterprise Development.”Microenterprise Development Brief 25. GEMINI Project,Washington, D.C.
———. 1998. Microenterprise Development Policy Paper.Washington, D.C.
Vogel, Robert C. 1994. “Other People’s Money: RegulatoryIssues Facing Microenterprise Finance Programs.”International Management and CommunicationsCorporation, Washington, D.C.
Waterfield, Charles, and Ann Duval. 1996. CARE Savings andCredit Sourcebook. Atlanta, Ga.: CARE.
Women’s World Banking Global Policy Forum. 1995.“The Missing Links: Financial Systems That Work forthe Majority.” Women’s World Banking (April).
Yanovitch, Lawrence, and Dennis Macray. 1996. “TheMultilateral Development Banks and the Microfinance Sector:Opening Financial Markets to the World’s Self-EmployedPoor.” Paper prepared for the Congressional Task Force onthe U.S. and Multilateral Development Banks and the Centerfor Strategic and International Studies. Foundation forInternational Community Assistance, Washington, D.C.
Yaron, Jacob, McDonald P. Benjamin, Jr., and Gerda L.Piprek. 1997. Rural Finance; Issues, Design, and BestPractices. Environmentally and Socially SustainableDevelopment Studies and Monographs Series 14.Washington, D.C.: World Bank.
33
The Target Marketand Impact Analysis
C H A P T E R T W O
Atarget market is a group of potential clients whoshare certain characteristics, tend to behave insimilar ways, and are likely to be attracted to a
specific combination of products and services. A targetmarket represents a defined market segment that con-tains identifiable clients who demand or represent apotential demand for microfinance services. In selectinga target market for microfinance services, MFIs need todetermine their own objectives, understand what moti-vates a group of clients, and assess whether the targetmarket can be reached in a way that will eventually befinancially sustainable. Most important, the market mustbe chosen based on effective demand for financial ser-vices and the capacity within that market to take ondebt.Organizations that do not define their objectives, and
hence their target market, or that fail to design theirproducts to meet the needs of this market often have dif-ficulty managing their operations and staying focused.For example, an organization that simply wants to pro-vide financial services to the poor without defining whothe poor are and which level of the poor it wants toreach often ends up operating with different credit mod-els, trying to serve different groups and satisfy differentdonors. Both donors and practitioners should be clearabout appropriate target markets for particular MFIs andmust continually focus on meeting those markets’ needs.Specifically, donors should not encourage MFIs to oper-ate in areas or market segments where they have no expe-rience, expertise, or resources.Target markets can be identified by the characteristics
of the clients (poverty level, gender, ethnicity, caste, reli-gion, and so forth) the MFI wants to serve and the typeor level of business activity (existing businesses, growth-
oriented businesses, or specific economic sectors) it wish-es to support. Furthermore, the clients’ cash flow andcapacity for debt must match the services being offered.Once a target market is selected, it is important to
determine if that market is in fact being reached andwhat impact the provision of financial services has onthat market. This is done by carrying out impact analy-sis, discussed in the second half of this chapter.Chapter 1 examined the supply of financial services;
this chapter focuses on demand and on how to determinethe impact of meeting that demand on the target market.It summarizes what stakeholders need to know to deter-mine whom they want to provide services to (practition-ers) or support the provision of services to (donors) andwhether they achieve the desired outcomes.This chapter covers two main topics: identifying a
target market, and analyzing the impact of services onthat market.
Objectives of the Microfinance Institution
Selecting a target market depends on the objectives ofthe microfinance service provider and the perceiveddemand for financial services. In any country there areunserved or underserved enterprises and households,ranging from the ultra-poor, who may not be economi-cally active, to small growing enterprises that provideemployment in their communities. This range or con-tinuum constitutes the demand side for microfinanceservices. Often the supply side does not offer a corre-sponding continuum of services. MFIs need to supplyservices that fill the gaps and integrate the unservedgroups into the market.
34 M I C R O F I N A N C E H A N D B O O K
The goal of MFIs as development organizations is toservice the financial needs of unserved or underservedmarkets as a means of meeting development objectives.These development objectives generally include one ormore of the following:� To reduce poverty� To empower women or other disadvantaged popula-tion groups
� To create employment� To help existing businesses grow or diversify theiractivities
� To encourage the development of new businesses.In a World Bank study of lending for small and
microenterprise projects, three objectives were most fre-quently cited (Webster, Riopelle, and Chidzero 1996):� To create employment and income opportunitiesthrough the creation and expansion of microenterprises
� To increase the productivity and incomes of vulnera-ble groups, especially women and the poor
� To reduce rural families’ dependence on drought-prone crops through diversification of their income-generating activities.Given the large number of conditional variables in
each country context, every organizational decision toenter or serve a target market will involve balancing theconditions in that market. This decisionmaking processmust keep in mind the two long-term goals of microfi-nance: outreach, serving those who have been consistentlyunderserved by financial institutions (such as women, thepoor, and indigenous and rural populations), and sus-tainability, generating enough revenue to cover the costsof providing financial services. Depending on which tar-get market is selected, there are consequences to theMFI’s financial position, because costs will be affected.In short, there are trade-offs involved in the decisionsabout objectives and how to reach them. The central cal-culus for an MFI concerns which objectives it can affordto set and for how long.MFIs need to determine where there is unmet
demand for microfinance services and which target groupmatches their objectives. For example, if an MFI’s objec-tive is to reach the very poor with financial and other ser-vices, its target market will differ from an MFI thatwishes to serve the economically active poor with onlyfinancial services. In addition, some MFIs may wish tofocus on a particular economic sector or level of businessactivity as a means of achieving their objectives.
Direct and Indirect Targeting
Before discussing how MFIs identify their target markets,it is worthwhile to clarify the meanings of and differencesbetween direct and indirect targeting and to explain whyindirect targeting (or “identifying” the market) is the pre-ferred means of reaching a target market with financialservices.
Direct targeting generally refers to the allocation of aspecific amount of funds to provide credit to a particularsector of the economy or population. Direct targeting isfounded on the belief that because certain groups (thepoor, specific castes) or sectors (agriculture, fisheries) areunable to access credit (or to access it at affordableprices), credit must be made accessible through a govern-ment or donor mandate. In some cases the governmentor donor also subsidizes the clients’ cost of borrowing.In spite of the good intentions of such a strategy, one
should be skeptical about its usefulness (see box 2.1).First, due to the fungibility (exchangeability) of money,it is almost always impossible to know what any givenloan “really” finances. Second, it is highly doubtful thatanyone knows better than the recipients themselves whatis good for them. Third, the strategy rests on the ideathat “commerce” and “consumption” are less valuable
Box 2.1 Targeted Credit Activities
IN MOST DEVELOPING COUNTRIES THERE HAS BEEN
extensive government intervention in the allocation ofcredit. Although a degree of intervention may have beenuseful during the early stages of development, many coun-tries have come to recognize that this policy has had anadverse effect on industrial and financial development.The evidence suggests that direct targeted credit programshave been an inefficient way of redistributing income anddealing with imperfections in the goods market. However,some programs that were well designed and narrowlyfocused have been reasonably successful in dealing withspecific imperfections in the financial markets (for exam-ple, the lack of risk capital). In the future governmentsshould attack the conditions that made direct creditappear desirable—imperfections in markets or extremeinequalities in income—instead of using directed creditprograms and interest rate subsidies.
Source: Pederson 1997.
socially than “production” and “income generation” andshould therefore not be financed. This naively transfersnotions from industrialized to developing countries andfrom the world of the wealthy to the world of the poor.For example, if people are engaged in trade, this is likelyto be a better line of business for them. However, con-sumption by a poor household is very often a way ofstrengthening income-generation capabilities throughimproved education and nutrition.Direct targeting generally leads to credit diversion and
low repayment. It also results in substantial costs of mon-itoring eligibility and compliance. Furthermore, potentialclients who have profitable but unfinanced or underfi-nanced businesses may be excluded because they do notfit the profile. Alternatively, people who do match thequalifications and receive credit may not have entrepre-neurial skills or a profitable venture in need of financing.
Indirect targeting means that products and services aredesigned for and aimed at people who are beyond thenormal frontiers of formal finance, instead of mandatingspecific funds to particular groups who fit a narrowlydefined profile. Indirect targeting focuses on those whocannot take advantage of income-generating opportuni-ties because of market imperfections or other barriers tofinancial services. With indirect targeting, self-selectiontakes place by virtue of the design of microfinanceservices. Economists refer to this as “incentive com-patibility”—the terms and conditions are such thatunwanted clients will not be interested, both because theproducts are less attractive and because the set of require-ments imposed to access the services will seem too bur-densome. This happens because populations outside ofthe target group have other alternatives for financial ser-vices that the target group does not have.For example, an MFI that seeks to provide the very
poor with credit should design its loan products so thatthe relatively high interest rates and small size of loans areattractive only to the very poor. The MFI may alsorequire group guarantees and weekly attendance at groupmeetings. More affluent clients usually see this as aninconvenience, which makes the credit attractive only topoorer clients.The primary difference between direct and indirect
targeting lies in the means that the MFI uses rather thanin the target group. Both direct and indirect targetingmay reach the same population groups or economic sec-
tors, but direct targeting imposes eligibility criteria, whileindirect targeting designs appropriate products andservices.
The Importance of Adequate Cash Flow and theCapacity to Service Debt
Debt capacity is an important consideration in determin-ing the demand for financial services. When identifyingtheir target market, MFIs must consider clients’ andpotential clients’ cash flow as well as their ability to repayloans. Cash flow is the comparison of cash inflows andoutflows. Debt capacity is the amount of additional debta client can take on without running the risk of inade-quate cash flow and consequent loan default.1
MFIs need to consider debt capacity as opposed tobasing credit decisions on a “credit need” approach thatrisks future trouble for both lenders and borrowers. Acredit-need assessment yields unreliable informationbecause self-reported credit need involves “wishing.” Byfocusing on credit need rather than debt capacity thelender risks not getting the money back, and the borrow-er risks serious debt. This is because the need for creditand the ability to repay debt cannot be assumed tomatch.No matter how the target market is identified, it is
imperative for MFIs to ensure that each client and targetgroup can generate enough cash to repay the loan ontime. This in turn determines the size of the potentialtarget market (differentiating between “credit need,” orwhat borrowers say they want, and “effective demand,”or what borrowers can and are willing to borrow andrepay).“Lenders are able to recover loans on schedule onlywhen the repayment capacity of the borrowerequals or exceeds debt service, which consists ofprincipal and interest due for payment. Borrowersare able to repay their loans on time without suf-fering hardship only when their repayment capaci-ty equals or exceeds the debt service due accordingto the loan contract. These simple, self-evidentrelationships define the role that credit plays indevelopment and influence the fate of efforts toexpand the frontier of formal finance.” (VonPischke 1991, 277)
T H E T A R G E T M A R K E T A N D I M P A C T A N A L Y S I S 35
1. This discussion is drawn from Von Pischke (1991).
To determine potential clients’ debt capacity, the firstconsideration is their cash flow. It is then necessary toassess the degree of risk associated with this cash flow andother claims that may come before repaying the MFIloan. Adjusting the debt capacity of a borrower for riskshould reflect reasonable expectations about adverse con-ditions that may affect the borrower’s enterprise.Adjustment for adversity should reflect the lender’s will-ingness to assume the risks of borrowers’ inability torepay. The greater the MFI’s capacity to assume risk, thehigher the credit limits the lender can offer.Other claims that need be considered are debts to
other lenders (claims by informal lenders generally rankahead of those of formal credit institutions) and house-hold expenses such as food and fuel, taxes, school fees,and expenditures for emergencies, important social oblig-ations, and ceremonies.MFIs need to be conservative when estimating the
debt capacity of a potential target market, because deter-mining clients’ debt capacity is an important part ofidentifying a target market and designing appropriateproducts and services for this market. For the most part,borrowers do not go into debt to the full extent of theirdebt capacity. Economists refer to this as “internal creditrationing.” If borrowers attempt to fully exhaust theirdebt capacity, they are usually behaving opportunisticallyand are at risk of not being able to manage debt.
Minimal Equity Requirement
In addition to assessing clients’ debt capacity, MFIsshould consider clients’ ability to contribute a minimumamount of equity. In other words, loans should notfinance the entire business activity. Some MFIs set a cer-tain percentage of equity as one of the loan conditions.Even when the target group is start-up businesses ownedby the very poor, where equity contributions in the strictsense are not possible, some MFIs require the pledging ofa household asset before granting the loan. Other formsof equity can be compulsory savings or an amount con-tributed by the borrower to the project in the form of a“membership fee” or “loan application fee.” While thesefees or contributions are financially insignificant from thelenders’ point of view, they carry financial and psycho-logical weight for the prospective borrowers.In banking terms, minimal equity requirements
reduce the lender’s risk. However, in microfinance it is
equally important to invoke the underlying psychologicalbasis for a minimal equity contribution. People careabout an asset if they have worked for it or own it. Thisseems to be a universal trait of human nature. If the MFIlends 100 percent of the cost of projects or assets, bor-rowers have little or no risk since their own money is notat stake. By requiring a contribution by the borrower(even if it is in fact a token from the lender’s viewpoint),MFIs hope to increase responsible behavior among bor-rowers and thereby reduce the chances of loan default.However, MFIs need to monitor where their clients
are accessing the capital for this minimal equity contribu-tion. If clients need to borrow funds from another source(at potentially higher interest rates) to contribute equity,they may be increasing the risk of default.
Moral Hazard
Managing debt capacity and ensuring a minimal equityrequirement offset moral hazard. Moral hazard isdefined as “the incentive by someone (an agent) whoholds an asset belonging to another person (the princi-ple) to endanger the value of that asset because the agentbears less than the full consequence of any loss” (Chavesand Gonzalez-Vega 1994). For example, a borrower’sefforts to repay may be largely unobservable by an MFI;it cannot readily determine what is attributable to thelack of effort by the client as opposed to bad luck orexternal forces. An MFI that could observe the borrowercould relate the terms of the loan contract to the effortput in by the borrower, but because it costs too much todo this, the best the MFI can do is to ensure that thecash flow and debt capacity of the borrower are suffi-cient to service the debt. MFIs must also set terms of theloan that are acceptable to the borrower and result inbehavior that the MFI prefers. This usually means giv-ing the borrower more risk (by being less willing to for-give loans when things go wrong) than the MFI wouldbe ready to assume if it had better information (Yaron,Benjamin, and Piperk 1997).
Market Size
MFIs should estimate the size of the market for microen-terprises that can benefit from financial services, lest self-reported credit need be confused with debt capacity andeffective demand. Obviously, since there are costs
36 M I C R O F I N A N C E H A N D B O O K
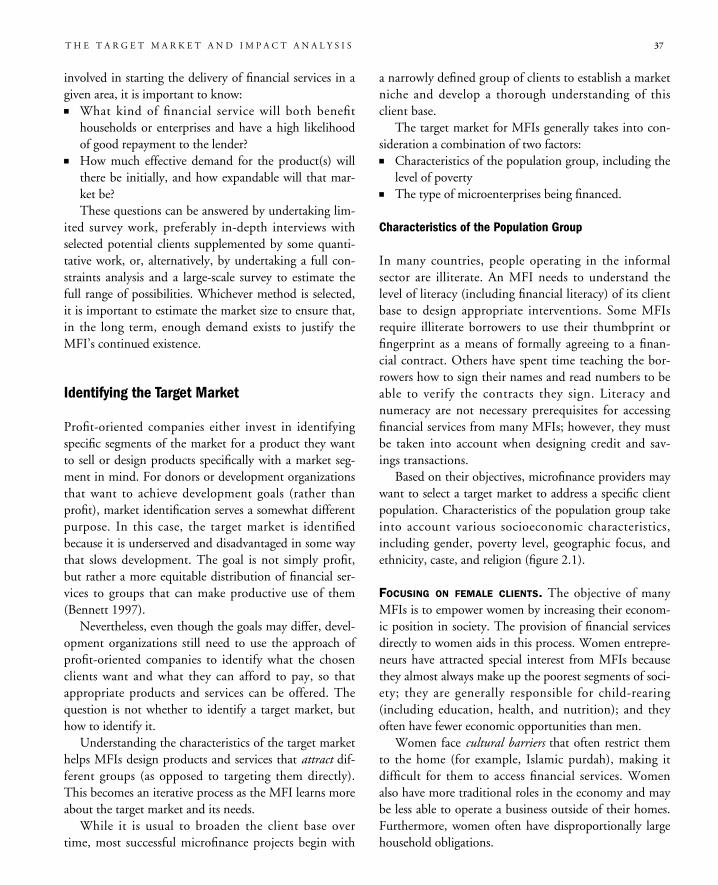
involved in starting the delivery of financial services in agiven area, it is important to know:� What kind of financial service will both benefithouseholds or enterprises and have a high likelihoodof good repayment to the lender?
� How much effective demand for the product(s) willthere be initially, and how expandable will that mar-ket be?These questions can be answered by undertaking lim-
ited survey work, preferably in-depth interviews withselected potential clients supplemented by some quanti-tative work, or, alternatively, by undertaking a full con-straints analysis and a large-scale survey to estimate thefull range of possibilities. Whichever method is selected,it is important to estimate the market size to ensure that,in the long term, enough demand exists to justify theMFI’s continued existence.
Identifying the Target Market
Profit-oriented companies either invest in identifyingspecific segments of the market for a product they wantto sell or design products specifically with a market seg-ment in mind. For donors or development organizationsthat want to achieve development goals (rather thanprofit), market identification serves a somewhat differentpurpose. In this case, the target market is identifiedbecause it is underserved and disadvantaged in some waythat slows development. The goal is not simply profit,but rather a more equitable distribution of financial ser-vices to groups that can make productive use of them(Bennett 1997).Nevertheless, even though the goals may differ, devel-
opment organizations still need to use the approach ofprofit-oriented companies to identify what the chosenclients want and what they can afford to pay, so thatappropriate products and services can be offered. Thequestion is not whether to identify a target market, buthow to identify it.Understanding the characteristics of the target market
helps MFIs design products and services that attract dif-ferent groups (as opposed to targeting them directly).This becomes an iterative process as the MFI learns moreabout the target market and its needs.While it is usual to broaden the client base over
time, most successful microfinance projects begin with
a narrowly defined group of clients to establish a marketniche and develop a thorough understanding of thisclient base.The target market for MFIs generally takes into con-
sideration a combination of two factors:� Characteristics of the population group, including thelevel of poverty
� The type of microenterprises being financed.
Characteristics of the Population Group
In many countries, people operating in the informalsector are illiterate. An MFI needs to understand thelevel of literacy (including financial literacy) of its clientbase to design appropriate interventions. Some MFIsrequire illiterate borrowers to use their thumbprint orfingerprint as a means of formally agreeing to a finan-cial contract. Others have spent time teaching the bor-rowers how to sign their names and read numbers to beable to verify the contracts they sign. Literacy andnumeracy are not necessary prerequisites for accessingfinancial services from many MFIs; however, they mustbe taken into account when designing credit and sav-ings transactions.Based on their objectives, microfinance providers may
want to select a target market to address a specific clientpopulation. Characteristics of the population group takeinto account various socioeconomic characteristics,including gender, poverty level, geographic focus, andethnicity, caste, and religion (figure 2.1).
FOCUSING ON FEMALE CLIENTS. The objective of manyMFIs is to empower women by increasing their econom-ic position in society. The provision of financial servicesdirectly to women aids in this process. Women entrepre-neurs have attracted special interest from MFIs becausethey almost always make up the poorest segments of soci-ety; they are generally responsible for child-rearing(including education, health, and nutrition); and theyoften have fewer economic opportunities than men.Women face cultural barriers that often restrict them
to the home (for example, Islamic purdah), making itdifficult for them to access financial services. Womenalso have more traditional roles in the economy and maybe less able to operate a business outside of their homes.Furthermore, women often have disproportionally largehousehold obligations.
T H E T A R G E T M A R K E T A N D I M P A C T A N A L Y S I S 37
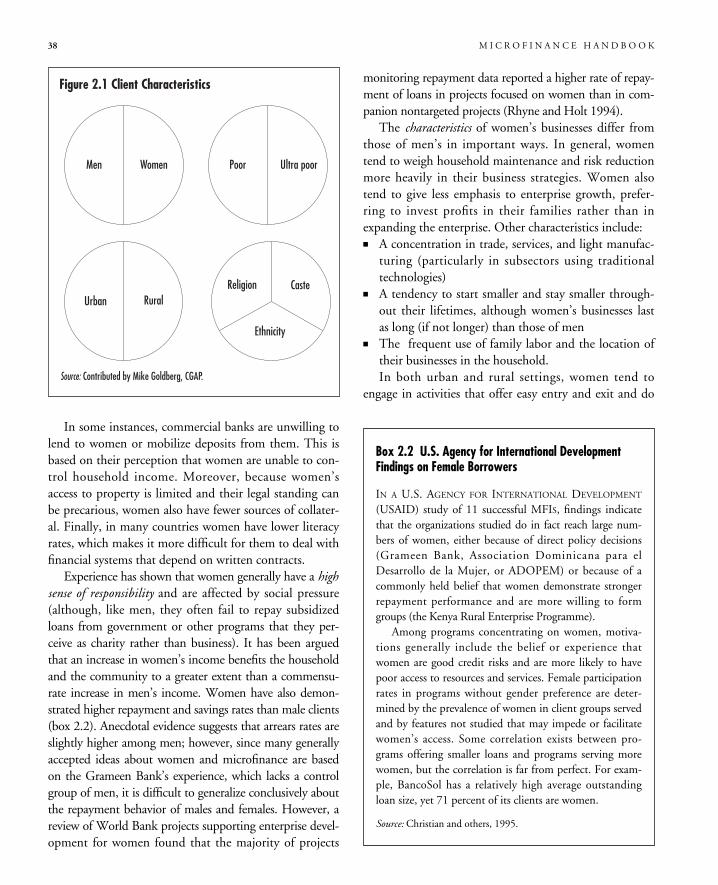
In some instances, commercial banks are unwilling tolend to women or mobilize deposits from them. This isbased on their perception that women are unable to con-trol household income. Moreover, because women’saccess to property is limited and their legal standing canbe precarious, women also have fewer sources of collater-al. Finally, in many countries women have lower literacyrates, which makes it more difficult for them to deal withfinancial systems that depend on written contracts.Experience has shown that women generally have a high
sense of responsibility and are affected by social pressure(although, like men, they often fail to repay subsidizedloans from government or other programs that they per-ceive as charity rather than business). It has been arguedthat an increase in women’s income benefits the householdand the community to a greater extent than a commensu-rate increase in men’s income. Women have also demon-strated higher repayment and savings rates than male clients(box 2.2). Anecdotal evidence suggests that arrears rates areslightly higher among men; however, since many generallyaccepted ideas about women and microfinance are basedon the Grameen Bank’s experience, which lacks a controlgroup of men, it is difficult to generalize conclusively aboutthe repayment behavior of males and females. However, areview of World Bank projects supporting enterprise devel-opment for women found that the majority of projects
monitoring repayment data reported a higher rate of repay-ment of loans in projects focused on women than in com-panion nontargeted projects (Rhyne and Holt 1994).The characteristics of women’s businesses differ from
those of men’s in important ways. In general, womentend to weigh household maintenance and risk reductionmore heavily in their business strategies. Women alsotend to give less emphasis to enterprise growth, prefer-ring to invest profits in their families rather than inexpanding the enterprise. Other characteristics include:� A concentration in trade, services, and light manufac-turing (particularly in subsectors using traditionaltechnologies)
� A tendency to start smaller and stay smaller through-out their lifetimes, although women’s businesses lastas long (if not longer) than those of men
� The frequent use of family labor and the location oftheir businesses in the household.In both urban and rural settings, women tend to
engage in activities that offer easy entry and exit and do
38 M I C R O F I N A N C E H A N D B O O K
Box 2.2 U.S. Agency for International DevelopmentFindings on Female Borrowers
IN A U.S. AGENCY FOR INTERNATIONAL DEVELOPMENT(USAID) study of 11 successful MFIS, findings indicatethat the organizations studied do in fact reach large num-bers of women, either because of direct policy decisions(Grameen Bank, Association Dominicana para elDesarrollo de la Mujer, or ADOPEM) or because of acommonly held belief that women demonstrate strongerrepayment performance and are more willing to formgroups (the Kenya Rural Enterprise Programme).Among programs concentrating on women, motiva-
tions generally include the belief or experience thatwomen are good credit risks and are more likely to havepoor access to resources and services. Female participationrates in programs without gender preference are deter-mined by the prevalence of women in client groups servedand by features not studied that may impede or facilitatewomen’s access. Some correlation exists between pro-grams offering smaller loans and programs serving morewomen, but the correlation is far from perfect. For exam-ple, BancoSol has a relatively high average outstandingloan size, yet 71 percent of its clients are women.
Source: Christian and others, 1995.
Figure 2.1 Client Characteristics
Men Women Poor Ultra poor
Urban RuralReligion Caste
Ethnicity
Source: Contributed by Mike Goldberg, CGAP.
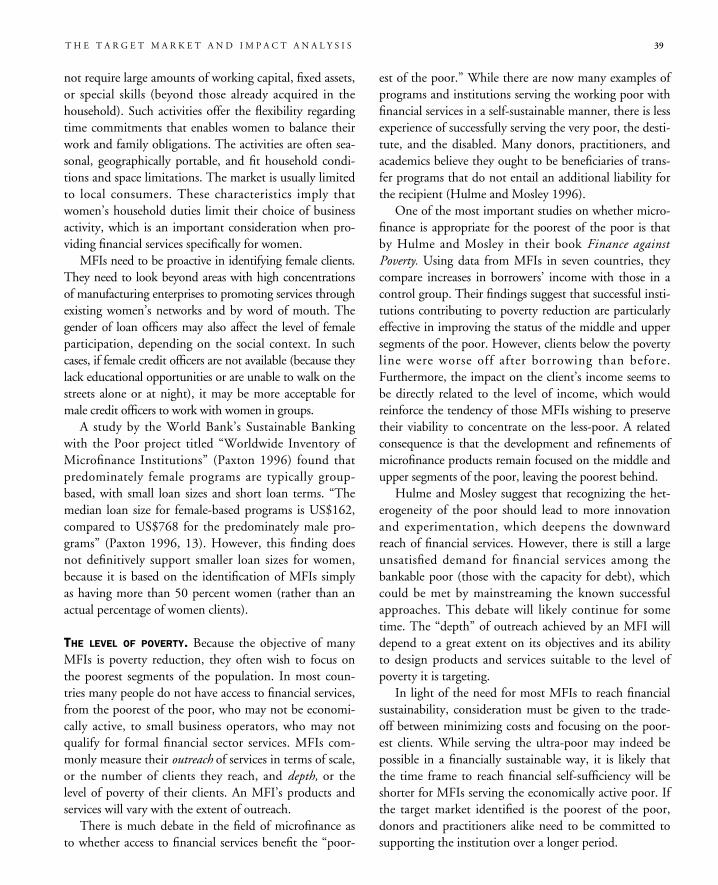
T H E T A R G E T M A R K E T A N D I M P A C T A N A L Y S I S 39
not require large amounts of working capital, fixed assets,or special skills (beyond those already acquired in thehousehold). Such activities offer the flexibility regardingtime commitments that enables women to balance theirwork and family obligations. The activities are often sea-sonal, geographically portable, and fit household condi-tions and space limitations. The market is usually limitedto local consumers. These characteristics imply thatwomen’s household duties limit their choice of businessactivity, which is an important consideration when pro-viding financial services specifically for women.MFIs need to be proactive in identifying female clients.
They need to look beyond areas with high concentrationsof manufacturing enterprises to promoting services throughexisting women’s networks and by word of mouth. Thegender of loan officers may also affect the level of femaleparticipation, depending on the social context. In suchcases, if female credit officers are not available (because theylack educational opportunities or are unable to walk on thestreets alone or at night), it may be more acceptable formale credit officers to work with women in groups.A study by the World Bank’s Sustainable Banking
with the Poor project titled “Worldwide Inventory ofMicrofinance Institutions” (Paxton 1996) found thatpredominately female programs are typically group-based, with small loan sizes and short loan terms. “Themedian loan size for female-based programs is US$162,compared to US$768 for the predominately male pro-grams” (Paxton 1996, 13). However, this finding doesnot definitively support smaller loan sizes for women,because it is based on the identification of MFIs simplyas having more than 50 percent women (rather than anactual percentage of women clients).
THE LEVEL OF POVERTY. Because the objective of manyMFIs is poverty reduction, they often wish to focus onthe poorest segments of the population. In most coun-tries many people do not have access to financial services,from the poorest of the poor, who may not be economi-cally active, to small business operators, who may notqualify for formal financial sector services. MFIs com-monly measure their outreach of services in terms of scale,or the number of clients they reach, and depth, or thelevel of poverty of their clients. An MFI’s products andservices will vary with the extent of outreach.There is much debate in the field of microfinance as
to whether access to financial services benefit the “poor-
est of the poor.” While there are now many examples ofprograms and institutions serving the working poor withfinancial services in a self-sustainable manner, there is lessexperience of successfully serving the very poor, the desti-tute, and the disabled. Many donors, practitioners, andacademics believe they ought to be beneficiaries of trans-fer programs that do not entail an additional liability forthe recipient (Hulme and Mosley 1996).One of the most important studies on whether micro-
finance is appropriate for the poorest of the poor is thatby Hulme and Mosley in their book Finance againstPoverty. Using data from MFIs in seven countries, theycompare increases in borrowers’ income with those in acontrol group. Their findings suggest that successful insti-tutions contributing to poverty reduction are particularlyeffective in improving the status of the middle and uppersegments of the poor. However, clients below the povertyline were worse off after borrowing than before.Furthermore, the impact on the client’s income seems tobe directly related to the level of income, which wouldreinforce the tendency of those MFIs wishing to preservetheir viability to concentrate on the less-poor. A relatedconsequence is that the development and refinements ofmicrofinance products remain focused on the middle andupper segments of the poor, leaving the poorest behind.Hulme and Mosley suggest that recognizing the het-
erogeneity of the poor should lead to more innovationand experimentation, which deepens the downwardreach of financial services. However, there is still a largeunsatisfied demand for financial services among thebankable poor (those with the capacity for debt), whichcould be met by mainstreaming the known successfulapproaches. This debate will likely continue for sometime. The “depth” of outreach achieved by an MFI willdepend to a great extent on its objectives and its abilityto design products and services suitable to the level ofpoverty it is targeting.In light of the need for most MFIs to reach financial
sustainability, consideration must be given to the trade-off between minimizing costs and focusing on the poor-est clients. While serving the ultra-poor may indeed bepossible in a financially sustainable way, it is likely thatthe time frame to reach financial self-sufficiency will beshorter for MFIs serving the economically active poor. Ifthe target market identified is the poorest of the poor,donors and practitioners alike need to be committed tosupporting the institution over a longer period.
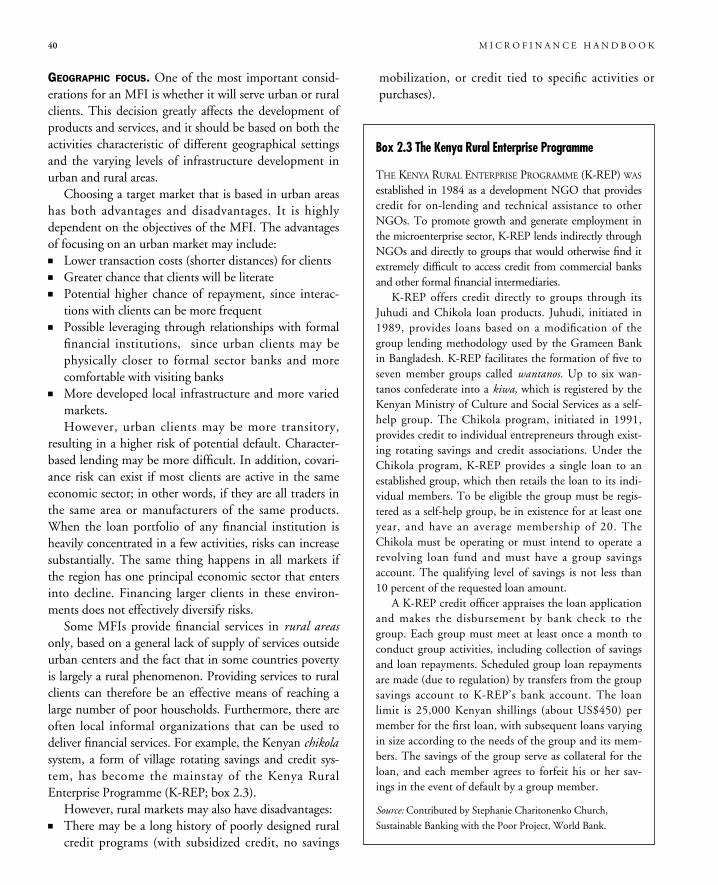
40 M I C R O F I N A N C E H A N D B O O K
GEOGRAPHIC FOCUS. One of the most important consid-erations for an MFI is whether it will serve urban or ruralclients. This decision greatly affects the development ofproducts and services, and it should be based on both theactivities characteristic of different geographical settingsand the varying levels of infrastructure development inurban and rural areas.Choosing a target market that is based in urban areas
has both advantages and disadvantages. It is highlydependent on the objectives of the MFI. The advantagesof focusing on an urban market may include:� Lower transaction costs (shorter distances) for clients� Greater chance that clients will be literate� Potential higher chance of repayment, since interac-tions with clients can be more frequent
� Possible leveraging through relationships with formalfinancial institutions, since urban clients may bephysically closer to formal sector banks and morecomfortable with visiting banks
� More developed local infrastructure and more variedmarkets.However, urban clients may be more transitory,
resulting in a higher risk of potential default. Character-based lending may be more difficult. In addition, covari-ance risk can exist if most clients are active in the sameeconomic sector; in other words, if they are all traders inthe same area or manufacturers of the same products.When the loan portfolio of any financial institution isheavily concentrated in a few activities, risks can increasesubstantially. The same thing happens in all markets ifthe region has one principal economic sector that entersinto decline. Financing larger clients in these environ-ments does not effectively diversify risks.Some MFIs provide financial services in rural areas
only, based on a general lack of supply of services outsideurban centers and the fact that in some countries povertyis largely a rural phenomenon. Providing services to ruralclients can therefore be an effective means of reaching alarge number of poor households. Furthermore, there areoften local informal organizations that can be used todeliver financial services. For example, the Kenyan chikolasystem, a form of village rotating savings and credit sys-tem, has become the mainstay of the Kenya RuralEnterprise Programme (K-REP; box 2.3).However, rural markets may also have disadvantages:
� There may be a long history of poorly designed ruralcredit programs (with subsidized credit, no savings
mobilization, or credit tied to specific activities orpurchases).
Box 2.3 The Kenya Rural Enterprise Programme
THE KENYA RURAL ENTERPRISE PROGRAMME (K-REP) WASestablished in 1984 as a development NGO that providescredit for on-lending and technical assistance to otherNGOs. To promote growth and generate employment inthe microenterprise sector, K-REP lends indirectly throughNGOs and directly to groups that would otherwise find itextremely difficult to access credit from commercial banksand other formal financial intermediaries.K-REP offers credit directly to groups through its
Juhudi and Chikola loan products. Juhudi, initiated in1989, provides loans based on a modification of thegroup lending methodology used by the Grameen Bankin Bangladesh. K-REP facilitates the formation of five toseven member groups called wantanos. Up to six wan-tanos confederate into a kiwa, which is registered by theKenyan Ministry of Culture and Social Services as a self-help group. The Chikola program, initiated in 1991,provides credit to individual entrepreneurs through exist-ing rotating savings and credit associations. Under theChikola program, K-REP provides a single loan to anestablished group, which then retails the loan to its indi-vidual members. To be eligible the group must be regis-tered as a self-help group, be in existence for at least oneyear, and have an average membership of 20. TheChikola must be operating or must intend to operate arevolving loan fund and must have a group savingsaccount. The qualifying level of savings is not less than10 percent of the requested loan amount.A K-REP credit officer appraises the loan application
and makes the disbursement by bank check to thegroup. Each group must meet at least once a month toconduct group activities, including collection of savingsand loan repayments. Scheduled group loan repaymentsare made (due to regulation) by transfers from the groupsavings account to K-REP’s bank account. The loanlimit is 25,000 Kenyan shillings (about US$450) permember for the first loan, with subsequent loans varyingin size according to the needs of the group and its mem-bers. The savings of the group serve as collateral for theloan, and each member agrees to forfeit his or her sav-ings in the event of default by a group member.
Source: Contributed by Stephanie Charitonenko Church,
Sustainable Banking with the Poor Project, World Bank.
� There may be a less diversified economic base.� Covariance risk can be significant. For example, if theMFI is engaged in agricultural lending, many farmersmay grow the same crop or raise the same type of ani-mals, resulting in higher risk in case of drought orother climate disorder.
� There may be no branches of formal financial institu-tions in the area. This can create problems whenclients need access to a branch network for savingsdeposits or loan repayment.
� It may be more difficult to reach the minimal scalerequired to break even.
� There is likely to be a poorly developed infrastructureand a more dispersed population.Whether microentrepreneurs are based in a rural or
urban area, they need access to markets and supplies.Rural areas are often isolated from markets. Furthermore,an inability to produce and deliver goods due to a lack ofinfrastructure may limit microentrepreneurs’ success andgrowth possibilities, thus limiting the demand for finan-cial services. A good transportation system reduces trans-action costs for both clients and MFIs. Some MFIs, suchas the Grameen Bank, operate branches in the same geo-graphic areas as their clients, reducing the barrier toaccessible financial services due to poor roads and inade-quate transportation services.MFIs depend on attaining a certain scale of operations
to achieve sustainability. Providing services to populationsthat are widely dispersed incurs greater transaction costs.However, while less densely populated areas are harder toservice, new methods, such as self-managed village banks,are being developed to overcome this problem by decen-tralizing most of the financial transactions at the villagelevel, thus limiting transportation costs.
ETHNICITY, CASTE, AND RELIGION. In most countries thereare ethnically or traditionally defined groups that areunserved or underserved by existing formal financialinstitutions. There are cases in which a certain groupwithin a community cannot or will not take part in afinancial services project due to a religious, ethnic, orother social influence. It is important to understand theserestrictions when identifying a target market, so thatproducts and services can be developed that take intoaccount the limitations on some groups.Building and maintaining a level of trust when differ-
ent ethnic or religious groups are involved can make pro-
viding microfinance services more difficult. (Caste, whilenot solely an ethnic factor, can pose cultural barriers simi-lar to ethnic differences.) Societies differ in their stock of“social capital—those features of social organization suchas networks, norms, and trust that facilitate coordinationand cooperation for mutual benefit” (Putnam 1993, 36).These structures depend on traditions of collaborationand a certain level of trust between members of society. Insocieties with high social capital, where systems and struc-tures have been developed to build trust and foster socialand economic transactions beyond the family andkingroup, it will be easier and less costly to build sustain-able systems for financial intermediation (Bennett 1997).When identifying a target market, MFIs must ensure
that they are able to communicate with their clients clear-ly. If serious language barriers exist, it may make financialservices to certain clients too costly. In addition, legal orfinancial jargon, even when in the client’s language, maycreate a communication barrier. MFIs must ensure thatcommunication with clients is appropriate to their level ofunderstanding, particularly if clients are anxious to accessfinancial services and do not fully understand the implica-tions and responsibilities of doing so (box 2.4).
T H E T A R G E T M A R K E T A N D I M P A C T A N A L Y S I S 41
Box 2.4 The Influence of Ethnicity and Language inMicrofinance
DOGON VILLAGES IN MALI HAVE REMAINED VERY
secluded over the years because of their physical isolationand the poor condition of communication networks. As aresult, the Dogon culture is relatively homogeneous andtraditions have remained very strong. In addition, villageshave maintained their own linguistic identity. Dialectsdiffer from one village to another, even though they areonly a few miles away, making communication difficult.The total Dogon population amounts to only 600,000people speaking at least 30 different dialects.For a local MFI, the multitude of dialects has three
important effects. First, all staff have to be hired locally,taking into consideration their ability to master severaldialects. Second, training activities and documents for vil-lagers on bank management have to be adapted into sev-eral dialects. Third, networking among village banksinvolves many translations.
Source: Contributed by Cecile Fruman, Sustainable Banking with
the Poor Project, World Bank.
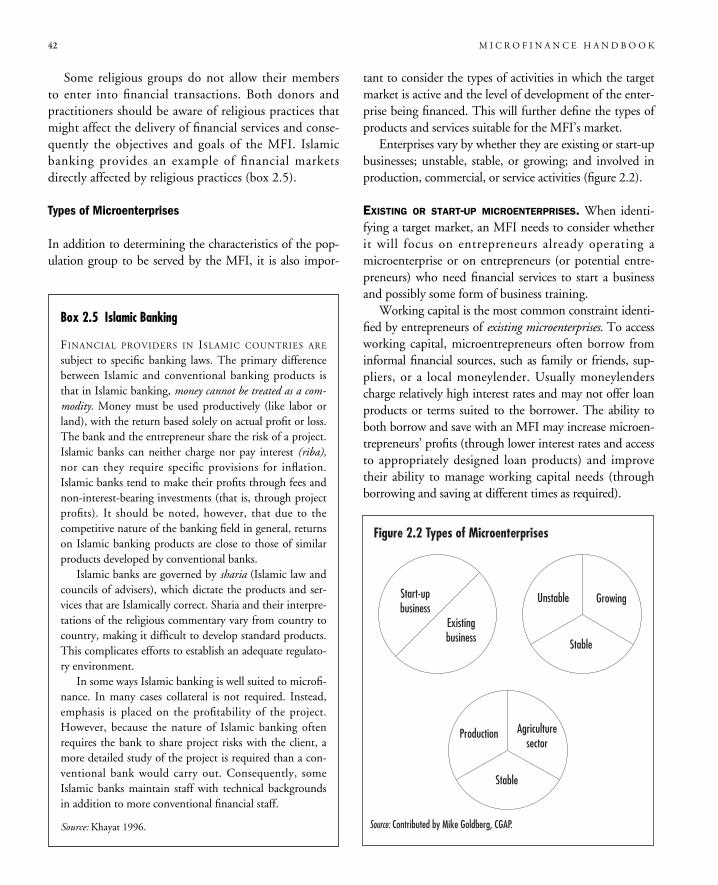
Some religious groups do not allow their membersto enter into financial transactions. Both donors andpractitioners should be aware of religious practices thatmight affect the delivery of financial services and conse-quently the objectives and goals of the MFI. Islamicbanking provides an example of financial marketsdirectly affected by religious practices (box 2.5).
Types of Microenterprises
In addition to determining the characteristics of the pop-ulation group to be served by the MFI, it is also impor-
tant to consider the types of activities in which the targetmarket is active and the level of development of the enter-prise being financed. This will further define the types ofproducts and services suitable for the MFI’s market.Enterprises vary by whether they are existing or start-up
businesses; unstable, stable, or growing; and involved inproduction, commercial, or service activities (figure 2.2).
EXISTING OR START-UP MICROENTERPRISES. When identi-fying a target market, an MFI needs to consider whetherit will focus on entrepreneurs already operating amicroenterprise or on entrepreneurs (or potential entre-preneurs) who need financial services to start a businessand possibly some form of business training.Working capital is the most common constraint identi-
fied by entrepreneurs of existing microenterprises. To accessworking capital, microentrepreneurs often borrow frominformal financial sources, such as family or friends, sup-pliers, or a local moneylender. Usually moneylenderscharge relatively high interest rates and may not offer loanproducts or terms suited to the borrower. The ability toboth borrow and save with an MFI may increase microen-trepreneurs’ profits (through lower interest rates and accessto appropriately designed loan products) and improvetheir ability to manage working capital needs (throughborrowing and saving at different times as required).
42 M I C R O F I N A N C E H A N D B O O K
Figure 2.2 Types of Microenterprises
Start-upbusiness
Unstable Growing
Stable
Source: Contributed by Mike Goldberg, CGAP.
Existingbusiness
Production Agriculturesector
Stable
Box 2.5 Islamic Banking
FINANCIAL PROVIDERS IN ISLAMIC COUNTRIES ARE
subject to specific banking laws. The primary differencebetween Islamic and conventional banking products isthat in Islamic banking, money cannot be treated as a com-modity. Money must be used productively (like labor orland), with the return based solely on actual profit or loss.The bank and the entrepreneur share the risk of a project.Islamic banks can neither charge nor pay interest (riba),nor can they require specific provisions for inflation.Islamic banks tend to make their profits through fees andnon-interest-bearing investments (that is, through projectprofits). It should be noted, however, that due to thecompetitive nature of the banking field in general, returnson Islamic banking products are close to those of similarproducts developed by conventional banks.Islamic banks are governed by sharia (Islamic law and
councils of advisers), which dictate the products and ser-vices that are Islamically correct. Sharia and their interpre-tations of the religious commentary vary from country tocountry, making it difficult to develop standard products.This complicates efforts to establish an adequate regulato-ry environment.In some ways Islamic banking is well suited to microfi-
nance. In many cases collateral is not required. Instead,emphasis is placed on the profitability of the project.However, because the nature of Islamic banking oftenrequires the bank to share project risks with the client, amore detailed study of the project is required than a con-ventional bank would carry out. Consequently, someIslamic banks maintain staff with technical backgroundsin addition to more conventional financial staff.
Source: Khayat 1996.
Profits can also be increased through the acquisitionof capital assets, such as sewing machines or rickshaws.Access to continued financial services, including loansfor capital purchases and savings services to build upreserves, allows microentrepreneurs to increase their assetbase and improve their ability to generate revenue.There are many advantages to working with existing
microentrepreneurs. Active businesses have a history ofsuccess, which greatly reduces the risk to the MFI.Furthermore, existing microentrepreneurs have thepotential to grow and create employment opportunities.However, some may have other debts (to moneylenders,suppliers, family, or other MFIs), which they may pay offwith the proceeds of new loans, thereby increasing therisk of default to the new lender (box 2.6).MFIs that target potential entrepreneurs often have
poverty alleviation as an objective. The belief is that byaiding potential entrepreneurs to start up their own busi-nesses, they will increase their incomes and consequentlyreduce their level of poverty.However, potential entrepreneurs often need more
than financial services. Many need skills training orother inputs to make their enterprises a success. Whenthere are significant barriers to entry into certain fields(due to minimum investment requirements, technolo-gy levels, and market contacts), an integrated approachcan prepare potential entrepreneurs prior to taking ondebt. However, the impact of training courses andtechnical assistance is not clearly linked to increasedproduction, profitability, job creation, and reinvest-ment. If services are subsidized, it can be difficult toremove these subsidies and put the enterprise on anequal footing with local competitors. Also, trainingprograms often assume that anyone can become anentrepreneur, which is not the case, because not every-one is willing to take the risks inherent in owning andoperating a business (although social intermediationservices can help—see chapter 3). Furthermore, train-ing courses linked to credit access sometimes assumethat entrepreneurs cannot contribute their own equityand that credit should be arranged for 100 percent ofthe investment.Most MFIs prefer to focus on existing businesses,
with perhaps a small portion of their portfolio investedin start-up businesses, thereby reducing their risk. Thisis again dependent on their objectives and the trade-offbetween increased costs (and lower loan sizes) for start-
up businesses, on the one hand, and sustainability, onthe other.
LEVEL OF BUSINESS DEVELOPMENT. The level of businessdevelopment is another consideration when identifying thetypes of microenterprise to which an MFI wishes to pro-vide financial services. This is closely linked with the levelof poverty existing in a potential target market. There aretypically three levels of business development of microen-terprises that benefit from access to financial services:
T H E T A R G E T M A R K E T A N D I M P A C T A N A L Y S I S 43
Box 2.6 The Association for the Development ofMicroenterprises’ Work with Existing Microenterprises
THE ASSOCIATION FOR THE DEVELOPMENT OF
Microenterprises (ADEMI) has developed an effectivelending methodology to meet the needs of low-incomeurban clients in the Dominican Republic. As of June1997 it had a network of 25 branches serving over16,300 clients. Its assets totaled RD606 million (US$43million) and its equity was RD242 million (US$17 mil-lion). ADEMI has served more than 40,000 small andmicro enterprises during the past 15 years and had adirect impact on the jobs of more than 200,000 ownersand employees of micro and small-scale enterprises.
Objectives. Job creation and delivery of sustainablefinancial services.
Target clients. Established microenterprises with atleast one year of experience and the potential to createnew jobs. Clients must be over 18 years old, show initia-tive, and have a minimum level of business aptitude toensure their success and growth.
Services. Loans for working capital or the acquisitionof equipment and machinery (fixed assets); and ADEMIMastercard; home improvement loans; and minimal sav-ings services. ADEMI does not make consumptionloans.
Method. Individual loans; no formal collateral,although ADEMI does encourage the use of guarantorsand will repossess equipment or seize other assets if aclient defaults. All borrowers must sign a legal contractand promissory note, stating their obligation to repayfunds at specified terms. Loan terms are on averagebetween 10 and 34 months; repayment is monthly; aver-age loan sizes vary from US$1,000 to US$10,000 formicroenterprises; interest rates range from 2.2 percent to3 percent a month.
Source: Benjamin and Ledgerwood 1998.
� Unstable survivors, with operators who have not foundother employment and tend to have very unstableenterprises for a limited time
� Stable survivors, with operators for whom themicroenterprise provides a modest but decent livingwhile rarely growing
� Growth enterprises, or businesses that have the poten-tial to grow and become genuinely dynamic smallenterprises.Unstable survivors comprise the group most diffi-
cult to provide financial services to in a sustainablefashion, because loan sizes tend to remain small andthe risk of business failure is high. Focusing on unsta-ble survivors as a target market can result in a greatdeal of time spent with the clients just to ensure thattheir businesses will survive and that they will contin-ue to be able to make loan payments. Some technicalassistance may also be required, resulting in furthertime and cost increases. Also, unstable survivors oftenneed credit for consumption-smoothing rather thanincome-generating activities. Depending on the objec-tives of the MFI, these stopgap loans may or may notbe appropriate.Generally, the debt capacity of unstable survivors does
not increase. Accordingly, the MFI is limited in itsattempts to reduce costs or increase revenue, becauseloan sizes remain small. While not all MFIs have theimmediate goal of reaching financial self-sufficiency, overthe long term the choice to focus on unstable survivorswill likely be a time-bound strategy, because access todonor funding may be limited.
Stable survivors comprise the group that many MFIsfocus on and for which access to a permanent credit sup-ply is vital. This is the group that benefits from access tofinancial services to meet both production and consump-tion needs, while not necessarily requiring other inputsfrom the MFI.Stable survivors are targeted by microfinance providers
with poverty reduction objectives. For these businesses,returns on labor are relatively low, and market imperfec-tions and near monopsony conditions may result inuneven bargaining positions. Stable survivors are oftenwomen who simultaneously maintain family-relatedactivities (providing food, water, cooking, medicine, andchild care) while engaging in income-generating activities.Seasonal changes and household life cycles often forcesuch people to consume rather than invest in the business.
Generally, profits are low, leading to low reinvestment,low output, and a high level of vulnerability. Profitsremain low due to:� The unspecialized nature of the product� The lack of timely and complete market information(beyond the local market)
� Underdeveloped infrastructure facilities� The lack of value-added services (such as packaging)� The number of producers with similar products.Experiences with this target group have demonstrat-
ed both advantages and disadvantages. Advantages mayinclude:� The high poverty impact of a financial services pro-ject, since these enterprises are run by poor house-holds
� High repayment, due to limited access to alternativesources of credit and the economic, social, andfinancial costs of those alternatives
� Effective savings services, since there are rarelysecure, liquid alternative forms of savings that offer areturn for the operators of these enterprises (theyalso help to smooth consumption for poor house-holds)
� A general willingness to work with new credit tech-nologies (such as groups) as an alternative to tangiblecollateral.Disadvantages may include:
� Little or no new job creation resulting from supportto these enterprises
� Limited growth potential or high covariance risk,because many entrepreneurs are active in the samebusinesses (financing them may create excess compe-tition, meaning that the loan portfolio has to growby increasing the number of clients rather thanincreasing loan amounts to good clients)
� Difficulty in mobilizing long-term savings, sincehouseholds are accustomed to seasonal savings build-up and liquidation cycles.Growth enterprises are often the focus of MFIs
whose objective is job creation and whose desire is tomove microentrepreneurs from the informal sector to aprogressively more formal environment. These MFIsoften establish linkages with the formal sector and pro-vide additional products and services. Growth enter-prises represent the upper end of the poverty scale:they usually pose the least risk to the MFI. While gen-erally a heterogeneous collection of enterprises, they
44 M I C R O F I N A N C E H A N D B O O K
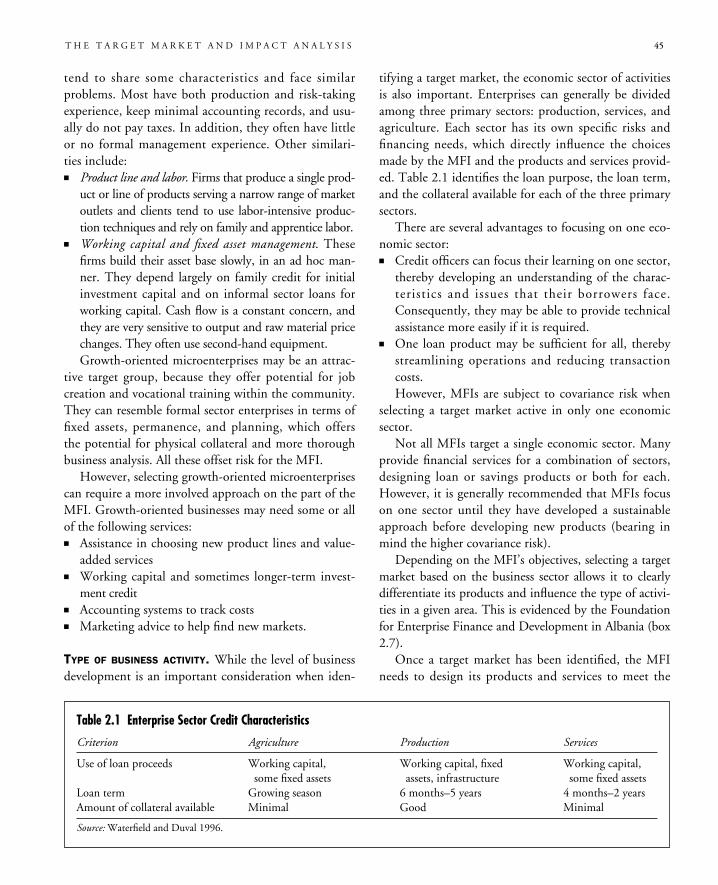
tend to share some characteristics and face similarproblems. Most have both production and risk-takingexperience, keep minimal accounting records, and usu-ally do not pay taxes. In addition, they often have littleor no formal management experience. Other similari-ties include:� Product line and labor. Firms that produce a single prod-
uct or line of products serving a narrow range of marketoutlets and clients tend to use labor-intensive produc-tion techniques and rely on family and apprentice labor.
� Working capital and fixed asset management. Thesefirms build their asset base slowly, in an ad hoc man-ner. They depend largely on family credit for initialinvestment capital and on informal sector loans forworking capital. Cash flow is a constant concern, andthey are very sensitive to output and raw material pricechanges. They often use second-hand equipment.Growth-oriented microenterprises may be an attrac-
tive target group, because they offer potential for jobcreation and vocational training within the community.They can resemble formal sector enterprises in terms offixed assets, permanence, and planning, which offersthe potential for physical collateral and more thoroughbusiness analysis. All these offset risk for the MFI.
However, selecting growth-oriented microenterprisescan require a more involved approach on the part of theMFI. Growth-oriented businesses may need some or allof the following services:� Assistance in choosing new product lines and value-
added services� Working capital and sometimes longer-term invest-
ment credit� Accounting systems to track costs� Marketing advice to help find new markets.
TYPE OF BUSINESS ACTIVITY. While the level of businessdevelopment is an important consideration when iden-
tifying a target market, the economic sector of activitiesis also important. Enterprises can generally be dividedamong three primary sectors: production, services, andagriculture. Each sector has its own specific risks andfinancing needs, which directly influence the choicesmade by the MFI and the products and services provid-ed. Table 2.1 identifies the loan purpose, the loan term,and the collateral available for each of the three primarysectors.
There are several advantages to focusing on one eco-nomic sector:� Credit officers can focus their learning on one sector,
thereby developing an understanding of the charac-teristics and issues that their borrowers face.Consequently, they may be able to provide technicalassistance more easily if it is required.
� One loan product may be sufficient for all, therebystreamlining operations and reducing transactioncosts.However, MFIs are subject to covariance risk when
selecting a target market active in only one economicsector.
Not all MFIs target a single economic sector. Manyprovide financial services for a combination of sectors,designing loan or savings products or both for each.However, it is generally recommended that MFIs focuson one sector until they have developed a sustainableapproach before developing new products (bearing inmind the higher covariance risk).
Depending on the MFI’s objectives, selecting a targetmarket based on the business sector allows it to clearlydifferentiate its products and influence the type of activi-ties in a given area. This is evidenced by the Foundationfor Enterprise Finance and Development in Albania (box2.7).
Once a target market has been identified, the MFIneeds to design its products and services to meet the
T H E T A R G E T M A R K E T A N D I M P A C T A N A L Y S I S 45
Table 2.1 Enterprise Sector Credit Characteristics
Criterion Agriculture Production Services
Use of loan proceeds Working capital, Working capital, fixed Working capital,some fixed assets assets, infrastructure some fixed assets
Loan term Growing season 6 months–5 years 4 months–2 yearsAmount of collateral available Minimal Good Minimal
Source: Waterfield and Duval 1996.
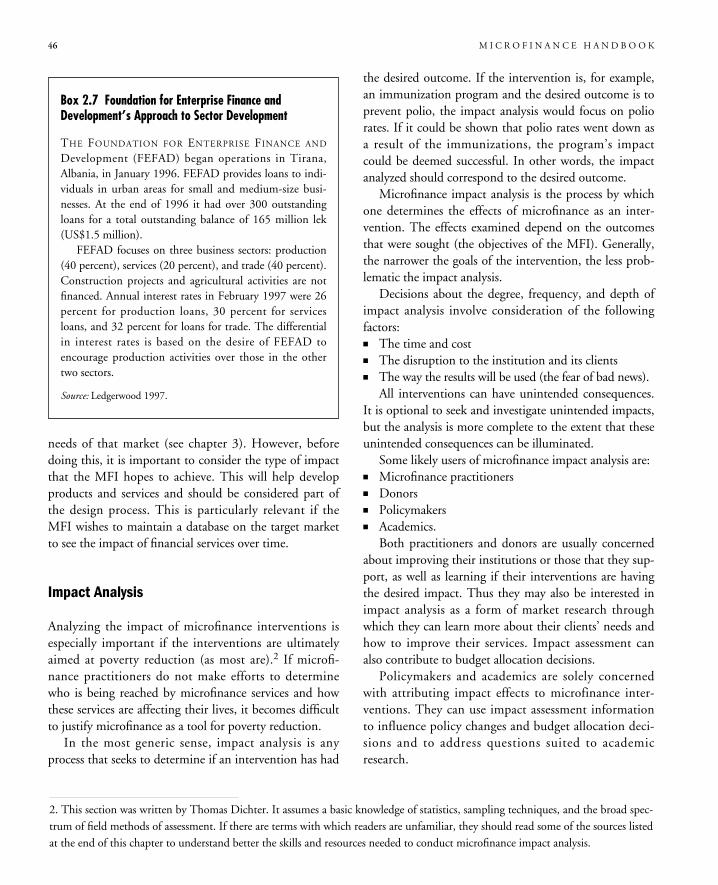
needs of that market (see chapter 3). However, beforedoing this, it is important to consider the type of impactthat the MFI hopes to achieve. This will help developproducts and services and should be considered part ofthe design process. This is particularly relevant if theMFI wishes to maintain a database on the target marketto see the impact of financial services over time.
Impact Analysis
Analyzing the impact of microfinance interventions isespecially important if the interventions are ultimatelyaimed at poverty reduction (as most are).2 If microfi-nance practitioners do not make efforts to determinewho is being reached by microfinance services and howthese services are affecting their lives, it becomes difficultto justify microfinance as a tool for poverty reduction.In the most generic sense, impact analysis is any
process that seeks to determine if an intervention has had
the desired outcome. If the intervention is, for example,an immunization program and the desired outcome is toprevent polio, the impact analysis would focus on poliorates. If it could be shown that polio rates went down asa result of the immunizations, the program’s impactcould be deemed successful. In other words, the impactanalyzed should correspond to the desired outcome.Microfinance impact analysis is the process by which
one determines the effects of microfinance as an inter-vention. The effects examined depend on the outcomesthat were sought (the objectives of the MFI). Generally,the narrower the goals of the intervention, the less prob-lematic the impact analysis.Decisions about the degree, frequency, and depth of
impact analysis involve consideration of the followingfactors:� The time and cost� The disruption to the institution and its clients� The way the results will be used (the fear of bad news).All interventions can have unintended consequences.
It is optional to seek and investigate unintended impacts,but the analysis is more complete to the extent that theseunintended consequences can be illuminated.Some likely users of microfinance impact analysis are:
� Microfinance practitioners� Donors� Policymakers� Academics.Both practitioners and donors are usually concerned
about improving their institutions or those that they sup-port, as well as learning if their interventions are havingthe desired impact. Thus they may also be interested inimpact analysis as a form of market research throughwhich they can learn more about their clients’ needs andhow to improve their services. Impact assessment canalso contribute to budget allocation decisions.Policymakers and academics are solely concerned
with attributing impact effects to microfinance inter-ventions. They can use impact assessment informationto influence policy changes and budget allocation deci-sions and to address questions suited to academicresearch.
46 M I C R O F I N A N C E H A N D B O O K
Box 2.7 Foundation for Enterprise Finance andDevelopment’s Approach to Sector Development
THE FOUNDATION FOR ENTERPRISE FINANCE ANDDevelopment (FEFAD) began operations in Tirana,Albania, in January 1996. FEFAD provides loans to indi-viduals in urban areas for small and medium-size busi-nesses. At the end of 1996 it had over 300 outstandingloans for a total outstanding balance of 165 million lek(US$1.5 million).FEFAD focuses on three business sectors: production
(40 percent), services (20 percent), and trade (40 percent).Construction projects and agricultural activities are notfinanced. Annual interest rates in February 1997 were 26percent for production loans, 30 percent for servicesloans, and 32 percent for loans for trade. The differentialin interest rates is based on the desire of FEFAD toencourage production activities over those in the othertwo sectors.
Source: Ledgerwood 1997.
2. This section was written by Thomas Dichter. It assumes a basic knowledge of statistics, sampling techniques, and the broad spec-trum of field methods of assessment. If there are terms with which readers are unfamiliar, they should read some of the sources listedat the end of this chapter to understand better the skills and resources needed to conduct microfinance impact analysis.
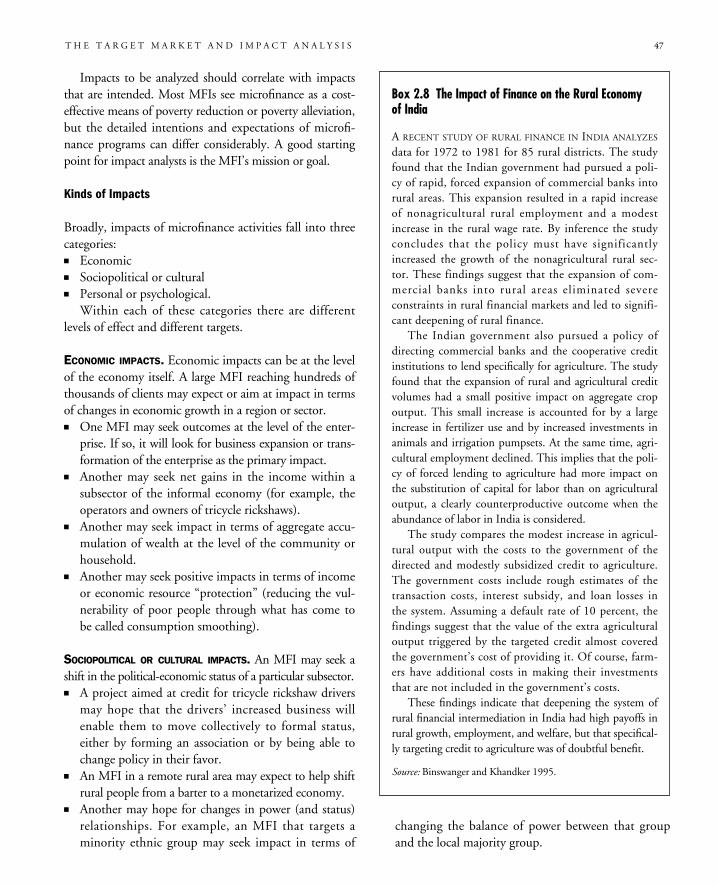
Impacts to be analyzed should correlate with impactsthat are intended. Most MFIs see microfinance as a cost-effective means of poverty reduction or poverty alleviation,but the detailed intentions and expectations of microfi-nance programs can differ considerably. A good startingpoint for impact analysts is the MFI’s mission or goal.
Kinds of Impacts
Broadly, impacts of microfinance activities fall into threecategories:� Economic� Sociopolitical or cultural� Personal or psychological.Within each of these categories there are different
levels of effect and different targets.
ECONOMIC IMPACTS. Economic impacts can be at the levelof the economy itself. A large MFI reaching hundreds ofthousands of clients may expect or aim at impact in termsof changes in economic growth in a region or sector.� One MFI may seek outcomes at the level of the enter-prise. If so, it will look for business expansion or trans-formation of the enterprise as the primary impact.
� Another may seek net gains in the income within asubsector of the informal economy (for example, theoperators and owners of tricycle rickshaws).
� Another may seek impact in terms of aggregate accu-mulation of wealth at the level of the community orhousehold.
� Another may seek positive impacts in terms of incomeor economic resource “protection” (reducing the vul-nerability of poor people through what has come tobe called consumption smoothing).
SOCIOPOLITICAL OR CULTURAL IMPACTS. An MFI may seek ashift in the political-economic status of a particular subsector.� A project aimed at credit for tricycle rickshaw driversmay hope that the drivers’ increased business willenable them to move collectively to formal status,either by forming an association or by being able tochange policy in their favor.
� An MFI in a remote rural area may expect to help shiftrural people from a barter to a monetarized economy.
� Another may hope for changes in power (and status)relationships. For example, an MFI that targets aminority ethnic group may seek impact in terms of
changing the balance of power between that groupand the local majority group.
T H E T A R G E T M A R K E T A N D I M P A C T A N A L Y S I S 47
Box 2.8 The Impact of Finance on the Rural Economyof India
A RECENT STUDY OF RURAL FINANCE IN INDIA ANALYZESdata for 1972 to 1981 for 85 rural districts. The studyfound that the Indian government had pursued a poli-cy of rapid, forced expansion of commercial banks intorural areas. This expansion resulted in a rapid increaseof nonagricultural rural employment and a modestincrease in the rural wage rate. By inference the studyconcludes that the policy must have significantlyincreased the growth of the nonagricultural rural sec-tor. These findings suggest that the expansion of com-mercial banks into rural areas eliminated severeconstraints in rural financial markets and led to signifi-cant deepening of rural finance.The Indian government also pursued a policy of
directing commercial banks and the cooperative creditinstitutions to lend specifically for agriculture. The studyfound that the expansion of rural and agricultural creditvolumes had a small positive impact on aggregate cropoutput. This small increase is accounted for by a largeincrease in fertilizer use and by increased investments inanimals and irrigation pumpsets. At the same time, agri-cultural employment declined. This implies that the poli-cy of forced lending to agriculture had more impact onthe substitution of capital for labor than on agriculturaloutput, a clearly counterproductive outcome when theabundance of labor in India is considered.The study compares the modest increase in agricul-
tural output with the costs to the government of thedirected and modestly subsidized credit to agriculture.The government costs include rough estimates of thetransaction costs, interest subsidy, and loan losses inthe system. Assuming a default rate of 10 percent, thefindings suggest that the value of the extra agriculturaloutput triggered by the targeted credit almost coveredthe government’s cost of providing it. Of course, farm-ers have additional costs in making their investmentsthat are not included in the government’s costs.These findings indicate that deepening the system of
rural financial intermediation in India had high payoffs inrural growth, employment, and welfare, but that specifical-ly targeting credit to agriculture was of doubtful benefit.
Source: Binswanger and Khandker 1995.
� Another may seek, as a primary impact, the redistrib-ution of assets (and power or decisionmaking) at thehousehold level (for example, shifting part of econom-ic decisionmaking from men to women).
� Another may seek changes in children’s nutrition oreducation as the result of a microfinance activityaimed at their mothers.
PERSONAL OR PSYCHOLOGICAL IMPACTS. Microfinance canhave impacts on the borrower’s sense of self.These impacts are the other half of empowerment
effects. The first half is in a sense political—peopleachieve more power in the household or community asthe result of financial services. The second half is internaland has to do with the person’s changed view of self.Such a change, if positive, can prepare the way for otherchanges. For example, a person who feels more confidentmay be willing to take new kinds of risks, such as startingor expanding a business.Of course, all three general impact categories (as well
as the different levels and targets) can shift in terms ofwhich are primary and which are secondary effects.Finally, an impact from one of these categories can initself cause an impact in one or more of the others.
What Kinds of Impacts Have We Seen withMicrofinance?
In the short history of microfinance impact analysis, wehave seen relatively little impact on a macro level.However, few MFIs aim for impacts at the level of theeconomy as a whole.With regard to impacts at the level of microenterpris-
es in the informal economy, the body of evidence sug-gests that microenterprise credit does not result insignificant net gains in employment, but it can and doeslead to increased use of family labor. We can state thatthere is as yet no solid evidence of business growth andtransformation as the result of microenterprise credit, butthere is evidence of credit enabling enterprises to survive(remain in business) in crises.The microfinance field has not yet amassed a large
body of well-researched impact analyses. In recent yearsthere have been reviews of existing impact studies, andthese as well as other research into the nature of povertyat the grassroots have begun to interact with the disci-pline of impact analysis. As a result, the questions have
begun to change. New empirical evidence makes it pos-sible to redirect some of the impact questions and withthem microfinance itself.Johnson and Rogaly (1997), for example, provide a
useful distinction between three sources of poverty:� Lack of income� Vulnerability to income fluctuations� Powerlessness (few choices and little control).Interventions can therefore promote income, pro-
tect income, or empower people. They point out thatmost MFIs, especially those run by NGOs, measure(or more often estimate) only the first of these. Thusthey look only at income changes as the result of cred-it (Johnson and Rogaly 1997) This is graduallychanging.
AT THE HOUSEHOLD LEVEL. While many MFIs stilldirect credit to preexisting informal sector microenter-prises, many others now direct credit specifically towomen who are engaged in what could be called anincome-generating activity rather than a business.These MFIs are less concerned about whether the cred-it is used for “business purposes.” A few MFIs alsoexplicitly lend for consumption and seek impacts at thehousehold level.Making households and the household economy the
targets of microfinance is increasing as research showshow important it is to reduce the economic insecurity ofpoor people, not by raising their income, but by “pro-tecting” what little they do have and reducing their vul-nerability (Corbett 1988).A recent review of research on impact discusses the
concept of the “household economic portfolio” as thesum total of human physical and financial resources,which is in a dynamic relationship to the sum total ofhousehold consumption, production, and investmentactivities (Dunn 1996). This very realistic approach tothe way in which credit is used by many poor borrowershelps us to understand that the categories of “borrowingfor production” and “borrowing for consumption” arenot always useful in practice.
AT THE INDIVIDUAL LEVEL. Similarly, as the household—seen as a tiny economy in itself—became a guiding con-cept in impact analysis, formal economic models ofhousehold decisionmaking have entered into economicthinking. For example, “the role of individual preferences,
48 M I C R O F I N A N C E H A N D B O O K
resources and bargaining power in intra-household deci-sion making” is now recognized as important (Chen andDunn 1996). Such concepts are coming into use as waysto map changes at both the household level (as a social andeconomic unit) and among the persons living in thehousehold. Thus, while the evidence of significant impactson health and nutrition are negligible and the results oneducation are mixed as a result of microfinance interven-tions, we are now able to see “empowerment” outcomesfor women that are significant. (It should be emphasizedthat we are referring to changes attributable to credit only.There are studies indicating that when credit services arecombined with health education or nutrition educationservices to groups, they do result in improvements tohealth, nutrition, and education.)
Impact Proxies
Doing impact analysis well (and therefore credibly) can bedifficult and expensive. Addressing this dilemma, there is aschool of thinking that advocates certain “proxies” forimpact. Otero and Rhyne have summarized recent micro-finance history by saying that there has been an importantshift from focusing on the individual firm or client offinancial services to focusing on the institutions providingservices. This financial systems approach “necessarily relax-es its attention to ‘impact’ in terms of measurable enter-prise growth and focuses instead on measures of increasedaccess to financial services” (Otero and Rhyne 1994).
Willingness to pay is sometimes viewed as a proxy forimpact. Essentially, this view derives from a market eco-nomics paradigm—the clients are customers; if the prod-uct or service is made available to them and they buy it,then there is value. Therefore, microfinance impactanalysis should concentrate on evidence of good outreachand evidence of willingness to pay.The rational for the willingness-to-pay test of impact
is that financial services usually require clients to pay thecost of acquiring the service in the form of interest pay-ments and fees as well as the transaction and opportunitycost of the time required to come to group meetings orto deal with other aspects of the loan process. If clientsuse the services (credit) repeatedly and, therefore, pay forthem repeatedly (and on time), it is evident that theyvalue the services more than the cost. One can surmise,therefore, that the client believes that the benefits(impact) of the service on their lives exceeds the cost.
High repayment rates and low arrears can be taken asprima facie evidence of willingness to pay. (This can alsobe applied to savings services; if people continue to uti-lize the savings services on an MFI, it can be assumedthat the service is valued.)But there are some caveats to this test. For example,
when a client uses a service only once (and drops out)or if the service is priced below its market value (forexample, through subsidized interest rates), it is unclearwhether this service would still be valued if the costwere raised to a sustainable amount. The willingness-to-pay test may also provide unclear results if a singleservice is linked to other services (such as nutrition edu-cation), if coercion is involved (as when a woman isforced by her husband to take out a loan), or if theintrahousehold effects are mixed (for example, a declinein girls’ school attendance due to increased labordemands at home).Thus while willingness to pay is a low-cost, simple
proxy for impact, the weaknesses are substantial andinclude the following considerations:� The magnitude of impact is hard to determine.� Intrahousehold effects are not captured.� Long-term development impact (poverty reduction) isunclear.Perhaps the biggest argument against market-deter-
mined proxies such as willingness to pay is that they pre-sume that microfinance is a product for the marketplacelike any other. If microfinance were merely a productthere would be little concern to look beyond willingnessto pay, just as the sellers of cigarettes construe their prof-its as sufficient evidence of the success of their product.Microfinance, however, is intended as a tool for povertyreduction, which is why many experts argue that analyz-ing its impact on poverty is an unavoidable task (seeHulme 1997, who states clearly that monitoring MFIperformance in not enough).
Client-Oriented Impact Analysis
The other school of thought about impact analysis consistsof those who believe that attempts must be made to assess,analyze, and measure direct impacts. Unfortunately, thedilemma of cost and the inherent difficulty of conductingsuch an analysis well have been persistent problems, whichhave led to a general avoidance of the task. Few MFIsinvest much in impact analysis, and the literature on
T H E T A R G E T M A R K E T A N D I M P A C T A N A L Y S I S 49
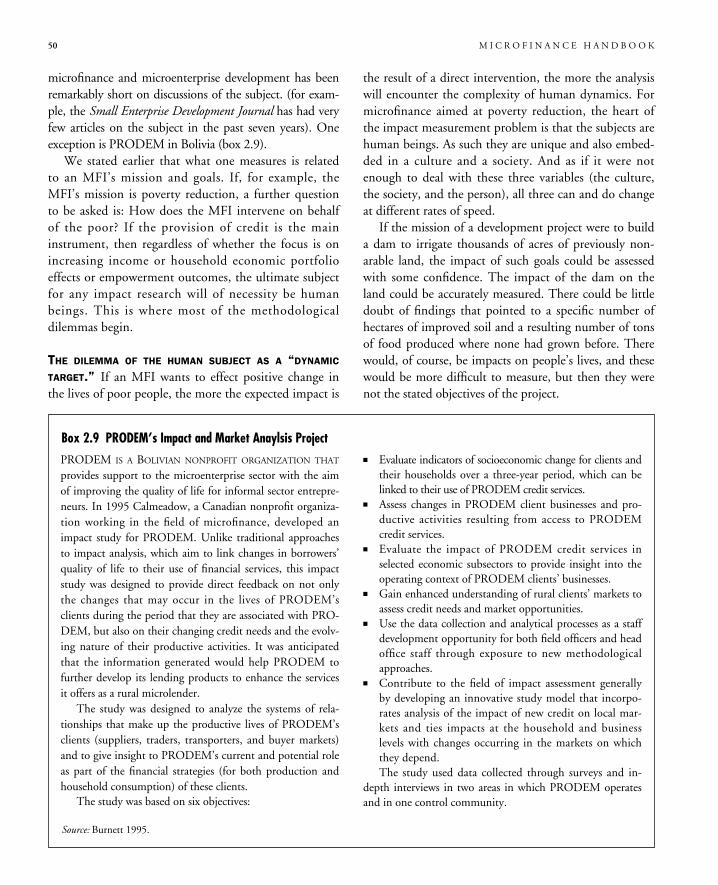
microfinance and microenterprise development has beenremarkably short on discussions of the subject. (for exam-ple, the Small Enterprise Development Journal has had veryfew articles on the subject in the past seven years). Oneexception is PRODEM in Bolivia (box 2.9).We stated earlier that what one measures is related
to an MFI’s mission and goals. If, for example, theMFI’s mission is poverty reduction, a further questionto be asked is: How does the MFI intervene on behalfof the poor? If the provision of credit is the maininstrument, then regardless of whether the focus is onincreasing income or household economic portfolioeffects or empowerment outcomes, the ultimate subjectfor any impact research will of necessity be humanbeings. This is where most of the methodologicaldilemmas begin.
THE DILEMMA OF THE HUMAN SUBJECT AS A “DYNAMIC
TARGET.” If an MFI wants to effect positive change inthe lives of poor people, the more the expected impact is
the result of a direct intervention, the more the analysiswill encounter the complexity of human dynamics. Formicrofinance aimed at poverty reduction, the heart ofthe impact measurement problem is that the subjects arehuman beings. As such they are unique and also embed-ded in a culture and a society. And as if it were notenough to deal with these three variables (the culture,the society, and the person), all three can and do changeat different rates of speed.If the mission of a development project were to build
a dam to irrigate thousands of acres of previously non-arable land, the impact of such goals could be assessedwith some confidence. The impact of the dam on theland could be accurately measured. There could be littledoubt of findings that pointed to a specific number ofhectares of improved soil and a resulting number of tonsof food produced where none had grown before. Therewould, of course, be impacts on people’s lives, and thesewould be more difficult to measure, but then they werenot the stated objectives of the project.
50 M I C R O F I N A N C E H A N D B O O K
PRODEM IS A BOLIVIAN NONPROFIT ORGANIZATION THAT
provides support to the microenterprise sector with the aimof improving the quality of life for informal sector entrepre-neurs. In 1995 Calmeadow, a Canadian nonprofit organiza-tion working in the field of microfinance, developed animpact study for PRODEM. Unlike traditional approachesto impact analysis, which aim to link changes in borrowers’quality of life to their use of financial services, this impactstudy was designed to provide direct feedback on not onlythe changes that may occur in the lives of PRODEM’sclients during the period that they are associated with PRO-DEM, but also on their changing credit needs and the evolv-ing nature of their productive activities. It was anticipatedthat the information generated would help PRODEM tofurther develop its lending products to enhance the servicesit offers as a rural microlender.The study was designed to analyze the systems of rela-
tionships that make up the productive lives of PRODEM’sclients (suppliers, traders, transporters, and buyer markets)and to give insight to PRODEM’s current and potential roleas part of the financial strategies (for both production andhousehold consumption) of these clients.The study was based on six objectives:
� Evaluate indicators of socioeconomic change for clients andtheir households over a three-year period, which can belinked to their use of PRODEM credit services.
� Assess changes in PRODEM client businesses and pro-ductive activities resulting from access to PRODEMcredit services.
� Evaluate the impact of PRODEM credit services inselected economic subsectors to provide insight into theoperating context of PRODEM clients’ businesses.
� Gain enhanced understanding of rural clients’ markets toassess credit needs and market opportunities.
� Use the data collection and analytical processes as a staffdevelopment opportunity for both field officers and headoffice staff through exposure to new methodologicalapproaches.
� Contribute to the field of impact assessment generallyby developing an innovative study model that incorpo-rates analysis of the impact of new credit on local mar-kets and ties impacts at the household and businesslevels with changes occurring in the markets on whichthey depend.The study used data collected through surveys and in-
depth interviews in two areas in which PRODEM operatesand in one control community.
Box 2.9 PRODEM’s Impact and Market Anaylsis Project
Source: Burnett 1995.
In the case of microfinance we see a similar dilemma,but with a difference. If an MFI aims at providing finan-cial services to the poor to reduce their poverty, then theinstitution cannot take refuge in simply measuring howwell it made services available (which is analogous to howwell the dam was constructed). Because the stated endresult—reducing poverty—is fully measurable only indirect relationship to the lives of human beings, the num-ber of possible effects, distortions, and permutations ofthose effects is, to put it mildly, far greater than in thecase when a project’s direct impact is intended to be anincrease in arable land as the result of building a dam.The dynamic interaction of individual humans, their
local society, and their culture can produce surprisingresults and can spoil a positive impact. Yaqub (1995)describes a group-based microcredit scheme operated byBRAC in Bangladesh. The scheme was deemed success-ful—as measured by increases in aggregate wealth of themembers. But it is precisely because of aggregate wealththat the nature of the relationships in the group and itsculture began to change. Because neither all persons inthe group nor their “life chances” are the same, somegradually became better off than others. As Yaqubshowed, some members with new wealth began to feelthat they had less to lose by ignoring group pressure torepay and thus became defaulters. This was a function ofthe new power of their wealth rather than their inabilityto repay. If the defaults caused by the successful use ofcredit resulted in the dissolution of the group and thesubsequent ineligibility of other members for futureloans, even their gains might be in jeopardy. Simply put,if the impact analysis story stopped at aggregate wealthaccumulation, it would miss a very important sequel.However, even before one gets to these unintended con-
sequences and feedback loop effects, there are other practi-cal problems involved in dealing with human subjects.
CLIENT TRANSPARENCY AND HONESTY. It is commonlyunderstood that money is fungible—that is, someonemay take a loan for the stated purpose of starting orfinancing a business and then put the loan proceeds intothe business, or they may use it to pay for their child’seducation or wedding and then use other householdincome to put into the business. If clients feel that theywill not receive another loan if they have not actuallyused the preceding loan for the stated purpose, they maynot accurately report the use of the loan.
In addition, there are many other reasons not toreport accurately, including:� Embarrassment� Fear of taxation� Not wanting others in the community to know� Wanting to impress the person asking the question� Wanting to please the person asking the question� A different way of calculating things than the ques-tionnaire—that is, the respondent genuinely may notknow the answers to the questions.
THE VESTED INTEREST OF THE ASSESSMENT TEAM. Thoseconducting the impact assessment may have an interest inthe outcome of the study and thus consciously or uncon-sciously may distort some responses. Anyone who is paidto do something may have a concern to please the agencypaying them, especially when they are being paid to con-duct an impact assessment for the agency whose project isbeing evaluated. Such an interest can be expressed uncon-sciously, even in the very design of the survey instrumentor the sample selection. At the level of data collection, it ispossible that enumerators, interviewers, or translators maysubtly avoid, ignore, or not notice data that may be offen-sive to the agency sponsoring the evaluation.
THE ATTRIBUTION DILEMMA. Attributing an incomechange to the credit taken by someone requires knowingin detail all the sources and uses of funds by the client(which in turn is related to the fungibility issue).Finding out the client’s sources and uses of funds ismade difficult by the challenge of respondent honestyand transparency as well as the fundamental fact thatthe livelihood strategies of most people, especially poorpeople, are complex, involving daily judgments about(and juggling of ) new opportunities and obstacles aswell as new costs and old obligations.Attribution further requires knowing all the other
events and influences that occurred while the creditintervention was undertaken and separating them fromthe specific impacts of the credit and savings program.There are other dynamic interactions that are func-
tions of microfinance itself. The use of one financial ser-vice can affect or influence the demand and usefulness ofothers. These, too, are difficult to trace.
HYPOTHETICAL IMPACTS IN THE ABSENCE OF SERVICES. Adifferent facet of the attribution dilemma is the difficulty
T H E T A R G E T M A R K E T A N D I M P A C T A N A L Y S I S 51
in determining how outcomes might have been differentif no intervention had been made. To determine thisrequires, at the least, the establishment of baselines andcontrol groups. These are tasks that are not only costlybut in some sense impossible to do perfectly, since it isextremely unlikely that one can find a sample of peoplewho are similar in every way to another sample of people,other than they did not receive a loan and others did.Moreover, estimating those similarities and conductingbaseline surveys is subject to the same kinds of reportingerrors as we have already noted. Still, one can get a senseof what might have happened in the absence of the ser-vices by looking at how many other financing optionsexist, how accessible they are to the same clientele, andhow attractively they are priced (including pricing thesocial transaction costs).Similar to the question of what would have happened
if the loan had not been made, one must also considerwhat other options for interventions were available andwhat resources could have been used for interventions,other than the provision of financial services.
TEMPORARY IMPACTS. An additional dilemma is the ques-tion of the ultimate value of the finding. Assume thatone finds that an intervention was or appeared to be suc-cessful in raising people’s incomes or reducing their pow-erlessness. Have they moved across the poverty line?Have the local structures in which their lives have beenembedded in the past altered in significant ways? Inshort, how lasting are the changes? It is empirically evi-dent that small changes can be undone very quickly.Small incremental moves upward in income or nutritionlevels or changes in power relationships within the familycan be reduced or wiped out by other reactions andforces, some of which are environmental, macroeconom-ic (even related to world trade), or political.The usefulness of a loan obviously depends on circum-
stances, which can change. If, for example, poor womentake loans repeatedly through several cycles, this simply saysthat they have been able to find ways to ensure repayment.Especially in cases where women do not have regular anddirect access to income, field studies have shown that theyborrow money from others in the family, take from remit-tance income, or even take from their own stocks of foodto repay the loan. There are highly variable reasons whythey may make an effort that can appear to be a sign ofhow much they value the service. They may borrow
because the loan comes at a time of particular need, becausesomeone else has asked them to take the loan on his or herbehalf, because they fear loss of face in their group, becausethey are hedging their bets in the belief that they may get alarger loan in the future, or even because they are countingon being able to default later on (when loan follow-upeventually slacked off), based on experience with past creditinterventions. In the case research for the SustainableBanking with the Poor project, dropout rates have beenincreasing, particularly among target groups in which theprospects for sustained income growth are not promising.
When Should Impact Be Assessed?
The question of when to conduct an impact assessmentis not just a practical matter of cost and methodologicaladvantage. As with the other aspects of impact, this ques-tion also relates to each MFI’s mission and purpose.
IMPACT ASSESSMENT BEFORE INTERVENTION. If the missioncontains an absolute commitment to reach directly thepoorest segment of the population (as is the case for Creditand Savings for the Hard-core Poor Network (CASH-POR) in the Philippines) then conducting a baselineimpact assessment prior to the initiation of financial ser-vices is essential to finding out who is going to be the mainbeneficiary of the loans in terms of relative wealth. Thisdoes not have to be expensive. In many villages in Asia, forexample, the material used in people’s roofs can be a reli-able indicator of relative poverty. CASHPOR thereforeadvocates a house index based simply on comparativemeasurements of the three dimensions of the house andnotation of the roof material (Gibbons 1997b).
IMPACT ASSESSMENT AFTER INTERVENTION. The conven-tional approach to impact assessment and analysis is toconduct the research after the MFI has been operating fora set period of time, such as three years (a period oftenimposed by donors). In this approach there are oftenthree phases: first, a baseline study establishing some con-trols at the beginning of the MFI’s operations, then aninterim or midterm impact assessment, followed 18months or 2 years later by the final assessment.Increasingly, this approach is being viewed as inadequate.
IMPACT ASSESSMENT DURING INTERVENTION. Those whoare most concerned with human and social dynamics and
52 M I C R O F I N A N C E H A N D B O O K
the methodological problems they present recommendthat impact assessment be done on a continuous basisand that someone from the MFI remain involved with arepresentative cross section of clients over time. This iscoming to be called “impact monitoring.” Obviously,this approach will likely involve keeping someone on theMFI staff full-time for this purpose.
Methods of Impact Assessment
In assessing the reviews of microfinance impact studies con-ducted in recent years (for example, Gaile and Foster 1996)and recalling the dilemmas outlined above, it is tempting toconclude that the number of problems unearthed is sogreat that the prospects of overcoming them are slim.However, the opposite seems to be the case. The consensusseems to be that multiple methods (as opposed to a singlemethod) must be used and that combining qualitative andquantitative approaches may be the only way to overcomethese dilemmas (Hulme 1995; Carvalho andWhite 1997).The growing literature on microfinance impact assess-
ment is replete with details on the pitfalls of variousapproaches. For example, Gaile and Foster reviewed 11studies and concluded that “some form of quasi experi-mental design is appropriate” along with multivariate sta-tistical analysis. Their recommendations include anoverall sample size of about 500, “which should allow foreffective use of control variables and for dealing withproblems associated with longitudinal analysis; longitudi-nal studies should have an interval of 18 to 24 monthsbetween data collection rounds.” At the same time, theirreview concluded that “none of the reviewed studies suc-cessfully controlled for the fungibility of resourcesbetween household and enterprise.”They recommend that control methods include:
� “Statistically equated control methods,” which theyfeel are sufficient to address most control issues
� Gender, which is a critical control variable� Continued efforts to control for fungibility� Control methods that are a function of the data avail-able.Among other lacunae in the studies they reviewed
were:� Minimal consideration as to the location of the MFI,which is a major determinant of success.
� Too little attention to alternative methodologies, suchas qualitative methods and counterfactual analysis
� Scant notice to questionnaire concerns, such as surveyfatigue and the need for back translation.
� Infrequent inclusion of issues, such as politics,favoritism, corruption, accountability, and leakages, aspart of the design.Measuring asset accumulation at the household level is
an approach that is also increasingly recommended as afocus of impact study, especially as a way to get aroundthe inherent difficulties in measuring income changesaccurately.Barnes (1996) identifies six approaches to measuring
assets in the microenterprise literature:� Attaching a current monetary value to assets and lia-bilities
� Specifying whether or not a specific asset is held,which may be used to discuss the structure of theholding or other qualitative dimensions
� Computing the flow value from productive assets� Ranking assets based on their assumed monetaryvalue of other qualities
� Constructing an index that is a composite of measures� Determining the meaning of the assets to the ownersand the social effects of the assets.Barnes also notes that the biggest quantitative prob-
lem with respect to asset accumulation involves depreci-ating and valuing physical assets.It is because these pitfalls are unavoidable that there is
a convergence of opinion that a mix of methods needs tobe used. The basics of both quantitative and qualitativemethods are reviewed briefly below.
Fundamental Characteristics of Qualitative Approaches
The most commonly prescribed alternatives to quantita-tive instruments and measures of impact fall within thefields of sociology and anthropology. The most recentapproach is the rubric of participant observation, whichis the classic mode of anthropological fieldwork.Participant observation is not so much a single methodas a combination of methods and techniques used to dealwith the problems posed by the complexity of socialorganizations. (As noted above, lone humans are com-plex enough, and in reality humans are almost neveralone. They are always part of a social unit, with levelsof complexity all the greater.) As one textbook on thesubject of participant observation puts it, “this blend oftechniques …involves some amount of genuine social
T H E T A R G E T M A R K E T A N D I M P A C T A N A L Y S I S 53

interaction in the field with the subjects of the study,some direct observation of relevant events, some formaland a great deal of informal interviewing, some systemat-ic counting... and open-endedness in the directions thestudy takes.” (McCall and Simmons 1969).The important general characteristics of such
approaches usually include the following:� Intensivity (a continuous or regular presence amongclients over time). This enables the researcher to deepenhis or her understanding of what is going on and inturn enables trust to develop on the part of the respon-dent. Naturally, one cannot be present among peopleover time without social interaction—hence the word“participant” in the term “participant observation.”
� Structured observation. Observation is not as passive afunction as it might seem. The researcher studyingmicrofinance impacts has in mind some hypothesesabout indicators and will naturally pay close attentionto them. They are thus part of a structured observa-tion plan. The actual activity in the field may includeformal interviewing, using a questionnaire or inter-view guide. The observation part comes into play as aform of research control. As a simple example, in ask-ing about household assets a respondent may mentionhaving recently purchased a radio or mirror. If theinterview takes place in the respondent’s home, thetrained (observant) interviewer will look around to seeif the radio or mirror is in sight. If it is not, the inter-viewer may then ask where it is.
� Triangulation. Triangulation involves checking datawith respondents and cross-checking with others toget different points of view of the same phenomenon.Careful use of triangulation helps to deal with theproblems of the inherently untrustworthy respondentand causality.
� Open-endedness. This is the characteristic that causessome methodological distress, because it implies thatthere may be no closure to the effort or that it has nomethodological rigor. In fact, the notion of open-end-edness is a response (again) to human dynamism andcomplexity. It is another way of saying that theimpact assessment process must be prepared to gowhere the data lead. Often findings or indications offindings are a surprise and may not fit a prior hypoth-esis. In many cases these findings, especially if notnumerically significant, are dismissed. In participantobservation the objective is to make use of such find-
ings by following their “tracks” as it were, to see whatsignificance they may have.Translated into the technique of “sampling” (the
process of selecting those with whom to interact), open-endedness means using what is called “nonprobability”sampling. This begins with common sense—ensuringdiversity by choosing a range of people in a range of situ-ations. But it also means being in position to take advan-tage of an accidental meeting with someone or to followa lead.
Rapid rural appraisal methods are derivative of classicsociological and anthropological approaches in that theyalso involve the use of semistructured interviews with keyinformants, participant observation, and the method-ological principles of triangulation and open-endedness.But rapid rural appraisal is more interactive and aims at ashorter duration. It also employs such new techniques as(Robert Chambers work in Carvalho and White 1997):� Focus groups with 5 to 12 participants from similarbackgrounds or situations (these may be observants orthe subjects under analysis)
� Social mapping and modeling drawn by participants(often on the ground) to indicate which institutionsand structures of their community are important intheir lives
� Seasonality maps or calendars on which communitiesshow how various phenomena in their lives vary overthe course of a year
� Daily time-use analysis� Participatory linkage diagramming showing chains ofcausality
� Venn diagrams showing the relative importance of dif-ferent institutions or individuals in the community
� Wealth ranking.
Fundamental Characteristics of QuantitativeApproaches
By definition quantitative approaches (the word “quantita-tive” derives from the Latin “quantus,” meaning “of whatsize”) involve quanta (units) or things that can be counted,including income, household expenditures, and wages.Because conclusions must be drawn from these numbers,the rules of statistics must be rigorously applied.Probability is one of the most important of these rules, andthus sampling (choosing which persons, households, orenterprises to survey) is extremely important and has to be
54 M I C R O F I N A N C E H A N D B O O K
done carefully to ensure that randomness is achieved (thatis, that every unit in the population to be studied has anequal chance of being selected). Probability theorydemands that the numbers of units to be studied be rela-tively large and widespread to have statistical validity.
Quantitative approaches to microfinance impacts relyon predesigned and pretested questionnaires. These areformal rather than unstructured, because the responsesmust be comparable and easy to count. Because surveyquestionnaires are structured and relatively fixed, littleinteractivity is likely between surveyor and respondent.As a result, survey questionnaires rely almost totally onrespondent recall. This may be unreliable if the eventsbeing recalled are far back in time.Because of the widespread coverage necessary, the cost
of designing, testing, and administering quantitativeapproaches is usually greater than that of qualitativeapproaches.The reason quantitative approaches have traditionally
been attractive to policymakers, however, derives fromthe notion that there is strength in numbers. Numbersoffer confidence and reliability precisely because they arepresumed to represent true measures. If the methodsused have been applied with rigor, the precision of theresults can be verified.Appendix 1 provides a matrix comparing some of the
major quantitative methods used in microfinance impactanalysis.In general, the available quantitative methods fall into
three categories:� Experimental methods� Quasi-experimental methods� Nonexperimental methods.
Experimental methods involve a natural or devised exper-iment in which some randomly chosen group is given the“treatment” or, in development terms, the “intervention”(here, microfinance services). The results are then com-pared to a randomly selected group of controls from whomthe treatment is withheld. The randomization guaranteesthat there are no differences—neither observable nor unob-servable—between the two groups. Consequently, in theo-ry, if there is a significant difference in outcomes, it canonly be the effect of the treatment. Although the role ofexperimental methods has been expanded in recent years,there are many cases in which such experiments are difficultor impossible because of the cost or the moral or politicalimplications (Deaton 1997, 92).
Quasi-experimental methods attempt to mimic theanalysis of controlled experiments, with treatment andcontrol groups created from different people. The differ-ences between the treatment and control groups may beobservable or unobservable due to their nonrandomselection.
Nonexperimental methods use nonexperimental (non-random) survey data to look at the differences in behav-ior between different people and relate the degree ofexposure to the treatment to variations in outcomes. Theabsence of a control group separates such methods fromquasi-experimental methods.
Econometrics is an analytical technique that appliesstatistical methods to economic problems. Econometrictechniques have been used extensively to analyze datagathered using quasi- and nonexperimental methods.Economists and econometricians have been studying sta-tistical methods for program evaluation for at least 25years (see Moffitt 1991, 291). During this time manyeconometric techniques have been developed to mitigatethe various problems associated with nonrandom dataselection. Some of the techniques available for perform-ing econometric analysis are described below, along withtheir advantages and disadvantages.Perhaps the most fundamental choice in an economet-
ric analysis is to select a model. Every analysis of an eco-nomic, social, or physical system is based on someunderlying logical structure, known as a model, whichdescribes the behavior of the agents in the system and isthe basic framework of analysis. In economics, as in thephysical sciences, this model is expressed in equationsdescribing the behavior of economic and related variables.The model that an investigator formulates might consist ofa single equation or a system involving several equations.In single-equation specification (regression analysis),
the analyst selects a single (dependent) variable (denoted asY ) whose behavior the researcher is interested in explain-ing. The investigator then identifies one or a number of(independent) variables (denoted by X ) that have causaleffects on the dependent variable. In some econometricstudies the investigator may be interested in more thanone dependent variable and hence will formulate severalequations at the same time. These are known as simultane-ous equation models (Ramanathan 1997, 6)To estimate the econometric model that a researcher
specifies, sample data on the dependent and independentvariables are needed (Hulme 1997, 1). Data are usually
T H E T A R G E T M A R K E T A N D I M P A C T A N A L Y S I S 55
drawn in one of two settings. A cross section is a sample ofa number of observational units all drawn at the samepoint in time. A time series is a set of observations drawnon the same observational unit at a number of (usuallyevenly spaced) points in time. Many recent studies havebeen based on time-series cross section, which generallyconsist of the same cross section observed at several pointsin time. Since the typical data set of this sort consists of alarge number of cross-sectional units observed at a fewpoints in time, the common term “panel data set” is morefitting for this type of study (Greene 1997, 102).
Comparisons of Quantitative and Qualitative Approaches
The major underlying difference between quantitative andqualitative approaches is their philosophical position on“reality.” The qualitative approach essentially says there aremultiple forms of reality and which “reality” is in playdepends on whose point of view one takes. Advocates ofthe qualitative approach say, for example, that povertycannot be defined only by the donor or project personnelbut must also be defined by the poor themselves, becausepoverty is more than simply lack of income. The quantita-tive approach essentially assumes that there is only onereality that can be counted. In the case of poverty, thequantitative approach would think it appropriate to haveexternal surveyors determine adequate poverty indicatorssuch as amount of income, assets, access to basic services,health, nutrition, potable water, and other measurablevariables, either by yes or no answers or actual counting.These basic differences have been summed up in the
commonly held notion that quantitative impact analysis ismore of a “science,” while qualitative approaches are moreof an “art” (Hulme 1997, 1).Whereas for data in quantitative methods the vari-
ables (for example, food expenditure) must be count-able, in qualitative methods only the responses toquestions or the number of times a phenomenon wasobserved can be counted, since the variables are atti-tudes, preferences, and priorities. As a result, whilequantitative approaches are not prone to errors involv-ing the representativeness of the sample, they are highlyprone to what is called “nonsampling error.” The oppo-site is the case with qualitative approaches.The processes by which both quantitative and qualitative
methods are implemented necessarily depends on fieldworkers, whether employed as enumerators, surveyors,
interviewers, participant observers, translators, or focusgroup facilitators. A large potential weakness in both quan-titative and qualitative methods is that the quality of thesepersonnel can vary greatly. Consequently, if impact analy-sis is to be done, those paying for it should invest up frontin high-quality field personnel. This implies carefulrecruiting, training, and supervision, as well as a sensibleremuneration policy.
Integrating Methodologies
“The key is to tap the breadth of the quantitativeapproach and the depth of the qualitative approach.The exact combination of qualitative and quantita-tive work will depend on the purpose of the studyand the available time, skills, and resources. In gen-eral, integrating methodologies can result in bettermeasurement; confirming, refuting, enriching, andexplaining can result in better analysis; and mergingthe quantitative and qualitative findings into one setof policy recommendations can lead to betteraction.” (Carvalho and White 1997)Carvalho and White (1997) recommend specific types
of integration such as:� Using the quantitative survey data to select qualitativesamples
� Using the quantitative survey to design the interviewguide for the qualitative work
� Using qualitative work to pretest the quantitative ques-tionnaire
� Using qualitative work to explain unanticipated resultsfrom quantitative data.
The Choice of Unit of Analysis
Regardless of the unit of analysis (the individual client, theenterprise, the household, or the community), it is impor-tant to investigate, get to know, and interview nonusers aswell as users of the financial service. Nonusers can be oftwo types: those who were and ceased to be users(dropouts) and those who were never users.
THE CLIENT AS A CLIENT. This unit of analysis focuses onthe individual client as a client of the microfinance ser-vices. The main purpose of such an analysis is for mar-ket research—to gather the clients’ perceptions of theservices so as to improve them. This has validity if con-
56 M I C R O F I N A N C E H A N D B O O K
cerns about outreach have come up or if there aredropouts.
THE CLIENT AS AN INDIVIDUAL. Both quantitative andqualitative methods can focus on the client as an indi-vidual (also called intrahousehold impact analysis whenit extends to members of the client’s household). Theadvantage of this level of investigation is that individualclients are easily defined and identified. They can be sur-veyed or interacted with in focus groups through inter-views or participant observation.Among the impacts to be sought at this level are
changes in income, allocation of income (to pay forgirls’ schooling, for example), changes in behavior (suchas willingness to take risks), changes in status or sense ofself, and so on.The disadvantages of focusing on the client as an
individual is that estimations of the magnitude ofimpact can be highly subjective and are likely to gobeyond the person or persons looked at. Thus itbecomes difficult to disaggregate the impacts on the pri-mary subjects and those that extend to others.
THE ENTERPRISE. Using the enterprise as the unit ofanalysis assumes that the goal of the MFI is largelyeconomic: a change in the overall prospects of theenterprise (growth, greater profits, increase in produc-tion, higher sales, acquisition of a productive asset,general increase in competitiveness, or some evidenceof business transformation, such as moving to a fixedlocation).The main methodological advantage of this unit of
analysis is the availability of well-understood analyticaltools, such as profitability and return on investment(Hulme 1997, 6). One disadvantage lies in defining theenterprise clearly enough for comparability with otherenterprises. Many microenterprises are survivalist activi-ties rather than businesses in the conventional sense.Thus the information needed for analysis will often belacking. The main disadvantage, however, is the prob-lem of fungibility: the fact that there is no sure way totell whether loan money has gone to benefit the enter-
prise or the household (especially when this distinctionis not clear to the entrepreneur).
THE SUBSECTOR. This unit and level of analysis is rarely ifever used in microfinance impact analysis. It is brought tothe reader’s attention to recall that the level of analysisdepends on the nature of the intervention and the intend-ed outcomes. It is possible that a microfinance program isdesigned to focus on one subsector of the economy. Thusbesides using the enterprises in that subsector (for exam-ple, all basket weavers) as units of analysis, the entire sub-sector would also be looked at in the aggregate. Indicatorscould include jobs created; aggregate output; changes insubcontracts with other subsectors; alleviating constraintsaffecting the whole subsector, such as input supply; andprice changes brought about by changes in the subsector.Needless to say, this level of analysis is highly research-oriented and requires significant time and resources.
THE HOUSEHOLD ECONOMIC PORTFOLIO. This approach looksat the household, the individual, his or her economicactivity, and the local society in which he or she is embed-ded and traces interactions among them. Such an analysisis difficult and costly and usually requires both a highdegree of technical specialization and a good knowledge oflocal contexts. It can involve living on site for a period oftime. The payoff, however, is that it provides a more com-prehensive picture of the impacts and the linkages betweendifferent parts of the whole.In summary, impact analysis is not easy or without real
costs. At a time in microfinance when institutional sustain-ability is an almost universal goal, finding ways to pay forimpact analysis poses serious challenges. However, thefuture of microfinance may be at stake as a deliberate toolfor poverty reduction. It is probably best if provisions forimpact analysis are made part of MFI activities from thebeginning and the subject is given the same priority asfinancial sustainability. Impact analysis, for all its difficul-ties—and they are daunting—can be done well. The cur-rent consensus seems to be that the first step is to take thetask seriously so that appropriate care and talent are devot-ed to carrying it out.
T H E T A R G E T M A R K E T A N D I M P A C T A N A L Y S I S 57
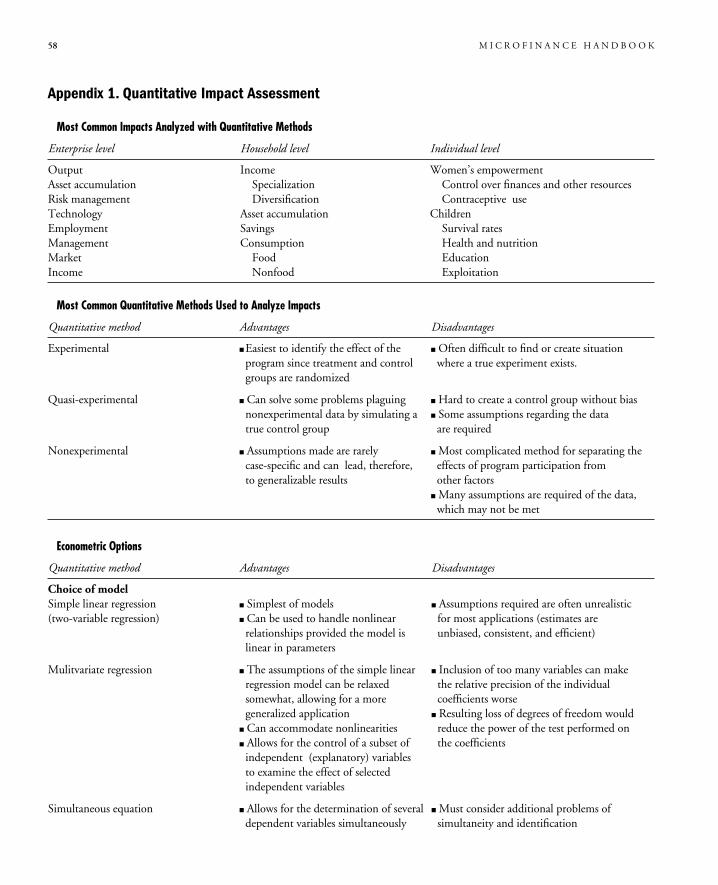
58 M I C R O F I N A N C E H A N D B O O K
Appendix 1. Quantitative Impact Assessment
Most Common Impacts Analyzed with Quantitative Methods
Enterprise level Household level Individual level
Output Income Women’s empowermentAsset accumulation Specialization Control over finances and other resourcesRisk management Diversification Contraceptive useTechnology Asset accumulation ChildrenEmployment Savings Survival ratesManagement Consumption Health and nutritionMarket Food EducationIncome Nonfood Exploitation
Most Common Quantitative Methods Used to Analyze Impacts
Quantitative method Advantages Disadvantages
Experimental �Easiest to identify the effect of the � Often difficult to find or create situationprogram since treatment and control where a true experiment exists.groups are randomized
Quasi-experimental � Can solve some problems plaguing � Hard to create a control group without biasnonexperimental data by simulating a � Some assumptions regarding the datatrue control group are required
Nonexperimental � Assumptions made are rarely � Most complicated method for separating thecase-specific and can lead, therefore, effects of program participation fromto generalizable results other factors
� Many assumptions are required of the data,which may not be met
Econometric Options
Quantitative method Advantages Disadvantages
Choice of modelSimple linear regression � Simplest of models � Assumptions required are often unrealistic(two-variable regression) � Can be used to handle nonlinear for most applications (estimates are
relationships provided the model is unbiased, consistent, and efficient)linear in parameters
Mulitvariate regression � The assumptions of the simple linear � Inclusion of too many variables can makeregression model can be relaxed the relative precision of the individualsomewhat, allowing for a more coefficients worsegeneralized application � Resulting loss of degrees of freedom would
� Can accommodate nonlinearities reduce the power of the test performed on� Allows for the control of a subset of the coefficientsindependent (explanatory) variablesto examine the effect of selectedindependent variables
Simultaneous equation � Allows for the determination of several � Must consider additional problems ofdependent variables simultaneously simultaneity and identification
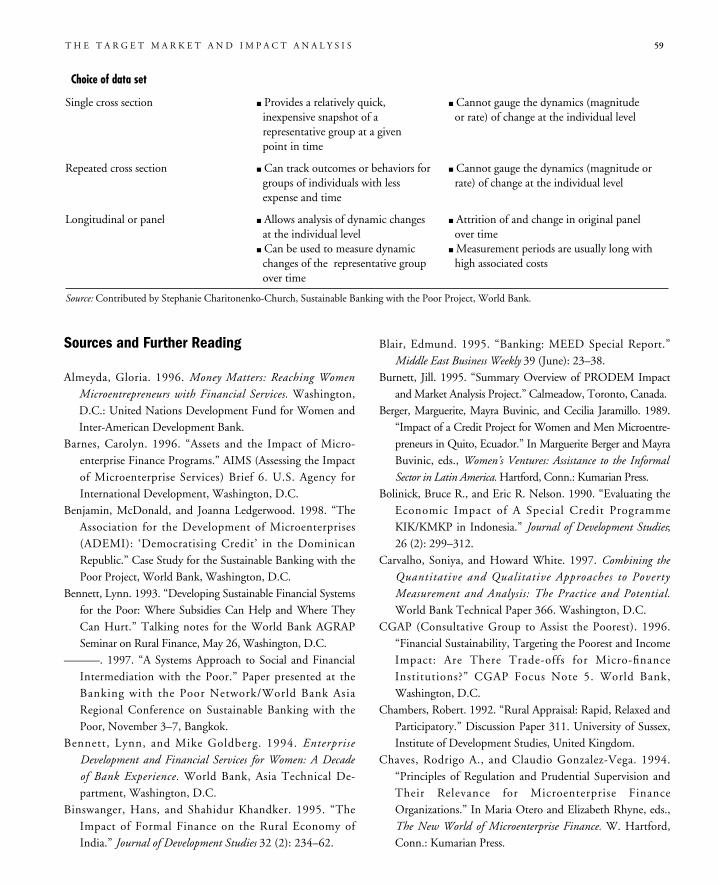
Sources and Further Reading
Almeyda, Gloria. 1996. Money Matters: Reaching WomenMicroentrepreneurs with Financial Services. Washington,D.C.: United Nations Development Fund for Women andInter-American Development Bank.
Barnes, Carolyn. 1996. “Assets and the Impact of Micro-enterprise Finance Programs.” AIMS (Assessing the Impactof Microenterprise Services) Brief 6. U.S. Agency forInternational Development, Washington, D.C.
Benjamin, McDonald, and Joanna Ledgerwood. 1998. “TheAssociation for the Development of Microenterprises(ADEMI): ‘Democratising Credit’ in the DominicanRepublic.” Case Study for the Sustainable Banking with thePoor Project, World Bank, Washington, D.C.
Bennett, Lynn. 1993. “Developing Sustainable Financial Systemsfor the Poor: Where Subsidies Can Help and Where TheyCan Hurt.” Talking notes for the World Bank AGRAPSeminar on Rural Finance, May 26, Washington, D.C.
———. 1997. “A Systems Approach to Social and FinancialIntermediation with the Poor.” Paper presented at theBanking with the Poor Network/World Bank AsiaRegional Conference on Sustainable Banking with thePoor, November 3–7, Bangkok.
Bennett, Lynn, and Mike Goldberg. 1994. EnterpriseDevelopment and Financial Services for Women: A Decadeof Bank Experience. World Bank, Asia Technical De-partment, Washington, D.C.
Binswanger, Hans, and Shahidur Khandker. 1995. “TheImpact of Formal Finance on the Rural Economy ofIndia.” Journal of Development Studies 32 (2): 234–62.
Blair, Edmund. 1995. “Banking: MEED Special Report.”Middle East Business Weekly 39 (June): 23–38.
Burnett, Jill. 1995. “Summary Overview of PRODEM Impactand Market Analysis Project.” Calmeadow, Toronto, Canada.
Berger, Marguerite, Mayra Buvinic, and Cecilia Jaramillo. 1989.“Impact of a Credit Project for Women and Men Microentre-preneurs in Quito, Ecuador.” In Marguerite Berger and MayraBuvinic, eds., Women’s Ventures: Assistance to the InformalSector in Latin America.Hartford, Conn.: Kumarian Press.
Bolinick, Bruce R., and Eric R. Nelson. 1990. “Evaluating theEconomic Impact of A Special Credit ProgrammeKIK/KMKP in Indonesia.” Journal of Development Studies;26 (2): 299–312.
Carvalho, Soniya, and Howard White. 1997. Combining theQuantitative and Qualitative Approaches to PovertyMeasurement and Analysis: The Practice and Potential.World Bank Technical Paper 366. Washington, D.C.
CGAP (Consultative Group to Assist the Poorest). 1996.“Financial Sustainability, Targeting the Poorest and IncomeImpact: Are There Trade-offs for Micro-financeInstitutions?” CGAP Focus Note 5. World Bank,Washington, D.C.
Chambers, Robert. 1992. “Rural Appraisal: Rapid, Relaxed andParticipatory.” Discussion Paper 311. University of Sussex,Institute of Development Studies, United Kingdom.
Chaves, Rodrigo A., and Claudio Gonzalez-Vega. 1994.“Principles of Regulation and Prudential Supervision andTheir Relevance for Microenterprise FinanceOrganizations.” In Maria Otero and Elizabeth Rhyne, eds.,The New World of Microenterprise Finance. W. Hartford,Conn.: Kumarian Press.
T H E T A R G E T M A R K E T A N D I M P A C T A N A L Y S I S 59
Choice of data set
Single cross section � Provides a relatively quick, � Cannot gauge the dynamics (magnitudeinexpensive snapshot of a or rate) of change at the individual levelrepresentative group at a givenpoint in time
Repeated cross section � Can track outcomes or behaviors for � Cannot gauge the dynamics (magnitude orgroups of individuals with less rate) of change at the individual levelexpense and time
Longitudinal or panel � Allows analysis of dynamic changes � Attrition of and change in original panelat the individual level over time
� Can be used to measure dynamic � Measurement periods are usually long withchanges of the representative group high associated costsover time
Source: Contributed by Stephanie Charitonenko-Church, Sustainable Banking with the Poor Project, World Bank.
Chen, Martha, and Elizabeth Dunn. 1996. “AIMS Brief 3.”U.S. Agency for International Development, Washington,D.C.
Christen, Robert Peck, Elisabeth Rhyne, Robert C. Vogel, andCressida McKean. 1995. Maximizing the Outreach ofMicroenterprise Finance: An Analysis of Successful Micro-finance Programs. Program and Operations AssessmentReport 10. Washington, D.C.: U.S. Agency for Inter-national Development.
Corbett, Jane. 1988. “Famine and Household CopingStrategies.”World Development 16 (9): 1099–112.
Deaton, A. 1997. The Analysis of Household Surveys: AMicroeconomic Approach to Development Policy. Baltimore,Md.: The Johns Hopkins University Press.
Downing, Jeanne, and Lisa Daniels. 1992. “Growth andDynamics of Women Entrepreneurs in Southern Africa.”GEMINI Technical Paper 47. U.S. Agency forInternational Development, Washington, D.C.
Dunn, Elizabeth. 1996. “Households, Microenterprises, andDebt.” AIMS Brief 5. U.S. Agency for InternationalDevelopment, Washington, D.C.
Gaile, Gary L., and Jennifer Foster. 1996. “Review ofMethodological Approaches to the Study of the Impact ofMicroenterprise Credit Programs.” AIMS (Assessing theImpact of Microenterprise Services project) paper,Management Systems International, Washington, D.C.
Garson, José. 1996. “Microfinance and Anti-PovertyStrategies. A Donor Perspective.” United NationsCapital Development Fund Working Paper. UNDCF,New York.
Gibbons, David. 1997a. “Targeting the Poorest and CoveringCosts.” Paper presented at the Microcredit Summit,February 3, Washington, D.C.
———. 1997b. Remarks made at the Microcredit Summit,February, Washington, D.C.
Goetz, Anne Marie, and Rina Sen Gupta. 1993. “Who TakesCredit? Gender, Power, and Control over Loan Use inRural Credit Programmes in Bangladesh.” Institute ofDevelopment Studies, University of Sussex, and BangladeshInstitute of Development Studies, Dhaka.
Goldberg, Mike. 1992. Enterprise Development Services forWomen Clients. Population and Human Resources,Women in Development. Washington, D.C.: World Bank.
Greene, W.H. 1997. Econometric Analysis. Upper Saddle River,N.J.: Prentice Hall.
Hulme, David. 1995. “Finance for the Poor, Poorer, orPoorest? Financial Innovation, Poverty, and Vulner-
ability.” Paper presented at the Finance against PovertySeminar, March 27, Reading University, UnitedKingdom.
———. 1997. “Impact Assessment Methodologies forMicrofinance: A Review.” Paper prepared for the CGAPWorking Group on Impact Assessment Methodologies,Washington, D.C.
Hulme, David, and Paul Mosley. 1996. Finance AgainstPoverty. London: Routledge.
Johnson, Susan, and Ben Rogaly. 1997. Microfinance andPoverty Reduction. London: Oxfam and ActionAid.
Khayatt, Djenan. 1996. Private Sector Development.Washington, D.C.: World Bank.
Lapar, Ma. Lucila A., Douglas H. Graham, Richard L. Meyer,and David S. Kraybill. 1995. “Selectivity Bias inEstimating the Effect of Credit on Output: The Case ofRural Non-farm Enterprises in the Philippines.” OhioState University, Department of Agricultural Economicsand Rural Sociology, Columbus, Ohio.
Lawai, Hussain. 1994. “Key Features of Islamic Banking.”Journal of Islamic Banking 11 (4): 7–13.
Ledgerwood, Joanna. 1997. “Albanian Development Fund.”Case Study for the Sustainable Banking with the PoorProject. World Bank, Washington, D.C.
Liedhom, Carl, and Donald C. Mead. 1987. “Small ScaleIndustries in Developing Countries: Empirical Evidenceand Policy Implications.” International DevelopmentPaper 9. Michigan State University, East Lansing, Mich.
Mahajan, Vijay, and Bharti Gupta Ramola. 1996. “FinancialServices for the Rural Poor and Women in India: Accessand Sustainability.” Journal of International Development 8(2): 211–24.
Malhotra, Mohini. 1992. “Poverty Lending and Micro-enterprise Development: A Clarification of the Issues.”GEMINI Working Paper 30. U.S. Agency for Inter-national Development, Washington, D.C.
McCall, George J., and J.L. Simmons. 1969. Issues inParticipant Observation. Reading, Mass.: Addison-Wesley.
McCracken, Jennifer A., Jules N. Pretty, and Gordon R.Conway. 1988. An Introduction to Rapid Rural Appraisal forAgricultural Development. London, U.K.: InternationalInstitute for Environment and Development, SustainableAgriculture Programme.
Moffit, R. 1991. “Program Evaluation with NonexperimentalData.” Evaluation Review 15 (3): 291–314.
Naponen, Helzi. 1990. “Loans to the Working Poor: ALongitudinal Study of Credit, Gender, and the Household
60 M I C R O F I N A N C E H A N D B O O K
Economy.” PRIE Center for Urban Policy Research,Rutgers University, New Brunswick, N.J.
O’Sullivan, Edmund. 1994. “Islamic Banking: MEED SpecialReport.”Middle East Business Weekly 38 (August): 7–13.
Otero, Maria, and Rhyne, Elizabeth, eds. 1994. The NewWorld of Microenterprise Finance. West Hartford, Conn.:Kumarian Press.
Parker, Joan, and C. Aleke Dondo. 1995. “Kenya: Kibera’sSmall Enterprise Sector—Baseline Survey Report.” GEMI-NI Working Paper 17. U.S. Agency for InternationalDevelopment, Washington, D.C.
Paxton, Julia. 1996. “Worldwide Inventory of MicrofinanceInstitutions.” Sustainable Banking with the Poor Project,World Bank, Washington, D.C.
Pederson, Glen D. 1997. “The State of the Art inMicrofinance. A Summary of Theory and Practice.”Sustainable Banking with the Poor Project, World Bank,Washington, D.C.
Pitt, Mark, and Shahidur R. Khandker. 1996. Household andIntrahousehold Impact of the Grameen Bank and SimilarTargeted Credit Programs in Bangladesh. World BankDiscussion Paper 320. Washington, D.C.
Putnam, Robert D., with Robert Leonardi, and Raffaella Y.Nanetti. 1993. Making Democracy Work: Civic Traditionsin Modern Italy. Princeton, N.J.: Princeton UniversityPress.
Ramanathan, R. 1997. Introductory Econometrics withApplications. Baltimore, Md.: Academic Press.
Rhyne, Elisabeth, and Sharon Holt. 1994. “Women in Financeand Enterprise Development.” ESP Discussion Paper 40.World Bank, Washington, D.C.
Schuler, Sidney Ruth, and Syed M. Hashemi. 1994. “CreditPrograms, Women’s Empowerment and Contraceptive Usein Rural Bangladesh.” Studies in Family Planning 25 (2):65–76.
Sebstad, Jennifer, Catherine Neill, Carolyn Barnes, withGregory Chen. 1995. “Assessing the Impacts ofMicroenterprise Interventions: A Framework for Analysis.”Managing for Results Working Paper 7. U.S. Agency forInternational Development, Office of MicroenterpriseDevelopment, Washington, D.C.
Sharif bin Fazil, Muhammad. 1993. “Financial InstrumentsConforming to Shariah.” Journal of Islamic Banking 10(4): 7–20.
Von Pischke, J.D. 1991. Finance at the Frontier. World Bank,Economic Development Institute. Washington, D.C.
Waterfield, Charles, and Ann Duval. 1996. CARE Savings andCredit Sourcebook. Atlanta, Ga: CARE.
Webster, Leila, Randall Riopelle, and Anne-Marie Chidzero.1996. World Bank Lending for Small Enterprises,1989–1993. World Bank Technical Paper 311.Washington, D.C.
Weidemann, Jean. 1993. “Financial Services for Women.”GEMINI Technical Note 3. U.S. Agency for InternationalDevelopment, Washington, D.C.
Yaqub, S. 1995. “Empowered to Default? Evidence fromBRAC’s Microcredit Programmes.” Journal of SmallEnterprise Development 6 (4) December.
Yaron, Jacob, McDonald P. Benjamin, Jr., and Gerda L.Piprek 1997. “Rural Finance: Issues, Design, and BestPractices.” Environmentally and Socially SustainableDevelopment Studies and Monographs Series 14. WorldBank, Rural Development Department. Washington, D.C.
T H E T A R G E T M A R K E T A N D I M P A C T A N A L Y S I S 61

63
Products and Services
C H A P T E R T H R E E
In chapter 1 we examined various contextualfactors that affect the supply of financial servicesto low-income women and men. In chapter 2 we
looked at the objectives of MFIs and ways to identify atarget market and assess impacts. In this chapter welook at the range of products and services that an MFImight offer, taking into account the supply anddemand analysis outlined in the previous two chapters.MFIs can offer their clients a variety of products
and services. First and foremost are financial services.However, due to the nature of an MFI’s target cli-ents—poor women and men without tangible assets,who often live in remote areas and may be illiterate—MFIs cannot operate like most formal financial insti-tutions. Formal financial institutions do not generallyregard the tiny informal businesses run by the poor asattractive investments. The loan amounts the business-es require are too small, and it is too difficult to obtaininformation from the clients (who may communicatein local dialects that the lender does not know). Theclients are also often too far away, and it takes too longto visit their farms or businesses, especially if they arelocated in the urban slum. All of this means that thecosts per dollar lent will be very high. And on top ofthat, there is no tangible security for the loan (Bennett1994).This means that low-income men and women face
formidable barriers in gaining access to mainstreamfinancial service institutions. Ordinary financial inter-mediation is not usually enough to help them partici-pate, and therefore MFIs have to create mechanisms tobridge the gaps created by poverty, illiteracy, gender,and remoteness. Local institutions must be built andnurtured, and the skills and confidence of new clients
must be developed. In many cases clients also needspecific production and business management skills aswell as better access to markets if they are to makeprofitable use of the financial services they receive(Bennett 1994).Providing effective financial services to low-income
women and men therefore often requires social interme-diation—”the process of creating social capital as a sup-port to sustainable financial intermediation with poorand disadvantaged groups or individuals” (Bennett1997). Most MFIs provide some form of social interme-diation, particularly if they work with groups. In somecases social intermediation is carried out by other orga-nizations working with MFIs.In addition, some MFIs provide enterprise develop-
ment services such as skills training and basic businesstraining (including bookkeeping, marketing, and pro-duction) or social services such as health care, education,and literacy training. These services can improve theability of low-income men and women to operatemicroenterprises either directly or indirectly.Deciding which services to offer depends on the
MFI’s objectives, the demands of the target market, theexistence of other service providers, and an accurate cal-culation of the costs and feasibility of delivering addi-tional services.This chapter will be of interest to donors who are
considering supporting a microfinance activity or exist-ing MFIs that are considering adding new services orchanging the way in which they operate. In particular,the overview of the products and services an MFI mightoffer its clients enables the reader to determine the levelat which it meets the needs and demands of the targetmarket.
64 M I C R O F I N A N C E H A N D B O O K
1. This discussion is taken from Bennett (1997).
The Systems Framework
Providing microfinance services to marginal clients is acomplex process that requires many different kinds ofskills and functions. This may require more than oneinstitution. Even MFIs taking an integrated approach donot often provide all of the services demanded by thetarget group (see below). Thus understanding how theprocess of financial and social intermediation takes placerequires a systems analysis rather than a simple institu-tional analysis.1
The systems perspective is important not onlybecause there may be a number of different institutionsinvolved, but also because these institutions are likely tohave very different institutional goals or “corporate mis-sions.” Thus if a commercial bank is involved, its goal isto build its equity and deliver a profit to its owners. Incontrast, both government agencies and nongovern-mental organizations (NGOs), despite their manydifferences, are service organizations rather than profit-making institutions. Credit and savings clients them-selves, if formed as a membership organization, havetheir own corporate mission: to serve its members whoare both clients and owners.The systems approach is useful for both donors and
practitioners, because it makes the issue of subsidies mucheasier to understand and deal with honestly. It allows usto see each institution involved in the intermediationprocess as a separate locus of sustainability when we areassessing the commercial viability of the whole system.When it comes to covering the costs of providing serviceswithin the systems framework, each institution may havea different perspective. For formal financial institutionsand membership organizations, financial sustainability isan essential goal. NGOs although expected to operateefficiently and to cover as much of their costs as possible,are not expected to generate a profit. Typically they workto deliver financial services to a target group for whom“the market” has failed. For many NGOs financial self-sustainability as an institution is not a goal consistentwith their corporate missions.If we consider the system as a whole, we can be much
clearer about where the subsidies are. If a given institu-tion is solely involved in providing social intermediation,then we can make an informed decision to provide ongo-
ing subsidy for this work. The systems approach allowsus to deal with the fact that microfinance involves a mixof “business” and “development.” Instead of trying toforce formal banks to become NGOs worrying aboutsocial intermediation, empowerment, and participation,and instead of urging NGOs to transform themselvesinto banks that must make a profit, we can encourageinstitutions to form partnerships in which each does whatit does best, pursuing its own corporate mission whilecombining different skills to provide a lasting system thatprovides the poor with access to financial services.(However, it is important to note that a new breed
of NGOs, called “business NGOs,” have begun toemerge. In the discourse currently surrounding microfi-nance, there seems to be an expectation that all NGOsinvolved in microfinance will basically transform them-selves into financial institutions to achieve the goal offinancial self-sustainability. Because not all NGOs arethe same, considerable caution is required before draw-ing this conclusion. Before encouraging an NGO tobecome a formal financial institution, it is important tobe very clear about the organization’s institutionalgoals, management capacity, and experience. Not allNGOs can—or should—become banks. Indeed, thereare many valid roles for NGOs to play within a sustain-able system of financial intermediation—even if theythemselves are not able to become financially self-sus-tainable in the way that a well performing bank orcooperative can.)Within the systems framework there are four broad
categories of services that may be provided to microfi-nance clients:� Financial intermediation, or the provision of financialproducts and services such as savings, credit, insur-ance, credit cards, and payment systems. Financialintermediation should not require ongoing subsidies.
� Social intermediation, or the process of building thehuman and social capital required by sustainablefinancial intermediation for the poor. Social interme-diation may require subsidies for a longer period thanfinancial intermediation, but eventually subsidesshould be eliminated.
� Enterprise development services, or nonfinancial servicesthat assist microentrepreneurs. They include businesstraining, marketing and technology services, skills
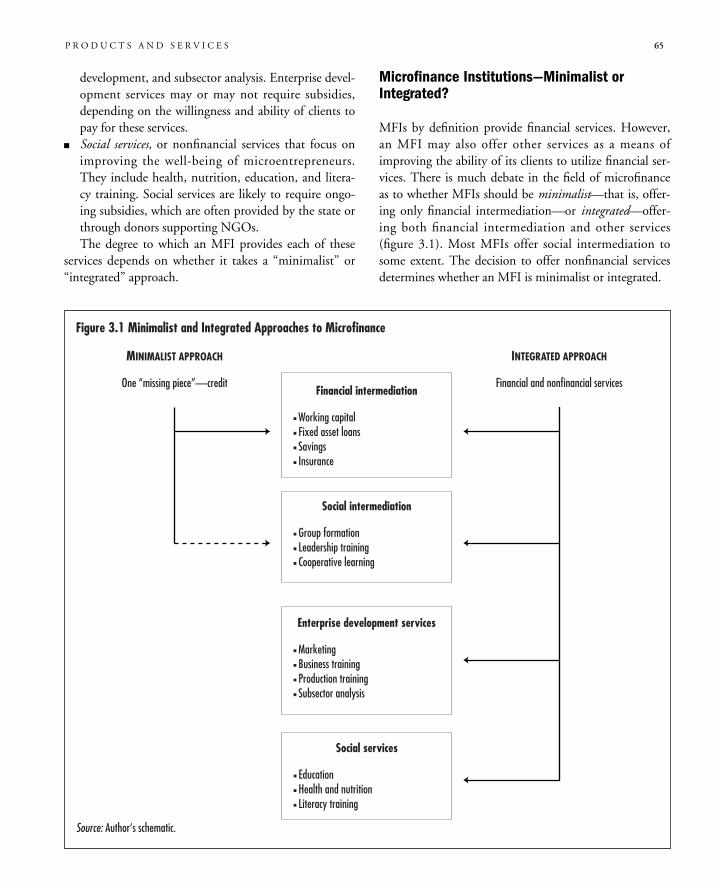
P R O D U C T S A N D S E R V I C E S 65
development, and subsector analysis. Enterprise devel-opment services may or may not require subsidies,depending on the willingness and ability of clients topay for these services.
� Social services, or nonfinancial services that focus onimproving the well-being of microentrepreneurs.They include health, nutrition, education, and litera-cy training. Social services are likely to require ongo-ing subsidies, which are often provided by the state orthrough donors supporting NGOs.The degree to which an MFI provides each of these
services depends on whether it takes a “minimalist” or“integrated” approach.
Microfinance Institutions—Minimalist orIntegrated?
MFIs by definition provide financial services. However,an MFI may also offer other services as a means ofimproving the ability of its clients to utilize financial ser-vices. There is much debate in the field of microfinanceas to whether MFIs should be minimalist—that is, offer-ing only financial intermediation—or integrated—offer-ing both financial intermediation and other services(figure 3.1). Most MFIs offer social intermediation tosome extent. The decision to offer nonfinancial servicesdetermines whether an MFI is minimalist or integrated.
Figure 3.1 Minimalist and Integrated Approaches to Microfinance
INTEGRATED APPROACH
Financial and nonfinancial services
MINIMALIST APPROACH
One “missing piece”—credit
Source: Author‘s schematic.
MFIs using the minimalist approach normally offeronly financial intermediation, but they may occasional-ly offer limited social intermediation services.Minimalists base their approach on the premise thatthere is a single “missing piece” for enterprise growth,usually considered to be the lack of affordable, accessi-ble short-term credit, which the MFI can offer. Whileother “missing pieces” may exist, the MFI recognizes itscomparative advantage in providing only financialintermediation. Other organizations are assumed toprovide other services demanded by the target clients.This approach offers cost advantages for the MFI andallows it to maintain a clear focus, since it develops andprovides only one service to clients.The integrated approach takes a more holistic view of
the client. It provides a combination or range of finan-cial and social intermediation, enterprise development,and social services. While it may not provide all four,the MFI takes advantage of its proximity to clients and,based on its objectives, provides those services that itfeels are most needed or that it has a comparativeadvantage in providing.An MFI chooses a minimalist or more integrated
approach depending on its objectives and the circum-stances (demand and supply) in which it is operating. Ifan MFI chooses to take an integrated approach, itshould be aware of the following potential issues:� Providing financial and nonfinancial services are twodistinct activities, which may at times lead an insti-tution to pursue conflicting objectives.
� It is often difficult for clients to differentiate “socialservices,” which are usually free, from “financial ser-vices,” which must be paid for, when they are receiv-ing both from the same organization.
� MFIs offering many services may have difficultiesidentifying and controlling the costs per service.
� Nonfinancial services are rarely financially sustainable.
Financial Intermediation
The primary role of MFIs is to provide financial interme-diation. This involves the transfer of capital or liquidityfrom those who have excess at a particular time to thosewho are short at that same time. Since production andconsumption do not take place simultaneously, some-thing is needed to coordinate these different rhythms.
“Finance in the form of savings and credit arises to per-mit coordination. Savings and credit are made more effi-cient when intermediaries begin to transfer funds fromfirms and individuals that have accumulated funds andare willing to shed liquidity, to those that desire toacquire liquidity” (Von Pischke 1991, 27).While virtually all MFIs provide credit services,
some also provide other financial products, includingsavings, insurance, and payment services. The choice ofwhich financial services to provide and the method ofproviding these services depends on the objectives ofthe MFI, the demands of its target market, and its insti-tutional structure.Two key imperatives that must be considered when
providing financial services are:� To respond effectively to the demand and prefer-ences of clients
� To design products that are simple and can be easilyunderstood by the clients and easily managed by theMFI.The range of products commonly provided includes:
� Credit� Savings� Insurance� Credit cards� Payment services.The following section provides a brief description of the
products MFIs offer their clients. This overview is providedto familiarize the reader with the unique ways that financialservices are provided to microentrepreneurs. Specific infor-mation on how to design credit and savings products canbe found in chapters 5 and 6. Appendix 1 summarizes themain approaches to financial intermediation.
Credit
Credit is borrowed funds with specified terms for repay-ment. When there are insufficient accumulated savingsto finance a business and when the return on borrowedfunds exceeds the interest rate charged on the loan, itmakes sense to borrow rather than postpone the businessactivity until sufficient savings can be accumulated,assuming the capacity to service the debt exists(Waterfield and Duval 1996).Loans are generally made for productive purposes—
that is, to generate revenue within a business. SomeMFIs also make loans for consumption, housing, or spe-
66 M I C R O F I N A N C E H A N D B O O K
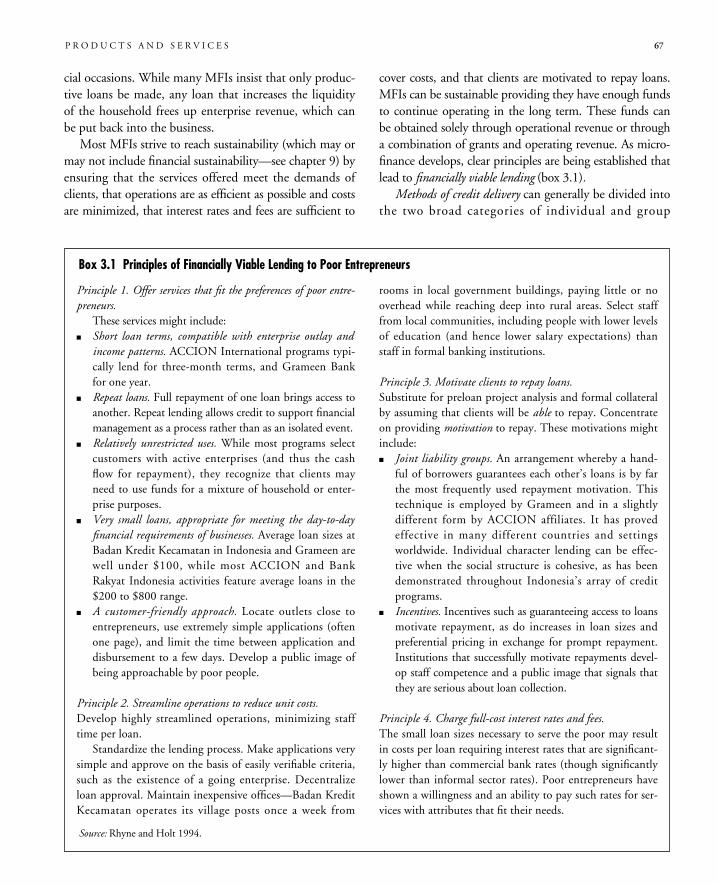
cial occasions. While many MFIs insist that only produc-tive loans be made, any loan that increases the liquidityof the household frees up enterprise revenue, which canbe put back into the business.Most MFIs strive to reach sustainability (which may or
may not include financial sustainability—see chapter 9) byensuring that the services offered meet the demands ofclients, that operations are as efficient as possible and costsare minimized, that interest rates and fees are sufficient to
cover costs, and that clients are motivated to repay loans.MFIs can be sustainable providing they have enough fundsto continue operating in the long term. These funds canbe obtained solely through operational revenue or througha combination of grants and operating revenue. As micro-finance develops, clear principles are being established thatlead to financially viable lending (box 3.1).
Methods of credit delivery can generally be divided intothe two broad categories of individual and group
P R O D U C T S A N D S E R V I C E S 67
Principle 1. Offer services that fit the preferences of poor entre-preneurs.These services might include:
� Short loan terms, compatible with enterprise outlay andincome patterns. ACCION International programs typi-cally lend for three-month terms, and Grameen Bankfor one year.
� Repeat loans. Full repayment of one loan brings access toanother. Repeat lending allows credit to support financialmanagement as a process rather than as an isolated event.
� Relatively unrestricted uses. While most programs selectcustomers with active enterprises (and thus the cashflow for repayment), they recognize that clients mayneed to use funds for a mixture of household or enter-prise purposes.
� Very small loans, appropriate for meeting the day-to-dayfinancial requirements of businesses. Average loan sizes atBadan Kredit Kecamatan in Indonesia and Grameen arewell under $100, while most ACCION and BankRakyat Indonesia activities feature average loans in the$200 to $800 range.
� A customer-friendly approach. Locate outlets close toentrepreneurs, use extremely simple applications (oftenone page), and limit the time between application anddisbursement to a few days. Develop a public image ofbeing approachable by poor people.
Principle 2. Streamline operations to reduce unit costs.Develop highly streamlined operations, minimizing stafftime per loan.Standardize the lending process. Make applications very
simple and approve on the basis of easily verifiable criteria,such as the existence of a going enterprise. Decentralizeloan approval. Maintain inexpensive offices—Badan KreditKecamatan operates its village posts once a week from
rooms in local government buildings, paying little or nooverhead while reaching deep into rural areas. Select stafffrom local communities, including people with lower levelsof education (and hence lower salary expectations) thanstaff in formal banking institutions.
Principle 3. Motivate clients to repay loans.Substitute for preloan project analysis and formal collateralby assuming that clients will be able to repay. Concentrateon providing motivation to repay. These motivations mightinclude:� Joint liability groups. An arrangement whereby a hand-ful of borrowers guarantees each other’s loans is by farthe most frequently used repayment motivation. Thistechnique is employed by Grameen and in a slightlydifferent form by ACCION affiliates. It has provedeffective in many different countries and settingsworldwide. Individual character lending can be effec-tive when the social structure is cohesive, as has beendemonstrated throughout Indonesia’s array of creditprograms.
� Incentives. Incentives such as guaranteeing access to loansmotivate repayment, as do increases in loan sizes andpreferential pricing in exchange for prompt repayment.Institutions that successfully motivate repayments devel-op staff competence and a public image that signals thatthey are serious about loan collection.
Principle 4. Charge full-cost interest rates and fees.The small loan sizes necessary to serve the poor may resultin costs per loan requiring interest rates that are significant-ly higher than commercial bank rates (though significantlylower than informal sector rates). Poor entrepreneurs haveshown a willingness and an ability to pay such rates for ser-vices with attributes that fit their needs.
Box 3.1 Principles of Financially Viable Lending to Poor Entrepreneurs
Source: Rhyne and Holt 1994.
approaches, based on how the MFI delivers and guaran-tees its loans (adapted from Waterfield and Duval 1996).� Individual loans are delivered to individuals based ontheir ability to provide the MFI with assurances ofrepayment and some level of security.
� Group-based approaches make loans to groups—thatis, either to individuals who are members of a groupand guarantee each other’s loans or to groups thatthen subloan to their members.
INDIVIDUAL LENDING. MFIs have successfully developedeffective models to lend to individuals, which combineformal lending, as is traditional in financial institutions,with informal lending, as carried out by moneylenders.
Formal financial institutions base lending decisions onbusiness and client characteristics, including cash flow,debt capacity, historical financial results, collateral, andcharacter. Formal sector lenders have also proven theusefulness of personal guarantors to motivate clients torepay loans. They have demonstrated the value of a busi-nessike approach and the importance of achieving costrecovery in their lending operations. Finally, they haveestablished the importance of external regulation to safe-guard client savings and the institution itself. However,formal sector lending practices are often not suitable formicrofinance institutions, as many microbusinesses orbusiness owners do not have many assets or adequatefinancial reporting systems.
Informal sector lenders approve loans based on a person-al knowledge of the borrowers rather than on a sophisti-cated feasibility analysis, and they use informal collateralsources. They also demonstrate the importance ofresponding quickly to borrowers’ needs with a minimumof bureaucratic procedures. Perhaps most important,moneylenders demonstrate that the poor do repay loansand are able to pay relatively high interest rates. However,loans from moneylenders are often not taken for produc-tive purposes but rather for emergency or consumptionsmoothing. They are usually for a relatively short periodof time.Characteristics of individual lending models include
(Waterfield and Duval 1996, 84):� The guarantee of loans by some form of collateral(defined less stringently than by formal lenders) or acosigner (a person who agrees to be legally responsiblefor the loan but who usually has not received a loan ofher or his own from the MFI).
� The screening of potential clients by credit checks andcharacter references.
� The tailoring of the loan size and term to businessneeds.
� The frequent increase over time of the loan size andterm.
� Efforts by the staff to develop close relationships withclients so that each client represents a significantinvestment of staff time and energy.Individual lending requires frequent and close contact
with individual clients. It is most often successful in urbanareas where client access is possible. Individual lending canalso be successful in rural areas, particularly through sav-ings and credit cooperatives or credit unions. In bothurban and rural areas individual lending is often focusedon financing production-oriented businesses, whose opera-tors are generally better off than the very poor.The Fédération des Caisses d’Epargne et de Crédit
Agricole Mutuel in Benin provides an example of effec-tive individual lending in rural areas (box 3.2).Because credit officers need to spend a relatively long
period of time with individual clients, they usually servebetween 60 and 140 clients. Loans to individuals areusually larger than loans to members in a group.Accordingly, given an equal number of loans, theseloans to individuals provide a larger revenue base to coverthe costs of delivering and maintaining the loans thangroup loans. The revenue base is the outstandingamount of a loan portfolio that is earning interest rev-enue. Because interest revenue is based on a percentageof the amount lent, the larger the amount lent thegreater the revenue and hence the more funds availableto cover costs, even though costs may not be that muchhigher than for loans of smaller amounts (see chapter 9).Furthermore, individual lending models may be lesscostly and less labor-intensive to establish than group-based models.The Association for the Development of Microenter-
prises in the Dominican Republic provides an excellentexample of a successful MFI that provides individual loans(box 3.3).
GROUP-BASED LENDING. Group-based lending involves theformation of groups of people who have a common wishto access financial services. Group-lending approachesfrequently build on or imitate existing informal lendingand savings groups. These groups exist in virtually every
68 M I C R O F I N A N C E H A N D B O O K
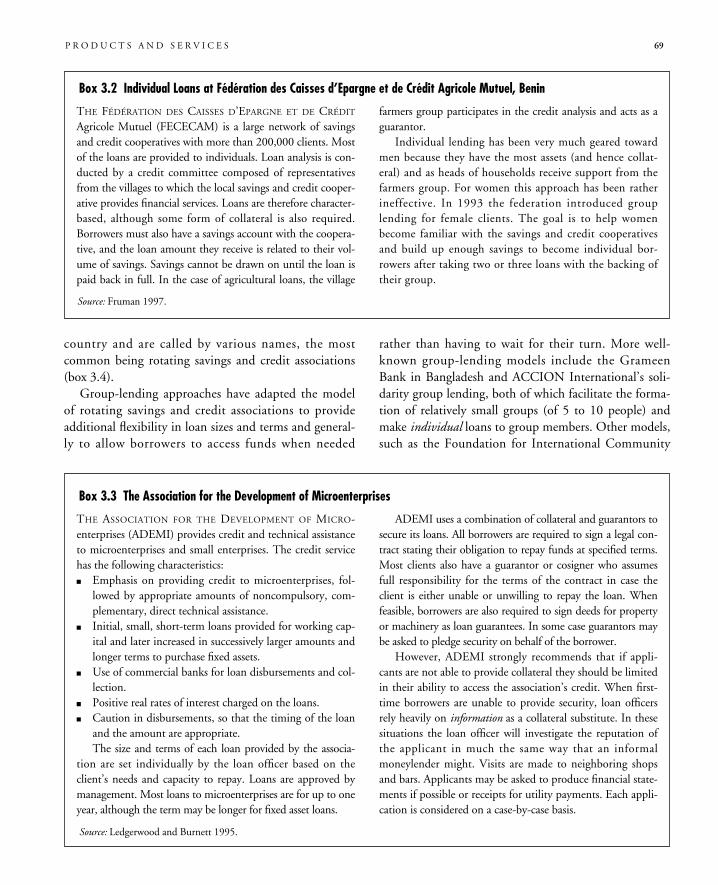
P R O D U C T S A N D S E R V I C E S 69
country and are called by various names, the mostcommon being rotating savings and credit associations(box 3.4).Group-lending approaches have adapted the model
of rotating savings and credit associations to provideadditional flexibility in loan sizes and terms and general-ly to allow borrowers to access funds when needed
rather than having to wait for their turn. More well-known group-lending models include the GrameenBank in Bangladesh and ACCION International’s soli-darity group lending, both of which facilitate the forma-tion of relatively small groups (of 5 to 10 people) andmake individual loans to group members. Other models,such as the Foundation for International Community
THE FÉDÉRATION DES CAISSES D’EPARGNE ET DE CRÉDITAgricole Mutuel (FECECAM) is a large network of savingsand credit cooperatives with more than 200,000 clients. Mostof the loans are provided to individuals. Loan analysis is con-ducted by a credit committee composed of representativesfrom the villages to which the local savings and credit cooper-ative provides financial services. Loans are therefore character-based, although some form of collateral is also required.Borrowers must also have a savings account with the coopera-tive, and the loan amount they receive is related to their vol-ume of savings. Savings cannot be drawn on until the loan ispaid back in full. In the case of agricultural loans, the village
farmers group participates in the credit analysis and acts as aguarantor.Individual lending has been very much geared toward
men because they have the most assets (and hence collat-eral) and as heads of households receive support from thefarmers group. For women this approach has been ratherineffective. In 1993 the federation introduced grouplending for female clients. The goal is to help womenbecome familiar with the savings and credit cooperativesand build up enough savings to become individual bor-rowers after taking two or three loans with the backing oftheir group.
Box 3.2 Individual Loans at Fédération des Caisses d’Epargne et de Crédit Agricole Mutuel, Benin
Source: Fruman 1997.
THE ASSOCIATION FOR THE DEVELOPMENT OF MICRO-enterprises (ADEMI) provides credit and technical assistanceto microenterprises and small enterprises. The credit servicehas the following characteristics:� Emphasis on providing credit to microenterprises, fol-lowed by appropriate amounts of noncompulsory, com-plementary, direct technical assistance.
� Initial, small, short-term loans provided for working cap-ital and later increased in successively larger amounts andlonger terms to purchase fixed assets.
� Use of commercial banks for loan disbursements and col-lection.
� Positive real rates of interest charged on the loans.� Caution in disbursements, so that the timing of the loanand the amount are appropriate.The size and terms of each loan provided by the associa-
tion are set individually by the loan officer based on theclient’s needs and capacity to repay. Loans are approved bymanagement. Most loans to microenterprises are for up to oneyear, although the term may be longer for fixed asset loans.
ADEMI uses a combination of collateral and guarantors tosecure its loans. All borrowers are required to sign a legal con-tract stating their obligation to repay funds at specified terms.Most clients also have a guarantor or cosigner who assumesfull responsibility for the terms of the contract in case theclient is either unable or unwilling to repay the loan. Whenfeasible, borrowers are also required to sign deeds for propertyor machinery as loan guarantees. In some case guarantors maybe asked to pledge security on behalf of the borrower.However, ADEMI strongly recommends that if appli-
cants are not able to provide collateral they should be limitedin their ability to access the association’s credit. When first-time borrowers are unable to provide security, loan officersrely heavily on information as a collateral substitute. In thesesituations the loan officer will investigate the reputation ofthe applicant in much the same way that an informalmoneylender might. Visits are made to neighboring shopsand bars. Applicants may be asked to produce financial state-ments if possible or receipts for utility payments. Each appli-cation is considered on a case-by-case basis.
Box 3.3 The Association for the Development of Microenterprises
Source: Ledgerwood and Burnett 1995.
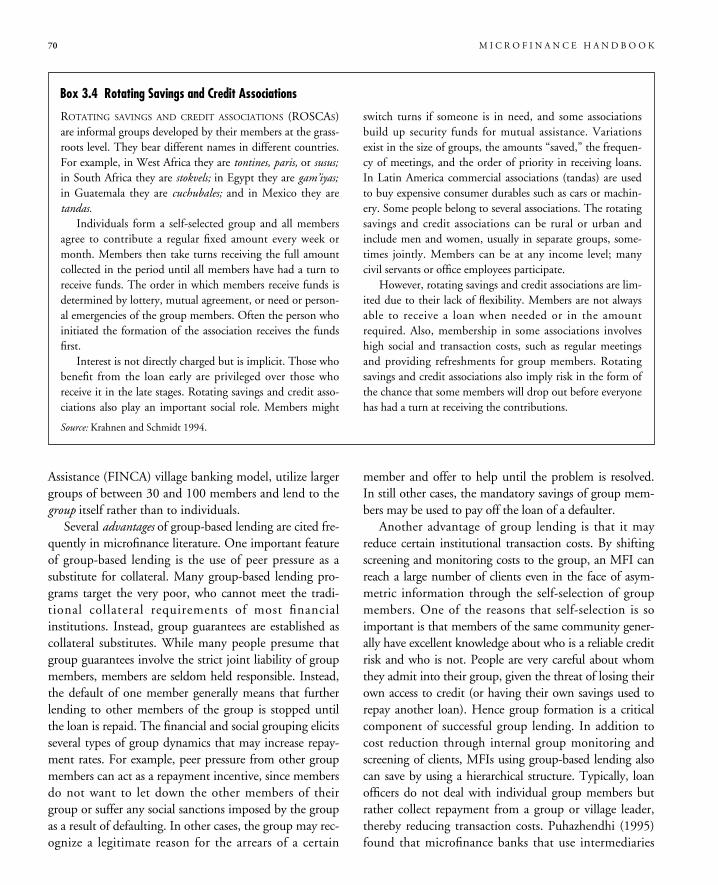
Assistance (FINCA) village banking model, utilize largergroups of between 30 and 100 members and lend to thegroup itself rather than to individuals.Several advantages of group-based lending are cited fre-
quently in microfinance literature. One important featureof group-based lending is the use of peer pressure as asubstitute for collateral. Many group-based lending pro-grams target the very poor, who cannot meet the tradi-tional collateral requirements of most financialinstitutions. Instead, group guarantees are established ascollateral substitutes. While many people presume thatgroup guarantees involve the strict joint liability of groupmembers, members are seldom held responsible. Instead,the default of one member generally means that furtherlending to other members of the group is stopped untilthe loan is repaid. The financial and social grouping elicitsseveral types of group dynamics that may increase repay-ment rates. For example, peer pressure from other groupmembers can act as a repayment incentive, since membersdo not want to let down the other members of theirgroup or suffer any social sanctions imposed by the groupas a result of defaulting. In other cases, the group may rec-ognize a legitimate reason for the arrears of a certain
member and offer to help until the problem is resolved.In still other cases, the mandatory savings of group mem-bers may be used to pay off the loan of a defaulter.Another advantage of group lending is that it may
reduce certain institutional transaction costs. By shiftingscreening and monitoring costs to the group, an MFI canreach a large number of clients even in the face of asym-metric information through the self-selection of groupmembers. One of the reasons that self-selection is soimportant is that members of the same community gener-ally have excellent knowledge about who is a reliable creditrisk and who is not. People are very careful about whomthey admit into their group, given the threat of losing theirown access to credit (or having their own savings used torepay another loan). Hence group formation is a criticalcomponent of successful group lending. In addition tocost reduction through internal group monitoring andscreening of clients, MFIs using group-based lending alsocan save by using a hierarchical structure. Typically, loanofficers do not deal with individual group members butrather collect repayment from a group or village leader,thereby reducing transaction costs. Puhazhendhi (1995)found that microfinance banks that use intermediaries
70 M I C R O F I N A N C E H A N D B O O K
ROTATING SAVINGS AND CREDIT ASSOCIATIONS (ROSCAS)are informal groups developed by their members at the grass-roots level. They bear different names in different countries.For example, in West Africa they are tontines, paris, or susus;in South Africa they are stokvels; in Egypt they are gam’iyas;in Guatemala they are cuchubales; and in Mexico they aretandas.Individuals form a self-selected group and all members
agree to contribute a regular fixed amount every week ormonth. Members then take turns receiving the full amountcollected in the period until all members have had a turn toreceive funds. The order in which members receive funds isdetermined by lottery, mutual agreement, or need or person-al emergencies of the group members. Often the person whoinitiated the formation of the association receives the fundsfirst.Interest is not directly charged but is implicit. Those who
benefit from the loan early are privileged over those whoreceive it in the late stages. Rotating savings and credit asso-ciations also play an important social role. Members might
switch turns if someone is in need, and some associationsbuild up security funds for mutual assistance. Variationsexist in the size of groups, the amounts “saved,” the frequen-cy of meetings, and the order of priority in receiving loans.In Latin America commercial associations (tandas) are usedto buy expensive consumer durables such as cars or machin-ery. Some people belong to several associations. The rotatingsavings and credit associations can be rural or urban andinclude men and women, usually in separate groups, some-times jointly. Members can be at any income level; manycivil servants or office employees participate.However, rotating savings and credit associations are lim-
ited due to their lack of flexibility. Members are not alwaysable to receive a loan when needed or in the amountrequired. Also, membership in some associations involveshigh social and transaction costs, such as regular meetingsand providing refreshments for group members. Rotatingsavings and credit associations also imply risk in the form ofthe chance that some members will drop out before everyonehas had a turn at receiving the contributions.
Box 3.4 Rotating Savings and Credit Associations
Source: Krahnen and Schmidt 1994.
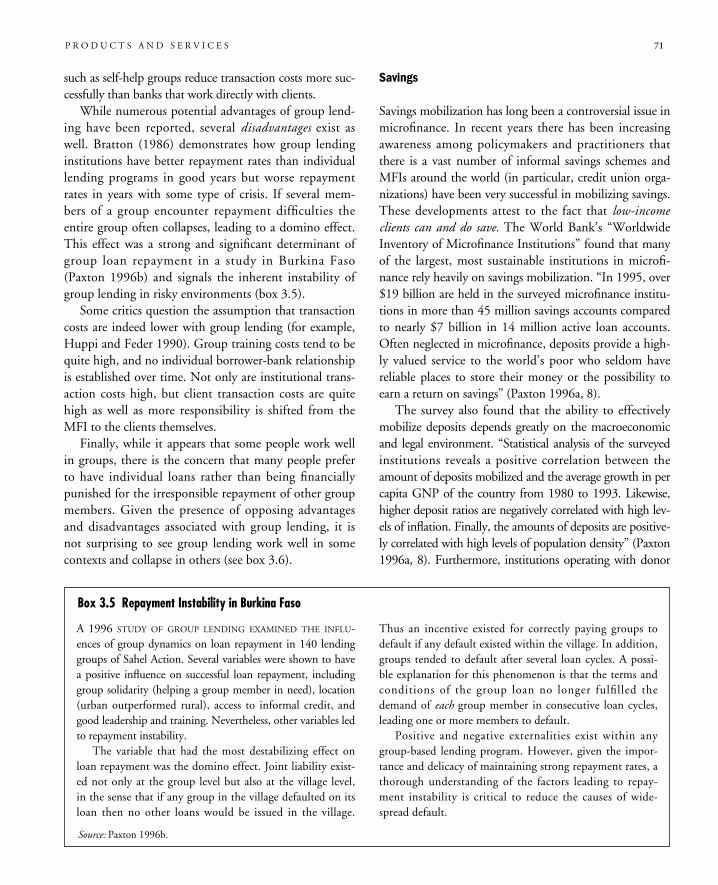
such as self-help groups reduce transaction costs more suc-cessfully than banks that work directly with clients.While numerous potential advantages of group lend-
ing have been reported, several disadvantages exist aswell. Bratton (1986) demonstrates how group lendinginstitutions have better repayment rates than individuallending programs in good years but worse repaymentrates in years with some type of crisis. If several mem-bers of a group encounter repayment difficulties theentire group often collapses, leading to a domino effect.This effect was a strong and significant determinant ofgroup loan repayment in a study in Burkina Faso(Paxton 1996b) and signals the inherent instability ofgroup lending in risky environments (box 3.5).Some critics question the assumption that transaction
costs are indeed lower with group lending (for example,Huppi and Feder 1990). Group training costs tend to bequite high, and no individual borrower-bank relationshipis established over time. Not only are institutional trans-action costs high, but client transaction costs are quitehigh as well as more responsibility is shifted from theMFI to the clients themselves.Finally, while it appears that some people work well
in groups, there is the concern that many people preferto have individual loans rather than being financiallypunished for the irresponsible repayment of other groupmembers. Given the presence of opposing advantagesand disadvantages associated with group lending, it isnot surprising to see group lending work well in somecontexts and collapse in others (see box 3.6).
Savings
Savings mobilization has long been a controversial issue inmicrofinance. In recent years there has been increasingawareness among policymakers and practitioners thatthere is a vast number of informal savings schemes andMFIs around the world (in particular, credit union orga-nizations) have been very successful in mobilizing savings.These developments attest to the fact that low-incomeclients can and do save. The World Bank’s “WorldwideInventory of Microfinance Institutions” found that manyof the largest, most sustainable institutions in microfi-nance rely heavily on savings mobilization. “In 1995, over$19 billion are held in the surveyed microfinance institu-tions in more than 45 million savings accounts comparedto nearly $7 billion in 14 million active loan accounts.Often neglected in microfinance, deposits provide a high-ly valued service to the world’s poor who seldom havereliable places to store their money or the possibility toearn a return on savings” (Paxton 1996a, 8).The survey also found that the ability to effectively
mobilize deposits depends greatly on the macroeconomicand legal environment. “Statistical analysis of the surveyedinstitutions reveals a positive correlation between theamount of deposits mobilized and the average growth in percapita GNP of the country from 1980 to 1993. Likewise,higher deposit ratios are negatively correlated with high lev-els of inflation. Finally, the amounts of deposits are positive-ly correlated with high levels of population density” (Paxton1996a, 8). Furthermore, institutions operating with donor
P R O D U C T S A N D S E R V I C E S 71
A 1996 STUDY OF GROUP LENDING EXAMINED THE INFLU-ences of group dynamics on loan repayment in 140 lendinggroups of Sahel Action. Several variables were shown to havea positive influence on successful loan repayment, includinggroup solidarity (helping a group member in need), location(urban outperformed rural), access to informal credit, andgood leadership and training. Nevertheless, other variables ledto repayment instability.The variable that had the most destabilizing effect on
loan repayment was the domino effect. Joint liability exist-ed not only at the group level but also at the village level,in the sense that if any group in the village defaulted on itsloan then no other loans would be issued in the village.
Thus an incentive existed for correctly paying groups todefault if any default existed within the village. In addition,groups tended to default after several loan cycles. A possi-ble explanation for this phenomenon is that the terms andconditions of the group loan no longer fulfilled thedemand of each group member in consecutive loan cycles,leading one or more members to default.Positive and negative externalities exist within any
group-based lending program. However, given the impor-tance and delicacy of maintaining strong repayment rates, athorough understanding of the factors leading to repay-ment instability is critical to reduce the causes of wide-spread default.
Box 3.5 Repayment Instability in Burkina Faso
Source: Paxton 1996b.
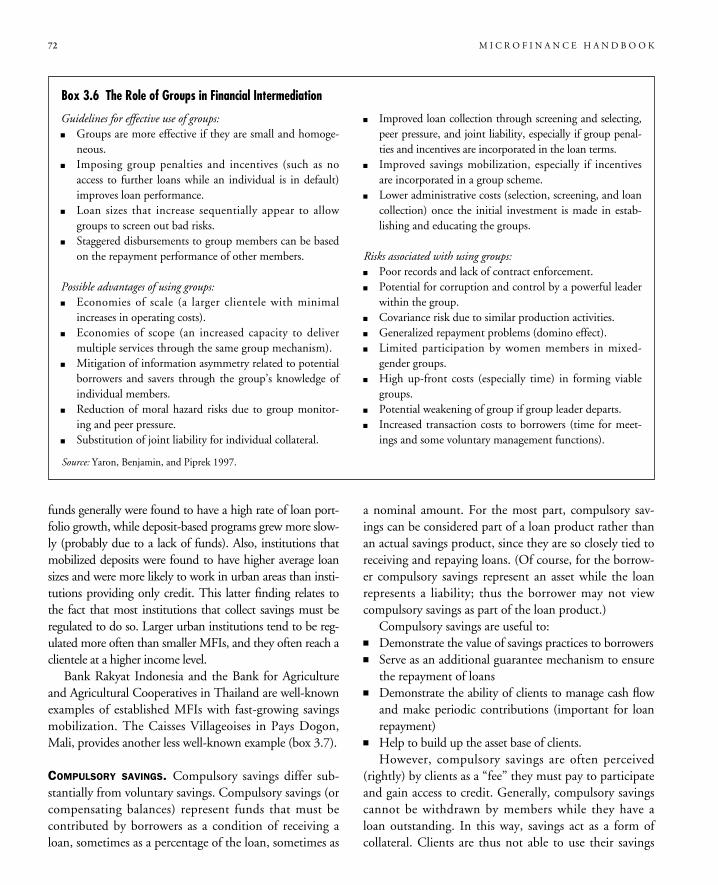
funds generally were found to have a high rate of loan port-folio growth, while deposit-based programs grew more slow-ly (probably due to a lack of funds). Also, institutions thatmobilized deposits were found to have higher average loansizes and were more likely to work in urban areas than insti-tutions providing only credit. This latter finding relates tothe fact that most institutions that collect savings must beregulated to do so. Larger urban institutions tend to be reg-ulated more often than smaller MFIs, and they often reach aclientele at a higher income level.Bank Rakyat Indonesia and the Bank for Agriculture
and Agricultural Cooperatives in Thailand are well-knownexamples of established MFIs with fast-growing savingsmobilization. The Caisses Villageoises in Pays Dogon,Mali, provides another less well-known example (box 3.7).
COMPULSORY SAVINGS. Compulsory savings differ sub-stantially from voluntary savings. Compulsory savings (orcompensating balances) represent funds that must becontributed by borrowers as a condition of receiving aloan, sometimes as a percentage of the loan, sometimes as
a nominal amount. For the most part, compulsory sav-ings can be considered part of a loan product rather thanan actual savings product, since they are so closely tied toreceiving and repaying loans. (Of course, for the borrow-er compulsory savings represent an asset while the loanrepresents a liability; thus the borrower may not viewcompulsory savings as part of the loan product.)Compulsory savings are useful to:
� Demonstrate the value of savings practices to borrowers� Serve as an additional guarantee mechanism to ensurethe repayment of loans
� Demonstrate the ability of clients to manage cash flowand make periodic contributions (important for loanrepayment)
� Help to build up the asset base of clients.However, compulsory savings are often perceived
(rightly) by clients as a “fee” they must pay to participateand gain access to credit. Generally, compulsory savingscannot be withdrawn by members while they have aloan outstanding. In this way, savings act as a form ofcollateral. Clients are thus not able to use their savings
72 M I C R O F I N A N C E H A N D B O O K
Guidelines for effective use of groups:� Groups are more effective if they are small and homoge-neous.
� Imposing group penalties and incentives (such as noaccess to further loans while an individual is in default)improves loan performance.
� Loan sizes that increase sequentially appear to allowgroups to screen out bad risks.
� Staggered disbursements to group members can be basedon the repayment performance of other members.
Possible advantages of using groups:� Economies of scale (a larger clientele with minimalincreases in operating costs).
� Economies of scope (an increased capacity to delivermultiple services through the same group mechanism).
� Mitigation of information asymmetry related to potentialborrowers and savers through the group’s knowledge ofindividual members.
� Reduction of moral hazard risks due to group monitor-ing and peer pressure.
� Substitution of joint liability for individual collateral.
� Improved loan collection through screening and selecting,peer pressure, and joint liability, especially if group penal-ties and incentives are incorporated in the loan terms.
� Improved savings mobilization, especially if incentivesare incorporated in a group scheme.
� Lower administrative costs (selection, screening, and loancollection) once the initial investment is made in estab-lishing and educating the groups.
Risks associated with using groups:� Poor records and lack of contract enforcement.� Potential for corruption and control by a powerful leaderwithin the group.
� Covariance risk due to similar production activities.� Generalized repayment problems (domino effect).� Limited participation by women members in mixed-gender groups.
� High up-front costs (especially time) in forming viablegroups.
� Potential weakening of group if group leader departs.� Increased transaction costs to borrowers (time for meet-ings and some voluntary management functions).
Box 3.6 The Role of Groups in Financial Intermediation
Source: Yaron, Benjamin, and Piprek 1997.
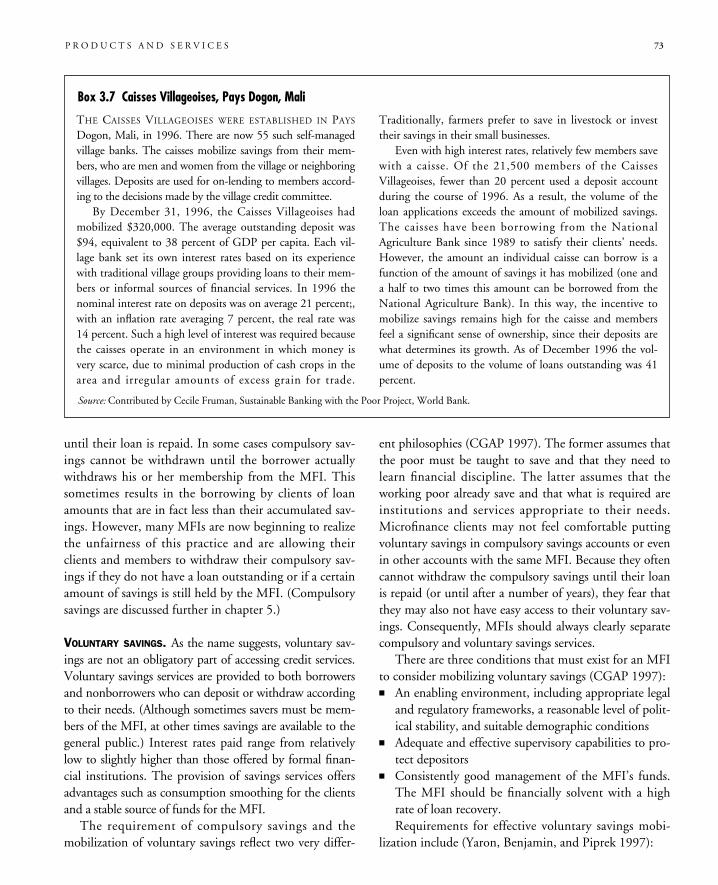
until their loan is repaid. In some cases compulsory sav-ings cannot be withdrawn until the borrower actuallywithdraws his or her membership from the MFI. Thissometimes results in the borrowing by clients of loanamounts that are in fact less than their accumulated sav-ings. However, many MFIs are now beginning to realizethe unfairness of this practice and are allowing theirclients and members to withdraw their compulsory sav-ings if they do not have a loan outstanding or if a certainamount of savings is still held by the MFI. (Compulsorysavings are discussed further in chapter 5.)
VOLUNTARY SAVINGS. As the name suggests, voluntary sav-ings are not an obligatory part of accessing credit services.Voluntary savings services are provided to both borrowersand nonborrowers who can deposit or withdraw accordingto their needs. (Although sometimes savers must be mem-bers of the MFI, at other times savings are available to thegeneral public.) Interest rates paid range from relativelylow to slightly higher than those offered by formal finan-cial institutions. The provision of savings services offersadvantages such as consumption smoothing for the clientsand a stable source of funds for the MFI.The requirement of compulsory savings and the
mobilization of voluntary savings reflect two very differ-
ent philosophies (CGAP 1997). The former assumes thatthe poor must be taught to save and that they need tolearn financial discipline. The latter assumes that theworking poor already save and that what is required areinstitutions and services appropriate to their needs.Microfinance clients may not feel comfortable puttingvoluntary savings in compulsory savings accounts or evenin other accounts with the same MFI. Because they oftencannot withdraw the compulsory savings until their loanis repaid (or until after a number of years), they fear thatthey may also not have easy access to their voluntary sav-ings. Consequently, MFIs should always clearly separatecompulsory and voluntary savings services.There are three conditions that must exist for an MFI
to consider mobilizing voluntary savings (CGAP 1997):� An enabling environment, including appropriate legaland regulatory frameworks, a reasonable level of polit-ical stability, and suitable demographic conditions
� Adequate and effective supervisory capabilities to pro-tect depositors
� Consistently good management of the MFI’s funds.The MFI should be financially solvent with a highrate of loan recovery.Requirements for effective voluntary savings mobi-
lization include (Yaron, Benjamin, and Piprek 1997):
P R O D U C T S A N D S E R V I C E S 73
THE CAISSES VILLAGEOISES WERE ESTABLISHED IN PAYSDogon, Mali, in 1996. There are now 55 such self-managedvillage banks. The caisses mobilize savings from their mem-bers, who are men and women from the village or neighboringvillages. Deposits are used for on-lending to members accord-ing to the decisions made by the village credit committee.By December 31, 1996, the Caisses Villageoises had
mobilized $320,000. The average outstanding deposit was$94, equivalent to 38 percent of GDP per capita. Each vil-lage bank set its own interest rates based on its experiencewith traditional village groups providing loans to their mem-bers or informal sources of financial services. In 1996 thenominal interest rate on deposits was on average 21 percent;,with an inflation rate averaging 7 percent, the real rate was14 percent. Such a high level of interest was required becausethe caisses operate in an environment in which money isvery scarce, due to minimal production of cash crops in thearea and irregular amounts of excess grain for trade.
Traditionally, farmers prefer to save in livestock or investtheir savings in their small businesses.Even with high interest rates, relatively few members save
with a caisse. Of the 21,500 members of the CaissesVillageoises, fewer than 20 percent used a deposit accountduring the course of 1996. As a result, the volume of theloan applications exceeds the amount of mobilized savings.The caisses have been borrowing from the NationalAgriculture Bank since 1989 to satisfy their clients’ needs.However, the amount an individual caisse can borrow is afunction of the amount of savings it has mobilized (one anda half to two times this amount can be borrowed from theNational Agriculture Bank). In this way, the incentive tomobilize savings remains high for the caisse and membersfeel a significant sense of ownership, since their deposits arewhat determines its growth. As of December 1996 the vol-ume of deposits to the volume of loans outstanding was 41percent.
Box 3.7 Caisses Villageoises, Pays Dogon, Mali
Source: Contributed by Cecile Fruman, Sustainable Banking with the Poor Project, World Bank.
� A high level of client confidence in the institution (asense of safety)
� A positive real deposit interest rate (which will requirepositive real on-lending interest rates)
� Flexibility and diversity of savings instruments� Security� Easy access to deposits for clients� Easy access to the MFI (either through its branch net-work or through mobile banking officers)
� MFI staff incentives linked to savings mobilization.The provision of savings services by an MFI can con-
tribute to improved financial intermediation by (Yaron,Benjamin, and Piprek 1997):� Providing clients with a secure place to keep theirsavings, smooth consumption patterns, hedge againstrisk, and accumulate assets while earning higher realreturns than they might by saving in the householdor saving in kind
� Enhancing clients’ perception of “ownership” of aMFI and thus potentially their commitment to repay-ing loans to the MFI
� Encouraging the MFI to intensify efforts to collectloans due to market pressures from depositors (espe-cially if they lose confidence in the MFI)
� Providing a source of funds for the MFI, which cancontribute to improved loan outreach, increasedautonomy from governments and donors, andreduced dependence on subsidies.Savings mobilization is not always feasible or desir-
able for MFIs: the administrative complexities and costsassociated with mobilizing savings—especially smallamounts—may be prohibitive. Institutions may alsofind it difficult to comply with prudential regulationsthat apply to deposit-taking institutions.Furthermore, the volatility of microfinance loan portfo-
lios may put deposits at unusually high risk if the MFI usessavings to fund unsafe lending operations. In addition, MFIsthat offer voluntary saving services must have greater liquidi-ty to meet unexpected increases in savings withdrawals. Theprovision of savings services creates a fundamentally differentinstitution than one that provides only credit. Caution mustbe taken when deciding to introduce savings.
Insurance
MFIs are beginning to experiment with other fin-ancial products and services such as insurance, credit
cards, and payment services. Many group lendingprograms offer an insurance or guarantee scheme. Atypical example is Grameen Bank. Each member isrequired to contribute 1 percent of the loan amountto an insurance fund. In case of the death of a clientthis fund is used to repay the loan and provide thedeceased client’s family with the means to cover bur-ial costs.Insurance is a product that will likely be offered
more extensively in the future by MFIs, because thereis growing demand among their clients for health orloan insurance in case of death or loss of assets. TheSelf-Employed Women’s’ Association in Gujarat,India, provides a good example of an MFI that ismeeting the insurance service needs of its clients (box3.8).
Credit Cards and Smart Cards
Among the other services that some MFIs are beginningto offer are credit cards and smart cards.
CREDIT CARDS. These cards allow borrowers to access aline of credit if and when they need it. Credit cards areused when a purchase is made (assuming the supplier ofthe goods accepts the credit card) or when access to cashis desired (the card is sometimes called a “debit card” ifthe client is accessing his or her own savings).The use of credit cards is still very new in the field
of microfinance; only a few examples are known. Cre-dit cards can only be used when adequate infrastructureis in place within the formal financial sector. For exam-ple, some credit cards provide access to cash throughautomated teller machines. If there is not a wide net-work of such machines and if retailers are not willingto accept credit cards, then the cards’ usefulness is lim-ited.Credit cards do offer considerable advantages to both
clients and MFIs. Credit cards can:� Minimize administrative and operating costs� Streamline operations� Provide an ongoing line of credit to borrowers,enabling them to supplement their cash flow accord-ing to their needs.A recent example of an MFI that provides its low-
income clients with credit cards is the Association forthe Development of Microenterprises (box 3.9).
74 M I C R O F I N A N C E H A N D B O O K
SMART CARDS. The Swazi Business Growth Trust in theKingdom of Swaziland provides its clients with smartcards, which are similar to credit cards but are generallynot available for use in retail outlets (box 3.10). Smartcards contain a memory chip that contains informationabout a client’s available line of credit with a lendinginstitution.
Payment Services
In traditional banks payment services include checkcashing and check writing privileges for customers whomaintain deposits (Caskey 1994). In this sense thebanks’ payment services are bundled with their savingsservices. MFIs may offer similar payment services eitherwith their savings services (if applicable) or separately fora fee. If payment services are bundled with savings ser-vices, the MFI can pay an artificially low interest rate oncustomer deposit accounts to cover the cost of those ser-vices. Otherwise, a fee is charged to cover these costs,which include personnel, infrastructure, and insurancecosts. Fees can be based on a percentage of the amountof the check or they can be a flat minimum fee withadditional charges for first-time clients. Moreover,because the MFI advances funds on checks that mustsubsequently be cleared through the banking system, itincurs interest expenses on the funds advanced and runsthe risk that some cashed checks will be uncollectibledue to insufficient funds or fraud. MFIs, therefore, musthave a relationship with at least one bank to clear thechecks being cashed.In addition to check cashing and check writing privi-
leges, payment services include the transfer and remit-tance of funds from one area to another. Microfinanceclients often need transfer services, however, the amounts
P R O D U C T S A N D S E R V I C E S 75P R O D U C T S A N D S E R V I C E S 75
THE SELF-EMPLOYED WOMEN’S ASSOCIATION (SEWA) IS THEmother institution of a network of interrelated organizations.It began in 1972 as a trade union of self-employed womenin Ahmedabad in the state of Gujarat, India. The associationis active in three areas: organizing women into unions; estab-lishing alternative economic organizations in the form ofcooperatives; and providing services such as banking, hous-ing, and child care.The association’s bank was established in 1974 to provide
banking and insurance services. It acts as manager of the insur-ance scheme run by the Self-Employed Women’s Associationfor its members. The insurance services are actually offered bythe Life Insurance Corporation of India and the United IndiaInsurance Company, supplemented by a special type of insur-ance for women workers offered by the association. The bankacts as an intermediary, packaging insurance services for its
members and helping women to apply for and settle insuranceclaims.Every member who wishes to purchase insurance is given
two options: pay a 60 rupee premium each year and receive allbenefits or make a one-time fixed deposit of 500 rupees in theassociation’s bank. The interest on the fixed deposit is used topay the annual premium. For members who opt for the fixeddeposit scheme, the association will also provide them with a300 rupee maternity benefit paid through its bank.The bank does not charge its own members or the associa-
tion’s members for this service and does not receive any com-mission from the insurance companies. However, in exchangefor managing these services on behalf of the association, itreceives an annual sum of 100,000 rupees. In addition, theassociation also pays the salaries of staff responsible for admin-istering the insurance schemes.
Box 3.8 Self-Employed Women’s Association Insurance
Source: Biswas and Mahajan 1997.
Box 3.9 The Association for the Development ofMicroenterprises’ MasterCardIN MAY 1996 THE ASSOCIATION FOR THE DEVELOPMENT ofMicroenterprises (ADEMI) and the Banco PopularDominicano, the largest private commercial bank in theDominican Republic, launched the ADEMI MasterCard.In addition to the usual uses of the card at purchasing out-lets, clients can withdraw cash at 45 Banco Popular branchesand 60 automated teller machines. To qualify for the cardclients must have operated their businesses for at least oneyear, have monthly incomes of at least 3,000 pesos (aboutUS$230), have borrowed at least 3,000 pesos fromADEMI, and have a good repayment record. The associa-tion aims to reach 5,000 cardholders in the first year. It callsthe MasterCard initiative a further step in building trustwith owners of microenterprises and enhancing their status.
Source: Contributed by McDonald Benjamin, East Asia and PacificRegion Financial Sector and Development Unit, World Bank.
that formal financial institutions require to make a trans-fer may be beyond the limits of the client. Withouttransfer services clients may be forced to carry (relatively)large amounts of money with them, thus incurringunnecessary risks. To offer payment services MFIs musthave an extensive branch network or relationships withone or more banks (box 3.11). This is often difficult toachieve.Few MFIs are currently offering these services, but
it is anticipated that in the future more and more willrecognize a demand for payment services and willboost their ability to cover the costs associated withsuch services.
Social Intermediation
For individuals whose social and economic disadvantagesplace them “beyond the frontier” of formal finance (VonPischke 1991), successful financial intermediation isoften accompanied by social intermediation. Social inter-mediation prepares marginalized groups or individuals toenter into solid business relationships with MFIs.2
Evidence has shown that it is easier to establish sus-tainable financial intermediation systems with the poorin societies that encourage cooperative efforts throughlocal clubs, temple associations, or work groups—inother words, societies with high levels of social capital.
76 M I C R O F I N A N C E H A N D B O O K
THE FÉDÉRATION DES CAISSES D’EPARGNE ET DE CRÉDITAgricole Mutuel (FECECAM) has the largest outreach of anyfinancial institution in Benin, with 64 local branches, many inremote areas. For this reason there is widespread pressure onthe bank to offer payment services, since its extensive networkoffers a unique opportunity to transfer funds from the capitalcity, Cotonou, to some very distant villages. The demand forpayment services comes from a variety of actors. Memberclients are interested because this service would help them re-ceive remittances or transfer money to relatives. Government
and donors who work closely with farmers or poor communi-ties are also interested, because they would be able to transfersubsidy payments.For now the federation does not have the management
capability to offer payment services. In addition, Article 24of the regulatory framework for credit unions (known as thePARMEC or Programme d’appui à la réglementation desMutuelles d’épargne et de Crédit law) does not allow theseinstitutions to transfer funds or offer checks which stronglylimits the possibility of offering payment services.
Box 3.11 Demand for Payment Services at the Fédération des Caisses d’Epargne et de Crédit Agricole Mutuel, Benin
Source: Fruman 1997.
SMART CARDS ARE A NEW FINANCIAL TECHNOLOGY PIONEERED
by the Growth Trust Corporation, a for-profit affiliate ofSwazi Business Growth Trust, with the assistance ofDevelopment Alternatives, Inc. and the U.S. Agency forInternational Development.Commercial banks in Swaziland are not interested in
providing financial services to trust customers due to thehigh transaction costs of servicing these small businesses.The Growth Trust Corporation was thus established to pro-vide financial services in the form of housing loans andsmall business loans. To minimize administrative and oper-ating costs, the corporation introduced the smart card. Eachcustomer is issued a smart card with a memory chip on itssurface containing information about the amount of theline of credit the client has obtained. Commercial banks are
provided with the equipment to read the cards, and SwaziBusiness Growth Trust clients can draw funds and makerepayments at various commercial bank branches inSwaziland. A smart card transaction takes a fraction of thetime of a regular teller transaction. The Growth TrustCorporation holds a line of credit with participating banksand collects transaction information from the banks at theend of the day.Smart cards enable the trust to monitor disbursements
and repayments easily. The trust plans to move the smartcard network on line in commercial banks once the Swazitelephone system allows. Commercial banks are willing toprovide this service free of charge because the trust is anonprofit organization and targets a different, low-incomeclientele.
Box 3.10 Swazi Business Growth Trust Smart Cards
Source:McLean and Gamser 1995.
Perhaps more than any other economic transaction,financial intermediation depends on social capital,because it depends on trust between the borrower andthe lender. Where neither traditional systems nor mod-ern institutions provide a basis for trust, financial inter-mediation systems are difficult to establish.Social intermediation can thus be understood as the
process of building the human and social capital requiredfor sustainable financial intermediation with the poor.MFIs that provide social intermediation services most
often do so through groups, but some also work withindividuals. The following discussion focuses primarily ongroup-based social intermediation, including approachesthat lend directly to groups and those that lend to indi-vidual members of groups. Loosely defined, “groups”include small solidarity groups (such as those found inACCION and Grameen lending models) as well as largecredit-unions or caisses villageois. Where relevant, indi-vidual-based social intermediation services are alsodiscussed.Group social intermediation is defined as the effort to
build the institutional capacity of groups and invest in thehuman resources of their members, so that they can beginto function more on their own with less help from out-side. This aspect of social intermediation responds to thegrowing awareness that some of the poor—especiallythose in remote, sparsely populated areas or where levelsof social capital are low—are not ready for sustainable
financial intermediation without first receiving somecapacity-building assistance.There is a range of capacity-building that can take place
with social intermediation. Some MFIs simply focus ondeveloping group cohesiveness to ensure that memberscontinue to guarantee each other’s loans and benefit asmuch as possible from networking and the empowermentthat comes from being part of a group. Other MFIs seekto develop a parallel financial system whereby the groupactually takes over the financial intermediation process(box 3.12). This often happens with the group first man-aging its own internal savings funds and then later takingon the lending risk and banking duties associated with on-lending external funds. This aspect of social interme-diation mostly involves training group members inparticipatory management, accounting, and basic financialmanagement skills and helping groups to establish a goodrecord-keeping system. This often requires initial subsidiessimilar to the time-bound subsidies required for financialintermediation (figure 3.2).Ultimately, it is the groups’ cohesiveness and self-man-
agement capacity that enables them to lower the costs offinancial intermediation by reducing default through peerpressure—and consequently to lower the transaction coststhat MFIs incur in dealing with many small borrowers andsavers (Bennett, Hunte, and Goldberg 1995).However, not all social intermediation results in the
formation of groups, nor is it always provided by the
P R O D U C T S A N D S E R V I C E S 77
STARTED IN 1985 AS AN EXPERIMENT IN COMMUNITY DEVEL-opment with a program for women’s savings and credit inCosta Rica, the village banking model has become an increas-ingly popular model for providing poor women with accessto financial services. FINCA, CARE, Catholic Relief Services,Freedom From Hunger, and a host of local nongovernmentalorganizations (NGOs) have begun to implement villagebanks throughout Latin America, Africa, and Asia. The SmallEnterprise Education and Promotion Network (SEEP)recently reported that there are “over 3,000 banks associatedwith SEEP members and their partners serving close to34,000 members, 92 percent of whom are women. Averageloan sizes are $80 and the collective portfolio stands atapproximately $8.5 million.”
The model usually establishes a parallel system managedby elected leaders, although there are an increasing numberof cases of village banks initiating relationships with formalsector financial institutions or federating into apex organiza-tions. The village bank provides a joint liability system for its25 to 50 members and also acts as a secure savings facility.Individual members accumulate savings, which eventuallybecome their own source of investment capital.The “rules of the game” for membership—meeting atten-
dance, savings, credit, and nonfinancial services—are devel-oped by the women themselves, usually with guidance froman NGO field worker. Enforcement of credit contracts is theresponsibility of the leaders, with member support. (For moreinformation on village banking, see appendix 1.)
Box 3.12 Village Banks: An Example of a Parallel System
Source: Bennett 1997.
2. This section is based on writings by Lynn Bennett between 1994 and 1997.
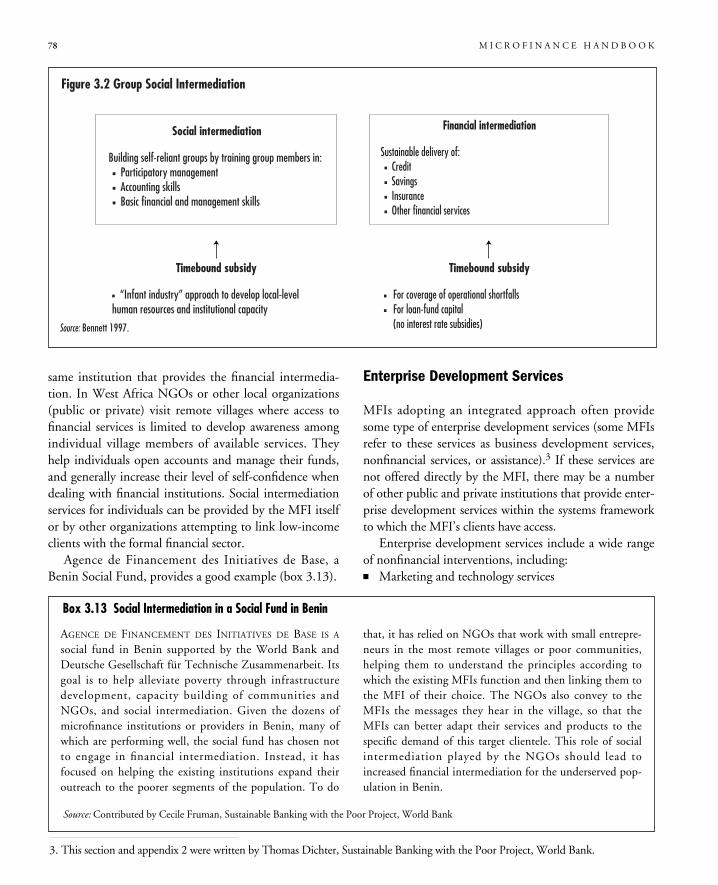
same institution that provides the financial intermedia-tion. In West Africa NGOs or other local organizations(public or private) visit remote villages where access tofinancial services is limited to develop awareness amongindividual village members of available services. Theyhelp individuals open accounts and manage their funds,and generally increase their level of self-confidence whendealing with financial institutions. Social intermediationservices for individuals can be provided by the MFI itselfor by other organizations attempting to link low-incomeclients with the formal financial sector.Agence de Financement des Initiatives de Base, a
Benin Social Fund, provides a good example (box 3.13).
Enterprise Development Services
MFIs adopting an integrated approach often providesome type of enterprise development services (some MFIsrefer to these services as business development services,nonfinancial services, or assistance).3 If these services arenot offered directly by the MFI, there may be a numberof other public and private institutions that provide enter-prise development services within the systems frameworkto which the MFI’s clients have access.Enterprise development services include a wide range
of nonfinancial interventions, including:� Marketing and technology services
78 M I C R O F I N A N C E H A N D B O O K
Figure 3.2 Group Social Intermediation
Source: Bennett 1997.
AGENCE DE FINANCEMENT DES INITIATIVES DE BASE IS Asocial fund in Benin supported by the World Bank andDeutsche Gesellschaft für Technische Zusammenarbeit. Itsgoal is to help alleviate poverty through infrastructuredevelopment, capacity building of communities andNGOs, and social intermediation. Given the dozens ofmicrofinance institutions or providers in Benin, many ofwhich are performing well, the social fund has chosen notto engage in financial intermediation. Instead, it hasfocused on helping the existing institutions expand theiroutreach to the poorer segments of the population. To do
that, it has relied on NGOs that work with small entrepre-neurs in the most remote villages or poor communities,helping them to understand the principles according towhich the existing MFIs function and then linking them tothe MFI of their choice. The NGOs also convey to theMFIs the messages they hear in the village, so that theMFIs can better adapt their services and products to thespecific demand of this target clientele. This role of socialintermediation played by the NGOs should lead toincreased financial intermediation for the underserved pop-ulation in Benin.
Box 3.13 Social Intermediation in a Social Fund in Benin
Source: Contributed by Cecile Fruman, Sustainable Banking with the Poor Project, World Bank
3. This section and appendix 2 were written by Thomas Dichter, Sustainable Banking with the Poor Project, World Bank.
� Business training (box 3.14)� Production training� Subsector analysis and interventions.The most common providers of enterprise develop-
ment services to date have been:� NGOs running microfinance projects with integratedapproaches
� Training institutes� Networks� Universities� Private firms (training companies, bilateral aid agencysubcontractors)
� Producer groups (or chambers of commerce)� Government agencies (small business assistance,export promotion bureaus)
� Informal networks providing production trainingthrough apprenticeships.Studies sponsored by the U.S. Agency for
International Development in the late 1980s found that
enterprise development service programs could be divid-ed into:� Enterprise formation programs, offering training insector-specific skills such as weaving as well as trainingfor persons who might start up such businesses
� Enterprise transformation programs, providing technicalassistance, training, and technology to help existingmicroenterprises make a quantitative and qualitativeleap in terms of scale of production and marketing.An additional distinction is between direct and indi-
rect services, which has to do with the interactionbetween the provider of services and the enterprises(box 3.15). Direct services are those that bring theclient in contact with the provider. Indirect services arethose that benefit the client without such direct con-tact, as in policy-level interventions.All enterprise development services have as their
goal the improved performance of the business athand, which in turn improves the financial conditionof the owner or operator. In a sense, enterprise devel-opment services are a residual or catch-all category—they can be almost everything except financial services.As a result, they are a far broader and more complexarena in which to work than credit and savings (box3.16).Some experts suggest that enterprise development
services be provided by a different institution than theone providing financial services. However, if an MFIchooses to provide such services, they should be clearlyseparated from other activities and accounted for sepa-rately. Furthermore, enterprise development services
P R O D U C T S A N D S E R V I C E S 79
Box 3.14 Business Skills Training
FUNDACIÓN CARVAJAL IN COLOMBIA PROVIDES SHORTpractical courses in a range of accounting, marketing, andmanagement topics adapted to microenterprise needs.Empretec in Ghana provides a two-tiered manage-
ment training course for microenterprise operators whoexhibit specific entrepreneurial characteristics and are will-ing to adopt new management attitudes and tools.
Source: Contributed by Thomas Dichter, Sustainable Bankingwith the Poor Project, World Bank.
Box 3.15 Direct and Indirect Business AdvisoryServices
THE BUSINESS WOMEN’S ASSOCIATION OF SWAZILANDvisits clients’ workshops on a regular basis to provide basicmanagement advice for a fee (direct services).Alternatively, the carpenters association in Oua-
gadougou, Burkina Faso, developed a promotionalbrochure to increase the number and size of contracts withsmall and medium-size firms and government agencies(indirect services).
Source: Contributed by Thomas Dichter, Sustainable Bankingwith the Poor Project, World Bank.
Box 3.16 Cattle Dealers in Mali
IN PAYS DOGON, MALI, AN MFI PROVIDING ENTERPRISEdevelopment services helped to organize a gathering withcattle dealers, where they identified their main need as areliable means of transportation to move cattle from the vil-lages to the towns. They decided to call a second meetingand invite some of the local truck owners to discuss theproblems and identify solutions. As a result, the cattle deal-ers started sharing truck loads to reduce costs. They alsobegan to pressure the truck owners to provide timely andhigh-quality transportation services.
Source: Contributed by Cecile Fruman, Sustainable Banking withthe Poor Project, World Bank.
should never be a requirement for obtaining financialservices.They should also be fee-based. While full cost recov-
ery may not be possible, the goal should be to generateas much revenue as possible to cover the costs of deliver-ing the services. This is why some traditional providers(such as government agencies) have been in this arena—they know that enterprise development services must besubsidized. The services will almost always involve sometype of subsidy, which has to be external to the enter-prises unless it is provided by groups of enterprises thatdevote a portion of their profits to keeping the servicesgoing. Even private firms (or bilateral aid agency sub-contractors) and universities usually provide enterprisedevelopment services under grants from foundationsand governments.Direct services to enterprises (such as entrepreneur-
ship and business skills training), the organization ofmicroenterprises into clusters, and so on require sensitivi-ty on the part of the provider to the circumstances ofpoor people, a capacity to stick with and work for longperiods in poor communities, and dedication to helpingthe poor. These characteristics are usually found amongpeople who work in NGOs.In general, enterprise development services are some-
what problematic, because even though the payoff can begreat, it is difficult to judge either the impact or the per-formance of the service provider itself. Enterprise devel-opment services projects do not generally involve moneyas a commodity, but rather the transfer of knowledge inthe form of skills, information, research, and analysis.The returns to the client as a result of this new knowl-edge are difficult to assess. Likewise, because the clientcannot measure the value of “knowledge” at the “point ofpurchase,” paying its full cost to the provider is rarelypossible.Certain studies have questioned the value of enter-
prise development services in the following areas:� Impact. Some studies have shown that in many casesthere is little difference in profits and efficiencybetween those microenterprises that received creditalone and those that received an integrated enterprisedevelopment services and credit package.
� Cost and impact. According to Rhyne and Holt(1994), “these [enterprise development service] pro-grams tend to fall into one of two patterns. Eitherthey have provided generic services to large numbers,
with little impact on the businesses; or they have pro-vided closely tailored assistance to a few enterprises,at high cost per beneficiary.”
� Outreach. A common complaint about enterprisedevelopment services is that women’s access tothese services is limited. A study by the UnitedNations Development Fund for Women in 1993found that only 11 percent of government-spon-sored business training slots went to women, dueto time conflicts between their work and house-hold responsibilities, the location (often distantfrom the village or slum), and bias in some formaltraining institutions against working with womenclients.The main response to these doubts is that enterprise
development services approaches are highly varied, andto date only a few of many possibilities have been tried.It is premature to conclude that these services have littleimpact or have inherent limits in terms of outreach. Norare there enough cases in which enterprise developmentservices are provided exclusively rather than as part of anintegrated package. However, they are likely most valu-able for larger microenterprises, since smaller ones areoften engaged in traditional activities that people knowhow to operate already. There is a high cost involved inproviding enterprise development services directly toindividual enterprises, but if the assisted business growsand creates significant employment, the long-term pay-offs can outweigh the initial cost. The dissenting viewsmentioned above refer only to the direct provision ofenterprise development services and do not take intoaccount the potential high returns accruing to indirectprovision.There has been little documentation of the results
and outcomes of enterprise development servicesbecause these services often have been part of inte-grated approaches. And unlike financial services, thewide range of approaches and strategies possibleunder the rubric of enterprise development servicesmeans that there are fewer agreed techniques to belearned and adapted by MFIs wishing to take thisapproach.Whether an MFI provides enterprise development
services depends on its goals, vision, and ability toattract donor funds to subsidize the costs. (See appendix2 for more information about enterprise developmentservices.)
80 M I C R O F I N A N C E H A N D B O O K
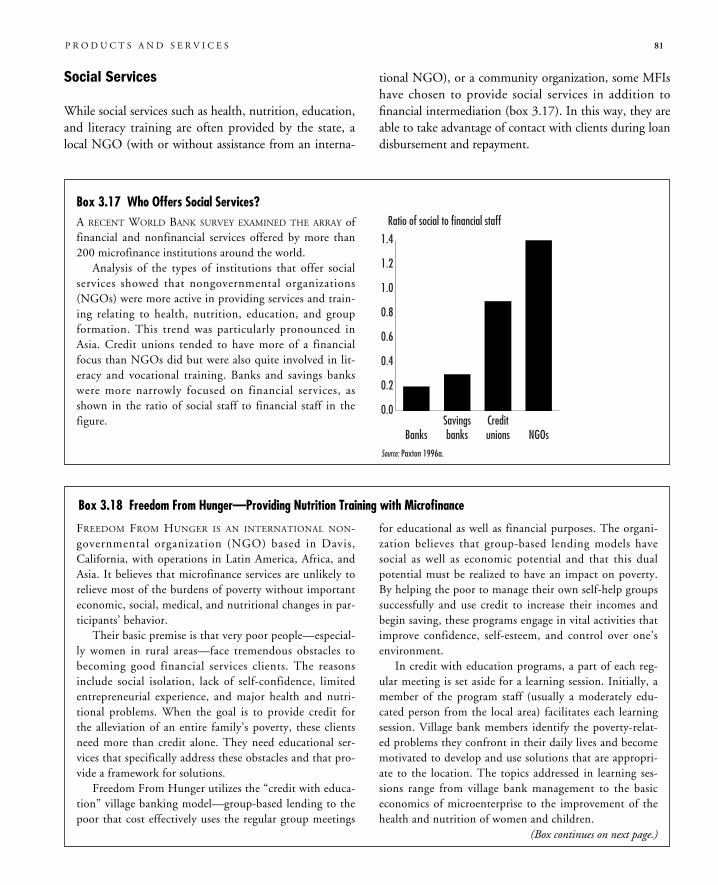
Social Services
While social services such as health, nutrition, education,and literacy training are often provided by the state, alocal NGO (with or without assistance from an interna-
tional NGO), or a community organization, some MFIshave chosen to provide social services in addition tofinancial intermediation (box 3.17). In this way, they areable to take advantage of contact with clients during loandisbursement and repayment.
P R O D U C T S A N D S E R V I C E S 81
Box 3.17 Who Offers Social Services?A RECENT WORLD BANK SURVEY EXAMINED THE ARRAY offinancial and nonfinancial services offered by more than200 microfinance institutions around the world.Analysis of the types of institutions that offer social
services showed that nongovernmental organizations(NGOs) were more active in providing services and train-ing relating to health, nutrition, education, and groupformation. This trend was particularly pronounced inAsia. Credit unions tended to have more of a financialfocus than NGOs did but were also quite involved in lit-eracy and vocational training. Banks and savings bankswere more narrowly focused on financial services, asshown in the ratio of social staff to financial staff in thefigure.
Source: Paxton 1996a.
0.0
0.2
0.4
0.6
0.8
1.0
1.2
1.4
NGOsCreditunions
SavingsbanksBanks
Ratio of social to financial staff
FREEDOM FROM HUNGER IS AN INTERNATIONAL NON-governmental organization (NGO) based in Davis,California, with operations in Latin America, Africa, andAsia. It believes that microfinance services are unlikely torelieve most of the burdens of poverty without importanteconomic, social, medical, and nutritional changes in par-ticipants’ behavior.Their basic premise is that very poor people—especial-
ly women in rural areas—face tremendous obstacles tobecoming good financial services clients. The reasonsinclude social isolation, lack of self-confidence, limitedentrepreneurial experience, and major health and nutri-tional problems. When the goal is to provide credit forthe alleviation of an entire family’s poverty, these clientsneed more than credit alone. They need educational ser-vices that specifically address these obstacles and that pro-vide a framework for solutions.Freedom From Hunger utilizes the “credit with educa-
tion” village banking model—group-based lending to thepoor that cost effectively uses the regular group meetings
for educational as well as financial purposes. The organi-zation believes that group-based lending models havesocial as well as economic potential and that this dualpotential must be realized to have an impact on poverty.By helping the poor to manage their own self-help groupssuccessfully and use credit to increase their incomes andbegin saving, these programs engage in vital activities thatimprove confidence, self-esteem, and control over one’senvironment.In credit with education programs, a part of each reg-
ular meeting is set aside for a learning session. Initially, amember of the program staff (usually a moderately edu-cated person from the local area) facilitates each learningsession. Village bank members identify the poverty-relat-ed problems they confront in their daily lives and becomemotivated to develop and use solutions that are appropri-ate to the location. The topics addressed in learning ses-sions range from village bank management to the basiceconomics of microenterprise to the improvement of thehealth and nutrition of women and children.
Box 3.18 Freedom From Hunger—Providing Nutrition Training with Microfinance
(Box continues on next page.)
As in the case of enterprise development services, thedelivery and management of social services should be keptas distinct as possible from the delivery and managementof financial intermediation services. This does not meanthat social services cannot be provided during group meet-ings, but they must be clearly identified as separate fromcredit and savings services. Furthermore, it is not reason-able to expect that revenue generated from financial inter-mediation will always cover the costs of delivering socialservices. Rather, the delivery of social services will mostlikely require ongoing subsidies. MFIs that choose to pro-vide social services must be clear about the costs incurredand must ensure that the donors supporting the MFIunderstand the implications of providing these services.Freedom From Hunger provides an example of an
international NGO that provides social services in conjunc-tion with financial intermediation (box 3.18).
Appendix 1. Microfinance Approaches
The following pages provide information on some of themost well-known microfinance approaches. Theapproaches presented are:� Individual lending� Grameen Bank solidarity lending
� Latin American solidarity group lending� Village banking� Self-reliant village banks.While microfinance approaches generally include
some specific product design issues, a primary means ofdifferentiating one approach from another is in thechoice of products and services provided and the man-ner in which provision is made. Any approach must bebased on the target market and its demand for financialintermediation, as well as other products, contextual fac-tors in the country, and the objectives and institutionalstructure of the MFI. These approaches do not operatein isolation. Many of them rely on other institutions(either public or private) to provide additional servicesso that the targeted clients can effectively utilize finan-cial services.The Grameen Trust supports replicators of the
Grameen Bank model around the world with funding andtechnical assistance. However, the Grameen Trust willonly support MFIs that replicate exactly the model fortheir first two years as it is implemented in Bangladesh.Grameen believes that their model is successful because ofall of its elements and that if some are rejected or changed,the MFI might fail. After two years of operations replica-tors are allowed to introduce changes if they feel that someelements must be adapted to the local context.
82 M I C R O F I N A N C E H A N D B O O K
Freedom From Hunger is committed to achieving fullrecovery of operating and financial costs with interest rev-enue from loans to village banks. However, Freedom FromHunger and other credit with education practitioners(Catholic Relief Services, Katalysis, Plan International, andWorld Relief, among others) differ in their attitudes towardcovering the costs of education with revenue from creditoperations. Some have separate field agents to providefinancial services and educational services to the same villagebank. They regard education as a social service that can andshould be subsidized by grants or government taxes andthey also believe that the skills required for delivering effec-tive education and financial services are too many and toovaried for a single field agent. Other practitioners try tominimize the marginal cost of education by training andsupporting each field agent to provide both financial and
education services to the same village bank. These practi-tioners limit the number, scope, and time allocation fortopics to be addressed, maintaining that the marginal costof education is low enough for reasonable interest charges tocover the costs of both financial and educational services.They also believe that the marginal cost of education can belegitimately charged to the village banks, because it makesthe members better financial service clients by improvingtheir family survival skills, productivity, and managementskills.Practitioners of credit with education believe that
there may also be a cost to not providing education, suchas epidemic outbreaks, loan growth stagnation, and mem-ber dropout due to illness of children. Comparison stud-ies are currently going on to determine the impact ofcredit with education programs.
Box 3.18 Freedom From Hunger—Providing Nutrition Training with Microfinance (Continued)
Source: Freedom From Hunger 1996.
Other practitioners are strongly in favor of adapta-tion. They believe that there is no single model appro-priate for all situations and that every model must beadapted to the local context to fit local needs. Thisrequires that MFIs be flexible and creative. ACCIONhas been successful in adapting their solidarity grouplending model to varying contexts.
Individual Lending
Individual lending is defined as the provision of credit toindividuals who are not members of a group that is joint-ly responsible for loan repayment. Individual lendingrequires frequent and close contact with individualclients to provide credit products tailored to the specificneeds of the business. It is most successful for larger,urban-based, production-oriented businesses and forclients who have some form of collateral or a willingcosigner. In rural areas, individual lending can also besuccessful with small farmers.
METHOD. Clients are individuals working in the informalsector who need working capital and credit for fixedassets. Credit officers usually work with a relatively smallnumber of clients (between 60 and 140) and developclose relationships with them over the years, often pro-viding minimal technical assistance. Loan amounts andterms are based on careful analysis by the credit officer.
Interest rates are higher than formal sector loans butlower than informal sector loans. Most MFIs requiresome form of collateral or cosignatories. Compulsory sav-ings usually are not required.Detailed financial analysis and projections are often
included with the loan application. The amount andterms are negotiated with the client and the credit offi-cer’s supervisor or other credit officers. Documentationis required, including a loan contract; details regardingthe clients references; if applicable, a form signed by thecosigner and his or her personal information; and legaldeeds to assets being pledged and credit history. Creditofficers are often recruited from the community so thatthey can base their analysis on their knowledge of theclient’s creditworthiness (character-based lending).The loan is usually disbursed at the branch office. A
visit is often made to the client’s place of business toverify that the client has made the purchases specifiedin the loan contract. Periodic payments are made at thebranch or through preapproved payments.
PRODUCTS. Loan sizes can vary from US$100 toUS$3,000 with terms between six months and fiveyears. Savings may or may not be provided dependingon the institutional structure of the MFI. Training andtechnical assistance may be provided by credit officers;sometimes training is provided on a per-fee-basis or ismandatory.
SIGNIFICANT EXAMPLES. These include ADEMI in theDominican Republic; Caja Municipales in Peru; BankRakyat Indonesia; Agence de Credit pour l’EnterprisePrivée in Senegal; Alexandria Business Association inEgypt; Self-Employed Women’s Association in India;Fédération des Caisses d’Epargne et de Crédit AgricoleMutuel in Benin; and Caja Social in Colombia.
APPROPRIATE CLIENTS. Clients are urban enterprises orsmall farmers, including both men and women, andmay be medium-income small businesses, microbusi-nesses, and production enterprises.
Grameen Solidarity Group Lending
This lending model was developed by the GrameenBank of Bangladesh to serve rural, landless women wish-ing to finance income-generating activities. This model
P R O D U C T S A N D S E R V I C E S 83
Box A3.1.1 Training for Replicators in West AfricaIN WEST AFRICA AN INNOVATIVE TRAINING CYCLE HAS
been set up for African replicators (Itinéraire de Formation-Diffusion). The total cycle lasts for seven months, duringwhich time replicators receive a month of formal trainingand spend four months on three different MFI sites, wherethey participate fully in the institution’s activities. Duringthe last three months, the trainees design their own MFI,drawing on the experience they have acquired in the fieldand the knowledge they have of their home market. Withsuch a process the newly established MFIs can become asynthesis of several successful programs. After the initialtraining the replicators receive ongoing technical assistanceand follow-up from the model programs.
Source: Contributed by Cecile Fruman, Sustainable Banking withthe Poor Project, World Bank.
84 M I C R O F I N A N C E H A N D B O O K
is prevalent mostly in Asia but has been replicated inother contexts. Grameen Trust has more than 40 repli-cators in Asia, Africa, and Latin America.
METHOD. Peer groups of five unrelated members areself-formed and incorporated into village “centers” ofup to eight peer groups. Attendance at weekly meetingsand weekly savings contributions, group fund contribu-tions, and insurance payments are mandatory. Savingsmust be contributed for four to eight weeks prior toreceiving a loan and must continue for the duration ofthe loan term. The group fund is managed by the groupand may be lent out within the group. Group membersmutually guarantee each other’s loans and are heldlegally responsible for repayment by other members.No further loans are available if all members do notrepay their loans on time. No collateral is required.Mandatory weekly meetings include self-esteem build-ing activities and discipline enforcement.Loans are made to individuals within the group by
the local credit officer at the weekly meetings. However,only two members receive loans initially. After a periodof successful repayment, two more members receiveloans. The final member receives her loan after anotherperiod of successful repayment. Grameen typically pro-vides precredit orientation but minimal technical assis-tance. Loan appraisal is performed by group membersand center leaders. Branch staff verify information andmake periodic visits to client businesses. Credit officersusually carry between 200 and 300 clients.
PRODUCTS. Credit is for six months to one year andpayments are made weekly. Loan amounts are usuallyfrom US$100 to US$300. Interest rates are 20 percenta year. Savings are compulsory.
SIGNIFICANT EXAMPLES. These include Grameen Bankand Bangladesh Rural Advancement Committee inBangladesh; Tulay sa Pag-Unlad, Inc. and ProjectDungganon in the Philippines; Sahel Action in BurkinaFaso; and Vietnam Women’s Union.
APPROPRIATE CLIENTELE. Clients are from rural or urban(densely populated) areas and are usually (although notexclusively) women from low-income groups (meanstests are applied to ensure outreach to the very poor)pursuing income-generating activities.
Latin American Solidarity Group Lending
The solidarity group lending model makes loans toindividual members in groups of four to seven. Themembers cross-guarantee each other’s loans to replacetraditional collateral. Clients are commonly femalemarket vendors who receive very small, short-termworking capital loans. This model was developed byACCION International in Latin America and has beenadapted by many MFIs.
METHOD. Customers are typically informal sector microbusi-nesses, such as merchants or traders who need smallamounts of working capital. Group members collectivelyguarantee loan repayment, and access to subsequent loans isdependent on successful repayment by all group members.Payments are made weekly at the program office. Themodel also incorporates minimal technical assistance to theborrowers, such as training and organization building.Credit officers generally work with between 200 and 400clients and do not normally get to know their clients verywell. Loan approval is by the credit officers based on mini-mal economic analysis of each loan request. Loan disburse-ment is made to the group leader at the branch office, whoimmediately distributes to each individual member. Creditofficers make brief, occasional visits to individual clients.Group members normally receive equal loan amounts,
with some flexibility provided for subsequent loans. Loanamounts and terms are gradually increased once clientsdemonstrate the ability to take on larger amounts of debt.Loan applications are simple and are reviewed quickly.Savings are usually required but are often deducted fromthe loan amount at the time of disbursement rather thanrequiring the clients to save prior to receiving a loan.Savings serve primarily as a compensating balance, guar-anteeing a portion of the loan amount.
PRODUCTS. Initial loan amounts are generally betweenUS$100 and US$200. Subsequent loans have no upperlimit. Interest rates are often quite high and service feesare also charged. Savings are usually required as a por-tion of the loan; some institutions encourage establish-ing intragroup emergency funds to serve as a safety net.Very few voluntary savings products are offered.
SIGNIFICANT EXAMPLES. These include ACCION affili-ates: PRODEM, BancoSol Bolivia; Asociación Grupos
Solidarios de Colombia; and Genesis and PROSEM inGuatemala.
APPROPRIATE CLIENTELE. Clients are mostly urban andinclude both men and women who have small to medi-um incomes (microbusinesses, merchants, or traders).
Village Banking
Village banks are community-managed credit and sav-ings associations established to provide access to financialservices in rural areas, build a community self-helpgroup, and help members accumulate savings (Otero andRhyne 1994). The model was developed in the mid-1980s by the Foundation for International CommunityAssistance (FINCA). Membership in a village bank usu-ally ranges from 30 to 50 people, most of whom arewomen. Membership is based on self-selection. The bankis financed by internal mobilization of members’ funds aswell as loans provided by the MFI.
METHOD. A village bank consists of its membership anda management committee, which receives training fromthe sponsoring MFI. The sponsoring MFI lends seedcapital (external account) to the bank, which then lendson the money to its members. All members sign theloan agreement to offer a collective guarantee. The loanamount to the village bank is based on an aggregate ofall individual members’ loan requests. Although theamount varies between countries, first loans are typical-ly short term (four to six months) and are smallamounts ($50), to be repaid in weekly installments.The amount of the second loan is determined by thesavings a member has accumulated during the first loanperiod through weekly contributions. The methodologyanticipates that the members will save a minimum of20 percent of the loan amount per cycle (internalaccount). Loans from the internal account (membersavings, interest earnings) set their own terms, whichare generally shorter, and their own interest rates,which are generally much higher. Loans to the villagebanks are generally provided in a series of fixed cycles,usually 10 to 12 months each, with lump-sum pay-ments at the end of each cycle. Subsequent loanamounts are linked to the aggregate amount saved byindividual bank members. Village banks have a highdegree of democratic control and independence.
Regular weekly or monthly meetings are held to collectsavings deposits, disburse loans, attend to administra-tive issues, and, if applicable, continue training with theMFI officer.
PRODUCTS. Members’ savings are tied to loan amountsand are used to finance new loans or collective income-generating activities. No interest is paid on savings.However, members receive a share from the bank’srelending or investment profits. The dividend distributedis directly proportional to the amount of savings eachindividual has contributed to the bank.Loans have commercial rates of interest (1 to 3 per-
cent per month) and higher rates if from an internalaccount. Some banks have broadened service delivery toinclude education about agricultural innovations, nutri-tion, and health.
SIGNIFICANT EXAMPLES. These include FINCA inMexico and Costa Rica; CARE in Guatemala; Save TheChildren in El Salvador; Freedom From Hunger inThailand, Burkina Faso, Bolivia, Mali, and Ghana; andCatholic Relief Services in Thailand and Benin. Theoriginal model has been adapted in a variety of ways. InFINCA in Costa Rica committee members take on thetasks of bank teller and manager. Catholic ReliefServices works through local NGOs. Freedom FromHunger in West Africa works directly with credit unionsin order to help them increase their membership amongwomen. Its clients graduate to the credit union.
APPROPRIATE CLIENTELE. Clients are usually from rural orsparsely populated but sufficiently cohesive areas. Theyhave very low incomes but with savings capacity, and arepredominantly women (although the program is alsoadequate for men or mixed groups).
Self-Reliant Village Banks (Savings and LoansAssociations)
Self-reliant village banks are established and managed byrural village communities. They differ from villagebanks in that they cater to the needs of the village as awhole, not just a group of 30 to 50 people. This modelwas developed by a French NGO, the Centre forInternational Development and Research, in the mid-1980s.
P R O D U C T S A N D S E R V I C E S 85
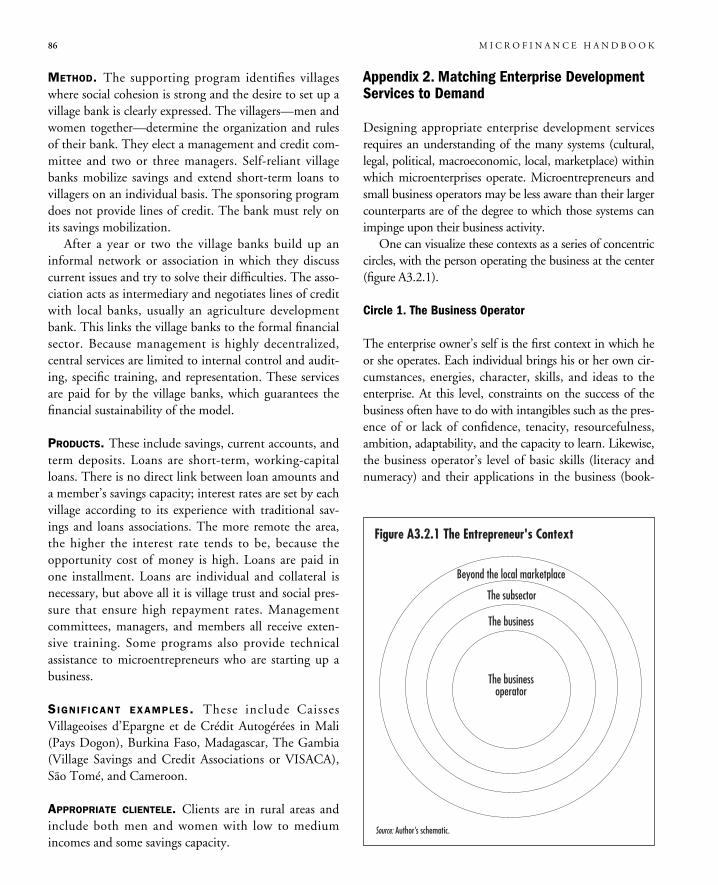
METHOD. The supporting program identifies villageswhere social cohesion is strong and the desire to set up avillage bank is clearly expressed. The villagers—men andwomen together—determine the organization and rulesof their bank. They elect a management and credit com-mittee and two or three managers. Self-reliant villagebanks mobilize savings and extend short-term loans tovillagers on an individual basis. The sponsoring programdoes not provide lines of credit. The bank must rely onits savings mobilization.After a year or two the village banks build up an
informal network or association in which they discusscurrent issues and try to solve their difficulties. The asso-ciation acts as intermediary and negotiates lines of creditwith local banks, usually an agriculture developmentbank. This links the village banks to the formal financialsector. Because management is highly decentralized,central services are limited to internal control and audit-ing, specific training, and representation. These servicesare paid for by the village banks, which guarantees thefinancial sustainability of the model.
PRODUCTS. These include savings, current accounts, andterm deposits. Loans are short-term, working-capitalloans. There is no direct link between loan amounts anda member’s savings capacity; interest rates are set by eachvillage according to its experience with traditional sav-ings and loans associations. The more remote the area,the higher the interest rate tends to be, because theopportunity cost of money is high. Loans are paid inone installment. Loans are individual and collateral isnecessary, but above all it is village trust and social pres-sure that ensure high repayment rates. Managementcommittees, managers, and members all receive exten-sive training. Some programs also provide technicalassistance to microentrepreneurs who are starting up abusiness.
SIGNIFICANT EXAMPLES. These include CaissesVillageoises d’Epargne et de Crédit Autogérées in Mali(Pays Dogon), Burkina Faso, Madagascar, The Gambia(Village Savings and Credit Associations or VISACA),São Tomé, and Cameroon.
APPROPRIATE CLIENTELE. Clients are in rural areas andinclude both men and women with low to mediumincomes and some savings capacity.
Appendix 2. Matching Enterprise DevelopmentServices to Demand
Designing appropriate enterprise development servicesrequires an understanding of the many systems (cultural,legal, political, macroeconomic, local, marketplace) withinwhich microenterprises operate. Microentrepreneurs andsmall business operators may be less aware than their largercounterparts are of the degree to which those systems canimpinge upon their business activity.One can visualize these contexts as a series of concentric
circles, with the person operating the business at the center(figure A3.2.1).
Circle 1. The Business Operator
The enterprise owner’s self is the first context in which heor she operates. Each individual brings his or her own cir-cumstances, energies, character, skills, and ideas to theenterprise. At this level, constraints on the success of thebusiness often have to do with intangibles such as the pres-ence of or lack of confidence, tenacity, resourcefulness,ambition, adaptability, and the capacity to learn. Likewise,the business operator’s level of basic skills (literacy andnumeracy) and their applications in the business (book-
86 M I C R O F I N A N C E H A N D B O O K
Figure A3.2.1 The Entrepreneur's Context
Beyond the local marketplace
The businessoperator
The business
The subsector
Source: Author’s schematic.
keeping, being able to read the maintenance instructionson a machine) will obviously make a difference. Some ofthese needs are addressed through the provision of socialintermediation or social services.Beyond the entrepreneur’s self is the realm of knowl-
edge and skills that are directly related to the conduct ofbusiness. On the cusp of the second circle (the businessitself) the emphasis is still on the knowledge possessed bythe operator. Business skills training aimed at impartingbasics such as bookkeeping and record keeping usuallyinvolves fairly generic skills and thus lends itself to class-room teaching.For start-up businesses an enterprise development ser-
vice provider can introduce concepts of the market andcourses that provide opportunities for practice inbookkeeping and accounting, legal issues (registration),business planning, marketing, and pricing, as well as cus-tomer orientation.A program could, for example, help a woman shop-
keeper devise an inventory system and a simple worksheetto monitor operating costs. She also could maintain abook that lists those products her clients ask for that shedoes not currently sell.It is very important to know which entrepreneurs have
a chance to become successful. Accordingly, some tests ofcommitment and ambition can be imposed. One meth-ods is to have people pay or agree to pay later a portion oftheir profits to the service provider. Another is to not offerthe service until a certain level of business activity hasbeen reached.It is also important to differentiate between skills that
can successfully be imparted by teaching (the genericbusiness skills discussed above) and those that need to beimparted one-on-one in the business setting (see below).
Circle 2. The Business Itself
The second concentric circle surrounding the entrepre-neur is the business itself. This is where all operationstake place in the enterprise, from buying inputs to mak-ing and selling the product or service. At this level theproblems and constraints encountered begin to have asmuch to do with forces external to the operator as theydo with the operator’s knowledge.Enterprise development services provided directly to
the business tend to be less generic in nature and morecustom-tailored. Thus the cost of providing service rises.
At this level the service provider has to understand whatthe product or service is, how it is produced, what tech-nology is used, what human labor is involved, and whatthe inputs are. For example, if a tailor requires zippers orbuttons, how are they supplied and how are they inven-toried, if at all? If storage is required, how is that madeavailable? Is time being lost because regular machinerymaintenance is not scheduled properly or because partsthat wear out on a predictable basis are not stocked inanticipation of need? What about the employees or otherhuman input that the business depends on? Are theyfamily members? Are they paid? How are they paid? Dothey stay on? Or do they leave to become competitors?Can production be improved by changing the flow
of work itself or by changing the physical organizationof the work space? Is there waste that can be eliminatedor reduced? Would changes in the timing of productionor selling make a positive difference in the owner’s bot-tom line?Many changes that can be made within the enterprise
need to be brought to the attention of the entrepreneurby an outsider. That outsider can be an “expert” or advi-sor working for the enterprise development serviceprovider or a colleague in the same type of business.The many methods used in enterprise development ser-
vices at the business level range from on-site visits by a reg-ular business advisor to the creation of local walk-inbusiness advisory service offices and enterprise clusters orindustry networks. They may, even in the case of literateurban entrepreneurs, include advice that comes in printedform or that entrepreneurs can learn themselves, for exam-ple, by going through a stock set of questions that providethem with the equivalent of an “outsider’s viewpoint.”The more one moves away from one-on-one direct
enterprise development services to indirect service provi-sion the more likely it is that costs per client will go down.But in the case of indirect service provision, outcomes sim-ilar to those possible with direct service cannot be auto-matically achieved. Indirect services at the business levelcan also include industrial estates and business incubators.These can be set up on a commodity subsector basis, thatis, by concentrating enterprises that are in the same orrelated subsector (for example, woodworking) or that sharethe trait of being start-ups. The first benefit is that start-ups share the costs of receiving subsidies to cover the costsof infrastructure and basic services such as electricity,water, storage space, and machinery. By concentrating
P R O D U C T S A N D S E R V I C E S 87
businesses in the same place, enterprises also benefit fromexternal economies—the emergence of suppliers who pro-vide raw materials and components at a bulk price, newand second hand machinery and parts, and the emergenceof or access to a pool of workers with sector-specific skills.Sometimes the industrial estate or business incubator
provides intangible but equally important benefits tostart-ups by enabling the entrepreneurs to speak with eachother informally. This often builds confidence and fostersthe discovery of new solutions to problems. More tangi-bly, as start-ups mature and business grows, subcontract-ing arrangements within the incubator often develop.Unfortunately, industrial estates and business incuba-
tors have often failed. Many microenterprise operatorstry to avoid regulation and taxation, and they often seethe visibility involved in moving to an industrial estate orincubator as disincentives. Microenterprises often dependon walk-in clients, so moving out of low-income neigh-borhoods can mean losing customers. These are prob-lems that can be solved by paying more attention to thelocation of such incubators and estates. Overall, theproblems with these failed efforts often have had more todo with the fact that they have been started by govern-ment agencies without careful preparation, proper incen-tives for government workers, or the participation of theeventual users in their planning.
Circle 3. The Subsector
All businesses operate in the context of other businessesin the same subsector and sellers and suppliers of inputsand services to the subsector. A subsector is identifiedby its final product and includes all firms engaged inthe supply of raw materials, production, and distribu-tion of the product (Haggeblade and Gamser 1991).Subsector analysis describes the economic system of thebusinesses related to the final product and involves theprovision of both financial and nonfinancial services. Asubsector is defined as the full array of businessesinvolved in making and selling a product or group ofproducts, from initial input suppliers to final retailers.Typical areas of intervention include technology devel-opment, skill training, collective marketing or purchas-ing of inputs, and, in some cases, policy advocacy(Rhyne and Holt 1994). Examples of subsectors thatMFIs have developed are dairy, wool, sericulture, palmoil, and fisheries.
The subsector approach emphasizes (Rhyne and Holt1994, 33):� Market access. The subsector approach aims to identi-fy both the growing portions of subsector markets andthe barriers that must be overcome if small enterprisesare to gain access to those growth markets.
� Leverage. The approach aims for cost effectiveness byidentifying interventions that can affect large numbersof enterprises at one time, often through indirectrather than one-on-one mechanisms.
� Releasing constraints. Many of the most important con-straints it addresses are highly industry specific andthus are missed by “generic” enterprise development.Subsector analysis requires versatility in design and
flexible access to a wide range of skills. Institutions thatidentify subsector analysis as a means of intervention willneed to consider many issues.Common constraints at the subsector level are:
� Rising competition, as low barriers to entry allow newmicroenterprises into the marketplace
� Space for the market’s physical infrastructure, includ-ing warehousing
� The imposition of fees or solicitation of bribes bylocal authorities
� Transport availability, reliability, and cost� Input availability, if a commodity that the enterpriseneeds for production is not available regularly
� Lack of appropriate technology� Limits (permanent, cyclical, seasonal) in customerpurchasing power
� Lack of product diversity� Dominance by middlemen.For example, the structure of ownership of transport
may be something a group of enterprises could correct ifassisted by an enterprise development service provider. AU.S. NGO working in rural Zaire in the mid-1980shelped local farmers pool resources to form a shareholder-owned trucking company, which served producers whowere unable to make money because they faced exorbitanttransport fees. The service provider undertook the legalwork involved in setting up this company and helped toput together the finance plan for the first vehicle.Often the way things are purchased is a constraint
on efficiency. For example, in the second-hand clothingbusiness in much of Africa the quality of the balesvaries randomly. The buyer does not know what is inthe bale and cannot look inside before purchasing it.
88 M I C R O F I N A N C E H A N D B O O K
Accordingly, the buyer is often reluctant to pool-pur-chase bales with other sellers. However, if an enterprisedevelopment service provider were to come up with away of decreasing this risk (for example, by poolingpurchases and then creating a secondary distributionchannel whereby the contents of each repackaged balewould be known), this constraint could be overcome.Inputs are often a major problem, as are parts or the
sourcing of equipment. People may not know of avail-able alternative sources.Technology itself is often a constraint. New technolo-
gies can be developed that are custom-tailored to a specif-ic level of the subsector. Pricing can also be a constraint.In some subsectors, particularly retail petty trade in theurban developing world, price can be the only feature dif-ferentiating adjacent sellers (personality traits of the sellersexcepted). The goods are likely to be the same, and as oneseller is literally six inches away from the next, location isnot a factor. And yet price itself cannot vary much, if atall. By studying the supply of the commodity traded(shoes, for example) and the nature of its wholesaling, itmay be possible to form a buyers’ coop through whichpetty traders can reduce the price they pay and thus passon that savings to the consumer (although this competi-tive advantage may be short-lived).The timing of production of some commodities
affects price. Retail traders in fresh foods are often at themercy of the agricultural production cycle and do notknow how to balance the relationship between their sup-ply and the customers’ demand. Storage or value added(such as through drying) give the seller an edge on price.
EX P A N S I O N O F T H E R A N G E O F S U P P L I E R S A N D
CUSTOMERS. This can be done by clustering and net-working as well as by creating intermediaries or associa-tions. Indirect options in which the enterprisedevelopment service provider can help are the organiza-tion of trade fairs, collective promotional efforts, tradecoops, showroom and exhibition space, industrialestates, business incubation, and so forth. Poolingemployees or temporarily exchanging employees canloosen constraints in the labor market, and enterprisedevelopment service providers can act as brokers forsubcontracting between and among enterprises.
NETWORKING AND ENTREPRENEURS CLUBS. Cross-visitsand other forms of network clustering or industrial net-
works can change the parameters of the market.Encouraging entrepreneurs to work together and tocombine strengths is essential for the development ofmicroenterprises. Cooperation between firms, mutuallearning, and collective innovation can often expand amicroenterprise’s chances of increasing its market shareand profits. Some examples:� Sharing information on markets or suppliers� Setting up joint cooperatives� Bidding on contracts together� Sharing costs of holding a stand at a fair or market� Reducing costs of warehousing by splitting a facility.
MARKET INFRASTRUCTURE IMPROVEMENT. The WorldBank’s Southwest China Poverty Reduction Projectincludes construction of farmers’ markets to improve thelinks between low-income household producers in poorcounties in mountainous southwest China and transportcompanies from booming markets on the south Chinacoast.
Circle 4. Beyond the Local Marketplace
The last of the concentric circles surrounding the indi-vidual microentrepreneur is the largest and furthest awayfrom his or her enterprise. Here at the macro level theforces exerting constraints on the enterprise are indeedlarge. These can be at the country level, the regionallevel, and even the world trade level. They extendbeyond the marketplace and economic forces in generalto include:� National social and political forces (corruption, insta-bility, tribal rivalries, the admission or exclusion ofnonnative traders, investors, and suppliers) andgeopolitical forces (for example, the end of the influ-ence of cold war politics on Africa).
� Regulatory and policy forces and constraints. Lawsmay work for or against a sector (or subsector) or foronly one channel in a particular sector and againstanother channel in the same sector. Likewise, lawsaffect the way in which lenders operate (the presenceof a thorough and reliable collateral law will affect thenature of lending throughout the financial sector).Licensing requirements for businesses and taxationcan be important constraints.
� Macro-level market forces, such as the dynamism orweakness of other exporters of the same commodity
P R O D U C T S A N D S E R V I C E S 89
in other countries (for example, Ghana was a majorexporter of palm oil until surpassed by Malaysia) orthe availability of uniform containers in a country forthe micro-level retailers (in Kenya, for example, theproduction and selling of honey in the late 1980s wasnegatively affected by the lack of readily available,uniformly sized small containers).
� National and global labor market forces, includingchanges in migrant labor patterns (for example,Filipinos are no longer going to Saudi Arabia to work,thus changing the nature of competition in the start-upmicroenterprise arena in the Philippines); the nature ofthe workers’ prior education, especially in technicalskill areas; or the influence of cultural factors on peo-ple’s willingness to take certain kinds of jobs.
� Contiguous financial sector constraints and enablers,such as a viable insurance industry that can priceinsurance at a rate affordable for small businessesinvesting in capital equipment or vehicles.In general, the constraints that are the furthest away
are the hardest for entrepreneurs to do anything aboutand can be the most binding. They are the forces thatset limits and that may ultimately keep the transforma-tion of the microenterprises in a given sector from tak-ing place. The enterprise development service providermust understand these constraints even though they arethe hardest and most expensive to study, requiring a spe-cial capacity to analyze large forces and an investment inrigorous research. Once conclusions about these macro-level constraints are drawn, implementing real solutions
is also difficult and requires not just technical ability butoften political skill as well.Although there have been very few enterprise devel-
opment service providers who have operated at thislevel of intervention, the payoffs and multiplier effectscan, in theory, be great. A service provider working inthis way is clearly providing an indirect service to enter-prises, which the individual entrepreneur and evengroups of individuals banding together cannot providefor themselves.The enterprise development service provider can
undertake studies of the sector to identify hidden con-straints that are invisible to the individual entrepreneur orthat the entrepreneur knows about but cannot changewithout help.
Sources and Further Reading
Bennett, Lynn. 1993. “Developing Sustainable Financial Systemsfor the Poor: Where Subsidies Can Help and Where TheyCan Hurt.” Talking notes for the World Bank AGRAPSeminar on Rural Finance, May 26, Washington, D.C.
———. 1994. “The Necessity—and the Dangers—ofCombining Social and Financial Intermediation to Reachthe Poor.” Paper presented at a conference on FinancialServices and the Poor at the Brookings Institution,September 28–30, Washington, D.C.
———. 1997. “A Systems Approach to Social and FinancialIntermediation with the Poor.” Paper presented at theBanking with the Poor Network/World Bank Asia RegionalConference on Sustainable Banking with the Poor,November 3–7, Bangkok.
Bennett, L., P. Hunte, and M. Goldberg. 1995. “Group-Based Financial Systems: Exploring the Links betweenPerformance and Participation.” World Bank, AsiaTechnical Department, Washington, D.C.
Biswas, Arun, and Vijay Mahajan. 1997. “SEWA Bank.” CaseStudy for the Sustainable Banking with the Poor Project,World Bank, Washington, D.C.
Bratton, M. 1986. “Financing Smallholder Production: AComparison of Individual and Group Credit Schemes inZimbabwe.” Public Administration and Development (UK) 6(April/June): 115–32.
Caskey, John P. 1994. “Fringe Banking—Check-CashingOutlets, Pawnshops, and the Poor.” Russel Sage Foun-dation, New York.
Committee of Donor Agencies for Small EnterpriseDevelopment. 1998. “Business Development Service for
90 M I C R O F I N A N C E H A N D B O O K
Box A3.2.1 Policy Dialogue in El SalvadorIN THE MID-1980S A U.S. NONGOVERNMENTAL ORGANIZA-tion working with subsector studies in El Salvador identi-fied a government policy that inadvertently created importcompetition to rural small enterprises making henequenfibre rope. The government simply was not aware thatdomestic needs for cheap rope could be met with domesticproduction. After this study was brought to the attention ofthe government through “policy dialogue,” import regula-tions were changed to favor local producers. The initiallyhigh cost of undertaking the studies proved to be amortizedquickly once the lot of many local producers improved.
Source: Contributed by Thomas Dichter, Sustainable Bankingwith the Poor Project, World Bank.
SMEs: Preliminary Guidelines for Donor-FundedInterventions.” Private Sector Development, World Bank,Washington, D.C.
CGAP (Consultative Group to Assist the Poorest). 1997.“Introducing Savings in Microcredit Institutions: Whenand How?” Focus Note 8. World Bank, Washington, D.C.
Freedom From Hunger. 1996. “The Case for Credit withEducation.” Credit with Education Learning ExchangeSecretariat, Davis, California.
Fruman, Cecile. 1997. “FECECAM–Benin.” Case Study forthe Sustainable Banking with the Poor Project, WorldBank, Washington, D.C.
Goldmark, Lara, Sira Berte, and Sergio Campos. 1997.“Preliminary Survey Results and Case Studies on BusinessDevelopment Services for Microentrepreneurs.” Inter-American Development Bank, Social Programs andSustainable Development Department, MicroenterpriseUnit, Washington, D.C.
Haggeblade, J., and M. Gamser. 1991. “A Field Manual forSubsector Practitioners.” GEMINI Technical Note. U.S.Agency for International Development, Washington, D.C.
Huppi, M., and Gershon Feder. 1990. “The Role of Groupsand Credit Cooperatives in Rural Lending.” World BankResearch Observer (International) 5 (2): 187–204.
Krahnen, Jan Pieter, and Reinhard H. Schmidt. 1994.Development Finance as Institution Building: A NewApproach to Poverty-Oriented Lending. Boulder, Colo.:Westview Press.
Ledgerwood, Joanna, and Jill Burnett. 1995. “IndividualMicro-Lending Research Project: A Case Study Review—ADEMI.” Calmeadow, Toronto, Canada.
McLean, Doug, and Matt Gamser. 1995. “Hi-Tech at theFrontier: Reducing the Transaction Cost of Lending inSwaziland with the Smart Card.” Seminar Abstract 5,
Sustainable Banking with the Poor Project, World Bank,Washington, D.C.
Nelson, Candace, Barbara McNelly, Kathleen Stack, andLawrence Yanovitch. 1995. Village Banking: The State ofPractice. The SEEP Network. New York: PactPublications.
Otero, Maria, and Elizabeth Rhyne. 1994. The New World ofMicroenterprise Finance: Building Healthy Financial Institutionsfor the Poor.West Hartford, Conn.: Kumarian Press.
Paxton, Julia. 1996a. “A Worldwide Inventory of MicrofinanceInstitutions.” World Bank, Sustainable Banking with thePoor Project, Washington, D.C.
———. 1996b. “Determinants of Successful Group LoanRepayment: An Application to Burkina Faso.” Ph.D. diss.,Department of Agricultural Economics and RuralSociology, Ohio State University, Columbia.
Puhazhendhi, V. 1995. “Transaction Costs of Lending to theRural Poor: Non-Governmental Organizations and Self-helpGroups of the Poor as Intermediaries for Banks in India.”Foundation for Development Cooperation, Brisbane, Australia.
Rhyne E., and S. Holt. 1994. “Women in Finance andEnterprise Development.” Education and Social PolicyDiscussion Paper 40. World Bank, Washington, D.C.
Von Pischke, J.D. 1991. Finance at the Frontier: Debt Capacityand the Role of Credit in the Private Economy. World Bank,Economic Development Institute. Washington, D.C.
Waterfield, Charles, and Ann Duval. 1996. CARE Savings andCredit Sourcebook. Atlanta, Ga.: CARE.
Women’s World Banking. 1996. Resource Guide to BusinessDevelopment Service Providers. New York.
Yaron, Jacob, McDonald Benjamin, and Gerda Piprek. 1997.“Rural Finance Issues, Design and Best Practices.” WorldBank, Agriculture and Natural Resources Department,Washington, D.C.
P R O D U C T S A N D S E R V I C E S 91

93
The Institution
C H A P T E R F O U R
In chapter 3 we introduced the “Systems Framework”in which different institutions can be involved in pro-viding the services demanded by low-income clients.
In this chapter the focus is on the primary institution thatprovides financial services, its institutional structure, andits capacity to meet the demands of its clients.The majority of MFIs are created as nongovernmental
organizations (NGOs). However, as the field of microfi-nance develops, the focus is changing from the delivery ofcredit services to a true process of financial intermediation,including the provision of savings and other financial ser-vices demanded by the working poor. Furthermore, theshrinking resource base (donor funds) to support the ever-increasing demand implies that MFIs will eventually needto support themselves. Accompanying this change of per-spective is a better understanding of the implications ofinstitutional structure for achieving the ends of greater ser-vice, scale, and sustainability.Many MFIs are now beginning to look at the advan-
tages and disadvantages of different institutional struc-tures. This chapter examines the range of institutionaltypes that are appropriate for microfinance and for meet-ing the objectives of MFIs, including formal, semi-for-mal, and informal structures. It also addresses otherinstitutional issues, including:� Institutional growth and transformation� Ownership and governance� The accessing of new sources of funding� Institutional capacity.Most MFIs have established or are establishing part-
nerships with other development agencies, such as gov-
ernments, donors, and international NGOs. Whendeciding whom to cooperate with, the objectives of boththe MFI and the potential development partner must beconsidered. Partnerships affect the structure of the MFI,its funding sources, and its activities. The first section ofthis chapter gives an overview of why institutions (andpartner institutions) are important and outlines the vari-ous institutional types. The remaining sections focus onthe institutional issues that arise as MFIs grow andexpand their operations.This chapter will be of interest to donors or consul-
tants who are examining or evaluating MFIs and topractitioners who are considering transforming theirinstitutional structure, examining issues of governance,or developing new funding sources. Practitioners,donors, and international NGOs in the process ofselecting partner institutions will also find this chapterinteresting.
The Importance of Institutions
An institution is a collection of assets—human, financial,and others—combined to perform activities such as granti-ng loans and taking deposits overtime.1 A one-time activitysuch as a “project” is not an institution. Thus by its verynature an institution has a function and a certain perma-nence. However, when one looks at specific providers offinancial intermediation to low-income women and men ina given country, one can easily see differences in the degreeto which they really are institutions, that is, the degree to
1. This section and the following section on institutional types were written by Reinhardt Schmidt, Internationale Projekt Consult(IPC) GmbH.
94 M I C R O F I N A N C E H A N D B O O K
which they have a well-defined function and are set up andrun to perform their function on a permanent basis. Clearly,permanence is important. Poor men and women need per-manent and reliable access to savings and credit facilities,and only stable institutions can assure permanence.
Attributes of a Good Institution
A good institution has three attributes:1. It provides services to the relevant target group.� Appropriate services include the offering of loans thatmatch client demand. This refers to loan size andmaturity, collateral requirements, and the proceduresapplied in granting loans and ensuring repayment. Agood MFI must have or be willing to adopt an appro-priate credit technology, which will enable quality ser-vices to be designed and distributed so that they areattractive and accessible to the target group.
� The scope of services must be consistent with the situa-tion of the clientele. In some cases, simply offeringloans of a specific type may be all that is needed; in oth-ers, an array of different loan types may be necessary, orit may be more important to offer deposit and paymenttransfer facilities or a combination of all these services.
� Prices that the clients have to pay for the services ofthe institution are not generally a point of majorimportance, according to practical experience.However, low transaction costs for clients, a highdegree of deposit liquidity, and rapid availability ofloans are extremely important features for a target-group-oriented institution to provide.
2. Its activities and offered services are not only demand-ed but also have some identifiable positive impact on thelives of the customers.3. It is strong, financially sound, and stable.Because the people who belong to the target group
need a reliable supply of financial services—that is, accessto credit facilities—and an institution to which they canentrust their deposits, it is of paramount importance thatthe MFI be a stable or sustainable institution or at leastbe clearly on the way to becoming one.
Stability has, first and foremost, a financial dimension.A stable institution is one whose existence and function isnot threatened by a lack of funds for making necessarypayments; it must be solvent at any given moment andalso in the foreseeable future. In addition, a sustainableinstitution must be able to maintain or expand its scale of
operations. This is important for two reasons. One is thatonly a growing institution can meet the demand that itsclientele typically exhibits. The other is that many devel-opment finance institutions that cater to poor clients are sosmall that the unit costs of their operations are too high.Growth is an efficient way to reduce costs.Experts sometimes claim that an MFI should not
depend on external support but rather should be subsidyindependent. This requires that the revenues from itsoperations be sufficient to cover all of its costs, includingloan losses, the opportunity cost of equity, and the full,inflation-adjusted cost of debt. This is a requirement thatany mature institution must meet, just like any commer-cial business. However, in most practical cases the realquestion is not whether an MFI is already financially self-sufficient—most of them are not—but rather, to whatextent their costs exceed their revenues and whether andhow fast their dependence on external support decreasesover time. An MFI must be able and determined tomake visible progress toward financial self-sufficiency.Not all aspects of stability can be readily expressed in
numbers. One such aspect is organizational stability. Asound MFI must have an organizational and ownershipstructure that helps to ensure its stability both in a finan-cial sense and with respect to its target group. One can-not call an institution stable if it simply turns away fromits original target group of poor clients as soon as it startsto grow and become more efficient and professional.This temptation is great, as poor people are not the mostprofitable target group or the easiest to deal with.Therefore it is all the more important that an MFI havean ownership and governance structure—that is, a divi-sion of roles between the management and the board ofdirectors or the supervisory board—that prevents theinstitution from “drifting away into social irrelevance.”
The Importance of Partner Institutions
Most MFIs, with the possible exception of some commer-cial banks, work with one or more development agencies orpartners. These development agencies may be internationalNGOs, governments, or donors that provide technicalassistance, funding, and training to the MFI itself ratherthan the MFI’s clients. (While some partner institutionsmay in fact provide services directly to the clients of anMFI, here we are considering partners that help to developthe ability of an MFI to provide financial intermediation.)
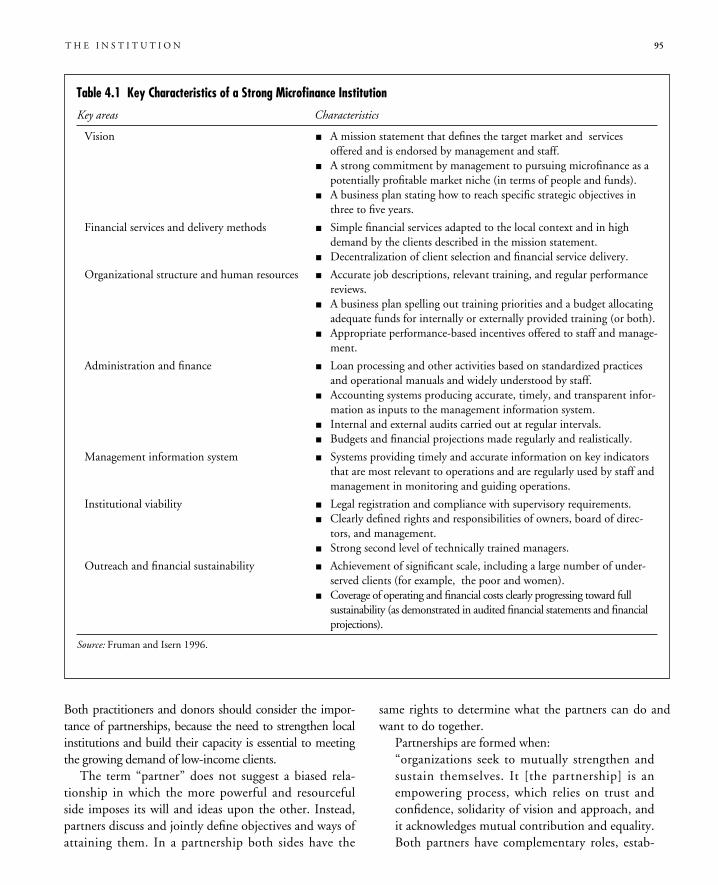
T H E I N S T I T U T I O N 95
Both practitioners and donors should consider the impor-tance of partnerships, because the need to strengthen localinstitutions and build their capacity is essential to meetingthe growing demand of low-income clients.
The term “partner” does not suggest a biased rela-tionship in which the more powerful and resourcefulside imposes its will and ideas upon the other. Instead,partners discuss and jointly define objectives and ways ofattaining them. In a partnership both sides have the
same rights to determine what the partners can do andwant to do together.
Partnerships are formed when:“organizations seek to mutually strengthen andsustain themselves. It [the partnership] is anempowering process, which relies on trust andconfidence, solidarity of vision and approach, andit acknowledges mutual contribution and equality.Both partners have complementary roles, estab-
Table 4.1 Key Characteristics of a Strong Microfinance Institution
Key areas Characteristics
Vision � A mission statement that defines the target market and servicesoffered and is endorsed by management and staff.
� A strong commitment by management to pursuing microfinance as apotentially profitable market niche (in terms of people and funds).
� A business plan stating how to reach specific strategic objectives inthree to five years.
Financial services and delivery methods � Simple financial services adapted to the local context and in highdemand by the clients described in the mission statement.
� Decentralization of client selection and financial service delivery.
Organizational structure and human resources � Accurate job descriptions, relevant training, and regular performancereviews.
� A business plan spelling out training priorities and a budget allocatingadequate funds for internally or externally provided training (or both).
� Appropriate performance-based incentives offered to staff and manage-ment.
Administration and finance � Loan processing and other activities based on standardized practicesand operational manuals and widely understood by staff.
� Accounting systems producing accurate, timely, and transparent infor-mation as inputs to the management information system.
� Internal and external audits carried out at regular intervals.� Budgets and financial projections made regularly and realistically.
Management information system � Systems providing timely and accurate information on key indicatorsthat are most relevant to operations and are regularly used by staff andmanagement in monitoring and guiding operations.
Institutional viability � Legal registration and compliance with supervisory requirements.� Clearly defined rights and responsibilities of owners, board of direc-
tors, and management.� Strong second level of technically trained managers.
Outreach and financial sustainability � Achievement of significant scale, including a large number of under-served clients (for example, the poor and women).
� Coverage of operating and financial costs clearly progressing toward fullsustainability (as demonstrated in audited financial statements and financialprojections).
Source: Fruman and Isern 1996.
lished through negotiations and subject to changeas the partnership grows and circumstanceschange.” (Long, Daouda, and Cawley 1990, 124)Local institutions can bring to the partnership the
advantage of knowing more about local circumstances:the target group or clientele, their situation and demandfor financial services, the local financial market, and thelocal laws and habits. Furthermore, there are ethical andpolitical considerations that make it advisable for a for-eign institution to have a local partner. Last but not least,a local partner is needed when an institution has beenestablished and the foreign partner is planning to with-draw from the MFI and leave it in the hands of localpeople. The failure of thousands of development financeprojects in the past demonstrates that it is necessary tohave not only an institutional basis but also strong local
partners if a permanent institution with a lasting impactfor low-income women and men is to be created.
Foreign partner agencies can bring funding, technicalassistance, and training to the partnership. Often foreignpartner agencies are familiar with microfinance “best prac-tices” and have at their disposal information and sources towhich the local partner may not readily have access.An American international NGO, Freedom From
Hunger, focuses on linking its MFI operations in Africa withlocal bank and credit unions. This has allowed it to focus pri-marily on technical assistance while creating sustainable insti-tutions in the countries in which it works (box 4.1).Partner selection implies cooperation, which is only
possible if there is a common purpose, mutual respectand openness, and a willingness by both partners to con-tribute to the achievement of the common goal. Thus
96 M I C R O F I N A N C E H A N D B O O K
FREEDOM FROM HUNGER (FFH) WORKS EXTENSIVELY INAfrica with local partners. Rather than going into a countryand setting up its own microfinance activity, Freedom FromHunger selects local formal financial institutions, trains themits own lending model, and provides technical advice. Theorganization has identified the advantages of this partnershipfor both parties:� Freedom From Hunger reduces the cost of delivering ser-vices, because the local institution can often fund its ownportfolio. Freedom From Hunger’s expertise in financialmanagement greatly helps in the start-up and ongoingmanagement. The local partner offers clients access to theformal financial sector. Credit unions, as partners, bringparticular advantages because they have a network of con-tacts, know their clients, and offer other local knowledge.
� The local partner gains access to creditworthy clientsusing Freedom From Hunger’s model, which features ahigh repayment rate and group loan guarantees. The newborrowers are also savers who build the bank’s loan capi-tal and profitability. Finally, reaching out to the clientstargeted by Freedom From Hunger represents an invest-ment in the welfare of the poor from which the bank canderive public relations and marketing benefits.Making this model work requires special attention to a
variety of issues. The greatest challenge for the internationalNGO is finding financial partners who have an interest inthe poverty and microbusiness sector and will honestly enterthe relationship with a long-term commitment. It is not by
chance that Freedom From Hunger’s partners are largelycredit unions or development banks—institutions with astrong social or development mission. How such anapproach might play out with more profit-seeking partnershas not been tested.Determinations that are of subsidiary but significant
importance are :� The financial health of the lending institution� The source of financing for the portfolio (in someinstances it is the bank or credit union, in others casesthe international NGO, which may need to supplementthe partner’s available resources)
� The source of funding for operational costs� The selection of staff delivering program services� Responsibility for loan loss.When these arrangements are worked out successfully,
the international NGO can see its activities grow beyondany scale that it could have reached with its own resources; itcan achieve a sustainable initiative, whether under its owncontrol or under that of the local financial institution. In thesecond case it has also achieved the establishment of microfi-nance within the formal financial system in a way that avoidsmany of the difficult challenges inherent in other models.The financial services are offered under the aegis of a regulat-ed institution that can provide security and stability to itsclients, and the organization does not have to transformitself or create a new financial institution to deliver servicesto those it most wants to serve.
Box 4.1 Freedom From Hunger: Partnering with Local Institutions
Source: SEEP Network 1996a.
there is no standard answer to the question, What makesa good local or international partner institution? Itdepends on who the other partner organization is, whatits ideas and objectives are, what it can contribute, andthe way in which it is willing to act as a partner.
Institutional Types
The following is a brief discussion of each institutionaltype and includes its suitability as a partner to a donor,international NGO, or government. The suitability ofdonors, international NGOs, and governments as part-ners is not discussed.
Formal institutions are defined as those that are sub-ject not only to general laws and regulations but also tospecific banking regulation and supervision. Semiformalinstitutions are those that are formal in the sense of beingregistered entities subject to all relevant general laws,including commercial law, but informal insofar as theyare, with few exceptions, not under bank regulation andsupervision. Informal providers (generally not referred toas institutions) are those to which neither special banklaw nor general commercial law applies, and whoseoperations are also so informal that disputes arising fromcontact with them often cannot be settled by recourse tothe legal system.
Formal Financial Institutions
The following are the most typical types of formal finan-cial institutions.
PUBLIC DEVELOPMENT BANKS. Development banks are oruntil quite recently have been, a special type of large,centralized, government-owned bank. Most of themwere set up with ample financial support from foreignand international organizations. They were created toprovide financial services to strategic sectors such as agri-culture or industry. Most are the product of traditionalinterventionist approaches, which place greater emphasison disbursements at low, subsidized interest rates thanon the quality of lending.Their traditional clients are large businesses. In the
1970s several development banks started to offer theirservices to small farmers and small businesses. Butbecause they tried to do this with the same credit tech-
nology and organizational structures as they had usedbefore, their success was extremely modest.
Rural development banks and specialized small businessdevelopment banks that escaped closure during the recentwave of financial sector reforms that swept over manycountries have some attractive features: almost all of themhave a broad network of branches; many are by nowactive collectors of deposits; and quite often they are theonly large institutions in rural areas to offer at least a min-imum of financial services to poor clients (box 4.3).Development banks can be considered good partners for
foreign development agencies—not in the traditional senseof providing funds, but rather in improving and reshapingtheir organizational structures, financial management, andthe way in which they design and provide their services topoorer clients. The crucial questions to be asked beforeundertaking such a partnership are whether there is anopenness to change and a willingness to give up the amplepowers that the traditional approach certainly entailed andwhether a foreign organization has enough resources to sup-port such a change if it is desired not only by the people inthe bank but by relevant politicians in the country.
PRIVATE DEVELOPMENT BANKS. Private developmentbanks are a special category of banks that exist in some
T H E I N S T I T U T I O N 97
Box 4.2 Types of Financial InstitutionsFormal institutions� Public development banks� Private development banks� Savings banks and postal savings banks� Commercial banks� Nonbank financial intermediaries.Semiformal institutions� Credit unions� Multipurpose cooperatives� NGOs� (Some) self-help groups.Informal providers� (Pure) moneylenders� Traders, landlords, and the like (as moneylenders)� (Most) self-help groups� Rotating savings and credit associations (work groups,multipurpose self-help groups)
� Families and friends.
Source: Author’s findings.
98 M I C R O F I N A N C E H A N D B O O K
developing countries. Their aim is broad economicdevelopment directed to fill capital gaps in the produc-tive sector that are considered too risky by commercialstandards. They often have lower capital requirementsthan commercial banks and enjoy some exemptions,either in the form of tax breaks or reduced reserverequirements (box 4.4).
SAVINGS BANKS AND POSTAL SAVINGS BANKS. The legalstatus and ownership of savings banks varies, but they aretypically not owned by the central government of theircountry, and they often have a mixture of public and pri-vate owners. Some, such as those in Peru, were set upand owned by municipalities; others, such as the ruralbanks in Ghana, are simply small local banks owned bylocal people.As the name indicates, savings banks tend to empha-
size savings mobilization more than other banks. Theirmain strength is that they are decentralized, rooted inthe local community, and interested in serving localsmall business.In many countries there are post office savings banks
modeled on patterns imposed by former colonial powers.A typical post office savings bank operates through thecounters of post offices, and therefore, has a very largenetwork of outlets; it does not offer credit but only takesdeposits and provides money transfer services. A surplus
of deposits is normally invested in government securitiesor simply transferred to the treasury. Most post officesavings banks are part of the postal administration oftheir country (box 4.5).With a few noteworthy exceptions, post office sav-
ings banks are in poor shape, both financially and oper-ationally. Their financial situation is poor because theyhave to pass their net deposits on to the treasury, whichoften does not want to acknowledge its indebtedness tothe post office savings banks. Their organizational weak-nesses derive from the fact that they are managed by thepostal service, which has no genuine interest in theirsuccess. This state of affairs is all the more regrettable inview of the fact that deposit facilities and money trans-fer services within easy reach of the majority of poorpeople are “basic financial needs,” which other institu-tions tend not to provide with comparably low transac-tion costs.Savings banks could be attractive partners for vari-
ous kinds of microfinance activities. Their mainstrengths are that they are decentralized, rooted in thelocal community, and interested in serving local smallbusiness. Some savings banks, such as those in Peru,are among the most successful target-group-orientedfinancial institutions, while others may be good part-ners for activities aimed at restructuring the savingsbank system.
DEVELOPMENT BANKS CAN LEND EITHER DIRECTLY OR
through intermediaries, as shown in these examples.Direct lending. The Bank for Agriculture and Agricultural
Cooperatives (BAAC) in Thailand is a state-owned develop-ment bank created in 1966 to provide financial assistance tofarmers and agriculture-related activities. Since the financialreforms of 1989 the bank’s efforts have been directed pre-dominantly at the low- to medium-income range. At first itlent mostly through agricultural cooperatives, but repaymentproblems led the bank to start lending directly to farmers.
Lending through intermediaries. The experience of theBanque Nationale de Développement Agricole (BNDA), astate-owned bank in Mali, is quite different. This bankceased lending directly to clients in rural areas in the early1990s because of very low repayment rates. Lending to vil-
lage cooperatives and groups of farmers gave better results.In more recent years the Banque Nationale has started lend-ing to microfinance institutions, such as the caisses villa-geoises—self-managed village banks—in three regions of thecountry. These institutions in turn on-lend to their clients.This linkage has been extremely successful, with high repay-ment rates and very low costs for the bank. The bank nowwishes to become directly involved in setting up self-managed village banks in other areas of the country. If itssole motivation is to channel more funds to the rural econo-my, this may prove to be a dangerous strategy. Indeed, thesuccess of the caisses villageoises in Mali is based on theirownership by the villagers themselves—and this sense ofownership might be weakened if the Banque Nationale istoo strongly involved.
Box 4.3 Development Banks
Source: Contributed by Cecile Fruman, Sustainable Banking with the Poor Project, World Bank.
T H E I N S T I T U T I O N 99
COMMERCIAL BANKS. Commercial banks are formalfinancial institutions that focus on short- and long-term
lending to established businesses. A typical commercialbank has little experience in providing financial services
TULAY SA PAG-UNLAD, INC. (TSPI), IN THE PHILIPPINES,determined that it would create a private development bankbased on the current regulatory environment and its owninstitutional capacity.� New banking regulations permit the establishment ofprivate development banks with much lower capitalrequirements (US$1.7 million, as opposed to US$50million for commercial banks). However, the new privatedevelopment banks are only allowed to operate outsideMetropolitan Manila, meaning that TSPI will need toconsider the location of its branches carefully so as to stayclose to its desired client base.
� While TSPI has managed to create a diversified productline, one of its four loan services, Sakbayan, which pro-vides loans to tricycle and taxi drivers, is significantlystronger than the others and will become the anchorproduct for the bank. This product, however, has limitedgrowth potential because taxi routes are regulated.Strengthening the other product lines is thus a prioritytask for TSPI.
� TSPI recognizes that it still faces some capacity-building issues, including human resource and sys-tems development. However, the pressure to sourceadditional loan capital and the potentially short regu-latory “window of opportunity” are demanding pro-gress toward the creation of a private developmentbank.
With these realities in mind, one option under considera-tion is a special transitional structure, with the new bank and theoriginal NGO in one integrated organization with shared per-sonnel and a unifying mission. The bank and the NGO wouldmaintain separate financial statements and transparent inter-company transactions but would share many of the head officefunctions and some of the operational management. The NGOwould be responsible for the Kabuhayan product aimed at thepoorest people as well as those branches within MetropolitanManila that cannot be legally transferred to the bank. The bankwould be responsible for the most profitable loan products,located in those branches most ready for bank status.The transition period would take two to three years as
the bank grew and became large enough to operate withinManila and take over the rest of TSPI’s branches. At thatpoint the bank and the NGO would separate all functionsand staff. The decision to merge Kabuhayan into the bankwould be made at that time or later. If the conclusion wasthat it would never reach commercial viability, the NGOwould continue with a separate head office structure. In themeantime, the unified structure provides TSPI with severalclear advantages:� It controls administrative costs.� It avoids potential cultural conflicts between the NGO andthe bank about the mission.
� It ensures coherent policies, performance measurement,and expectations.
Box 4.4 Tulay sa Pag-Unlad’s Transformation into a Private Development Bank
Source: Calmeadow 1996.
FROM 1918 TO 1985 THE POSTAL ADMINISTRATION IN
Madagascar collected savings. In 1985 the Savings Bank ofMadagascar (Caisse d’épargne Madagascar) was createdunder the financial supervision of the Ministry of Financeand the technical supervision of the Ministry of Post andTelecommunications. The Savings Bank of Madagascarbegan with 46 existing postal offices. In June 1996 it wasoperating out of 174 windows located in both main citiesand remote small towns. For use of the postal outlets thebank pays the postal administration 0.8 percent on savingscollected.
The Savings Bank of Madagascar provides its clientswith savings services only. Clients earn interest on theirsavings depending on the length of time they are held.Once a year all clients give their transactions books to thebank’s agency or postal office to calculate the accruedinterest.The Savings Bank of Madagascar focuses on poor clients,
as evidenced by an average savings balance of less thanUS$32. This represents 28 percent of GDP. The total num-ber of clients in June 1996 was 372,291, with 46 percent ofthem women.
Box 4.5 The Savings Bank of Madagascar
Source: Galludec 1996.
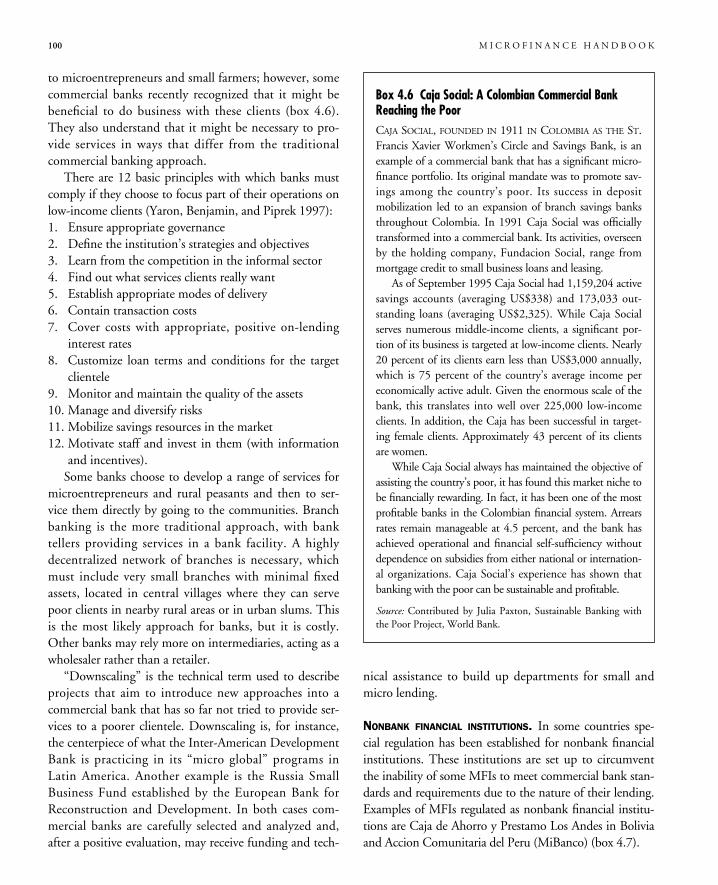
to microentrepreneurs and small farmers; however, somecommercial banks recently recognized that it might bebeneficial to do business with these clients (box 4.6).They also understand that it might be necessary to pro-vide services in ways that differ from the traditionalcommercial banking approach.There are 12 basic principles with which banks must
comply if they choose to focus part of their operations onlow-income clients (Yaron, Benjamin, and Piprek 1997):1. Ensure appropriate governance2. Define the institution’s strategies and objectives3. Learn from the competition in the informal sector4. Find out what services clients really want5. Establish appropriate modes of delivery6. Contain transaction costs7. Cover costs with appropriate, positive on-lendinginterest rates
8. Customize loan terms and conditions for the targetclientele
9. Monitor and maintain the quality of the assets10. Manage and diversify risks11. Mobilize savings resources in the market12. Motivate staff and invest in them (with informationand incentives).Some banks choose to develop a range of services for
microentrepreneurs and rural peasants and then to ser-vice them directly by going to the communities. Branchbanking is the more traditional approach, with banktellers providing services in a bank facility. A highlydecentralized network of branches is necessary, whichmust include very small branches with minimal fixedassets, located in central villages where they can servepoor clients in nearby rural areas or in urban slums. Thisis the most likely approach for banks, but it is costly.Other banks may rely more on intermediaries, acting as awholesaler rather than a retailer.“Downscaling” is the technical term used to describe
projects that aim to introduce new approaches into acommercial bank that has so far not tried to provide ser-vices to a poorer clientele. Downscaling is, for instance,the centerpiece of what the Inter-American DevelopmentBank is practicing in its “micro global” programs inLatin America. Another example is the Russia SmallBusiness Fund established by the European Bank forReconstruction and Development. In both cases com-mercial banks are carefully selected and analyzed and,after a positive evaluation, may receive funding and tech-
nical assistance to build up departments for small andmicro lending.
NONBANK FINANCIAL INSTITUTIONS. In some countries spe-cial regulation has been established for nonbank financialinstitutions. These institutions are set up to circumventthe inability of some MFIs to meet commercial bank stan-dards and requirements due to the nature of their lending.Examples of MFIs regulated as nonbank financial institu-tions are Caja de Ahorro y Prestamo Los Andes in Boliviaand Accion Comunitaria del Peru (MiBanco) (box 4.7).
100 M I C R O F I N A N C E H A N D B O O K
Box 4.6 Caja Social: A Colombian Commercial BankReaching the PoorCAJA SOCIAL, FOUNDED IN 1911 IN COLOMBIA AS THE ST.Francis Xavier Workmen’s Circle and Savings Bank, is anexample of a commercial bank that has a significant micro-finance portfolio. Its original mandate was to promote sav-ings among the country’s poor. Its success in depositmobilization led to an expansion of branch savings banksthroughout Colombia. In 1991 Caja Social was officiallytransformed into a commercial bank. Its activities, overseenby the holding company, Fundacion Social, range frommortgage credit to small business loans and leasing.As of September 1995 Caja Social had 1,159,204 active
savings accounts (averaging US$338) and 173,033 out-standing loans (averaging US$2,325). While Caja Socialserves numerous middle-income clients, a significant por-tion of its business is targeted at low-income clients. Nearly20 percent of its clients earn less than US$3,000 annually,which is 75 percent of the country’s average income pereconomically active adult. Given the enormous scale of thebank, this translates into well over 225,000 low-incomeclients. In addition, the Caja has been successful in target-ing female clients. Approximately 43 percent of its clientsare women.While Caja Social always has maintained the objective of
assisting the country’s poor, it has found this market niche tobe financially rewarding. In fact, it has been one of the mostprofitable banks in the Colombian financial system. Arrearsrates remain manageable at 4.5 percent, and the bank hasachieved operational and financial self-sufficiency withoutdependence on subsidies from either national or internation-al organizations. Caja Social’s experience has shown thatbanking with the poor can be sustainable and profitable.
Source: Contributed by Julia Paxton, Sustainable Banking withthe Poor Project, World Bank.
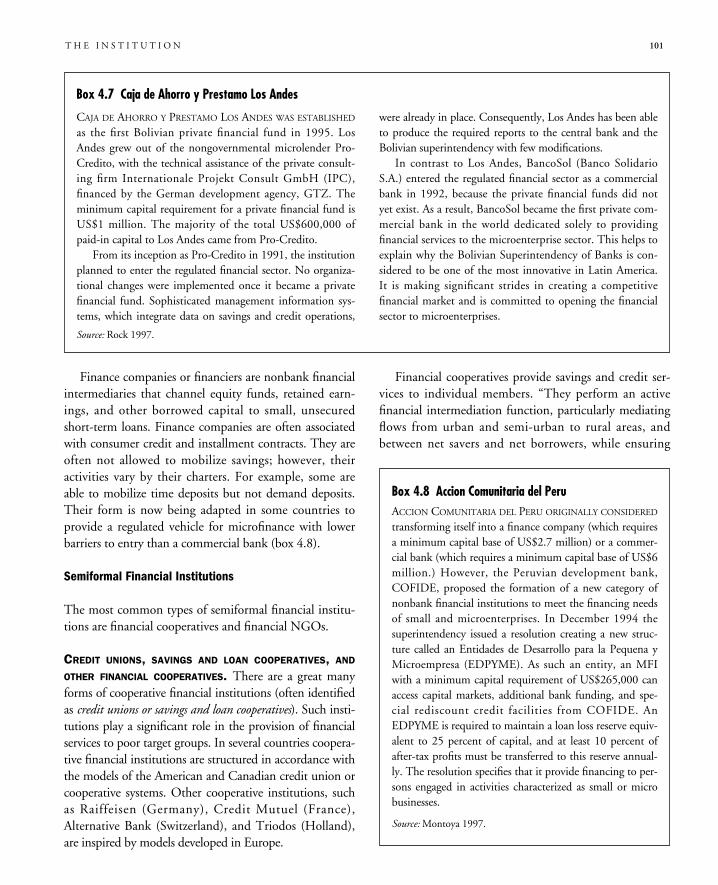
Finance companies or financiers are nonbank financialintermediaries that channel equity funds, retained earn-ings, and other borrowed capital to small, unsecuredshort-term loans. Finance companies are often associatedwith consumer credit and installment contracts. They areoften not allowed to mobilize savings; however, theiractivities vary by their charters. For example, some areable to mobilize time deposits but not demand deposits.Their form is now being adapted in some countries toprovide a regulated vehicle for microfinance with lowerbarriers to entry than a commercial bank (box 4.8).
Semiformal Financial Institutions
The most common types of semiformal financial institu-tions are financial cooperatives and financial NGOs.
CREDIT UNIONS, SAVINGS AND LOAN COOPERATIVES, AND
OTHER FINANCIAL COOPERATIVES. There are a great manyforms of cooperative financial institutions (often identifiedas credit unions or savings and loan cooperatives). Such insti-tutions play a significant role in the provision of financialservices to poor target groups. In several countries coopera-tive financial institutions are structured in accordance withthe models of the American and Canadian credit union orcooperative systems. Other cooperative institutions, suchas Raiffeisen (Germany), Credit Mutuel (France),Alternative Bank (Switzerland), and Triodos (Holland),are inspired by models developed in Europe.
Financial cooperatives provide savings and credit ser-vices to individual members. “They perform an activefinancial intermediation function, particularly mediatingflows from urban and semi-urban to rural areas, andbetween net savers and net borrowers, while ensuring
T H E I N S T I T U T I O N 101
CAJA DE AHORRO Y PRESTAMO LOS ANDES WAS ESTABLISHEDas the first Bolivian private financial fund in 1995. LosAndes grew out of the nongovernmental microlender Pro-Credito, with the technical assistance of the private consult-ing firm Internationale Projekt Consult GmbH (IPC),financed by the German development agency, GTZ. Theminimum capital requirement for a private financial fund isUS$1 million. The majority of the total US$600,000 ofpaid-in capital to Los Andes came from Pro-Credito.From its inception as Pro-Credito in 1991, the institution
planned to enter the regulated financial sector. No organiza-tional changes were implemented once it became a privatefinancial fund. Sophisticated management information sys-tems, which integrate data on savings and credit operations,
were already in place. Consequently, Los Andes has been ableto produce the required reports to the central bank and theBolivian superintendency with few modifications.In contrast to Los Andes, BancoSol (Banco Solidario
S.A.) entered the regulated financial sector as a commercialbank in 1992, because the private financial funds did notyet exist. As a result, BancoSol became the first private com-mercial bank in the world dedicated solely to providingfinancial services to the microenterprise sector. This helps toexplain why the Bolivian Superintendency of Banks is con-sidered to be one of the most innovative in Latin America.It is making significant strides in creating a competitivefinancial market and is committed to opening the financialsector to microenterprises.
Box 4.7 Caja de Ahorro y Prestamo Los Andes
Source: Rock 1997.
Box 4.8 Accion Comunitaria del PeruACCION COMUNITARIA DEL PERU ORIGINALLY CONSIDEREDtransforming itself into a finance company (which requiresa minimum capital base of US$2.7 million) or a commer-cial bank (which requires a minimum capital base of US$6million.) However, the Peruvian development bank,COFIDE, proposed the formation of a new category ofnonbank financial institutions to meet the financing needsof small and microenterprises. In December 1994 thesuperintendency issued a resolution creating a new struc-ture called an Entidades de Desarrollo para la Pequena yMicroempresa (EDPYME). As such an entity, an MFIwith a minimum capital requirement of US$265,000 canaccess capital markets, additional bank funding, and spe-cial rediscount credit facilities from COFIDE. AnEDPYME is required to maintain a loan loss reserve equiv-alent to 25 percent of capital, and at least 10 percent ofafter-tax profits must be transferred to this reserve annual-ly. The resolution specifies that it provide financing to per-sons engaged in activities characterized as small or microbusinesses.
Source:Montoya 1997.
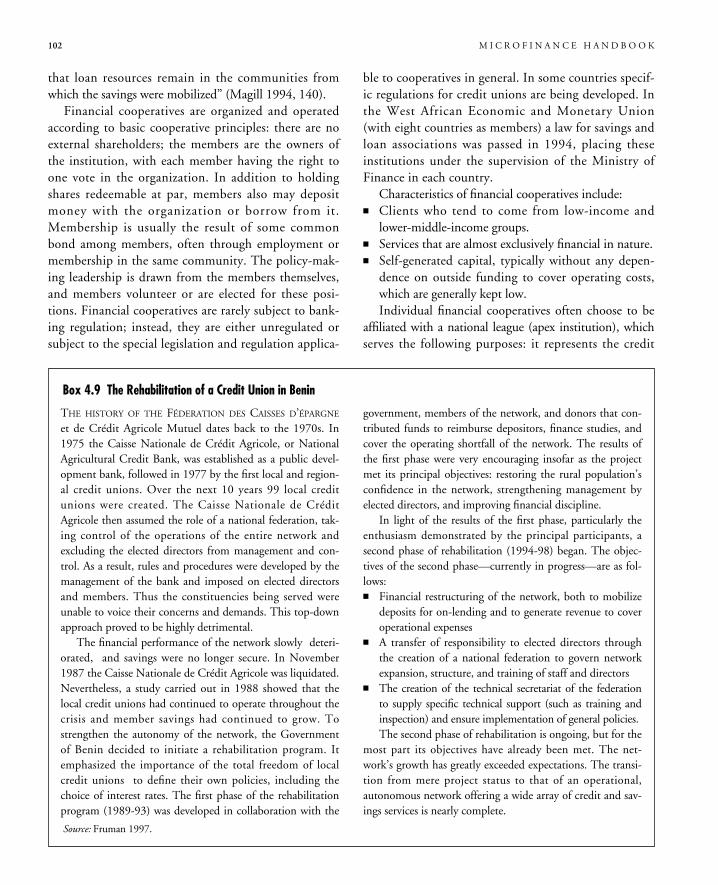
that loan resources remain in the communities fromwhich the savings were mobilized” (Magill 1994, 140).Financial cooperatives are organized and operated
according to basic cooperative principles: there are noexternal shareholders; the members are the owners ofthe institution, with each member having the right toone vote in the organization. In addition to holdingshares redeemable at par, members also may depositmoney with the organization or borrow from it.Membership is usually the result of some commonbond among members, often through employment ormembership in the same community. The policy-mak-ing leadership is drawn from the members themselves,and members volunteer or are elected for these posi-tions. Financial cooperatives are rarely subject to bank-ing regulation; instead, they are either unregulated orsubject to the special legislation and regulation applica-
ble to cooperatives in general. In some countries specif-ic regulations for credit unions are being developed. Inthe West African Economic and Monetary Union(with eight countries as members) a law for savings andloan associations was passed in 1994, placing theseinstitutions under the supervision of the Ministry ofFinance in each country.Characteristics of financial cooperatives include:
� Clients who tend to come from low-income andlower-middle-income groups.
� Services that are almost exclusively financial in nature.� Self-generated capital, typically without any depen-dence on outside funding to cover operating costs,which are generally kept low.Individual financial cooperatives often choose to be
affiliated with a national league (apex institution), whichserves the following purposes: it represents the credit
102 M I C R O F I N A N C E H A N D B O O K
THE HISTORY OF THE FÉDERATION DES CAISSES D’ÉPARGNEet de Crédit Agricole Mutuel dates back to the 1970s. In1975 the Caisse Nationale de Crédit Agricole, or NationalAgricultural Credit Bank, was established as a public devel-opment bank, followed in 1977 by the first local and region-al credit unions. Over the next 10 years 99 local creditunions were created. The Caisse Nationale de CréditAgricole then assumed the role of a national federation, tak-ing control of the operations of the entire network andexcluding the elected directors from management and con-trol. As a result, rules and procedures were developed by themanagement of the bank and imposed on elected directorsand members. Thus the constituencies being served wereunable to voice their concerns and demands. This top-downapproach proved to be highly detrimental.The financial performance of the network slowly deteri-
orated, and savings were no longer secure. In November1987 the Caisse Nationale de Crédit Agricole was liquidated.Nevertheless, a study carried out in 1988 showed that thelocal credit unions had continued to operate throughout thecrisis and member savings had continued to grow. Tostrengthen the autonomy of the network, the Governmentof Benin decided to initiate a rehabilitation program. Itemphasized the importance of the total freedom of localcredit unions to define their own policies, including thechoice of interest rates. The first phase of the rehabilitationprogram (1989-93) was developed in collaboration with the
government, members of the network, and donors that con-tributed funds to reimburse depositors, finance studies, andcover the operating shortfall of the network. The results ofthe first phase were very encouraging insofar as the projectmet its principal objectives: restoring the rural population’sconfidence in the network, strengthening management byelected directors, and improving financial discipline.In light of the results of the first phase, particularly the
enthusiasm demonstrated by the principal participants, asecond phase of rehabilitation (1994-98) began. The objec-tives of the second phase—currently in progress—are as fol-lows:� Financial restructuring of the network, both to mobilizedeposits for on-lending and to generate revenue to coveroperational expenses
� A transfer of responsibility to elected directors throughthe creation of a national federation to govern networkexpansion, structure, and training of staff and directors
� The creation of the technical secretariat of the federationto supply specific technical support (such as training andinspection) and ensure implementation of general policies.The second phase of rehabilitation is ongoing, but for the
most part its objectives have already been met. The net-work’s growth has greatly exceeded expectations. The transi-tion from mere project status to that of an operational,autonomous network offering a wide array of credit and sav-ings services is nearly complete.
Box 4.9 The Rehabilitation of a Credit Union in Benin
Source: Fruman 1997.
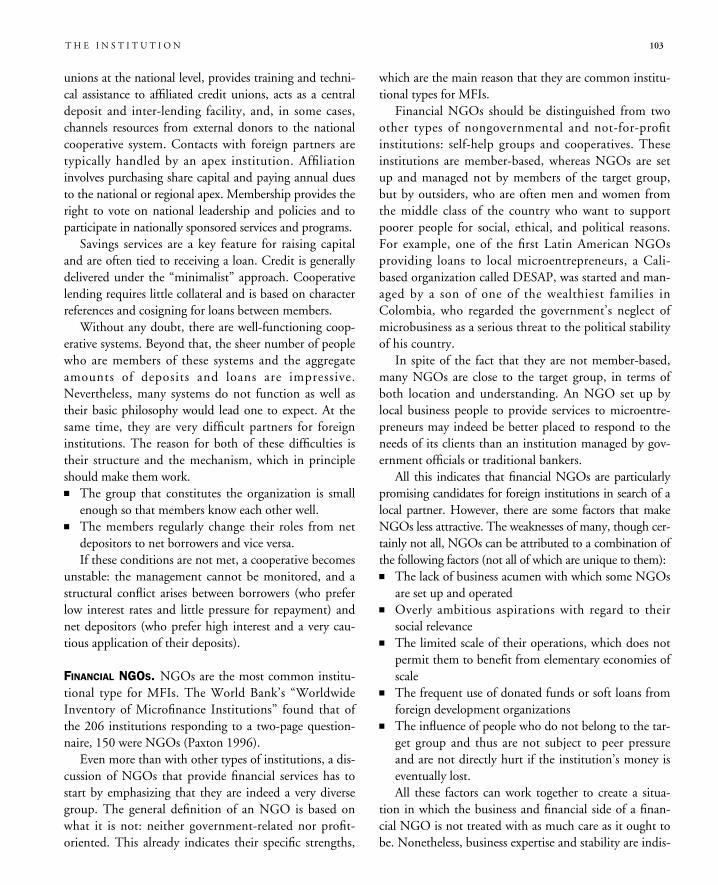
unions at the national level, provides training and techni-cal assistance to affiliated credit unions, acts as a centraldeposit and inter-lending facility, and, in some cases,channels resources from external donors to the nationalcooperative system. Contacts with foreign partners aretypically handled by an apex institution. Affiliationinvolves purchasing share capital and paying annual duesto the national or regional apex. Membership provides theright to vote on national leadership and policies and toparticipate in nationally sponsored services and programs.Savings services are a key feature for raising capital
and are often tied to receiving a loan. Credit is generallydelivered under the “minimalist” approach. Cooperativelending requires little collateral and is based on characterreferences and cosigning for loans between members.Without any doubt, there are well-functioning coop-
erative systems. Beyond that, the sheer number of peoplewho are members of these systems and the aggregateamounts of deposits and loans are impressive.Nevertheless, many systems do not function as well astheir basic philosophy would lead one to expect. At thesame time, they are very difficult partners for foreigninstitutions. The reason for both of these difficulties istheir structure and the mechanism, which in principleshould make them work.� The group that constitutes the organization is smallenough so that members know each other well.
� The members regularly change their roles from netdepositors to net borrowers and vice versa.If these conditions are not met, a cooperative becomes
unstable: the management cannot be monitored, and astructural conflict arises between borrowers (who preferlow interest rates and little pressure for repayment) andnet depositors (who prefer high interest and a very cau-tious application of their deposits).
FINANCIAL NGOS. NGOs are the most common institu-tional type for MFIs. The World Bank’s “WorldwideInventory of Microfinance Institutions” found that ofthe 206 institutions responding to a two-page question-naire, 150 were NGOs (Paxton 1996).Even more than with other types of institutions, a dis-
cussion of NGOs that provide financial services has tostart by emphasizing that they are indeed a very diversegroup. The general definition of an NGO is based onwhat it is not: neither government-related nor profit-oriented. This already indicates their specific strengths,
which are the main reason that they are common institu-tional types for MFIs.Financial NGOs should be distinguished from two
other types of nongovernmental and not-for-profitinstitutions: self-help groups and cooperatives. Theseinstitutions are member-based, whereas NGOs are setup and managed not by members of the target group,but by outsiders, who are often men and women fromthe middle class of the country who want to supportpoorer people for social, ethical, and political reasons.For example, one of the first Latin American NGOsproviding loans to local microentrepreneurs, a Cali-based organization called DESAP, was started and man-aged by a son of one of the wealthiest families inColombia, who regarded the government’s neglect ofmicrobusiness as a serious threat to the political stabilityof his country.In spite of the fact that they are not member-based,
many NGOs are close to the target group, in terms ofboth location and understanding. An NGO set up bylocal business people to provide services to microentre-preneurs may indeed be better placed to respond to theneeds of its clients than an institution managed by gov-ernment officials or traditional bankers.All this indicates that financial NGOs are particularly
promising candidates for foreign institutions in search of alocal partner. However, there are some factors that makeNGOs less attractive. The weaknesses of many, though cer-tainly not all, NGOs can be attributed to a combination ofthe following factors (not all of which are unique to them):� The lack of business acumen with which some NGOsare set up and operated
� Overly ambitious aspirations with regard to theirsocial relevance
� The limited scale of their operations, which does notpermit them to benefit from elementary economies ofscale
� The frequent use of donated funds or soft loans fromforeign development organizations
� The influence of people who do not belong to the tar-get group and thus are not subject to peer pressureand are not directly hurt if the institution’s money iseventually lost.All these factors can work together to create a situa-
tion in which the business and financial side of a finan-cial NGO is not treated with as much care as it ought tobe. Nonetheless, business expertise and stability are indis-
T H E I N S T I T U T I O N 103
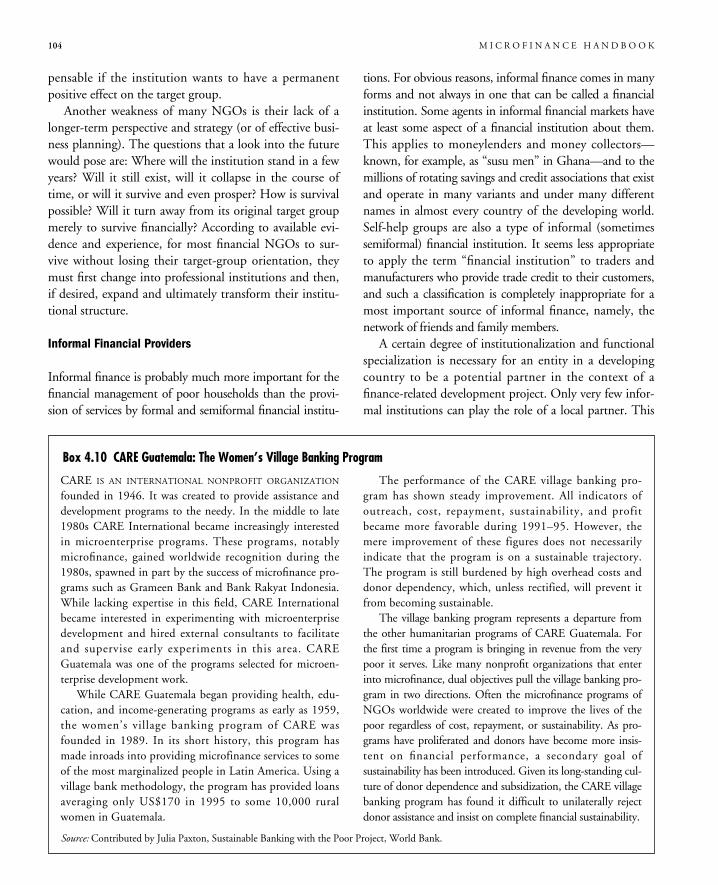
pensable if the institution wants to have a permanentpositive effect on the target group.Another weakness of many NGOs is their lack of a
longer-term perspective and strategy (or of effective busi-ness planning). The questions that a look into the futurewould pose are: Where will the institution stand in a fewyears? Will it still exist, will it collapse in the course oftime, or will it survive and even prosper? How is survivalpossible? Will it turn away from its original target groupmerely to survive financially? According to available evi-dence and experience, for most financial NGOs to sur-vive without losing their target-group orientation, theymust first change into professional institutions and then,if desired, expand and ultimately transform their institu-tional structure.
Informal Financial Providers
Informal finance is probably much more important for thefinancial management of poor households than the provi-sion of services by formal and semiformal financial institu-
tions. For obvious reasons, informal finance comes in manyforms and not always in one that can be called a financialinstitution. Some agents in informal financial markets haveat least some aspect of a financial institution about them.This applies to moneylenders and money collectors—known, for example, as “susu men” in Ghana—and to themillions of rotating savings and credit associations that existand operate in many variants and under many differentnames in almost every country of the developing world.Self-help groups are also a type of informal (sometimessemiformal) financial institution. It seems less appropriateto apply the term “financial institution” to traders andmanufacturers who provide trade credit to their customers,and such a classification is completely inappropriate for amost important source of informal finance, namely, thenetwork of friends and family members.A certain degree of institutionalization and functional
specialization is necessary for an entity in a developingcountry to be a potential partner in the context of afinance-related development project. Only very few infor-mal institutions can play the role of a local partner. This
104 M I C R O F I N A N C E H A N D B O O K
CARE IS AN INTERNATIONAL NONPROFIT ORGANIZATION
founded in 1946. It was created to provide assistance anddevelopment programs to the needy. In the middle to late1980s CARE International became increasingly interestedin microenterprise programs. These programs, notablymicrofinance, gained worldwide recognition during the1980s, spawned in part by the success of microfinance pro-grams such as Grameen Bank and Bank Rakyat Indonesia.While lacking expertise in this field, CARE Internationalbecame interested in experimenting with microenterprisedevelopment and hired external consultants to facilitateand supervise early experiments in this area. CAREGuatemala was one of the programs selected for microen-terprise development work.While CARE Guatemala began providing health, edu-
cation, and income-generating programs as early as 1959,the women’s village banking program of CARE wasfounded in 1989. In its short history, this program hasmade inroads into providing microfinance services to someof the most marginalized people in Latin America. Using avillage bank methodology, the program has provided loansaveraging only US$170 in 1995 to some 10,000 ruralwomen in Guatemala.
The performance of the CARE village banking pro-gram has shown steady improvement. All indicators ofoutreach, cost, repayment, sustainability, and profitbecame more favorable during 1991–95. However, themere improvement of these figures does not necessarilyindicate that the program is on a sustainable trajectory.The program is still burdened by high overhead costs anddonor dependency, which, unless rectified, will prevent itfrom becoming sustainable.The village banking program represents a departure from
the other humanitarian programs of CARE Guatemala. Forthe first time a program is bringing in revenue from the verypoor it serves. Like many nonprofit organizations that enterinto microfinance, dual objectives pull the village banking pro-gram in two directions. Often the microfinance programs ofNGOs worldwide were created to improve the lives of thepoor regardless of cost, repayment, or sustainability. As pro-grams have proliferated and donors have become more insis-tent on financial performance, a secondary goal ofsustainability has been introduced. Given its long-standing cul-ture of donor dependence and subsidization, the CARE villagebanking program has found it difficult to unilaterally rejectdonor assistance and insist on complete financial sustainability.
Box 4.10 CARE Guatemala: The Women’s Village Banking Program
Source: Contributed by Julia Paxton, Sustainable Banking with the Poor Project, World Bank.
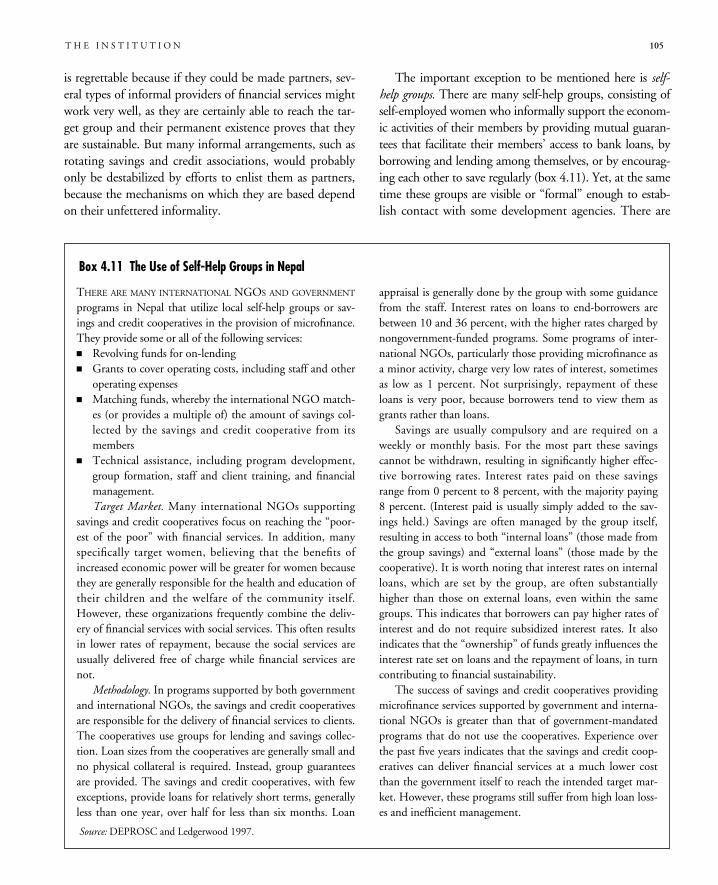
is regrettable because if they could be made partners, sev-eral types of informal providers of financial services mightwork very well, as they are certainly able to reach the tar-get group and their permanent existence proves that theyare sustainable. But many informal arrangements, such asrotating savings and credit associations, would probablyonly be destabilized by efforts to enlist them as partners,because the mechanisms on which they are based dependon their unfettered informality.
The important exception to be mentioned here is self-help groups. There are many self-help groups, consisting ofself-employed women who informally support the econom-ic activities of their members by providing mutual guaran-tees that facilitate their members’ access to bank loans, byborrowing and lending among themselves, or by encourag-ing each other to save regularly (box 4.11). Yet, at the sametime these groups are visible or “formal” enough to estab-lish contact with some development agencies. There are
T H E I N S T I T U T I O N 105
THERE ARE MANY INTERNATIONAL NGOS AND GOVERNMENTprograms in Nepal that utilize local self-help groups or sav-ings and credit cooperatives in the provision of microfinance.They provide some or all of the following services:� Revolving funds for on-lending� Grants to cover operating costs, including staff and otheroperating expenses
� Matching funds, whereby the international NGO match-es (or provides a multiple of) the amount of savings col-lected by the savings and credit cooperative from itsmembers
� Technical assistance, including program development,group formation, staff and client training, and financialmanagement.Target Market. Many international NGOs supporting
savings and credit cooperatives focus on reaching the “poor-est of the poor” with financial services. In addition, manyspecifically target women, believing that the benefits ofincreased economic power will be greater for women becausethey are generally responsible for the health and education oftheir children and the welfare of the community itself.However, these organizations frequently combine the deliv-ery of financial services with social services. This often resultsin lower rates of repayment, because the social services areusually delivered free of charge while financial services arenot.
Methodology. In programs supported by both governmentand international NGOs, the savings and credit cooperativesare responsible for the delivery of financial services to clients.The cooperatives use groups for lending and savings collec-tion. Loan sizes from the cooperatives are generally small andno physical collateral is required. Instead, group guaranteesare provided. The savings and credit cooperatives, with fewexceptions, provide loans for relatively short terms, generallyless than one year, over half for less than six months. Loan
appraisal is generally done by the group with some guidancefrom the staff. Interest rates on loans to end-borrowers arebetween 10 and 36 percent, with the higher rates charged bynongovernment-funded programs. Some programs of inter-national NGOs, particularly those providing microfinance asa minor activity, charge very low rates of interest, sometimesas low as 1 percent. Not surprisingly, repayment of theseloans is very poor, because borrowers tend to view them asgrants rather than loans.Savings are usually compulsory and are required on a
weekly or monthly basis. For the most part these savingscannot be withdrawn, resulting in significantly higher effec-tive borrowing rates. Interest rates paid on these savingsrange from 0 percent to 8 percent, with the majority paying8 percent. (Interest paid is usually simply added to the sav-ings held.) Savings are often managed by the group itself,resulting in access to both “internal loans” (those made fromthe group savings) and “external loans” (those made by thecooperative). It is worth noting that interest rates on internalloans, which are set by the group, are often substantiallyhigher than those on external loans, even within the samegroups. This indicates that borrowers can pay higher rates ofinterest and do not require subsidized interest rates. It alsoindicates that the “ownership” of funds greatly influences theinterest rate set on loans and the repayment of loans, in turncontributing to financial sustainability.The success of savings and credit cooperatives providing
microfinance services supported by government and interna-tional NGOs is greater than that of government-mandatedprograms that do not use the cooperatives. Experience overthe past five years indicates that the savings and credit coop-eratives can deliver financial services at a much lower costthan the government itself to reach the intended target mar-ket. However, these programs still suffer from high loan loss-es and inefficient management.
Box 4.11 The Use of Self-Help Groups in Nepal
Source: DEPROSC and Ledgerwood 1997.
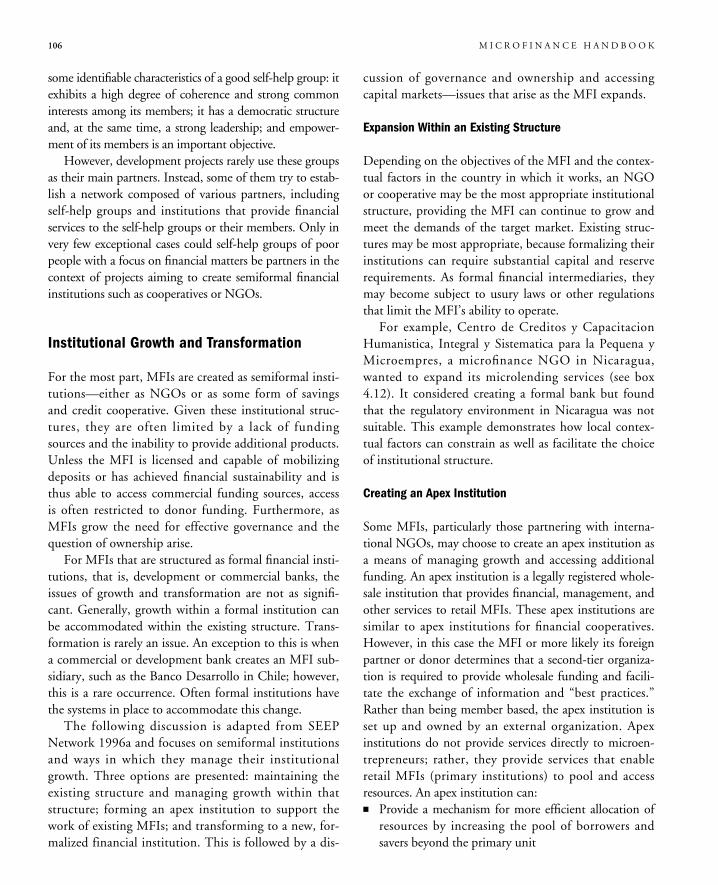
some identifiable characteristics of a good self-help group: itexhibits a high degree of coherence and strong commoninterests among its members; it has a democratic structureand, at the same time, a strong leadership; and empower-ment of its members is an important objective.However, development projects rarely use these groups
as their main partners. Instead, some of them try to estab-lish a network composed of various partners, includingself-help groups and institutions that provide financialservices to the self-help groups or their members. Only invery few exceptional cases could self-help groups of poorpeople with a focus on financial matters be partners in thecontext of projects aiming to create semiformal financialinstitutions such as cooperatives or NGOs.
Institutional Growth and Transformation
For the most part, MFIs are created as semiformal insti-tutions—either as NGOs or as some form of savingsand credit cooperative. Given these institutional struc-tures, they are often limited by a lack of fundingsources and the inability to provide additional products.Unless the MFI is licensed and capable of mobilizingdeposits or has achieved financial sustainability and isthus able to access commercial funding sources, accessis often restricted to donor funding. Furthermore, asMFIs grow the need for effective governance and thequestion of ownership arise.For MFIs that are structured as formal financial insti-
tutions, that is, development or commercial banks, theissues of growth and transformation are not as signifi-cant. Generally, growth within a formal institution canbe accommodated within the existing structure. Trans-formation is rarely an issue. An exception to this is whena commercial or development bank creates an MFI sub-sidiary, such as the Banco Desarrollo in Chile; however,this is a rare occurrence. Often formal institutions havethe systems in place to accommodate this change.The following discussion is adapted from SEEP
Network 1996a and focuses on semiformal institutionsand ways in which they manage their institutionalgrowth. Three options are presented: maintaining theexisting structure and managing growth within thatstructure; forming an apex institution to support thework of existing MFIs; and transforming to a new, for-malized financial institution. This is followed by a dis-
cussion of governance and ownership and accessingcapital markets—issues that arise as the MFI expands.
Expansion Within an Existing Structure
Depending on the objectives of the MFI and the contex-tual factors in the country in which it works, an NGOor cooperative may be the most appropriate institutionalstructure, providing the MFI can continue to grow andmeet the demands of the target market. Existing struc-tures may be most appropriate, because formalizing theirinstitutions can require substantial capital and reserverequirements. As formal financial intermediaries, theymay become subject to usury laws or other regulationsthat limit the MFI’s ability to operate.For example, Centro de Creditos y Capacitacion
Humanistica, Integral y Sistematica para la Pequena yMicroempres, a microfinance NGO in Nicaragua,wanted to expand its microlending services (see box4.12). It considered creating a formal bank but foundthat the regulatory environment in Nicaragua was notsuitable. This example demonstrates how local contex-tual factors can constrain as well as facilitate the choiceof institutional structure.
Creating an Apex Institution
Some MFIs, particularly those partnering with interna-tional NGOs, may choose to create an apex institution asa means of managing growth and accessing additionalfunding. An apex institution is a legally registered whole-sale institution that provides financial, management, andother services to retail MFIs. These apex institutions aresimilar to apex institutions for financial cooperatives.However, in this case the MFI or more likely its foreignpartner or donor determines that a second-tier organiza-tion is required to provide wholesale funding and facili-tate the exchange of information and “best practices.”Rather than being member based, the apex institution isset up and owned by an external organization. Apexinstitutions do not provide services directly to microen-trepreneurs; rather, they provide services that enableretail MFIs (primary institutions) to pool and accessresources. An apex institution can:� Provide a mechanism for more efficient allocation ofresources by increasing the pool of borrowers andsavers beyond the primary unit
106 M I C R O F I N A N C E H A N D B O O K
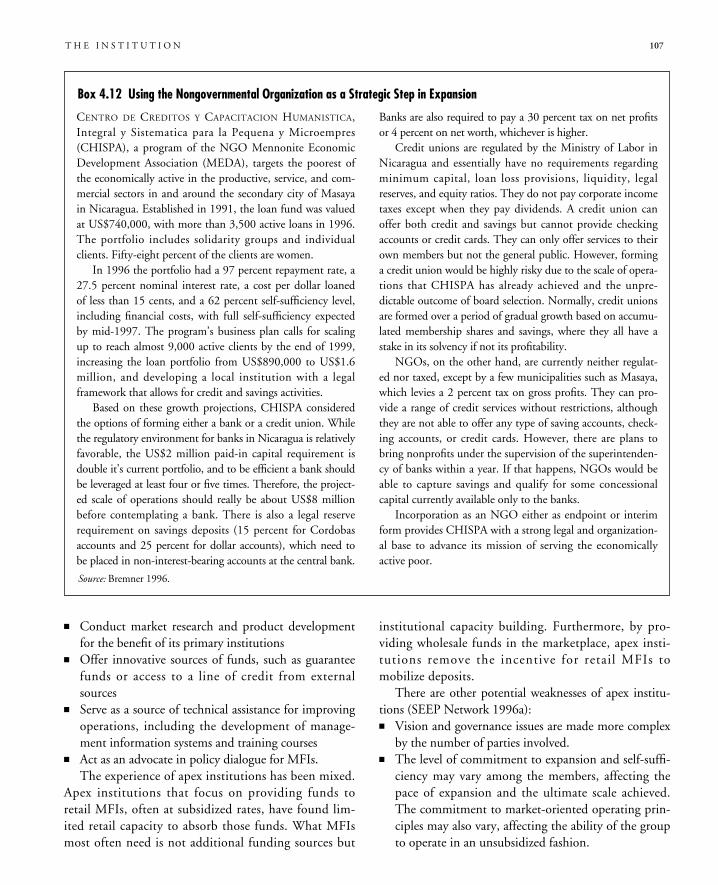
� Conduct market research and product developmentfor the benefit of its primary institutions
� Offer innovative sources of funds, such as guaranteefunds or access to a line of credit from externalsources
� Serve as a source of technical assistance for improvingoperations, including the development of manage-ment information systems and training courses
� Act as an advocate in policy dialogue for MFIs.The experience of apex institutions has been mixed.
Apex institutions that focus on providing funds toretail MFIs, often at subsidized rates, have found lim-ited retail capacity to absorb those funds. What MFIsmost often need is not additional funding sources but
institutional capacity building. Furthermore, by pro-viding wholesale funds in the marketplace, apex insti-tutions remove the incentive for retail MFIs tomobilize deposits.There are other potential weaknesses of apex institu-
tions (SEEP Network 1996a):� Vision and governance issues are made more complexby the number of parties involved.
� The level of commitment to expansion and self-suffi-ciency may vary among the members, affecting thepace of expansion and the ultimate scale achieved.The commitment to market-oriented operating prin-ciples may also vary, affecting the ability of the groupto operate in an unsubsidized fashion.
T H E I N S T I T U T I O N 107
CENTRO DE CREDITOS Y CAPACITACION HUMANISTICA,Integral y Sistematica para la Pequena y Microempres(CHISPA), a program of the NGO Mennonite EconomicDevelopment Association (MEDA), targets the poorest ofthe economically active in the productive, service, and com-mercial sectors in and around the secondary city of Masayain Nicaragua. Established in 1991, the loan fund was valuedat US$740,000, with more than 3,500 active loans in 1996.The portfolio includes solidarity groups and individualclients. Fifty-eight percent of the clients are women.In 1996 the portfolio had a 97 percent repayment rate, a
27.5 percent nominal interest rate, a cost per dollar loanedof less than 15 cents, and a 62 percent self-sufficiency level,including financial costs, with full self-sufficiency expectedby mid-1997. The program’s business plan calls for scalingup to reach almost 9,000 active clients by the end of 1999,increasing the loan portfolio from US$890,000 to US$1.6million, and developing a local institution with a legalframework that allows for credit and savings activities.Based on these growth projections, CHISPA considered
the options of forming either a bank or a credit union. Whilethe regulatory environment for banks in Nicaragua is relativelyfavorable, the US$2 million paid-in capital requirement isdouble it’s current portfolio, and to be efficient a bank shouldbe leveraged at least four or five times. Therefore, the project-ed scale of operations should really be about US$8 millionbefore contemplating a bank. There is also a legal reserverequirement on savings deposits (15 percent for Cordobasaccounts and 25 percent for dollar accounts), which need tobe placed in non-interest-bearing accounts at the central bank.
Banks are also required to pay a 30 percent tax on net profitsor 4 percent on net worth, whichever is higher.Credit unions are regulated by the Ministry of Labor in
Nicaragua and essentially have no requirements regardingminimum capital, loan loss provisions, liquidity, legalreserves, and equity ratios. They do not pay corporate incometaxes except when they pay dividends. A credit union canoffer both credit and savings but cannot provide checkingaccounts or credit cards. They can only offer services to theirown members but not the general public. However, forminga credit union would be highly risky due to the scale of opera-tions that CHISPA has already achieved and the unpre-dictable outcome of board selection. Normally, credit unionsare formed over a period of gradual growth based on accumu-lated membership shares and savings, where they all have astake in its solvency if not its profitability.NGOs, on the other hand, are currently neither regulat-
ed nor taxed, except by a few municipalities such as Masaya,which levies a 2 percent tax on gross profits. They can pro-vide a range of credit services without restrictions, althoughthey are not able to offer any type of saving accounts, check-ing accounts, or credit cards. However, there are plans tobring nonprofits under the supervision of the superintenden-cy of banks within a year. If that happens, NGOs would beable to capture savings and qualify for some concessionalcapital currently available only to the banks.Incorporation as an NGO either as endpoint or interim
form provides CHISPA with a strong legal and organization-al base to advance its mission of serving the economicallyactive poor.
Box 4.12 Using the Nongovernmental Organization as a Strategic Step in Expansion
Source: Bremner 1996.
� Differential growth rates among the partners canalso strain their relationship, especially when theirneeds for resources and technical support widendramatically.
� Monitoring and supervision are essential to goodperformance but are made difficult by the number ofpartners. If there are weaknesses in financial report-ing and management at the primary level, these canadversely affect the second-tier operation.
� Unless both the primary institutions and the apexare efficient, the ultimate costs to the client can behigh. There needs to be constant attention to issuesof productivity and performance.While there are many disadvantages to apex institu-
tions, if structured appropriately and set up with clearand market-oriented objectives, they can add value andaid in the development of microfinance.
“For the most part, microfinance apex institutionsprovide more than just liquidity in the market.Usually the apex is set up when everyone agreesthat there is a drastic shortage of retail capacity.The advertised objective of the apex is to fomentthe development of stronger retailers capable ofreaching a much more substantial portion of themicrofinance clientele.” (Rosenberg 1996)Apex institutions that focus on pooling member-
mobilized funds and on-lending these funds at marketrates to their members represent a far better approachthan those wholesaling donor or government funds. Also,apex institutions should not be creating microfinanceretailers. Rather, they are most helpful when many exist-ing MFIs participate and benefit from doing so.Apex institutions may also be useful in the following
situations (Von Pischke 1996):
108 M I C R O F I N A N C E H A N D B O O K
CATHOLIC RELIEF SERVICES SUPPORTED THE ESTABLISHMENTof the Small Enterprise Development Company, Ltd., afinance company in Thailand, to provide financial interme-diation and institutional strengthening services to its NGOand (currently five) credit union counterparts implementingthe village bank methodology. The company can facilitatethe use of collective savings as well as attract donors andbankers. It is expected to achieve financial self-sufficiency by1999, when it will be managing a US$910,000 portfolio andcharging a 6 to 10 percent spread. In turn, the counterpartswill be lending funds to 175 village banks with almost11,000 members.In Indonesia Catholic Relief Services is supporting the
development of formal financial services at two levels: thecreation of 20 subdistrict credit banks, called BankPerkredital Rakyats, and the formation of a national-scalelimited liability company, called the Self RelianceCorporation. Catholic Relief Services’ traditional targetgroups, the Usaha Bersamas (rural savings and creditgroups), will receive financial services directly from the sub-district credit banks. As for profit subsidiaries of CatholicRelief Services’ NGO partners, the subdistrict credit bankswill help them increase the clients served from 16,000 tomore than 30,000 in 5 years, with loans averaging US$150.Self sufficiency of the banks is expected in 24 months. TheSelf Reliance Corporation will function as an Indonesianregistered company and will assist with the start-up and
management of the credit banks. The corporation will seek a51 percent equity investment in all new credit banks, withthe counterparts owning between 20 and 49 percent.Revenues should enable the corporation to achieve financialself-sufficiency toward the end of the third year.In Peru Catholic Relieve Services is assisting eight mem-
bers of COPEME, a local consortium of enterprise NGOs,to form an Entidades de Desarrollo para la Pequena yMicroempresa or finance company to serve the departmentsof Lima, Callao, Lambayeque, Arequipa, Piura, and Trujillo.Operating as a for-profit institution funded by commercialinvestments, the company will provide financing servicesenabling the partners to provide 20,000 loans, averagingbetween US$50 and US$200 and valued at US$425,000, bythe end of three years.Catholic Relief Services identifies four key attributes of
these models:� They are based on consistent involvement of experiencedNGOs, which, in every case, remain key actors with sig-nificant decisionmaking power.
� All parties have demonstrated a willingness to experimentwith new speculative models that take advantage of manyregulatory innovations.
� They avoid the large capital requirements of the com-mercial bank form.
� Lending through diverse partners also mitigates risksassociated with these transformations.
Box 4.13 Catholic Relief Services: Using the Apex Model for Expansion
Source: SEEP Network 1996a.
� When they are lenders of last resort, not necessarily insituations of crisis but on the basis of cost. Retaillenders regard an apex institution as a good source ofexpensive funds and presumably use them sparinglyand only for highly important and profitable programs.
� When the apex institution fills in seasonally.Agricultural-based retail lenders might want to borrowseasonally as a means of managing cash flow. Again,the funds should not have to be provided by the apexinstitution at anything less than commercial rates.
� When the apex institution becomes a shareholder inthe retail MFIs, in the expectation that this wouldprovide an attractive overall return. In this case theapex institution would expect to add value by provid-ing expertise and oversight as well as funds in theform of equity and quite possibly debt.
� When retail lenders are not permitted to takedeposits. Apex institutions could then play a usefulrole if they added value through their terms and con-ditions and behaved commercially.An apex institution appears to be most successful
when a critical mass of strong MFI retailers already existsand when it is focused on working with existing formalfinancial institutions that are “downscaling” to meet thedemands of low-income clients. (For further informationabout apex institutions, see Gonzalez-Vega 1998.)
Creating a Formal Financial Intermediary
Recently the field of microfinance has focused on thetransformation of financial NGOs into formal financialinstitutions. This approach involves the transfer of theNGO’s or cooperative’s operations to a newly createdfinancial intermediary, while the original institution iseither phased out or continues to exist alongside the newintermediary. In most cases, the original MFI’s assets,staff, methodology, and systems are transferred to thenew institution and adapted to meet the more rigorousrequirements of a financial intermediary. Various meansmay be established to determine a transfer price for theassets and operations of the NGO or cooperative to thenew entity. It is imperative, however, that the transferprice mechanism be transparent (box 4.14).The rationale for developing a formal financial
institution is compelling: the potential to access bothsavings and commercial funding may help solve anMFI’s funding constraints and increase its ability to
provide additional financial services to the target mar-ket. However, creating a formal financial institutionalso implies additional costs and restrictions as theMFI becomes regulated and supervised (see chapter 1).Capital requirements may be much higher than antici-pated, and unless the MFI has reached financial self-sufficiency it will be difficult (and costly) to attractequity investors and commercial debt (see the sectionbelow on accessing capital markets). And finally, theMFI must develop the institutional capacity to managea number of different products and services, mobilizeresources (both debt and equity as well as humanresources), and enhance management information sys-tems to adhere to regulatory reporting requirementsand manage additional products (see the section belowon institutional capacity building). While transforma-tion may seem like an ideal path, MFIs should consid-er the substantial changes that are required whentransforming to a formal financial institution. Theymust also thoroughly examine their institutional capac-ity and determine if it meets the requirements fortransformation (Appendix 1 provides a framework forconducting this analysis).The costs to convert into a formal financial institu-
tion are often exceedingly high: they include feasibilityand pre-start-up work, capital requirements, as well asthe changes in management and systems that must beimplemented. Each MFI must consider the varioustypes of formal institutions described above and deter-mine which one best suits their needs (box 4.15). Forexample, PRODEM’s choice of the commercial bankmodel for BancoSol was due to its great leverage poten-tial and ability to offer savings and other financial prod-ucts, matched by the right combination of political andfinancial support. On the other hand, AccionComunitaria del Peru and COPEME, an association ofNGOs partnered with Catholic Relief Services, decidedto establish finance companies in accordance with spe-cial legislation supporting these forms. Although unableto capture savings, these structures do provide regulatedvehicles that have leverage potential and can beginoperations with lower capital (SEEP Network 1996a).Finally, if an NGO in the transformation process
remains a separate institution, the two organizations (theNGO and new financial intermediary) must develop aworking relationship that benefits both parties and thatsolidifies the bridge between them. Some useful bridging
T H E I N S T I T U T I O N 109
mechanisms include the following (SEEP Network1996a):� Overlapping directorates� Cost sharing of head office functions, branch space,insurance, and so forth
� Joint resource mobilization, with the NGO attract-ing the social investment capital that the financialintermediary may not qualify for directly
� Coordinating policies for product development, tar-get areas, and populations.
Governance and Ownership
MFIs, particularly those set up as financial NGOs, areoften formed by a visionary. These visionaries are notusually interested in profits but rather have a socialobjective to improve the lives of low-income membersof their community. Only after the MFI begins to growdoes the visionary reach the conclusion that the MFIneeds to adopt a more business-like approach. This is
110 M I C R O F I N A N C E H A N D B O O K
Box 4.15 Catholic Relief Services’ GuatemalaDevelopment BankCATHOLIC RELIEF SERVICES’ PARTNER IN GUATEMALA,Cooperative Association for Western Rural Development,is planning to establish a development bank, because itsorganizing principles are more amenable than a commer-cial bank to the social development mission that the asso-ciation supports. This mission involves:� A focus on the very poor, the core constituency ofCatholic Relief Services and its partners
� An emphasis on savings� Accessibility for NGOs and popular organizations interms of the initial investment requirements andadministrative operations
� Easy replicability.This last characteristic is seen as essential both to sup-
port rapid scale-up and to encourage diversification ratherthan financial concentration.
Source: SEEP Network 1996a.
IN 1988 THE GERMAN AID INSTITUTIONS CREATED A ROTAT-ing credit fund for the Association of Micro and SmallEntrepreneurs (AMPES) of El Salvador. The objective of thisproject was to improve the supply of credit for small businesspeople on a lasting basis. Plans were made with the associationto create a stable and professional institution that could ulti-mately be transformed into a small target-group-oriented for-mal financial institution.From the beginning, credit operations were organized
separately from the association’s other business, both toassure professionalism and also to limit undue personalinfluence. While the association was the owner of AMPES-Servicio Crediticio, it did not run the operations. Also, thedonor institutions insisted that the purchasing power of thefund be maintained. Accordingly, interest rates were set at anunusually high level (effective rates between 25 percent and40 percent). Finally, strict lending policies were implement-ed and a system of financial incentives for loan officers wascreated, which kept loan losses below 1 percent.With external funding from the Inter-American
Development Bank the loan portfolio and the number of bor-rowers doubled every year. At the end of 1996 the number ofborrowers was around 20,000 and the loan portfolio hadgrown to the equivalent of US$14 million. During this phase
of rapid growth, the fund was transformed into FinancieraCalpía, a small, strictly targeted group-oriented formal bank.The transformation was undertaken with the full support ofthe Association of Micro and Small Entrepreneurs, which,through its Fundación Calpía, is now the main shareholder ofFinanciera Calpía. The other shareholders are local and inter-national development institutions.Transformation and formalization were necessary for two
reasons. To satisfy the high demand for small and very smallloans, the institution needed the right to accept savingsdeposits from its customers and to have access to the inter-bank market. And because of the challenges and dangers ofthe extremely dynamic expansion of its operations, the institu-tion needed—and wanted—the increased stability and tightercontrol that the new status provides by making Calpía stillmore independent from the association and putting it underthe formal control of the superintendency of banks.Currently, Calpía is the most important specialized
lender to the small business community of El Salvador. Ithas opened eight branches to date. Because of its high posi-tive (inflation-adjusted) return on equity and its institutionalstability, other banks in the country regard it as highly creditworthy, improving the availability of loan funds to on-lendto the target population.
Box 4.14 Transformation from a Nongovernmental Organization to Financiera Calpía
Source: Contributed by Reinhard Schmidt, Internationale Projekt Consult GmbH (IPC).
often the result of limited donor funds, demands of thetarget market, and a general shift in the field of microfi-nance toward formalized institutions.As the MFI grows and management systems are devel-
oped, the need for governance arises to ensure effectivemanagement of the MFI and, potentially, to attract peoplewith much-needed skills (usually from the private sector).While governance does not always result in a change ofvision for the MFI, it does establish a means of holdingmanagement accountable. Furthermore, as the MFI growsthe issue of ownership becomes apparent. This is particu-larly important as the MFI begins to create a more formal-ized structure.
GOVERNANCE. (Adapted from Clarkson and Deck 1997.)Governance refers to a system of checks and balanceswhereby a board of directors is established to oversee themanagement of the MFI. The board of directors isresponsible for reviewing, confirming, and approvingthe plans and performance of senior management andensuring that the vision of the MFI is maintained.Management is responsible for the daily operations ofputting the vision into action.The basic responsibilities of the board are:
� Fiduciary. The board has the responsibility to safe-guard the interests of all of the institution’s stake-holders. It serves as a check and balance to ensurethe MFI’s investors, staff, clients, and other keystakeholders that the managers will operate in thebest interest of the MFI.
� Strategic. The board participates in the MFI’s long-term strategy by critically considering the principalrisks to which the organization is exposed and approv-ing plans presented by the management. The boarddoes not generate corporate strategy but insteadreviews management’s business plans in light of theinstitution’s mission and approves them accordingly.
� Supervisory. The board delegates the authority foroperations to the management through the executivedirector or chief executive officer. The board super-vises management in the execution of the approvedstrategic plan and evaluates the performance of man-agement in the context of the goals and time frameoutlined in the plan.
� Management development. The board supervises theselection, evaluation, and compensation of thesenior management team. This includes succession
planning for the executive. In the transition from asmall, growing entrepreneurial organization to anestablished institution, effective governance ensuresthat the company survives. Governance moves aninstitution beyond dependency on the visionary.The board should comprise members who have a
number of different skills, including financial, legal,and managerial. In particular, representation from theprivate sector is important. Also, the ability to criticallyanalyze management’s plans as well as provide effectiveguidance is paramount when selecting a board. An MFImust define the following:� The role of board members both within the boardand with regard to external alliances
� The desired areas of expertise� The existence of committees to oversee specific areasof operation
� Term limits for board seats� The process for replacing board members� The role of the executive director in selecting boardmembers
� The optimum number of board members� Mechanisms to evaluate the contribution of individ-ual members.Board members must be provided with and agree to
clear and common objectives. Furthermore, it is importantthat members be independent from the MFI and be chosenfor their expertise rather than their own interests or politicalagendas or those of the senior management. Board mem-bers should act in such a way that they create accountabilityand enable stakeholders to trust one another. Governancegives shareholders, donors, governments, and regulatorsconfidence that managers are being appropriately super-vised. Thus board members should not receive any person-al or material gain other than the approved remuneration.
OWNERSHIP. (Adapted from Otero 1998.) It is the ownersof the MFI that elect (or at times compose) the governingbody of the institution. Owners, through their agents onthe board, hold management accountable. Ownership isan important but often nebulous issue for MFIs, particu-larly as many are funded with donor contributions.Neither formal financial institutions nor NGOs have
owners per se. Formal MFIs have shareholders whoown shares that give them a residual claim to the assetsof the MFI if there is anything remaining after it hasdischarged all of its obligations. Shareholders have the
T H E I N S T I T U T I O N 111
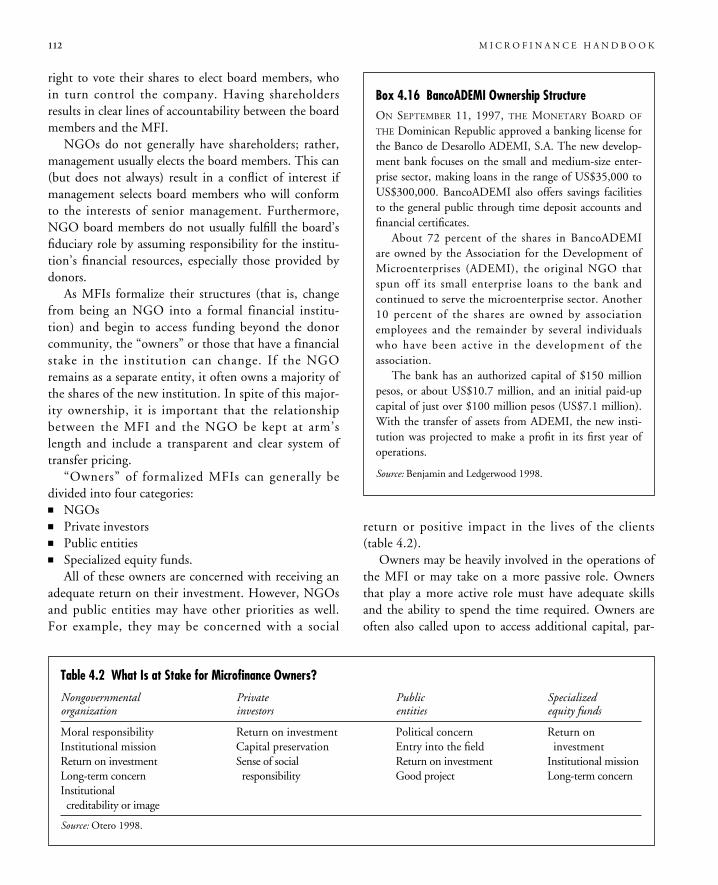
right to vote their shares to elect board members, whoin turn control the company. Having shareholdersresults in clear lines of accountability between the boardmembers and the MFI.NGOs do not generally have shareholders; rather,
management usually elects the board members. This can(but does not always) result in a conflict of interest ifmanagement selects board members who will conformto the interests of senior management. Furthermore,NGO board members do not usually fulfill the board’sfiduciary role by assuming responsibility for the institu-tion’s financial resources, especially those provided bydonors.As MFIs formalize their structures (that is, change
from being an NGO into a formal financial institu-tion) and begin to access funding beyond the donorcommunity, the “owners” or those that have a financialstake in the institution can change. If the NGOremains as a separate entity, it often owns a majority ofthe shares of the new institution. In spite of this major-ity ownership, it is important that the relationshipbetween the MFI and the NGO be kept at arm’slength and include a transparent and clear system oftransfer pricing.“Owners” of formalized MFIs can generally be
divided into four categories:� NGOs� Private investors� Public entities� Specialized equity funds.All of these owners are concerned with receiving an
adequate return on their investment. However, NGOsand public entities may have other priorities as well.For example, they may be concerned with a social
return or positive impact in the lives of the clients(table 4.2).Owners may be heavily involved in the operations of
the MFI or may take on a more passive role. Ownersthat play a more active role must have adequate skillsand the ability to spend the time required. Owners areoften also called upon to access additional capital, par-
112 M I C R O F I N A N C E H A N D B O O K
Table 4.2 What Is at Stake for Microfinance Owners?
Nongovernmental Private Public Specializedorganization investors entities equity funds
Moral responsibility Return on investment Political concern Return onInstitutional mission Capital preservation Entry into the field investmentReturn on investment Sense of social Return on investment Institutional missionLong-term concern responsibility Good project Long-term concernInstitutionalcreditability or image
Source: Otero 1998.
Box 4.16 BancoADEMI Ownership StructureON SEPTEMBER 11, 1997, THE MONETARY BOARD OF
THE Dominican Republic approved a banking license forthe Banco de Desarollo ADEMI, S.A. The new develop-ment bank focuses on the small and medium-size enter-prise sector, making loans in the range of US$35,000 toUS$300,000. BancoADEMI also offers savings facilitiesto the general public through time deposit accounts andfinancial certificates.About 72 percent of the shares in BancoADEMI
are owned by the Association for the Development ofMicroenterprises (ADEMI), the original NGO thatspun off its small enterprise loans to the bank andcontinued to serve the microenterprise sector. Another10 percent of the shares are owned by associationemployees and the remainder by several individualswho have been active in the development of theassociation.The bank has an authorized capital of $150 million
pesos, or about US$10.7 million, and an initial paid-upcapital of just over $100 million pesos (US$7.1 million).With the transfer of assets from ADEMI, the new insti-tution was projected to make a profit in its first year ofoperations.
Source: Benjamin and Ledgerwood 1998.
ticularly equity capital. As owners they may wish tomaintain their stake as the MFI grows and takes onadditional capital. This implies that they also must havecontinued access to capital.
Accessing Capital Markets
The majority of MFIs fund their activities with donor orgovernment funding through grants or concessionalloans. However, it is becoming evident that donor fund-ing is limited. As MFIs expand and reach a critical stageof growth, they find that they cannot sustain theirgrowth with only donor support. Some are beginning toaccess capital markets. There are various ways that anMFI can access new capital, including:� Debt accessed through guarantee funds, loans, anddeposit mobilization
� Equity� Equity investment funds� Socially responsible mutual funds� Securitization of the loan portfolio.
ACCESSING DEBT. For the most part it is necessary to befinancially self-sufficient to access commercial sources offunds. However, with the backing of guarantees bydonors or international NGOs, some MFIs, if they earnenough revenue to at least cover their cash costs, may beable to leverage their donor funds with commercial loansin amounts equal to the donor funds.
Guarantee funds are financial mechanisms that reducethe risk to a financial institution by ensuring repaymentof some portion of a loan (adapted from Stearns 1993).Guarantee funds are used to encourage formal sectorbank lending to the microenterprise sector. They can beused to guarantee a loan made by a commercial bank toan MFI, which then on-lends funds to its clients, orloans from a bank directly to microentrepreneurs. Thereare three types of guarantee funds that cover the risks ofmaking loans. These risk-related design features aresome of the most important determinants of the accep-tance and use of a guarantee mechanism by banks. Theyare guarantees covering:� A percentage of the loan principal� A percentage of the loan principal and the interest lost� A certain amount of the loan (say, the first 50 percent).By reducing risk and transaction costs faced by the
financial institution, guarantee funds can function as
“research and development” for commercial lenders con-sidering entry into a new market (either lending to MFIsor directly to clients). Guarantee funds are usuallydesigned to leverage resources. For example, a guaranteefund of US$5 million may encourage banks to lendUS$10 million to microentrepreneurs, thereby leveragingthe fund’s resources by a factor of two to one. The moreeffective the guarantee mechanism the higher the lever-age factor becomes (the guarantee fund backs an increas-ingly large loan portfolio). Ultimately, the aim is togradually transfer the risk from the guarantee mechanismto the participating financial institutions.For example, ACCION’s Bridge Fund provides its
NGO affiliates with access to commercial loans that theyotherwise might not have. The Bridge Fund puts cashdeposits, securities, or letters of credit with commercialbanks, which in turn on-lend to the NGO affiliate atmarket rates. Eventually, some affiliates have been able toborrow directly without the use of the guarantee scheme.However, the costs of guarantee schemes must be
considered relative to the benefits (box 4.17). Vogel andAdams (1997) claim that there are three categories ofcosts that accompany loan guarantee programs: the costsof setting up the program, the costs of funding the sub-sidy needed to energize and sustain the program, andthe additional cost incurred by the financial system ofrunning and participating in the guarantee program.The benefits of a loan guarantee program are the addi-tional lending induced by the transfer of part of thelender’s risk to the guaranteeing organization. Both bor-rowers and society benefit from the increases in netincome realized by borrowers. Vogel and Adams suggestthat the benefits are hard to measure, because it is diffi-cult to determine if the guarantee scheme resulted intrue additionality (that is, additional lending to the tar-get market). Furthermore, substitution can also occurwhereby the bank simply transfers part or all of the qual-ifying portion of its existing loan portfolio to the guar-antee programs or to an NGO, in this way benefitingfrom the subsidized guarantee program that takes bor-rowing clients away from other NGOs not benefitingfrom the subsidies.At the very least, few guarantee schemes are financial-
ly sustainable without some form of subsidy. However,they appear to be more beneficial than direct subsidies toclients. (For further information on guarantee schemesfor microenterprises see Stearns 1993, and on guarantee
T H E I N S T I T U T I O N 113
114 M I C R O F I N A N C E H A N D B O O K
schemes for small and medium-size enterprises seeGudger 1997; Levitsky 1997).As an MFI continues to expand and eventually reach-
es financial self-sufficiency (revenue earned covers allcosts, including inflation and an imputed cost of capital;see chapter 8), its ability to leverage its equity (donorfunds and retained surpluses) increases. If it becomes aformally regulated financial institution, it can achieveleverage ratios of up to 12 times its equity by borrowingdirectly from commercial sources or mobilizing deposits(if regulated to do so). However, mobilizing savingsrequires substantial changes to the MFI, which are dis-cussed fully in chapter 6.An MFI is ready to access commercial financing when
it has built an equity base through past donor grants andhas a positive net worth (see box 4.18).
MFIs can access commercial debt by borrowingdirectly from commercial banks or by issuing financialpaper in the market place (box 4.19).
ACCESSING EQUITY. Capital markets can also be ac-cessed by selling shares of ownership (equity) of theMFI. For this to be possible the institution must be aformal financial intermediary with shareholders. Un-like debt instruments, equity does not have a fixedyield or maturity. Rather, equity investors invest inthe profitable future of the MFI and expect a share ofthe returns. Because the microfinance industry has notyet developed to the point where there are many in-vestors who are aware of the potential of MFIs, it may
Box 4.17 Guarantee Scheme in Sri LankaTHE GUARANTEE SCHEME IN SRI LANKA WAS STARTED IN
1979 and operated by the central bank. The scheme cov-ered 60 percent of the loan amount and was instituted asan incentive for the commercial banks to participate inthe credit line channeled through the NationalDevelopment Bank, financed by the World Bank.Between 1979 and 1995 the World Bank approved
four loans for small and medium-size enterprises for atotal of US$105 million. Repayment rates on thesubloans given from the first two World Bank loans werelow (70–73 percent), but this improved significantly tomore than 90 percent in the later bank loans.In the earlier years of operation claims were high—7
percent of guarantees claimed in 1979–80 and 13 percentin 1982–85. Substantial changes were made and claimsdropped to 2 percent in 1991–95.In 1979–96, 18,500 guarantees were given, and there
were subsequently 696 claims for guarantee payment (89rejected and 417 paid out) up to the end of 1994, for atotal of US$1.36 million. Outstanding guarantees forwhich the central bank has a contingent liability were esti-mated at a maximum total claim of US$0.88 million. Theactual and potential total loss on guarantees paid on baddebt was US$2.2 million. With 18,850 guarantees thiswas a cost to the state of US$118 per entrepreneur assist-ed. This amount was estimated to be more than offset byadditional tax generated.
Source: Levitsky 1997.
Box 4.18 Key Measures for Accessing CommercialFinancingMFIS ARE READY TO ACCESS COMMERCIAL FINANCING IF
they:� Have perfected their service delivery methods andproduct design to respond to the demands of theirmarket in a rapid and efficient way, ensuring anincreased volume of operations and repeat borrowing
� Have a strong sense of mission and a sound governingstructure that is free from political interference, so thatthey can make policy decisions that protect theirfinancial health
� Have a management team that focuses on efficient ser-vice delivery and productivity, on profits rather thanvolume, and sets productivity goals and incentiveschemes
� Have information systems that produce clear, accu-rate, timely, and relevant information for managementdecisionmaking and that focus on well-developed loantracking and financial reporting systems, reporting oncosts and income both on a profit-center basis and forthe MFI as a whole
� Have a record of achieving high levels of financial per-formance, of incorporating appropriate pricing poli-cies based on the full cost of delivering the services,and of maintaining the value of donated equity
� Maintain low levels of delinquency (well below 5 per-cent to 8 percent of outstanding portfolio, with loanloss rates below 2 percent) to ensure optimum incomeand prevent asset erosion.
Source: Clark 1997.
be some time before equity investors play an im-portant role in the funding mechanisms of MFIs.However, some equity investment funds are beingdeveloped specifically to invest in growing, sustainableMFIs.
EQUITY INVESTMENT FUNDS. Equity investment fundsprovide equity and quasi-equity (subordinated debt) toselected organizations. ProFund is one such investmentfund that was set up for the sole purpose of investing inexpanding MFIs in Latin America (box 4.20). Efforts
T H E I N S T I T U T I O N 115
ISSUING FINANCIAL PAPER REFERS TO A FORMAL IOU GIVEN
by the MFI to investors in exchange for their funds.Financial paper is issued with a fixed date on which the debtwill be paid (maturity) and a preestablished interest pay-ment (yield). The financial market then evaluates the paperin terms of yield versus risk, comparing it with every otherinvestment opportunity available. To succeed in the finan-cial market an MFI must offer at least an equally attractiveyield to alternatives that are perceived to have the same levelof risk. Accordingly, for a new entrant in the market whoserisk profile is unknown, a higher yield may be necessary.Establishing the correct risk is especially important for
an MFI operating in an industry that is itself unknown.For example, in 1994, when ACCION was placing paperissued by BancoSol to North American financial institu-tions, investors began with an expectation of returnsreflecting both country and venture capital risk. WhileBolivian country risk was unquestionably a relevant consid-eration, ACCION argued successfully that the appropriatebusiness risk, instead of being compared to venture capital,
should reflect a methodology proven by microlendingactivities deployed since 1987 by BancoSol’s predecessor,PRODEM. This long track record of success is evidencedby a consistent historical loss record of less than 1 percentof portfolio. On that basis the yield offered by BancoSolpaper was highly attractive relative to its real rather thanperceived risk.It is not necessary to become a regulated financial insti-
tution before issuing financial paper. For example, in 1995the ACCION affiliate in Paraguay, Fundación Paraguayade Cooperacion y Desarrollo, as an NGO issued 350 mil-lion guaranies in debt through the Asuncion SecuritiesExchange.In addition, it may not even be necessary for the issuing
institutions to be 100 percent financially self-sufficient toissue paper, although it is clearly preferable, as in the case ofthe Grameen Bank in Bangladesh. In the debt market it ispossible to find buyers as long as there is the firm expecta-tion that the cash flow (whether generated by operations ordonations) is sufficient to service the debt.
Box 4.19 Accessing Capital Markets by Issuing Financial Paper
Source: Chu 1996b.
PROFUND IS AN INVESTMENT FUND INCORPORATED IN
Panama and administered from Costa Rica. It was created tosupport the growth of regulated and efficient financial inter-mediaries that serve the small business and microenterprisemarket in Latin America and the Caribbean. It operates on aprofit basis, providing equity and quasi-equity to eligiblefinancial institutions so that they can expand their opera-tions on a sustainable and large-scale base. By supporting thegrowth of efficient intermediaries, ProFund aims to achievesuperior financial returns for its investors through long-termcapital appreciation of the MFIs in which it invests.At the end of 1997 ProFund was capitalized by a group
of 16 investors who have subscribed a total of more thanUS$22 million with 63 percent of the capital paid in
(ProFund Internacional 1996–97). ProFund’s sponsors(original investors) are Calmeadow, ACCION International,FUNDES (a Swiss foundation), and Société d’Invest-issement et de Développement International (SIDI), aFrench NGO consortium. Other investors include theInternational Finance Corporation, the InternationalDevelopment Bank’s Multilateral Investment Fund, and theRockefeller Foundation.By 1997 ProFund had made seven investments, with
total commitments of US$12.2 million. MFIs invested ininclude Accion Comunitaria del Peru, Banco Empresarial(Guatemala), BancoSol (Bolivia), Banco Solidario (Ecuador),Caja de Ahorro y Prestamo Los Andes (Bolivia), Finansol(Colombia), and Servicredit (Nicaragua).
Box 4.20 ProFund—an Equity Investment Fund for Latin America
Source: ProFund Internacional 1997.
are under way to establish similar funds in Africa andAsia.
SOCIALLY RESPONSIBLE MUTUAL FUNDS. There are twotypes of socially responsible mutual funds: screened andshared-return funds. With screened mutual funds, man-agers screen companies for social criteria. Profits are paidto shareholders who choose to invest in these fundsbecause they want to support socially responsible compa-nies. The Calvert Group mutual fund is an example of ascreened mutual fund (box 4.21).
Shared return funds are mutual funds owned by mem-ber organizations (MFIs). Shareholders agree to donate(share) a percentage of the return to the member organi-zations. DEVCAP (Development Capital Fund) is anexample of a shared mutual fund owned by MFI mem-ber organizations (box 4.22).
SECURITIZATION. Securitization links microfinance insti-tutions to capital markets by issuing corporate deben-tures backed by (and serviced by) the MFI’s portfolio(adapted from Chu 1996a). The structure requires thecreation of a single purpose corporation, which buys themicroenterprise portfolio and capitalizes itself by issuingdebentures into the capital market.The purpose of creating a single purpose corporation
is to acquire the microenterprise portfolios of knownentities without taking on other risks. The equity of thesingle purpose corporation comes from the microfinanceorganization and its partners. The single purpose corpo-ration uses its funds to purchase the portfolio from anMFI, which it does at a discount—that is, for less than
its face value. The amount of discount is based on thequality of the portfolio. For example, if the single pur-pose corporation purchases US$105 of portfolio foronly US$100, the additional US$5 is held in a reserve toprotect the corporation against any portfolio losses. Thisreserve amounts to roughly 5 percent of the portfolio. Inthis case the historic rate of default must be lower than 5percent and likely less than 2 percent (the reserve shouldbe greater than the historic loan loss to provide comfortfor investors). In addition, the single purpose corpora-tion has substantial equity so anyone who buys paperissued by it is highly protected.The single purpose corporation then sells commercial
paper through its financial partner, a leading brokeragefirm in the local financial market. For securitization tosucceed, the partner must be significant and wellrespected with an established network of buyers. Thepartner receives a management fee and an investmentbanking fee.The object of securitization is to increase the availabil-
ity of funds and, at the same time, reduce the cost offunds. Grameen Bank and ACCION International andits affiliate, the Fundación Ecuatoriana de Desarollo(FED) in Ecuador, are two MFIs that are either consider-
116 M I C R O F I N A N C E H A N D B O O K
Box 4.21 The Calvert Group—a Screened Mutual FundONE TO 3 PERCENT OF THE CALVERT GROUP’S ASSETS AREinvested in “high social impact” instruments such as MFIs.Eligible institutions must have loan capital of at leastUS$300,000 from diverse sources and demonstrate theneed for more capital. The cost of borrowing by the MFIsis generally below market rates by 3 percent or 4 percent.Renewable loan terms are for one year, and the average loanamount is US$100,000. Investors risk receiving a lowerreturn than from other mutual funds, depending on thesuccess of the overall investment strategy of the fund.
Source: Calvert Group.
Box 4.22 DEVCAP—a Shared-Return FundDEVCAP (DEVELOPMENT CAPITAL FUND) IS A MUTUALfund designed to provide financial returns to its investorsas well as provide its members with revenue. DEVCAPrepresents a consortium of MFIs that invested initial capi-tal to develop an asset base for the fund. Additional capi-tal is provided by public investors. The assets of the fundare invested in a leading socially screened portfolio (socialequity portfolio) based on the Domini Social Index,which consists of the stocks of approximately 400 U.S.companies chosen for their corporate and social responsi-bility as well as their financial performance. The returnearned on the investments is shared between the investorand DEVCAP. The tax-deductible donation made by theinvestor ranges from 50 percent to 100 percent of thereturn earned.The return earned by DEVCAP is shared among its
member MFIs. Members include Appropriate TechnologyInternational, Catholic Relief Services, Save the Children,and the Seed Capital Development Fund.
Source: Development Capital Fund.
ing or have successfully achieved securitization of theirportfolios. (For an explanation of the structure that FEDused for securitizing its portfolio, see Chu 1996a.)Because both debt and equity represent a willingness
to accept financial risk, the fundamental factor that deter-mines the sustainability of access to capital markets is theinstitution’s credibility as perceived by investors, whetherthey are lenders or shareholders. To link with capital mar-kets MFIs must provide clear and solid answers to suchcritical questions of governance as (Chu 1996b):� Can MFIs that are NGOs or have NGO owners pro-vide financial markets with the assurance that they willmake decisions with the same standards of prudence asenterprises that have traditional shareholders with com-mercial monies at risk?
� Will NGOs be able to resist the temptation to letnonfinancial considerations—whether lofty or base—overwhelm return considerations, because, in theabsence of commercial shareholders, they are ulti-mately accountable only to their institutional mission?
� Can boards of directors of NGOs effectively controlmanagement?
� Will donor agencies be able to distinguish betweenthose NGOs that can live up to the required stan-dards and those that cannot?
� In some cases, particularly in Asia, clients becomeshareholders as part of the methodology. Will suchatomized owners be able to participate in a meaning-ful way, and, if so, will the cumulative effect ofminuscule portions of ownership lead to commercial-ly sound results?
� Will NGOs that have generated their equity throughgrants and donations be able to exhibit the same disci-pline and rigor as a private investor? For example, canan institution like ACCION invest in BancoSol withfunds provided by donor agencies and behave like acommercial investor?Answers to these questions will become apparent as
the field of microfinance grows and more MFIs begin toaccess capital markets.
Institutional Capacity Building
Regardless of institutional type and ways of managinggrowth, all MFIs need to periodically review their institu-tional capacity and consider where they might make
improvements. For more formalized institutions this mayrequire a greater focus on client needs through improvedproduct development and human resource management.For NGOs this may include the adoption of a formalbusiness planning process, improved financial and pro-ductivity management, and new funding sources.Since the purpose of this handbook is to improve the
institutional capacity of MFIs, it is useful to briefly high-light the institutional capacity issues that many MFIs arefacing and to identify where these issues are addressed inthis and following chapters.Institutional capacity issues include (SEEP Network
1996a):� Business planning. An MFI needs to be able to trans-late its strategic vision into a set of operational plansbased on detailed market and organizational analysis,financial projections, and profitability analyses.Appendix 2 provides an outline for businessplanning.
� Product development. An MFI must be able to diversi-fy beyond its original credit products (usually indi-vidual, solidarity group lending, or both) into otherareas such as savings, which can provide desired ser-vices to clients and accommodate their growth. AnMFI must also be able to price its products on thebasis of operating and financial costs and demand inthe marketplace. This requires periodic review toensure appropriate pricing. (For more on the devel-opment and pricing of credit and savings products,see chapters 5 and 6 respectively.)
� Management information systems. As MFIs grow oneof their greatest limitations is often their man-agement information system. It is imperative that anMFI have adequate information systems for financialand human resource management. For example,establishing an effective incentive system dependscritically on the existence of a good managementinformation system, which then allows managementto track the various indicators of performance that itwants to reward. (For a more detailed discussion ofmanagement information systems, see chapter 7.)
� Financial management. Improvements in accountingand budgeting are often required to monitor loanportfolio quality, donor subsidies, and the growingvolume of operations. Additional skills are required in:� The adjustment of financial statements for subsi-dies and inflation
T H E I N S T I T U T I O N 117
� Portfolio risk management, including appropriaterisk classification, loan loss provisioning, andwrite-offs
� Performance management, including profitabilityand financial viability
� Liquidity and risk management, focused on effec-tively administering portfolios largely based onshort-term loans
� Asset and liability management, including appro-priate matching of amortization periods in rela-tion to the loan portfolio and asset managementand capital budgeting processes that are inflationsensitive.
(For a discussion of financial management see chapters 8through 10.)
Efficiency and productivity enhancement. MFIs mustbe able to operate in a way that best combines standard-ization, decentralization, and incentives to achieve thegreatest output with the least cost. They must also devel-op systems for staff recruitment and selection, compen-sation, training, and motivation to support staffcommitment and accountability. (For further informa-
tion about efficiency and productivity enhancement seechapter 10.)The credit unions in Guatemala present a good
example of the importance of periodic reviews and afocus on institutional capacity building (box 4.23).
Appendix 1. MFI Operational Review
The following outline is from SEEP Network 1996b andwas developed by Calmeadow, Toronto, Canada.
Definition
The operational review is a tool used to evaluate the insti-tutional maturity of a microfinance organization. Anoperational review helps an NGO planning to transforminto a self-sufficient microfinance intermediary to evaluateits readiness. This tool draws on lessons from the formalbanking sector, from Calmeadow’s own observationsworking with microfinance institutions, and from recentpublications on institutional development.
118 M I C R O F I N A N C E H A N D B O O K
IN MID-1987 THE U.S. AGENCY FOR INTERNATIONALDevelopment contracted the World Council of CreditUnions to provide technical and financial assistance to theNational Credit Union Federation. During the course of theproject a major restructuring of the Guatemalan credit unionmovement took place. New financial tools and disciplineswere developed and tested in 20 community credit unionscountrywide. Their use transformed the credit unions intomodern, effective financial intermediaries, capable of com-peting in commercial financial markets.Guatemalan credit unions had followed a traditional devel-
opment model for 25 years. This model was based on the the-ory that the rural poor lacked the resources necessary to saveand thereby fuel their development potential. Internationaldonors responded to the lack of local resources by providingthe credit unions with external capital at subsidized rates foron-lending to their members. Loan sizes were based on a mul-tiple of the amount of shares a member held in the creditunion rather than on the member’s repayment capacity.Shares earned very low returns, so the only purpose in savingwas to access a loan. The traditional model discouraged sav-
ing, encouraged borrowing, and forced those who saved tosubsidize those who borrowed. Over time, the response ofmany members was to find a way to borrow-out their sharesavings with no intention of ever repaying the loan.In the new model created through the project, the focus
was shifted from share savings to voluntary deposits with acompetitive rate of return. Subsidized external financing waseliminated, and because all funding came from internallymobilized deposits, loans were priced based on market rates.Loan approvals were based on the repayment capacity of theborrower. Earnings were capitalized rather than distributedto members, so that the credit unions’ capital maintained itsvalue. The credit unions undertook a market-based, results-oriented business planning process. And finally, improvedfinancial reporting control and evaluation was institutedthrough intensive training.While the process was slow and difficult and required sig-
nificant changes in the attitudes of elected leaders, employ-ees, and the member-owners, the result was greater financialindependence, stronger and safer credit union operations,and superior, member-driven financial services.
Box 4.23 Credit Unions Retooled
Source: Richardson, Lennon, and Branch 1993.
The Tool
The operational review provides the user with guidelineson how to evaluate a microcredit program in seven keyareas: corporate governance, market and clients, creditmethodology, distribution, human resource management,computerization, and financial management. Each topicincludes three sections: documentation, indicators ofhealth, and transformation issues.
How the Tool Works
The review involves a thorough documentation of theoperating procedures and institutional characteristics ofthe organization and an evaluation of these factorsagainst performance levels currently being achieved byleading micro-finance institutions worldwide.An operational review takes about 2 weeks (or 10
working days) of on-site field work to gather the informa-tion required from an intermediate level organization(more than 2,000 clients). This includes collecting andsynthesizing a large amount of data and materials as well asinterviews with all senior managers, a comprehensive sam-ple of other head office staff and field staff, and clients.Two useful products can result from an operational
review:1. A detailed documentation of the organization that canbe given to visitors, researchers, funders, and groupswho may want to start a microcredit program and arelooking for lessons from current practitioners.
2. An evaluation of the organization’s readiness for rapidgrowth and transformation, comprising of two sec-tions—one on institutional capacity in general andone on issues particular to transformation.
Operational Review: An Outline
1. Corporate governance2. Markets and clients3. Credit methodology4. Distribution5. Human resource management6. Computerization7. Financial managementFor each topic above, this outline includes three sections:
� Documentation—A checklist of items to be collectedand documented during the review.
� Indicators of health—Standards against which to eval-uate the organization. As we gain experience withapplying the tool, these standards will become morequantitative.
� Transformation issues—Issues requiring thought andattention if the organization is contemplating trans-forming into a regulated financial intermediary.
1. CORPORATE GOVERNANCE
Documentation� History, institutional type/incorporation, vision andgoals
� Board of directors (names and professions/areas ofexpertise, regularity of meetings; committees of theboard, term of members, and board renewal proce-dures)
� Managing director and senior management (namesand experience; years of service)
Indicators of health� Vision and goals clearly articulated and consistent� Evidence of a strong sense of mission� Board well constituted, with a mixture of financialservices and other business
� Legal, marketing, fundraising, and community devel-opment skills
� Board members well informed about the globalmicrofinance sector and committed to the vision ofthe organization
� Board members who are active in committees� Depth of experience and strong leadership demonstrat-ed by the managing director and senior management
� Strong commitment by senior management towardthe vision of the organization. Sufficient breadth anddepth of senior management so organization is notvulnerable to the loss of any one individual.
� A business planning process and strategic plans inplace.
� If microfinance is just one activity of the organization,the financial services are run and monitored indepen-dently, unencumbered by other nonfinancial activities.
Transformation issues� What new corporate structures are being contemplat-ed? Do these make sense? Does transformation makesense given the institutional maturity of the organiza-tion? Is transformation being contemplated for the
T H E I N S T I T U T I O N 119
right reasons or should other options be considered atthis point in time?
� Will the new structure require a different mission, or isthe new structure just a different vehicle for imple-menting the same mission? (Business versus socialdevelopment mission.)
� How will ownership of the new organization be struc-tured? Will new partners be required? What type ofpartners are most desirable? What combination of for-profit and not-for-profit institutions?
� Do all board members fully understand and supportthe goal of transformation?
� Will the board need to be reconstituted for the trans-formed organization?
� Do all senior managers fully understand and supportthe goal of transformation?
2. MARKETS AND CLIENTS
Documentation� State of small and microenterprise sector in the coun-try (how large? how sophisticated? how literate?)
� Barriers faced (cultural and political factors)� Suppliers of microcredit in the country; competitors� Target markets (size, type and subsector, gender, geo-graphic coverage)
� Policies on client graduation� Profile of current borrowers (size of microenterprisesserved; three most common activities by gender; dis-tribution by sector: trade, manufacturing, service;proportion of new versus repeat borrowers; propor-tion of female borrowers)
� New product development (how done and who isaccountable)
Indicators of health� Target markets are clearly articulated; ideally only oneor two primary targets. If more than one target, thedifferent markets should work well together withinone delivery structure.
� Profile of current borrowers should match the targets.� Low client drop out rates/high renewal rates. Clientsexpress a high level of satisfaction with the service.New clients approach the organization voluntarily.
� A strong “client service” culture is evident.� Client and market research is conducted on a regularbasis; innovation in meeting the evolving needs ofclients is valued.
� New product development is viewed as a necessary andongoing activity in the organization and accountabilityfor product enhancements and new product develop-ment is clearly assigned to appropriate personnel.
Transformation issues� The size of target markets should be sufficiently largeto sustain a self-sufficient microfinance institution.
� Will transformation require a redefinition of the tar-get market or a departure from the current target?Will it threaten the current market focus?
3. CREDIT METHODOLOGY
Documentation� Product design (loan amounts (sizes), terms, andrepayment frequency; pricing; interest and fees; savingsproducts and requirements; insurance or other funds)
� Eligibility criteria (gender, age, years of experience inbusiness, collateral, guarantors, peer groups, other col-lateral substitutes; legal, cultural, or other regulatoryrequirements)
� Credit delivery procedures (promotions, screening,orientation, group formation, applications and dis-bursements, repayments, renewals)
� Delinquency management (reports and monitoring;enforcement/follow-up procedures; incentives andsanctions: i) rewards for timely repayment, ii) penal-ties for late payment, iii) consequences of default,insurance/use of savings, policies on rescheduling,refinancing, and death of borrower)
Indicators of health� The basic methodology appears to be well-tested andstable.
� Product design appears to suit business needs of bor-rowers.
� Eligibility criteria are easy to meet—not too restrictive.� For group-based programs, group cohesion appears tobe strong.
� Delivery procedures minimize inconvenience andtransaction costs for client.
� Delivery procedures minimize chances for fraud.� Branch procedures are routine/standardized and facili-tate loan officer work flow—they make it easy forloan officers to conduct their work effectively.
� Strong relationship is evident between clients andloan officer.
120 M I C R O F I N A N C E H A N D B O O K
� Delinquency management is tightly enforced. Pro-cedures for late payment follow-up are triggered auto-matically after certain time periods. Loan officers notinvolved in collections once client is no longer negoti-ating in good faith. Incentives and sanctions appear tobe effective. Late payments are minimal.
� Repayment/recovery rates are calculated according tointernational standards and are above 85% (for cumu-lative repayment, including arrears)
� Portfolio at risk rates are calculated according to inter-national standards and are <10%
Transformation issues� Will transformation require any change to the currentmethodology? How will this be perceived by the client?
4. DISTRIBUTION
Documentation� Type, number, and location of field offices (diagramif desirable)
� Outreach / branching / growth strategy� Nature and strength of relationships with related orsupporting institutions that assist with operations andoutreach (such as banks)
Indicators of health� Branching strategy is clearly articulated and makessense—urban versus rural—builds economies ofscale—not too sparse
� Strong relationships with supporting institutions, thatis, banks, collection agencies
Transformation issues� How will the transformation affect relationships withother institutions? Will contracts need to be revised?
5. HUMAN RESOURCE MANAGEMENT
Documentation� Organigram of head office and field personnel structures.� For primary operations staff (hiring criteria and pro-cedures, job descriptions, training program; compen-sation policies, incentive scheme design, otherrecognition and reward mechanisms).
� For head office positions (any unusual or noteworthyhiring or training policies, compensation policies,incentive scheme design, other recognition andreward mechanisms).
� Apparent culture of organization—hierarchical orparticipatory.
� Apparent employee satisfaction levels; turnover lev-els—head office and field offices.
� Existence of an employee union or association.� Existence of an employee newsletter.� Appraisal system.� Promotion policies/succession planning.� Other innovative personnel policies.
Indicators of health� Head office size and structure that is appropriate forthe size of operations currently and in the near future.
� Branch organization structure is streamlined, mini-mizes overhead, and does not put too much stress onmanagers.
� Span of control for managers is close to the ideal offive to seven direct reports each.
� Sufficient number of qualified candidates applying toadvertised positions. Appropriate “incubators” forstaff identified, for example, technical colleges. Timespent screening candidates is minimized. Progressivehiring policies in place (that is, gender sensitive).
� Job descriptions that are available, clearly written, andemphasize expected outputs rather than activities. Nooverlaps or underlaps in accountabilities betweendepartments and individuals.
� Training materials are thorough and well designed,covering philosophy and client service concepts aswell as technical skills. A period of coaching/mentor-ing built into the training. Training period screensout inappropriate candidates. Length and cost oftraining minimized.
� Compensation policies are set to attract the right cal-iber of staff.
� Incentive schemes are designed to reward portfolioquality as well as volume, and incentive amounts are setrelative to the extra income earned through enhancedperformance.
� Employees who express a high level of satisfactionwith their work. Low employee turnover. No antago-nistic employee unions or associations.
� Dynamic use of employee newsletter, with contribu-tions from employees. Strong internal communicationsand transparency. A team spirit evident in all activities.
� Appraisal systems, promotions policies, and otherpolicies are perceived as fair.
T H E I N S T I T U T I O N 121
Transformation isues� Will all head office and field operations go to the newinstitution or will some remain?
� Will split be clean or will there be complex relation-ships between the NGO and the new institution?
� Will head office functions be shared between institu-tions?
� How do staff members feel about the proposedtransformation? Are they aware of it, do they under-stand the reasons for it, are they supportive of it?What are their biggest concerns regarding transfor-mation?
� If the organization is being divided into two, will thesame human resources policies apply to both? Willthere be a differential in compensation levels? Howwill this be handled?
6. COMPUTERIZATION
Documentation� Current state of automation
� head office and field offices� loan portfolio system, accounting system, othersystems?
� Hardware and software used, development tools used,network design
� Existence of functional specifications� Level of staff satisfaction with current systems� Profile and depth of information systems department� Procedures used for auditing systems.
Indicators of health� Degree of automation in line with size and complexi-ty of organization, degree of automation in line withdependability of communications infrastructure in thecountry
� Diversification of risk—avoid dependence on a singleprogrammer to develop and maintain the systems,and avoid dependence on one expensive firm to makesmall updates to the systems
� Hardware and software used should be well supportedlocally, development tools should be well knownlocally
� Apparent high level of staff satisfaction with the sys-tems
� Strong information systems manager and depart-ment—knowledgeable, reliable, service-oriented
� Effective procedures in place for auditing systems.
Transformation issues� What systems changes will be required to accommo-date new reporting requirements for the new institu-tion?
� Will the current system be able to handle rapid growthand increased complexity over the next 18 months?
7. FINANCIAL MANAGEMENT
Documentation� Financial statements (when produced? when audited?how consolidated?)
� Relationship with auditors (availability of profit andcost center information and statements, availability ofmultiple year financial forecasting models)
� Budgeting process� Cash flow management—cash flow forecasting, liquid-ity monitoring, minimizing idle cash, bank accountmanagement
� Delinquency management—repayment rates, portfolioaging, arrears aging, provision and write-off policies
� Internal controls to avoid fraud, negligence, and theft,internal audit procedures
� Sources of capital and relationship withbankers/funders, average cost of capital
� Size of equity base in relation to total assets� Self-sufficiency management—operational efficiency,productivity, and self-sufficiency ratios.
Indicators of health� Financial statements are produced and audited at leastannually
� Statements should be produced for the financial ser-vice activities of the organization unconsolidated fromany other nonfinancial activities
� Auditing firm should be respected and ideally havesome financial sector experience/expertise
� Income statements and key ratios are available foreach primary operating unit—branch/region/total
� A three- to five-year financial forecasting model is inplace and actively used to assist with pricing and otherpolicy setting and steer the organization towardprofitability.
� An annual budgeting process is in place and is used tocontrol expenses.
� Cash flows are well managed—liquidity problems areavoided, idle cash is minimized, and bank charges areminimized.
122 M I C R O F I N A N C E H A N D B O O K
� Delinquency and default are closely monitored andtightly managed; appropriate provision and write-offpolicies are in place and properly implemented.
� Sufficient sources of loan capital are in place to fundexpected growth. The average cost of capital is kept to aminimum. The relationship with banks is approachedas a business relationship, not as a public relations ordonations relationship. Over time, the organization ismoving away from subsidized sources of funding anddeveloping a good reputation with commercial funders.
� The equity base is sufficient in relation to overallassets and performing assets.
� Key ratios of operational efficiency, productivity,and self-sufficiency are regularly monitored andguide the decisionmaking of board and senior man-agement. Key ratios are steadily improving, withfull self-sufficiency likely to be reached within 12 to24 months.
� Management information reports are timely, accurate,and relevant.
� Key reports include:� Actual payments against expected payments—forfield staff
� Client status report—for field staff� Bad debts report—for field staff and head office� Aging of arrears—for field staff and head office� Aging of portfolio—for head office� Performance indicators report—for head officeand board of directors.
� Break-even analyses are available and guide decision-making.
� Pricing is carefully managed. Calculations are availablefor effective costs to the client and for effective yields tothe organization. Rates are established in order to coveroperating costs, loan losses, and financial costs and toachieve a profit at certain levels of operation.
Transformation issues� How will financial statements need to be revised forthe new organization(s)?
� Will new auditors need to be appointed?� How will bank accounts and liquidity managementbe affected?
� How will internal audit procedures need to bechanged?
� Are current subsidies in place today, due to the orga-nization’s non-profit status, which will no longer be
available after transformation? How will the highercosts affect self-sufficiency levels? (consider operatingcost subsidies and financial cost subsidies.)
� How should the capital structure for the new organi-zation be designed? How much control needs to bemaintained? What kind of shareholders are desirable?How much capital is required to support the newinstitution for the first few years of its existence? Whatis an optimum debt to equity ratio for the new insti-tution?
� What will be the dividend policy for the first three tofive years of the transformed institution?
Appendix 2. Manual for Elaboration of aBusiness Plan
The following outline is from SEEP Network 1996b andwas developed by CENTRO ACCION Microempresarial,Bogota, Colombia, and ACCION International, Cam-bridge, Mass.
Definition
This manual provides guidelines for creating a businessplan. It is divided into nine chapters, each of whichcovers a distinct part of a business plan, from marketanalysis to portfolio projections to estimating opera-tional costs. The core chapters provide instructions fordata gathering and analysis that feed directly into theconstruction of standard financial statements. Becausethe manual was written for ACCION affiliates, itfocuses on planning for the expansion of credit ser-vices.
The Tool
The original tool is a 45-page manual, in spanish, withthe following chapters: Institutional Analysis, DefiningMarket Size, Identifying the Competition, Projectingthe Portfolio, Market Penetration, Financing Expansion,Operational Costs, Priority Projects, Projective Finan-cial Statements.The tool included here is an English summary of the
manual, which highlights the main themes in each chap-ter and provides some examples of the many illustrativetables and charts found in the original.
T H E I N S T I T U T I O N 123
How the Tool Works
The business plan is a document that explicitly establish-es an institution’s trajectory over a three-year period. It isthe tool by which an institution’s mission gets translatedinto measurable targets. These targets are set in functionof market demand and the competition. They informincome and expense projections that take sustainabilityfrom theory to reality.In light of its mission, an institution sets targets for
the market share it will achieve by the end of the three-year planning period. Market share, defined by geo-graphic area, translates into a certain number of branchoffices and field staff, which in turn determines the insti-tution’s cost structure. From these targets, the portfoliosize can be deduced, which then points to the amount offunding required. Internal coherence is then determinedby combining the product pricing, the cost structure,and the financing plan to form the income statement.The Business Plan process begins with an ACCION
team (usually two people, one of whom is often the presi-dent) making a visit that includes a formal presentation ofthe state of the microfinance program and of its medium-term goals. The business plan tool is presented and stafflearn how to apply it. This takes place over a two-dayperiod in the presence of all members of the institution’stop management and, in some cases, with the attendanceof board members. While concepts related to the missionare discussed, most of the time is spent on issues, includ-ing the type and size of the market, the relative strength ofthe competition, setting realistic growth targets based on anumber of key assumptions, and definition of a handfulof priority projects that will have to be carried out if theproposed objectives are to be achieved. At the end of thetwo-day period, a time line for completing different draftsof the business plan is agreed upon.Most of the work is then carried out by the affiliates
themselves, over a period of two to four months. Thework is divided among departments, with each managerresponsible for involving his/her staff in the process tothe fullest extent. As drafts of the plan are produced, theyare sent to ACCION for a critical review of the assump-tions and internal consistency.The strength of the business plan lies in the way in
which all elements, and every decision, have a financialimplication with an impact on financial performance andthe bottom line. This requires analytical rigor. It also forces
an integration of all elements of the plan, as well as func-tional integration of the managers who formulate and over-see it. Using a financially based planning tool helpsmanagers adapt to changing conditions and knowmore pre-cisely how their decisions will affect financial performance.The plan serves as a reference tool to clarify priorities, unifyefforts, avoid contradictions and evaluate the performancesof both the institution and individual employees.Moreover, for affiliates in the ACCION network, the
business plan is an essential tool in building relationshipswith the formal financial sector. Without a plan, finan-cial markets will not be disposed to increase lines of cred-it or negotiate more favorable terms.
1. INTRODUCTION
What is business planning?It is a process by which an organization defines a pathfrom its current situation to where it wants to be at adetermined point in the future.
How is it used?In the course of business planning, the organizationdetermines its destination (within a three-year horizon)and designs the road to get there. It establishes numeri-cally defined objectives, strategies, and actions. Thisdiagnosis helps to answer two important questions:� Can the organization successfully travel along this path?� What additional resources will it need and how will itsecure them?
Who participates in the business planning process?The entire management team must participate to ensurethat all of the pieces of the planning puzzle fit, resultingin a consistent, coherent plan.
What are the characteristics of a successful business plan?� Involves entire management team� Identifies key elements that differentiate the programfrom other similar organizations and explain its success
� Analyzes the environment, including the market andcompetition
� Defines the organization’s objectives� Identifies strategies to overcome obstacles to achiev-ing objectives
� Analyzes the financial implications of these strategies� Translates the objectives, strategies and resources intonumerical terms that are void of inconsistencies.
124 M I C R O F I N A N C E H A N D B O O K
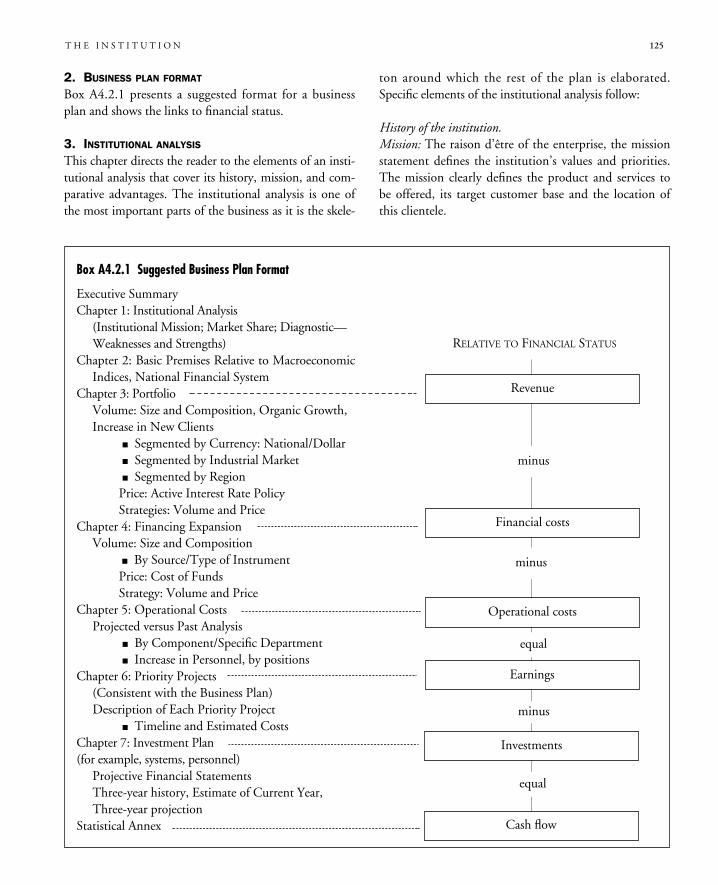
2. BUSINESS PLAN FORMAT
Box A4.2.1 presents a suggested format for a businessplan and shows the links to financial status.
3. INSTITUTIONAL ANALYSIS
This chapter directs the reader to the elements of an insti-tutional analysis that cover its history, mission, and com-parative advantages. The institutional analysis is one ofthe most important parts of the business as it is the skele-
ton around which the rest of the plan is elaborated.Specific elements of the institutional analysis follow:
History of the institution.Mission: The raison d’être of the enterprise, the missionstatement defines the institution’s values and priorities.The mission clearly defines the product and services tobe offered, its target customer base and the location ofthis clientele.
Box A4.2.1 Suggested Business Plan Format
Executive SummaryChapter 1: Institutional Analysis(Institutional Mission; Market Share; Diagnostic—Weaknesses and Strengths)
Chapter 2: Basic Premises Relative to MacroeconomicIndices, National Financial System
Chapter 3: PortfolioVolume: Size and Composition, Organic Growth,Increase in New Clients
� Segmented by Currency: National/Dollar� Segmented by Industrial Market� Segmented by RegionPrice: Active Interest Rate PolicyStrategies: Volume and Price
Chapter 4: Financing ExpansionVolume: Size and Composition
� By Source/Type of InstrumentPrice: Cost of FundsStrategy: Volume and Price
Chapter 5: Operational CostsProjected versus Past Analysis
� By Component/Specific Department� Increase in Personnel, by positions
Chapter 6: Priority Projects(Consistent with the Business Plan)Description of Each Priority Project
� Timeline and Estimated CostsChapter 7: Investment Plan(for example, systems, personnel)Projective Financial StatementsThree-year history, Estimate of Current Year,Three-year projection
Statistical Annex
T H E I N S T I T U T I O N 125
Revenue
Financial costs
Operational costs
Earnings
Investments
Cash flow
RELATIVE TO FINANCIAL STATUS
minus
minus
minus
equal
equal
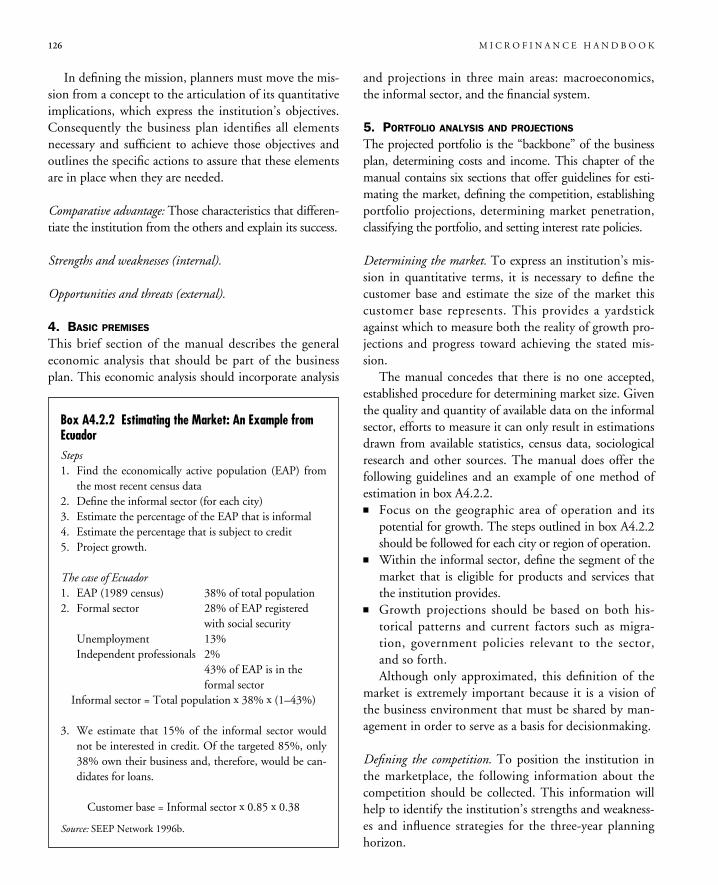
In defining the mission, planners must move the mis-sion from a concept to the articulation of its quantitativeimplications, which express the institution’s objectives.Consequently the business plan identifies all elementsnecessary and sufficient to achieve those objectives andoutlines the specific actions to assure that these elementsare in place when they are needed.
Comparative advantage: Those characteristics that differen-tiate the institution from the others and explain its success.
Strengths and weaknesses (internal).
Opportunities and threats (external).
4. BASIC PREMISES
This brief section of the manual describes the generaleconomic analysis that should be part of the businessplan. This economic analysis should incorporate analysis
and projections in three main areas: macroeconomics,the informal sector, and the financial system.
5. PORTFOLIO ANALYSIS AND PROJECTIONS
The projected portfolio is the “backbone” of the businessplan, determining costs and income. This chapter of themanual contains six sections that offer guidelines for esti-mating the market, defining the competition, establishingportfolio projections, determining market penetration,classifying the portfolio, and setting interest rate policies.
Determining the market. To express an institution’s mis-sion in quantitative terms, it is necessary to define thecustomer base and estimate the size of the market thiscustomer base represents. This provides a yardstickagainst which to measure both the reality of growth pro-jections and progress toward achieving the stated mis-sion.The manual concedes that there is no one accepted,
established procedure for determining market size. Giventhe quality and quantity of available data on the informalsector, efforts to measure it can only result in estimationsdrawn from available statistics, census data, sociologicalresearch and other sources. The manual does offer thefollowing guidelines and an example of one method ofestimation in box A4.2.2.� Focus on the geographic area of operation and itspotential for growth. The steps outlined in box A4.2.2should be followed for each city or region of operation.
� Within the informal sector, define the segment of themarket that is eligible for products and services thatthe institution provides.
� Growth projections should be based on both his-torical patterns and current factors such as migra-tion, government policies relevant to the sector,and so forth.Although only approximated, this definition of the
market is extremely important because it is a vision ofthe business environment that must be shared by man-agement in order to serve as a basis for decisionmaking.
Defining the competition. To position the institution inthe marketplace, the following information about thecompetition should be collected. This information willhelp to identify the institution’s strengths and weakness-es and influence strategies for the three-year planninghorizon.
126 M I C R O F I N A N C E H A N D B O O K
Box A4.2.2 Estimating the Market: An Example fromEcuadorSteps1. Find the economically active population (EAP) fromthe most recent census data
2. Define the informal sector (for each city)3. Estimate the percentage of the EAP that is informal4. Estimate the percentage that is subject to credit5. Project growth.
The case of Ecuador1. EAP (1989 census) 38% of total population2. Formal sector 28% of EAP registered
with social securityUnemployment 13%Independent professionals 2%
43% of EAP is in theformal sector
Informal sector = Total population x 38% x (1–43%)
3. We estimate that 15% of the informal sector wouldnot be interested in credit. Of the targeted 85%, only38% own their business and, therefore, would be can-didates for loans.
Customer base = Informal sector x 0.85 x 0.38
Source: SEEP Network 1996b.
� Who are the competitors?� Size� Funding sources� Client base� Market niche� Marketing methods� Portfolio size and quality� Methodology� How solid are they?� Pricing� Time to deliver service� Marketing methods� Numbers.It can be helpful to construct a “Chart of Comp-
etition,” placing competitors on a graph defined byinterest rates and non-monetary costs. In addition tolocating the institution in relation to its competitors, thegraph can be used to show its movement in time.
Projecting the portfolio. Projections of portfolio growthmust be made on two levels: loan volume of existingclients in the current portfolio and loan volume attrib-uted to new clients. While the institution has the optionto take new clients or not, it must attend to the needs ofexisting clients. (Inability to do so would trigger wide-spread delinquency and even default.) Additional factorsto consider in projecting the portfolio include:� Client drop-out rate� Growth pattern of average loan size over time—influenced by average loan term, cyclical nature ofdemand, influence of inflation on initial loan size,and new loan products with different characteris-tics.
Estimating market penetration. The relationship of theportfolio projections to the estimated market for credityields the market penetration (MP ). Calculating theinstitution’s market penetration serves as a reality checkfor the projections:
Classifying the portfolio. The portfolio must be disaggre-gated or classified by a number of factors that have animpact on cash flow and costs. These include:� Loan size and number� Loan maturities� Life of the client with the program
� Indicators of portfolio quality: delinquency and default.Interest rate policies. The final part of portfolio projec-tions is setting the interest rate(s), which will be based onthe following factors:� Market rates (researched as part of competitionanalysis)
� Operating costs (explained in chapter 8).� Financial costs (a weighted average)� Capitalization objectives (that is, targeted level ofretained earnings generated by the portfolio deter-mined during the institutional analysis).Although there are various methods for setting inter-
est rates, one simple example is illustrated below:Interest rate charged 20%– Financing costs 10%= Financial margin 10%– Operating costs 5%= Operating margin 5%Desired margin 8%
With estimated financing and operating costs, theinterest rate can be set to achieve the desired margin. Inthis example, the institution has not achieved its desiredmargin leaving it with the option to raise its interest rateor reduce costs. This is a dynamic process in which theprojections and parameters will need to be adjusted tosecure the desired results.
6. FINANCING EXPANSION
This chapter identifies various funding sources—theircharacteristics, costs, and conditions. Each is analyzed foraccessibility and inherent risks. Here are two sources offunding: internal (retained earnings) and external (dona-tions, shareholder capital, soft loans, commercial loans,and deposits). With the portfolio growth and the desiredrate of capitalization established, external funding needscan be determined. Assuming multiple sources at varyingcost, it is necessary to establish a weighted average of thesources to estimate the institution’s financial costs. TableA4.2.1 provides a hypothetical example. The weightingfactor for each funding category is the product of the pro-portion of the total external capital and the effective inter-est rate. The sum of the weights is the weighted averageinterest rate the organization pays on its external capital.
7. OPERATIONAL COSTS—PAST AND PROJECTED
Offices and staff by city or geographic area. Disaggregatecosts by office. Personnel, the most significant cost,
T H E I N S T I T U T I O N 127
MPCustomer base (defined in projected portfolio)
=Potential market
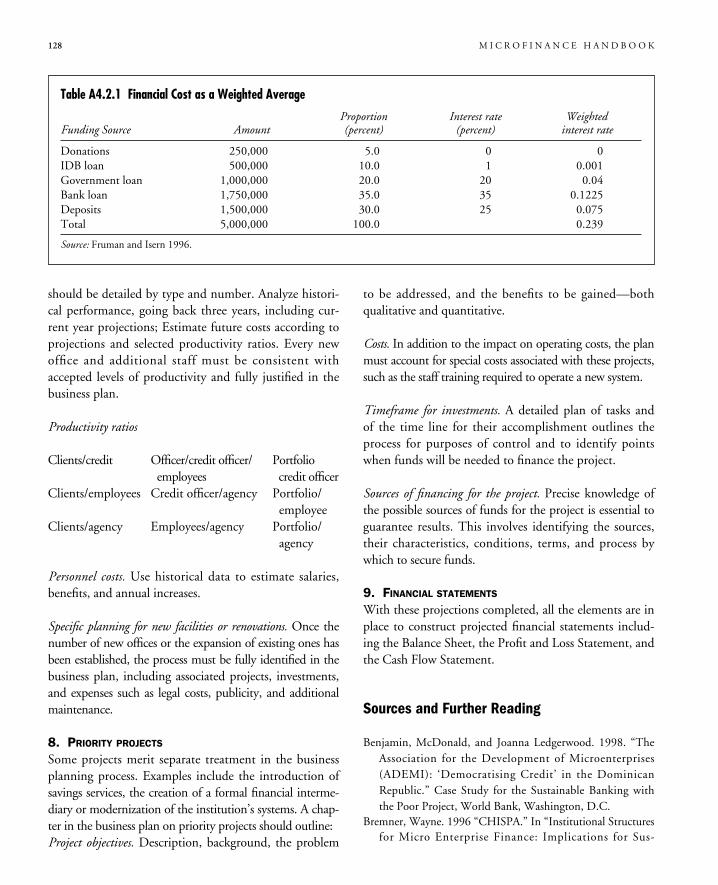
should be detailed by type and number. Analyze histori-cal performance, going back three years, including cur-rent year projections; Estimate future costs according toprojections and selected productivity ratios. Every newoffice and additional staff must be consistent withaccepted levels of productivity and fully justified in thebusiness plan.
Productivity ratios
Clients/credit Officer/credit officer/ Portfolioemployees credit officer
Clients/employees Credit officer/agency Portfolio/employee
Clients/agency Employees/agency Portfolio/agency
Personnel costs. Use historical data to estimate salaries,benefits, and annual increases.
Specific planning for new facilities or renovations. Once thenumber of new offices or the expansion of existing ones hasbeen established, the process must be fully identified in thebusiness plan, including associated projects, investments,and expenses such as legal costs, publicity, and additionalmaintenance.
8. PRIORITY PROJECTS
Some projects merit separate treatment in the businessplanning process. Examples include the introduction ofsavings services, the creation of a formal financial interme-diary or modernization of the institution’s systems. A chap-ter in the business plan on priority projects should outline:Project objectives. Description, background, the problem
to be addressed, and the benefits to be gained—bothqualitative and quantitative.
Costs. In addition to the impact on operating costs, the planmust account for special costs associated with these projects,such as the staff training required to operate a new system.
Timeframe for investments. A detailed plan of tasks andof the time line for their accomplishment outlines theprocess for purposes of control and to identify pointswhen funds will be needed to finance the project.
Sources of financing for the project. Precise knowledge ofthe possible sources of funds for the project is essential toguarantee results. This involves identifying the sources,their characteristics, conditions, terms, and process bywhich to secure funds.
9. FINANCIAL STATEMENTS
With these projections completed, all the elements are inplace to construct projected financial statements includ-ing the Balance Sheet, the Profit and Loss Statement, andthe Cash Flow Statement.
Sources and Further Reading
Benjamin, McDonald, and Joanna Ledgerwood. 1998. “TheAssociation for the Development of Microenterprises(ADEMI): ‘Democratising Credit’ in the DominicanRepublic.” Case Study for the Sustainable Banking withthe Poor Project, World Bank, Washington, D.C.
Bremner, Wayne. 1996 “CHISPA.” In “Institutional Structuresfor Micro Enterprise Finance: Implications for Sus-
128 M I C R O F I N A N C E H A N D B O O K
Table A4.2.1 Financial Cost as a Weighted Average
Proportion Interest rate WeightedFunding Source Amount (percent) (percent) interest rate
Donations 250,000 5.0 0 0IDB loan 500,000 10.0 1 0.001Government loan 1,000,000 20.0 20 0.04Bank loan 1,750,000 35.0 35 0.1225Deposits 1,500,000 30.0 25 0.075Total 5,000,000 100.0 0.239
Source: Fruman and Isern 1996.
tainability and Expansion.” In Moving Forward: EmergingStrategies for Sustainability and Expansion. The SEEPNetwork, New York: PACT Publications.
Calmeadow. 1996. “Planning for Institutional Trans-formation—Analysis of a Microfinance Organization.” InMoving Forward: Emerging Strategies for Sustainbility andExpansion. The SEEP Network, New York: PACTPublications.
CGAP (Consultative Group to Assist the Poorest). 1998.“Apex Institutions.” Occasional Paper, World Bank,Washington, D.C.
———. 1997a. “Anatomy of a Micro-finance Deal: A NewApproach to Investing in Micro-Finance Institutions.”Focus Note 9. World Bank, Washington, D.C.
———. 1997b. “The Challenge of Growth for Micro-FinanceInstitutions: The BancoSol Experience.” Focus Note 6.World Bank, Washington, D.C.
———. 1997c. “Effective Governance for Micro-FinanceInstitutions.” Focus Note 7. World Bank, Washington, D.C.
———.1997d. “State-Owned Development Banks in Micro-Finance.” Focus Note 10. World Bank, Washington,D.C.
Christen, Robert Peck. 1997. Banking Services for the Poor:Managing for Financial Success. Washington, D.C.:ACCION International.
Christen, Robert, Elizabeth Rhyne, and Robert Vogel. 1995.“Maximizing the Outreach of Microenterprise Finance: AnAnalysis of Successful Microfinance Programs.” Programand Operations Assessment Report 10. U.S. Agency forInternational Development, Washington D.C.
Chu, Michael. 1996a. “Securitization of a MicroenterprisePortfolio.” In Craig Churchill, ed., An Introduction to KeyIssues in Microfinance: Supervision and Regulation,Financing Sources, Expansion of Microfinance Institutions.Washington, D.C.: MicroFinance Network.
———. 1996b. “Reflections on Accessing Capital Markets.”ACCION International summary of paper delivered atFourth Annual MicroFinance Network Conference,November, Toronto.
Churchill, Craig, ed. 1997. Establishing a MicrofinanceIndustry: Governance, Best Practices, Access to CapitalMarkets. Washington, D.C.: MicroFinance Network
———. ed. 1998. Moving Microfinance Forward: Ownership,Competition, and Control of Microfinance Institutions.Washington, D.C.: MicroFinance Network.
Clark, Heather. 1997. “When a Program is Ready to AccessCommercial Funds: A Discussion for CommercialStandards.” Paper prepared for the Microcredit Summit,February 3, Washington D.C.
Clarkson, Max, and Michael Deck. 1997. “EffectiveGovernance for Micro-Finance Institutions.” In Craig
Churchill, ed., Establishing a Microfinance Industry.Washington, D.C.: MicroFinance Network.
Development Project Service Centre (DEPROSC) and JoannaLedgerwood. 1997. “Critical Issues in Nepal’s Micro-Finance Circumstances.” University of Maryland atCollege Park, Institutional Reform and the InformalSector, College Park, Md.
Edgcomb, Elaine, and Jim Cawley, eds. 1993. An InstitutionalGuide for Enterprise Development Organizations. New York:PACT Publications.
Fruman, Cecile. 1997. “FEECAM—Benin.” Case Study forthe Sustainable Banking with the Poor Project, WorldBank, Washington, D.C.
Fruman, Cecile, and Jennifer Isern. 1996. “World BankMicrofinance Training.” World Bank, Washington, D.C.
Galludec, Gilles. 1996. “CGAP Appraisal Mission.” WorldBank, Consultative Group to Assist the Poorest, Wash-ington, D.C.
Garber, Garter. 1997. “Private Investment as a FinancingSource for Microcredit.” The North South Agenda Papers23. University of Miami, North-South Center, Miami, Fla.
Gonzalez-Vega, Claudio. 1998. “Microfinance ApexMechanisms: Review of the Evidence and PolicyRecommendations.” Ohio State University, Department ofAgricultural, Environmental, and Development Economics,Rural Finance Program, Columbus, Ohio.
Gudger, Michael. 1997. “Sustainability of Credit GuaranteeSystems.” In SME Credit Guarantee Schemes 4 (1 and 2):30–33. Published for the Inter-American Development Bankby The Financier.
Holtmann, Martin, and Rochus Mommartz. 1996. ATechnical Guide for Analyzing Credit-Granting NGOs.Saarbricken, Germany: Verlag fir Entwicklungspolitik.
Jackelen, Henry R., and Elisabeth Rhyne. 1991.”Toward aMore Market-Oriented Approach to Credit and Savings forthe Poor.” Small Enterprise Development 2 (4): 4–20.
Krahnen, Jan Pieter, and Reinhard H. Schmidt. 1994.Development Finance as Institution Building: A NewApproach to Poverty-oriented Banking. Boulder, Colo.:Westview Press.
Levitsky, Jacob. 1997. “Best Practice in Credit GuaranteeSchemes.” In SME Credit Guarantee Schemes. 4 (1 and 2):86–94. Published for the Inter-American DevelopmentBank by The Financier.
Long, Carolyn, Daouda Diop, and James Cawley. 1990.“Report of Program Working Group.” In ElaineEdgecomb and James Cawley, eds., An Institutional Guidefor Enterprise Development Organizations. New York:PACT Publications.
Magill, John H. 1994. “Credit Unions: A Formal-SectorAlternative for Financing Microenterprise Development.” In
T H E I N S T I T U T I O N 129
Maria Otero and Elisabeth Rhyne, eds., The New World ofMicroenterprise Finance: Building Healthy FinancialInstitutions for the Poor. West Hartford, Conn.: KumarianPress.
Montoya, Manuel. 1997. “EDPYME in Peru.” In CraigChurchill, ed., Establishing a Microfinance Industry.Washington, D.C.: Microfinance Network.
Nataradol, Pittayapol. 1995. “Lending to Small-Scale Farmers:BAAC’s Experience.” Bank of Agriculture and AgriculturalCooperatives, Finance against Poverty Conference.Reading, U.K.
Otero, Maria. 1998. “Types of Owners for MicrofinanceInstitutions.” In Craig Churchill, ed.,Moving Microfinance,Forward Ownership, Competition, and Control ofMicrofinance Institutions. Washington, D.C.: MicrofinanceNetwork.
Otero, Maria, and Elisabeth Rhyne, eds. 1994. The New World ofMicroenterprise Finance: Building Healthy Financial Institutionsfor the Poor.West Hartford, Conn.: Kumarian Press.
Paxton, Julia. 1996. “A Worldwide Inventory of MicrofinanceInstitutions.” World Bank, Sustainable Banking with thePoor Project, Washington, D.C.
ProFund Internacional. 1997. S.A. Annual Report 1996–97.San Jose, Costa Rica.
Rhyne, Elisabeth. 1996. “Human Resource Development:Microfinance as a Breakthrough Service.” In AnIntroduction to Key Issues in Microfinance. Washington,D.C.: MicroFinance Network.
Richardson, David C., Barry L. Lennon, and Brian L. Branch.1993. “Credit Unions Retooled: A Road Map for FinancialStabilization.” World Council of Credit Unions, Madison,Wisc.
Rock, Rachel. 1997. “Regulation and Supervision CaseStudies—Bolivia.” In Regulation and Supervision ofMicrofinance Institutions: Case Studies. MicrofinanceNetwork Occasional Paper 2. Washington, D.C.
Rosenberg, Rich. 1996. “Comment on DevFinance NetworkMay 15, 1996.” Internet discussion group: [email protected]
Schmidt, Reinhard H., and Claus-Peter Zeitinger. 1994.“Critical Issues in Small and MicroBusiness Finance.”Internationale Projekt Consult GmbH (IPC), Frankfurt.
SEEP (Small Enterprise Education and Promotion) Network.1996a. Moving Forward: Emerging Strategies for Sustainabilityand Expansion.New York: PACT Publications.
———. 1996b. Moving Forward: Tools for Sustainability andExpansion. New York: PACT Publications.
Stearns, Katherine. 1993. “Leverage or Loss? Guarantee Fundsand Microenterprises.” Monograph Series 8. ACCIONInternational, Washington, D.C.
Vogel, Robert C., and Dale Adams. “Costs and Benefits ofLoan Guarantee Programs.” In SME Credit GuaranteeSchemes 4 (1 and 2): 22–29. Published for the Inter-American Development Bank by The Financier.
Von Pischke, J.D. 1991. “Finance at the Frontier: DebtCapacity and the Role of Credit in the Private Economy.”World Bank, Economic Development InstituteDevelopment Studies, Washington D.C.
———. 1996. “Comment on DevFinance Network, May 14,1996.” Internet discussion group: [email protected]
Wesley, Glenn D., and Shell Shaver. 1996. “Credit UnionPolicies and Performance in Latin America.” Paper pre-sented at the 1996 Annual Meeting of the LatinAmerican and Caribbean Economics Association,October, Mexico City.
Yaron, Jacob. 1992. Successful Rural Finance Institutions.WorldBank Discussion Paper 150. Washington, D.C.
Yaron, Jacob, McDonald Benjamin, and Gerda Piprek. 1997.“Rural Finance Issues, Design and Best Practices.” WorldBank, Agriculture and Natural Resources Department,Washington, D.C.
130 M I C R O F I N A N C E H A N D B O O K
Part II–Designing andMonitoring FinancialProducts and Services

133
Designing LendingProducts
C H A P T E R F I V E
By definition, MFIs provide credit. Regardless ofthe approach selected (see chapter 4), the actualloan products need to be designed according to
the demands of the target market. This involves estab-lishing appropriate loan amounts, loan terms, collateralrequirements (or substitutes), interest rates and fees,and, potentially, compulsory savings or group contribu-tion requirements.
Successfully designed credit products that meet theneeds of microentrepreneurs are a necessity for anyMFI. It is important that the people who provide andevaluate lending services understand the different ele-ments of lending products and the way in which theseelements affect both borrowers and the viability of theMFI. This chapter illustrates how different design ele-ments can result in lending products that are specificallytailored to both the target market and the capacity ofthe MFI.
This chapter emphasizes designing financial productsto meet client needs, based on the belief that microentre-preneurs value access to financial services and act in aresponsible manner if they are treated as clients ratherthan as beneficiaries.1 The chapter will be of interest topractitioners who wish to modify or refine their loanproducts and to donors and consultants who are evaluat-ing the credit products of MFIs, in particular their finan-cial aspects. The appendixes to the chapter providedetails on more technical topics such as setting a sustain-able interest rate and calculating the effective rate onloans using the internal rate of return and taking intoaccount varying cash flows.
Cash Patterns, Loan Terms, and PaymentFrequency
This section covers credit fundamentals, includingcash patterns of borrowers, loan amounts, loan terms,and repayment schedules. Underlying each topic is anemphasis on understanding the behavior and creditneeds of clients.
Client Cash Patterns and Loan Amounts
To design a loan product to meet borrower needs, it isimportant to understand the cash patterns of borrowers.Cash inflows are the cash received by the business orhousehold in the form of wages, sales revenues, loans, orgifts; cash outflows are the cash paid by the business orhousehold to cover payments or purchases. Cash pat-terns are important insofar as they affect the debt capac-ity of borrowers. Lenders must ensure that borrowershave sufficient cash inflow to cover loan payments whenthey are due.
Some cash inflows and outflows occur on a regularbasis, others at irregular intervals or on an emergency orseasonal basis. Seasonal activities can create times whenthe borrower generates revenues (such as after a harvestperiod) and times when there is no revenue (revenuemay be received from other activities). However, loanterms often extend over several seasons, during whichthere can be gaps in revenues.
Loans should be based on the cash patterns of bor-rowers and designed as much as possible to enable the
1. Portions of this chapter are based on materials originally published in Ledgerwood (1996).
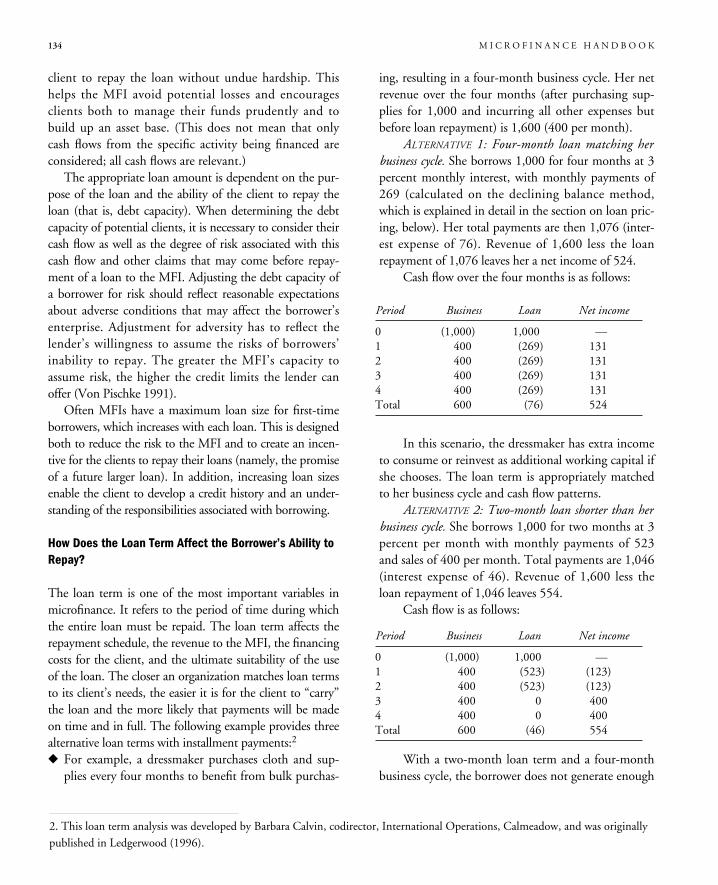
134 M I C R O F I N A N C E H A N D B O O K
client to repay the loan without undue hardship. Thishelps the MFI avoid potential losses and encouragesclients both to manage their funds prudently and tobuild up an asset base. (This does not mean that onlycash flows from the specific activity being financed areconsidered; all cash flows are relevant.)
The appropriate loan amount is dependent on the pur-pose of the loan and the ability of the client to repay theloan (that is, debt capacity). When determining the debtcapacity of potential clients, it is necessary to consider theircash flow as well as the degree of risk associated with thiscash flow and other claims that may come before repay-ment of a loan to the MFI. Adjusting the debt capacity ofa borrower for risk should reflect reasonable expectationsabout adverse conditions that may affect the borrower’senterprise. Adjustment for adversity has to reflect thelender’s willingness to assume the risks of borrowers’inability to repay. The greater the MFI’s capacity toassume risk, the higher the credit limits the lender canoffer (Von Pischke 1991).
Often MFIs have a maximum loan size for first-timeborrowers, which increases with each loan. This is designedboth to reduce the risk to the MFI and to create an incen-tive for the clients to repay their loans (namely, the promiseof a future larger loan). In addition, increasing loan sizesenable the client to develop a credit history and an under-standing of the responsibilities associated with borrowing.
How Does the Loan Term Affect the Borrower’s Ability toRepay?
The loan term is one of the most important variables inmicrofinance. It refers to the period of time during whichthe entire loan must be repaid. The loan term affects therepayment schedule, the revenue to the MFI, the financingcosts for the client, and the ultimate suitability of the useof the loan. The closer an organization matches loan termsto its client’s needs, the easier it is for the client to “carry”the loan and the more likely that payments will be madeon time and in full. The following example provides threealternative loan terms with installment payments:2
� For example, a dressmaker purchases cloth and sup-plies every four months to benefit from bulk purchas-
ing, resulting in a four-month business cycle. Her netrevenue over the four months (after purchasing sup-plies for 1,000 and incurring all other expenses butbefore loan repayment) is 1,600 (400 per month).
ALTERNATIVE 1: Four-month loan matching herbusiness cycle. She borrows 1,000 for four months at 3percent monthly interest, with monthly payments of269 (calculated on the declining balance method,which is explained in detail in the section on loan pric-ing, below). Her total payments are then 1,076 (inter-est expense of 76). Revenue of 1,600 less the loanrepayment of 1,076 leaves her a net income of 524.
Cash flow over the four months is as follows:
In this scenario, the dressmaker has extra incometo consume or reinvest as additional working capital ifshe chooses. The loan term is appropriately matchedto her business cycle and cash flow patterns.
ALTERNATIVE 2: Two-month loan shorter than herbusiness cycle. She borrows 1,000 for two months at 3percent per month with monthly payments of 523and sales of 400 per month. Total payments are 1,046(interest expense of 46). Revenue of 1,600 less theloan repayment of 1,046 leaves 554.
Cash flow is as follows:
With a two-month loan term and a four-monthbusiness cycle, the borrower does not generate enough
2. This loan term analysis was developed by Barbara Calvin, codirector, International Operations, Calmeadow, and was originallypublished in Ledgerwood (1996).
Period Business Loan Net income
0 (1,000) 1,000 —1 400 (269) 1312 400 (269) 1313 400 (269) 1314 400 (269) 131Total 600 (76) 524
Period Business Loan Net income
0 (1,000) 1,000 —1 400 (523) (123)2 400 (523) (123)3 400 0 4004 400 0 400Total 600 (46) 554
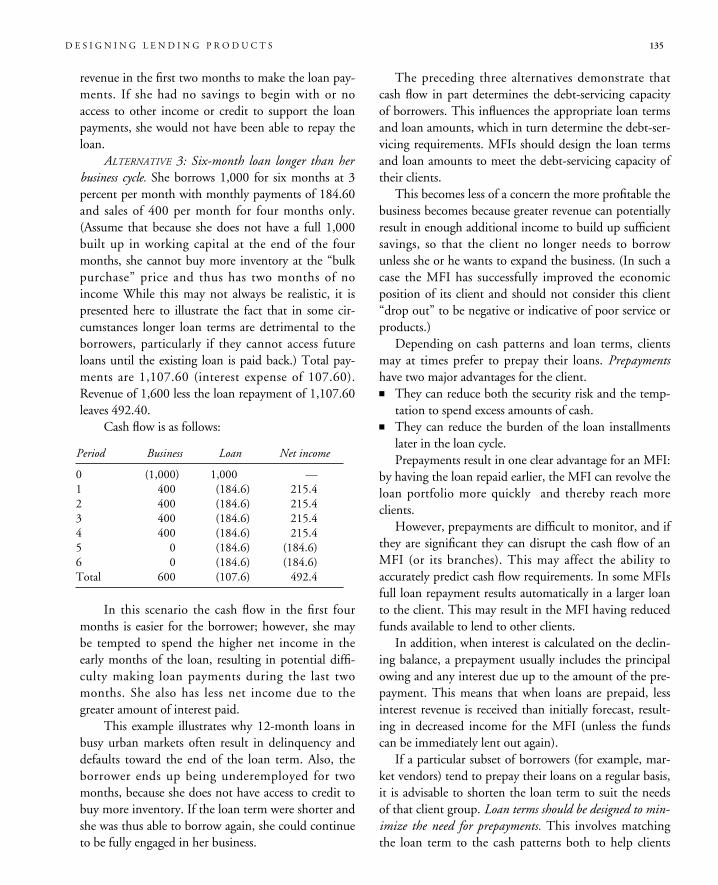
D E S I G N I N G L E N D I N G P R O D U C T S 135
revenue in the first two months to make the loan pay-ments. If she had no savings to begin with or noaccess to other income or credit to support the loanpayments, she would not have been able to repay theloan.
ALTERNATIVE 3: Six-month loan longer than herbusiness cycle. She borrows 1,000 for six months at 3percent per month with monthly payments of 184.60and sales of 400 per month for four months only.(Assume that because she does not have a full 1,000built up in working capital at the end of the fourmonths, she cannot buy more inventory at the “bulkpurchase” price and thus has two months of noincome While this may not always be realistic, it ispresented here to illustrate the fact that in some cir-cumstances longer loan terms are detrimental to theborrowers, particularly if they cannot access futureloans until the existing loan is paid back.) Total pay-ments are 1,107.60 (interest expense of 107.60).Revenue of 1,600 less the loan repayment of 1,107.60leaves 492.40.
Cash flow is as follows:
In this scenario the cash flow in the first fourmonths is easier for the borrower; however, she maybe tempted to spend the higher net income in theearly months of the loan, resulting in potential diffi-culty making loan payments during the last twomonths. She also has less net income due to thegreater amount of interest paid.
This example illustrates why 12-month loans inbusy urban markets often result in delinquency anddefaults toward the end of the loan term. Also, theborrower ends up being underemployed for twomonths, because she does not have access to credit tobuy more inventory. If the loan term were shorter andshe was thus able to borrow again, she could continueto be fully engaged in her business.
The preceding three alternatives demonstrate thatcash flow in part determines the debt-servicing capacityof borrowers. This influences the appropriate loan termsand loan amounts, which in turn determine the debt-ser-vicing requirements. MFIs should design the loan termsand loan amounts to meet the debt-servicing capacity oftheir clients.
This becomes less of a concern the more profitable thebusiness becomes because greater revenue can potentiallyresult in enough additional income to build up sufficientsavings, so that the client no longer needs to borrowunless she or he wants to expand the business. (In such acase the MFI has successfully improved the economicposition of its client and should not consider this client“drop out” to be negative or indicative of poor service orproducts.)
Depending on cash patterns and loan terms, clientsmay at times prefer to prepay their loans. Prepaymentshave two major advantages for the client.� They can reduce both the security risk and the temp-
tation to spend excess amounts of cash.� They can reduce the burden of the loan installments
later in the loan cycle.Prepayments result in one clear advantage for an MFI:
by having the loan repaid earlier, the MFI can revolve theloan portfolio more quickly and thereby reach moreclients.
However, prepayments are difficult to monitor, and ifthey are significant they can disrupt the cash flow of anMFI (or its branches). This may affect the ability toaccurately predict cash flow requirements. In some MFIsfull loan repayment results automatically in a larger loanto the client. This may result in the MFI having reducedfunds available to lend to other clients.
In addition, when interest is calculated on the declin-ing balance, a prepayment usually includes the principalowing and any interest due up to the amount of the pre-payment. This means that when loans are prepaid, lessinterest revenue is received than initially forecast, result-ing in decreased income for the MFI (unless the fundscan be immediately lent out again).
If a particular subset of borrowers (for example, mar-ket vendors) tend to prepay their loans on a regular basis,it is advisable to shorten the loan term to suit the needsof that client group. Loan terms should be designed to min-imize the need for prepayments. This involves matchingthe loan term to the cash patterns both to help clients
Period Business Loan Net income
0 (1,000) 1,000 —1 400 (184.6) 215.42 400 (184.6) 215.43 400 (184.6) 215.44 400 (184.6) 215.45 0 (184.6) (184.6)6 0 (184.6) (184.6)Total 600 (107.6) 492.4
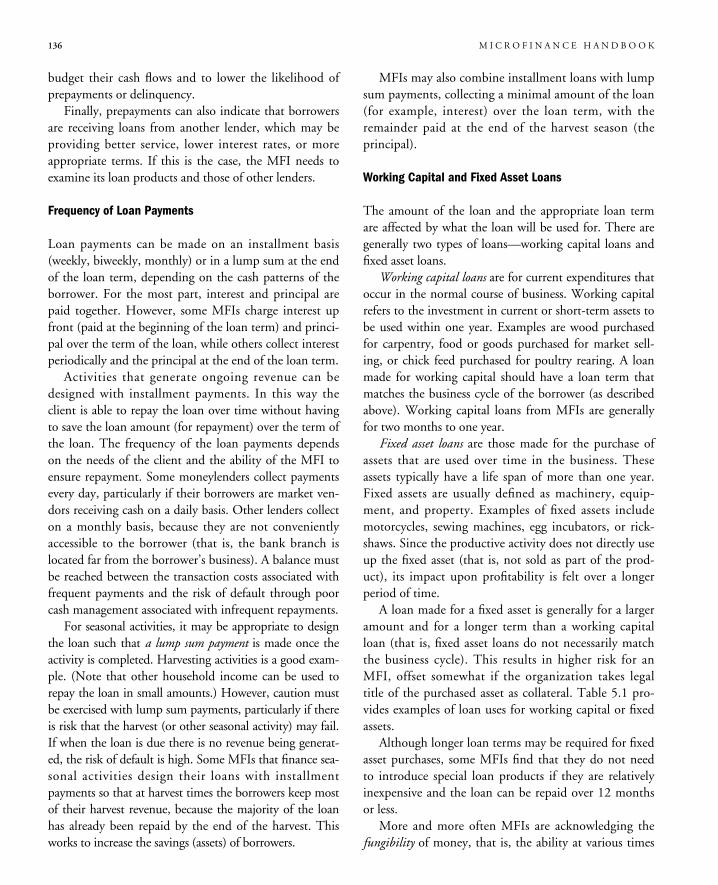
budget their cash flows and to lower the likelihood ofprepayments or delinquency.
Finally, prepayments can also indicate that borrowersare receiving loans from another lender, which may beproviding better service, lower interest rates, or moreappropriate terms. If this is the case, the MFI needs toexamine its loan products and those of other lenders.
Frequency of Loan Payments
Loan payments can be made on an installment basis(weekly, biweekly, monthly) or in a lump sum at the endof the loan term, depending on the cash patterns of theborrower. For the most part, interest and principal arepaid together. However, some MFIs charge interest upfront (paid at the beginning of the loan term) and princi-pal over the term of the loan, while others collect interestperiodically and the principal at the end of the loan term.
Activities that generate ongoing revenue can bedesigned with installment payments. In this way theclient is able to repay the loan over time without havingto save the loan amount (for repayment) over the term ofthe loan. The frequency of the loan payments dependson the needs of the client and the ability of the MFI toensure repayment. Some moneylenders collect paymentsevery day, particularly if their borrowers are market ven-dors receiving cash on a daily basis. Other lenders collecton a monthly basis, because they are not convenientlyaccessible to the borrower (that is, the bank branch islocated far from the borrower’s business). A balance mustbe reached between the transaction costs associated withfrequent payments and the risk of default through poorcash management associated with infrequent repayments.
For seasonal activities, it may be appropriate to designthe loan such that a lump sum payment is made once theactivity is completed. Harvesting activities is a good exam-ple. (Note that other household income can be used torepay the loan in small amounts.) However, caution mustbe exercised with lump sum payments, particularly if thereis risk that the harvest (or other seasonal activity) may fail.If when the loan is due there is no revenue being generat-ed, the risk of default is high. Some MFIs that finance sea-sonal activities design their loans with installmentpayments so that at harvest times the borrowers keep mostof their harvest revenue, because the majority of the loanhas already been repaid by the end of the harvest. Thisworks to increase the savings (assets) of borrowers.
MFIs may also combine installment loans with lumpsum payments, collecting a minimal amount of the loan(for example, interest) over the loan term, with theremainder paid at the end of the harvest season (theprincipal).
Working Capital and Fixed Asset Loans
The amount of the loan and the appropriate loan termare affected by what the loan will be used for. There aregenerally two types of loans—working capital loans andfixed asset loans.
Working capital loans are for current expenditures thatoccur in the normal course of business. Working capitalrefers to the investment in current or short-term assets tobe used within one year. Examples are wood purchasedfor carpentry, food or goods purchased for market sell-ing, or chick feed purchased for poultry rearing. A loanmade for working capital should have a loan term thatmatches the business cycle of the borrower (as describedabove). Working capital loans from MFIs are generallyfor two months to one year.
Fixed asset loans are those made for the purchase ofassets that are used over time in the business. Theseassets typically have a life span of more than one year.Fixed assets are usually defined as machinery, equip-ment, and property. Examples of fixed assets includemotorcycles, sewing machines, egg incubators, or rick-shaws. Since the productive activity does not directly useup the fixed asset (that is, not sold as part of the prod-uct), its impact upon profitability is felt over a longerperiod of time.
A loan made for a fixed asset is generally for a largeramount and for a longer term than a working capitalloan (that is, fixed asset loans do not necessarily matchthe business cycle). This results in higher risk for anMFI, offset somewhat if the organization takes legaltitle of the purchased asset as collateral. Table 5.1 pro-vides examples of loan uses for working capital or fixedassets.
Although longer loan terms may be required for fixedasset purchases, some MFIs find that they do not needto introduce special loan products if they are relativelyinexpensive and the loan can be repaid over 12 monthsor less.
More and more often MFIs are acknowledging thefungibility of money, that is, the ability at various times
136 M I C R O F I N A N C E H A N D B O O K
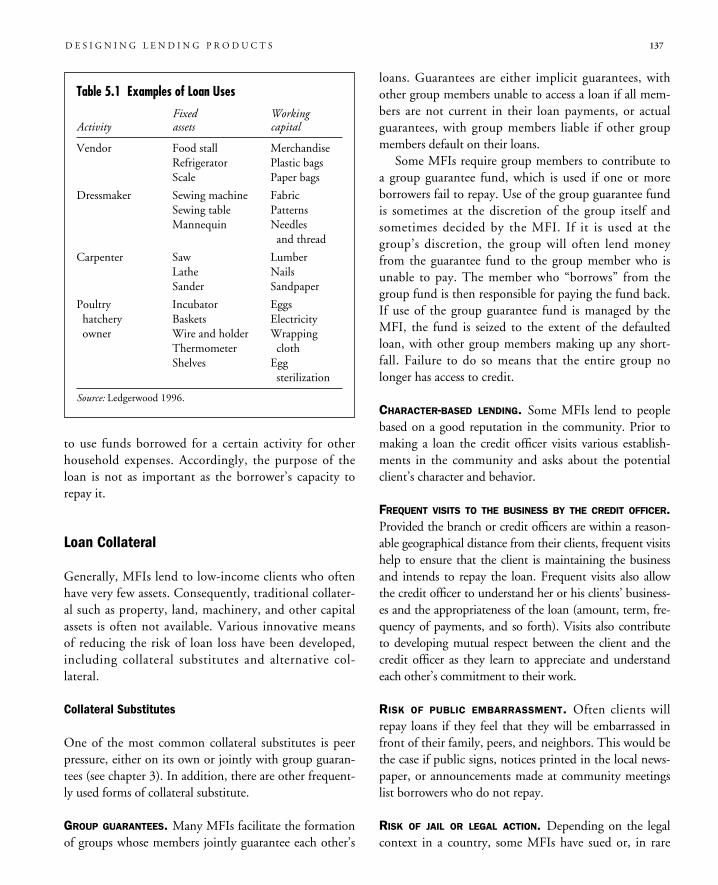
to use funds borrowed for a certain activity for otherhousehold expenses. Accordingly, the purpose of theloan is not as important as the borrower’s capacity torepay it.
Loan Collateral
Generally, MFIs lend to low-income clients who oftenhave very few assets. Consequently, traditional collater-al such as property, land, machinery, and other capitalassets is often not available. Various innovative meansof reducing the risk of loan loss have been developed,including collateral substitutes and alternative col-lateral.
Collateral Substitutes
One of the most common collateral substitutes is peerpressure, either on its own or jointly with group guaran-tees (see chapter 3). In addition, there are other frequent-ly used forms of collateral substitute.
GROUP GUARANTEES. Many MFIs facilitate the formationof groups whose members jointly guarantee each other’s
loans. Guarantees are either implicit guarantees, withother group members unable to access a loan if all mem-bers are not current in their loan payments, or actualguarantees, with group members liable if other groupmembers default on their loans.
Some MFIs require group members to contribute toa group guarantee fund, which is used if one or moreborrowers fail to repay. Use of the group guarantee fundis sometimes at the discretion of the group itself andsometimes decided by the MFI. If it is used at thegroup’s discretion, the group will often lend moneyfrom the guarantee fund to the group member who isunable to pay. The member who “borrows” from thegroup fund is then responsible for paying the fund back.If use of the group guarantee fund is managed by theMFI, the fund is seized to the extent of the defaultedloan, with other group members making up any short-fall. Failure to do so means that the entire group nolonger has access to credit.
CHARACTER-BASED LENDING. Some MFIs lend to peoplebased on a good reputation in the community. Prior tomaking a loan the credit officer visits various establish-ments in the community and asks about the potentialclient’s character and behavior.
FREQUENT VISITS TO THE BUSINESS BY THE CREDIT OFFICER.Provided the branch or credit officers are within a reason-able geographical distance from their clients, frequent visitshelp to ensure that the client is maintaining the businessand intends to repay the loan. Frequent visits also allowthe credit officer to understand her or his clients’ business-es and the appropriateness of the loan (amount, term, fre-quency of payments, and so forth). Visits also contributeto developing mutual respect between the client and thecredit officer as they learn to appreciate and understandeach other’s commitment to their work.
RISK OF PUBLIC EMBARRASSMENT. Often clients willrepay loans if they feel that they will be embarrassed infront of their family, peers, and neighbors. This would bethe case if public signs, notices printed in the local news-paper, or announcements made at community meetingslist borrowers who do not repay.
RISK OF JAIL OR LEGAL ACTION. Depending on the legalcontext in a country, some MFIs have sued or, in rare
D E S I G N I N G L E N D I N G P R O D U C T S 137
Table 5.1 Examples of Loan Uses
Fixed WorkingActivity assets capital
Vendor Food stall MerchandiseRefrigerator Plastic bagsScale Paper bags
Dressmaker Sewing machine FabricSewing table PatternsMannequin Needles
and thread
Carpenter Saw LumberLathe NailsSander Sandpaper
Poultry Incubator Eggshatchery Baskets Electricityowner Wire and holder Wrapping
Thermometer clothShelves Egg
sterilization
Source: Ledgerwood 1996.
138 M I C R O F I N A N C E H A N D B O O K
cases, even jailed clients for nonpayment. Sometimes,simply the risk of legal repercussion is enough to encour-age repayment.
Alternative Forms of Collateral
There are at least three commonly used alternative formsof collateral.
COMPULSORY SAVINGS. Many MFIs require clients tohold a balance (stated as a percentage of the loan) in sav-ings (or as contributions to group funds) for first or sub-sequent loans (or both). Compulsory savings differ fromvoluntary savings in that they are not generally availablefor withdrawal while a loan is outstanding. In this waycompulsory savings act as a form of collateral.
By being required to set aside funds as savings, borrow-ers are restricted from utilizing those funds in their busi-ness activities or other income producing investments.Usually the deposit interest rate paid (if any) on the sav-ings is lower than the return earned by the borrowers ifthe savings were put into their business or other invest-ments. This results in an opportunity cost equal to the dif-ference between what the client earns on compulsorysavings and the return that could be earned otherwise.
Compulsory savings can have a positive impact onclients by smoothing out their consumption patterns andproviding funds for emergencies provided the savings areavailable for withdrawal by the borrower. Most compulso-ry savings are available for withdrawal only at the end ofthe loan term, providing the loan has been repaid in full.Clients thus have additional cash flow for investment orconsumption at the end of the loan term. Compulsorysavings also provide a means of building assets for clients;not all MFIs view compulsory savings as strictly an alter-native form of collateral.
A variation of compulsory savings required by BankRakyat Indonesia is for borrowers to pay additionalinterest each month, which is returned to them at theend of the loan provided they have made full, on-timepayments each month. This is referred to as a “promptpayment incentive” and results in the borrower receivinga lump sum at the end of the loan term. This benefitsthe borrower and provides a concrete incentive to repaythe loan on time, thus benefiting the bank as well.
Compulsory savings also provide a source of lendingand investment funds for the MFI. They are generally a
stable source of funds because they are illiquid (that is,savings are not generally available for withdrawal by theborrowers while their loans are outstanding). However,it is essential that the MFI act in a prudent manner whenon-lending or investing client savings to ensure that thefunds will be repaid and can be returned to the client infull when necessary.
ASSETS PLEDGED AT LESS THAN THE VALUE OF THE LOAN.Sometimes, regardless of the actual market value ofassets owned by the borrower, the act of pledging assets(such as furniture or appliances) and the consequentrealization that they can be lost (resulting in inconve-nience) causes the client to repay the loan. It is impor-tant that the MFI formally seize the assets that havebeen pledged if the client does not repay the loan. Thissends a message to other borrowers that the MFI is seri-ous about loan repayment.
PERSONAL GUARANTEES. While microborrowers them-selves do not often have the ability to guarantee theirloans, they are sometimes able to enlist friends or familymembers to provide personal guarantees (sometimesreferred to as cosigners). This means that in the event ofthe inability of the borrower to repay, the person whohas provided a personal guarantee is responsible forrepaying the loan.
Many of the foregoing collateral substitutes and alter-native forms of collateral are used in combination witheach other. A good example of this is offered by theAssociation for the Development of Microenterprises(ADEMI) in the Dominican Republic (box 5.1).
Loan Pricing
Pricing loans is an important aspect of loan productdesign. A balance must be reached between what clientscan afford and what the lending organization needs toearn to cover all of its costs. Generally, microfinanceclients are not interest-rate sensitive. That is, microentre-preneurs have not appeared to borrow more or less inreaction to an increase or decrease in interest rates. Forthe most part, an interest rate far above commercial bankrates is acceptable because the borrowers have such limit-ed access to credit. However, an MFI must ensure thatits operations are as efficient as possible so that undue
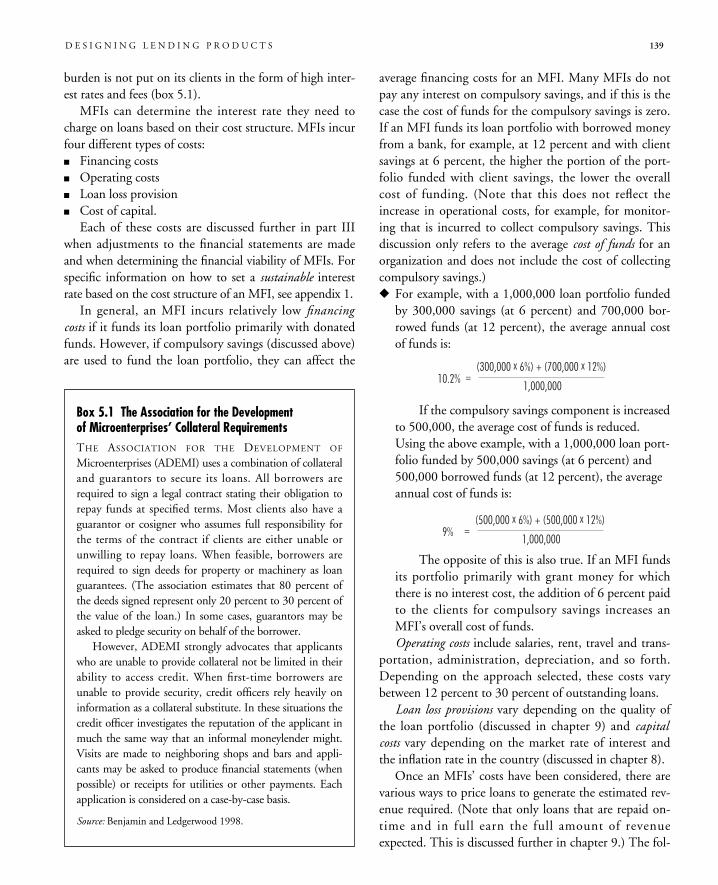
D E S I G N I N G L E N D I N G P R O D U C T S 139
burden is not put on its clients in the form of high inter-est rates and fees (box 5.1).
MFIs can determine the interest rate they need tocharge on loans based on their cost structure. MFIs incurfour different types of costs:� Financing costs� Operating costs� Loan loss provision� Cost of capital.
Each of these costs are discussed further in part IIIwhen adjustments to the financial statements are madeand when determining the financial viability of MFIs. Forspecific information on how to set a sustainable interestrate based on the cost structure of an MFI, see appendix 1.
In general, an MFI incurs relatively low financingcosts if it funds its loan portfolio primarily with donatedfunds. However, if compulsory savings (discussed above)are used to fund the loan portfolio, they can affect the
average financing costs for an MFI. Many MFIs do notpay any interest on compulsory savings, and if this is thecase the cost of funds for the compulsory savings is zero.If an MFI funds its loan portfolio with borrowed moneyfrom a bank, for example, at 12 percent and with clientsavings at 6 percent, the higher the portion of the port-folio funded with client savings, the lower the overallcost of funding. (Note that this does not reflect theincrease in operational costs, for example, for monitor-ing that is incurred to collect compulsory savings. Thisdiscussion only refers to the average cost of funds for anorganization and does not include the cost of collectingcompulsory savings.)� For example, with a 1,000,000 loan portfolio funded
by 300,000 savings (at 6 percent) and 700,000 bor-rowed funds (at 12 percent), the average annual costof funds is:
If the compulsory savings component is increasedto 500,000, the average cost of funds is reduced.Using the above example, with a 1,000,000 loan port-folio funded by 500,000 savings (at 6 percent) and500,000 borrowed funds (at 12 percent), the averageannual cost of funds is:
The opposite of this is also true. If an MFI fundsits portfolio primarily with grant money for whichthere is no interest cost, the addition of 6 percent paidto the clients for compulsory savings increases anMFI’s overall cost of funds.Operating costs include salaries, rent, travel and trans-
portation, administration, depreciation, and so forth.Depending on the approach selected, these costs varybetween 12 percent to 30 percent of outstanding loans.
Loan loss provisions vary depending on the quality ofthe loan portfolio (discussed in chapter 9) and capitalcosts vary depending on the market rate of interest andthe inflation rate in the country (discussed in chapter 8).
Once an MFIs’ costs have been considered, there arevarious ways to price loans to generate the estimated rev-enue required. (Note that only loans that are repaid on-time and in full earn the full amount of revenueexpected. This is discussed further in chapter 9.) The fol-
9%(500,000 x 6%) + (500,000 x 12%)
1,000,000=
10.2%(300,000 x 6%) + (700,000 x 12%)
1,000,000=
Box 5.1 The Association for the Developmentof Microenterprises’ Collateral RequirementsTHE ASSOCIATION FOR THE DEVELOPMENT OF
Microenterprises (ADEMI) uses a combination of collateraland guarantors to secure its loans. All borrowers arerequired to sign a legal contract stating their obligation torepay funds at specified terms. Most clients also have aguarantor or cosigner who assumes full responsibility forthe terms of the contract if clients are either unable orunwilling to repay loans. When feasible, borrowers arerequired to sign deeds for property or machinery as loanguarantees. (The association estimates that 80 percent ofthe deeds signed represent only 20 percent to 30 percent ofthe value of the loan.) In some cases, guarantors may beasked to pledge security on behalf of the borrower.
However, ADEMI strongly advocates that applicantswho are unable to provide collateral not be limited in theirability to access credit. When first-time borrowers areunable to provide security, credit officers rely heavily oninformation as a collateral substitute. In these situations thecredit officer investigates the reputation of the applicant inmuch the same way that an informal moneylender might.Visits are made to neighboring shops and bars and appli-cants may be asked to produce financial statements (whenpossible) or receipts for utilities or other payments. Eachapplication is considered on a case-by-case basis.
Source: Benjamin and Ledgerwood 1998.
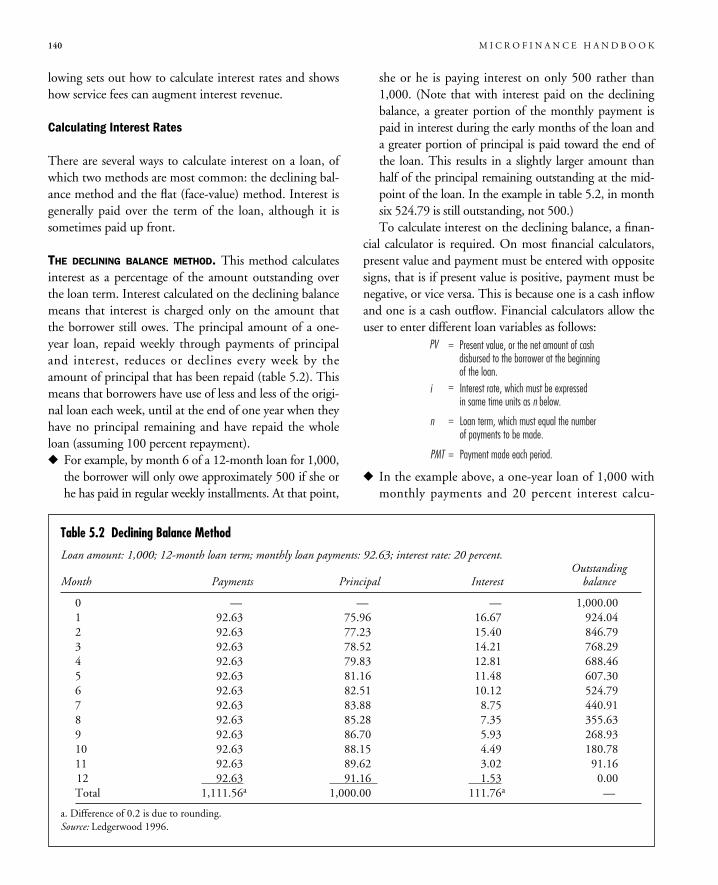
lowing sets out how to calculate interest rates and showshow service fees can augment interest revenue.
Calculating Interest Rates
There are several ways to calculate interest on a loan, ofwhich two methods are most common: the declining bal-ance method and the flat (face-value) method. Interest isgenerally paid over the term of the loan, although it issometimes paid up front.
THE DECLINING BALANCE METHOD. This method calculatesinterest as a percentage of the amount outstanding overthe loan term. Interest calculated on the declining balancemeans that interest is charged only on the amount thatthe borrower still owes. The principal amount of a one-year loan, repaid weekly through payments of principaland interest, reduces or declines every week by theamount of principal that has been repaid (table 5.2). Thismeans that borrowers have use of less and less of the origi-nal loan each week, until at the end of one year when theyhave no principal remaining and have repaid the wholeloan (assuming 100 percent repayment).� For example, by month 6 of a 12-month loan for 1,000,
the borrower will only owe approximately 500 if she orhe has paid in regular weekly installments. At that point,
she or he is paying interest on only 500 rather than1,000. (Note that with interest paid on the decliningbalance, a greater portion of the monthly payment ispaid in interest during the early months of the loan anda greater portion of principal is paid toward the end ofthe loan. This results in a slightly larger amount thanhalf of the principal remaining outstanding at the mid-point of the loan. In the example in table 5.2, in monthsix 524.79 is still outstanding, not 500.)To calculate interest on the declining balance, a finan-
cial calculator is required. On most financial calculators,present value and payment must be entered with oppositesigns, that is if present value is positive, payment must benegative, or vice versa. This is because one is a cash inflowand one is a cash outflow. Financial calculators allow theuser to enter different loan variables as follows:
� In the example above, a one-year loan of 1,000 withmonthly payments and 20 percent interest calcu-
PV Present value, or the net amount of cashdisbursed to the borrower at the beginningof the loan.
=
=
=
=
i
n
PMT
Interest rate, which must be expressedin same time units as n below.
Loan term, which must equal the numberof payments to be made.
Payment made each period.
140 M I C R O F I N A N C E H A N D B O O K
Table 5.2 Declining Balance Method
Loan amount: 1,000; 12-month loan term; monthly loan payments: 92.63; interest rate: 20 percent.Outstanding
Month Payments Principal Interest balance
0 — — — 1,000.001 92.63 75.96 16.67 924.042 92.63 77.23 15.40 846.793 92.63 78.52 14.21 768.294 92.63 79.83 12.81 688.465 92.63 81.16 11.48 607.306 92.63 82.51 10.12 524.797 92.63 83.88 8.75 440.918 92.63 85.28 7.35 355.639 92.63 86.70 5.93 268.9310 92.63 88.15 4.49 180.7811 92.63 89.62 3.02 91.1612 92.63 91.16 1.53 0.00Total 1,111.56a 1,000.00 111.76a —
a. Difference of 0.2 is due to rounding.Source: Ledgerwood 1996.
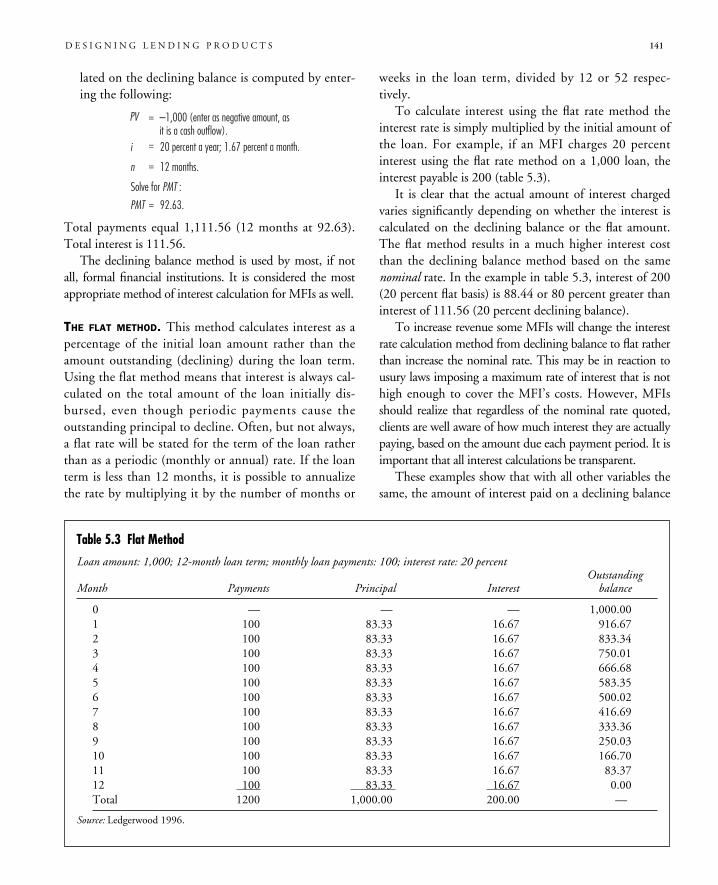
lated on the declining balance is computed by enter-ing the following:
Total payments equal 1,111.56 (12 months at 92.63).Total interest is 111.56.
The declining balance method is used by most, if notall, formal financial institutions. It is considered the mostappropriate method of interest calculation for MFIs as well.
THE FLAT METHOD. This method calculates interest as apercentage of the initial loan amount rather than theamount outstanding (declining) during the loan term.Using the flat method means that interest is always cal-culated on the total amount of the loan initially dis-bursed, even though periodic payments cause theoutstanding principal to decline. Often, but not always,a flat rate will be stated for the term of the loan ratherthan as a periodic (monthly or annual) rate. If the loanterm is less than 12 months, it is possible to annualizethe rate by multiplying it by the number of months or
weeks in the loan term, divided by 12 or 52 respec-tively.
To calculate interest using the flat rate method theinterest rate is simply multiplied by the initial amount ofthe loan. For example, if an MFI charges 20 percentinterest using the flat rate method on a 1,000 loan, theinterest payable is 200 (table 5.3).
It is clear that the actual amount of interest chargedvaries significantly depending on whether the interest iscalculated on the declining balance or the flat amount.The flat method results in a much higher interest costthan the declining balance method based on the samenominal rate. In the example in table 5.3, interest of 200(20 percent flat basis) is 88.44 or 80 percent greater thaninterest of 111.56 (20 percent declining balance).
To increase revenue some MFIs will change the interestrate calculation method from declining balance to flat ratherthan increase the nominal rate. This may be in reaction tousury laws imposing a maximum rate of interest that is nothigh enough to cover the MFI’s costs. However, MFIsshould realize that regardless of the nominal rate quoted,clients are well aware of how much interest they are actuallypaying, based on the amount due each payment period. It isimportant that all interest calculations be transparent.
These examples show that with all other variables thesame, the amount of interest paid on a declining balance
PV –1,000 (enter as negative amount, asit is a cash outflow).
=
=
=
=
i
n
PMT
20 percent a year; 1.67 percent a month.
12 months.
92.63.
Solve for PMT :
D E S I G N I N G L E N D I N G P R O D U C T S 141
Table 5.3 Flat Method
Loan amount: 1,000; 12-month loan term; monthly loan payments: 100; interest rate: 20 percentOutstanding
Month Payments Principal Interest balance
0 — — — 1,000.001 100 83.33 16.67 916.672 100 83.33 16.67 833.343 100 83.33 16.67 750.014 100 83.33 16.67 666.685 100 83.33 16.67 583.356 100 83.33 16.67 500.027 100 83.33 16.67 416.698 100 83.33 16.67 333.369 100 83.33 16.67 250.0310 100 83.33 16.67 166.7011 100 83.33 16.67 83.3712 100 83.33 16.67 0.00Total 1200 1,000.00 200.00 —
Source: Ledgerwood 1996.
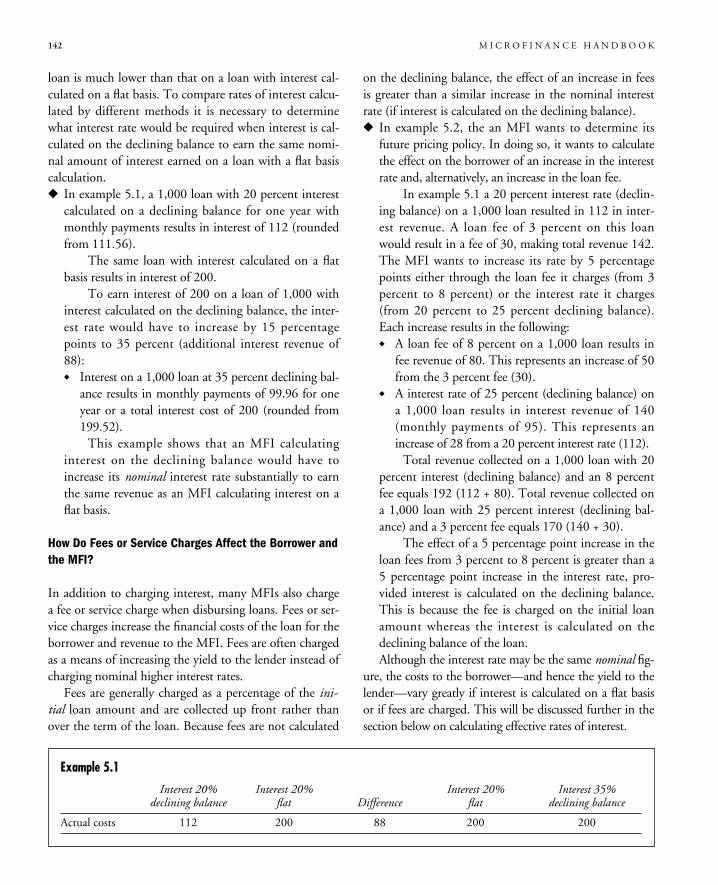
loan is much lower than that on a loan with interest cal-culated on a flat basis. To compare rates of interest calcu-lated by different methods it is necessary to determinewhat interest rate would be required when interest is cal-culated on the declining balance to earn the same nomi-nal amount of interest earned on a loan with a flat basiscalculation.� In example 5.1, a 1,000 loan with 20 percent interest
calculated on a declining balance for one year withmonthly payments results in interest of 112 (roundedfrom 111.56).
The same loan with interest calculated on a flatbasis results in interest of 200.
To earn interest of 200 on a loan of 1,000 withinterest calculated on the declining balance, the inter-est rate would have to increase by 15 percentagepoints to 35 percent (additional interest revenue of88):� Interest on a 1,000 loan at 35 percent declining bal-
ance results in monthly payments of 99.96 for oneyear or a total interest cost of 200 (rounded from199.52).This example shows that an MFI calculating
interest on the declining balance would have toincrease its nominal interest rate substantially to earnthe same revenue as an MFI calculating interest on aflat basis.
How Do Fees or Service Charges Affect the Borrower andthe MFI?
In addition to charging interest, many MFIs also chargea fee or service charge when disbursing loans. Fees or ser-vice charges increase the financial costs of the loan for theborrower and revenue to the MFI. Fees are often chargedas a means of increasing the yield to the lender instead ofcharging nominal higher interest rates.
Fees are generally charged as a percentage of the ini-tial loan amount and are collected up front rather thanover the term of the loan. Because fees are not calculated
on the declining balance, the effect of an increase in feesis greater than a similar increase in the nominal interestrate (if interest is calculated on the declining balance).� In example 5.2, the an MFI wants to determine its
future pricing policy. In doing so, it wants to calculatethe effect on the borrower of an increase in the interestrate and, alternatively, an increase in the loan fee.
In example 5.1 a 20 percent interest rate (declin-ing balance) on a 1,000 loan resulted in 112 in inter-est revenue. A loan fee of 3 percent on this loanwould result in a fee of 30, making total revenue 142.The MFI wants to increase its rate by 5 percentagepoints either through the loan fee it charges (from 3percent to 8 percent) or the interest rate it charges(from 20 percent to 25 percent declining balance).Each increase results in the following:� A loan fee of 8 percent on a 1,000 loan results in
fee revenue of 80. This represents an increase of 50from the 3 percent fee (30).
� A interest rate of 25 percent (declining balance) ona 1,000 loan results in interest revenue of 140(monthly payments of 95). This represents anincrease of 28 from a 20 percent interest rate (112).Total revenue collected on a 1,000 loan with 20
percent interest (declining balance) and an 8 percentfee equals 192 (112 + 80). Total revenue collected ona 1,000 loan with 25 percent interest (declining bal-ance) and a 3 percent fee equals 170 (140 + 30).
The effect of a 5 percentage point increase in theloan fees from 3 percent to 8 percent is greater than a5 percentage point increase in the interest rate, pro-vided interest is calculated on the declining balance.This is because the fee is charged on the initial loanamount whereas the interest is calculated on thedeclining balance of the loan.Although the interest rate may be the same nominal fig-
ure, the costs to the borrower—and hence the yield to thelender—vary greatly if interest is calculated on a flat basisor if fees are charged. This will be discussed further in thesection below on calculating effective rates of interest.
142 M I C R O F I N A N C E H A N D B O O K
Example 5.1
Interest 20% Interest 20% Interest 20% Interest 35%declining balance flat Difference flat declining balance
Actual costs 112 200 88 200 200
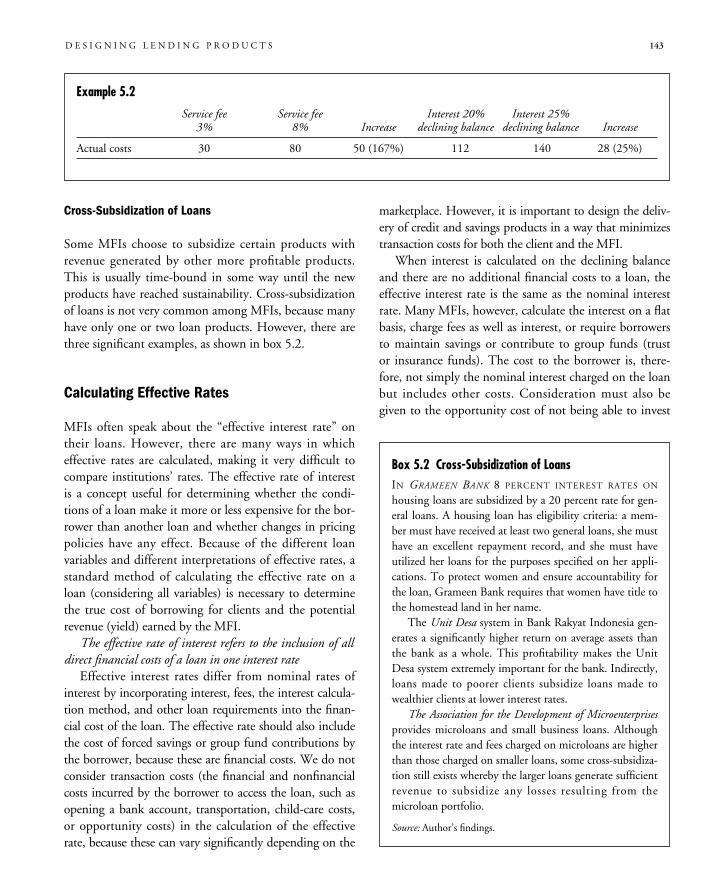
Cross-Subsidization of Loans
Some MFIs choose to subsidize certain products withrevenue generated by other more profitable products.This is usually time-bound in some way until the newproducts have reached sustainability. Cross-subsidizationof loans is not very common among MFIs, because manyhave only one or two loan products. However, there arethree significant examples, as shown in box 5.2.
Calculating Effective Rates
MFIs often speak about the “effective interest rate” ontheir loans. However, there are many ways in whicheffective rates are calculated, making it very difficult tocompare institutions’ rates. The effective rate of interestis a concept useful for determining whether the condi-tions of a loan make it more or less expensive for the bor-rower than another loan and whether changes in pricingpolicies have any effect. Because of the different loanvariables and different interpretations of effective rates, astandard method of calculating the effective rate on aloan (considering all variables) is necessary to determinethe true cost of borrowing for clients and the potentialrevenue (yield) earned by the MFI.
The effective rate of interest refers to the inclusion of alldirect financial costs of a loan in one interest rate
Effective interest rates differ from nominal rates ofinterest by incorporating interest, fees, the interest calcula-tion method, and other loan requirements into the finan-cial cost of the loan. The effective rate should also includethe cost of forced savings or group fund contributions bythe borrower, because these are financial costs. We do notconsider transaction costs (the financial and nonfinancialcosts incurred by the borrower to access the loan, such asopening a bank account, transportation, child-care costs,or opportunity costs) in the calculation of the effectiverate, because these can vary significantly depending on the
marketplace. However, it is important to design the deliv-ery of credit and savings products in a way that minimizestransaction costs for both the client and the MFI.
When interest is calculated on the declining balanceand there are no additional financial costs to a loan, theeffective interest rate is the same as the nominal interestrate. Many MFIs, however, calculate the interest on a flatbasis, charge fees as well as interest, or require borrowersto maintain savings or contribute to group funds (trustor insurance funds). The cost to the borrower is, there-fore, not simply the nominal interest charged on the loanbut includes other costs. Consideration must also begiven to the opportunity cost of not being able to invest
D E S I G N I N G L E N D I N G P R O D U C T S 143
Box 5.2 Cross-Subsidization of LoansIN GRAMEEN BANK 8 PERCENT INTEREST RATES ON
housing loans are subsidized by a 20 percent rate for gen-eral loans. A housing loan has eligibility criteria: a mem-ber must have received at least two general loans, she musthave an excellent repayment record, and she must haveutilized her loans for the purposes specified on her appli-cations. To protect women and ensure accountability forthe loan, Grameen Bank requires that women have title tothe homestead land in her name.
The Unit Desa system in Bank Rakyat Indonesia gen-erates a significantly higher return on average assets thanthe bank as a whole. This profitability makes the UnitDesa system extremely important for the bank. Indirectly,loans made to poorer clients subsidize loans made towealthier clients at lower interest rates.
The Association for the Development of Microenterprisesprovides microloans and small business loans. Althoughthe interest rate and fees charged on microloans are higherthan those charged on smaller loans, some cross-subsidiza-tion still exists whereby the larger loans generate sufficientrevenue to subsidize any losses resulting from themicroloan portfolio.
Source: Author’s findings.
Example 5.2
Service fee Service fee Interest 20% Interest 25%3% 8% Increase declining balance declining balance Increase
Actual costs 30 80 50 (167%) 112 140 28 (25%)
the money that the borrower must pay back in regularinstallments (the time value of money).
Variables of microloans that influence the effectiverate include:� Nominal interest rate� Method of interest calculation: declining balance or
flat rate� Payment of interest at the beginning of the loan (as a
deduction of the amount of principal disbursed to theborrower) or over the term of the loan
� Service fees either up front or over the term of theloan
� Contribution to guarantee, insurance, or group fund� Compulsory savings or compensating balances and
the corresponding interest paid to the borrower eitherby the MFI or another institution (bank, creditunion)
� Payment frequency� Loan term� Loan amount.
When all variables are expressed as a percentage of theloan amount, a change in the amount of the loan will notchange the effective rate. A fee that is based in currency(such as $25 per loan application) will change the effec-tive rate if the loan amount is changed; that is, smallerloan amounts with the same fee (in currency) result in ahigher effective rate.
Calculation of the effective rate demonstrates how dif-ferent loan product variables affect the overall costs andrevenues of the loan. Two methods of calculating theeffective rate of interest are an estimation method, whichuses a formula that does not require a financial calcula-tor, and the internal rate of return method.
Note that the estimation method does not directlytake into account the time value of money and the fre-quency of payments, which are considered in the internalrate of return method. Although the difference may beminimal, the greater the length of the loan term and theless frequent the loan payments, the more substantial thedifference will be. This is because the longer the loan isoutstanding and the less frequent the payments, thegreater the effect on the cost will be and hence the differ-ence between the estimated effective cost and the internalrate of return calculation. In addition, the estimationmethod does not take into account compulsory savingsor contributions to other funds, such as trust or insur-ance funds. It is presented here simply as a method for
calculating the effective rate if no financial calculator orspreadsheets are available.
Estimating the Effective Rate
If you do not have access to a financial calculator or acomputer spreadsheet, you can compute an estimation ofthe effective rate (see Waterfield 1995). The estimationmethod considers the amount the borrower pays in inter-est and fees over the loan term. The estimation methodcan be used to determine the effect of the interest ratecalculation method, the loan term, and the loan fee. Anestimation of the effective rate is calculated as follows:
To calculate the effective cost per period, simplydivide the resulting figure by the number of periods.
As previously illustrated, the amount of interest rev-enue is largely affected by whether interest is calculated ona flat or declining balance basis. With all other variablesthe same, the effective rate for a loan with interest calculat-ed on a declining balance basis will be lower than the effec-tive rate for a loan with interest calculated on a flat basis.
Using an example similar to that in tables 5.2 and5.3, the effective rate is estimated for a 1,000 loan withinterest of 20 percent and a 3 percent fee, first with inter-est calculated on the declining balance and then withinterest calculated on the flat basis.
Calculating the interest on the declining balanceresults in an estimated annual effective rate of 25 percentor 2.1 percent per month (table 5.4).
Calculating the interest on a flat basis results in anestimated annual effective rate of 42 percent or 3.5 per-cent per month (table 5.5).
With all other factors the same, the effective rateincreases from 25 percent (2.1 percent per month) to 42percent (3.5 percent per month) when the method ofcalculation is changed from declining balance to flat.
The effective rate also increases when the loan term isshortened if a fee is charged. This is because fees are calculat-ed on the initial loan amount regardless of the length of theloan term. If the loan term is shortened, the same amount of
Effective cost =
Amount paid in interest and fees
Average principal amount outstanding
=(Sum of principal amounts outstanding)
number of paymentsAverage principalamount outstanding
Note:
144 M I C R O F I N A N C E H A N D B O O K
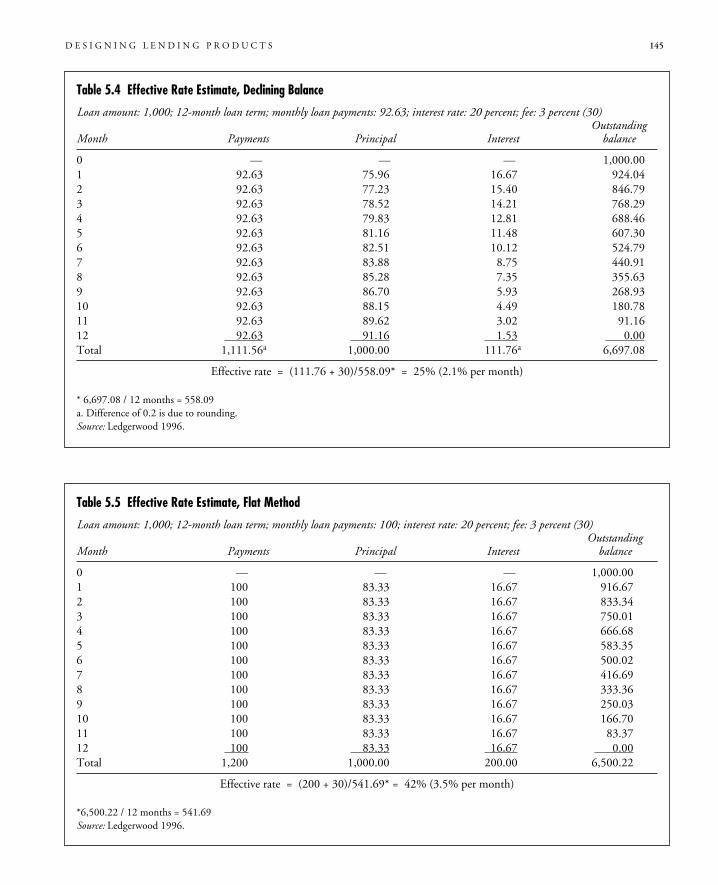
D E S I G N I N G L E N D I N G P R O D U C T S 145
Table 5.4 Effective Rate Estimate, Declining Balance
Loan amount: 1,000; 12-month loan term; monthly loan payments: 92.63; interest rate: 20 percent; fee: 3 percent (30)Outstanding
Month Payments Principal Interest balance
0 — — — 1,000.001 92.63 75.96 16.67 924.042 92.63 77.23 15.40 846.793 92.63 78.52 14.21 768.294 92.63 79.83 12.81 688.465 92.63 81.16 11.48 607.306 92.63 82.51 10.12 524.797 92.63 83.88 8.75 440.918 92.63 85.28 7.35 355.639 92.63 86.70 5.93 268.9310 92.63 88.15 4.49 180.7811 92.63 89.62 3.02 91.1612 92.63 91.16 1.53 0.00Total 1,111.56a 1,000.00 111.76a 6,697.08
Effective rate = (111.76 + 30)/558.09* = 25% (2.1% per month)
* 6,697.08 / 12 months = 558.09a. Difference of 0.2 is due to rounding.Source: Ledgerwood 1996.
Table 5.5 Effective Rate Estimate, Flat Method
Loan amount: 1,000; 12-month loan term; monthly loan payments: 100; interest rate: 20 percent; fee: 3 percent (30)Outstanding
Month Payments Principal Interest balance
0 — — — 1,000.001 100 83.33 16.67 916.672 100 83.33 16.67 833.343 100 83.33 16.67 750.014 100 83.33 16.67 666.685 100 83.33 16.67 583.356 100 83.33 16.67 500.027 100 83.33 16.67 416.698 100 83.33 16.67 333.369 100 83.33 16.67 250.0310 100 83.33 16.67 166.7011 100 83.33 16.67 83.3712 100 83.33 16.67 0.00Total 1,200 1,000.00 200.00 6,500.22
Effective rate = (200 + 30)/541.69* = 42% (3.5% per month)
*6,500.22 / 12 months = 541.69Source: Ledgerwood 1996.
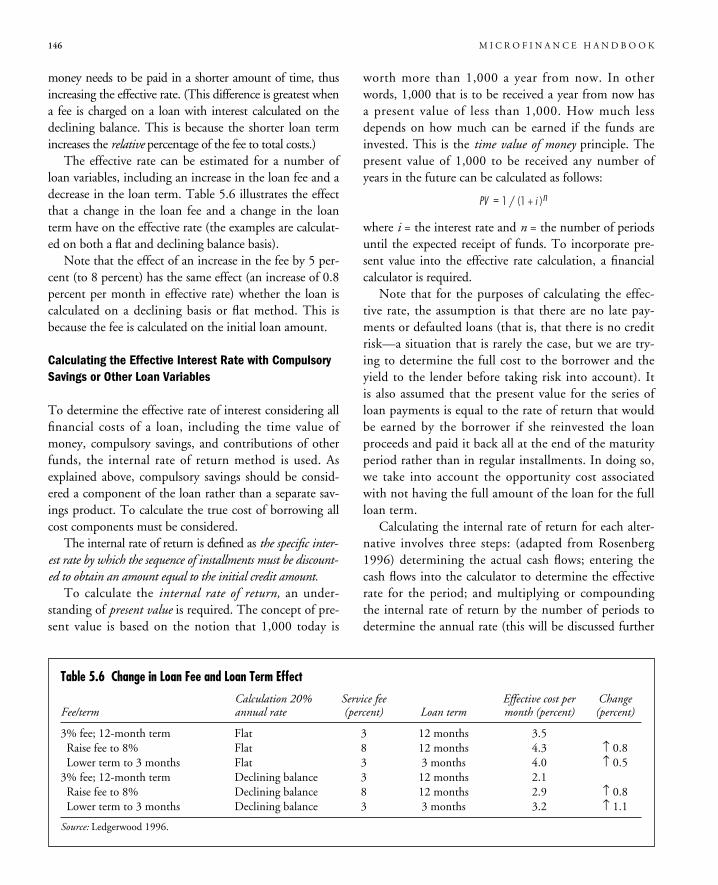
money needs to be paid in a shorter amount of time, thusincreasing the effective rate. (This difference is greatest whena fee is charged on a loan with interest calculated on thedeclining balance. This is because the shorter loan termincreases the relative percentage of the fee to total costs.)
The effective rate can be estimated for a number ofloan variables, including an increase in the loan fee and adecrease in the loan term. Table 5.6 illustrates the effectthat a change in the loan fee and a change in the loanterm have on the effective rate (the examples are calculat-ed on both a flat and declining balance basis).
Note that the effect of an increase in the fee by 5 per-cent (to 8 percent) has the same effect (an increase of 0.8percent per month in effective rate) whether the loan iscalculated on a declining basis or flat method. This isbecause the fee is calculated on the initial loan amount.
Calculating the Effective Interest Rate with CompulsorySavings or Other Loan Variables
To determine the effective rate of interest considering allfinancial costs of a loan, including the time value ofmoney, compulsory savings, and contributions of otherfunds, the internal rate of return method is used. Asexplained above, compulsory savings should be consid-ered a component of the loan rather than a separate sav-ings product. To calculate the true cost of borrowing allcost components must be considered.
The internal rate of return is defined as the specific inter-est rate by which the sequence of installments must be discount-ed to obtain an amount equal to the initial credit amount.
To calculate the internal rate of return, an under-standing of present value is required. The concept of pre-sent value is based on the notion that 1,000 today is
worth more than 1,000 a year from now. In otherwords, 1,000 that is to be received a year from now hasa present value of less than 1,000. How much lessdepends on how much can be earned if the funds areinvested. This is the time value of money principle. Thepresent value of 1,000 to be received any number ofyears in the future can be calculated as follows:
where i = the interest rate and n = the number of periodsuntil the expected receipt of funds. To incorporate pre-sent value into the effective rate calculation, a financialcalculator is required.
Note that for the purposes of calculating the effec-tive rate, the assumption is that there are no late pay-ments or defaulted loans (that is, that there is no creditrisk—a situation that is rarely the case, but we are try-ing to determine the full cost to the borrower and theyield to the lender before taking risk into account). Itis also assumed that the present value for the series ofloan payments is equal to the rate of return that wouldbe earned by the borrower if she reinvested the loanproceeds and paid it back all at the end of the maturityperiod rather than in regular installments. In doing so,we take into account the opportunity cost associatedwith not having the full amount of the loan for the fullloan term.
Calculating the internal rate of return for each alter-native involves three steps: (adapted from Rosenberg1996) determining the actual cash flows; entering thecash flows into the calculator to determine the effectiverate for the period; and multiplying or compoundingthe internal rate of return by the number of periods todetermine the annual rate (this will be discussed further
PV 1 / (1 + i )n=
146 M I C R O F I N A N C E H A N D B O O K
Table 5.6 Change in Loan Fee and Loan Term Effect
Calculation 20% Service fee Effective cost per ChangeFee/term annual rate (percent) Loan term month (percent) (percent)
3% fee; 12-month term Flat 3 12 months 3.5Raise fee to 8% Flat 8 12 months 4.3 ↑ 0.8Lower term to 3 months Flat 3 3 months 4.0 ↑ 0.5
3% fee; 12-month term Declining balance 3 12 months 2.1Raise fee to 8% Declining balance 8 12 months 2.9 ↑ 0.8Lower term to 3 months Declining balance 3 3 months 3.2 ↑ 1.1
Source: Ledgerwood 1996.
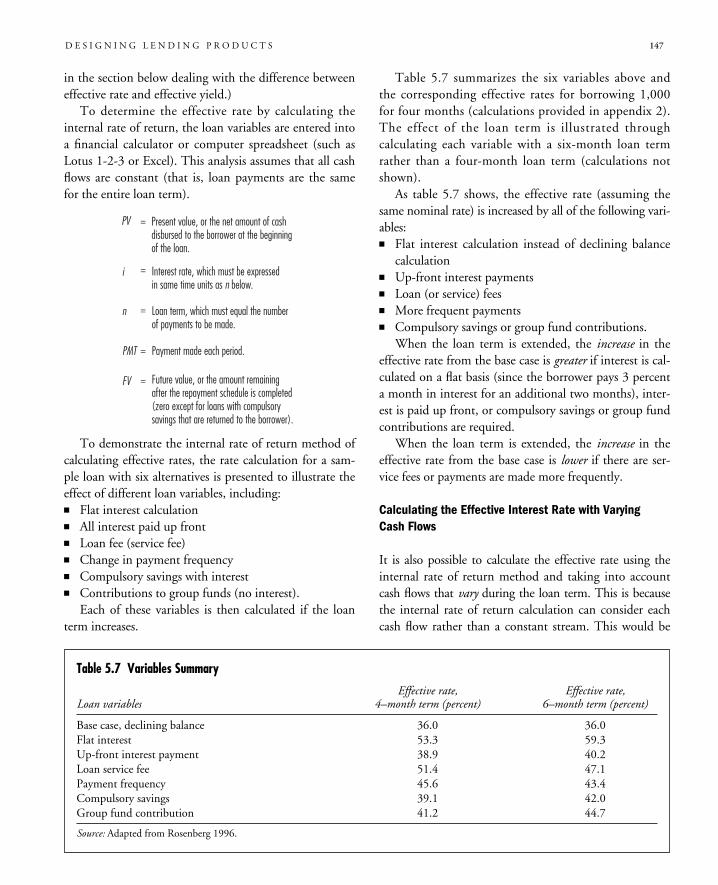
in the section below dealing with the difference betweeneffective rate and effective yield.)
To determine the effective rate by calculating theinternal rate of return, the loan variables are entered intoa financial calculator or computer spreadsheet (such asLotus 1-2-3 or Excel). This analysis assumes that all cashflows are constant (that is, loan payments are the samefor the entire loan term).
To demonstrate the internal rate of return method ofcalculating effective rates, the rate calculation for a sam-ple loan with six alternatives is presented to illustrate theeffect of different loan variables, including:� Flat interest calculation� All interest paid up front� Loan fee (service fee)� Change in payment frequency� Compulsory savings with interest� Contributions to group funds (no interest).
Each of these variables is then calculated if the loanterm increases.
Table 5.7 summarizes the six variables above andthe corresponding effective rates for borrowing 1,000for four months (calculations provided in appendix 2).The effect of the loan term is illustrated throughcalculating each variable with a six-month loan termrather than a four-month loan term (calculations notshown).
As table 5.7 shows, the effective rate (assuming thesame nominal rate) is increased by all of the following vari-ables:� Flat interest calculation instead of declining balance
calculation� Up-front interest payments� Loan (or service) fees� More frequent payments� Compulsory savings or group fund contributions.
When the loan term is extended, the increase in theeffective rate from the base case is greater if interest is cal-culated on a flat basis (since the borrower pays 3 percenta month in interest for an additional two months), inter-est is paid up front, or compulsory savings or group fundcontributions are required.
When the loan term is extended, the increase in theeffective rate from the base case is lower if there are ser-vice fees or payments are made more frequently.
Calculating the Effective Interest Rate with VaryingCash Flows
It is also possible to calculate the effective rate using theinternal rate of return method and taking into accountcash flows that vary during the loan term. This is becausethe internal rate of return calculation can consider eachcash flow rather than a constant stream. This would be
PV Present value, or the net amount of cashdisbursed to the borrower at the beginningof the loan.
=
=
=
=
=
i
n
PMT
FV
Interest rate, which must be expressedin same time units as n below.
Loan term, which must equal the numberof payments to be made.
Payment made each period.
Future value, or the amount remainingafter the repayment schedule is completed(zero except for loans with compulsory savings that are returned to the borrower).
D E S I G N I N G L E N D I N G P R O D U C T S 147
Table 5.7 Variables Summary
Effective rate, Effective rate,Loan variables 4–month term (percent) 6–month term (percent)
Base case, declining balance 36.0 36.0Flat interest 53.3 59.3Up-front interest payment 38.9 40.2Loan service fee 51.4 47.1Payment frequency 45.6 43.4Compulsory savings 39.1 42.0Group fund contribution 41.2 44.7
Source: Adapted from Rosenberg 1996.
useful for loans that have a grace period during the loanterm or if a lump sum payment is made at the end of theloan term. For a discussion of calculating the internal rateof return on a loan with varying cash flows, see appendix 3.
How does the Effective Cost for the Borrower Differfrom the Effective Yield to the Lender?
Yield refers to the revenue earned by the lender on the port-folio outstanding, including interest revenue and fees.Calculating the effective yield earned on the portfolioallows an MFI to determine if enough revenue will begenerated to cover all costs, leading to financial self-sufficiency. Projecting the effective yield is also useful forforecasting revenues and determining the effect ofchanges in pricing policies on revenue.
The projected effective yield is also useful for MFIs tocompare to the actual yield on their portfolios.
The effective yield to the lender differs from the effec-tive cost to the borrower for two reasons:� If there are components of the loan pricing, such as
compulsory savings or fund contributions, that are notheld by and hence do not result in revenue to thelender (for example, if savings are put into a commer-cial bank or fees are charged to the borrower by anotherinstitution, such as training fees), they are not includedin the yield calculation but are included in the effectiveinterest rate (for the borrower) calculation.
� The expected yield to the lender differs because thecost to the borrower is determined on the initial loanamount, whereas the return to the lender must bebased on the average portfolio outstanding. Thisresults in differing calculations for annualizing period-ic interest rates—periodic rates are either multipliedby the number of periods or compounded.If all elements of the loan are both costs to the bor-
rower and revenue to the lender, then the only differencebetween the effective cost and the effective yield is themethod used to annualize the rate.
In the examples above, for simplicity’s sake we multi-plied the periodic interest rate to achieve an annual rate.However, the decision to multiply or compound theperiodic rate is based on whether or not the cost to theborrower or the yield to the lender is being determined.� For the cost to the borrower, the internal rate of return
is compounded by the number of payment periods in ayear. The internal rate of return must be compounded
rather than simply multiplied by the number of peri-ods, because we assume that the reinvestment rate ofthe borrower is equal to the internal rate of return. Inother words, the internal rate of return per period isthe amount the borrower forgoes by repaying the loanin installments (that is, the principal amount availabledeclines with each installment). Therefore the returnearned per period if the borrower could reinvestwould compound over time.
� For the yield to the lender, the per period rate is multi-plied, because we assume that the revenue generated isused to cover expenses and is not reinvested (only theprincipal is reinvested). Therefore, the average port-folio outstanding does not increase (unless revenueexceeds expenses).To compound the rate, the periodic internal rate of
return must be stated as a decimal amount rather than asa percentage amount. To do this, the periodic internalrate of return is divided by 100. To annualize the period-ic rate, the following formula is used:
where IRRp equals the internal rate of return per perioddivided by 100 and a equals the number of periods in ayear (a = 12 if p is one month; a = 32 if p is one week).� For example, a 1,000 loan, repaid in four equal
monthly payments of principal and interest, with aninterest rate of 36 percent per year, calculated on a flatbasis results in the following internal rate of return:
Solving for i yields an internal rate of return of 4.69percent.
The borrower’s effective rate is 73.3 percent andthe yield to the lender is closer to 56.3 percent, a dif-ference of 17 percent (example 5.3).The effective yield on the portfolio of an MFI is
reduced by:� The amount of delinquent (or non-revenue-generating)
loans� Late payments� Low loan turnover (idle funds)� Fraud� Reporting errors or failures that lead to delayed collec-
tion of loans� Prepayments if interest is calculated on the declining
balance and funds remain idle.
PV = ,1000; PMT = –280; n = 4
annual internal rate of return
(1 + IRRp)a–1=
148 M I C R O F I N A N C E H A N D B O O K
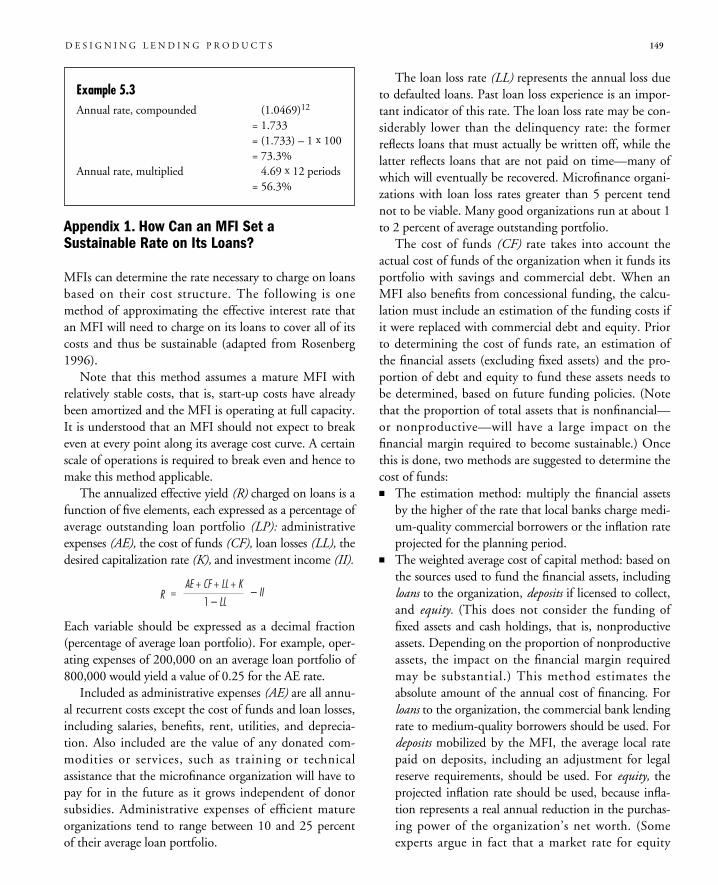
Appendix 1. How Can an MFI Set aSustainable Rate on Its Loans?
MFIs can determine the rate necessary to charge on loansbased on their cost structure. The following is onemethod of approximating the effective interest rate thatan MFI will need to charge on its loans to cover all of itscosts and thus be sustainable (adapted from Rosenberg1996).
Note that this method assumes a mature MFI withrelatively stable costs, that is, start-up costs have alreadybeen amortized and the MFI is operating at full capacity.It is understood that an MFI should not expect to breakeven at every point along its average cost curve. A certainscale of operations is required to break even and hence tomake this method applicable.
The annualized effective yield (R) charged on loans is afunction of five elements, each expressed as a percentage ofaverage outstanding loan portfolio (LP): administrativeexpenses (AE), the cost of funds (CF), loan losses (LL), thedesired capitalization rate (K), and investment income (II).
Each variable should be expressed as a decimal fraction(percentage of average loan portfolio). For example, oper-ating expenses of 200,000 on an average loan portfolio of800,000 would yield a value of 0.25 for the AE rate.
Included as administrative expenses (AE) are all annu-al recurrent costs except the cost of funds and loan losses,including salaries, benefits, rent, utilities, and deprecia-tion. Also included are the value of any donated com-modities or services, such as training or technicalassistance that the microfinance organization will have topay for in the future as it grows independent of donorsubsidies. Administrative expenses of efficient matureorganizations tend to range between 10 and 25 percentof their average loan portfolio.
The loan loss rate (LL) represents the annual loss dueto defaulted loans. Past loan loss experience is an impor-tant indicator of this rate. The loan loss rate may be con-siderably lower than the delinquency rate: the formerreflects loans that must actually be written off, while thelatter reflects loans that are not paid on time—many ofwhich will eventually be recovered. Microfinance organi-zations with loan loss rates greater than 5 percent tendnot to be viable. Many good organizations run at about 1to 2 percent of average outstanding portfolio.
The cost of funds (CF) rate takes into account theactual cost of funds of the organization when it funds itsportfolio with savings and commercial debt. When anMFI also benefits from concessional funding, the calcu-lation must include an estimation of the funding costs ifit were replaced with commercial debt and equity. Priorto determining the cost of funds rate, an estimation ofthe financial assets (excluding fixed assets) and the pro-portion of debt and equity to fund these assets needs tobe determined, based on future funding policies. (Notethat the proportion of total assets that is nonfinancial—or nonproductive—will have a large impact on thefinancial margin required to become sustainable.) Oncethis is done, two methods are suggested to determine thecost of funds:� The estimation method: multiply the financial assets
by the higher of the rate that local banks charge medi-um-quality commercial borrowers or the inflation rateprojected for the planning period.
� The weighted average cost of capital method: based onthe sources used to fund the financial assets, includingloans to the organization, deposits if licensed to collect,and equity. (This does not consider the funding offixed assets and cash holdings, that is, nonproductiveassets. Depending on the proportion of nonproductiveassets, the impact on the financial margin requiredmay be substantial.) This method estimates theabsolute amount of the annual cost of financing. Forloans to the organization, the commercial bank lendingrate to medium-quality borrowers should be used. Fordeposits mobilized by the MFI, the average local ratepaid on deposits, including an adjustment for legalreserve requirements, should be used. For equity, theprojected inflation rate should be used, because infla-tion represents a real annual reduction in the purchas-ing power of the organization’s net worth. (Someexperts argue in fact that a market rate for equity
RAE + CF + LL + K
1 – LL= – II
D E S I G N I N G L E N D I N G P R O D U C T S 149
Example 5.3Annual rate, compounded (1.0469)12
= 1.733= (1.733) – 1 x 100= 73.3%
Annual rate, multiplied 4.69 x 12 periods= 56.3%
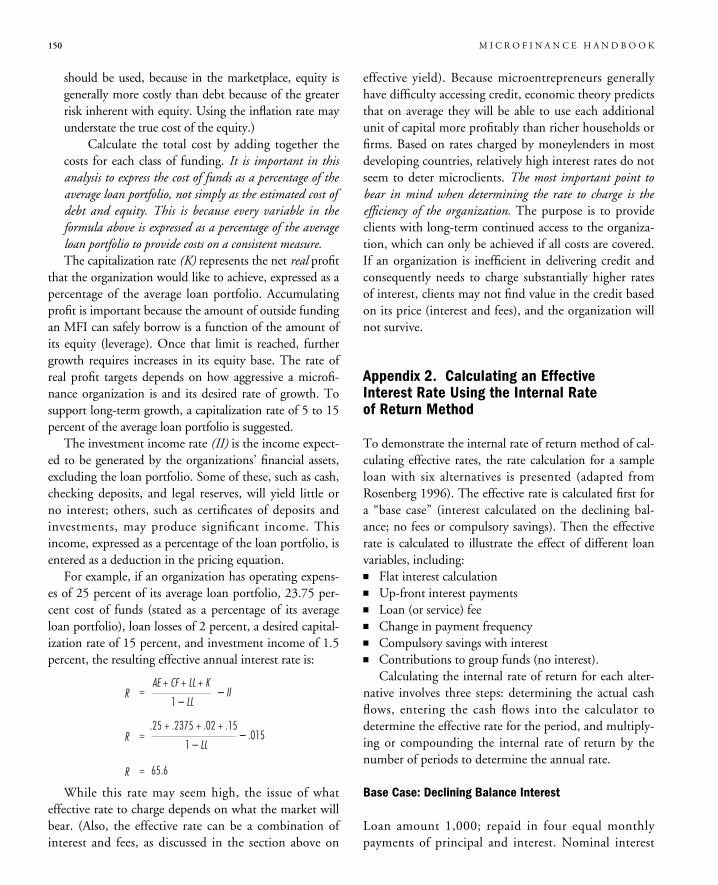
150 M I C R O F I N A N C E H A N D B O O K
should be used, because in the marketplace, equity isgenerally more costly than debt because of the greaterrisk inherent with equity. Using the inflation rate mayunderstate the true cost of the equity.)
Calculate the total cost by adding together thecosts for each class of funding. It is important in thisanalysis to express the cost of funds as a percentage of theaverage loan portfolio, not simply as the estimated cost ofdebt and equity. This is because every variable in theformula above is expressed as a percentage of the averageloan portfolio to provide costs on a consistent measure.The capitalization rate (K) represents the net real profit
that the organization would like to achieve, expressed as apercentage of the average loan portfolio. Accumulatingprofit is important because the amount of outside fundingan MFI can safely borrow is a function of the amount ofits equity (leverage). Once that limit is reached, furthergrowth requires increases in its equity base. The rate ofreal profit targets depends on how aggressive a microfi-nance organization is and its desired rate of growth. Tosupport long-term growth, a capitalization rate of 5 to 15percent of the average loan portfolio is suggested.
The investment income rate (II) is the income expect-ed to be generated by the organizations’ financial assets,excluding the loan portfolio. Some of these, such as cash,checking deposits, and legal reserves, will yield little orno interest; others, such as certificates of deposits andinvestments, may produce significant income. Thisincome, expressed as a percentage of the loan portfolio, isentered as a deduction in the pricing equation.
For example, if an organization has operating expens-es of 25 percent of its average loan portfolio, 23.75 per-cent cost of funds (stated as a percentage of its averageloan portfolio), loan losses of 2 percent, a desired capital-ization rate of 15 percent, and investment income of 1.5percent, the resulting effective annual interest rate is:
While this rate may seem high, the issue of whateffective rate to charge depends on what the market willbear. (Also, the effective rate can be a combination ofinterest and fees, as discussed in the section above on
effective yield). Because microentrepreneurs generallyhave difficulty accessing credit, economic theory predictsthat on average they will be able to use each additionalunit of capital more profitably than richer households orfirms. Based on rates charged by moneylenders in mostdeveloping countries, relatively high interest rates do notseem to deter microclients. The most important point tobear in mind when determining the rate to charge is theefficiency of the organization. The purpose is to provideclients with long-term continued access to the organiza-tion, which can only be achieved if all costs are covered.If an organization is inefficient in delivering credit andconsequently needs to charge substantially higher ratesof interest, clients may not find value in the credit basedon its price (interest and fees), and the organization willnot survive.
Appendix 2. Calculating an EffectiveInterest Rate Using the Internal Rateof Return Method
To demonstrate the internal rate of return method of cal-culating effective rates, the rate calculation for a sampleloan with six alternatives is presented (adapted fromRosenberg 1996). The effective rate is calculated first fora “base case” (interest calculated on the declining bal-ance; no fees or compulsory savings). Then the effectiverate is calculated to illustrate the effect of different loanvariables, including:� Flat interest calculation� Up-front interest payments� Loan (or service) fee� Change in payment frequency� Compulsory savings with interest� Contributions to group funds (no interest).
Calculating the internal rate of return for each alter-native involves three steps: determining the actual cashflows, entering the cash flows into the calculator todetermine the effective rate for the period, and multiply-ing or compounding the internal rate of return by thenumber of periods to determine the annual rate.
Base Case: Declining Balance Interest
Loan amount 1,000; repaid in four equal monthlypayments of principal and interest. Nominal interest
RAE + CF + LL + K
1 – LL=
R =
R =
– II
.25 + .2375 + .02 + .15
1 – LL– .015
65.6
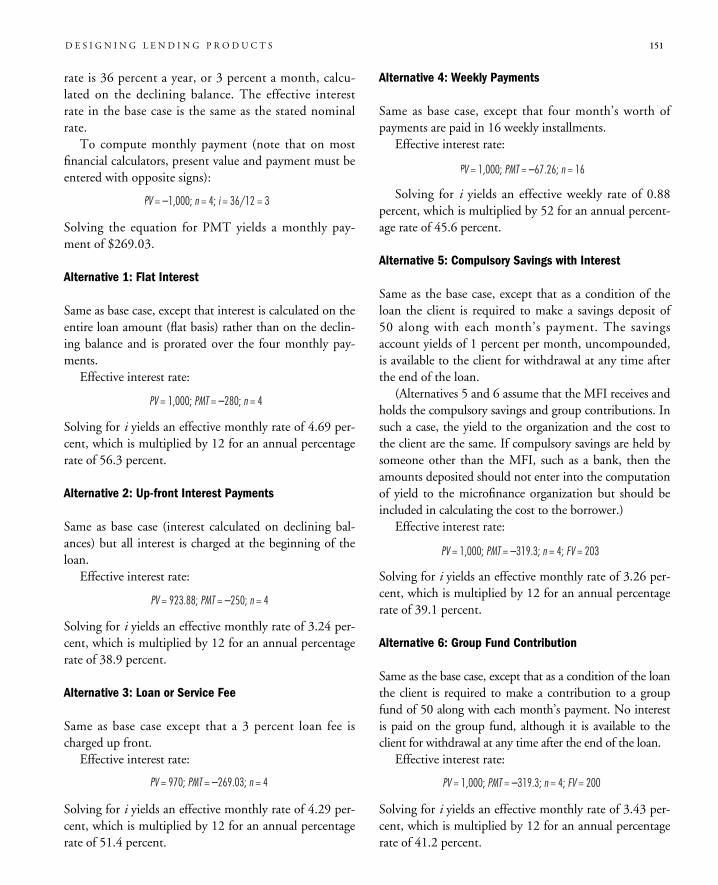
rate is 36 percent a year, or 3 percent a month, calcu-lated on the declining balance. The effective interestrate in the base case is the same as the stated nominalrate.
To compute monthly payment (note that on mostfinancial calculators, present value and payment must beentered with opposite signs):
Solving the equation for PMT yields a monthly pay-ment of $269.03.
Alternative 1: Flat Interest
Same as base case, except that interest is calculated on theentire loan amount (flat basis) rather than on the declin-ing balance and is prorated over the four monthly pay-ments.
Effective interest rate:
Solving for i yields an effective monthly rate of 4.69 per-cent, which is multiplied by 12 for an annual percentagerate of 56.3 percent.
Alternative 2: Up-front Interest Payments
Same as base case (interest calculated on declining bal-ances) but all interest is charged at the beginning of theloan.
Effective interest rate:
Solving for i yields an effective monthly rate of 3.24 per-cent, which is multiplied by 12 for an annual percentagerate of 38.9 percent.
Alternative 3: Loan or Service Fee
Same as base case except that a 3 percent loan fee ischarged up front.
Effective interest rate:
Solving for i yields an effective monthly rate of 4.29 per-cent, which is multiplied by 12 for an annual percentagerate of 51.4 percent.
Alternative 4: Weekly Payments
Same as base case, except that four month’s worth ofpayments are paid in 16 weekly installments.
Effective interest rate:
Solving for i yields an effective weekly rate of 0.88percent, which is multiplied by 52 for an annual percent-age rate of 45.6 percent.
Alternative 5: Compulsory Savings with Interest
Same as the base case, except that as a condition of theloan the client is required to make a savings deposit of50 along with each month’s payment. The savingsaccount yields of 1 percent per month, uncompounded,is available to the client for withdrawal at any time afterthe end of the loan.
(Alternatives 5 and 6 assume that the MFI receives andholds the compulsory savings and group contributions. Insuch a case, the yield to the organization and the cost tothe client are the same. If compulsory savings are held bysomeone other than the MFI, such as a bank, then theamounts deposited should not enter into the computationof yield to the microfinance organization but should beincluded in calculating the cost to the borrower.)
Effective interest rate:
Solving for i yields an effective monthly rate of 3.26 per-cent, which is multiplied by 12 for an annual percentagerate of 39.1 percent.
Alternative 6: Group Fund Contribution
Same as the base case, except that as a condition of the loanthe client is required to make a contribution to a groupfund of 50 along with each month’s payment. No interestis paid on the group fund, although it is available to theclient for withdrawal at any time after the end of the loan.
Effective interest rate:
Solving for i yields an effective monthly rate of 3.43 per-cent, which is multiplied by 12 for an annual percentagerate of 41.2 percent.
PV = 1,000; PMT = –319.3; n = 4; FV = 200
PV = 1,000; PMT = –319.3; n = 4; FV = 203
PV = 1,000; PMT = –67.26; n = 16
PV = 970; PMT = –269.03; n = 4
PV = 923.88; PMT = –250; n = 4
PV = 1,000; PMT = –280; n = 4
PV = –1,000; n = 4; i = 36/12 = 3
D E S I G N I N G L E N D I N G P R O D U C T S 151
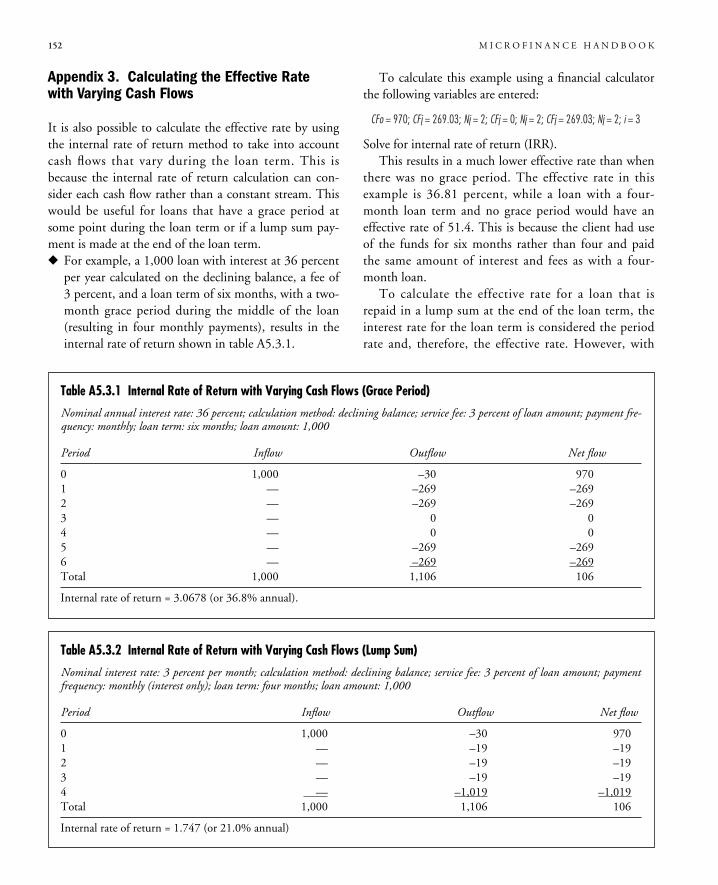
Appendix 3. Calculating the Effective Ratewith Varying Cash Flows
It is also possible to calculate the effective rate by usingthe internal rate of return method to take into accountcash flows that vary during the loan term. This isbecause the internal rate of return calculation can con-sider each cash flow rather than a constant stream. Thiswould be useful for loans that have a grace period atsome point during the loan term or if a lump sum pay-ment is made at the end of the loan term.� For example, a 1,000 loan with interest at 36 percent
per year calculated on the declining balance, a fee of3 percent, and a loan term of six months, with a two-month grace period during the middle of the loan(resulting in four monthly payments), results in theinternal rate of return shown in table A5.3.1.
To calculate this example using a financial calculatorthe following variables are entered:
Solve for internal rate of return (IRR).This results in a much lower effective rate than when
there was no grace period. The effective rate in thisexample is 36.81 percent, while a loan with a four-month loan term and no grace period would have aneffective rate of 51.4. This is because the client had useof the funds for six months rather than four and paidthe same amount of interest and fees as with a four-month loan.
To calculate the effective rate for a loan that isrepaid in a lump sum at the end of the loan term, theinterest rate for the loan term is considered the periodrate and, therefore, the effective rate. However, with
CFo = 970; CFj = 269.03; Nj = 2; CFj = 0; Nj = 2; CFj = 269.03; Nj = 2; i = 3
152 M I C R O F I N A N C E H A N D B O O K
Table A5.3.2 Internal Rate of Return with Varying Cash Flows (Lump Sum)
Nominal interest rate: 3 percent per month; calculation method: declining balance; service fee: 3 percent of loan amount; paymentfrequency: monthly (interest only); loan term: four months; loan amount: 1,000
Period Inflow Outflow Net flow
0 1,000 –30 9701 — –19 –192 — –19 –193 — –19 –194 — –1,019 –1,019Total 1,000 1,106 106
Internal rate of return = 1.747 (or 21.0% annual)
Table A5.3.1 Internal Rate of Return with Varying Cash Flows (Grace Period)
Nominal annual interest rate: 36 percent; calculation method: declining balance; service fee: 3 percent of loan amount; payment fre-quency: monthly; loan term: six months; loan amount: 1,000
Period Inflow Outflow Net flow
0 1,000 –30 9701 — –269 –2692 — –269 –2693 — 0 04 — 0 05 — –269 –2696 — –269 –269Total 1,000 1,106 106
Internal rate of return = 3.0678 (or 36.8% annual).
loans that require the interest to be paid in install-ments and the principal to be paid at the end of theloan term, the internal rate of return calculation isused.� For example, a 1,000 loan with interest at 3 percent
per month calculated on the declining balance, a feeof 3 percent, and a loan term of four months, withinterest paid monthly and the principal paid at theend of the loan term, results in the internal rate ofreturn shown in table A5.3.2.To calculate the above example using a financial cal-
culator the following variables are entered:
The substantially lower effective rate is a result ofthe borrower having use of the full amount of theprincipal (1,000) for the entire loan term of fourmonths. For the MFI to earn an effective yield equalto a loan that has principal and interest paid in install-ments, the nominal rate would have to be increasedconsiderably.
Sources and Further Reading
Benjamin, McDonald, and Joanna Ledgerwood. 1998. “TheAssociation for the Development of Microenterprises(ADEMI): ‘Democratising Credit’ in the DominicanRepublic.” World Bank, Sustainable Banking with thePoor, Washington, D.C.
Ledgerwood, Joanna. 1996. Financial Management Training forMicrofinance Organizations: Finance Study Guide. NewYork: PACT Publications (for Calmeadow).
Rosenberg, Rich. 1996. “Microcredit Interest Rates.” CGAPOccasional Paper 1. World Bank, Consultative Group toAssist the Poorest (CGAP), Washington, D.C.
Von Pischke, J.D. 1991. Finance at the Frontier: Debt Capacityand the Role of Credit in the Private Economy. Washington,D.C.: World Bank, Economic Development Institute.
Waterfield, Charles. 1995. “Financial Viability Model—Facilitator’s Notes.” SEEP Network. New York.
Women’s World Banking. 1994. “Principles and Practices ofFinancial Management for Microenterprise Lenders andOther Service Organizations.” In Women’s World BankingBest Practice Workbook. New York.
CFo = 970; CFj = 19; Nj = 3; CFj = 1,019; i = 3
D E S I G N I N G L E N D I N G P R O D U C T S 153

155
Designing SavingsProducts
C H A P T E R S I X
Savings services are often not available to MFIclients for two main reasons. First, there is amistaken belief that the poor cannot and do not
save, meaning that their demand for savings productsgoes unheard and unnoticed. Second, due to the regu-latory constraints of most MFIs, many are not legallyallowed to mobilize deposits. As these reasons rein-force and perpetuate each other, deposits from the poorare formally mobilized only infrequently. Furthermore,as MFIs expand their operations, few are able toincrease their outreach to a significant number ofclients unless they increase their funding sources toinclude voluntary deposits. MFIs that depend on exter-nal sources of donated funding often concentrate onthe demands of donors rather than on the demands ofpotential clients, especially potential savings clients(GTZ 1997a).
“Savings mobilization is considered now to be acrucial factor in the development of soundfinancial markets. There are a growing numberof successful savings mobilization programs indeveloping countries and governments andinternational agencies have recently becomemuch more interested in such activities. Ruraland non-wealthy households in particular havebecome the focus of policies to promote savings,as the myths that the poor have no margin overconsumption for saving and do not respond toeconomic incentives are increasingly being ques-tioned.” (FAO 1995, 14)Subsidized credit funds also contribute to the lim-
ited mobilization of savings deposits. MFIs receivingsubsidized funding have little or no incentive tomobilize deposits, because they have funds available
for on-lending from donors at lower rates than theywould have to pay depositors. Furthermore, accessingdonor funding is often less costly than developing theinfrastructure required to mobilize deposits.
If an MFI is to mobilize savings effectively, theremust be suitable economic and political environmentsin the country in which it is working. Reasonable lev-els of macroeconomic management and political sta-bility are required because they affect the rate ofinflation, which influences the ability of an MFI tooffer savings services in a sustainable manner. In addi-tion, an appropriate and enabling regulatory environ-ment is necessary.
Finally, the institution itself must have establisheda good record of sound financial management andinternal controls, which assures depositors that theirfunds will be safely held by the MFI.
This chapter highlights the demand for savings ser-vices and the environment in which the MFI operates,including the legal requirements for providing savingsservices. This activity implies a necessary developmentof the institutional capacity of the MFI, including itshuman resources, infrastructure, security, manage-ment information system, and risk management. Thediscussion in this chapter includes an overview of thetypes and pricing of savings products that MFIs pro-vide and the costs associated with delivering savingsservices. Its focus is on the design of voluntary savingsproducts, which are a separate and distinct productfrom loans and are generally accessible whether clientsare borrowers or not. Voluntary savings differ fromcompulsory savings (discussed in the previous chap-ter) in that they are not a mandatory requirement forreceiving a loan.
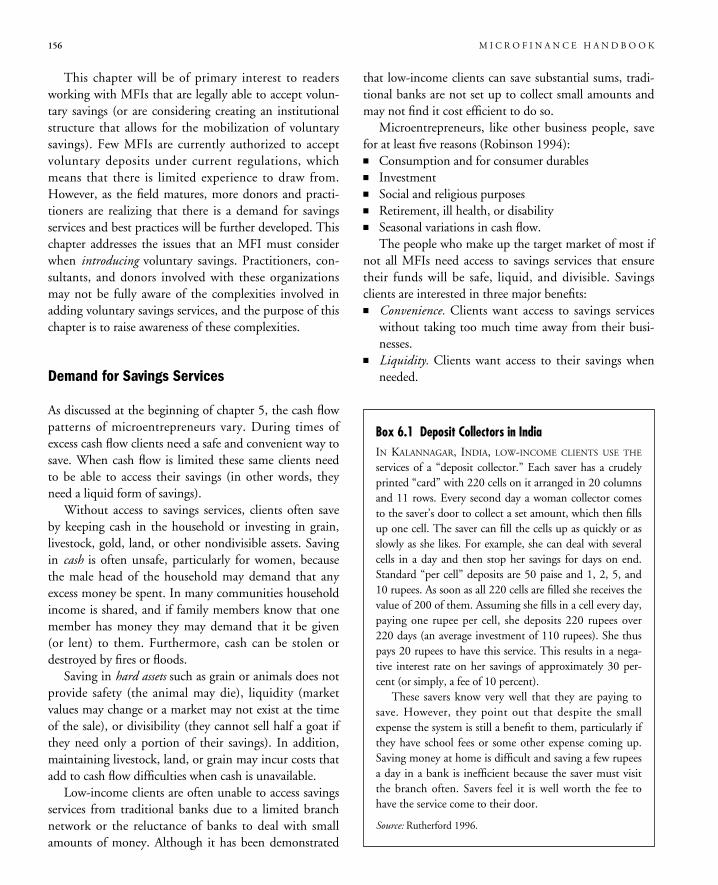
156 M I C R O F I N A N C E H A N D B O O K
This chapter will be of primary interest to readersworking with MFIs that are legally able to accept volun-tary savings (or are considering creating an institutionalstructure that allows for the mobilization of voluntarysavings). Few MFIs are currently authorized to acceptvoluntary deposits under current regulations, whichmeans that there is limited experience to draw from.However, as the field matures, more donors and practi-tioners are realizing that there is a demand for savingsservices and best practices will be further developed. Thischapter addresses the issues that an MFI must considerwhen introducing voluntary savings. Practitioners, con-sultants, and donors involved with these organizationsmay not be fully aware of the complexities involved inadding voluntary savings services, and the purpose of thischapter is to raise awareness of these complexities.
Demand for Savings Services
As discussed at the beginning of chapter 5, the cash flowpatterns of microentrepreneurs vary. During times ofexcess cash flow clients need a safe and convenient way tosave. When cash flow is limited these same clients needto be able to access their savings (in other words, theyneed a liquid form of savings).
Without access to savings services, clients often saveby keeping cash in the household or investing in grain,livestock, gold, land, or other nondivisible assets. Savingin cash is often unsafe, particularly for women, becausethe male head of the household may demand that anyexcess money be spent. In many communities householdincome is shared, and if family members know that onemember has money they may demand that it be given(or lent) to them. Furthermore, cash can be stolen ordestroyed by fires or floods.
Saving in hard assets such as grain or animals does notprovide safety (the animal may die), liquidity (marketvalues may change or a market may not exist at the timeof the sale), or divisibility (they cannot sell half a goat ifthey need only a portion of their savings). In addition,maintaining livestock, land, or grain may incur costs thatadd to cash flow difficulties when cash is unavailable.
Low-income clients are often unable to access savingsservices from traditional banks due to a limited branchnetwork or the reluctance of banks to deal with smallamounts of money. Although it has been demonstrated
that low-income clients can save substantial sums, tradi-tional banks are not set up to collect small amounts andmay not find it cost efficient to do so.
Microentrepreneurs, like other business people, savefor at least five reasons (Robinson 1994):� Consumption and for consumer durables� Investment� Social and religious purposes� Retirement, ill health, or disability� Seasonal variations in cash flow.
The people who make up the target market of most ifnot all MFIs need access to savings services that ensuretheir funds will be safe, liquid, and divisible. Savingsclients are interested in three major benefits:� Convenience. Clients want access to savings services
without taking too much time away from their busi-nesses.
� Liquidity. Clients want access to their savings whenneeded.
Box 6.1 Deposit Collectors in IndiaIN KALANNAGAR, INDIA, LOW-INCOME CLIENTS USE THE
services of a “deposit collector.” Each saver has a crudelyprinted “card” with 220 cells on it arranged in 20 columnsand 11 rows. Every second day a woman collector comesto the saver’s door to collect a set amount, which then fillsup one cell. The saver can fill the cells up as quickly or asslowly as she likes. For example, she can deal with severalcells in a day and then stop her savings for days on end.Standard “per cell” deposits are 50 paise and 1, 2, 5, and10 rupees. As soon as all 220 cells are filled she receives thevalue of 200 of them. Assuming she fills in a cell every day,paying one rupee per cell, she deposits 220 rupees over220 days (an average investment of 110 rupees). She thuspays 20 rupees to have this service. This results in a nega-tive interest rate on her savings of approximately 30 per-cent (or simply, a fee of 10 percent).
These savers know very well that they are paying tosave. However, they point out that despite the smallexpense the system is still a benefit to them, particularly ifthey have school fees or some other expense coming up.Saving money at home is difficult and saving a few rupeesa day in a bank is inefficient because the saver must visitthe branch often. Savers feel it is well worth the fee tohave the service come to their door.
Source: Rutherford 1996.
D E S I G N I N G S A V I N G S P R O D U C T S 157
� Security. Clients want to be sure that their savings aresafe and that the institution that collects them is stable.For the most part, savings clients have not considered
the interest earned on savings to be a priority; however, itdoes become a priority when resources are scarce and thereare many profitable investment opportunities.
Is There an Enabling Environment?
To mobilize savings effectively, an MFI needs to be oper-ating in a country in which the financial sector has beenliberalized. This includes abolishing interest rate ceilingsand foreign exchange controls, admitting new entrantsinto the market, as well as establishing reasonable capitalrequirements. Furthermore, the government must notallow unqualified institutions to mobilize public savings.Nor must is allow more institutions to mobilize savingsthan the supervisory body is able to supervise effectively.
Savings clients cannot be expected to have enoughinformation to evaluate the soundness of the institutionwith which they save. The government must superviseinstitutions that mobilize public deposits, either directlyor through an effectively managed body that it approves.This usually entails a willingness on the part of the gov-ernment to modify its banking supervision so that MFIsare appropriately regulated and supervised (see chapter 1).
“Well-designed and well-delivered deposit servicescan simultaneously benefit households, enterprises,groups, the participating financial institutions, andthe government. Good savings programs can con-tribute to local, regional, and national economicdevelopment and can help improve equity.”(Robinson 1994, 35)External regulations should be based on international
banking standards and more specifically on internationalaccounting principles, minimum capital requirements,techniques to reduce and diversify the risk exposure ofassets, provision policies, and performance criteria (GTZ1997a).
MFIs that are not operating in enabling environmentsmust lobby the appropriate authorities to make the nec-essary changes. To do this they must familiarize them-selves with international and local experience andevidence to support their arguments. They should alsoconduct market research on the demand for savingsinstruments in their own markets (CGAP 1997).
Bank Rakyat Indonesia is one of the best known casesof a state bank providing savings services to low-incomeclients in a sustainable manner. Bank Rakyat Indonesiahas shown that microentrepreneurs utilize savings ser-vices more than credit services (box 6.2).
Legal Requirements for Offering VoluntarySavings Services
There are two major legal requirements that generallyneed to be fulfilled before an MFI can offer voluntarysavings services: licensing and reserve requirements.
LICENSING. For the most part, an MFI needs to belicensed to collect savings. This usually means that itbecomes subject to some form of regulation.
When discussing voluntary savings services, it isimportant to differentiate between savings services thatare provided to borrowers or members and those avail-able to the general public. Many informal or semiformalMFIs collect savings from their members and either on-lend these savings or deposit them in a formal financialinstitution. Although some are licensed (as NGOs), theyare not necessarily licensed as financial intermediaries(that is, to accept deposits) and are generally not super-vised or regulated in their deposit activities.
To accept deposits from the general public, an organi-zation must have a license. MFIs that are licensed asdeposit-taking institutions are generally subject to someform of regulation and supervision by the country’ssuperintendent of banks, central bank, or other govern-ment department or entity. Adhering to regulatory andsupervisory requirements usually imposes additional costson the MFI (such as reserve requirements).
Ultimately, to be licensed to accept deposits an MFImust have the financial strength and institutional capaci-ty to do so. Determining the capacity of MFIs is theresponsibility of the licensing body.
RESERVE REQUIREMENTS. Reserve requirements refer toa percentage of deposits accepted by an institutionthat must be held in the central bank or in a similarsafe and liquid form. They are imposed by the localsuperintendent of banks on formalized MFIs accept-ing deposits to ensure that depositors’ funds are bothsafe and accessible. By mandating a certain percentageof deposit funds as a reserve, governments restrict
MFIs with respect to the total amount of funds avail-able to them for on-lending.
Reserve requirements result in increased costs toMFIs, because the amount held as reserve cannot be lentout and thus does not earn the effective portfolio yield orinvestment return rate.
Reserve requirements are often separated between pri-mary reserves and secondary reserves. For example, inCanada all chartered banks are required to maintain areserve with the central bank equal to the aggregate of 10percent of Canadian currency demand deposits, 2 per-cent of Canadian currency notice deposits, 1 percent ofCanadian currency notice deposits in excess ofCDN$500 million, and 3 percent of foreign currencydeposits held in Canada by Canadian residents. This pri-mary reserve is not interest bearing to the chartered bank.
Secondary reserves are bank reserves, which must bemaintained in prescribed interest-bearing public debt orday loans to investment dealers in Canada, or cash.These reserves may not be greater than 12 percent ofdeposits of Canadian residents of the bank, its offices in
Canada, or any of its subsidiaries (Morris, Power, andVarma 1986).
Reserve requirements in Indonesia are 5 percent, inthe Philippines 8 percent, and in Colombia 10 percent.Some government banks, such as those in Thailand, areexempt from reserve requirements, which gives them aconsiderable advantage over other institutions.
Deposit Insurance
The best way to ensure the safety of deposits is to pre-vent the failure of the MFIs providing the deposit ser-vices. This is best done by ensuring that MFIs havesound management and prudent lending policies andare supported by adequate regulation and supervision.However, most industrial countries (and many develop-ing countries) have established deposit insurance plansas a safety net to protect depositors should an institutionnot be prudently managed. (Informal financial institu-tions collecting deposits are generally unable to partici-pate in deposit insurance schemes.) Deposit insurance
158 M I C R O F I N A N C E H A N D B O O K
IN JUNE 1983 THE INDONESIAN GOVERNMENT DEREGULATED
the financial sector to allow government banks to set theirown interest rates on most loans and deposits. At that timeTABANAS, the government’s national savings program, hadbeen offered in Bank Rakyat Indonesia’s more than 3,600local-level banks for about a decade but had mobilized only$17.6 million. State banks had been required to lend at 12percent and to pay 15 percent on most deposits, providing anegative incentive for deposit mobilization. In addition,TABANAS, the only instrument available, limited with-drawals to twice a month, a provision that was unacceptableto most villagers, who wanted to be sure that their savingswould be accessible whenever they were needed.
But the low savings total of the local banking system waswidely attributed not to its real causes—primarily the inter-est rate regulations and the poorly designed TABANASinstrument—but to untested assumptions that villagers didnot save and that even if there were some who did, theywould not save in banks. Both assumptions were wrong.Extensive field research in the 1980s showed—much to thesurprise of most government and Bank Rakyat Indonesiaofficials—that there was vast unmet demand, both rural and
urban, for a liquid savings instrument in which both finan-cial stocks and savings from income flows could be safelydeposited. Also, many lower-income people wanted to con-vert some of their nonfinancial savings into financial savings,if these could be deposited in liquid accounts. There was alsodemand for fixed deposit accounts.
As of December 31, 1995, Bank Rakyat Indonesia’s pri-mary savings product, SIMPEDES, and its urban counter-part, SIMASKOT, accounted for 77 percent of the totaldeposits in the bank’s local banking system. The bankingsystem that mobilized $17.6 million in its first decade mobi-lized $2.7 billion in its second decade—from the same cus-tomers in the same banks! This spectacular change occurredprimarily because after 1983 the bank had an incentive tomobilize savings and began to learn about its local markets.Deposit instruments were then designed specifically to meetdifferent types of local demand.
With 14.5 million savings accounts as of December 31,1995, Bank Rakyat Indonesia’s local banking system providessavings services to about 30 percent of Indonesia’s households.Households and enterprises also benefit from the expandedvolume of institutional credit financed by the savings program.
Box 6.2 Savings Mobilization at Bank Rakyat Indonesia
Source: Robinson 1995.
guarantees a maximum nominal value of deposits toeach saver (based on the amount they have deposited) ifthe institution collecting deposits fails. This insurance isgenerally government controlled and provided by anapex institution, to which each regulated deposit-takinginstitution pays a fee. In some countries the governmentalso contributes funds. In all cases it is important thatthe government provide the necessary backup support tomake the system effective (box 6.3).
Deposit insurance is established for three main rea-sons (FAO 1995):� It strengthens confidence in the banking system and
helps to promote deposit mobilization.� It provides the government with a formal mechanism
for dealing with failing banks.� It ensures that small depositors are protected in the
event of a bank failure.Two of the main disadvantages of deposit insurance
plans are that savers have less incentive to select stableMFIs and MFIs have less incentive to manage their orga-nizations prudently. However, the need to protect thosewho deposit in MFIs is particularly important, due to theimperfect information about the MFI available to low-income clients and the lack of interest of governments inintervening and compensating savers when an MFI fails,since in most cases its failure is not likely to be seen as athreat to the financial stability of a country.
Although deposit insurance plans should include alldeposit-taking institutions, including cooperatives andsemiformal MFIs, it may not be appropriate to providethe same insurance for all institutions. Having separate
D E S I G N I N G S A V I N G S P R O D U C T S 159
Box 6.3 Deposit Insurance in IndiaDEPOSIT INSURANCE IN INDIA IS IMPLEMENTED BY A PUBLIC
sector agency called the Deposit Insurance and CreditGuarantee Corporation, which was set up in 1962 in thewake of the collapse of a private bank. The agency offersdeposit and credit insurance to the entire banking sector inIndia, including cooperatives and rural banks. While creditinsurance is voluntary, deposit insurance is compulsory forthe banks. The Deposit Insurance and Credit GuaranteeCorporation charges a premium of 5 paise per year for 100rupees on a half-yearly basis (0.0005 percent). Each depos-itor is eligible for a maximum level of protection of 1 lakh(approximately US$2,565), which means practically all ofthe small savers are protected in India.
The scheme seems to have created a significant level ofconfidence among small savers, which has enabled banksto mobilize savings fairly easily, even in remote areas.While banks frequently submit claims on credit insur-ance, very rarely do they invoke deposit insurance, giventhe general financial stability in India.
Source: Shylendra 1998.
THE BANK FOR AGRICULTURE AND AGRICULTURAL
Cooperatives (BAAC) has operated in the rural areas ofThailand for 30 years. Originally conceived of as a vehicle fordelivering low-cost credit to Thai farmers, in recent yearsBAAC has come to be recognized as one of the few sector-spe-cialized government-owned rural financial institutions.
One of the important aspects of this success is the bank’simpressive record in the past decade in mobilizing financialresources. It has done this through vigorous efforts to attractsavings in rural areas, which finance its rapidly expandingagricultural lending portfolio.
There is no formal deposit insurance program in theThai banking sector. However, on a case by case basis, thegovernment has saved depositors from losing their funds bymounting rescue operations overseen by the Bank of
Thailand. Unfortunately, this implicit guarantee approachmay not be very conducive to depositor peace of mind, andit may create perverse managerial incentives for bankers ifthe implicit “safety net” encourages them to pursue overlyrisky lending operations. As a result, BAAC portfolio quali-ty is poor.
Further financial market distortions are created when thepublic believes that such implicit government guarantees areoperated in an uneven manner between state-owned and pri-vately owned financial institutions. The appropriate explicitdeposit guarantee framework is a risk-based deposit insuranceprogram in which each participating financial institution(whether state-owned or privately owned) contributes anamount to the deposit insurance fund based on an indepen-dent assessment of that institution’s portfolio risk.
Source: GTZ 1997b.
Box 6.4 Security of Deposits in the Bank for Agriculture and Agricultural Cooperatives, Thailand
160 M I C R O F I N A N C E H A N D B O O K
deposit insurance funds for each major type of financialintermediary diversifies risk. For example, banks andcredit union insurance funds were not affected by thesavings and loan crisis in the United States, and thusinsurance premiums had to be raised only for savingsand loans associations (FAO 1995).
Even without the availability of deposit insurance,what seems to be most important to the saver is the rep-utation of the bank. Potential savers look for an estab-lished bank with a good reputation, appropriateinstruments, and a convenient local outlet.
Does the MFI Have the NecessaryInstitutional Capacity to Mobilize Savings?
Prior to offering voluntary savings services, MFIs mustensure that they have the institutional structure thatallows them to mobilize savings legally and adequateinstitutional capacity or the ability to develop it.1
Institutional capacity requires that adequate governance,management, staff, and operational structures are inplace to provide savings services. Furthermore, additional(and sometimes substantial) reporting requirements tothe superintendent or other regulatory body implyincreased personnel costs and expanded managementinformation systems.
Ownership, governance, and organizational structureshave a strong impact on client perceptions of MFIs’mobilization of savings. Moreover, the introduction ofvoluntary savings services implies the addition of manynew customers, which in turn requires increased capacityof staff and staff training programs, management, mar-keting systems, infrastructure, security and internal con-trols, management information systems, and riskmanagement.
Ownership and Governance
Public ownership can make an MFI seem reliable andsecure, particularly if strong political support exists andpolitical interference is minimal. Depositors know thatthe government will protect them in the case of a severeliquidity or solvency crisis. However, public ownershipcan also impose limitations on savings if subsidized cred-
it programs exist and government intervention in pricingand customer selection prevails. MFIs must be allowedto operate free of political interference. They must notbe discouraged from mobilizing savings by frequentinjections of inexpensive public funds. Furthermore, ifexternal regulation and supervision is less stringent forpublic than private MFIs, insufficient risk managementmay put depositor funds at risk (box 6.5).
Privately owned MFIs need to ensure that they bothare and are perceived to be sound financial intermedi-aries. Relationships with well-respected individuals, fam-ilies, or institutions such as a religious organization orlarger holding company can help strengthen the confi-dence and trust of their depositors. Furthermore, MFIsthat were traditionally focused only on providing creditservices need to ensure that their identity is reestablishedas a safe place for deposits. This will depend to a largeextent on the quality of the credit services that they pro-vide and their reputation as serious lenders who do notaccept clients who default on their loans.
The governance structure of MFIs is crucial for ensur-ing appropriate financial intermediation services betweensavers and borrowers. MFIs that mobilize savings arelikely to have a more professional governance structure,with greater representation from the private financial sec-tor or the membership than those whose sole business isdisbursing loans.
Organizational Structure
Most MFIs that mobilize savings have organizationalstructures that are both extensive and decentralized. Alocation close to deposit customers reduces transactioncosts for both the MFI and its clients and is an impor-tant part of establishing a permanent relationship builton mutual trust, which is a key to successful savingsmobilization.
Successful MFIs organize their branches or field officesas profit centers and employ a method of transfer pricingthat ensures full-cost coverage throughout the branch net-work. Transfer pricing refers to the pricing of servicesprovided by the head office to the branches on a cost-recovery basis. For example, costs incurred in the headoffice to manage the overall organization are prorated tothe branches based on a percentage of assets (loans) or lia-
1. This section draws substantially from Robinson (1995) and GTZ (1997a).
D E S I G N I N G S A V I N G S P R O D U C T S 161
bilities (deposits) held at the branch. Funding costs areapportioned as well. A branch that disburses a larger vol-ume of loans than the deposits it collects needs to receivefunding from the head office (or another branch) to fundthose loans. The head office (or a regional office) will actas a central funding facility to ensure that any excessdeposits in one branch are “sold” to another branch tofund their loans. The branch that has excess depositsreceives payment (interest revenue) for those funds, whilethe branch receiving them pays a fee (interest expense). Ifthe head office determines that there is no excess fundingwithin the system, it will then access external funding andon-lend it to its branches for a set price.
The transfer price charged to branches (or paid tobranches for excess deposits) is set either close to theinterbank lending rate or at a rate somewhat higher thanthe average cost of funds for the MFI. This providesincentives for branches to mobilize savings locally ratherthan relying on the excess liquidity of other brancheswithin the network. It can also result in some additionalrevenue at the head office level to cover overheads.Transfer pricing ensures transparency and instillsaccountability and responsibility in the branches.
Human Resources
Once savings are introduced, the MFI becomes a truefinancial intermediary, and the consequences for the
institution and its human resources are considerable.Managing a financial intermediary is far more complexthan managing a credit organization, especially since thesize of the organization often increases rapidly. This hasserious consequences if the MFI is like many that haveone or two key individuals who head the organizationand are personally involved in almost every aspect ofoperations. In particular, MFIs mobilizing deposits willbe subject to much greater scrutiny and supervision bygovernment regulators and others. The level of effectivemanagement must be greater than that of an MFI that isproviding credit only.
Staff recruitment should focus on selecting staff fromthe local region who are familiar with customs and cul-ture and, if applicable, the dialect spoken in the region(box 6.6). Local staff tend to instill confidence in clientsand make it easier for them to communicate with theMFI. Studies have found that a strong customer orienta-tion and service culture attitudes are crucial ingredientsfor successful savings mobilization (GTZ 1997a).
Significant training of both management and staffbecomes imperative when introducing savings. Man-agers and staff need to learn how local markets operate,how to locate potential savers, and how to design instru-ments and services for that market. They also need tounderstand basic finance and the importance of an ade-quate spread between lending and deposit services.Often MFI staff have a social development background
THE BANK FOR AGRICULTURE AND AGRICULTURAL
Cooperatives (BAAC) is governed by a board of directorsappointed by the council of ministers. The board controlsthe policies and business operations of the bank. Its enablinglegislation requires that board membership also include rep-resentatives from the prime minister’s office, the Ministry ofFinance, the Ministry of Agriculture and Cooperatives, andother government departments. Thus the board is mainlycomposed of public officials who reflect the interests of thegovernment but lack financial enterprise acumen and experi-ence. The composition of the board reflects the 99.7 percentgovernment ownership of the bank.
This governance structure was inherited from earlieryears when the institution acted primarily as a dispenser offinancial resources received from the government and foreign
donor agencies or on behalf of the government (as in thecase of mandatory commercial bank deposits). The situationhas since changed; BAAC is now responsible for the steward-ship and safekeeping of a large volume of resources from itsnew depositor-clientele.
Despite the radical change in BAAC’s financial resourcebase, there has so far not been an adaptation of the member-ship of the board of directors to reflect the substantial shiftin the array of the institution’s stakeholders. Nor have theopportunities for ownership of the institution been modifiedor broadened significantly to respond to these new interests.
A change in the governance structure of the bank couldmake an important contribution to addressing some of thestakeholders issues that fall outside the original state-ownedenterprise design concept.
Box 6.5 Ownership and Governance at the Bank for Agriculture and Agricultural Cooperatives, Thailand
Source: GTZ 1997b.
and may not appreciate the fact that low-income clientscan and do save. While successful microlending relies onthe loan officer personally understanding each client, theprovision of savings services can be quite different,depending on how those savings are collected and with-drawn. The training needs of all management and staffshould be assessed and delivered both initially and peri-odically as the MFI grows.
Marketing
MFIs providing credit services must select borrowerswhom they trust to repay the loans. When collecting sav-ings, however, it is the customers who must trust theMFI. Deposit clients must be convinced that the MFIstaff is competent and honest. MFIs must actively seekout potential depositors, keeping in mind their targetmarket. Most important, the MFI must first design itssavings products appropriately and then publicize its ser-vices in locally appropriate ways.
During the market research phase, MFIs need to learnwhat savings services are demanded by potential clientsand then incorporate this information into both productdesign and marketing. For example, to encourage savingsmobilization Bank Rakyat Indonesia determined thatsavers would like the opportunity to receive gifts whenthey open a savings account. The bank now offers lotter-
ies with each of its savings products. Each month a draw-ing is made from the names of deposit account holdersand the winners receive a gift such as a television or bicy-cle. Lotteries have proven to be an effective means ofmarketing savings services, and they have been adoptedby BancoSol in Bolivia as well.
Another marketing method employed by BankRakyat Indonesia is the displaying of posters showingpictures of the local subbranch, its larger supervisingbranch, and the bank’s impressive looking head office.This approach is based on the fact that savers tend tobe concerned about placing their savings in whatappears to be a small local bank. When the bank has agood reputation, emphasis on the relationship betweenthe sub-branch and the larger bank is reassuring toclients.
MFIs can also establish “open door” days when clientscan come in and meet staff as well as physically see thesafe where the money is kept. If savers are unfamiliarwith banks in general, they may derive comfort fromobserving a safe environment.
The design of special trademarks for savings productshas also attracted depositors. For example, Thailand’sBank for Agriculture and Agricultural cooperatives has asavings product called “BAAC’s Save to Increase yourChances,” and Banco Caja Social in Colombia markets a“Grow Every Day” savings account. While special trade-marks make it easier for clients to understand the partic-ular design of each savings product, they also help todistinguish the products from those offered by a com-peting MFI.
Ultimately however, word of mouth is the best formof advertising. To ensure positive word of mouth, theservice provided to depositors must be timely, consider-ate, and honest. Once again, client demand must ulti-mately be met through appropriate savings productdesign. A woman living in a rural area of an easternIndonesian island who was asked what she thoughtabout Bank Rakyat Indonesia opening a bank officethere said, “If [Bank Rakyat Indonesia] opens here andprovides good service, it will be wonderful for us. Weneed a bank.” Then she said, “There is little to do herein the evenings except talk. If the bank does somethinggood here, you can be sure that we will talk about it foryears to come!” “Of course,” she added, “if the bankdoes something bad here, we will talk about that foryears to come” (Robinson 1995, 14).
162 M I C R O F I N A N C E H A N D B O O K
Box 6.6 Using Local Human Resources in CaissesVillageoises d’Epargne et de Crédit Autogérées, MaliONE OF THE STRENGTHS OF MICROFINANCE INSTITUTIONS
that involve local managers chosen by the communitiesthemselves is that these managers know the clients welland are trusted by them. This is the case in the caisses vil-lageoises d’épargne et de crédit autogérées (self-managed vil-lage savings and credit banks) in Pays Dogon, a remoteSahel region of Mali, West Africa. All of the village bankmanagers (tellers and internal controllers) are from the vil-lage itself. Initially they were trained in the course of adonor project (KFW), which was fully staffed with localprofessionals who were all fluent in at least two localdialects, were well respected by the villagers, and had agenuine interest in making the program a success to helpout their own region.
Source: Contributed by Cecile Fruman, Sustainable Banking withthe Poor Project, World Bank, 1998.
Infrastructure
As previously mentioned, introducing voluntary savingsproducts greatly alters the organization and managementof an MFI. Depending on the collection methodemployed, some MFIs may need to develop branchesclose to their clients. However, this may not be neces-sary until the MFI reaches a certain volume of business.Alternatively, MFIs can provide “mobile banking” ser-vices, with the MFI staff traveling to the client to collectsavings rather than having the client visit the branch.Bank Rakyat Indonesia savings officers go weekly toeach village and collect savings and provide withdrawals.Mobile banking works well so long as the MFI is consis-tent in its scheduled visits, so that clients are assured oftheir ability to deposit or withdraw savings on specificdays of the week.
Other MFIs enhance their branch structures to makethem more convenient for their clients and more userfriendly. For example, BancoSol operates primarily inurban areas (including secondary cities) where branchesare relatively accessible to their clients. They modifiedtheir branches to include teller windows and a comfort-able and inviting environment for savers. BancoSol alsohired and trained staff specifically to manage and main-tain deposit accounts.
Furthermore, convenient and flexible hours of opera-tion that meet the needs of clients helps to make savingsservices more attractive.
Security and Internal Controls
As an MFI begins to offer voluntary savings services, itneeds to consider the issue of security. At a minimum theMFI needs to purchase a safe to keep cash available forpotential withdrawals and to minimize the risk of rob-bery. If the MFI collects savings through mobile bank-ing, it should have two officers working together tominimize the risk of both fraud and robbery. BankRakyat Indonesia, which uses this system, has found thatthe community itself ensures that bank officers are notrobbed, knowing that it is their money that is at risk.
MFIs need to develop internal controls to addresssecurity risk when providing voluntary savings products.There is extensive knowledge in the formal financial sec-tor that addresses risk, including such checks and bal-ances as dual custody of cash and combinations,
separation of duties, audit trails, and the use of fireproofvaults and drop boxes (Calvin 1995). Experts from theformal financial sector should be contracted to advise onthese issues.
Management Information Systems
An appropriate and soundly operating managementinformation system is the core of an efficient internalcontrol and monitoring system. The management infor-mation system should be simple, transparent, and objec-tive. An effective management information systembecomes fundamentally important when savings servicesare introduced both for internal management and exter-nal reporting.
When designing management information systems tomanage savings products, it is important to consider accu-racy, reliability, and speed. There are three major goals foran information system (adapted from Calvin 1995):� Transaction processing� Customer service� Management information.
To make strategic decisions about the savings prod-ucts, the MFI needs the following information: numberof accounts, value of accounts, and average balances;number of transactions per account; the distribution ofthe balances of the accounts; and the daily turnover as apercentage of balances (which may vary by season).Over time it is important to maintain a client databasethat allows the institution to analyze the relationshipbetween credit and savings products and other marketdetails.
It is increasingly important for management informa-tion systems to provide the reporting and monitoringrequirements demanded by the supervisory bodyresponsible for regulating the MFI. Systems must bedesigned to ensure that this information is producedregularly and that it also provides information that isbeneficial to the MFI itself. (See chapter 7 for a moredetailed discussion of management informationsystems.)
Risk Management and Treasury
The introduction of deposit-taking greatly complicatesthe management of assets and liabilities. In additionto meeting the reserve requirements stipulated by the
D E S I G N I N G S A V I N G S P R O D U C T S 163
regulatory authorities, it is also important to have theright amount of cash in the right branches at the righttimes. Poor liquidity management can seriously ham-per the operational capacity of each branch. MostMFIs generating numerous small deposits have foundthat very small savings accounts, even those with anunlimited number of withdrawals, generally experi-ence little turnover and therefore represent a stableliquidity cushion. Publicly owned MFIs often rely onlarge savings deposits from state-owned institutions orlegally enforced deposits from commercial banks,which implies heightened liquidity risk if governmentregulations change and they lose their large depositors.
MFIs that create a central funding facility (discussedabove under transfer pricing) may be better able toeffectively manage their liquidity risk. (Delinquency,liquidity, and asset and liability management are dis-cussed in chapter 10.)
Sequencing the Introduction of SavingsServices
MFIs planning to introduce voluntary savings servicesmust consider the order in which to carry out the vari-ous steps. Box 6.7 identifies six steps that an MFI shouldfollow.
Types of Savings Products forMicroentrepreneurs
Deposit instruments must be designed appropriately tomeet local demand. It is crucial for an MFI to conductmarket research prior to introducing savings productsand to offer a good mix of products with various levels ofliquidity that respond to the characteristics and financialneeds of various market segments.
164 M I C R O F I N A N C E H A N D B O O K
1. Enhance the knowledge of the MFI’s board and managersabout the experience of other local and internationalMFIs. By understanding the savings services that existlocally, MFI managers can build on existing systems.
2. Carry out market research and train staff selected for thepilot stage. Examine the regulatory environment and theinstitutional capacity of the MFI.
3. Conduct and evaluate a pilot project. This is a crucial step,because until the extent of demand and the costs of thedifferent products, including labor, are known, only tem-porary interest rates can be set.
4. When necessary, carry out and evaluate a second set ofpilot projects testing products and prices that were revisedas a result of the first pilot. At the same time, hold widerstaff training. During this period pay attention to planningthe logistics and management information systems thatwill be required for the expansion of the program ofdeposit mobilization.
5. When the instruments, pricing, logistics, information sys-tems, and staff training are completed, gradually expandsavings mobilization throughout all branches.
6. When expansion of saving services to all branches isachieved, switch attention from the logistics of expansionto the techniques of market penetration. When well-runMFIs offer appropriate deposit facilities and services, theycan quickly gain the accounts of people living or working
nearby the bank offices; this is known as “the easy money.”Market penetration of the wider service area, however,requires other methods. These include the development ofa systematic approach to identification of potential deposi-tors; the implementation of a staff incentive system basedon the value of deposits collected so that the staff will seekout the potential depositors rather than wait for them tocome to the bank; the development of effective methodsfor intrabank communication; more extensive marketresearch; a major overhaul of public relations; and massivestaff training.The sequencing outlined here may appear lengthy and
cumbersome, but it is necessary for building the long-termviability of the MFI. There are often temptations to go toofast, but instituting voluntary savings mobilization too rapidlyis a prime example of “haste makes waste.” For example, anMFI is asking for trouble if it tries to implement its new sav-ings program before its management information system isready and the staff is well trained in its use. A financial institu-tion that gets its sequencing wrong can lose its clients’ trust,which in turn can lead to the loss of its reputation and eventu-ally of its viability.
Getting the “when” and “how” of introducing voluntarysavings mobilization right enables MFIs to meet local demandfor savings services and provide a larger volume of microcredit,thereby increasing both outreach and profitability.
Box 6.7 The Sequencing of Voluntary Savings Mobilization
Source: Robinson 1995.
When Bank Rakyat Indonesia decided to offer volun-tary savings products, it conducted an extensive study oflocal demand for financial services and systematicallyidentified potential savers. The bank also looked closelyat existing savings services in the informal sector anddesigned its products to overcome limitations and toreplicate the strengths of existing services (box 6.8).
For the most part, individual voluntary savings havebeen found to be more successful than group savings.Most savings products for microclients include the fol-lowing features (GTZ 1997a):� The required minimum opening balances are general-
ly low.� A mix of liquid savings products, semiliquid savings
products, and time deposits with a fixed-term struc-
ture are offered, including at least one liquid savingsproduct with unlimited withdrawals.
� Attractive rates of interest are offered. For privateMFIs this may mean rates of interest that are higherthan market rates as a sort of risk premium to attractdeposits, particularly if they are operating in a com-petitive environment. Public MFIs may be able to paylower rates of interest based on the perceived safety ofpublic institutions.
� Interest rates should increase with the size of the sav-ings account to provide a financial incentive for saversto increase deposits and refrain from withdrawing.
� Conversely, savings account balances below a speci-fied minimum are exempt from interest payments topartially compensate for the relatively higher adminis-trative costs of small accounts.
� Some MFIs may charge fees and commissions todepositors for opening and closing accounts and forspecific services related to account management, suchas issuing a passbook.There are three broad deposit groups based on the
degree of liquidity: highly liquid current accounts, semi-liquid savings accounts, and fixed-term deposits.
Liquid Accounts
Highly liquid deposits provide the greatest flexibility andliquidity and the lowest returns. Current accounts—ordemand deposits—are deposits that allow funds to bedeposited and withdrawn at any time. Frequently no inter-est is paid. Highly liquid accounts are difficult to manage,because they require substantial bookkeeping and are notas stable a source of funding as term deposits. Only a lim-ited portion of demand deposits can be used to provideloans (based on reserve requirements), because the MFImust be able to service withdrawal requests at all times.
Semiliquid Accounts
Semiliquid accounts provide some liquidity and somereturns. Some savings accounts are semiliquid, whichmeans that the borrower can usually withdraw funds alimited number of times per month and deposit funds atany time. Unlike current accounts, savings accounts gen-erally pay a nominal rate of interest, which is sometimesbased on the minimum balance in the account over agiven period (monthly, yearly). They begin to act like
D E S I G N I N G S A V I N G S P R O D U C T S 165
Box 6.8 Bank Rakyat Indonesia Savings InstrumentsAFTER A SERIES OF PILOT PROJECTS THAT BEGAN IN 1984,Bank Rakyat Indonesia introduced four savings instru-ments with different ratios of liquidity and returnsnationwide in 1986. SIMPEDES, a savings instrumentthat permits an unlimited number of withdrawals,became the “flagship” of the new savings program. TheSIMPEDES instrument incorporates lotteries for thedepositors that were modeled loosely on Bank DagangBali’s highly successful depositor lotteries. SIMPEDESwas aimed at households, firms, and organizations thatdemand liquidity in combination with positive realreturns. TABANAS, which provides a higher interest ratethan SIMPEDES, was continued, with the withdrawalrules later liberalized. TABANAS was aimed at depositorswho wanted middle levels of both liquidity and returns.
Deposito Berjangka, a fixed deposit instrument previ-ously available from Bank Rakyat Indonesia only throughits branches, was now offered as well through the bank unitin its local banking system. Deposito Berjangka is used bywealthier villagers and firms hoping to realize higher returnsand also by those saving for long-term goals, such as build-ing construction, land purchase, and children’s education.Many Deposito Berjangka account holders also hold SIM-PEDES accounts. The fourth instrument, Giro, a type ofcurrent account, is primarily for use by institutions thatmust meet special government requirements. With theexception of Giro, these deposit instruments have generallyprovided positive real interest rates.
Source: Robinson 1995.
term deposits if interest is paid only when a minimumbalance is held in the account. This encourages the clientto hold a certain amount of money in the account, whichmakes for easier management by the MFI.
Fixed-Term Deposits
Term deposits are savings accounts that are locked in for aspecified amount of time. They provide the lowest liquid-ity and the highest returns. Term deposits are generally astable source of funding for the MFI and pay a higher rateof return to the saver. Generally, the interest rate is basedon the length of the term of the deposit and the expectedmovement in market rates. Term deposits range from aone-month term to several years; they allow the MFI tofund loans for a period of time just short of the depositterm. This makes liquidity and gap management easierfor the MFI, because the funds are available for a set peri-od of time, which is offset by reduced liquidity andincreased interest-rate risk for the saver. (Gap manage-ment and interest-rate risk are discussed in chapter 10.)
The choice of products to offer must be based on theneeds of the clients in the area served by the MFI. Manyfirst-time savers will choose a highly liquid account. Asthey become more experienced with managing theirsavings, they will likely open more than one depositaccount, using a semiliquid or fixed-term depositaccount for longer-term savings (box 6.9).
Costs of Mobilizing Voluntary Savings
The cost of savings mobilization depends not only oninternal factors such as operational efficiency, but also onexternal factors such as minimum reserve requirements(discussed above), tax rates, and general market condi-tions. Determining both internal and external costs helpsto establish what rate to pay on different savings products(taking into account the market rate for deposits).
Costs include (adapted from Christen 1997):� Setup costs� Direct costs� Indirect costs� Cost of funds (paid to depositors).
Setup costs include research and development, whichmay include hiring outside consultants and savingsexperts; the printing of passbooks and other marketing
material for the initial launch; safes; computer systems,including hardware and software; as well as existing or newstaff costs. These costs must all be estimated and a plandevised prior to developing the savings products.
Direct costs are those costs incurred specifically in theprovision of savings services. Direct costs can be variableor fixed. Variable costs are those that are incurred peraccount or per transaction. They include time and mate-rials used in opening, maintaining, and closing anaccount. These costs can be estimated per account basedon average activity and the time taken to process thetransactions in a given time period, such as a month.
Fixed direct costs are those incurred to deliver savingsproducts that do not vary with the number of accounts(units) opened or maintained. These include salaries andongoing training for savings officers, additional manage-ment, additional accounting personnel, branch infrastruc-ture, and any special promotions for savings products.
Indirect costs are costs that do not relate directly to theprovision of savings services but a portion of whichshould be charged to the savings operation by virtue ofbeing part of the overall services provided by the organi-zation. These include overhead (such as management),
166 M I C R O F I N A N C E H A N D B O O K
Box 6.9 The Choice of Savings Products in Pays Dogon,MaliIN PAYS DOGON, A NETWORK OF 55 SELF-RELIANT AND
self-managed village banks has been established. The ruralcommunities have themselves determined the financialproducts that they wish their banks to offer. Both demandand term deposits are offered. The results are that termdeposits are much more popular (constituting about 85percent of total deposits) due to liquidity management,which dictates that only term deposits are used for lending(out of community solidarity those who are wealthyenough to save prefer to save long-term so that other peo-ple from the village can access loans); interest, which onterm deposits is high (15 to 20 percent annually); and thetradition of Dogon farmers of long-term savings in kind(before the severe draughts hit the Sahel in the 1980s,they were all cattle owners, but with the loss of a majorityof their herds during dry periods, these farmers are nowhappy to have alternative monetary savings products thatoffer much higher security).
Source: Contributed by Cecile Fruman, Sustainable Banking withthe Poor Project, World Bank.
premises, general operating costs, as well as other headoffice and branch costs. Indirect costs are generally pro-rated based on the amount of business activity generatedby savings products as opposed to other business activi-ties (such as loans, investments, training, and so forth).
These costs can often be estimated by examiningexisting costs as well as in reference to other organiza-tions providing savings services. These will vary depend-ing on the delivery method chosen for providing savingsservices.
The cost of funds refers to the interest rate paid todepositors. The rates vary based on the liquidity of theaccount and the amount of time a deposit is held.
All of these cost factors must be considered whenoffering savings products. However, it is difficult to esti-mate accurately the operational costs and demand foreach product and the interest rates necessary both tomake the instrument attractive and the spread profitable.Pilot projects are thus imperative to estimate the costsaccurately, to set appropriate interest rates, to establishsuitable spreads, and to ensure that the product isdesigned to meet client needs. Furthermore, the incen-tive system of MFIs can be designed to increase staff pro-ductivity and in turn reduce administrative costs. (For amore complete treatment of the costs of savingsaccounts, see Christen 1997, 201–11.)
Furthermore, transaction costs incurred by depositcustomers must be considered. Locating branches indensely populated areas or close to business centers wherea significant number of people meet to carry out econom-ic transactions reduces transaction costs for customers.Also, MFIs should minimize the waiting time for clientsto make deposits by ensuring that enough tellers are pro-vided, based on the number of clients and transaction vol-umes. Clients who are only able to visit the MFI branchduring evenings or weekends should be accommodated.While these measures reduce transaction costs for clients,the administrative costs for the MFI increase. A cost-ben-efit analysis should be carried out to determine the bestway to both lower transaction costs for clients and mini-mize the administrative costs for the MFI (box 6.10).
Pricing Savings Products
The interest rate paid on deposits is based on the prevail-ing deposit rates of similar products in similar institu-
tions, the rate of inflation, and market supply anddemand. Risk factors such as liquidity risk and interest-rate risk must also be considered based on the time peri-od of deposits. Finally, the costs of providing voluntarysavings also influences deposit pricing policies.
MFIs incur greater operational costs to administerhighly liquid accounts and thus the interest rates arelower. Fixed-term deposits are priced at a higher rate,because the funds are locked in and are not available tothe depositor. Thus they are of lower risk to the MFI,and as a result term deposits are a more stable source offunding than demand deposits (ignoring for the momentasset-liability management and term matching issues forthe MFI and liquidity risk and interest-rate risk for thedepositor, which are discussed in chapter 10).
Savings products need to be priced so that the MFIearns a spread between its savings and lending servicesthat enables it to become profitable. Labor and othernonfinancial costs must be carefully considered when set-ting deposit rates. However, there are a number ofunknowns at the beginning of savings mobilization. Forexample, a highly liquid savings account that is in highdemand can be quite labor intensive and thus costly,especially if there is a large number of very smallaccounts. Experience to date indicates that most saverswho select a liquid account are not highly sensitive tointerest rates and prefer better service to higher interest.A study conducted by Ostry and Reinhart (1995) findsthat the lower the income group, the less sensitive theyare to interest rates paid on savings:
D E S I G N I N G S A V I N G S P R O D U C T S 167
Box 6.10 Administrative Costs for Banco Caja Social,ColombiaBANCO CAJA SOCIAL RECENTLY BEGAN COST ACCOUNTING
by savings product and found that the administrative costsfor an actively used traditional passbook savings accountbelow US$10 was roughly 18 percent of the balance (with-out considering interest payments during the year).However, it also found that for the average savings accountin 1996, administrative costs were below 1 percent of thebalance. This demonstrates that while the administration ofvery small savings is costly, financial institutions can mini-mize those costs by offering a good mix of savings productsand implementing cost-reducing procedures.
Source: GTZ 1997c.
“A one percentage point rise in the real rate ofinterest should elicit a rise in the saving rate ofonly about two-tenths of one percentage point forthe 10 poorest countries in the sample. For thewealthiest countries, by contrast, the rise in thesaving rate in response to a similar change in thereal interest rate is about two-thirds of a percentagepoint.” (Ostry and Reinhart 1995, 18).
Sources and Further Reading
Calvin, Barbara. 1995. “Operational Implications of IntroducingSavings Services.” Paper delivered at the MicroFinanceNetwork Conference, November 8, Cavite, Philippines.
Christen, Robert Peck. 1997. Banking Services for the Poor:Managing for Financial Success. Washington, D.C.:ACCION International.
CGAP (Consultative Group to Assist the Poorest). 1997.“Introducing Savings in Microcredit Institutions: Whenand How?” Focus Note 8. World Bank, Washington, D.C.
FAO (Food and Agriculture Organization). 1995.“Safeguarding Deposits: Learning from Experience.” FAOAgricultural Services Bulletin 116. Rome.
Fruman, Cecile. 1998. “Pays Dogon, Mali” Case Study for theSustainable Banking with the Poor Project, World Bank,Washington, D.C.
GTZ (Deutsche Gesellschaft für Technische Zusammenarbeit).1997a. “Comparative Analysis of Savings MobilizationStrategies.” CGAP (Consultative Group to Assist thePoorest) Working Group, Washington, D.C.
———. 1997b. “Comparative Analysis of Savings MobilizationStrategies—Case Study for Bank of Agriculture andAgricultural Cooperatives (BAAC), Thailand.” CGAP(Consultative Group to Assist the Poorest) Working Group,Washington, D.C.
———. 1997c. “Comparative Analysis of Savings MobilizationStrategies—Case Study for Banco Caja Social (BCS),
Colombia.” CGAP (Consultative Group to Assist thePoorest) Working Group, Washington, D.C.
———. 1997d. “Comparative Analysis of Savings MobilizationStrategies—Case Study for Bank Rakyat Indonesia (BRI),Indonesia.” CGAP (Consultative Group to Assist thePoorest) Working Group, Washington, D.C.
———. 1997e. “Comparative Analysis of Savings MobilizationStrategies—Case Study for Rural Bank of Panabo (RBP),Philippines.” CGAP (Consultative Group to Assist thePoorest) Working Group, Washington, D.C.
Morris, D.D., A. Power, and D.K. Varma, eds. 1986. 1986Guide to Financial Reporting for Canadian Banks. Toronto,Canada: Touche Ross.
Ostry, Jonathan D., and Carmen M. Reinhart. 1995. “Savingand the Real Interest Rate in Developing Countries.”Finance & Development 32 (December): 16–18.
Patten, H. Richard, and Jay K. Rosengard. 1991. Progress withProfits. The Development of Rural Banking in Indonesia. SanFrancisco: ICS Press.
Robinson, Marguerite. 1994. “Savings Mobilization andMicroenterprise Finance: The Indonesian Experience.” InOtero and Rhyne, eds., New World of MicroenterpriseFinance. West Hartford, Conn.: Kumarian Press.
———. 1995. “Introducing Savings Mobilization inMicrofinance Programs: When and How?” Paper deliveredat the annual meeting of the MicroFinance Network,November 8, Cavite, Philippines.
Rutherford, Stuart. 1996. “Comment on DevFinanceNetwork, September 6, 1996.” Internet discussion net-work, Ohio State University. [email protected]
Shylendra, H.S. 1998. “Comment on DevFinance Network,March 12.” Ohio State University. [email protected]
Wisniwski, Sylvia. 1997. “Savings in the Context ofMicrofinance: Comparative Analysis of Asian Case Studies.”Paper delivered at the Fourth Asia-Pacific Regional Work-shop on Sustainable Banking with the Poor, November3–7, Bangkok.
168 M I C R O F I N A N C E H A N D B O O K

169
ManagementInformation Systems
C H A P T E R S E V E N
The management information system of an insti-tution includes all the systems used for generat-ing the information that guides management in
its decisions and actions.1 The management informa-tion system can be seen as a map of the activities thatare carried out by the MFI. It monitors the operationsof the institution and provides reports that reflect theinformation that management considers the most signif-icant to track. Staff, management, board, funding orga-nizations, regulators, and others rely on reportsproduced by the management information system togive an accurate portrait of what is occurring in theinstitution.
With the current trend in the microfinance commu-nity toward the significant scale-up of activities, man-agers of many MFIs are becoming increasingly aware ofthe acute need to improve their information systems.Methodological issues, staff development, and evenfinancing are frequently not proving to be the criticalconstraints to growth. Rather, an institution’s ability totrack the status of its portfolio in a timely and accuratemanner is often the most pressing need. The reliabilityof the systems tracking this information is in many casesthe difference between success and failure of the lendingand savings operations and, therefore, of the institution.More accurate, timely, and comprehensive informationon operations, especially on the loan portfolio, willstrengthen the management’s capacity to enhance finan-cial performance and expand client outreach.
Setting up good information systems may necessi-tate a significant restructuring of the institution, in-
cluding the reworking of staff responsibilities (some-times even of some staff qualifications), the redesign ofwork processes and information flows, the revision andrationalization of financial policies, and significantinvestment in computer technology. However, thebenefits associated with these costs are substantial.Good information is essential for the MFI to performin an efficient and effective manner. The better theinformation, the better the MFI can manage itsresources.
Good information systems can:� Improve the work of field staff, enabling them to
better monitor their portfolios and provide betterservices to an increasing number of clients
� Enable supervisors to better monitor their areas ofresponsibility, pinpointing priority areas that mostrequire attention
� Help senior management to better orchestrate thework of the entire organization and make well-informed operational and strategic decisions byregularly monitoring the health of the institutionthrough a set of well-chosen reports and indica-tors.This chapter will interest practitioners who are in the
process of setting up, evaluating, or improving theirmanagement information systems. In particular, MFIsthat are transforming their institutional structure oradding new products will find this chapter of interest.Donors may also wish to understand the characteristicsof a good management information system for the MFIsthat they are supporting.
1. This chapter was written by Tony Sheldon. It draws substantially on Waterfield and Ramsing (1998) and Waterfield andSheldon (1997).
170 M I C R O F I N A N C E H A N D B O O K
An Overview of Issues Related to ManagementInformation Systems
At the most fundamental level, it is important to notethe distinction between “data” and “information.”Relevant data is generated by an institution in manyforms: checks made payable to employees, suppliers, andcustomers; client loan repayment records; and bankwithdrawals, deposits, and transfers. It is the task of amanagement information system to transform this “rawdata” (or input) into meaningful information (or output)that can be used by the MFI in its decisionmaking.
Some MFI management information systems are man-ual, particularly those of MFIs just starting out. However,as MFIs expand, many of them develop computer-basedmanagement information systems requiring software pro-grams that are designed to capture and report on the rele-vant information. Many of the problems in developingand implementing computer-based information systemsarise from the complexity of the information to be cap-tured and reported. The most prevalent cause of poorlyperforming management information systems is a lack ofclarity on the part of users and systems designers aboutprecisely what needs to be tracked and reported.
Many MFIs have spent substantial time and moneydeveloping information systems that turn out to be dis-appointing or unsatisfactory due to the following threefactors:� Poor identification of information needs� Poor communication between management and sys-
tems personnel� Unrealistic expectations about information technology.
Frequently, managers, field staff, board members, andinformation systems staff do not have a good sense of thecomplete information needs of their institution. Theymay be aware of many of the required reports (such as anincome statement, balance sheet, or portfolio aging) andseveral key indicators that need to be tracked, but theprecise data inputs and information outputs may beinsufficiently defined. If the specifications for a manage-ment information system are poorly conceived, the sys-tem will never succeed in transforming data inputs intouseful management reports.
The starting point in the development of any man-agement information system is to determine what infor-mation the institution needs to make appropriatedecisions and perform well (box 7.1). The key to defin-
ing information needs is to evaluate the needs of theusers of that information. An integral part of this processis a consideration of how information is to be presentedand what frequency and timeliness are required. In thesystem design stage (discussed more fully below), a focuson the specific needs of each user group, including acareful mapping of the flow of information through theinstitution, is essential to avoid the problem of pooridentification of information needs.
Even when information needs are clearly understoodand defined by users, MFI managers typically do notspeak with the same vocabulary as information systemsdesigners. The language of MFI management (for exam-ple, cost centers, portfolio aging, flat amount or decliningbalance interest rate calculations) is not necessarily under-stood in depth by systems designers. Likewise, the lan-guage of systems designers (databases, operating systems,network platforms) is not readily understood by nontech-nical managers. It is crucial that the various users of themanagement information system not only identify theirinformation needs but also clearly articulate them to thesystems designers. The translation of user needs into thekind of specifications required to develop or maintain amanagement information system is comparable to a rigor-ous and precise translation of a text from one language toanother.
Finally, unrealistic expectations about informationtechnology by potential users also causes frustration anddisappointment. A computerized management informa-tion system can serve many essential functions, but it will
Box 7.1 Determining the Information Needsof an MFIIN ORDER TO DETERMINE THE INFORMATION NEEDS OF AN
MFI, it is necessary to identify the users of the informa-tion and evaluate the needs of each user group.� What key information do the users need?� What key indicators or ratios do the users need to
monitor to perform their job well?� What additional information should the users have to
be knowledgeable about the organization’s perfor-mance and broader goal achievement?
� How might the users’ information needs change in thefuture and how might those changes affect the designof the management information system ?
Source: Author’s compilation.
M A N A G E M E N T I N F O R M A T I O N S Y S T E M S 171
not function any better than the policies and proceduresthat it tracks and reports. Introducing a managementinformation system into an MFI will not solve problemsthat lie in the underlying structure and work flow of theinstitution. As mentioned earlier, good informationcomes at a price; an MFI must be willing to pay thatprice (for ongoing data entry and maintenance as well asup-front development and purchase) if it intends to reapthe benefits of a good management information system.
With good information provided in a useful form andon a timely basis, all the stakeholders in the institution—staff at all levels, clients, board members, donors,investors, regulators—can be provided with the informa-tion they need to participate productively in the activitiesof the MFI.
Three Areas of Management InformationSystems
MFI management information systems generally fall intothree main areas:� An accounting system, with the general ledger at its
core� A credit and savings monitoring system, which cap-
tures information and provides reports about the per-formance of each loan disbursed, often with a savingssystem that monitors all transactions related to clientsavings
� A system designed to gather data on client impact.Not all institutions have a management information
system that covers all of these areas. The first two (generalledger and loan tracking) almost always exist in someform; however, only MFIs that accept deposits need a sys-tem to monitor savings. Client impact data is generallygathered only in an informal manner, and the “informa-tion system” that keeps track of this information is oftensimilarly informal. In this discussion the focus is on thefirst two types of management information systems, par-ticularly loan-tracking software, which is the most prob-lematic component of an MFI’s information systems.
Accounting Systems
Although the standards guiding accounting and auditingprocedures vary greatly from country to country, thereare almost always basic principles that determine the
underlying logic of the accounting side of managementinformation systems. Frequently, these standards aredeveloped by a central authority (such as the FinancialAccounting Standards Board in the United States) andare applied to institutions that fall within a particulararea of the tax code (such as nonprofit or nongovern-mental organizations [NGOs]). General ledger softwareprograms incorporate and reflect these accounting stan-dards and conventions. Therefore, finding an existingaccounting program that performs at least the basicfunctions required of a microfinance institution andprovides the essential accounting reports (income state-ment, balance sheet, and cash flow) is a relatively easytask. Management should clearly define the kinds ofvariations on these basic reports that it will need to over-see operations effectively, such as income statements bybranches or balance sheets by funding organizations.The general ledger can then be designed to capture therelevant data and generate reports at the appropriatelevel of detail.
CHART OF ACCOUNTS. The core of an institution’saccounting system is its general ledger. The skeleton ofthe general ledger is, in turn, the chart of accounts. Thedesign of the chart of accounts reflects a number of fun-damental decisions by the institution. The structure andlevel of detail established will determine the type of infor-mation that management will be able to access and ana-lyze in the future. Management must be clear about itsinformation needs and be able to reach a balance betweentwo contrasting considerations. On the one hand, if thechart of accounts captures information at too general alevel (for example, by not separating interest income fromfees), the system will not provide the kind of detailedinformation that management needs to make informeddecisions. On the other hand, if the chart of accounts isdesigned to capture too great a level of detail, the systemwill track needless amounts of data and generate informa-tion that is so disaggregated that management cannotidentify and interpret trends properly. In addition, thegreater the level of detail, the longer and more costly itwill be to gather the data and process the information.
Nearly all MFIs make use of key financial indicators tomonitor the status of their operations (see chapter 9).These financial indicators are based on information thatis extracted at least in part from the chart of accounts.Therefore, management should determine the indicators
they intend to use and make sure that the chart ofaccounts is structured to support the generation of thoseindicators.
The charts of accounts should be designed to meet theneeds of management, providing the information with adegree of detail that is meaningful for managers at all lev-els. Donor, regulatory, and auditing requirements areusually less detailed and, therefore, can be met if manage-ment needs are met. (There are some cases, however, inwhich regulatory bodies will require the use of a specificchart of accounts for institutions under their jurisdiction,especially for formal financial intermediaries.)
In addition to the general ledger, low-cost software isgenerally available for other accounting operations, suchas accounts payable, accounts receivable, and payroll.Depending on the scale and particular needs of the MFI,those additional functions can be automated in the man-agement information system.
The following features should be sought in generalledger software packages (Women’s World Banking1994):� A system that requires a single input of data to gener-
ate various financial reports (for example, those need-ed by management, auditors, and donors)
� Software that incorporates rigorous accounting stan-dards (for example, does not accept entries that donot balance; supports accrual accounting)
� A flexible chart of accounts structure that allows theorganization to track income and expenses by pro-gram, branch, funding source, and so on
� A flexible report writer that allows the organization togenerate reports by program, branch, funding source,and so on
� The capacity to maintain and report on historical andbudget, as well as current, financial information—a“user-friendly” design that includes clear menu lay-outs, good documentation, and the capacity to sup-port networked operations, if relevant
� Reasonably priced local support, either by phone or inperson (particularly during the transition and trainingperiods)
� Relatively modest hard-disk utilization requirements.
Credit and Savings Monitoring Systems
While well-established accounting practices are reflected ingeneral ledger software, there are currently no standards or
widely accepted guidelines for the loan-tracking side of amanagement information system. (Here, “loan-trackingsoftware” and “portfolio system” are used synonymouslywith “credit and savings monitoring system,” includingthe capacity to track savings-related information.) As aresult, each software program designed for loan trackinghas its own approach to the information that is tracked,the kinds of reports that are generated, and, most impor-tant, the kinds of features that are included. Some of thekey features that vary widely among loan-tracking softwareprograms include the types of lending models supported(such as group, individual, or village banking), the meth-ods of calculating interest and fees, the frequency andcomposition of loan payments, and the format of reports.Each MFI tends to have its own idiosyncratic way of struc-turing its credit operations, and so an MFI’s loan-trackingsoftware attempts to reflect the operational procedures andwork flow of the institution.
Because there are no agreed standards for loan-trackingsystems and the information to be tracked and reported isrelatively complex, institutions face a number of chal-lenges when considering how to improve the loan man-agement component of their management informationsystem. A portfolio system should be designed to workwith all major types of financial products that are current-ly offered (and are likely to be offered in the future). AllMFIs offer loans, which are the most complex product forthe system to track. Some also offer savings accounts, timedeposits, checking accounts, shares, credit cards, insurancepolicies, or other products. The portfolio system will needto accommodate each of these distinct products.
The system should be designed to establish distinctsets of “rules” for the different kinds of products withineach major type of financial product (loans, savings, andso forth). For example, an institution may offer workingcapital loans, fixed asset loans, small business loans, andsolidarity group loans. Each of these types of loans willhave distinctly different characteristics or sets of rules.Interest rates, interest calculation methods, maximumallowable amounts and terms, definition of overdue pay-ments, eligible collateral, and many other factors willvary among the different loan products.
Again, contrasting considerations must be balanced.The more financial products the institution offers, themore complex the portfolio system becomes. The morecomplex the system, the higher the cost of purchasing(or developing) the software, the higher the level of
172 M I C R O F I N A N C E H A N D B O O K
expertise needed to use and support the system, and thehigher the risk of programming and data entry errors. Aloan-tracking system should be full-featured enough tohandle the range of existing and anticipated financialproducts, but not so complex as to become too difficultor expensive to develop, use, or maintain.
ASSESSING LOAN-TRACKING SOFTWARE. There are threealternative approaches to acquiring loan-tracking software:� Purchase an “off-the-shelf” software package from
either a local developer or an international supplier� Modify an existing system, incorporating key features
required for the specific MFI� Develop a fully customized system, designed and pro-
grammed specifically for the institution.A decision on which route to take is based largely on
the scale of operations of the institution. MFIs can becategorized usefully, if simplistically, into three sizes:small, medium, and large.
Small MFIs are those with fewer than 3,000 clientsthat have no plans for significant expansion. These MFIsdo not expect to convert into formal financial institu-tions or to offer a broad range of financial products.Consequently, their management information systemneeds are fairly basic and do not demand a rigorous andversatile portfolio system. These institutions need a rela-tively simple system that monitors and reports on thequality of the portfolio and can generate the informationrequired for key management indicators.
Medium MFIs are institutions that have from 3,000 to20,000 clients, are expanding, and offer an array of creditand savings products. These MFIs require a much morerigorous management information system with solid secu-rity features and a thorough audit trail, that handles a largevolume of transactions, includes the capacity to monitorsavings accounts, and will stand up to the scrutiny ofbanking regulators. These MFIs cannot generally affordthe development of a complete, customized loan-trackingsystem and must, therefore, sacrifice some features andflexibility to make use of an existing package, which maybe modified to meet some specific information needs.
Large MFIs exceed or intend to exceed 20,000 clients.These institutions are large enough generally to justify thesubstantial modification of an existing management infor-mation system—or the development of a new system—tomore specifically meet their information needs. Althoughthe costs of developing such management information
systems can easily exceed US$100,000, the increasedquality of information and management control, as wellas the automation of many key tasks, can lead to signifi-cant efficiencies in operations of this scale, which justifythe high level of investment required.
To decide among the alternatives, the MFI shouldassess whether an existing software package meets amajority of its portfolio management needs. An initialassessment of software programs should include a carefulreview of all documentation available and, ideally, areview of any demonstration or trial versions of the soft-ware. This initial assessment should focus on major issuesof compatibility among the types of financial productssupported, basic interest methods supported, and so on,rather than the more technical details, such as proceduresfor calculating penalties, because these are sometimes dif-ficult to determine from basic documentation. (Appendix1 provides a summary of the most well-known softwarepackages available.)
When areas of incompatibility are identified, theyshould be carefully noted for discussion with the softwarefirm. Often incompatibilities can be addressed throughundocumented features of the software and can be solvedthrough relatively minor alterations. At other timesseemingly minor incompatibilities can completely ruleout the system if the necessary modifications affect itscore and even extensive programming cannot resolve theissue. This level of incompatibility may lead large MFIsto decide to develop a brand new system (box 7.2).
If a particular software package passes an initial assess-ment (or if a decision is made to design a new system),the following framework for loan-tracking software canserve as a guide to a fuller evaluation of a portfolio man-agement system. (Appendix. 2 amplifies this frameworkinto several key considerations for each category.)
There are six aspects of loan-tracking software thatshould be evaluated:� Ease of use� Features� Reports� Security� Software and hardware issues� Technical support.
EASE OF USE. A system’s value is based in part on howeasy it is for staff to use. Several issues should be consid-ered, including the “user-friendliness” of screen design
M A N A G E M E N T I N F O R M A T I O N S Y S T E M S 173
174 M I C R O F I N A N C E H A N D B O O K
and data entry, the quality of program documentationand of any tutorials, the handling of errors, the availabili-ty of help screens, and so forth.
FEATURES. This category includes some of the mostimportant aspects of the software system: user lan-guages, setup options, loan product definitions, lendingmethodology issues, management of branch officeinformation, overall accounting issues, reports, andsecurity issues.
In the development of any software package, supportfor multiple-user languages should be incorporated into
the software design at the beginning. If an otherwiseappealing software package is not available in the lan-guage required, the institution should be sure that thedesign of the software allows for a means of adding morelanguages, rather than necessitating a major revision ofthe program.
A robust system provides setup options, which requirethe user to input parameters that serve as the underlyingstructure for the system, including the widths of variousdata fields, the structure of client and loan account num-bers, and so on. Many of these items, which may appearstraightforward, can have far-ranging implications for
THE ALEXANDRIA BUSINESS ASSOCIATION IN EGYPT PROVIDES
individual loans to microentrepreneurs. In 1997 it had approx-imately 13,000 clients. The association employs the same basicsoftware systems that it used when it started its operationsseven years ago. It uses a modified off-the-shelf accountingpackage and a homemade portfolio system, which are not inte-grated. Each month the data between the two are reconciled.The Alexandria Business Association describes its accountingsystem as partially manual because the organization is requiredby Egyptian law to maintain two accounting books.
The association is in the process of decentralizing its oper-ations. Currently, 3 of its 10 branches are decentralized,which means that there is a management information systememployee in the branch who captures applications andreceipts. For the other seven branches this function is fulfilledat the head office. Information between decentralized branch-es and the head office travels on diskette by courier; however,the Alexandria Business Association is currently acceptingbids to establish a dedicated leased line. Each branch has onecomputer, one printer, and one uninterupted power supply(UPS) backup.
Association de Crédit et d’Epargne pour la Production(ACEP) in Senegal provides both individual and solidaritygroup loans. In 1997 it had about 4,000 clients. It has usedthe same software system since it began operations. For theaccounting, payroll, and fixed assets management system itemploys a modified off-the-shelf accounting software pack-age called SAARI, which is widely used in France and inFrench-speaking countries. For its portfolio-tracking systemthe association employs a modified version of the U.S.DataEase software. The accounting and the loan-trackingsystems are not integrated. For the headquarters, DataEase
has been upgraded into a local area network (LAN) version.The association has purchased a new Windows-based systemto replace the current DOS-based system very soon. Boththe accounting and the loan-tracking systems are manual atthe branch level. However, each of the five regional offices isequipped with a computer that processes accounting andportfolio data. In addition, each regional office has a printerand a backup power source. The information is transferredby diskette to the head office.
PRODEM is a Bolivian NGO that focuses on servingrural microentrepreneurs with financial services. In 1997 ithad 28,000 clients. In 1992 PRODEM established a newdata systems department. A systems manager was hired towork with four other department staff members at thenational office. Together the department staff has developeda system completely in-house.
The system was designed in the environments of DOS6.22 and LAN 3.11. The loan portfolio and accountingmodules are fully integrated at the national level only.Information from these modules is exported into Excel toproduce monthly performance indicators.
Under the current system the information flows betweenthe national office and branches using a variety of systems,depending on the location. The most common method is forthe loan portfolio to be sent weekly by each branch to theregional office. Typically, rural branches do not have accessto management information systems. The information isconsolidated at the regional office with information from allbranches in the region. The regional office sends consolidat-ed information (about loan portfolio, accounting, andadministration) to the head office monthly via either faxmodem or an internet link.
Source: Waterfield 1997.
Box 7.2 Microfinance Institutions with Developed “In-House” Systems
M A N A G E M E N T I N F O R M A T I O N S Y S T E M S 175
the use of the system. For example, changing somethingas seemingly simple as the number of decimal places inthe currency field may mean that every data screen andreport format needs to be redesigned.
As mentioned previously, the method of lending is anarea of extreme importance. There are many differentlending methods in practice, and a management infor-mation system may not appropriately handle theapproach used in a specific MFI. For example, to knowthat a system handles “solidarity group lending” does notmean that it will work for every institution employingsolidarity group lending. In some MFIs each group loanis considered a single loan, whereas in other institutionseach client has an “individual” loan while mutually guar-anteeing the loans of other group members. The chosenmanagement information system must support the lend-ing approaches used by the institution.
Most MFIs define the basic parameters of their loanproduct, which determine interest rate methods, penaltycalculation methods, minimum and maximum allowableloan sizes, and so on. The more parameters available, themore flexible the program will be in terms of supportingmultiple lending and savings products. However, thegreater complexity may imply a need for more advancedsystems maintenance.
If an MFI has branch offices, each will need its ownmanagement information system database. The head officethen needs a means by which to consolidate that data togenerate reports for the institution as a whole. The man-agement information system needs to be designed withthese decentralization and consolidation requirements inmind.
A good loan portfolio package will allow for easytransfer and reconciliation of relevant data to theaccounting system, including summary information ondisbursements, repayments, interest and fee income, sav-ings transactions, and so forth. The data for these trans-actions on the loan-tracking side of the managementinformation system must tally with the comparable dataon its accounting side. Some software packages featurefully integrated loan-tracking and accounting capabili-ties that transfer relevant data automatically; however,such systems are expensive and unnecessary for mostMFIs. Most institutions need a loan-tracking systemthat produces a transaction report that summarizes therelevant information. This information is then recon-ciled with the accounting transactions on a timely basis.
REPORTS. When selecting a portfolio system, it is crucial toreview the precise definitions of how information is pre-sented to determine if the system is suitable for the institu-tion’s needs. For example, it is not sufficient to know thatthe system produces an “aging report” without knowingthe specifics of how the aging report is structured.
The type of reports the MFI requires, as well as theformat and content of those reports, depends on severalfactors, including the lending methodologies used, theservices offered, the staffing structure, and the key indica-tors chosen by management. Users of reports within theMFI can be grouped into three broad categories: fieldstaff needing day-to-day, detailed operational informa-tion; supervisors needing reports that facilitate oversightof field staff; and senior management and board mem-bers looking for more strategic information. There arealso external users of reports, including auditors, regula-tors, donors, investors, and clients (box 7.3).
Key issues in report design include:� Categorization and level of detail. Similar information
may need to be presented at varying levels of aggre-gation (for example, portfolio quality by individualloan officer, by branch office, by region, by overallinstitution).
� Frequency and timeliness. Because the purpose of provid-ing information is to enable staff to take constructiveactions, appropriate frequency and timeliness is critical.
� Performance indicators. Key performance indicatorsthat management monitors need to be generated,preferably including trend information.
SECURITY. Security features protect data, restrict useraccess, and limit possible fraud. Security features cannotguarantee that fraud or data loss will not occur, but theycan minimize the likelihood and negative effects of suchoccurrences.
In general, information on computer systems shouldbe protected against two threats:� Purposeful attempts to gain unauthorized access to
data or to certain user functions� Data corruption from hardware, software, or power
failures.These threats imply two different types of security.
The first requires securing data and user routines fromunauthorized use. For example, user routines such asloan disbursement and loan repayment should not beaccessible by all staff. This type of security is referred to
as “system security” and includes such features as userpasswords. The second type of threat requires frequentbackup of data and a method to re-index lost or corrupt-ed data. This type of security is called “data security.”
An MFI should have as many strong security fea-tures as possible in the software. These features shouldextend beyond basic passwords entered by staff, whichgrant them access to different levels of activity, to thor-ough audit trails that determine who can input andchange specific information in the database. In addi-tion, a secure system should have means to prohibittampering with the databases from outside the system.
SOFTWARE AND HARDWARE ISSUES. In evaluating loan-tracking software, a number of key technical issues mustbe explored. (For a more complete treatment of these soft-ware and hardware issues, see Waterfield and Ramsing1997.) These include should the MFI run its system on anetwork, and if so, what kind of network is most appropri-ate, and which operating system should the software runon (DOS, Windows, Windows 98, or Windows NT).
There are essentially four applications of personalcomputer architecture for MFIs:� Stand-alone computers� Multiple computers in a peer-to-peer network
� Multiple computers in a server-based local area net-work (LAN)
� Wide-area networks that connect computers in dis-tant locations (WAN).Networks offer many advantages but they also add
additional complexity. Many MFIs might be concernedabout installing a network, considering them to be bothexpensive and heavily dependent on technical support.However, computer networking technology now sup-ports simple networks requiring fairly minimal technicalsupport.
Benefits gained from a simple peer-to-peer network areassociated with information efficiency. In general, manypeople need access to information at the same time. In anetworked system, critical information is stored on oneuser’s computer but is available to all staff who needaccess to it. Networking requires more sophisticated pro-gramming techniques to ensure data integrity, so thatwhen more than one person is accessing the same data,only one is able to modify the data at a time. While apeer-to-peer approach is not recommended for a growth-oriented MFI, it could be implemented in smaller MFIsthat want the benefits of networking at minimal cost.
Growth-oriented and larger MFIs could make effi-ciency gains by employing a “server-based” local area
176 M I C R O F I N A N C E H A N D B O O K
THE WORKERS BANK OF JAMAICA GREW OUT OF THE
Government Savings Bank, established in 1870. TheWorkers Bank inherited the Post Office Banking Network,with almost 250 post office banking windows where smallsavers maintained accounts. By 1995 the Post OfficeDivision had more than 95,000 small savers with more thanUS$10 million in deposits. That same year the bank decidedto set up a microbanking unit to expand microfinance ser-vices by offering microloans through the Post OfficeDivision.
At that time the bank was in the early stages of develop-ing a comprehensive management information system. Itdetermined that it needed to purchase a system that wouldmanage its small loans and the small savings accounts in thePost Office Division until the larger management informa-tion system was fully operational. After analyzing several sys-tems, the bank chose an internationally available system tomanage its postal banking operation.
Although the system provided adequate capabilities forinputting information and making financial calculations, thebank found its standardized reports insufficient. Managementwas not receiving the accurate and timely information itneeded about portfolio activity by loan officer, post office,and region. And neither loan officers nor managers were get-ting reports that would enable them to properly manage amicroloan portfolio with weekly payment cycles. To helpdevelop report formats that would better meet the bank’sneeds in managing its new microloan portfolio, the bankhired an independent consultant with many years of experi-ence in computer programming and managing MFIs toadvise on design.
The new reporting formats meet the needs of loan offi-cers and managers for controlling delinquency and managinga growing microloan portfolio. They provide timely andaccurate information, are easy to use, and customize infor-mation to fit the needs of users.
Box 7.3 Improving Reporting Formats: Experience of the Workers Bank of Jamaica
Source: Waterfield and Ramsing 1998.
network (LAN). A server is a personal computer with afaster processor, more memory, and more hard diskspace than a typical stand-alone computer. The data tobe broadly accessible is stored on the network. Networkcards and cables connect the server to individual com-puters, enabling each user to access the informationstored on the server. Security and data integrity issuesare handled by the network software and by the data-base system.
LANs consist of computers in the same building con-nected by cables. Wide area networks (WANs) are com-puters that are connected via phone lines, so that remoteoffices can access and transfer data as if they were in thesame place. However, WANs are beyond the technicaland cost capabilities of most MFIs. For MFIs withremote branch offices, the best alternative for transfer-ring data is by modem at the end of the day or bydiskette on a weekly or monthly basis.
Most loan-tracking systems operate in DOS, whichhas been adequate for MFIs of all scales. There is no realrestriction on the number of clients or transactions thata DOS-based system can process. Practically speaking,however, systems designed for use a few years from nowwill need to be redesigned to work under one of theWindows operating systems. Making a substantialinvestment in a DOS-based system should be done onlyafter careful thought.
Because DOS was developed before the memorycapacity of personal computers was as large as it is now,
DOS-based systems often have a problem accessing suf-ficient memory to run efficiently. Also, the operatingspeed of systems depends heavily on the programminglanguage used, the level of hardware, the amount ofmemory, and, even more important, the skill level ofthe programmer. A system may appear to operate wellinitially, but after reaching a certain number of clientsor accumulating a year’s worth of information it mayslow down unacceptably. In selecting a system, it is crit-ical to carefully assess the future scale of activity and thecapacity of each system under consideration.
SUPPORT. The role of the software provider does not endwhen the system is installed. There is always a need forcontinuing support to fix bugs, train staff, and modify theprogram. This need for ongoing support is the primaryreason that many MFIs develop their own customized sys-tems. They then have the in-house capacity to providethese support services, albeit at substantial cost. However,many MFIs cannot afford to have a systems designer onstaff and must depend on outside support. If it is availablelocally, there is a good chance that the support will be reli-able. However, many systems currently provide remotesupport, which is quite risky as well as potentially expen-sive. Many problems cannot be communicated andresolved quickly by e-mail, phone, or courier. Because anMFI cannot afford to have its management informationsystem not functioning for an extended period of time, theviability of remote support should be explored carefully.
M A N A G E M E N T I N F O R M A T I O N S Y S T E M S 177
THE ASSOCIATION FOR THE DEVELOPMENT OF
Microenterprises (ADEMI), one of the early prominentmicrocredit programs in Latin America, was also one of thefirst to automate its information systems. In 1984 it devel-oped a database system that was advanced enough even toautomate the printing of loan contracts and client re-payment vouchers and let senior managers monitor the bal-ance of their bank accounts directly from their desktopcomputers.
With technological changes and growth to more than18,000 loans, ADEMI revamped its management informa-tion system in 1994. Nearly all the work was done in-houseby an experienced management information system depart-ment. As with the earlier system, ADEMI chose to use the
more advanced UNIX operating system instead of the morecommon PC-based systems. The system consists of fullyintegrated modules for loan portfolio, savings data (only 170time deposits), accounting, client data, payroll, and fixedassets.
The system allows all the Santo Domingo offices and theregional offices to be connected on line. Other branchoffices, however, are not connected into the managementinformation system. They send in transaction receipts everyfew days to the regional office, where information is inputand reports are generated. These reports are then sent to thebranch offices, where they are compared with independentsystems used by the branches to verify the accuracy and com-pleteness of data entry.
Box 7.4 Management Information Systems at the Association for the Development of Microenterprises, Dominican Republic
Source: Waterfield 1997.
Other considerations to make in choosing loan-tracking systems include:� Whether the system has been used internationally� Whether the system has been in use for a sufficient
amount of time to be well tested and to have reacheda high level of reliability
� Whether the company supporting the system can makea strong case that it is able to support the MFI’s opera-tions (that is, provide training and technical assistance)
� Whether the system has already been used formicrofinance (as opposed to commercial banking).
Client Impact Tracking Systems
Most MFIs want to track socioeconomic and impactdata (that is, the number of jobs created, the number ofclients moving out of poverty). However, client impacttracking is even less standardized than portfolio manage-ment and presents major challenges to MFIs looking forappropriate software packages. Virtually no off-the-shelfsystem for monitoring impact is currently available.Institutions that choose to monitor impact have normal-ly selected information-gathering approaches that com-plement their other information collection processes.For example, they may use data already gathered in theloan application process and then keep track of thisinformation on a spreadsheet.
One approach that is often used to track impact-relatedinformation is to incorporate the relevant data into theloan-tracking system. Special screens and reports can bedesigned in a customized system. However, existing soft-ware packages frequently include several “user-defined”fields in client and loan records. These can be set up totrack and report on significant impact-related data.
Installing a Management Information System
Many managers do not fully comprehend the substantialprocess that needs to be followed when selecting andinstalling a management information system. The task isoften much greater than typically envisioned. The inter-relationship between the management information sys-tem and the entire structure and operating procedures ofthe institution means that in some cases the installationof a system must be done concurrently with the restruc-turing of the entire organization.
The following framework presents a series of over-lapping steps involved in implementing a managementinformation system.
Institutional Assessment
Before deciding on a management information system theMFI must assess the “fit” between the MFI’s practices—both present and future—and the software’s capabilities.As stated previously, management information systemsdiffer not only in philosophy and approach but also infeatures and capabilities. Any selection process needs tobegin with absolute clarity about the expected functionali-ty of the system.
Configuration
This stage follows closely on the work done in the insti-tutional assessment. Configuration consists primarily of:� The general ledger, the basis of which is the chart of
accounts. Sometimes modification of the existingchart of accounts is required to meet the redefined
178 M I C R O F I N A N C E H A N D B O O K
Box 7.5 Framework for a Management InformationSystem at Freedom From HungerFREEDOM FROM HUNGER, A SUCCESSFUL INTERNATIONAL
NGO operating out of Davis, California, has developed a“Framework for Designing a Management InformationSystem.” The framework consists of 17 steps for designingand implementing an accounting and management infor-mation system for MFIs. Each step includes a specific listof questions and issues pertaining to each step.
The framework was developed to strengthen andstreamline the accounting system of the Reseau desCaisses Populaires, Freedom From Hunger’s partner inBurkina Faso. The framework may be used as an imple-mentation or management tool to guide the user throughkey issues in assessing the MFI’s information needs, thesystem alternatives available, and system implementation.The tool provides the user with a logical structure toexamine the management information system needs bothin the field and at headquarters. (For detailed informa-tion on the assessment framework see SEEP Network1996.)
Source: SEEP Network 1996.
needs of the institution as well as any requirementsor limitations of the software package.
� Loan-tracking systems, which define the various finan-cial products, each with its own specific characteris-tics, such as minimum and maximum amounts,interest rate methods, the various “linkages” that theMFI uses between different accounts (such as block-ing savings when a client has a loan), and treatment ofdelinquency.
� The structure of branch relationships, which determineshow information will be shared and consolidatedamong branches.If the initial assessment has been doing well, the con-
figuration of the system can be handled fairly straight-forwardly, provided the MFI’s needs are fullycompatible with the software’s capabilities. If changes tothe software are needed to accommodate the require-ments of the MFI, then the process of software modifi-cation begins.
Software Modifications
This is potentially the most costly and time-consumingcomponent of installing a management informationsystem. If the software package has not been used byother MFIs or similar operating environments (such asdifferent types of MFIs in different countries) or if thesoftware has not previously been adapted to a widevariety of operating methodologies (for example, indi-vidual lending or group lending), there may be a needfor major modifications. Extensive programming maystill be required if the MFI is unwilling to compromiseon its operating methods and accounting conventions,even if the software package is nearly exhaustive infunctionality.
The modification process is costly and time-consum-ing for several reasons. The source code (or underlyinglogic and commands of the software) for a complex sys-tem can only be modified by a handful of people—ide-ally, the original programmers. Any change, no matterhow minor, needs to be carefully tested and debugged,because a change in one area of the program can affectwhat seem to be wholly unrelated areas of the program.Program modification should only be undertaken byhighly qualified programmers and only if the MFI can-not perform its essential work by using a packaged loantracking system.
Testing
Once the software design is finalized, it is essential to runa rigorous test of the system with actual data. This testingphase serves two purposes: it allows the behavior of thesystem to be carefully studied, identifying any bugs orproblem areas needing changes; and it allows the devel-opment of a strategy for data conversion or input of theinitial data to the system.
For the general ledger, testing consists of processingsample transactions, including receipts of income, pay-ment of checks, and journal entries. Trial balance andfinancial statements should be generated, with the resultsconfirmed and presented in the formats desired by theinstitution.
For loan tracking, the testing phase is more complexand includes verifying that crucial procedures are han-dled correctly. Key questions include:� Are repayment schedules, interest charges, penalties,
and delinquencies being properly calculated?� Does the system crash inexplicably?� Does the network function adequately?� Does the system allow for corrections of data entered
in error?� Are there user-friendliness issues that need to be
addressed?
Data Transfer
This is another time-consuming and costly process. Thevolume of start-up information that must be entered canbe substantial. For the portfolio system, inputting namesand other data on clients as well as all outstanding balancesfor loans and savings accounts is extremely time consum-ing. At a minimum for the general ledger, openingamounts for all balance sheet accounts must be entered.
A frequently encountered problem is incompatibilitybetween the way the previous system handled transactionsand the way the new management information systemtreats the same transactions. For example, if delinquencyis calculated even slightly differently by the two systems,the new system may calculate penalties on outstandingloans in a way not agreed to with the client.
It is often difficult to predict precisely how long ordifficult this data transfer process will be, even if therehas been a careful initial assessment. One way to avoidthese problems is to continue to use the existing portfolio
M A N A G E M E N T I N F O R M A T I O N S Y S T E M S 179
system until all outstanding loans are repaid, enteringonly new loans into the new system.
Training
Because a full-featured management information systemis complex, implementation may require major shifts inthe operational procedures of an institution, requiringextensive training at all levels of staff.
Parallel Operations
After data transfer and staff training, the new manage-ment information system is ready to be used. However, itis important to run the new system in parallel with theold system. This is essential to ensure that the new systemruns reliably and generates reports that can be trusted.
During the period of parallel operation, data shouldbe entered into both systems and the outputs carefullycompared. Any discrepancies should be evaluated andaccounted for. Any errors or bugs in the new systemshould be carefully documented and corrected.
The duration of parallel operations can vary, but itshould generally last at least two months to ensure thatnearly every client has come to make at least one pay-ment and that the system has gone through twomonth-end closing processes. Once management is sat-isfied that the new system is performing well, the oldsystem can be discontinued, but all printouts and datafiles should be carefully stored for future reference (box7.6).
Ongoing Support and Maintenance
As discussed previously, the institution’s need for man-agement information system support continues once thesystem is installed. The cost of support will depend onhow stable and reliable the system is and will normallydecline as the MFI grows more experienced with it andthus more capable of resolving problems.
There are two important lessons that can be gleanedfrom the experience of MFIs in installing managementinformation systems:� An institution should be content with the essentials.
An MFI should not seek a management information
system that offers every ideal feature. The more thatis demanded of a system , the more complex that sys-tem becomes and the less likely it is to work correctlyand trouble free.
� An MFI should consider adapting some of its proce-dures to the standards of the loan-tracking system. Ofcourse, this would ideally function the other wayaround: a management information system would becapable of implementing every aspect of an institu-tion’s policies and procedures. However, acceptanceof existing features that do not fundamentally alterthe institution’s goals and objectives may save thou-sands of dollars and months of customizing time.
Appendix 1. Overview of CommercialManagement Information System SoftwarePackages
There are no set prices for commercial managementinformation software packages.1 Pricing depends onspecific conditions in each installation, such as thescale of the MFI, the extent of customization, and theavailability of local technicians who the software firmcan call on. None of the commercial firms referenced
180 M I C R O F I N A N C E H A N D B O O K
Box 7.6 Running Parallel Operations in the Fédérationdes Caisses d’Epargne et de Crédit Agricole Mutuel,BeninIN THE LOCAL CREDIT UNIONS OF THE FÉDÉRATION DES
Caisses d’Epargne et de Crédit Agricole Mutuel, account-ing was done manually until computers started slowly tobe introduced and tested in 1993. For the first creditunions to be computerized, it was required that account-ing be recorded both manually and by computer for onefull year, so that the staff could become fully acquaintedwith the new software and procedures and so that theinformation systems technicians could make necessaryadjustments to the software. As experience is gained byboth parties, managers of the federation believe therequired period for running accounting in parallel couldbe brought down to two months.
Source: Contributed by Cecile Fruman, Sustainable Banking withthe Poor Project, World Bank.
1. This appendix is excerpted from Waterfield (1997).
in this overview provided a set price; however, priceranges and typical contract prices have been includedwhere possible.
IPC Banking System
The IPC banking system was developed over seven yearsby IPC Consulting for use in MFIs participating in long-term technical assistance contracts and has never beeninstalled independent of a technical assistance contract.The system is currently used in Albania, Bolivia, Brazil,Colombia, Costa Rica, El Salvador, Paraguay, Russia,Uganda, and Ukraine.
The system runs in DOS on stand-alone PCs andNovell or Windows networks. It contains modules forloan monitoring, savings, fixed deposit, and accounting. Itprovides extensive support of the entire lending process,starting with registration of application, support for loanapplication analysis, integrated generation of loan agree-ment and payment plan, wide range of possible paymentplans, and various interest rate calculation procedures. Thesystem supports a full range of teller-based operations,including monitoring cash and check payments, monitor-ing various cashiers, and a money-changing function.
IPC personnel visit on site for installation, configura-tion, and training. Maintenance contracts are available,which provide for software modifications and updates.The system price depends on the type of contract, theextent of modifications required, and the number ofinstallations involved, but the minimum contractamount considered is US$50,000.
The FAO Microbanking System
FAO’s Microbanker was developed over the past 10 yearsand is currently running in 900 installations in morethan 20 countries in Asia, Africa, Latin America and theCaribbean, Eastern Europe, and some former SovietUnion republics.
The system was developed as a low-cost computersoftware alternative for the automation of banking opera-tions for small and medium-size financial intermediaries.It runs on basic PC equipment and is flexible enough towork as a single teller, a stand-alone installation, or as amultiteller installation.
The SRTE 2.0 version of the system covers loans, sav-ings accounts, time deposits, current accounts, customerinformation, and general ledger in one integrated pack-age. EXTE, the extended version of the system, allowsthe introduction of substantial modifications and cus-tomization through access to parts of the source code.Institutions with procedures that differ substantially fromstandard systems may need to acquire this version of thesoftware.
The purchase of the software includes a warrantysupport from an authorized support provider by phone,fax, or email for three months. FAO recommends thatan authorized support provider also be contracted tohelp with installation and customization and that a con-tract for longer-term assistance be established with oneof the support providers when the warranty period hasexpired.
The current price (1997) of the SRTE 2.0 is US$800for each installation. This includes an unlimited numberof users per installation, but no customization can bemade, nor is any installation support available for thisprice. The access fee of the customizable EXTE version isUS$8,000. Customization can only be done for addi-tional fees by an authorized support provider. The cost ofa contract for assistance with minor customization andconfiguration assistance, installation, and basic training,typically runs between US$40,000 and US$70,000,depending on the size of the MFI and the extent of themodifications.
The Reliance Credit Union ManagementSystem
This system is owned by CUSA Technologies, Inc.(CTI), and has been marketed primarily to credit unionsin the United States, although the company is also work-ing at developing an international market.
It is currently installed in over 100 locations in theUnited States, and installation procedures are currentlyunder way in Puerto Rico, Central America, and Australia(26 credit unions with more than 150 branches). Thesystem is currently available in English and Spanish. AFrench version is in development.
The Reliance software incorporates modules for on-line teller transactions, loan processing, mortgagelending, integrated general ledger, ATM transaction pro-
M A N A G E M E N T I N F O R M A T I O N S Y S T E M S 181
cessing, credit card processing, electronic payroll process-ing, share draft processing, and signature and picture ver-ification.
Technical assistance is available 12 hours per day,Monday to Saturday, by phone and Internet. CTI is cur-rently establishing a Spanish support center (a distribu-tor) in Puerto Rico.
System pricing is by module, by asset size, and by thenumber of system users. CTI was reluctant to provideany price estimates, but indicated that the system is gen-erally priced for larger institutions.
The SiBanque System
The SiBanque system is supported by Centre Internationalde Credit Mutuel (CICM) in France. The system is cur-rently available in French and English, but may be trans-lated to other languages. SiBanque is currently installed inapproximately 100 offices in 8 institutions in Burundi,Cameroon, Congo, Guinea, Mali, and Senegal.
The system is set up for “front office” and “backoffice” transactions, is oriented toward credit unionstructures, and provides some configuration through theuse of parameters. It is a dBase-compatible system thatoperates on DOS.
Since the software is not supported by a commercialsoftware firm, the pricing situation is nonstandard.The software itself does not have a cost, but CICMrequires MFI staff to be trained as a requirement priorto installation. The cost of this training is billed to the
client. Maintenance is contracted for a fee negotiatedwith the client.
Solace for Workgroups
This system is owned by Solace, an Australian softwarefirm, but its distribution has been licensed to De-centralized Banking Solutions (DBS), a South Africanfirm actively marketing the software to the microfinancecommunity. The system is currently available in Englishand is installed in 13 institutions in Australia, NewZealand, South Africa, and Zimbabwe.
The system runs on Windows 95, Windows NT,UNIX, and AS400 operating systems. The teller-based sys-tem supports savings, loan, checking, and equity accounts.It provides for printing of passbooks and receipts and sup-ports audit inquiries. It can be used in a wide range ofinstitutional settings, including networks of more than200 users. Technical support is provided via the Internet,with potential local support through a joint venture with alocal partner when business volume warrants.
Price is based on a nominal solace software purchasefee of US$3,000 per user terminal (for example, an instal-lation requiring access to 20 computers would costUS$60,000) plus run-time costs and an annual supportfee dependent upon local requirements and conditions.Annual support is often based on the number of terminalsas well. A typical installation, therefore, can cost in excessof US$100,000, and at least one installation costsUS$370,000, all expenses included.
182 M I C R O F I N A N C E H A N D B O O K
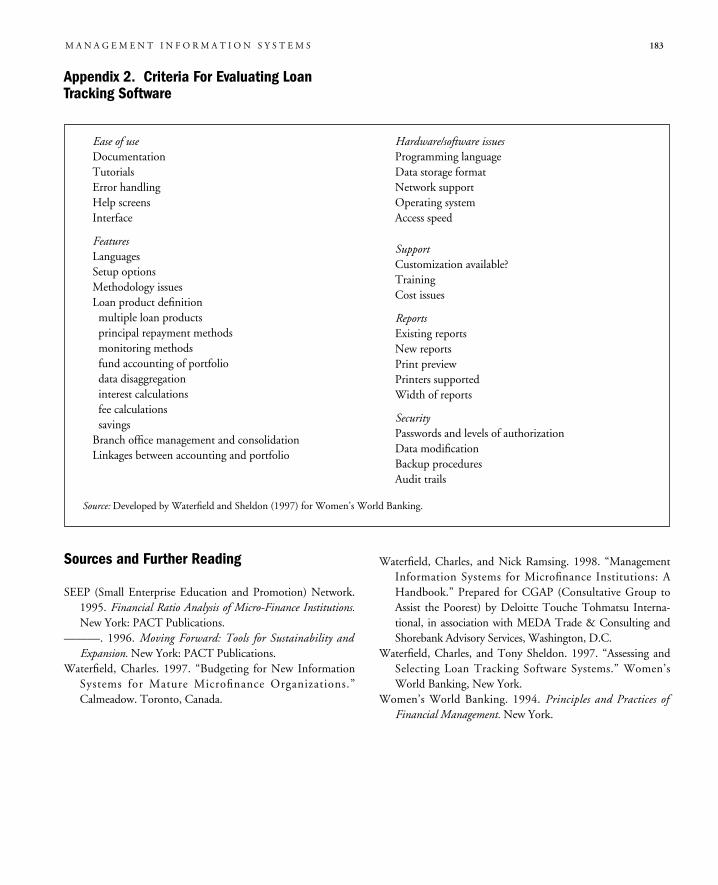
Appendix 2. Criteria For Evaluating LoanTracking Software
Sources and Further Reading
SEEP (Small Enterprise Education and Promotion) Network.1995. Financial Ratio Analysis of Micro-Finance Institutions.New York: PACT Publications.
———. 1996. Moving Forward: Tools for Sustainability andExpansion. New York: PACT Publications.
Waterfield, Charles. 1997. “Budgeting for New InformationSystems for Mature Microfinance Organizations.”Calmeadow. Toronto, Canada.
Waterfield, Charles, and Nick Ramsing. 1998. “ManagementInformation Systems for Microfinance Institutions: AHandbook.” Prepared for CGAP (Consultative Group toAssist the Poorest) by Deloitte Touche Tohmatsu Interna-tional, in association with MEDA Trade & Consulting andShorebank Advisory Services, Washington, D.C.
Waterfield, Charles, and Tony Sheldon. 1997. “Assessing andSelecting Loan Tracking Software Systems.” Women’sWorld Banking, New York.
Women’s World Banking. 1994. Principles and Practices ofFinancial Management. New York.
M A N A G E M E N T I N F O R M A T I O N S Y S T E M S 183
Ease of useDocumentationTutorialsError handlingHelp screensInterface
FeaturesLanguagesSetup optionsMethodology issuesLoan product definitionmultiple loan productsprincipal repayment methodsmonitoring methodsfund accounting of portfoliodata disaggregationinterest calculationsfee calculationssavings
Branch office management and consolidationLinkages between accounting and portfolio
Hardware/software issuesProgramming languageData storage formatNetwork supportOperating systemAccess speed
SupportCustomization available?TrainingCost issues
ReportsExisting reportsNew reportsPrint previewPrinters supportedWidth of reports
SecurityPasswords and levels of authorizationData modificationBackup proceduresAudit trails
Source: Developed by Waterfield and Sheldon (1997) for Women’s World Banking.

Part III–MeasuringPerformance andManaging Viability

187
Adjusting FinancialStatements
C H A P T E R E I G H T
To analyze the financial performance of MFIs prop-erly, it is necessary to ensure that their financialstatements are consistent with generally accepted
accounting principles. Due to the structure of many micro-finance institutions and their initial reliance on donor fund-ing, adjustments to balance sheets and income statementsare often needed before the financial performance can beanalyzed (see chapter 9). There are generally two types ofadjustments required: those that are necessary to adhere toproper accounting standards, which are often neglected inMFIs, and those that restate financial results to reflect moreaccurately the full financial position of the MFI.
The first type requires accounting entries that adjustan MFI’s financial statements. The amount and type ofadjustment required will vary with each MFI, dependingon its adherence to standard accounting principles.1
These adjustments include:� Accounting for loan losses and loan loss provisions. MFIs
that fail to properly consider potential or existing loanlosses, understate total expenses, and overstate thevalue of the loan portfolio.
� Accounting for depreciation of fixed assets. Failing todepreciate or inaccurately depreciating fixed assetsunderstates the true expense of operations.
� Accounting for accrued interest and accrued interestexpense. Accruing interest revenue on delinquentloans results in higher stated revenue than actuallyreceived, thereby overstating profits, and failure toaccrue interest expense on liabilities understatesexpenses.The second type of adjustments do not necessarily
have to be formally recorded in the MFI’s financial state-
ments. This decision would be made by each MFI orreader individually. However, the following adjustmentsshould be made (either on the financial statements or inan external spreadsheet) to reflect the unique nature ofMFIs and to account for the benefit of donor financing:� Accounting for subsidies. Donor funding either for
loan capital to on-lend or to cover operating expensesis generally provided as either grants or concessionalloans (loans with lower than market rates of interest)and therefore contains a subsidy to the MFI.
� Accounting for inflation. The cost of inflation resultsin a loss in the real value of equity and other balancesheet accounts.These adjustments are needed to assess the MFI in an
accurate and meaningful manner and to allow for com-parisons among institutions to some extent.
Finally, MFIs may wish to restate their financial state-ments in “constant currency terms,” particularly if theyare operating in a highly inflationary environment. Thismeans expressing the financial results in real rather thannominal terms by converting financial data from previ-ous year nominal values (in local currency) to constant,present-year values. This permits year-over-year compar-isons and performance trend analysis.
This chapter presents the reasons that adjustmentsshould be made, ways to determine the appropriateamount of adjustments, and ways to make them.Examples of adjusted financial statements for subsidiesand inflation are provided in the appendixes. This chap-ter will be of interest primarily to practitioners or consul-tants evaluating MFIs. To make the most use of thischapter, it is necessary to have some understanding of
1. Portions of this chapter are based on material originally published in Ledgerwood 1996.
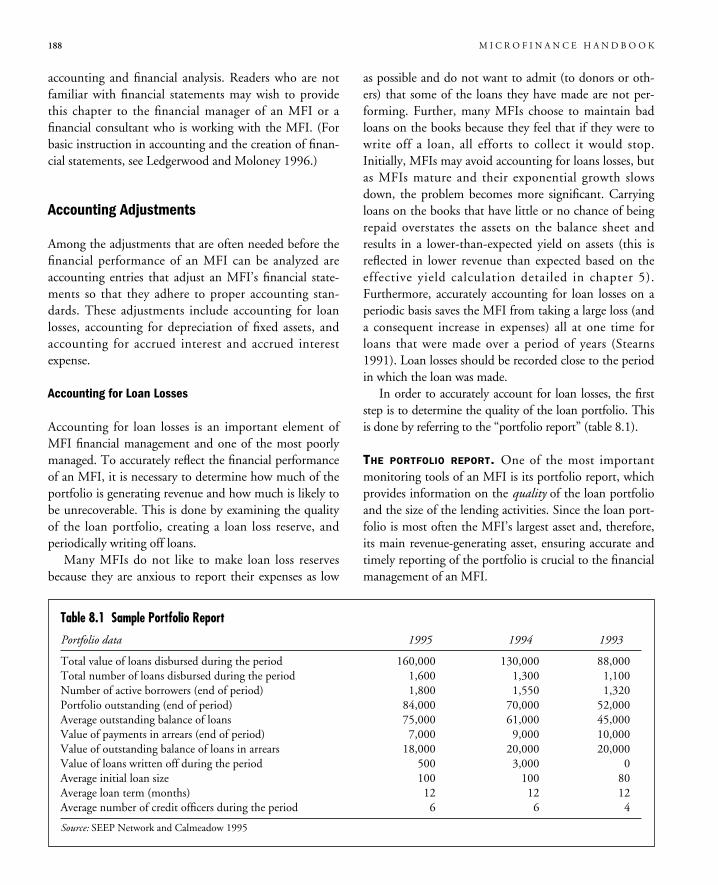
188 M I C R O F I N A N C E H A N D B O O K
accounting and financial analysis. Readers who are notfamiliar with financial statements may wish to providethis chapter to the financial manager of an MFI or afinancial consultant who is working with the MFI. (Forbasic instruction in accounting and the creation of finan-cial statements, see Ledgerwood and Moloney 1996.)
Accounting Adjustments
Among the adjustments that are often needed before thefinancial performance of an MFI can be analyzed areaccounting entries that adjust an MFI’s financial state-ments so that they adhere to proper accounting stan-dards. These adjustments include accounting for loanlosses, accounting for depreciation of fixed assets, andaccounting for accrued interest and accrued interestexpense.
Accounting for Loan Losses
Accounting for loan losses is an important element ofMFI financial management and one of the most poorlymanaged. To accurately reflect the financial performanceof an MFI, it is necessary to determine how much of theportfolio is generating revenue and how much is likely tobe unrecoverable. This is done by examining the qualityof the loan portfolio, creating a loan loss reserve, andperiodically writing off loans.
Many MFIs do not like to make loan loss reservesbecause they are anxious to report their expenses as low
as possible and do not want to admit (to donors or oth-ers) that some of the loans they have made are not per-forming. Further, many MFIs choose to maintain badloans on the books because they feel that if they were towrite off a loan, all efforts to collect it would stop.Initially, MFIs may avoid accounting for loans losses, butas MFIs mature and their exponential growth slowsdown, the problem becomes more significant. Carryingloans on the books that have little or no chance of beingrepaid overstates the assets on the balance sheet andresults in a lower-than-expected yield on assets (this isreflected in lower revenue than expected based on theeffective yield calculation detailed in chapter 5).Furthermore, accurately accounting for loan losses on aperiodic basis saves the MFI from taking a large loss (anda consequent increase in expenses) all at one time forloans that were made over a period of years (Stearns1991). Loan losses should be recorded close to the periodin which the loan was made.
In order to accurately account for loan losses, the firststep is to determine the quality of the loan portfolio. Thisis done by referring to the “portfolio report” (table 8.1).
THE PORTFOLIO REPORT. One of the most importantmonitoring tools of an MFI is its portfolio report, whichprovides information on the quality of the loan portfolioand the size of the lending activities. Since the loan port-folio is most often the MFI’s largest asset and, therefore,its main revenue-generating asset, ensuring accurate andtimely reporting of the portfolio is crucial to the financialmanagement of an MFI.
Table 8.1 Sample Portfolio Report
Portfolio data 1995 1994 1993
Total value of loans disbursed during the period 160,000 130,000 88,000Total number of loans disbursed during the period 1,600 1,300 1,100Number of active borrowers (end of period) 1,800 1,550 1,320Portfolio outstanding (end of period) 84,000 70,000 52,000Average outstanding balance of loans 75,000 61,000 45,000Value of payments in arrears (end of period) 7,000 9,000 10,000Value of outstanding balance of loans in arrears 18,000 20,000 20,000Value of loans written off during the period 500 3,000 0Average initial loan size 100 100 80Average loan term (months) 12 12 12Average number of credit officers during the period 6 6 4
Source: SEEP Network and Calmeadow 1995
A D J U S T I N G F I N A N C I A L S T A T E M E N T S 189
Portfolio outstanding refers to the principal amount ofloans outstanding. Projected interest is not usually consid-ered part of the portfolio. Principal outstanding is anasset for an MFI; interest contributes to the income of anMFI and is recorded as revenue.
Readers should note that some MFIs capitalize(record as an asset on the balance sheet) the interest rev-enue expected when the loan is disbursed (particularly ifthey are operating with British accounting standards) orwhen the loan term has ended and an outstanding bal-ance is still remaining. For the purposes of this hand-book, we assume that interest is not recorded untilreceived. However, those readers working with MFIs thatdo capitalize interest revenue should be aware that thisresults in higher total assets than if the MFI did not capi-talize interest payments and affects the way in which loanpayments are recorded for accounting purposes.
When a loan payment is received, if interest has notbeen capitalized, interest revenue is recorded on theincome statement as an increase in revenue, and the prin-cipal repaid is recorded on the balance sheet as a reduc-tion in loans outstanding (asset). For MFIs that capitalizeinterest, the entire loan payment amount is recorded as areduction in the loan portfolio, since interest revenue wasrecorded (on the income statement) when the loan wasmade (see the section on accounting for accrued interestand accrued interest expenses below).
Both the “value of payments in arrears” and the“value of outstanding balance of loans in arrears” refer toloans that have an amount that has come due and hasnot been received. The “value of payments in arrears”includes only the amount that has come due and notbeen received, while the “value of outstanding balance ofloans in arrears” includes the total amount of loans out-standing, including the amount that has not yet becomedue, of loans that have an amount in arrears. This iscommonly referred to as the “portfolio at risk.”
Note that the terms “arrears,” “late payments,” “over-due,” “past due,” “delinquent,” and “default” are oftenused interchangeably. Generally, loans that are “inarrears, past-due, and overdue” have become due andhave not been paid. These are also referred to as delin-quent loans (that is, “this loan is delinquent” means ithas an amount that is owing—is in arrears, past due,overdue—and has not been paid). To say that loans arein default is also referring to delinquent loans, but mostoften to loans that have been or are about to be written
off (discussed below). Defaulted loans are often calledsuch if there is little hope of ever receiving payment.
Some MFIs determine that a loan is delinquent if nopayment was received on the due date. However, manyloans are paid within a few days of the due date, andother MFIs allow a short period for late payments and donot consider a loan delinquent until one or two weeks orpayment periods have passed.
Some MFIs fail to consider the amount of time a loanis in arrears and base the likelihood of default (loan loss)more on the term of the loan—in other words, a loan isreported as overdue when the loan term ends, rather thanafter a certain period of time in which no payments havebeen received. This handbook does not take into accountwhether or not the loan term has ended. Any loan thathas an amount in arrears is considered delinquent, basedon the number of days it has been in arrears.
MFIs must also determine whether or not they consid-er the entire outstanding balance of loans that have anamount in arrears (portfolio at risk) to be delinquent orjust the amount that has become due and has not beenreceived. Generally, MFIs should consider the entire out-standing amount as delinquent, because this is the amountthat is actually at risk (that is, if the borrower has missed apayment, chances are he or she may miss more paymentsor will simply stop repaying the loan all together).
A delinquent loan becomes a defaulted loan when thechance of recovery becomes minimal. Defaulted loansresult in loan write-offs. Write-offs should be consideredafter a certain period of time has passed and the loan hasnot been repaid. The decision to write off a loan and thetiming of doing so are based on the policies of the MFI.Some MFIs choose to write loans off relatively quickly sothat their balance sheets do not reflect basically worthlessassets. Others choose not to write off loans as long asthere is a remote possibility of collecting the loan.Regardless of when write-offs take place, it is importantthat an MFI have an adequate loan loss reserve (discussedbelow) so that the net value of loans stated on the bal-ance sheet accurately reflects the amount of revenue-gen-erating assets.
Based on an analysis of the quality of the loan portfo-lio, managers can determine what percentage of the loansis likely to default. To reflect this risk and the corre-sponding true value of the loan portfolio accurately, it isnecessary to create a balance sheet account called the“loan loss reserve.”
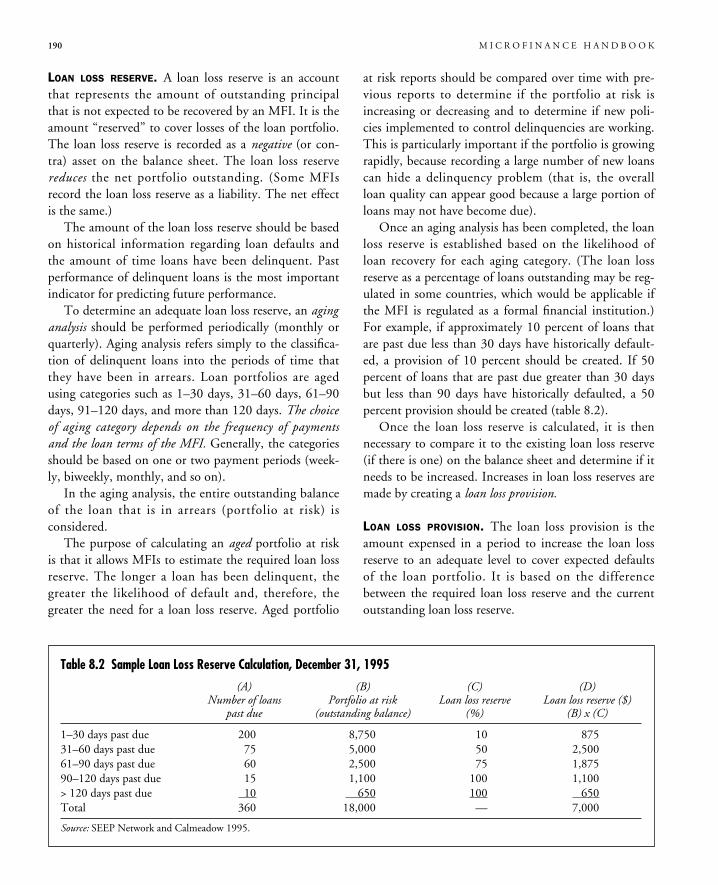
LOAN LOSS RESERVE. A loan loss reserve is an accountthat represents the amount of outstanding principalthat is not expected to be recovered by an MFI. It is theamount “reserved” to cover losses of the loan portfolio.The loan loss reserve is recorded as a negative (or con-tra) asset on the balance sheet. The loan loss reservereduces the net portfolio outstanding. (Some MFIsrecord the loan loss reserve as a liability. The net effectis the same.)
The amount of the loan loss reserve should be basedon historical information regarding loan defaults andthe amount of time loans have been delinquent. Pastperformance of delinquent loans is the most importantindicator for predicting future performance.
To determine an adequate loan loss reserve, an aginganalysis should be performed periodically (monthly orquarterly). Aging analysis refers simply to the classifica-tion of delinquent loans into the periods of time thatthey have been in arrears. Loan portfolios are agedusing categories such as 1–30 days, 31–60 days, 61–90days, 91–120 days, and more than 120 days. The choiceof aging category depends on the frequency of paymentsand the loan terms of the MFI. Generally, the categoriesshould be based on one or two payment periods (week-ly, biweekly, monthly, and so on).
In the aging analysis, the entire outstanding balanceof the loan that is in arrears (portfolio at risk) isconsidered.
The purpose of calculating an aged portfolio at riskis that it allows MFIs to estimate the required loan lossreserve. The longer a loan has been delinquent, thegreater the likelihood of default and, therefore, thegreater the need for a loan loss reserve. Aged portfolio
at risk reports should be compared over time with pre-vious reports to determine if the portfolio at risk isincreasing or decreasing and to determine if new poli-cies implemented to control delinquencies are working.This is particularly important if the portfolio is growingrapidly, because recording a large number of new loanscan hide a delinquency problem (that is, the overallloan quality can appear good because a large portion ofloans may not have become due).
Once an aging analysis has been completed, the loanloss reserve is established based on the likelihood ofloan recovery for each aging category. (The loan lossreserve as a percentage of loans outstanding may be reg-ulated in some countries, which would be applicable ifthe MFI is regulated as a formal financial institution.)For example, if approximately 10 percent of loans thatare past due less than 30 days have historically default-ed, a provision of 10 percent should be created. If 50percent of loans that are past due greater than 30 daysbut less than 90 days have historically defaulted, a 50percent provision should be created (table 8.2).
Once the loan loss reserve is calculated, it is thennecessary to compare it to the existing loan loss reserve(if there is one) on the balance sheet and determine if itneeds to be increased. Increases in loan loss reserves aremade by creating a loan loss provision.
LOAN LOSS PROVISION. The loan loss provision is theamount expensed in a period to increase the loan lossreserve to an adequate level to cover expected defaultsof the loan portfolio. It is based on the differencebetween the required loan loss reserve and the currentoutstanding loan loss reserve.
190 M I C R O F I N A N C E H A N D B O O K
Table 8.2 Sample Loan Loss Reserve Calculation, December 31, 1995
(A) (B) (C) (D)Number of loans Portfolio at risk Loan loss reserve Loan loss reserve ($)
past due (outstanding balance) (%) (B) x (C)
1–30 days past due 200 8,750 10 87531–60 days past due 75 5,000 50 2,50061–90 days past due 60 2,500 75 1,87590–120 days past due 15 1,100 100 1,100> 120 days past due 10 650 100 650Total 360 18,000 — 7,000
Source: SEEP Network and Calmeadow 1995.
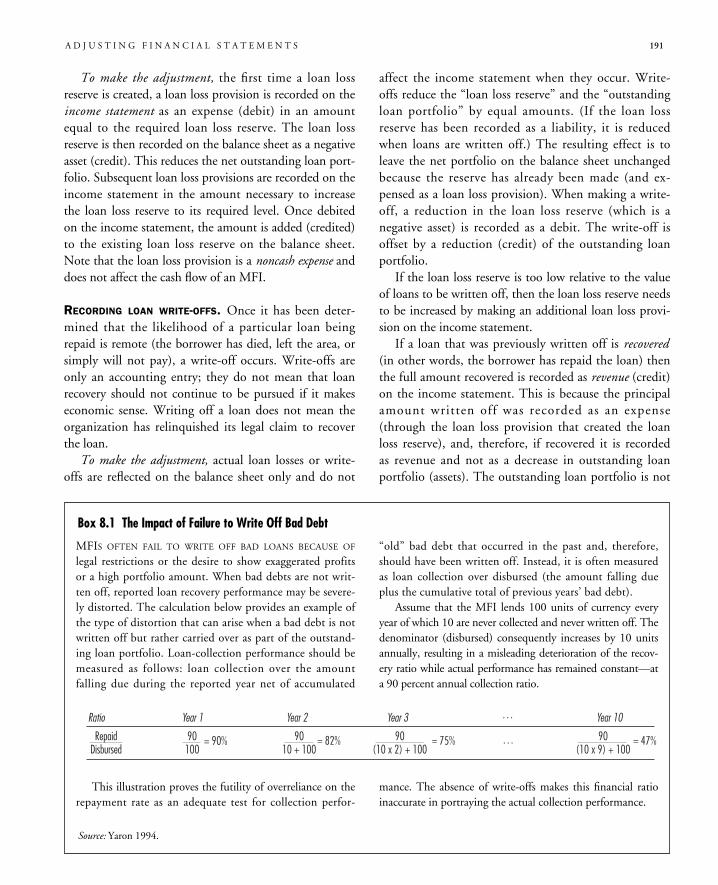
A D J U S T I N G F I N A N C I A L S T A T E M E N T S 191
To make the adjustment, the first time a loan lossreserve is created, a loan loss provision is recorded on theincome statement as an expense (debit) in an amountequal to the required loan loss reserve. The loan lossreserve is then recorded on the balance sheet as a negativeasset (credit). This reduces the net outstanding loan port-folio. Subsequent loan loss provisions are recorded on theincome statement in the amount necessary to increasethe loan loss reserve to its required level. Once debitedon the income statement, the amount is added (credited)to the existing loan loss reserve on the balance sheet.Note that the loan loss provision is a noncash expense anddoes not affect the cash flow of an MFI.
RECORDING LOAN WRITE-OFFS. Once it has been deter-mined that the likelihood of a particular loan beingrepaid is remote (the borrower has died, left the area, orsimply will not pay), a write-off occurs. Write-offs areonly an accounting entry; they do not mean that loanrecovery should not continue to be pursued if it makeseconomic sense. Writing off a loan does not mean theorganization has relinquished its legal claim to recoverthe loan.
To make the adjustment, actual loan losses or write-offs are reflected on the balance sheet only and do not
affect the income statement when they occur. Write-offs reduce the “loan loss reserve” and the “outstandingloan portfolio” by equal amounts. (If the loan lossreserve has been recorded as a liability, it is reducedwhen loans are written off.) The resulting effect is toleave the net portfolio on the balance sheet unchangedbecause the reserve has already been made (and ex-pensed as a loan loss provision). When making a write-off, a reduction in the loan loss reserve (which is anegative asset) is recorded as a debit. The write-off isoffset by a reduction (credit) of the outstanding loanportfolio.
If the loan loss reserve is too low relative to the valueof loans to be written off, then the loan loss reserve needsto be increased by making an additional loan loss provi-sion on the income statement.
If a loan that was previously written off is recovered(in other words, the borrower has repaid the loan) thenthe full amount recovered is recorded as revenue (credit)on the income statement. This is because the principalamount written off was recorded as an expense(through the loan loss provision that created the loanloss reserve), and, therefore, if recovered it is recordedas revenue and not as a decrease in outstanding loanportfolio (assets). The outstanding loan portfolio is not
MFIS OFTEN FAIL TO WRITE OFF BAD LOANS BECAUSE OF
legal restrictions or the desire to show exaggerated profitsor a high portfolio amount. When bad debts are not writ-ten off, reported loan recovery performance may be severe-ly distorted. The calculation below provides an example ofthe type of distortion that can arise when a bad debt is notwritten off but rather carried over as part of the outstand-ing loan portfolio. Loan-collection performance should bemeasured as follows: loan collection over the amountfalling due during the reported year net of accumulated
“old” bad debt that occurred in the past and, therefore,should have been written off. Instead, it is often measuredas loan collection over disbursed (the amount falling dueplus the cumulative total of previous years’ bad debt).
Assume that the MFI lends 100 units of currency everyyear of which 10 are never collected and never written off. Thedenominator (disbursed) consequently increases by 10 unitsannually, resulting in a misleading deterioration of the recov-ery ratio while actual performance has remained constant—ata 90 percent annual collection ratio.
Box 8.1 The Impact of Failure to Write Off Bad Debt
Source: Yaron 1994.
This illustration proves the futility of overreliance on therepayment rate as an adequate test for collection perfor-
mance. The absence of write-offs makes this financial ratioinaccurate in portraying the actual collection performance.
Year 1 Year 2 Year 3 Year 10…Ratio
90100
RepaidDisbursed
9010 + 100
90(10 x 2) + 100
… 90(10 x 9) + 100
= 90% = 82% = 75% = 47%
192 M I C R O F I N A N C E H A N D B O O K
affected because the loan amount was already removedfrom the balance sheet when the write-off occurred.The offsetting entry (debit) is an increase in assets, usu-ally cash.
To determine if a write-off has taken place, it is neces-sary to have the previous year’s closing balance sheet,this year’s closing balance sheet, and this year’s incomestatement. The first step is to determine the differencebetween the amount of the loan loss reserve in the pre-vious year and the amount of the loan loss reserve thisyear. This amount should equal the amount of theloan loss provision for this year. If it does not, the dif-ference is the amount of write-off taken in the currentyear.� For example, the financial statements (not shown) for
the sample MFI portfolio report in table 8.1 showeda loan loss reserve of 5,000 on the balance sheet atthe end of 1994, a loan loss reserve of 7,000 on thebalance sheet at the end of 1995, and a loan loss pro-vision on the income statement in 1995 of 2,500.Adding the 1995 loan loss provision (2,500) to the1994 loan loss reserve (5,000) should result in a loanloss reserve for 1995 of 7,500. Since it is not 7,500but only 7,000, a write-off of 500 must haveoccurred. This can be verified by looking at the sam-ple portfolio report in table 8.1.Note that write-offs reduce the amount of portfolio
at risk. MFIs that wish to report a healthy portfolio (orminimal portfolio at risk) may choose to write off loansmore frequently than they should. The decision onwhen to write off a loan should be based on a soundpolicy established and agreed to by the board membersof an MFI.
Accounting for Depreciation of Fixed Assets
Many MFIs depreciate fixed assets according to gener-ally accepted accounting principles. However, some donot. If in an analysis of an MFI’s financial statementsthere does not appear to be an operating account(expense) called depreciation on the income state-ment, or if the account seems too large or too smallrelative to the amount of fixed assets on the balancesheet, it is necessary to adjust the financial statementsand depreciate each capital asset by the appropriateamount for the number of years that the MFI hasowned it.
When a fixed asset such as a piece of machinery or amotorcycle is purchased, there is a limited time that itwill be useful (that is, able to contribute to the genera-tion of revenue). Depreciation expense is the account-ing term used to allocate and charge the cost of thisusefulness to the accounting periods that benefit fromthe use of the asset. Depreciation is an annual expensethat is determined by estimating the useful life of eachasset. Like the loan loss provision, depreciation is a non-cash expense and does not affect the cash flow of theMFI.
To make the adjustment, when a fixed asset is firstpurchased, it is recorded on the balance sheet at thecurrent value or price. When a depreciation expense(debit) is recorded on the income statement, it is off-set by a negative asset (credit) on the balance sheetcalled accumulated depreciation. This offsets the grossproperty and equipment reducing the net fixed assets.Accumulated depreciation represents a decrease in thevalue to property and equipment that is used up dur-ing each accounting period. (Accumulated deprecia-tion is similar to the loan loss reserve in that bothserve to reduce the value of specific assets on the bal-ance sheet.)� For example, when an MFI purchases a motorcycle, it
estimates its useful life for a number of years.Recording depreciation on the motorcycle is a processof allocating the period cost to the accounting periodsthat benefit from its use. If the useful life is estimatedat, say, five years, then depreciation would be record-ed for each of the five years. This results in a reducedbook value of the motorcycle on the MFI’s balancesheet.There are two primary methods of recording depreci-
ation: the straight-line method and the declining bal-ance method. The straight-line method allocates an equalshare of an asset’s total depreciation to each accountingperiod. This is calculated by taking the cost of the assetand dividing it by the estimated number of accountingperiods in the asset’s useful life. The result is the amountof depreciation to be recorded each period.� In the example above, if the motorcycle costs
5,500, has an estimated useful life of five years, andhas an estimated value of 500 at the end of the fiveyears (salvage value), its depreciation per year cal-culated by the straight-line method is 1,000, asfollows:
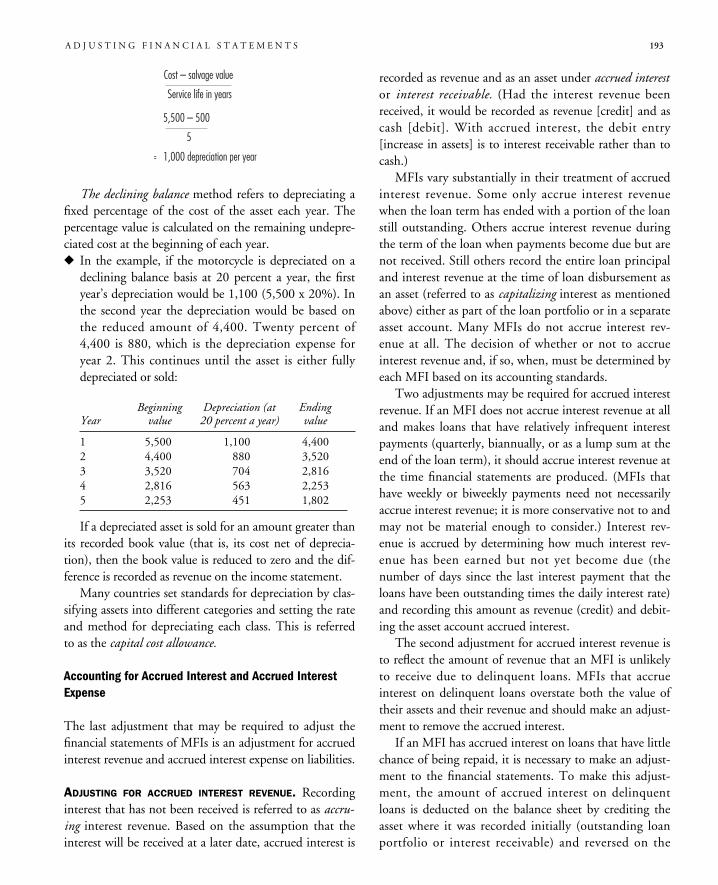
The declining balance method refers to depreciating afixed percentage of the cost of the asset each year. Thepercentage value is calculated on the remaining undepre-ciated cost at the beginning of each year.� In the example, if the motorcycle is depreciated on a
declining balance basis at 20 percent a year, the firstyear’s depreciation would be 1,100 (5,500 x 20%). Inthe second year the depreciation would be based onthe reduced amount of 4,400. Twenty percent of4,400 is 880, which is the depreciation expense foryear 2. This continues until the asset is either fullydepreciated or sold:
Beginning Depreciation (at EndingYear value 20 percent a year) value
1 5,500 1,100 4,4002 4,400 880 3,5203 3,520 704 2,8164 2,816 563 2,2535 2,253 451 1,802
If a depreciated asset is sold for an amount greater thanits recorded book value (that is, its cost net of deprecia-tion), then the book value is reduced to zero and the dif-ference is recorded as revenue on the income statement.
Many countries set standards for depreciation by clas-sifying assets into different categories and setting the rateand method for depreciating each class. This is referredto as the capital cost allowance.
Accounting for Accrued Interest and Accrued InterestExpense
The last adjustment that may be required to adjust thefinancial statements of MFIs is an adjustment for accruedinterest revenue and accrued interest expense on liabilities.
ADJUSTING FOR ACCRUED INTEREST REVENUE. Recordinginterest that has not been received is referred to as accru-ing interest revenue. Based on the assumption that theinterest will be received at a later date, accrued interest is
recorded as revenue and as an asset under accrued interestor interest receivable. (Had the interest revenue beenreceived, it would be recorded as revenue [credit] and ascash [debit]. With accrued interest, the debit entry[increase in assets] is to interest receivable rather than tocash.)
MFIs vary substantially in their treatment of accruedinterest revenue. Some only accrue interest revenuewhen the loan term has ended with a portion of the loanstill outstanding. Others accrue interest revenue duringthe term of the loan when payments become due but arenot received. Still others record the entire loan principaland interest revenue at the time of loan disbursement asan asset (referred to as capitalizing interest as mentionedabove) either as part of the loan portfolio or in a separateasset account. Many MFIs do not accrue interest rev-enue at all. The decision of whether or not to accrueinterest revenue and, if so, when, must be determined byeach MFI based on its accounting standards.
Two adjustments may be required for accrued interestrevenue. If an MFI does not accrue interest revenue at alland makes loans that have relatively infrequent interestpayments (quarterly, biannually, or as a lump sum at theend of the loan term), it should accrue interest revenue atthe time financial statements are produced. (MFIs thathave weekly or biweekly payments need not necessarilyaccrue interest revenue; it is more conservative not to andmay not be material enough to consider.) Interest rev-enue is accrued by determining how much interest rev-enue has been earned but not yet become due (thenumber of days since the last interest payment that theloans have been outstanding times the daily interest rate)and recording this amount as revenue (credit) and debit-ing the asset account accrued interest.
The second adjustment for accrued interest revenue isto reflect the amount of revenue that an MFI is unlikelyto receive due to delinquent loans. MFIs that accrueinterest on delinquent loans overstate both the value oftheir assets and their revenue and should make an adjust-ment to remove the accrued interest.
If an MFI has accrued interest on loans that have littlechance of being repaid, it is necessary to make an adjust-ment to the financial statements. To make this adjust-ment, the amount of accrued interest on delinquentloans is deducted on the balance sheet by crediting theasset where it was recorded initially (outstanding loanportfolio or interest receivable) and reversed on the
Cost – salvage value
Service life in years
=
5,500 – 500
5
1,000 depreciation per year
A D J U S T I N G F I N A N C I A L S T A T E M E N T S 193
income statement by decreasing interest revenue (debit).This adjustment correctly states the true financial posi-tion of the MFI.� For example, if an MFI has accrued interest of 500 in
the interest receivable account on a loan that has beenoverdue for more than a year, it should decrease inter-est revenue by 500 and decrease interest receivable by500 to correctly state its revenue and assets.The best practice for MFIs is not to accrue interest
revenue on delinquent loans at all.
ADJUSTING FOR ACCRUED INTEREST EXPENSE. When a fiscalyear ends, the balance sheet should reflect the financial
position of the MFI as of that date. When MFIs borrowfrom external sources (concessional or commercial loansor client savings or both) to fund their assets, they incur aliability. Liabilities carry financing charges that are paidperiodically. At year-end it is likely that the MFI will oweinterest on borrowed funds for the period from the lastloan or interest payment to the day the year ends. Thefinancial statements will need to be adjusted to reflect thisfinancing expense that has been incurred but not yet paid.This is referred to as accrued interest expense. If interestowed is not accrued, the MFI’s financing costs at the endof the year are understated, its profitability is overstated,and its liabilities are understated.
To accrue interest expense, the amount of interestowing as of the date the balance sheet is created is debit-ed on the income statement as a financing cost and cred-ited as a liability on the balance sheet in the accruedinterest expense account.� For example, an MFI borrows 10,000 on January 1 at
an annual interest rate of 5 percent with interest dueonce a year on January 1 and the principal due at theend of five years. If its year-end is December 31, itwill have had the loan for one year less a day when itcloses its balance sheet. However, it will not have paidany interest yet, as interest is not due until January 1.To properly reflect this interest expense, the MFIshould debit its income statement to include 500 ininterest expense (financing costs) and credit itsaccrued interest expense account (liability) 500.
Adjusting for Subsidies and Inflation
Unlike the three adjustments described above, whichreflect proper accounting procedures, the following adjust-ments may or may not be required to adhere to properaccounting procedures, depending on which country theMFI is operating in. However, adjustments for both subsi-dies and inflation should be made to accurately determinethe true financial viability of an MFI. Some readers maywish to make these adjustments separately from the adjust-ed financial statements described above.
The following describes why adjustments for subsi-dies and inflation should be made and how to makeactual accounting entries to the financial statements.(Adjusted financial statements are provided in appen-dixes 1 and 2.)
194 M I C R O F I N A N C E H A N D B O O K
Box 8.2 Cash and Accrual Accounting for MicrofinanceInstitutionsSOME MFIS ACCRUE INTEREST REVENUE WHEREAS OTHERS
account for it on a cash basis. MFIs that accrue interestrevenue account for it as earned whether or not it hascome due and been paid. This is standard practice in thebanking industry; however, banks have to stop accruinginterest once a loan is past due more than 90 days(nonperforming loans).
Most MFIs account for interest revenue more conserv-atively, on a cash basis. They treat interest as income onlyafter it is actually received. In institutions that do notgrow, the difference between the two systems does notentail a great difference in the final results presented atyear end. If payment frequency is high (for example,weekly) then there is little difference between the two sys-tems: in the case of weekly payments, the closing balancedone on a cash basis would fail to reflect only a week’sworth of interest income. Likewise, the final results underthe two systems are not widely different in institutionsthat are not growing: under a cash accounting system in ano-growth program, the omission of earned but unpaidinterest is approximately balanced by the inclusion of cashinterest income earned in the prior period but received inthe present period.
In MFIs where growth is strong and payments are lessfrequent, the results produced by cash and accrualaccounting can be substantially different. MFIs shouldeventually move toward the banking industry practice ofaccruing interest. However, many MFIs do not have thecomputing power to do accrual accounting, and theyshould not necessarily acquire it only for this purpose.
Source: Christen 1997.
Accounting for Subsidies
Unlike traditional financial intermediaries that fund theirloans with voluntary savings and other debt, many MFIsfund their loan portfolios (assets) primarily with donatedequity or concessional loans (liabilities). Concessionalloans, donated funds for operations (including indirectsubsidies—such as reserve requirement exemptions orgovernment assumption of loan losses or foreignexchange losses—or “in-kind” donations—such as freeoffice space, equipment, or training provided by govern-ments or donors), and donated equity are all consideredsubsidies for MFIs.
Yaron (1992) shows that standard accounting mea-sures of profitability are not valid for analyzing the per-formance of institutions receiving subsidies. Accountingprofits are simply the sum of profits (or losses) and subsi-dies received. For example, if an MFI receives a grant tocover operating shortfalls and records it as revenue, itsnet income will be overstated. In this case a highly subsi-dized MFI appears more profitable than a better-performing, subsidy-free MFI.
It is, therefore, necessary to separate out and adjust thefinancial statements for any subsidies to determine thefinancial performance of an MFI as if it were operatingwith market debt and equity rather than donor funds. Inaddition, as an MFI matures, it will likely find it necessaryto replace grants and concessional loans with market ratedebt (or equity) and would thus need to determine itsfinancial viability if it were to borrow commercial funds.
To some extent, these adjustments also allow for com-parison among MFIs, because it puts all MFIs on equalground analytically, as if they were all operating withcommercially available third-party funds (Christen 1997).
It is important to note that while the adjustments forsubsidies may ultimately be entered on the MFI’s finan-cial statements, they do not represent actual cash out-flows. Subsidy adjustments are calculated for analysispurposes only to accurately assess the institution, its sub-sidy dependence, and the risk that it would face if subsi-dies were eliminated.
There are three types of subsidies typically received byMFIs:� Funds donated to cover operational costs and dona-
tions in-kind� Concessional loans� Donated equity.
To make subsidy adjustments, it is necessary first todetermine the value of the subsidy and then recordaccounting entries. For concessional loans and donatedequity, it is also necessary to determine the appropriate“cost of funds” to apply to the subsidies.
Adjustments for subsidies result in a change in the netincome reported on the income statement equal to thevalue of the subsidies; that is, subsidy adjustments resultin increased expenses, which lower the net income.Subsidy adjustments do not, however, ultimately changethe totals on the balance sheet, because a new capitalaccount is created to reflect the increase in equity neces-sary to compensate for the effect of the subsidies, whichoffsets the lower retained earnings. Audited financialstatements may reflect the effect of direct donations(grants to cover operating expenses) to the MFI butwould not likely be adjusted for implicit subsidies (in-kind donations or concessional loans).
DONATIONS TO COVER OPERATIONAL COSTS AND DONATIONS
IN KIND. Funds donated to cover operational costs are adirect subsidy to the MFI. The value of the subsidy is,therefore, equal to the amount donated to cover expensesincurred in the period reported. Some donations are pro-vided to cover operating shortfalls over a period greaterthan one year. Only the amount “spent” in the year isrecorded on the income statement as revenue. Anyamount still to be used in subsequent years remains as aliability on the balance sheet (referred to as deferred rev-enue). This occurs because, theoretically, if an MFIstopped operations in the middle of a multiyear operat-ing grant, they would have to return the unused dona-tion to the donor. Therefore, the unused amount isconsidered a liability.
Donated funds for operations should be reported onthe income statement separately from revenue generatedby lending and investment activities to accurately reportthe earned revenue of the MFI. These funds should bededucted from revenue or net income prior to any finan-cial performance analysis, because they do not representrevenue earned from operations. (Note that any costsincurred to obtain donor funds—“fundraising costs”—should also be separated from other operating expenses,because the benefit of receiving the funds is not included.)
In-kind donations such as free office space or stafftraining constitute a subsidy to the MFI and should berecorded as an expense on the income statement. This
A D J U S T I N G F I N A N C I A L S T A T E M E N T S 195
accurately reflects the true level of expenses that wouldbe incurred if the MFI were to operate without in-kinddonations.
To make the adjustment, if an MFI has recorded dona-tions to cover operational costs on the income statement asrevenue earned, the amount should be reported below thenet income line, resulting in a reduction in operational rev-enue and, therefore, a reduction in the amount transferredto the balance sheet as current year net surplus (deficit). Anoffsetting credit entry is made to the balance sheet in theaccumulated capital—subsidies account (equity).
Similarly, the market value of donations in kind isdebited on the income statement (an increase in expens-es) and offset in the same equity account on the balancesheet: accumulated capital—subsidies.� For example, in the sample financial statements in
appendix 1, a donation of 950 was received for opera-tions (assume no donations in kind were received).The income statement is adjusted to reflect a reduc-tion in profits of 950 (debit) and a credit of 950 tothe accumulated capital account on the balance sheetis made.
CONCESSIONAL LOANS. Concessional loans are loansreceived by the MFI with lower than market rates ofinterest. Concessional loans result in a subsidy equal tothe value of the concessional loans times the commercialor market rate, less the amount of interest paid.
The actual financing costs of concessional loans arenetted out in this calculation because they are capturedin the recorded financing costs on the income statement(as an actual cash outflow or accrued interest payable).
To determine the appropriate market rate (cost of funds)to apply, it is best to choose the form of funding that theMFI would most reasonably be able to obtain if it wereto replace donor funds with market funds. Suggestedmarket rates include:� Local prime rate for commercial loans (adjusted
upward for a potential risk premium due to the per-ceived risk of MFIs)
� 90-day certificate of deposit rate (adjusted for risk)� Interbank lending rate (adjusted for risk)� Average deposit rate at commercial banks (adjusted
upward to account for the additional operating costs
incurred to collect deposits and the added cost ofreserve requirements on deposits).
� Inflation rate plus 3 to 5 percentage points per year(particularly if the prime rate is negative in relation toinflation).MFIs may wish to select the same market rate for all
types of concessional debt, or they may choose differentrates, depending on what form of funding might replaceeach subsidy. This must be decided by each MFI basedon the existing forms of debt and equity available and theability to access different types of debt and equity.
Adjustments must be made to both the balance sheetand the income statement. The amount of the subsidy isentered as an increase to equity (credit) under the accu-mulated capital—subsidies account and as an increase infinancial costs (debit).� For example, in the sample financial statements in
appendix 1, concessional funds outstanding at the endof the year were 30,000. If we assume that the interestpaid for the year on the 30,000 concessional loan was900 and the market rate was 10 percent, then the sub-sidy would equal 2,100 [(30,000 * 10%) – 900].
The subsidy can also be determined by calculat-ing the average rate of interest paid on the concession-al loans. For example, if we assume that the averageinterest rate paid on those funds was 3 percent andthe market rate for commercial loans is 10 percent,the annual subsidy is equal to (30,000 x 7%) or2,100.
To make this adjustment on the balance sheet,2,100 is entered in the capital accumulation account(credit), which increases equity. To offset this entry,an adjustment has to be made to the income state-ment. The amount of the subsidy is entered as anincrease in financial costs (debit) of 2,100, which inturn reduces the profit of the MFI. When thisreduced profit is transferred to the balance sheet, thenet equity changes result in no change to the totals onthe balance sheet.
FUNDS DONATED FOR LOAN CAPITAL (EQUITY). Fundsdonated for loan capital are often treated as equity byMFIs and, therefore, are not always considered whenadjusting for subsidies, since these funds are not usuallyincluded on the income statement as revenue. (Note thatsome MFIs do record donations for loan fund capital onthe income statement, which then “flow through” to the
Subsidy [(concessional loans x market rate)amount of interest paid]
=–
196 M I C R O F I N A N C E H A N D B O O K
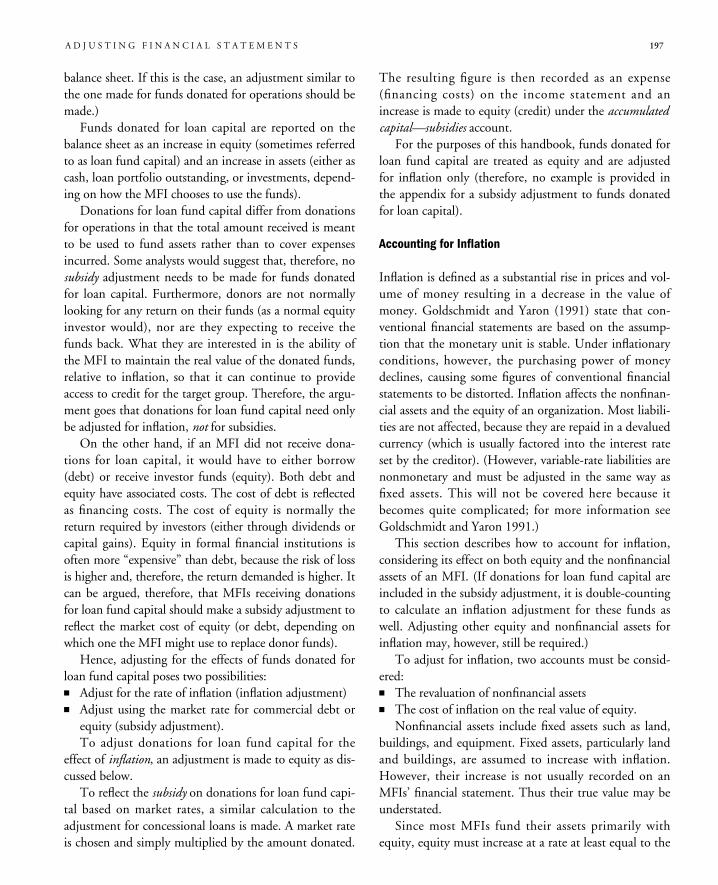
A D J U S T I N G F I N A N C I A L S T A T E M E N T S 197
balance sheet. If this is the case, an adjustment similar tothe one made for funds donated for operations should bemade.)
Funds donated for loan capital are reported on thebalance sheet as an increase in equity (sometimes referredto as loan fund capital) and an increase in assets (either ascash, loan portfolio outstanding, or investments, depend-ing on how the MFI chooses to use the funds).
Donations for loan fund capital differ from donationsfor operations in that the total amount received is meantto be used to fund assets rather than to cover expensesincurred. Some analysts would suggest that, therefore, nosubsidy adjustment needs to be made for funds donatedfor loan capital. Furthermore, donors are not normallylooking for any return on their funds (as a normal equityinvestor would), nor are they expecting to receive thefunds back. What they are interested in is the ability ofthe MFI to maintain the real value of the donated funds,relative to inflation, so that it can continue to provideaccess to credit for the target group. Therefore, the argu-ment goes that donations for loan fund capital need onlybe adjusted for inflation, not for subsidies.
On the other hand, if an MFI did not receive dona-tions for loan capital, it would have to either borrow(debt) or receive investor funds (equity). Both debt andequity have associated costs. The cost of debt is reflectedas financing costs. The cost of equity is normally thereturn required by investors (either through dividends orcapital gains). Equity in formal financial institutions isoften more “expensive” than debt, because the risk of lossis higher and, therefore, the return demanded is higher. Itcan be argued, therefore, that MFIs receiving donationsfor loan fund capital should make a subsidy adjustment toreflect the market cost of equity (or debt, depending onwhich one the MFI might use to replace donor funds).
Hence, adjusting for the effects of funds donated forloan fund capital poses two possibilities:� Adjust for the rate of inflation (inflation adjustment)� Adjust using the market rate for commercial debt or
equity (subsidy adjustment).To adjust donations for loan fund capital for the
effect of inflation, an adjustment is made to equity as dis-cussed below.
To reflect the subsidy on donations for loan fund capi-tal based on market rates, a similar calculation to theadjustment for concessional loans is made. A market rateis chosen and simply multiplied by the amount donated.
The resulting figure is then recorded as an expense(financing costs) on the income statement and anincrease is made to equity (credit) under the accumulatedcapital—subsidies account.
For the purposes of this handbook, funds donated forloan fund capital are treated as equity and are adjustedfor inflation only (therefore, no example is provided inthe appendix for a subsidy adjustment to funds donatedfor loan capital).
Accounting for Inflation
Inflation is defined as a substantial rise in prices and vol-ume of money resulting in a decrease in the value ofmoney. Goldschmidt and Yaron (1991) state that con-ventional financial statements are based on the assump-tion that the monetary unit is stable. Under inflationaryconditions, however, the purchasing power of moneydeclines, causing some figures of conventional financialstatements to be distorted. Inflation affects the nonfinan-cial assets and the equity of an organization. Most liabili-ties are not affected, because they are repaid in a devaluedcurrency (which is usually factored into the interest rateset by the creditor). (However, variable-rate liabilities arenonmonetary and must be adjusted in the same way asfixed assets. This will not be covered here because itbecomes quite complicated; for more information seeGoldschmidt and Yaron 1991.)
This section describes how to account for inflation,considering its effect on both equity and the nonfinancialassets of an MFI. (If donations for loan fund capital areincluded in the subsidy adjustment, it is double-countingto calculate an inflation adjustment for these funds aswell. Adjusting other equity and nonfinancial assets forinflation may, however, still be required.)
To adjust for inflation, two accounts must be consid-ered:� The revaluation of nonfinancial assets� The cost of inflation on the real value of equity.
Nonfinancial assets include fixed assets such as land,buildings, and equipment. Fixed assets, particularly landand buildings, are assumed to increase with inflation.However, their increase is not usually recorded on anMFIs’ financial statement. Thus their true value may beunderstated.
Since most MFIs fund their assets primarily withequity, equity must increase at a rate at least equal to the
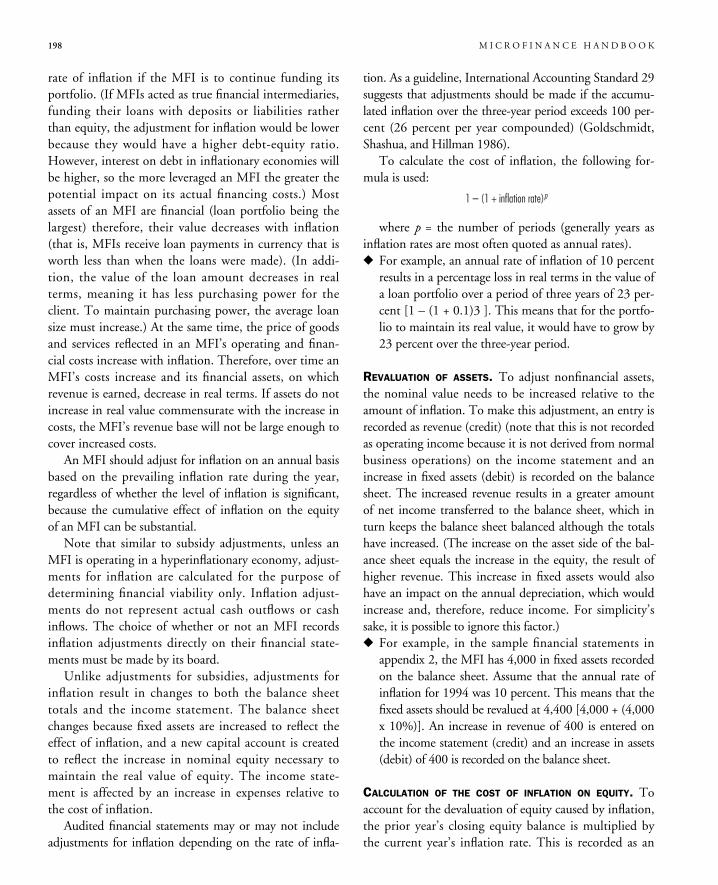
rate of inflation if the MFI is to continue funding itsportfolio. (If MFIs acted as true financial intermediaries,funding their loans with deposits or liabilities ratherthan equity, the adjustment for inflation would be lowerbecause they would have a higher debt-equity ratio.However, interest on debt in inflationary economies willbe higher, so the more leveraged an MFI the greater thepotential impact on its actual financing costs.) Mostassets of an MFI are financial (loan portfolio being thelargest) therefore, their value decreases with inflation(that is, MFIs receive loan payments in currency that isworth less than when the loans were made). (In addi-tion, the value of the loan amount decreases in realterms, meaning it has less purchasing power for theclient. To maintain purchasing power, the average loansize must increase.) At the same time, the price of goodsand services reflected in an MFI’s operating and finan-cial costs increase with inflation. Therefore, over time anMFI’s costs increase and its financial assets, on whichrevenue is earned, decrease in real terms. If assets do notincrease in real value commensurate with the increase incosts, the MFI’s revenue base will not be large enough tocover increased costs.
An MFI should adjust for inflation on an annual basisbased on the prevailing inflation rate during the year,regardless of whether the level of inflation is significant,because the cumulative effect of inflation on the equityof an MFI can be substantial.
Note that similar to subsidy adjustments, unless anMFI is operating in a hyperinflationary economy, adjust-ments for inflation are calculated for the purpose ofdetermining financial viability only. Inflation adjust-ments do not represent actual cash outflows or cashinflows. The choice of whether or not an MFI recordsinflation adjustments directly on their financial state-ments must be made by its board.
Unlike adjustments for subsidies, adjustments forinflation result in changes to both the balance sheettotals and the income statement. The balance sheetchanges because fixed assets are increased to reflect theeffect of inflation, and a new capital account is createdto reflect the increase in nominal equity necessary tomaintain the real value of equity. The income state-ment is affected by an increase in expenses relative tothe cost of inflation.
Audited financial statements may or may not includeadjustments for inflation depending on the rate of infla-
tion. As a guideline, International Accounting Standard 29suggests that adjustments should be made if the accumu-lated inflation over the three-year period exceeds 100 per-cent (26 percent per year compounded) (Goldschmidt,Shashua, and Hillman 1986).
To calculate the cost of inflation, the following for-mula is used:
where p = the number of periods (generally years asinflation rates are most often quoted as annual rates).� For example, an annual rate of inflation of 10 percent
results in a percentage loss in real terms in the value ofa loan portfolio over a period of three years of 23 per-cent [1 – (1 + 0.1)3 ]. This means that for the portfo-lio to maintain its real value, it would have to grow by23 percent over the three-year period.
REVALUATION OF ASSETS. To adjust nonfinancial assets,the nominal value needs to be increased relative to theamount of inflation. To make this adjustment, an entry isrecorded as revenue (credit) (note that this is not recordedas operating income because it is not derived from normalbusiness operations) on the income statement and anincrease in fixed assets (debit) is recorded on the balancesheet. The increased revenue results in a greater amountof net income transferred to the balance sheet, which inturn keeps the balance sheet balanced although the totalshave increased. (The increase on the asset side of the bal-ance sheet equals the increase in the equity, the result ofhigher revenue. This increase in fixed assets would alsohave an impact on the annual depreciation, which wouldincrease and, therefore, reduce income. For simplicity’ssake, it is possible to ignore this factor.)� For example, in the sample financial statements in
appendix 2, the MFI has 4,000 in fixed assets recordedon the balance sheet. Assume that the annual rate ofinflation for 1994 was 10 percent. This means that thefixed assets should be revalued at 4,400 [4,000 + (4,000x 10%)]. An increase in revenue of 400 is entered onthe income statement (credit) and an increase in assets(debit) of 400 is recorded on the balance sheet.
CALCULATION OF THE COST OF INFLATION ON EQUITY. Toaccount for the devaluation of equity caused by inflation,the prior year’s closing equity balance is multiplied bythe current year’s inflation rate. This is recorded as an
1 – (1 + inflation rate)p
198 M I C R O F I N A N C E H A N D B O O K
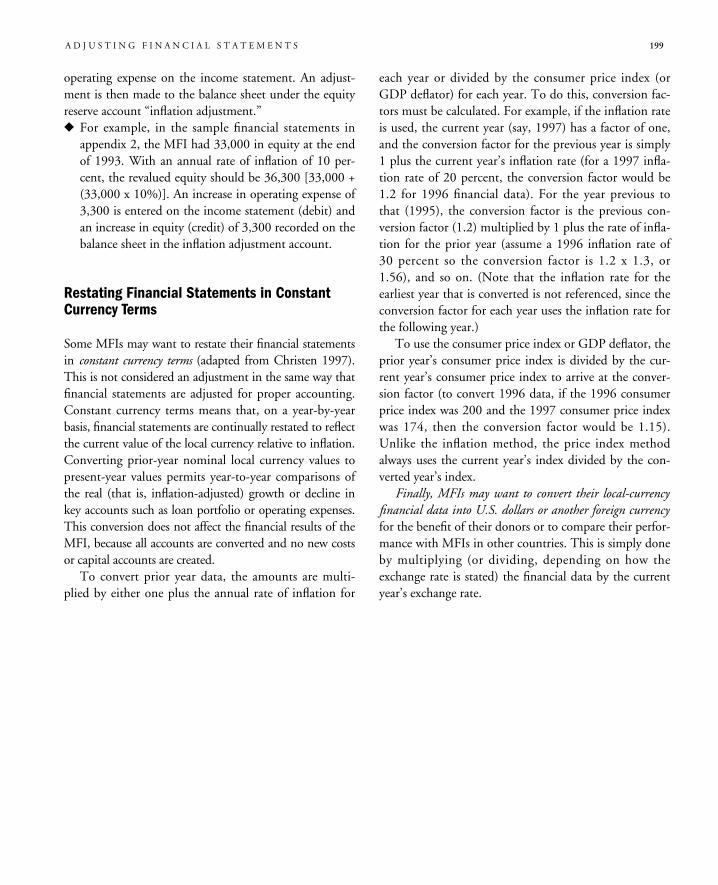
operating expense on the income statement. An adjust-ment is then made to the balance sheet under the equityreserve account “inflation adjustment.”� For example, in the sample financial statements in
appendix 2, the MFI had 33,000 in equity at the endof 1993. With an annual rate of inflation of 10 per-cent, the revalued equity should be 36,300 [33,000 +(33,000 x 10%)]. An increase in operating expense of3,300 is entered on the income statement (debit) andan increase in equity (credit) of 3,300 recorded on thebalance sheet in the inflation adjustment account.
Restating Financial Statements in ConstantCurrency Terms
Some MFIs may want to restate their financial statementsin constant currency terms (adapted from Christen 1997).This is not considered an adjustment in the same way thatfinancial statements are adjusted for proper accounting.Constant currency terms means that, on a year-by-yearbasis, financial statements are continually restated to reflectthe current value of the local currency relative to inflation.Converting prior-year nominal local currency values topresent-year values permits year-to-year comparisons ofthe real (that is, inflation-adjusted) growth or decline inkey accounts such as loan portfolio or operating expenses.This conversion does not affect the financial results of theMFI, because all accounts are converted and no new costsor capital accounts are created.
To convert prior year data, the amounts are multi-plied by either one plus the annual rate of inflation for
each year or divided by the consumer price index (orGDP deflator) for each year. To do this, conversion fac-tors must be calculated. For example, if the inflation rateis used, the current year (say, 1997) has a factor of one,and the conversion factor for the previous year is simply1 plus the current year’s inflation rate (for a 1997 infla-tion rate of 20 percent, the conversion factor would be1.2 for 1996 financial data). For the year previous tothat (1995), the conversion factor is the previous con-version factor (1.2) multiplied by 1 plus the rate of infla-tion for the prior year (assume a 1996 inflation rate of30 percent so the conversion factor is 1.2 x 1.3, or1.56), and so on. (Note that the inflation rate for theearliest year that is converted is not referenced, since theconversion factor for each year uses the inflation rate forthe following year.)
To use the consumer price index or GDP deflator, theprior year’s consumer price index is divided by the cur-rent year’s consumer price index to arrive at the conver-sion factor (to convert 1996 data, if the 1996 consumerprice index was 200 and the 1997 consumer price indexwas 174, then the conversion factor would be 1.15).Unlike the inflation method, the price index methodalways uses the current year’s index divided by the con-verted year’s index.
Finally, MFIs may want to convert their local-currencyfinancial data into U.S. dollars or another foreign currencyfor the benefit of their donors or to compare their perfor-mance with MFIs in other countries. This is simply doneby multiplying (or dividing, depending on how theexchange rate is stated) the financial data by the currentyear’s exchange rate.
A D J U S T I N G F I N A N C I A L S T A T E M E N T S 199
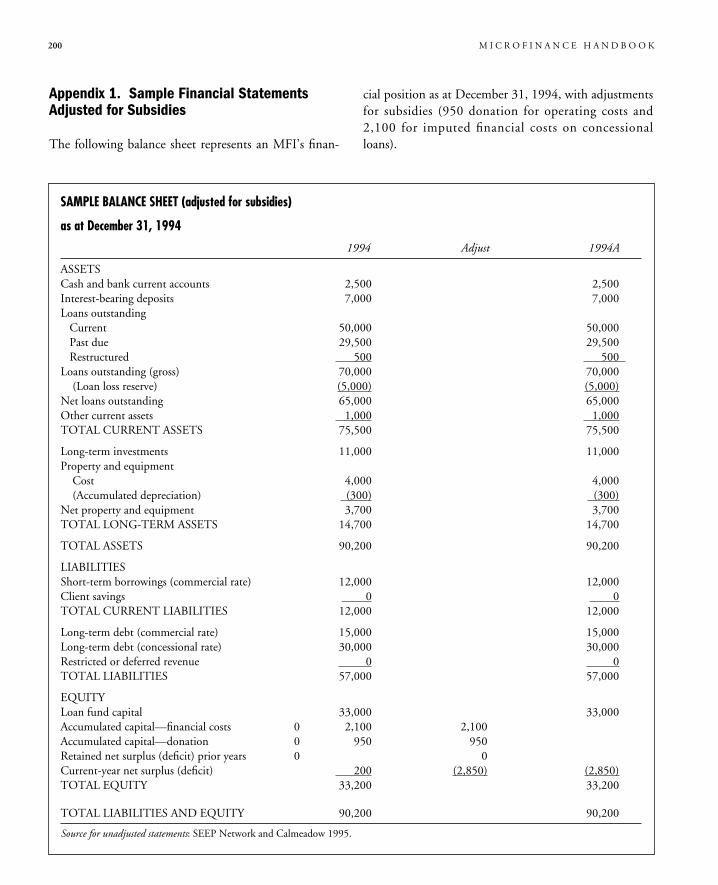
200 M I C R O F I N A N C E H A N D B O O K
SAMPLE BALANCE SHEET (adjusted for subsidies)
as at December 31, 1994
1994 Adjust 1994A
ASSETSCash and bank current accounts 2,500 2,500Interest-bearing deposits 7,000 7,000Loans outstandingCurrent 50,000 50,000Past due 29,500 29,500Restructured 500 500
Loans outstanding (gross) 70,000 70,000(Loan loss reserve) (5,000) (5,000)
Net loans outstanding 65,000 65,000Other current assets 1,000 1,000TOTAL CURRENT ASSETS 75,500 75,500
Long-term investments 11,000 11,000Property and equipment
Cost 4,000 4,000(Accumulated depreciation) (300) (300)
Net property and equipment 3,700 3,700TOTAL LONG-TERM ASSETS 14,700 14,700
TOTAL ASSETS 90,200 90,200
LIABILITIESShort-term borrowings (commercial rate) 12,000 12,000Client savings 0 0TOTAL CURRENT LIABILITIES 12,000 12,000
Long-term debt (commercial rate) 15,000 15,000Long-term debt (concessional rate) 30,000 30,000Restricted or deferred revenue 0 0TOTAL LIABILITIES 57,000 57,000
EQUITYLoan fund capital 33,000 33,000Accumulated capital—financial costs 0 2,100 2,100Accumulated capital—donation 0 950 950Retained net surplus (deficit) prior years 0 0Current-year net surplus (deficit) 200 (2,850) (2,850)TOTAL EQUITY 33,200 33,200
TOTAL LIABILITIES AND EQUITY 90,200 90,200
Source for unadjusted statements: SEEP Network and Calmeadow 1995.
Appendix 1. Sample Financial StatementsAdjusted for Subsidies
The following balance sheet represents an MFI’s finan-
cial position as at December 31, 1994, with adjustmentsfor subsidies (950 donation for operating costs and2,100 for imputed financial costs on concessionalloans).
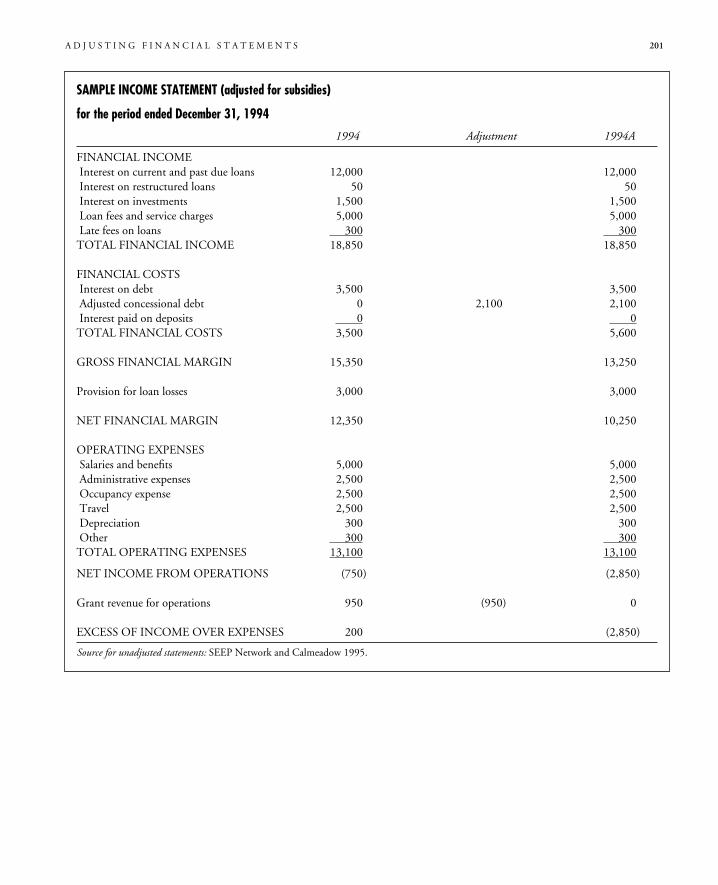
A D J U S T I N G F I N A N C I A L S T A T E M E N T S 201
SAMPLE INCOME STATEMENT (adjusted for subsidies)
for the period ended December 31, 1994
1994 Adjustment 1994A
FINANCIAL INCOMEInterest on current and past due loans 12,000 12,000Interest on restructured loans 50 50Interest on investments 1,500 1,500Loan fees and service charges 5,000 5,000Late fees on loans 300 300TOTAL FINANCIAL INCOME 18,850 18,850
FINANCIAL COSTSInterest on debt 3,500 3,500Adjusted concessional debt 0 2,100 2,100Interest paid on deposits 0 0TOTAL FINANCIAL COSTS 3,500 5,600
GROSS FINANCIAL MARGIN 15,350 13,250
Provision for loan losses 3,000 3,000
NET FINANCIAL MARGIN 12,350 10,250
OPERATING EXPENSESSalaries and benefits 5,000 5,000Administrative expenses 2,500 2,500Occupancy expense 2,500 2,500Travel 2,500 2,500Depreciation 300 300Other 300 300TOTAL OPERATING EXPENSES 13,100 13,100
NET INCOME FROM OPERATIONS (750) (2,850)
Grant revenue for operations 950 (950) 0
EXCESS OF INCOME OVER EXPENSES 200 (2,850)
Source for unadjusted statements: SEEP Network and Calmeadow 1995.
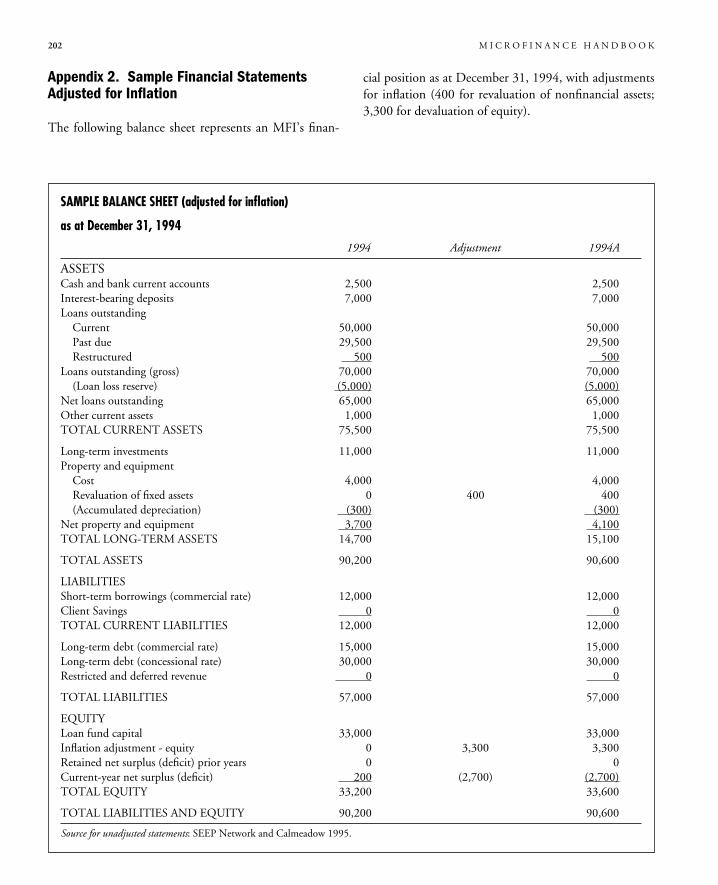
Appendix 2. Sample Financial StatementsAdjusted for Inflation
The following balance sheet represents an MFI’s finan-
cial position as at December 31, 1994, with adjustmentsfor inflation (400 for revaluation of nonfinancial assets;3,300 for devaluation of equity).
202 M I C R O F I N A N C E H A N D B O O K
SAMPLE BALANCE SHEET (adjusted for inflation)
as at December 31, 1994
1994 Adjustment 1994A
ASSETSCash and bank current accounts 2,500 2,500Interest-bearing deposits 7,000 7,000Loans outstanding
Current 50,000 50,000Past due 29,500 29,500Restructured 500 500
Loans outstanding (gross) 70,000 70,000(Loan loss reserve) (5,000) (5,000)
Net loans outstanding 65,000 65,000Other current assets 1,000 1,000TOTAL CURRENT ASSETS 75,500 75,500
Long-term investments 11,000 11,000Property and equipment
Cost 4,000 4,000Revaluation of fixed assets 0 400 400(Accumulated depreciation) (300) (300)
Net property and equipment 3,700 4,100TOTAL LONG-TERM ASSETS 14,700 15,100
TOTAL ASSETS 90,200 90,600
LIABILITIESShort-term borrowings (commercial rate) 12,000 12,000Client Savings 0 0TOTAL CURRENT LIABILITIES 12,000 12,000
Long-term debt (commercial rate) 15,000 15,000Long-term debt (concessional rate) 30,000 30,000Restricted and deferred revenue 0 0
TOTAL LIABILITIES 57,000 57,000
EQUITYLoan fund capital 33,000 33,000Inflation adjustment - equity 0 3,300 3,300Retained net surplus (deficit) prior years 0 0Current-year net surplus (deficit) 200 (2,700) (2,700)TOTAL EQUITY 33,200 33,600
TOTAL LIABILITIES AND EQUITY 90,200 90,600
Source for unadjusted statements: SEEP Network and Calmeadow 1995.
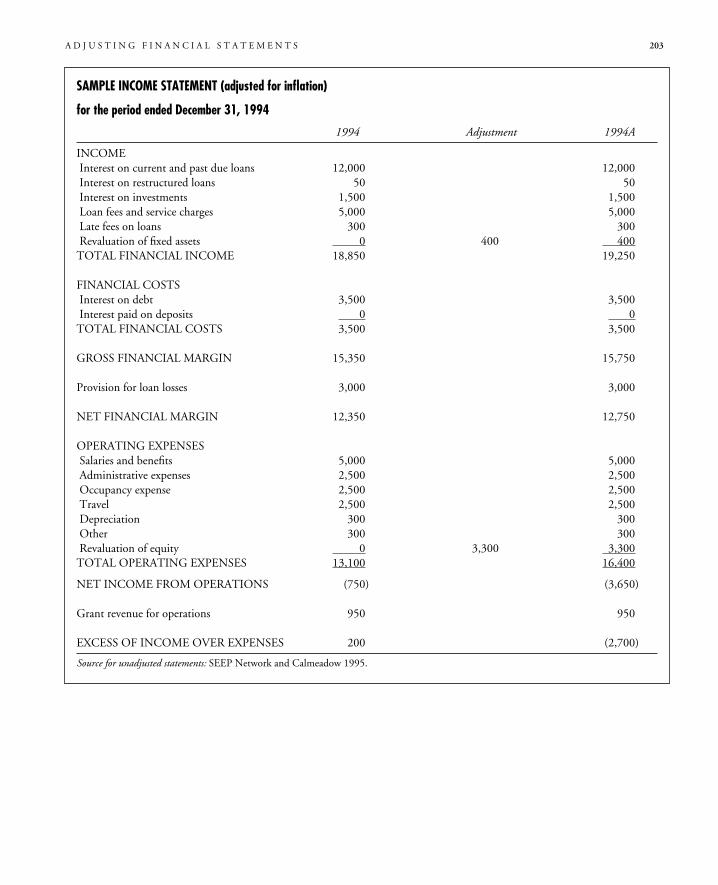
A D J U S T I N G F I N A N C I A L S T A T E M E N T S 203
SAMPLE INCOME STATEMENT (adjusted for inflation)
for the period ended December 31, 1994
1994 Adjustment 1994A
INCOMEInterest on current and past due loans 12,000 12,000Interest on restructured loans 50 50Interest on investments 1,500 1,500Loan fees and service charges 5,000 5,000Late fees on loans 300 300Revaluation of fixed assets 0 400 400TOTAL FINANCIAL INCOME 18,850 19,250
FINANCIAL COSTSInterest on debt 3,500 3,500Interest paid on deposits 0 0TOTAL FINANCIAL COSTS 3,500 3,500
GROSS FINANCIAL MARGIN 15,350 15,750
Provision for loan losses 3,000 3,000
NET FINANCIAL MARGIN 12,350 12,750
OPERATING EXPENSESSalaries and benefits 5,000 5,000Administrative expenses 2,500 2,500Occupancy expense 2,500 2,500Travel 2,500 2,500Depreciation 300 300Other 300 300Revaluation of equity 0 3,300 3,300TOTAL OPERATING EXPENSES 13,100 16,400
NET INCOME FROM OPERATIONS (750) (3,650)
Grant revenue for operations 950 950
EXCESS OF INCOME OVER EXPENSES 200 (2,700)
Source for unadjusted statements: SEEP Network and Calmeadow 1995.
Sources and Further Reading
Bartel, Margaret, Michael J. McCord, and Robin R. Bell.1994. Fundamentals of Accounting for Microcredit Programs.GEMINI Technical Note 6. Development AlternativesInc., Financial Assistance to Microenterprise Programs.Washington, D.C.: U.S. Agency for International Dev-elopment.
Christen, Robert Peck. 1997. Banking Services for the Poor:Managing for Financial Success. Washington, D.C.:ACCION International.
Eliot, Nicola. 1996. Basic Accounting for Credit and SavingsSchemes. London: Oxfam Basic Guides.
Goldschmidt, Yaaqov, Leon Shashua, and Jimmye S. Hillman.1986. The Impact of Inflation on Financial Activity inBusiness. Totowa, N.J.: Rowman and Allanheld.
Goldschmidt, Yaaqov, and Jacob Yaron. 1991. “InflationAdjustments of Financial Statements.” Policy Research
Working Paper 670. World Bank, Washington, D.C.Ledgerwood, Joanna. 1996. Financial Management Training for
Microfinance Organizations: Finance Study Guide. NewYork: PACT Publications (for Calmeadow).
Ledgerwood, Joanna, and Kerri Moloney. 1996. FinancialManagement Training for Microfinance Organizations:Accounting Study Guide. Toronto: Calmeadow.
SEEP (Small Enterprise Education and Promotion) Networkand Calmeadow. 1995. Financial Ratio Analysis ofMicroFinance Institutions. New York: PACT Publications.
Stearns, Katherine. 1991. The Hidden Beast: Delinquency inMicroenterprise Programs. Washington, D.C.: ACCIONInternational.
Yaron, Jacob. 1992. Assessing Development Finance Institutions:A Public Interest Analysis. World Bank Discussion Paper174. Washington, D.C.
———. 1994. “The Assessment and Measurement of LoanCollections and Loan Recovery.” World Bank, Agricultureand Natural Resources Department, Washington, D.C.
204 M I C R O F I N A N C E H A N D B O O K
205
PerformanceIndicators
C H A P T E R N I N E
Effective financial management requires periodicanalysis of financial performance. Performance indi-cators collect and restate financial data to provide
useful information about the financial performance of anMFI. By calculating performance indicators, donors, practi-tioners, and consultants can determine the efficiency, viabil-ity, and outreach of MFI operations.
Performance indicators usually are in the form ofratios, that is, a comparison of one piece of financial datato another. Comparing ratios over a period of time isreferred to as trend analysis, which shows whether financialperformance is improving or deteriorating. In addition totrend analysis, ratios should be analyzed in the context ofother ratios to determine the overall financial performanceof an MFI. Calculating ratios does not in itself result inimproved financial performance. However, analysis of theperformance indicators (ratios) and changes to providesinformation that can identify potential or existing prob-lems, which can lead to changes in policies or operations,which in turn may improve financial performance. (Thisis discussed further in chapter 10.)
The performance indicators presented here are orga-nized into six areas:� Portfolio quality� Productivity and efficiency� Financial viability� Profitability� Leverage and capital adequacy� Scale, outreach, and growth.
Each of these performance indicators was chosenbecause they are useful in managing MFIs. Many ofthem (including financial viability, profitability, leverageand capital adequacy ratios, and scale, outreach, andgrowth) are also useful for external parties, such as
investors or donors. There are many other useful indica-tors. The ones presented here are considered to be theminimum set of performance indicators that an MFImight use to guide its financial management.
This chapter presents performance indicators thatprovide information about different areas of MFI opera-tions. It will be of interest to readers who are evaluatingthe financial performance and outreach of an MFI.Practitioners will be able to use the performance indica-tors to determine how well they are doing financiallyand to establish future performance goals. Donors orconsultants can also determine whether the MFIs thatthey are supporting or evaluating are achieving plannedresults. Furthermore, donors may recognize perfor-mance indicators that are useful for the financial man-agement of MFIs and may consequently require thatthose ratios be incorporated into the reports submittedby MFIs. In this way, donor reporting can also benefitMFI internal management.
A balance sheet, income statement, and portfolioreport are required to construct the ratios presented inthis chapter. (If the reader is not familiar with howfinancial statements are created, see Ledgerwood andMoloney 1996.) Performance indicators are calculatedonce financial statements have been adjusted to reflectgenerally accepted accounting principles as presented inchapter 8.
At the end of each section ratios are calculated for athree-year period using the sample financial statementsand portfolio report found in appendixes 1, 2, and 3 ofthis chapter. Note that these sample financial state-ments are not adjusted for subsidies and inflation (butdo accurately reflect portfolio quality, depreciation, andaccrued interest and expenses) as discussed in chapter 8.
206 M I C R O F I N A N C E H A N D B O O K
This is because, with the exception of the profitabilityratios, the ratios presented here are either not affectedby subsidies or inflation (portfolio quality, productivity,and efficiency ratios) or consider subsidies and inflationin the formulas (financial viability ratios). (For simplici-ty’s sake, we have assumed that no in-kind donationswere provided. Therefore, all operating costs incurredare recorded on the income statement. Donations arenot included in any ratios that consider earned rev-enue.) For the profitability ratios only, one year ofratios is calculated using the adjusted statements fromchapter 8.
Some readers may be looking for a standard range ofperformance for each of the ratios. Given the small num-ber of MFIs that measure their financial performancetaking into account the necessary adjustments, it is pre-mature to provide ranges. As time goes on, however,more MFIs will begin to measure their performance inaccordance with generally accepted accounting princi-ples. As the number of comparative organizationsincreases, standard ranges will likely be established. Thelast section of this chapter, on performance standardsand variations, provides an overview of four of the mostwell-known performance analysis systems currently usedin the microfinance industry.
In analyses of performance indicators, there are con-textual factors that must be considered, such as the geo-graphical context (appropriate benchmarks in LatinAmerica are not necessarily adequate for Asia and Africa),the maturity of the institution (younger institutions maybe incurring expansion costs without commensurate rev-enue and should not be compared to mature institu-tions), and the varying lending approaches that are usedaround the world. All of these factors greatly influenceperformance indicators. Hence, their primary use should(for now) be for internal management of the MFI.Although both practitioners and donors will (and tosome extent should) compare institutions, performanceindicators must be put in the context of where and howthe different MFIs are operating.
Finally, it is important to consider that the majorityof these performance indicators are based on the assump-tion that most MFIs are primarily lending institutions.Hence, while managing liabilities is an important part offinancial management, the focus here is on effective asset
management. Where relevant, the effect of savings mobi-lization has been taken into account.1
Portfolio Quality
Portfolio quality ratios provide information on the per-centage of nonearning assets, which in turn decrease therevenue and liquidity position of an MFI. Various ratiosare used to measure portfolio quality and to provideother information about the portfolio (even though theyare all referred to here as “portfolio quality” ratios). Theratios are divided into three areas:� Repayment rates� Portfolio quality ratios� Loan loss ratios.
Repayment Rates
Although the repayment rate is a popular measure usedby donors and MFIs, it does not in fact indicate thequality of the loan portfolio (that is, the amount of riskin the current outstanding portfolio). Rather, the repay-ment rate measures the historical rate of loan recovery.
Repayment rates measure the amount of paymentsreceived with respect to the amount due, whereas otherratios indicate the quality of the current outstandingportfolio (see the arrears rate and the portfolio at riskrate discussed below). This is not to say that the repay-ment rate is not useful—it is a good measure for moni-toring repayment performance over time (if it iscalculated correctly and in a consistent manner). It isalso useful for projecting future cash flow, because itindicates what percentage of the amount due can beexpected to be received, based on past experience.
However, MFIs should not use the repayment rate toindicate the current quality of the outstanding portfolioand are discouraged from using it as an external indica-tor of success or as a comparative measure with otherorganizations. It is only possible to compare repaymentrates of different organizations (or any other ratios infact) if they are calculated in exactly the same mannerand for the same period.
Repayment rates are particularly misleading if theMFI portfolio is growing rapidly and if loan terms are
1. Portions of this chapter are based on material originally published in Ledgerwood (1996).
P E R F O R M A N C E I N D I C A T O R S 207
long. This is because the percentage that has becomedue (the numerator) compared with the amount dis-bursed or the amount outstanding (the denominator) isrelatively low, which means that a delinquency problem,in fact, may not show up right away.
There are many variations used to calculate repay-ment rates, which is why it is difficult to use as an indi-cator of success unless the exact method of calculation isknown and understood. For example, if an MFI mea-sures the repayment rate based only on loans made in acertain period—say, the previous month—the repay-ment rate may be very high, even though the number ofloans and the portfolio at risk in the total outstandingportfolio may also be high but are simply not includedbecause they are loans from previous months. SomeMFIs calculate the repayment rate based on the amountdisbursed, while others calculate it based on the amountstill outstanding. For the most part, MFIs tend to usethe amount received as the numerator and the amountexpected as the denominator, with some variation.
Some MFIs calculate the repayment rate as follows:
This formula overstates the amount received by theprepayments and the amount received on past due loans(because it does not include past due amounts in thedenominator). This is why repayment rates can some-times be greater than 100 percent. This formula does notprovide useful information about the ongoing perfor-mance of the portfolio and should not be used. Instead,two other formulas are suggested:
or
These formulas remove the effect of prepayments andshow the actual rate of received payments against expect-
ed payments either on time or taking into account pastdue amounts.
Portfolio Quality Ratios
Three ratios are suggested here to measure portfolio qual-ity: the arrears rate, the portfolio at risk, and the ratio ofdelinquent borrowers.
Arrears represent the amount of loan principal that hasbecome due and has not been received. Arrears generallydo not include interest; however, if the MFI records theinterest owing as an asset (for more on capitalized interestsee chapter 8) at the time the loan is disbursed, it shouldalso include interest in the amount of arrears. The arrearsrate provides an indication of the risk that a loan will notbe repaid.
ARREARS RATE. The arrears rate is the ratio of overdueloan principal (or principal plus interest) to the portfoliooutstanding:
(Some organizations calculate the arrears rate as 1minus the repayment rate. This works only if the repay-ment rate on the entire portfolio outstanding is consid-ered, including past-due amounts, and not just for acertain period of loan disbursements).
The arrears rate shows how much of the loan hasbecome due and has not been received. However, thearrears rate understates the risk to the portfolio andunderstates the potential severity of a delinquency prob-lem, because it only considers payments as they becomepast due, not the entire amount of the loan outstandingthat is actually at risk.� For example, a client who borrows 1,000 for petty
trading for 12 months at 15 percent interest on thedeclining balance must repay 90 per month (madeup of approximately 83 principal and 7 interest). Ifshe misses the first three months of payments, theamount past due is 270 (249 principal and 21 inter-est). Accordingly, the arrears rate would be approxi-mately 25 percent:
Arrears rate249
1,000=
= 25%
Arrears rate Amount in arrearsPortfolio outstanding
(including amounts past due)
=
Repayment rateincluding past dueamounts
Collection on current amounts due plus past due less prepayments
Total current amounts dueplus past due amounts
=
On-time repayment rate
Collection on current amounts due less prepayments
Total current amounts due=
Repayment rate
Amount received(including prepaymentsand past due amounts)
Amount due(excluding past due amounts)
=
208 M I C R O F I N A N C E H A N D B O O K
Since no payments have been received, the trueamount at risk is the full amount of the loan (1,000or 100 percent), not 249. A more conservative formu-la to use to calculate risk is the portfolio at risk rate.
PORTFOLIO AT RISK. The portfolio at risk refers to theoutstanding balance of all loans that have an amountoverdue. Portfolio at risk is different from arrears becauseit considers the amount in arrears plus the remainingoutstanding balance of the loan.
The portfolio at risk ratio is calculated as follows:
The portfolio at risk ratio reflects the true risk of a delin-quency problem because it considers the full amount of theloan at risk—this is particularly important when the loanpayments are small and loan terms are long. (Some MFIschoose to declare a loan at risk only after a specific numberof days have passed since the payment became due and hasnot been received, based on the fact that many clients areable to make their loan payments within a few days of thedue date. By calculating the portfolio at risk rate on a peri-odic basis, MFIs can determine whether delinquency isimproving or deteriorating. Portfolio at risk can be calculat-ed for an MFI as a whole, for a region, a branch, a creditofficer, or by sector (loan purpose or geographic).
Tables 9.1 and 9.2 show the difference between thecalculation of the arrears rate and the portfolio at risk forthe same organization. The information in both tables isexactly the same with the exception of the aged amountsbeing either arrears (table 9.1) or portfolio at risk (table9.2). Note the difference in arrears as a percentage ofoutstanding loans (6.8 percent) and the portfolio at risk asa percentage of outstanding loans (19.8 percent).
DELINQUENT BORROWERS. As a further indication ofportfolio quality, it is useful to determine the numberof borrowers who are delinquent relative to the vol-ume of delinquent loans. If there is variation in thesize of the loans disbursed, it is helpful to knowwhether the larger or smaller loans result in greaterdelinquency. If the ratio of delinquent borrowers islower than the portfolio at risk or the arrears rate,then it is likely that larger loans are more problematicthan smaller ones.
� For example, if an MFI has a portfolio at risk of 20percent and the ratio of delinquent borrowers to totalborrowers is 5 percent, it will know that the delin-quency problem lies mostly with larger borrowers.In determining the number of delinquent borrowers it
is also useful to see whether more loans are becoming delin-quent at the beginning of the loan cycle or toward the end.
DEFINING DELINQUENCY. The policy used by an MFI todefine delinquent loans directly influences the portfolio
Delinquent borrowers
Number of delinquent borrowers
Total number of active borrowers=
Portfolio at risk
Outstanding balance of loans with payments past due
Portfolio outstanding (including amounts past due)=
Box 9.1 Repayment Rates Compared with PortfolioQuality RatiosPROJECT DUNGGANON WAS CREATED IN OCTOBER 1989by the Negros Women for Tomorrow Foundation. It isone of the most active Grameen Bank replicators in thePhilippines. As of April 1995 there was 5,953 active bor-rowers. Total loans outstanding was 4.4 million pesos(US$174,000) and total savings collected in the GroupFund was 3.3 million pesos.
Project Dungganon has historically recorded repaymentrates ranging from 94 to 99 percent, calculated by dividingthe amount received by the amount expected for eachmonth. (The repayment rate does not include any past-dueloan amounts in the denominator and does include prepay-ments in the numerator.) However, when further analysisof Dungganon’s portfolio was completed, it was found that32 percent or 1.5 million pesos (US$58,000) of the totaloutstanding loans in April 1995 was in arrears, the majorityof them for more than two years.
Because the focus had been on the high repaymentrate, Project Dungganon was touted as one of the mostsuccessful Grameen replicators. In fact, if it had contin-ued to operate with such poor loan portfolio quality, itwould have eventually gone out of business!
In April 1995 Project Dungganon began calculatingportfolio quality ratios, realized its portfolio quality waspoor, and implemented highly effective delinquency man-agement techniques. As of August 1997 Dungganonreported a portfolio at risk of 16 percent over 30 days (yetcontinued to report a repayment rate of 99.4 percent). InJune 1997 it wrote off 5 percent of its portfolio.
Source: Ledgerwood 1995 and discussion with Briget Helms,CGAP, World Bank.
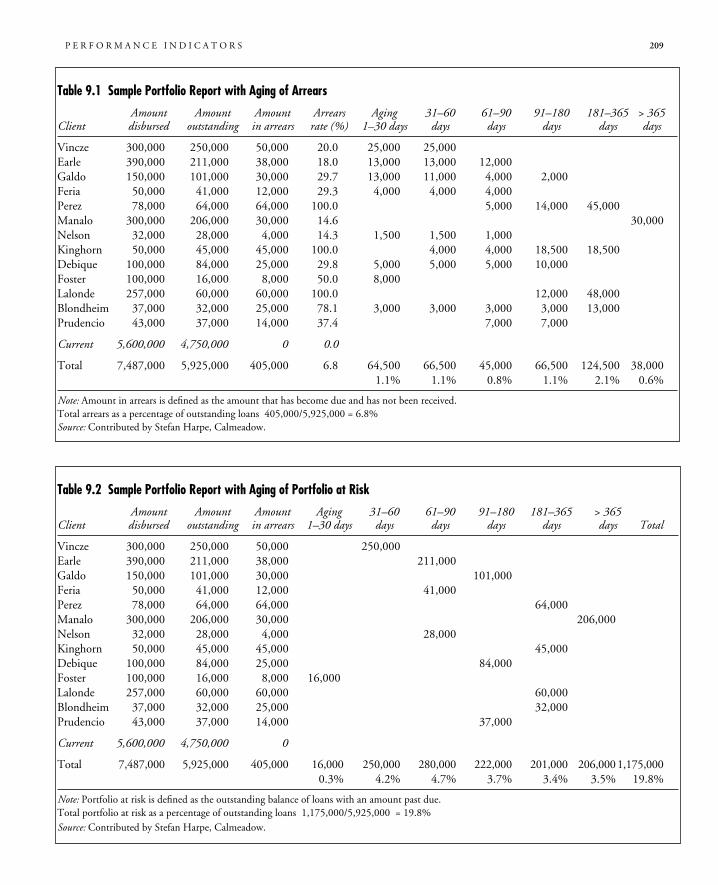
P E R F O R M A N C E I N D I C A T O R S 209
Table 9.1 Sample Portfolio Report with Aging of Arrears
Amount Amount Amount Arrears Aging 31–60 61–90 91–180 181–365 > 365Client disbursed outstanding in arrears rate (%) 1–30 days days days days days days
Vincze 300,000 250,000 50,000 20.0 25,000 25,000Earle 390,000 211,000 38,000 18.0 13,000 13,000 12,000Galdo 150,000 101,000 30,000 29.7 13,000 11,000 4,000 2,000Feria 50,000 41,000 12,000 29.3 4,000 4,000 4,000Perez 78,000 64,000 64,000 100.0 5,000 14,000 45,000Manalo 300,000 206,000 30,000 14.6 30,000Nelson 32,000 28,000 4,000 14.3 1,500 1,500 1,000Kinghorn 50,000 45,000 45,000 100.0 4,000 4,000 18,500 18,500Debique 100,000 84,000 25,000 29.8 5,000 5,000 5,000 10,000Foster 100,000 16,000 8,000 50.0 8,000Lalonde 257,000 60,000 60,000 100.0 12,000 48,000Blondheim 37,000 32,000 25,000 78.1 3,000 3,000 3,000 3,000 13,000Prudencio 43,000 37,000 14,000 37.4 7,000 7,000
Current 5,600,000 4,750,000 0 0.0
Total 7,487,000 5,925,000 405,000 6.8 64,500 66,500 45,000 66,500 124,500 38,0001.1% 1.1% 0.8% 1.1% 2.1% 0.6%
Note: Amount in arrears is defined as the amount that has become due and has not been received.Total arrears as a percentage of outstanding loans 405,000/5,925,000 = 6.8%Source: Contributed by Stefan Harpe, Calmeadow.
Table 9.2 Sample Portfolio Report with Aging of Portfolio at Risk
Amount Amount Amount Aging 31–60 61–90 91–180 181–365 > 365Client disbursed outstanding in arrears 1–30 days days days days days days Total
Vincze 300,000 250,000 50,000 250,000Earle 390,000 211,000 38,000 211,000Galdo 150,000 101,000 30,000 101,000Feria 50,000 41,000 12,000 41,000Perez 78,000 64,000 64,000 64,000Manalo 300,000 206,000 30,000 206,000Nelson 32,000 28,000 4,000 28,000Kinghorn 50,000 45,000 45,000 45,000Debique 100,000 84,000 25,000 84,000Foster 100,000 16,000 8,000 16,000Lalonde 257,000 60,000 60,000 60,000Blondheim 37,000 32,000 25,000 32,000Prudencio 43,000 37,000 14,000 37,000
Current 5,600,000 4,750,000 0
Total 7,487,000 5,925,000 405,000 16,000 250,000 280,000 222,000 201,000 206,0001,175,0000.3% 4.2% 4.7% 3.7% 3.4% 3.5% 19.8%
Note: Portfolio at risk is defined as the outstanding balance of loans with an amount past due.Total portfolio at risk as a percentage of outstanding loans 1,175,000/5,925,000 = 19.8%Source: Contributed by Stefan Harpe, Calmeadow.
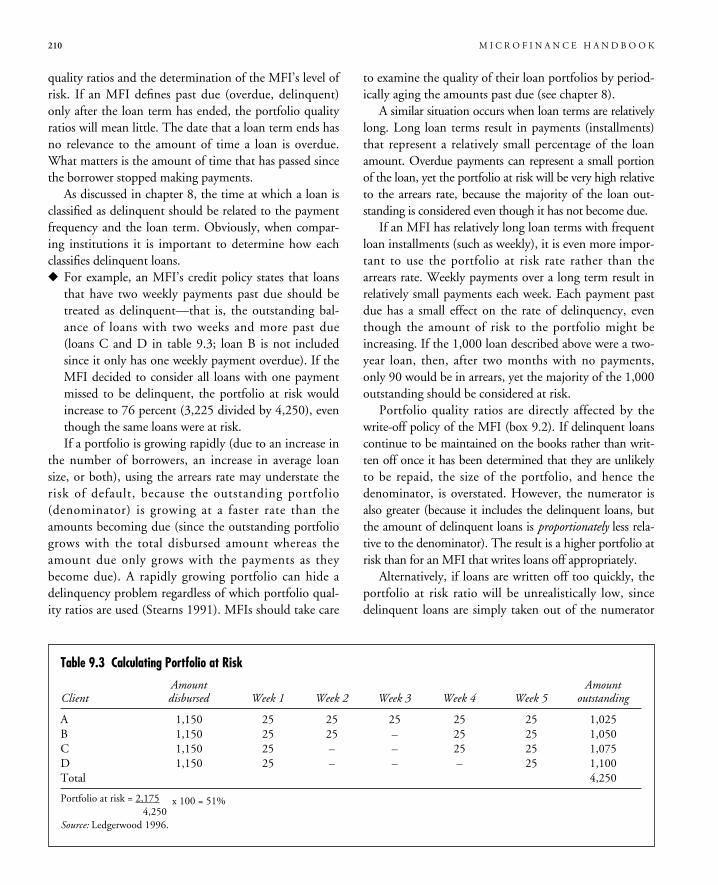
quality ratios and the determination of the MFI’s level ofrisk. If an MFI defines past due (overdue, delinquent)only after the loan term has ended, the portfolio qualityratios will mean little. The date that a loan term ends hasno relevance to the amount of time a loan is overdue.What matters is the amount of time that has passed sincethe borrower stopped making payments.
As discussed in chapter 8, the time at which a loan isclassified as delinquent should be related to the paymentfrequency and the loan term. Obviously, when compar-ing institutions it is important to determine how eachclassifies delinquent loans.� For example, an MFI’s credit policy states that loans
that have two weekly payments past due should betreated as delinquent—that is, the outstanding bal-ance of loans with two weeks and more past due(loans C and D in table 9.3; loan B is not includedsince it only has one weekly payment overdue). If theMFI decided to consider all loans with one paymentmissed to be delinquent, the portfolio at risk wouldincrease to 76 percent (3,225 divided by 4,250), eventhough the same loans were at risk.If a portfolio is growing rapidly (due to an increase in
the number of borrowers, an increase in average loansize, or both), using the arrears rate may understate therisk of default, because the outstanding portfolio(denominator) is growing at a faster rate than theamounts becoming due (since the outstanding portfoliogrows with the total disbursed amount whereas theamount due only grows with the payments as theybecome due). A rapidly growing portfolio can hide adelinquency problem regardless of which portfolio qual-ity ratios are used (Stearns 1991). MFIs should take care
to examine the quality of their loan portfolios by period-ically aging the amounts past due (see chapter 8).
A similar situation occurs when loan terms are relativelylong. Long loan terms result in payments (installments)that represent a relatively small percentage of the loanamount. Overdue payments can represent a small portionof the loan, yet the portfolio at risk will be very high relativeto the arrears rate, because the majority of the loan out-standing is considered even though it has not become due.
If an MFI has relatively long loan terms with frequentloan installments (such as weekly), it is even more impor-tant to use the portfolio at risk rate rather than thearrears rate. Weekly payments over a long term result inrelatively small payments each week. Each payment pastdue has a small effect on the rate of delinquency, eventhough the amount of risk to the portfolio might beincreasing. If the 1,000 loan described above were a two-year loan, then, after two months with no payments,only 90 would be in arrears, yet the majority of the 1,000outstanding should be considered at risk.
Portfolio quality ratios are directly affected by thewrite-off policy of the MFI (box 9.2). If delinquent loanscontinue to be maintained on the books rather than writ-ten off once it has been determined that they are unlikelyto be repaid, the size of the portfolio, and hence thedenominator, is overstated. However, the numerator isalso greater (because it includes the delinquent loans, butthe amount of delinquent loans is proportionately less rela-tive to the denominator). The result is a higher portfolio atrisk than for an MFI that writes loans off appropriately.
Alternatively, if loans are written off too quickly, theportfolio at risk ratio will be unrealistically low, sincedelinquent loans are simply taken out of the numerator
210 M I C R O F I N A N C E H A N D B O O K
Table 9.3 Calculating Portfolio at Risk
Amount AmountClient disbursed Week 1 Week 2 Week 3 Week 4 Week 5 outstanding
A 1,150 25 25 25 25 25 1,025B 1,150 25 25 – 25 25 1,050C 1,150 25 – – 25 25 1,075D 1,150 25 – – – 25 1,100Total 4,250
Portfolio at risk = 2,1754,250
x 100 = 51%
Source: Ledgerwood 1996.
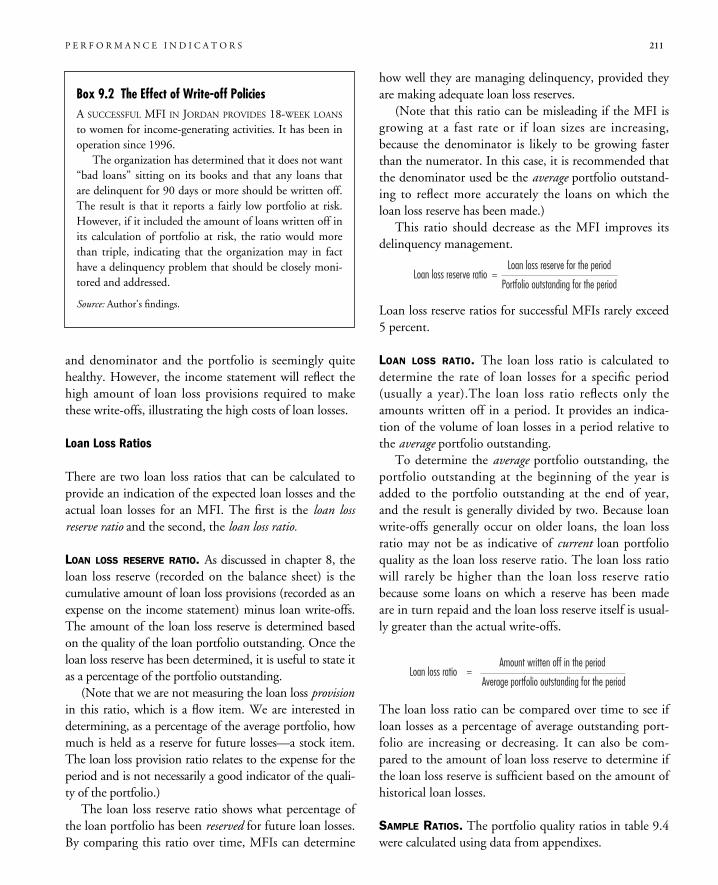
P E R F O R M A N C E I N D I C A T O R S 211
and denominator and the portfolio is seemingly quitehealthy. However, the income statement will reflect thehigh amount of loan loss provisions required to makethese write-offs, illustrating the high costs of loan losses.
Loan Loss Ratios
There are two loan loss ratios that can be calculated toprovide an indication of the expected loan losses and theactual loan losses for an MFI. The first is the loan lossreserve ratio and the second, the loan loss ratio.
LOAN LOSS RESERVE RATIO. As discussed in chapter 8, theloan loss reserve (recorded on the balance sheet) is thecumulative amount of loan loss provisions (recorded as anexpense on the income statement) minus loan write-offs.The amount of the loan loss reserve is determined basedon the quality of the loan portfolio outstanding. Once theloan loss reserve has been determined, it is useful to state itas a percentage of the portfolio outstanding.
(Note that we are not measuring the loan loss provisionin this ratio, which is a flow item. We are interested indetermining, as a percentage of the average portfolio, howmuch is held as a reserve for future losses—a stock item.The loan loss provision ratio relates to the expense for theperiod and is not necessarily a good indicator of the quali-ty of the portfolio.)
The loan loss reserve ratio shows what percentage ofthe loan portfolio has been reserved for future loan losses.By comparing this ratio over time, MFIs can determine
how well they are managing delinquency, provided theyare making adequate loan loss reserves.
(Note that this ratio can be misleading if the MFI isgrowing at a fast rate or if loan sizes are increasing,because the denominator is likely to be growing fasterthan the numerator. In this case, it is recommended thatthe denominator used be the average portfolio outstand-ing to reflect more accurately the loans on which theloan loss reserve has been made.)
This ratio should decrease as the MFI improves itsdelinquency management.
Loan loss reserve ratios for successful MFIs rarely exceed5 percent.
LOAN LOSS RATIO. The loan loss ratio is calculated todetermine the rate of loan losses for a specific period(usually a year).The loan loss ratio reflects only theamounts written off in a period. It provides an indica-tion of the volume of loan losses in a period relative tothe average portfolio outstanding.
To determine the average portfolio outstanding, theportfolio outstanding at the beginning of the year isadded to the portfolio outstanding at the end of year,and the result is generally divided by two. Because loanwrite-offs generally occur on older loans, the loan lossratio may not be as indicative of current loan portfolioquality as the loan loss reserve ratio. The loan loss ratiowill rarely be higher than the loan loss reserve ratiobecause some loans on which a reserve has been madeare in turn repaid and the loan loss reserve itself is usual-ly greater than the actual write-offs.
The loan loss ratio can be compared over time to see ifloan losses as a percentage of average outstanding port-folio are increasing or decreasing. It can also be com-pared to the amount of loan loss reserve to determine ifthe loan loss reserve is sufficient based on the amount ofhistorical loan losses.
SAMPLE RATIOS. The portfolio quality ratios in table 9.4were calculated using data from appendixes.
Loan loss ratio =Amount written off in the period
Average portfolio outstanding for the period
Loan loss reserve ratio =
Loan loss reserve for the period
Portfolio outstanding for the period
Box 9.2 The Effect of Write-off PoliciesA SUCCESSFUL MFI IN JORDAN PROVIDES 18-WEEK LOANS
to women for income-generating activities. It has been inoperation since 1996.
The organization has determined that it does not want“bad loans” sitting on its books and that any loans thatare delinquent for 90 days or more should be written off.The result is that it reports a fairly low portfolio at risk.However, if it included the amount of loans written off inits calculation of portfolio at risk, the ratio would morethan triple, indicating that the organization may in facthave a delinquency problem that should be closely moni-tored and addressed.
Source: Author’s findings.
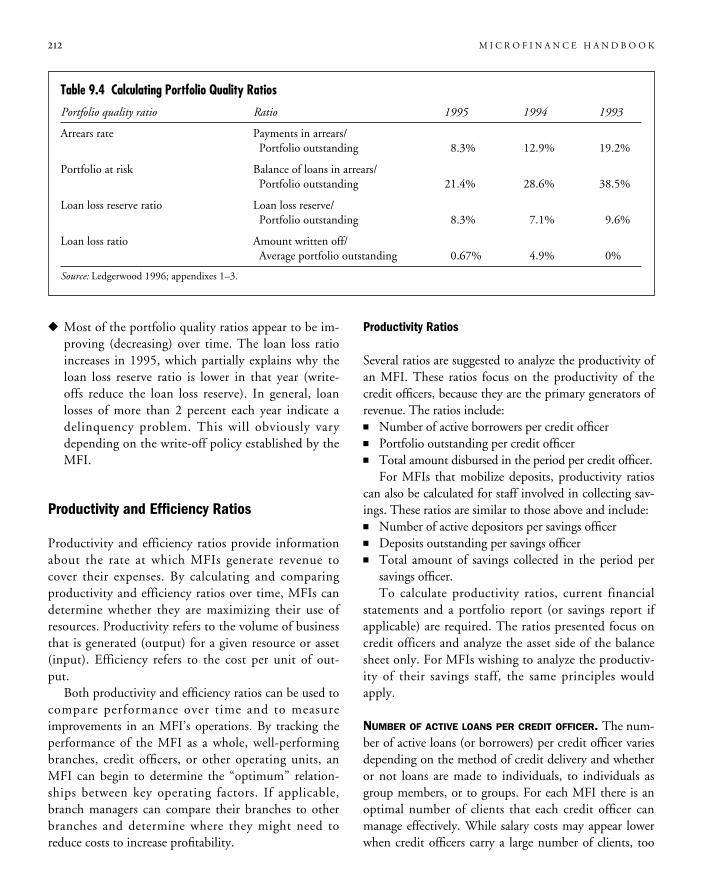
212 M I C R O F I N A N C E H A N D B O O K
� Most of the portfolio quality ratios appear to be im-proving (decreasing) over time. The loan loss ratioincreases in 1995, which partially explains why theloan loss reserve ratio is lower in that year (write-offs reduce the loan loss reserve). In general, loanlosses of more than 2 percent each year indicate adelinquency problem. This will obviously varydepending on the write-off policy established by theMFI.
Productivity and Efficiency Ratios
Productivity and efficiency ratios provide informationabout the rate at which MFIs generate revenue tocover their expenses. By calculating and comparingproductivity and efficiency ratios over time, MFIs candetermine whether they are maximizing their use ofresources. Productivity refers to the volume of businessthat is generated (output) for a given resource or asset(input). Efficiency refers to the cost per unit of out-put.
Both productivity and efficiency ratios can be used tocompare performance over time and to measureimprovements in an MFI’s operations. By tracking theperformance of the MFI as a whole, well-performingbranches, credit officers, or other operating units, anMFI can begin to determine the “optimum” relation-ships between key operating factors. If applicable,branch managers can compare their branches to otherbranches and determine where they might need toreduce costs to increase profitability.
Productivity Ratios
Several ratios are suggested to analyze the productivity ofan MFI. These ratios focus on the productivity of thecredit officers, because they are the primary generators ofrevenue. The ratios include:� Number of active borrowers per credit officer� Portfolio outstanding per credit officer� Total amount disbursed in the period per credit officer.
For MFIs that mobilize deposits, productivity ratioscan also be calculated for staff involved in collecting sav-ings. These ratios are similar to those above and include:� Number of active depositors per savings officer� Deposits outstanding per savings officer� Total amount of savings collected in the period per
savings officer.To calculate productivity ratios, current financial
statements and a portfolio report (or savings report ifapplicable) are required. The ratios presented focus oncredit officers and analyze the asset side of the balancesheet only. For MFIs wishing to analyze the productiv-ity of their savings staff, the same principles wouldapply.
NUMBER OF ACTIVE LOANS PER CREDIT OFFICER. The num-ber of active loans (or borrowers) per credit officer variesdepending on the method of credit delivery and whetheror not loans are made to individuals, to individuals asgroup members, or to groups. For each MFI there is anoptimal number of clients that each credit officer canmanage effectively. While salary costs may appear lowerwhen credit officers carry a large number of clients, too
Table 9.4 Calculating Portfolio Quality Ratios
Portfolio quality ratio Ratio 1995 1994 1993
Arrears rate Payments in arrears/Portfolio outstanding 8.3% 12.9% 19.2%
Portfolio at risk Balance of loans in arrears/Portfolio outstanding 21.4% 28.6% 38.5%
Loan loss reserve ratio Loan loss reserve/Portfolio outstanding 8.3% 7.1% 9.6%
Loan loss ratio Amount written off/Average portfolio outstanding 0.67% 4.9% 0%
Source: Ledgerwood 1996; appendixes 1–3.
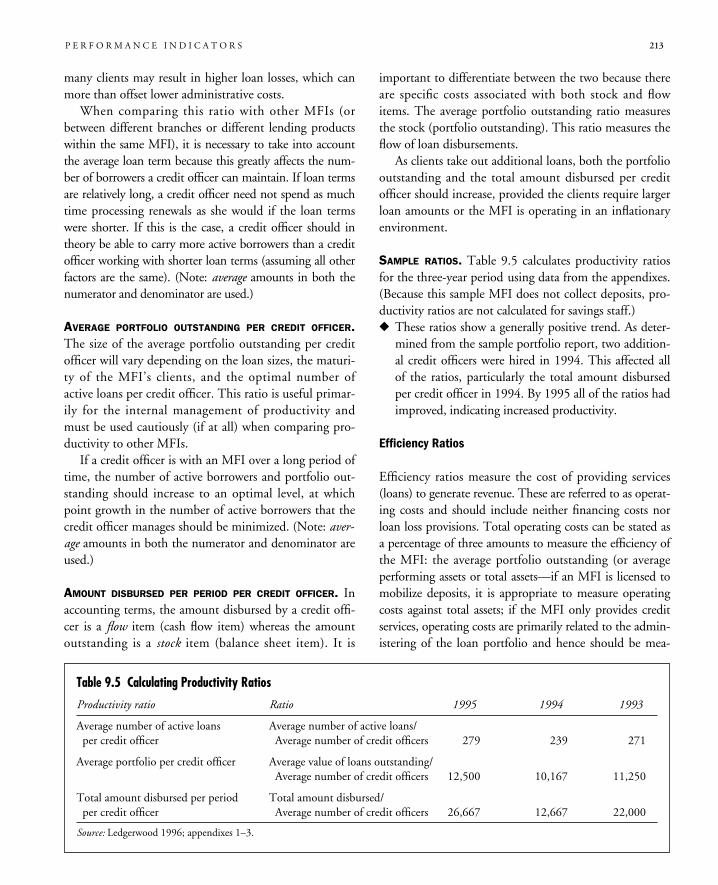
many clients may result in higher loan losses, which canmore than offset lower administrative costs.
When comparing this ratio with other MFIs (orbetween different branches or different lending productswithin the same MFI), it is necessary to take into accountthe average loan term because this greatly affects the num-ber of borrowers a credit officer can maintain. If loan termsare relatively long, a credit officer need not spend as muchtime processing renewals as she would if the loan termswere shorter. If this is the case, a credit officer should intheory be able to carry more active borrowers than a creditofficer working with shorter loan terms (assuming all otherfactors are the same). (Note: average amounts in both thenumerator and denominator are used.)
AVERAGE PORTFOLIO OUTSTANDING PER CREDIT OFFICER.The size of the average portfolio outstanding per creditofficer will vary depending on the loan sizes, the maturi-ty of the MFI’s clients, and the optimal number ofactive loans per credit officer. This ratio is useful primar-ily for the internal management of productivity andmust be used cautiously (if at all) when comparing pro-ductivity to other MFIs.
If a credit officer is with an MFI over a long period oftime, the number of active borrowers and portfolio out-standing should increase to an optimal level, at whichpoint growth in the number of active borrowers that thecredit officer manages should be minimized. (Note: aver-age amounts in both the numerator and denominator areused.)
AMOUNT DISBURSED PER PERIOD PER CREDIT OFFICER. Inaccounting terms, the amount disbursed by a credit offi-cer is a flow item (cash flow item) whereas the amountoutstanding is a stock item (balance sheet item). It is
important to differentiate between the two because thereare specific costs associated with both stock and flowitems. The average portfolio outstanding ratio measuresthe stock (portfolio outstanding). This ratio measures theflow of loan disbursements.
As clients take out additional loans, both the portfoliooutstanding and the total amount disbursed per creditofficer should increase, provided the clients require largerloan amounts or the MFI is operating in an inflationaryenvironment.
SAMPLE RATIOS. Table 9.5 calculates productivity ratiosfor the three-year period using data from the appendixes.(Because this sample MFI does not collect deposits, pro-ductivity ratios are not calculated for savings staff.)� These ratios show a generally positive trend. As deter-
mined from the sample portfolio report, two addition-al credit officers were hired in 1994. This affected allof the ratios, particularly the total amount disbursedper credit officer in 1994. By 1995 all of the ratios hadimproved, indicating increased productivity.
Efficiency Ratios
Efficiency ratios measure the cost of providing services(loans) to generate revenue. These are referred to as operat-ing costs and should include neither financing costs norloan loss provisions. Total operating costs can be stated asa percentage of three amounts to measure the efficiency ofthe MFI: the average portfolio outstanding (or averageperforming assets or total assets—if an MFI is licensed tomobilize deposits, it is appropriate to measure operatingcosts against total assets; if the MFI only provides creditservices, operating costs are primarily related to the admin-istering of the loan portfolio and hence should be mea-
P E R F O R M A N C E I N D I C A T O R S 213
Table 9.5 Calculating Productivity Ratios
Productivity ratio Ratio 1995 1994 1993
Average number of active loans Average number of active loans/per credit officer Average number of credit officers 279 239 271
Average portfolio per credit officer Average value of loans outstanding/Average number of credit officers 12,500 10,167 11,250
Total amount disbursed per period Total amount disbursed/per credit officer Average number of credit officers 26,667 12,667 22,000
Source: Ledgerwood 1996; appendixes 1–3.
214 M I C R O F I N A N C E H A N D B O O K
sured against the average portfolio outstanding) per unit ofcurrency lent, or per loan made.
For a more detailed analysis, operating costs can alsobe broken down to measure the efficiency of specificcost elements such as salaries and benefits, occupationalexpenses such as rent and utilities, or travel. Sincesalaries and benefits generally make up the largest por-tion of operating costs, the ratio of salaries and benefitsto the average portfolio outstanding is often calculated,as well as the average credit officer salary with the coun-try’s per capita GDP. Other breakdowns are not be pre-sented here but can be easily calculated depending onthe objectives of the analyst.
For MFIs that mobilize deposits, efficiency ratios willbe somewhat lower because additional operating costs areincurred to collect deposits. Therefore, efficiency ratiosof MFIs that collect deposits should not be compared toMFIs that do not collect deposits. This analysis focusesonly on the credit operations.
In analyzing the credit operations of an MFI, two keyfactors influence the level of activity and hence operatingcosts and efficiency: the turnover of the loan portfolioand the average loan size (Bartel, McCord, and Bell1995). The impact of these two factors and the corre-sponding efficiency of operations can be analyzed bylooking at operating costs as a percentage of portfoliooutstanding and at the costs associated with lending on aper unit of currency basis or a per loan basis.
OPERATING COST RATIO. The operating cost ratio providesan indication of the efficiency of the lending operations(sometimes referred to as the efficiency indicator). Thisratio is affected by increasing or decreasing operationalcosts relative to the average portfolio.
Successful MFIs tend to have operating cost ratiosof between 13 and 21 percent of their average loanportfolios and between 5 and 16 percent of their aver-age total assets (Christen and others 1995).
SALARIES AND BENEFITS TO AVERAGE PORTFOLIO OUTSTAND-ING. Many successful MFIs have salaries and benefitsrunning between 4 percent and 16 percent of averageportfolio outstanding (Christen and others 1995). This
varies depending on the model, the density of the popu-lation, and the salary level in the country.
AVERAGE CREDIT OFFICER SALARY AS A MULTIPLE OF PER
CAPITA GDP. The average credit officer salary as a multi-ple of per capita GDP is an effective ratio to determinethe appropriateness of salary levels relative to the eco-nomic level of activity in the country. This ratio can becompared to similar organizations operating in the sameenvironment.
COST PER UNIT OF CURRENCY LENT. The cost per unit ofcurrency lent ratio highlights the impact of the turnoverof the loan portfolio on operating costs. The lower theratio, the higher the efficiency. This ratio is most useful tocalculate and compare over time to see if costs are decreas-ing or increasing. However, it can sometimes be mislead-ing. For example, while operating costs may increase,even though the size of the portfolio remains the same,the cost per dollar lent may actually decrease. This wouldhappen if more short-term loans were made during theperiod and. therefore, the turnover of the portfolio washigher. Although the ratio would be reduced, it does notnecessarily indicate increased efficiency.
COST PER LOAN MADE. The cost per loan made ratio pro-vides an indication of the cost of providing loans basedon the number of loans made. Both this ratio and thecost per unit of currency lent need to be looked at overtime to determine whether operating costs are increasingor decreasing relative to the number of loans made, indi-cating the degree of efficiency. As an MFI matures, theseratios should decrease.
It is difficult to compare efficiency ratios amongMFIs because the average loan size and loan term are sosignificant in these calculations. For example, MFIs thatmake relatively large loans will have lower cost per unit
Cost per loan =Operating costs for the period
Total number of loans made in the period
Cost per unit ofcurrency lent
Operating costs for the period
Total amount disbursed in the period=
Average credit officer salary as a multiple of per capita GDP
Per capita GDP
Average credit officer salary=
Salaries and benfits to average portfolio =outstanding ratio
Salaries and benfits
Average portfolio outstanding
Operating cost ratio =Operating costs
Average portfolio outstanding
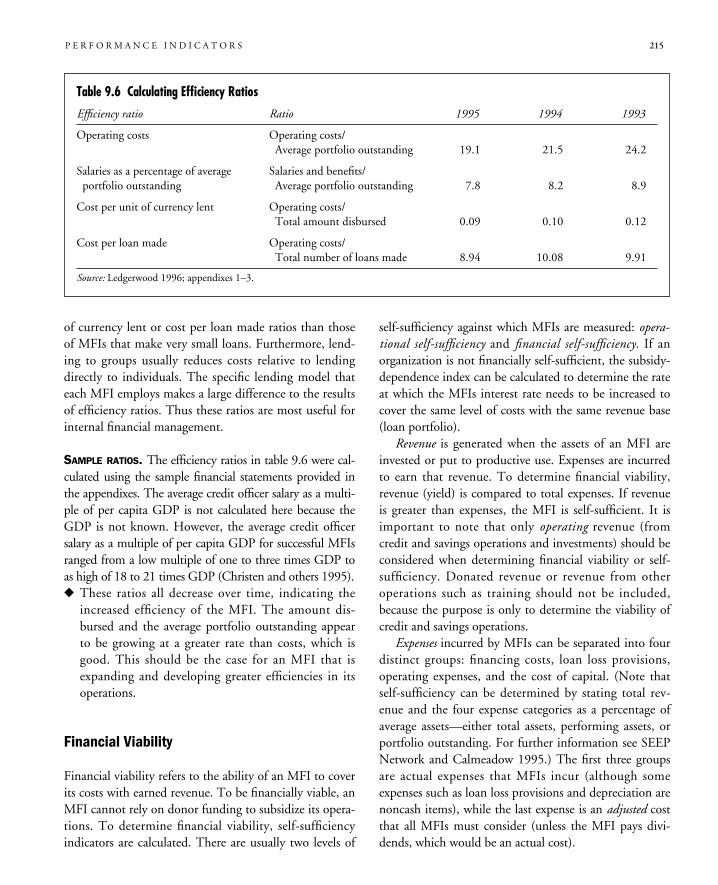
of currency lent or cost per loan made ratios than thoseof MFIs that make very small loans. Furthermore, lend-ing to groups usually reduces costs relative to lendingdirectly to individuals. The specific lending model thateach MFI employs makes a large difference to the resultsof efficiency ratios. Thus these ratios are most useful forinternal financial management.
SAMPLE RATIOS. The efficiency ratios in table 9.6 were cal-culated using the sample financial statements provided inthe appendixes. The average credit officer salary as a multi-ple of per capita GDP is not calculated here because theGDP is not known. However, the average credit officersalary as a multiple of per capita GDP for successful MFIsranged from a low multiple of one to three times GDP toas high of 18 to 21 times GDP (Christen and others 1995).� These ratios all decrease over time, indicating the
increased efficiency of the MFI. The amount dis-bursed and the average portfolio outstanding appearto be growing at a greater rate than costs, which isgood. This should be the case for an MFI that isexpanding and developing greater efficiencies in itsoperations.
Financial Viability
Financial viability refers to the ability of an MFI to coverits costs with earned revenue. To be financially viable, anMFI cannot rely on donor funding to subsidize its opera-tions. To determine financial viability, self-sufficiencyindicators are calculated. There are usually two levels of
self-sufficiency against which MFIs are measured: opera-tional self-sufficiency and financial self-sufficiency. If anorganization is not financially self-sufficient, the subsidy-dependence index can be calculated to determine the rateat which the MFIs interest rate needs to be increased tocover the same level of costs with the same revenue base(loan portfolio).
Revenue is generated when the assets of an MFI areinvested or put to productive use. Expenses are incurredto earn that revenue. To determine financial viability,revenue (yield) is compared to total expenses. If revenueis greater than expenses, the MFI is self-sufficient. It isimportant to note that only operating revenue (fromcredit and savings operations and investments) should beconsidered when determining financial viability or self-sufficiency. Donated revenue or revenue from otheroperations such as training should not be included,because the purpose is only to determine the viability ofcredit and savings operations.
Expenses incurred by MFIs can be separated into fourdistinct groups: financing costs, loan loss provisions,operating expenses, and the cost of capital. (Note thatself-sufficiency can be determined by stating total rev-enue and the four expense categories as a percentage ofaverage assets—either total assets, performing assets, orportfolio outstanding. For further information see SEEPNetwork and Calmeadow 1995.) The first three groupsare actual expenses that MFIs incur (although someexpenses such as loan loss provisions and depreciation arenoncash items), while the last expense is an adjusted costthat all MFIs must consider (unless the MFI pays divi-dends, which would be an actual cost).
P E R F O R M A N C E I N D I C A T O R S 215
Table 9.6 Calculating Efficiency Ratios
Efficiency ratio Ratio 1995 1994 1993
Operating costs Operating costs/Average portfolio outstanding 19.1 21.5 24.2
Salaries as a percentage of average Salaries and benefits/portfolio outstanding Average portfolio outstanding 7.8 8.2 8.9
Cost per unit of currency lent Operating costs/Total amount disbursed 0.09 0.10 0.12
Cost per loan made Operating costs/Total number of loans made 8.94 10.08 9.91
Source: Ledgerwood 1996; appendixes 1–3.
In the example in chapter 8, various adjustments weremade to ensure that the MFI’s financial statements ade-quately reflected total expenses. Adjustments were madeto reflect the cost of poor loan portfolio quality, deprecia-tion of fixed assets, and accrued interest revenue andinterest expense. Further adjustments were made to reflectthe benefit of subsidies received and the cost of inflation.In making these adjustments, a cost of capital was adjustedon the equity of the MFI. That is, the equity was adjustedto reflect the benefit of donations and concessional loansand the cost of inflation. Thus in the adjusted financialstatements all four costs are clearly recorded. For unad-justed statements, however, an adjusted cost of capitalmust be calculated. This is described below.
For the purposes of this section, nonadjusted finan-cial statements are used to demonstrate the differencebetween operational and financial self-sufficiency byproviding a formula to impute the cost of capital. Thisis provided for those readers who do not choose toadjust their financial statements directly for inflationand subsidies. If, in fact, the MFI’s financial statementsare adjusted, then a cost of capital need not be imputed,and both the operational and financial self-sufficiencyformulas can be calculated using the adjusted figures.
Financial Spread
True financial intermediaries mobilize deposits frommembers, from the general public, (or both). They thenlend these funds to their clients. They normally pay a rateof interest to the depositors and charge a higher rate ofinterest to the borrowers (or earn a greater rate on invest-ments). The difference between these two rates of interestis what is referred to as “spread” (sometimes referred to asgross financial margin if all operating revenue is included).
In the case of MFIs, which may or may not bemobilizing deposits from the public, spread refers to thedifference between the yield earned on the outstandingportfolio and the average cost of funds (whether thefunds be deposits, concessional loans, or commercialloans). Spread is what is available to cover the remain-ing three costs that an MFI incurs: operating costs, loanloss provisions, and the cost of capital. Spread is usuallystated as a percentage of portfolio outstanding (or alter-natively, if return on investments is included in theyield calculation, average performing assets can be usedas the denominator).
If the portfolio is funded with debt (liabilities), thenthe average cost of the debt is subtracted from the aver-age yield on the portfolio to determine the spread.
If the entire portfolio is funded with equity ordonated funds, then the spread is equal to the portfolioyield. (This is not to say that there is no “cost” for equi-ty; in fact, equity is generally more expensive than debt,because equity investors are taking a higher risk thanthose lending money since they have no guaranteed rateof return, which debt holders have in the form of inter-est. However, when discussing spread, this term refersonly to the difference between the cost of debt [liabili-ties] and the interest rate earned. The cost of equity isconsidered after a net profit is made and transferred tothe balance sheet; for most MFIs, no cost is ever reallydetermined. Rather, the return on equity is calculatedand compared with other investment choices. See thediscussion of profitability below).
The formula for calculating spread is:
or if investment income is included:
From here the loan loss provision (expense item) canbe subtracted from the spread, which results in the netfinancial margin and then the operating costs (operatingcost ratio as discussed above), which results in the netmargin (SEEP Network and Calmeadow 1995).
Two Levels of Self-Sufficiency
As the microfinance industry matures, the definition ofself-sufficiency has begun to narrow. A few years agopeople spoke about three (or four) levels of self-suffi-ciency that an MFI should progressively aim to achieve.Some analysts considered an MFI to be operationallyself-sufficient (level one) if the revenue it generatedfrom operations covered its operating costs, includingloan loss provisions. Reaching level two meant that anMFI generated enough revenue to cover financingcosts, operating expenses, and loan loss provisions.Level three (financial self-sufficiency) referred to rev-enue that covered nonfinancial and financial expenses
Spread (grossfinancial margin)
Operating revenue – financing costs
Average performing assets=
Spread =
Interest and fee revenue – financing costs
Average loan portfolio
216 M I C R O F I N A N C E H A N D B O O K
calculated on a commercial basis—“profit without sub-sidy” (Christen and others 1995).
Currently, most people in the microfinance industryrefer to only two levels of self-sufficiency: operationalself-sufficiency and financial self-sufficiency. However, thedefinition of operational self-sufficiency varies amongdifferent MFIs and donors. The difference centers onthe inclusion of financing costs. Whereas actual financ-ing costs used to be included only in levels two andthree (as above), some analysts include them in calculat-ing both operational and financial self-sufficiency andsome only in calculating financial self-sufficiency.
OPERATIONAL SELF-SUFFICIENCY. Some MFIs define oper-ational self-sufficiency as generating enough operatingrevenue to cover operating expenses, financing costs, andthe provision for loan losses.
Operational self-sufficiency thus indicates whether ornot enough revenue has been earned to cover the MFI’sdirect costs, excluding the (adjusted) cost of capital butincluding any actual financing costs incurred.
Other MFIs argue that operational self-sufficiencyshould not include financing costs, because not all MFIsincur financing costs equally, which thus makes thecomparison of self-sufficiency ratios between institutionsless relevant. Some MFIs fund all of their loans withgrants or concessional loans and do not need to borrowfunds—or collect savings—and thus either do not incurany financing costs or incur minimal costs. Other MFIs,as they move progressively toward financial viability, areable to access concessional or commercial borrowingsand thus incur financing costs. However, all MFIs incuroperating expenses and the cost of making loan loss pro-visions, and they should be measured on the manage-ment of these costs alone. Furthermore, MFIs shouldnot be penalized for accessing commercial fundingsources (through the inclusion of financing costs in theformula), nor should MFIs that are able to finance all oftheir loans with donor funds be rewarded.
The choice of which formula to use is personal,because both are correct. However, it is important thatwhen comparing institutions, the analyst determine thatthe same formula has been used, because no standarddefinition has yet been established.
Regardless of which formula is used, if an MFI does notreach operational self-sufficiency, eventually its equity (loan-fund capital) will be reduced by losses (unless additionalgrants can be raised to cover operating shortfalls). Thismeans that there will be a smaller amount of funds to loanto borrowers, (which could lead to closing the MFI once thefunds run out). To increase its self-sufficiency, the MFImust either increase its yield (return on assets) ordecrease its expenses (financing costs, provision for loanlosses, or operating costs).
FINANCIAL SELF-SUFFICIENCY. Financial self-sufficiencyindicates whether or not enough revenue has been earnedto cover both direct costs, including financing costs, pro-visions for loan losses, and operating expenses, and indi-rect costs, including the adjusted cost of capital.
The adjusted cost of capital is considered to be thecost of maintaining the value of the equity relative toinflation (or the market rate of equity) and the cost ofaccessing commercial rate liabilities rather than conces-sional loans. This was discussed and detailed adjustmentswere made in chapter 8, and so the adjusted cost of capi-tal will be discussed here only briefly.
Many MFIs fund their loans with donated funds(equity) and thus to continue funding their loan port-folio, they need to generate enough revenue to increasetheir equity to keep pace with inflation. (If the MFI wasto operate with borrowed funds, the financing costs inthe income statement would capture the costs of debtand the cost of inflation, because inflation only affectsequity and not liabilities. Liabilities are priced by thelender to cover the cost of inflation, because the borrow-er—in this case, the MFI—repays the loan in the futurewith inflated currency. If it turns out that the rate ofinflation is greater than the rate of interest on the loan,the lender loses money, not the MFI.) Furthermore,many MFIs also access concessional funding (quasi-equity) at below-market rates. Consideration must begiven to this subsidy and an additional cost of fundsincluded, based on the MFI accessing commercial loans.Theoretically, this puts all MFIs on a somewhat levelplaying field regardless of their funding structures
Operational self-sufficiencyOperating income
Operating expenses+ provision for loan losses
=(ii)
Operational self-sufficiencyOperating income
Operating expenses + financing costs+ provision for loan losses
=(i)
P E R F O R M A N C E I N D I C A T O R S 217
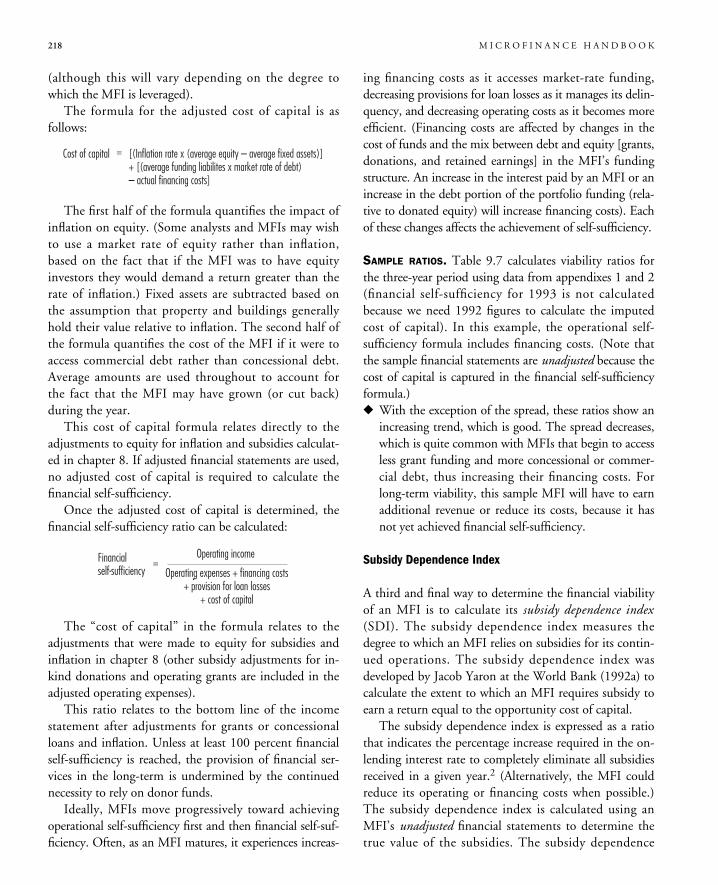
(although this will vary depending on the degree towhich the MFI is leveraged).
The formula for the adjusted cost of capital is asfollows:
The first half of the formula quantifies the impact ofinflation on equity. (Some analysts and MFIs may wishto use a market rate of equity rather than inflation,based on the fact that if the MFI was to have equityinvestors they would demand a return greater than therate of inflation.) Fixed assets are subtracted based onthe assumption that property and buildings generallyhold their value relative to inflation. The second half ofthe formula quantifies the cost of the MFI if it were toaccess commercial debt rather than concessional debt.Average amounts are used throughout to account forthe fact that the MFI may have grown (or cut back)during the year.
This cost of capital formula relates directly to theadjustments to equity for inflation and subsidies calculat-ed in chapter 8. If adjusted financial statements are used,no adjusted cost of capital is required to calculate thefinancial self-sufficiency.
Once the adjusted cost of capital is determined, thefinancial self-sufficiency ratio can be calculated:
.
The “cost of capital” in the formula relates to theadjustments that were made to equity for subsidies andinflation in chapter 8 (other subsidy adjustments for in-kind donations and operating grants are included in theadjusted operating expenses).
This ratio relates to the bottom line of the incomestatement after adjustments for grants or concessionalloans and inflation. Unless at least 100 percent financialself-sufficiency is reached, the provision of financial ser-vices in the long-term is undermined by the continuednecessity to rely on donor funds.
Ideally, MFIs move progressively toward achievingoperational self-sufficiency first and then financial self-suf-ficiency. Often, as an MFI matures, it experiences increas-
ing financing costs as it accesses market-rate funding,decreasing provisions for loan losses as it manages its delin-quency, and decreasing operating costs as it becomes moreefficient. (Financing costs are affected by changes in thecost of funds and the mix between debt and equity [grants,donations, and retained earnings] in the MFI’s fundingstructure. An increase in the interest paid by an MFI or anincrease in the debt portion of the portfolio funding (rela-tive to donated equity) will increase financing costs). Eachof these changes affects the achievement of self-sufficiency.
SAMPLE RATIOS. Table 9.7 calculates viability ratios forthe three-year period using data from appendixes 1 and 2(financial self-sufficiency for 1993 is not calculatedbecause we need 1992 figures to calculate the imputedcost of capital). In this example, the operational self-sufficiency formula includes financing costs. (Note thatthe sample financial statements are unadjusted because thecost of capital is captured in the financial self-sufficiencyformula.)� With the exception of the spread, these ratios show an
increasing trend, which is good. The spread decreases,which is quite common with MFIs that begin to accessless grant funding and more concessional or commer-cial debt, thus increasing their financing costs. Forlong-term viability, this sample MFI will have to earnadditional revenue or reduce its costs, because it hasnot yet achieved financial self-sufficiency.
Subsidy Dependence Index
A third and final way to determine the financial viabilityof an MFI is to calculate its subsidy dependence index(SDI). The subsidy dependence index measures thedegree to which an MFI relies on subsidies for its contin-ued operations. The subsidy dependence index wasdeveloped by Jacob Yaron at the World Bank (1992a) tocalculate the extent to which an MFI requires subsidy toearn a return equal to the opportunity cost of capital.
The subsidy dependence index is expressed as a ratiothat indicates the percentage increase required in the on-lending interest rate to completely eliminate all subsidiesreceived in a given year.2 (Alternatively, the MFI couldreduce its operating or financing costs when possible.)The subsidy dependence index is calculated using anMFI’s unadjusted financial statements to determine thetrue value of the subsidies. The subsidy dependence
Financialself-sufficiency
Operating income
Operating expenses + financing costs+ provision for loan losses
+ cost of capital
=
Cost of capital [(Inflation rate x (average equity – average fixed assets)]+ [(average funding liabilites x market rate of debt) – actual financing costs]
=
218 M I C R O F I N A N C E H A N D B O O K
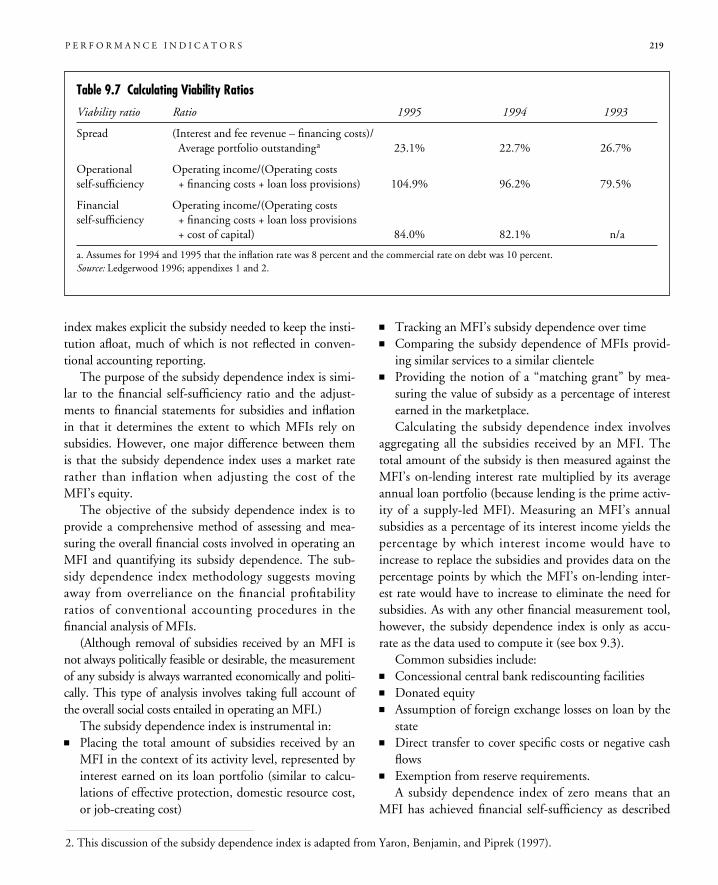
index makes explicit the subsidy needed to keep the insti-tution afloat, much of which is not reflected in conven-tional accounting reporting.
The purpose of the subsidy dependence index is simi-lar to the financial self-sufficiency ratio and the adjust-ments to financial statements for subsidies and inflationin that it determines the extent to which MFIs rely onsubsidies. However, one major difference between themis that the subsidy dependence index uses a market raterather than inflation when adjusting the cost of theMFI’s equity.
The objective of the subsidy dependence index is toprovide a comprehensive method of assessing and mea-suring the overall financial costs involved in operating anMFI and quantifying its subsidy dependence. The sub-sidy dependence index methodology suggests movingaway from overreliance on the financial profitabilityratios of conventional accounting procedures in thefinancial analysis of MFIs.
(Although removal of subsidies received by an MFI isnot always politically feasible or desirable, the measurementof any subsidy is always warranted economically and politi-cally. This type of analysis involves taking full account ofthe overall social costs entailed in operating an MFI.)
The subsidy dependence index is instrumental in:� Placing the total amount of subsidies received by an
MFI in the context of its activity level, represented byinterest earned on its loan portfolio (similar to calcu-lations of effective protection, domestic resource cost,or job-creating cost)
� Tracking an MFI’s subsidy dependence over time� Comparing the subsidy dependence of MFIs provid-
ing similar services to a similar clientele� Providing the notion of a “matching grant” by mea-
suring the value of subsidy as a percentage of interestearned in the marketplace.Calculating the subsidy dependence index involves
aggregating all the subsidies received by an MFI. Thetotal amount of the subsidy is then measured against theMFI’s on-lending interest rate multiplied by its averageannual loan portfolio (because lending is the prime activ-ity of a supply-led MFI). Measuring an MFI’s annualsubsidies as a percentage of its interest income yields thepercentage by which interest income would have toincrease to replace the subsidies and provides data on thepercentage points by which the MFI’s on-lending inter-est rate would have to increase to eliminate the need forsubsidies. As with any other financial measurement tool,however, the subsidy dependence index is only as accu-rate as the data used to compute it (see box 9.3).
Common subsidies include:� Concessional central bank rediscounting facilities� Donated equity� Assumption of foreign exchange losses on loan by the
state� Direct transfer to cover specific costs or negative cash
flows� Exemption from reserve requirements.
A subsidy dependence index of zero means that anMFI has achieved financial self-sufficiency as described
P E R F O R M A N C E I N D I C A T O R S 219
Table 9.7 Calculating Viability Ratios
Viability ratio Ratio 1995 1994 1993
Spread (Interest and fee revenue – financing costs)/Average portfolio outstandinga 23.1% 22.7% 26.7%
Operational Operating income/(Operating costsself-sufficiency + financing costs + loan loss provisions) 104.9% 96.2% 79.5%
Financial Operating income/(Operating costsself-sufficiency + financing costs + loan loss provisions
+ cost of capital) 84.0% 82.1% n/a
a. Assumes for 1994 and 1995 that the inflation rate was 8 percent and the commercial rate on debt was 10 percent.Source: Ledgerwood 1996; appendixes 1 and 2.
2. This discussion of the subsidy dependence index is adapted from Yaron, Benjamin, and Piprek (1997).
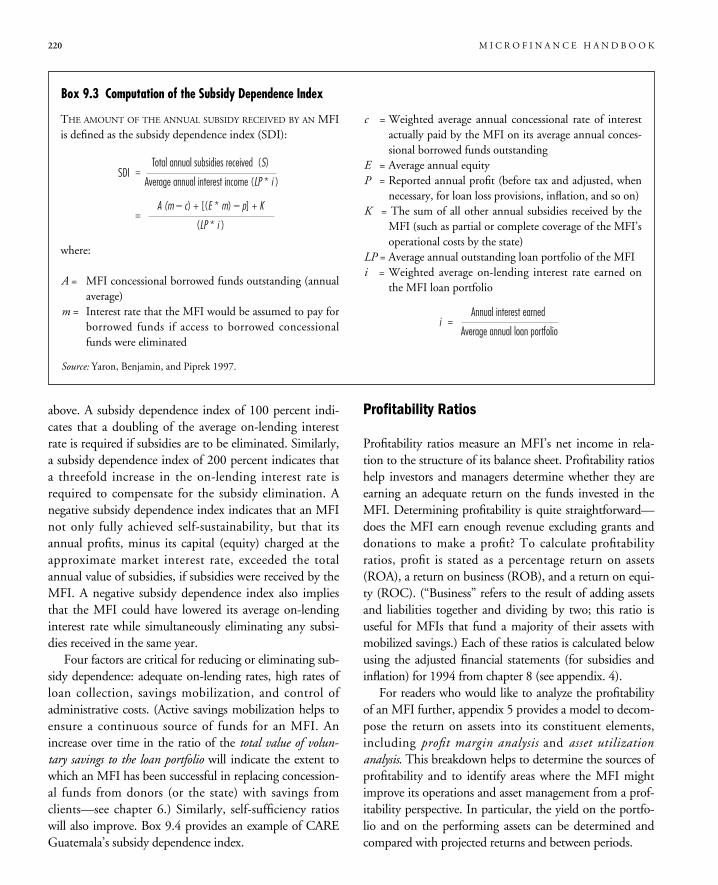
above. A subsidy dependence index of 100 percent indi-cates that a doubling of the average on-lending interestrate is required if subsidies are to be eliminated. Similarly,a subsidy dependence index of 200 percent indicates thata threefold increase in the on-lending interest rate isrequired to compensate for the subsidy elimination. Anegative subsidy dependence index indicates that an MFInot only fully achieved self-sustainability, but that itsannual profits, minus its capital (equity) charged at theapproximate market interest rate, exceeded the totalannual value of subsidies, if subsidies were received by theMFI. A negative subsidy dependence index also impliesthat the MFI could have lowered its average on-lendinginterest rate while simultaneously eliminating any subsi-dies received in the same year.
Four factors are critical for reducing or eliminating sub-sidy dependence: adequate on-lending rates, high rates ofloan collection, savings mobilization, and control ofadministrative costs. (Active savings mobilization helps toensure a continuous source of funds for an MFI. Anincrease over time in the ratio of the total value of volun-tary savings to the loan portfolio will indicate the extent towhich an MFI has been successful in replacing concession-al funds from donors (or the state) with savings fromclients—see chapter 6.) Similarly, self-sufficiency ratioswill also improve. Box 9.4 provides an example of CAREGuatemala’s subsidy dependence index.
Profitability Ratios
Profitability ratios measure an MFI’s net income in rela-tion to the structure of its balance sheet. Profitability ratioshelp investors and managers determine whether they areearning an adequate return on the funds invested in theMFI. Determining profitability is quite straightforward—does the MFI earn enough revenue excluding grants anddonations to make a profit? To calculate profitabilityratios, profit is stated as a percentage return on assets(ROA), a return on business (ROB), and a return on equi-ty (ROC). (“Business” refers to the result of adding assetsand liabilities together and dividing by two; this ratio isuseful for MFIs that fund a majority of their assets withmobilized savings.) Each of these ratios is calculated belowusing the adjusted financial statements (for subsidies andinflation) for 1994 from chapter 8 (see appendix. 4).
For readers who would like to analyze the profitabilityof an MFI further, appendix 5 provides a model to decom-pose the return on assets into its constituent elements,including profit margin analysis and asset utilizationanalysis. This breakdown helps to determine the sources ofprofitability and to identify areas where the MFI mightimprove its operations and asset management from a prof-itability perspective. In particular, the yield on the portfo-lio and on the performing assets can be determined andcompared with projected returns and between periods.
220 M I C R O F I N A N C E H A N D B O O K
THE AMOUNT OF THE ANNUAL SUBSIDY RECEIVED BY AN MFIis defined as the subsidy dependence index (SDI):
where:
A = MFI concessional borrowed funds outstanding (annualaverage)
m = Interest rate that the MFI would be assumed to pay forborrowed funds if access to borrowed concessionalfunds were eliminated
c = Weighted average annual concessional rate of interestactually paid by the MFI on its average annual conces-sional borrowed funds outstanding
E = Average annual equityP = Reported annual profit (before tax and adjusted, when
necessary, for loan loss provisions, inflation, and so on)K = The sum of all other annual subsidies received by the
MFI (such as partial or complete coverage of the MFI’soperational costs by the state)
LP = Average annual outstanding loan portfolio of the MFIi = Weighted average on-lending interest rate earned on
the MFI loan portfolio
Annual interest earned
Average annual loan portfolio=i
SDITotal annual subsidies received (S)
Average annual interest income (LP * i )=
A (m – c) + [(E * m) – p] + K
(LP * i )=
Box 9.3 Computation of the Subsidy Dependence Index
Source: Yaron, Benjamin, and Piprek 1997.
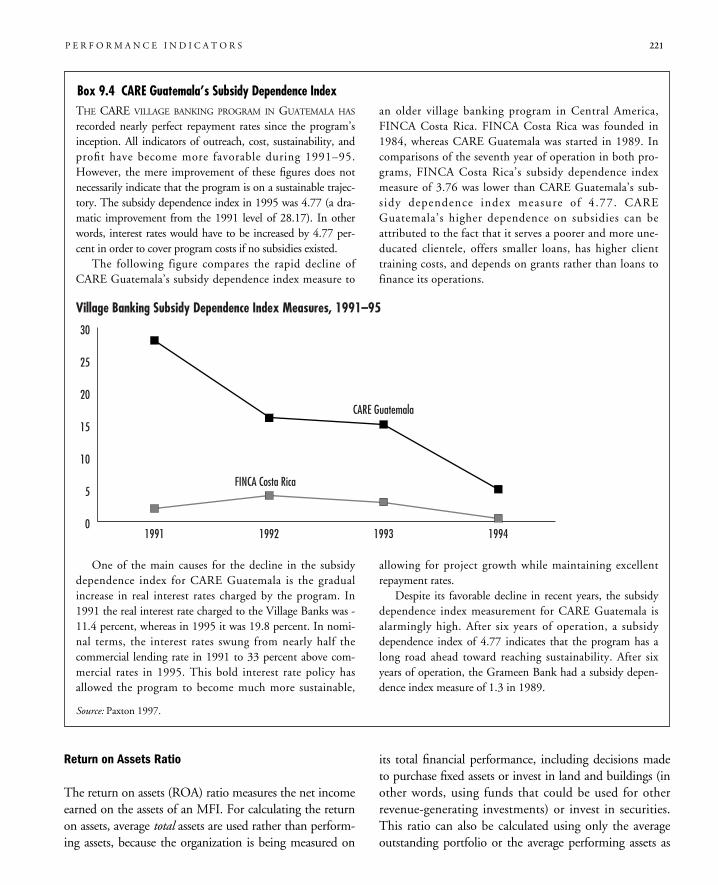
Return on Assets Ratio
The return on assets (ROA) ratio measures the net incomeearned on the assets of an MFI. For calculating the returnon assets, average total assets are used rather than perform-ing assets, because the organization is being measured on
its total financial performance, including decisions madeto purchase fixed assets or invest in land and buildings (inother words, using funds that could be used for otherrevenue-generating investments) or invest in securities.This ratio can also be calculated using only the averageoutstanding portfolio or the average performing assets as
P E R F O R M A N C E I N D I C A T O R S 221
One of the main causes for the decline in the subsidydependence index for CARE Guatemala is the gradualincrease in real interest rates charged by the program. In1991 the real interest rate charged to the Village Banks was -11.4 percent, whereas in 1995 it was 19.8 percent. In nomi-nal terms, the interest rates swung from nearly half thecommercial lending rate in 1991 to 33 percent above com-mercial rates in 1995. This bold interest rate policy hasallowed the program to become much more sustainable,
allowing for project growth while maintaining excellentrepayment rates.
Despite its favorable decline in recent years, the subsidydependence index measurement for CARE Guatemala isalarmingly high. After six years of operation, a subsidydependence index of 4.77 indicates that the program has along road ahead toward reaching sustainability. After sixyears of operation, the Grameen Bank had a subsidy depen-dence index measure of 1.3 in 1989.
THE CARE VILLAGE BANKING PROGRAM IN GUATEMALA HAS
recorded nearly perfect repayment rates since the program’sinception. All indicators of outreach, cost, sustainability, andprofit have become more favorable during 1991–95.However, the mere improvement of these figures does notnecessarily indicate that the program is on a sustainable trajec-tory. The subsidy dependence index in 1995 was 4.77 (a dra-matic improvement from the 1991 level of 28.17). In otherwords, interest rates would have to be increased by 4.77 per-cent in order to cover program costs if no subsidies existed.
The following figure compares the rapid decline ofCARE Guatemala’s subsidy dependence index measure to
an older village banking program in Central America,FINCA Costa Rica. FINCA Costa Rica was founded in1984, whereas CARE Guatemala was started in 1989. Incomparisons of the seventh year of operation in both pro-grams, FINCA Costa Rica’s subsidy dependence indexmeasure of 3.76 was lower than CARE Guatemala’s sub-sidy dependence index measure of 4.77. CAREGuatemala’s higher dependence on subsidies can beattributed to the fact that it serves a poorer and more une-ducated clientele, offers smaller loans, has higher clienttraining costs, and depends on grants rather than loans tofinance its operations.
Box 9.4 CARE Guatemala’s Subsidy Dependence Index
Source: Paxton 1997.
Village Banking Subsidy Dependence Index Measures, 1991–95
0
5
10
15
20
25
30
FINCA Costa Rica
CARE Guatemala
1994199319921991
the denominator to determine how specific assets are per-forming. (The return on portfolio ratio indicates the pro-ductivity of the lending activities only. It measures theaverage revenue received for every unit of currency out-standing in loans. While the return on portfolio mightindicate an adequate return, if only 50 percent of the assetsare represented by outstanding loans, the organization maynot be performing as well as the return on portfolio ratiowould indicate. The return on performing assets ratiotakes into account the return earned on other investments.The return on total assets ratio shows how the MFI is per-forming relative to all assets, including nonproductiveassets such as fixed assets or land and property.)� For example, if an MFI earns 50,000 in net income
and has average assets of 2,740,000 then the return onassets is 1.8 percent.
Factors that affect the return on assets ratio are vary-ing loan terms, interest rates and fees, and changes in thelevel of delinquent payments. The split between interestincome and fee income also affects this ratio if loan termsand loan amounts change (see chapter 5).
The return on assets ratio is an important indicator toanalyze when pricing or loan term structures are changed(or decisions are made to purchase capital assets—see chap-ter 10). Analysis of this ratio will improve the ability of anMFI to determine the revenue impact of policy changes,improved delinquency management, or the addition ofnew products.� Using the adjusted sample balance sheet and sample
income statement in appendix 4 (with combinedadjustments for subsidies and inflation), the followingreturn on assets ratio for 1994 is calculated:
(Note that for simplicity’s sake, 1993 assets did notinclude an adjustment to fixed assets for inflation.)
With the adjustments for inflation and subsidies, thissample MFI does not earn a profit. However, if an MFIis financially sustainable (earning a profit after adjust-ments for subsidies and inflation), the return on assetsratio provides an indication of whether or not the MFIhas the potential to generate a commercially acceptablerate of return, which would enable it to access commer-cial financing as well as potentially become a formalfinancial institution (if this is not already the case).Most commercial financial institutions in developing
countries earn return on assets ratios of less than 2 percent.Of the 11 successful MFIs studied by the U.S. Agency forInternational Development, the adjusted return on assetsratios in 1993 ranged from a high of 7.4 percent (LPD inBali) to a low of –18.5 percent (Kenya Rural EnterpriseProgramme) (Christen and others 1995).
Return on Business Ratio
To take into account the fact that some MFIs mobilizedeposits as a large part of their operations, the return onbusiness (ROB) ratio is provided.
By summing the assets and liabilities and dividing bytwo, an average business base is provided. This is impor-tant when an MFI collects deposits due to the addedoperational and financing costs associated with voluntarysavings. The return on business ratio accounts for thedual activity (collecting savings and loans) of its opera-tions. Some commercial banks calculate the return onbusiness ratio, particularly if only a small amount of theirbusiness is off-balance sheet activities (letters of credit,guarantees. and so forth).
The return on business ratio is directly affected bythe capital structure of an MFI. If the majority of anMFI’s assets are funded by equity, the return on busi-ness ratio will be misleading and should not be calculat-ed. If an MFI is acting as a true financial intermediaryand funding its loan portfolio with client savings, thereturn on business ratio may be a fairer ratio to comparewith other institutions than the return on assets ratio.This is because when an MFI collects savings, it incursadditional costs. These costs are offset either completelyor partially by the lower cost of funds (interest paid onclient savings is generally lower than the market rate fordebt, which is used for the adjusted statements). If onlythe return on assets ratio was considered, MFIs thatmobilize deposits would be penalized by their increased
Return on assets
Net income
Average assets=
50,000
2,740,000=
1.8%=
Return on assets (adjusted)
Net adjusted income
Average total assets=
–5,750
77,950=
–7.4%=
222 M I C R O F I N A N C E H A N D B O O K
operating costs. The return on business ratio mitigatesthis fact by including deposits in the denominator.� Using the adjusted sample balance sheet and sample
income statement in appendix 4, the following returnon business ratio for 1994 is calculated:
Because the sample MFI’s capital structure consists ofa relatively large amount of equity (no client savings), itis not applicable to calculate the return on business ratio.However, ignoring the specific numbers for a moment,we can make some observations.
If the sample MFI collected savings, presumably thespread earned on its loans would more than offset thehigher operational costs. The result would be a highernet adjusted income because financing costs would belower. (This assumes that the MFI would otherwise befunding its loans with borrowed funds at commercialrates or that adjustments have been made to reflect theadjusted cost of capital.) The denominator would alsobe higher since liabilities would increase relative to equi-ty. The result would be a return on business ratio muchcloser to the return on assets ratio. If, in fact, the returnon business ratio were lower than the return on assetsratio, the MFI would have to consider whether it isprofitable to mobilize savings.
Return on Equity Ratio
The return on equity (ROE) ratio provides managementand investors with the rate of return earned on theinvested equity. It differs from the return on assets ratioin that it measures the return on funds that are owned bythe MFI (rather than total assets, which by definitionincludes both liabilities and equity). If the return onequity is less than the inflation rate, then the equity ofthe MFI is reduced each year by the difference (net of thenonmonetary assets owned by the MFI). The return onequity ratio also allows donors and investors to deter-mine how their investment in a particular MFI comparesagainst alternative investments. This becomes a crucialindicator when the MFI is seeking private investors.
The return on equity ratio will also vary greatlydepending on the capital structure of the MFI. Thosethat fund their assets primarily with equity will show alower return on equity than those that fund their assetsprimarily with liabilities.� Using the adjusted sample balance sheet and sample
income statement in appendix 4, the following returnon equity for 1994 is calculated:
Because the sample MFI has not earned profit, itsreturn on equity is not particularly relevant. However, ifit were to earn a profit, its return on equity ratio wouldstill be low, because it has a larger portion of equity thanmost commercial financial institutions. If it were tomake a profit or to increase its leverage (amount of debtrelative to equity, see below), this ratio would improve.
Many commercial financial institutions target anreturn on equity of about 15 to 25 percent, depending onthe inflation rate in the country. Of the 11 successfulMFIs studied by USAID, the adjusted return on equity in1993 ranged from a high of 32.7 percent (LPD in Bali) toa low of –18.7 percent (FINCA Costa Rica). Bank RakyatIndonesia and CorpoSol in Colombia also recorded highROEs of 31 percent and 22.5 percent respectively(Christen and others 1995).
Leverage and Capital Adequacy
Leverage refers to the extent to which an MFI borrowsmoney relative to its amount of equity. In other words, itanswers the question of how many additional dollars orother currency can be mobilized from commercialsources for every dollar or other currency worth of fundsowned by the MFI. Leverage states the relationship offunding assets with debt versus equity.
Capital adequacy refers to the amount of capital an MFIhas relative to its assets. Capital adequacy relates to leveragein terms of the adequacy of the MFI’s funding structure.
The term “capital” includes the equity of an MFI anda portion of its liabilities, including subordinated debt.
Return on business(adjusted)
Net adjusted income
Average business base=
–5,570
61,300=
–9.4%=
Return on equity(adjusted)
Net adjusted income
Average equity=
–5,570
33,300=
–1.7%=
P E R F O R M A N C E I N D I C A T O R S 223
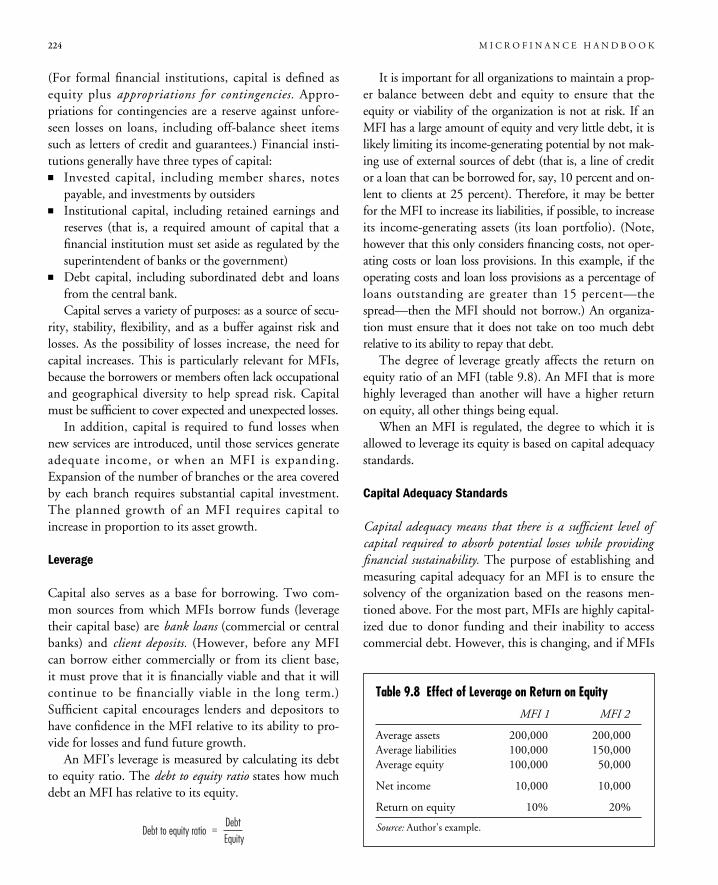
(For formal financial institutions, capital is defined asequity plus appropriations for contingencies. Appro-priations for contingencies are a reserve against unfore-seen losses on loans, including off-balance sheet itemssuch as letters of credit and guarantees.) Financial insti-tutions generally have three types of capital:� Invested capital, including member shares, notes
payable, and investments by outsiders� Institutional capital, including retained earnings and
reserves (that is, a required amount of capital that afinancial institution must set aside as regulated by thesuperintendent of banks or the government)
� Debt capital, including subordinated debt and loansfrom the central bank.Capital serves a variety of purposes: as a source of secu-
rity, stability, flexibility, and as a buffer against risk andlosses. As the possibility of losses increase, the need forcapital increases. This is particularly relevant for MFIs,because the borrowers or members often lack occupationaland geographical diversity to help spread risk. Capitalmust be sufficient to cover expected and unexpected losses.
In addition, capital is required to fund losses whennew services are introduced, until those services generateadequate income, or when an MFI is expanding.Expansion of the number of branches or the area coveredby each branch requires substantial capital investment.The planned growth of an MFI requires capital toincrease in proportion to its asset growth.
Leverage
Capital also serves as a base for borrowing. Two com-mon sources from which MFIs borrow funds (leveragetheir capital base) are bank loans (commercial or centralbanks) and client deposits. (However, before any MFIcan borrow either commercially or from its client base,it must prove that it is financially viable and that it willcontinue to be financially viable in the long term.)Sufficient capital encourages lenders and depositors tohave confidence in the MFI relative to its ability to pro-vide for losses and fund future growth.
An MFI’s leverage is measured by calculating its debtto equity ratio. The debt to equity ratio states how muchdebt an MFI has relative to its equity.
It is important for all organizations to maintain a prop-er balance between debt and equity to ensure that theequity or viability of the organization is not at risk. If anMFI has a large amount of equity and very little debt, it islikely limiting its income-generating potential by not mak-ing use of external sources of debt (that is, a line of creditor a loan that can be borrowed for, say, 10 percent and on-lent to clients at 25 percent). Therefore, it may be betterfor the MFI to increase its liabilities, if possible, to increaseits income-generating assets (its loan portfolio). (Note,however that this only considers financing costs, not oper-ating costs or loan loss provisions. In this example, if theoperating costs and loan loss provisions as a percentage ofloans outstanding are greater than 15 percent—thespread—then the MFI should not borrow.) An organiza-tion must ensure that it does not take on too much debtrelative to its ability to repay that debt.
The degree of leverage greatly affects the return onequity ratio of an MFI (table 9.8). An MFI that is morehighly leveraged than another will have a higher returnon equity, all other things being equal.
When an MFI is regulated, the degree to which it isallowed to leverage its equity is based on capital adequacystandards.
Capital Adequacy Standards
Capital adequacy means that there is a sufficient level ofcapital required to absorb potential losses while providingfinancial sustainability. The purpose of establishing andmeasuring capital adequacy for an MFI is to ensure thesolvency of the organization based on the reasons men-tioned above. For the most part, MFIs are highly capital-ized due to donor funding and their inability to accesscommercial debt. However, this is changing, and if MFIs
Debt to equity ratioDebt=Equity
224 M I C R O F I N A N C E H A N D B O O K
Table 9.8 Effect of Leverage on Return on Equity
MFI 1 MFI 2
Average assets 200,000 200,000Average liabilities 100,000 150,000Average equity 100,000 50,000
Net income 10,000 10,000
Return on equity 10% 20%
Source: Author’s example.
are to reach substantial numbers of low-income clients,they will have to increase and expand their sources offunding while ensuring prudent management. Capitaladequacy standards help to ensure the viability of MFIsas they increase their degree of leverage.
International standards of capital adequacy have beenput forth through the Basle Agreement (as discussed inchapter 1). Capital adequacy standards require MFIs tohave both a minimum nominal amount of capital and anadequate amount of capital to cover the risk of losses.
Capital adequacy is based on risk-weighted assets (asset out under the Basle Accord, which identifies differentrisk levels for different assets types. There are five stan-dard risk weights ranging from 0 percent to 100 percentrisk. For most MFIs, only the first category—0 percentweight; includes cash, central bank balances, and govern-ment securities, and the last category—100 percentweight; includes loans to private entities and individu-als—are relevant, because MFIs do not generally havefully secured loans—50 percent weight—or off-balancesheet items.) Capital adequacy is set at 8 percent of risk-weighted assets. This means that a regulated MFI canhave up to 12 times the amount of debt as equity basedon the adjusted (risk-weighted) assets being funded.
Capital is also classified under the Basle Accord bydifferent categories available for inclusion in the calcula-tion of capital adequacy. For example, core capital includ-ing equity and reserves must be at least 4 percent ofrisk-weighted assets.
Capital adequacy is usually measured by the followingratio of capital to risk-weighted assets:
This ratio should be calculated periodically to deter-mine the level of capital adequacy of an MFI. As theMFI grows and presumably increases its leverage, thisratio will decrease over time as the organization takesadvantage of increased borrowings.
Scale and Depth of Outreach Indicators
In addition to financial performance indicators, manyMFIs collect data on their client base—both the scale oftheir activities (number of clients served with different
types of instruments) and the depth of outreach (type ofclients reached and their level of poverty).
A performance assessment framework introduced byYaron (1992b) consists of two primary criteria: the levelof outreach achieved among target clientele and self-sus-tainability of the MFI. While these do not provide a fullassessment of the economic impact of the operations ofan MFI, they serve as quantifiable proxies of the extent towhich an MFI has reached its objectives, and they maketransparent the social costs associated with supportingthe institution (Yaron, Benjamin, and Piprek 1997).This section presents the first half of the performanceassessment framework only (that is, outreach indicators;self-sustainability indicators are provided above).
The indicators of outreach are both qualitative andquantitative. They are relatively simple to collect andprovide a good measure of scale of outreach and goodproxies for depth of outreach (a more detailed discussionof depth of outreach is provided below). The indicatorscan be weighed, quantified, and prioritized according totheir relevance to a particular MFI. For example, if gen-der does not limit access to credit, the weight attached tothe number of women clients may be low or even zero(Yaron, Benjamin, and Piprek 1997).
Some of the indicators are repeated from the portfolioreport presented in chapter 8 and others are mentionedin the various formulas presented above. Depending onthe objectives of the MFI, additional or different indica-tors may be appropriate. To evaluate the successful out-reach of an MFI it is useful to track these indicators overtime and compare them with the stated goals of the orga-nization (or projected figures; see box 9.5).
Although outreach often is recorded by the totalnumber of clients served by an MFI (scale of outreach),the depth of outreach is a more nebulous measure. Asmentioned above, the depth of outreach is proxied byaverage loan size or average loan size as a percentageof GDP per capita. Although useful measures, theseindicators can sometimes be misleading, because theloans are for different terms and uses and may notreflect the income level of the clients. Depth of out-reach can have many different meanings. If one takesthe view that it refers to providing financial services tothose excluded from formal financial services, then it isimportant to define which sectors of society have littleor no access to formal finance (adapted from Paxtonand Fruman 1998).
Capital to risk-weighted assets
Invested capital + reserves+ retained earnings
Risk-weighted assets=
P E R F O R M A N C E I N D I C A T O R S 225
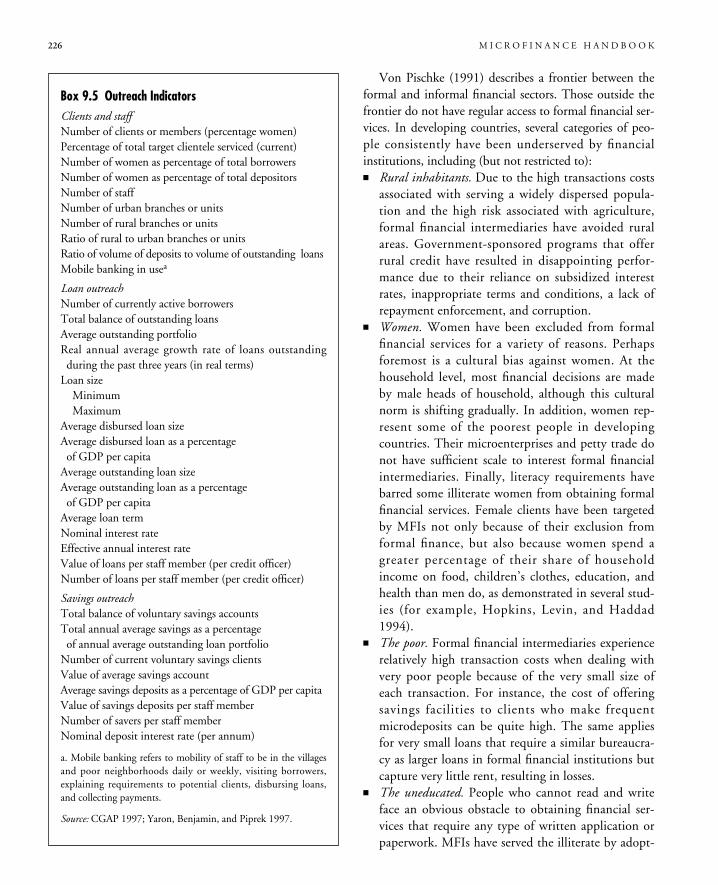
Von Pischke (1991) describes a frontier between theformal and informal financial sectors. Those outside thefrontier do not have regular access to formal financial ser-vices. In developing countries, several categories of peo-ple consistently have been underserved by financialinstitutions, including (but not restricted to):� Rural inhabitants. Due to the high transactions costs
associated with serving a widely dispersed popula-tion and the high risk associated with agriculture,formal financial intermediaries have avoided ruralareas. Government-sponsored programs that offerrural credit have resulted in disappointing perfor-mance due to their reliance on subsidized interestrates, inappropriate terms and conditions, a lack ofrepayment enforcement, and corruption.
� Women. Women have been excluded from formalfinancial services for a variety of reasons. Perhapsforemost is a cultural bias against women. At thehousehold level, most financial decisions are madeby male heads of household, although this culturalnorm is shifting gradually. In addition, women rep-resent some of the poorest people in developingcountries. Their microenterprises and petty trade donot have sufficient scale to interest formal financialintermediaries. Finally, literacy requirements havebarred some illiterate women from obtaining formalfinancial services. Female clients have been targetedby MFIs not only because of their exclusion fromformal finance, but also because women spend agreater percentage of their share of householdincome on food, children’s clothes, education, andhealth than men do, as demonstrated in several stud-ies (for example, Hopkins, Levin, and Haddad1994).
� The poor. Formal financial intermediaries experiencerelatively high transaction costs when dealing withvery poor people because of the very small size ofeach transaction. For instance, the cost of offeringsavings facilities to clients who make frequentmicrodeposits can be quite high. The same appliesfor very small loans that require a similar bureaucra-cy as larger loans in formal financial institutions butcapture very little rent, resulting in losses.
� The uneducated. People who cannot read and writeface an obvious obstacle to obtaining financial ser-vices that require any type of written application orpaperwork. MFIs have served the illiterate by adopt-
226 M I C R O F I N A N C E H A N D B O O K
Box 9.5 Outreach IndicatorsClients and staffNumber of clients or members (percentage women)Percentage of total target clientele serviced (current)Number of women as percentage of total borrowersNumber of women as percentage of total depositorsNumber of staffNumber of urban branches or unitsNumber of rural branches or unitsRatio of rural to urban branches or unitsRatio of volume of deposits to volume of outstanding loansMobile banking in usea
Loan outreachNumber of currently active borrowersTotal balance of outstanding loansAverage outstanding portfolioReal annual average growth rate of loans outstandingduring the past three years (in real terms)
Loan sizeMinimumMaximum
Average disbursed loan sizeAverage disbursed loan as a percentageof GDP per capita
Average outstanding loan sizeAverage outstanding loan as a percentageof GDP per capita
Average loan termNominal interest rateEffective annual interest rateValue of loans per staff member (per credit officer)Number of loans per staff member (per credit officer)
Savings outreachTotal balance of voluntary savings accountsTotal annual average savings as a percentageof annual average outstanding loan portfolio
Number of current voluntary savings clientsValue of average savings accountAverage savings deposits as a percentage of GDP per capitaValue of savings deposits per staff memberNumber of savers per staff memberNominal deposit interest rate (per annum)
a. Mobile banking refers to mobility of staff to be in the villagesand poor neighborhoods daily or weekly, visiting borrowers,explaining requirements to potential clients, disbursing loans,and collecting payments.
Source: CGAP 1997; Yaron, Benjamin, and Piprek 1997.
ing innovative techniques, including oral trainingand screening, pictorial training, group guarantees,and the use of thumbprint signatures.Obviously, many people excluded from formal
finance fall into more than one of these categories andthus a correlation exists between these four outreachindicators. To compare MFI clients with the popula-tion of the country on average, depth of outreach dia-monds provide a simple, intuitive measure of the typesof clients being served by a MFI. Box 9.6 illustrates thistechnique using data from credit-first and savings-firstMFIs in Sub-Saharan Africa.
Performance Standards and Variations
There is a multitude of performance indicators that anMFI might use to analyze its financial performance.The ones presented in this chapter have been drawnfrom a number of institutions, both semiformal andformal. To date, there is no standard set of ratios to usenor standard ranges of performance for the microfi-nance industry. However, there are currently severalefforts under way to establish a set of worldwide micro-
finance performance standards (Saltzman, Rock, andSalinger 1998):� ACCION recently developed and made public its
CAMEL system.� The Private Sector Initiatives Corporation is devel-
oping a rating agency.� CGAP and the World Bank are funding the
MicroBanking Financial Review.� DFID–Department for International Development
(UK) is funding the development of the BASEKenya “Micro Finance Institution Monitoring andAnalysis System.”
� USAID funded the PEARLS rating system as used bythe World Council of Credit Unions (WOCCU).In addition, various guides have been developed,
including the Small Enterprise Education andPromotion Network’s Financial Ratio Analysis of Micro-Finance Institutions, CGAP’s Management InformationSystems for Microfinance Institutions, and the Inter-American Development Bank’s Technical Guide for theAnalysis of Microenterprise Finance Institutions.
An overview of four of the most well-knownapproaches and of the ratios used is provided in boxes9.7–9.10.
P E R F O R M A N C E I N D I C A T O R S 227
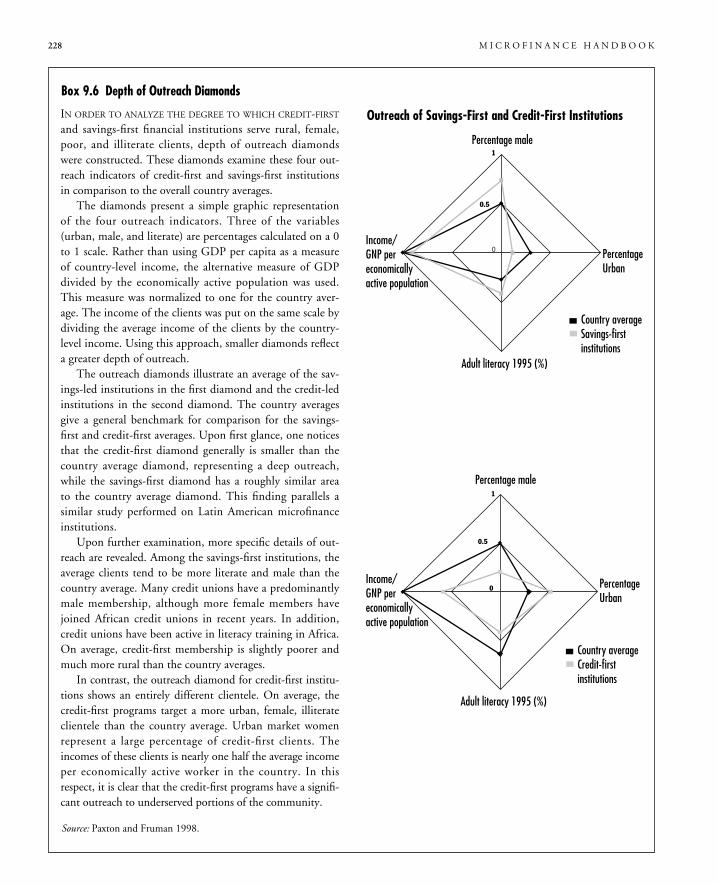
228 M I C R O F I N A N C E H A N D B O O K
IN ORDER TO ANALYZE THE DEGREE TO WHICH CREDIT-FIRST
and savings-first financial institutions serve rural, female,poor, and illiterate clients, depth of outreach diamondswere constructed. These diamonds examine these four out-reach indicators of credit-first and savings-first institutionsin comparison to the overall country averages.
The diamonds present a simple graphic representationof the four outreach indicators. Three of the variables(urban, male, and literate) are percentages calculated on a 0to 1 scale. Rather than using GDP per capita as a measureof country-level income, the alternative measure of GDPdivided by the economically active population was used.This measure was normalized to one for the country aver-age. The income of the clients was put on the same scale bydividing the average income of the clients by the country-level income. Using this approach, smaller diamonds reflecta greater depth of outreach.
The outreach diamonds illustrate an average of the sav-ings-led institutions in the first diamond and the credit-ledinstitutions in the second diamond. The country averagesgive a general benchmark for comparison for the savings-first and credit-first averages. Upon first glance, one noticesthat the credit-first diamond generally is smaller than thecountry average diamond, representing a deep outreach,while the savings-first diamond has a roughly similar areato the country average diamond. This finding parallels asimilar study performed on Latin American microfinanceinstitutions.
Upon further examination, more specific details of out-reach are revealed. Among the savings-first institutions, theaverage clients tend to be more literate and male than thecountry average. Many credit unions have a predominantlymale membership, although more female members havejoined African credit unions in recent years. In addition,credit unions have been active in literacy training in Africa.On average, credit-first membership is slightly poorer andmuch more rural than the country averages.
In contrast, the outreach diamond for credit-first institu-tions shows an entirely different clientele. On average, thecredit-first programs target a more urban, female, illiterateclientele than the country average. Urban market womenrepresent a large percentage of credit-first clients. Theincomes of these clients is nearly one half the average incomeper economically active worker in the country. In thisrespect, it is clear that the credit-first programs have a signifi-cant outreach to underserved portions of the community.
Box 9.6 Depth of Outreach Diamonds
Source: Paxton and Fruman 1998.
Outreach of Savings-First and Credit-First Institutions
Country averageSavings-firstinstitutions
Percentage male
PercentageUrban
PercentageUrban
Adult literacy 1995 (%)
Income/GNP pereconomicallyactive population
Country averageCredit-firstinstitutions
Percentage male
Adult literacy 1995 (%)
Income/GNP pereconomicallyactive population
1
0.5
0
1
0.5
0
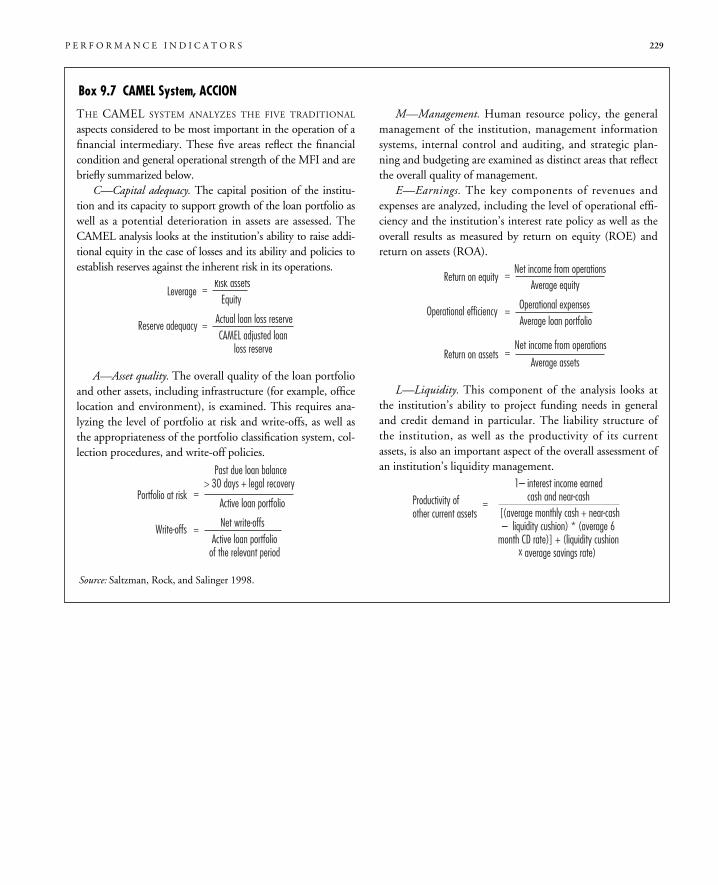
P E R F O R M A N C E I N D I C A T O R S 229
THE CAMEL SYSTEM ANALYZES THE FIVE TRADITIONAL
aspects considered to be most important in the operation of afinancial intermediary. These five areas reflect the financialcondition and general operational strength of the MFI and arebriefly summarized below.
C—Capital adequacy. The capital position of the institu-tion and its capacity to support growth of the loan portfolio aswell as a potential deterioration in assets are assessed. TheCAMEL analysis looks at the institution’s ability to raise addi-tional equity in the case of losses and its ability and policies toestablish reserves against the inherent risk in its operations.
A—Asset quality. The overall quality of the loan portfolioand other assets, including infrastructure (for example, officelocation and environment), is examined. This requires ana-lyzing the level of portfolio at risk and write-offs, as well asthe appropriateness of the portfolio classification system, col-lection procedures, and write-off policies.
M—Management. Human resource policy, the generalmanagement of the institution, management informationsystems, internal control and auditing, and strategic plan-ning and budgeting are examined as distinct areas that reflectthe overall quality of management.
E—Earnings. The key components of revenues andexpenses are analyzed, including the level of operational effi-ciency and the institution’s interest rate policy as well as theoverall results as measured by return on equity (ROE) andreturn on assets (ROA).
L—Liquidity. This component of the analysis looks atthe institution’s ability to project funding needs in generaland credit demand in particular. The liability structure ofthe institution, as well as the productivity of its currentassets, is also an important aspect of the overall assessment ofan institution’s liquidity management.
Productivity of other current assets
1– interest income earned
cash and near-cash [(average monthly cash + near-cash– liquidity cushion) * (average 6
month CD rate)] + (liquidity cushionx average savings rate)
=
Return on equity
Net income from operations=
Average equity
Return on assets
Net income from operations
=Average assets
Operational efficiency Operational expenses=Average loan portfolio
Portfolio at risk
Past due loan balance
> 30 days + legal recovery =
Active loan portfolio
Write-offs
Net write-offs=
Active loan portfolioof the relevant period
LeverageRisk assets=
Equity
Reserve adequacy
Actual loan loss reserve=CAMEL adjusted loan
loss reserve
Box 9.7 CAMEL System, ACCION
Source: Saltzman, Rock, and Salinger 1998.
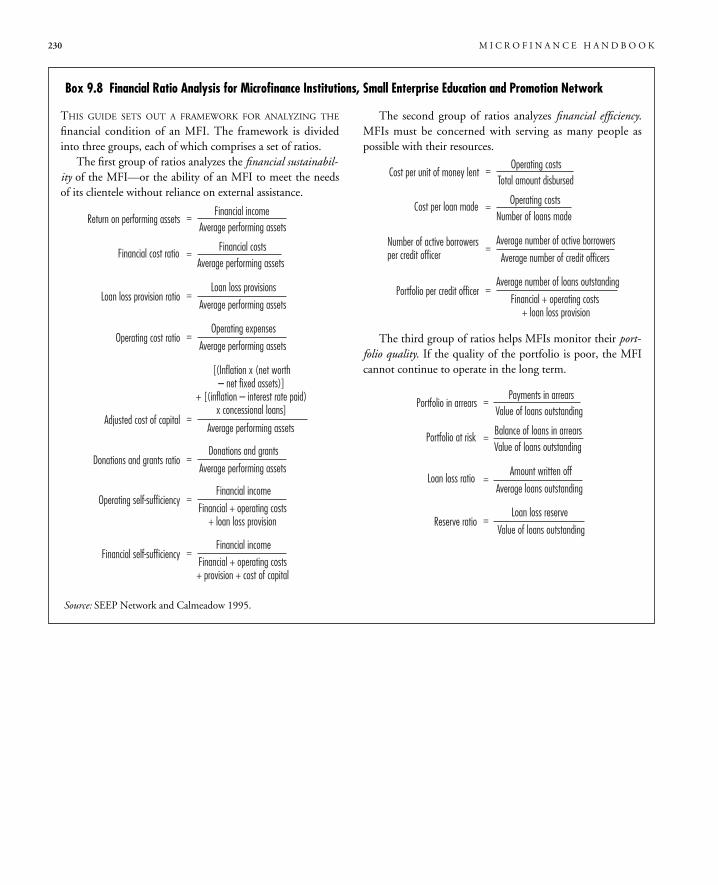
230 M I C R O F I N A N C E H A N D B O O K
THIS GUIDE SETS OUT A FRAMEWORK FOR ANALYZING THE
financial condition of an MFI. The framework is dividedinto three groups, each of which comprises a set of ratios.
The first group of ratios analyzes the financial sustainabil-ity of the MFI—or the ability of an MFI to meet the needsof its clientele without reliance on external assistance.
The second group of ratios analyzes financial efficiency.MFIs must be concerned with serving as many people aspossible with their resources.
The third group of ratios helps MFIs monitor their port-folio quality. If the quality of the portfolio is poor, the MFIcannot continue to operate in the long term.
Portfolio in arrears
Payments in arrears=
Value of loans outstanding
Loan loss ratioAmount written off
=Average loans outstanding
Reserve ratio
Loan loss reserve
=Value of loans outstanding
Portfolio at risk
Balance of loans in arrears=Value of loans outstanding
Cost per unit of money lent
Operating costs=
Total amount disbursed
Number of active borrowersper credit officer
Average number of active borrowers
=Average number of credit officers
Portfolio per credit officer
Average number of loans outstanding
=Financial + operating costs
+ loan loss provision
Cost per loan made Operating costs=Number of loans madeReturn on performing assets
Financial income=
Average performing assets
Loan loss provision ratioLoan loss provisions
=Average performing assets
Operating cost ratioOperating expenses
=Average performing assets
Donations and grants ratioDonations and grants
=Average performing assets
Financial self-sufficiencyFinancial income
=
Operating self-sufficiencyFinancial income
=Financial + operating costs
+ loan loss provision
Adjusted cost of capital
[(Inflation x (net worth– net fixed assets)]
+ [(inflation – interest rate paid)x concessional loans]
=Average performing assets
Financial cost ratio Financial costs=Average performing assets
Financial + operating costs+ provision + cost of capital
Box 9.8 Financial Ratio Analysis for Microfinance Institutions, Small Enterprise Education and Promotion Network
Source: SEEP Network and Calmeadow 1995.
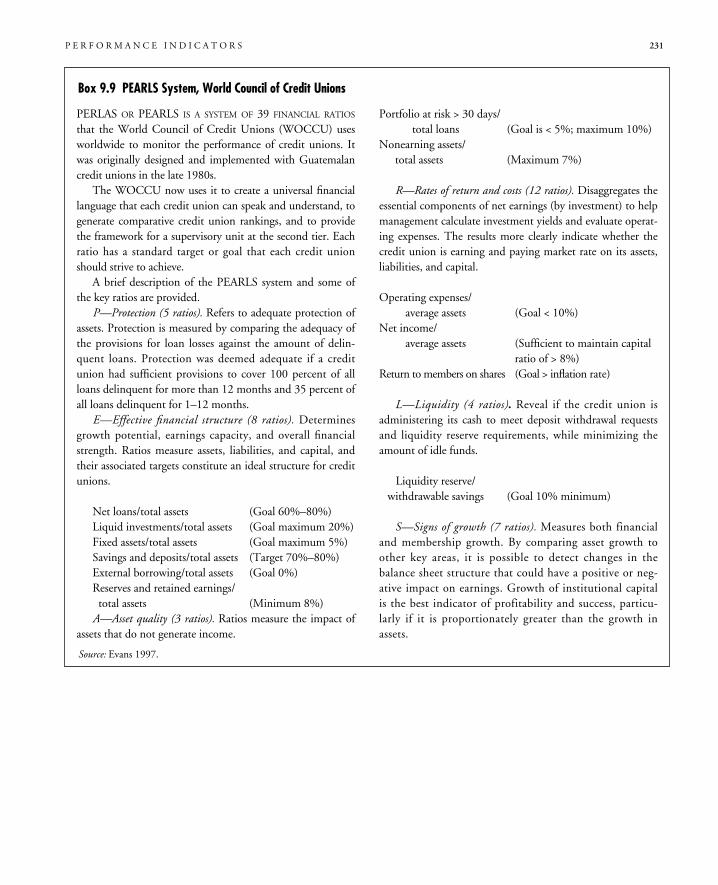
P E R F O R M A N C E I N D I C A T O R S 231
PERLAS OR PEARLS IS A SYSTEM OF 39 FINANCIAL RATIOS
that the World Council of Credit Unions (WOCCU) usesworldwide to monitor the performance of credit unions. Itwas originally designed and implemented with Guatemalancredit unions in the late 1980s.
The WOCCU now uses it to create a universal financiallanguage that each credit union can speak and understand, togenerate comparative credit union rankings, and to providethe framework for a supervisory unit at the second tier. Eachratio has a standard target or goal that each credit unionshould strive to achieve.
A brief description of the PEARLS system and some ofthe key ratios are provided.
P—Protection (5 ratios). Refers to adequate protection ofassets. Protection is measured by comparing the adequacy ofthe provisions for loan losses against the amount of delin-quent loans. Protection was deemed adequate if a creditunion had sufficient provisions to cover 100 percent of allloans delinquent for more than 12 months and 35 percent ofall loans delinquent for 1–12 months.
E—Effective financial structure (8 ratios). Determinesgrowth potential, earnings capacity, and overall financialstrength. Ratios measure assets, liabilities, and capital, andtheir associated targets constitute an ideal structure for creditunions.
Net loans/total assets (Goal 60%–80%)Liquid investments/total assets (Goal maximum 20%)Fixed assets/total assets (Goal maximum 5%)Savings and deposits/total assets (Target 70%–80%)External borrowing/total assets (Goal 0%)Reserves and retained earnings/total assets (Minimum 8%)
A—Asset quality (3 ratios). Ratios measure the impact ofassets that do not generate income.
Portfolio at risk > 30 days/total loans (Goal is < 5%; maximum 10%)
Nonearning assets/total assets (Maximum 7%)
R—Rates of return and costs (12 ratios). Disaggregates theessential components of net earnings (by investment) to helpmanagement calculate investment yields and evaluate operat-ing expenses. The results more clearly indicate whether thecredit union is earning and paying market rate on its assets,liabilities, and capital.
Operating expenses/average assets (Goal < 10%)
Net income/average assets (Sufficient to maintain capital
ratio of > 8%)Return to members on shares (Goal > inflation rate)
L—Liquidity (4 ratios). Reveal if the credit union isadministering its cash to meet deposit withdrawal requestsand liquidity reserve requirements, while minimizing theamount of idle funds.
Liquidity reserve/withdrawable savings (Goal 10% minimum)
S—Signs of growth (7 ratios). Measures both financialand membership growth. By comparing asset growth toother key areas, it is possible to detect changes in thebalance sheet structure that could have a positive or neg-ative impact on earnings. Growth of institutional capitalis the best indicator of profitability and success, particu-larly if it is proportionately greater than the growth inassets.
Box 9.9 PEARLS System, World Council of Credit Unions
Source: Evans 1997.
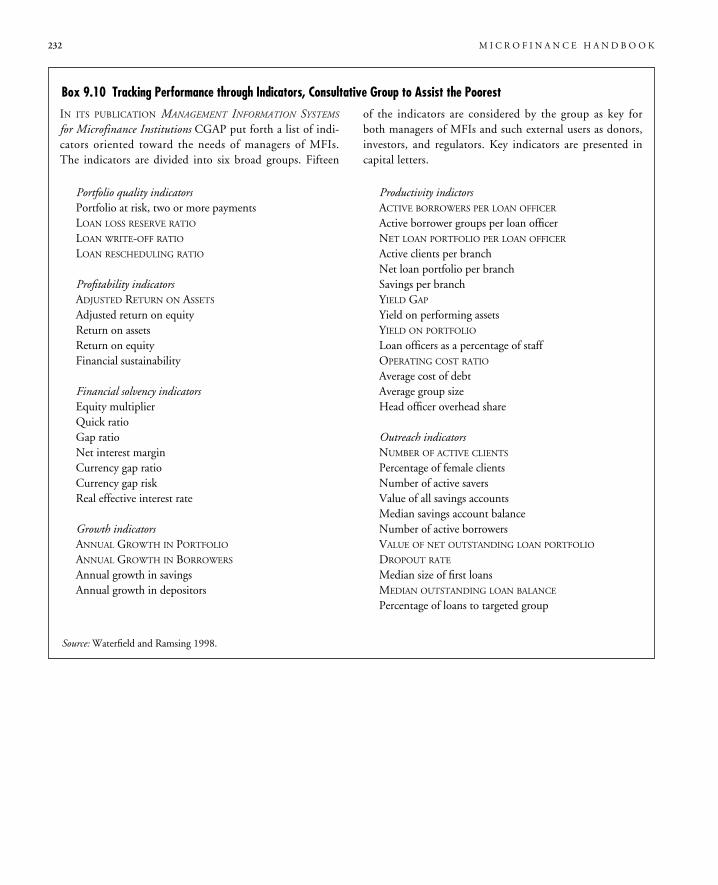
232 M I C R O F I N A N C E H A N D B O O K
IN ITS PUBLICATION MANAGEMENT INFORMATION SYSTEMS
for Microfinance Institutions CGAP put forth a list of indi-cators oriented toward the needs of managers of MFIs.The indicators are divided into six broad groups. Fifteen
of the indicators are considered by the group as key forboth managers of MFIs and such external users as donors,investors, and regulators. Key indicators are presented incapital letters.
Box 9.10 Tracking Performance through Indicators, Consultative Group to Assist the Poorest
Source: Waterfield and Ramsing 1998.
Portfolio quality indicatorsPortfolio at risk, two or more paymentsLOAN LOSS RESERVE RATIO
LOAN WRITE-OFF RATIO
LOAN RESCHEDULING RATIO
Profitability indicatorsADJUSTED RETURN ON ASSETS
Adjusted return on equityReturn on assetsReturn on equityFinancial sustainability
Financial solvency indicatorsEquity multiplierQuick ratioGap ratioNet interest marginCurrency gap ratioCurrency gap riskReal effective interest rate
Growth indicatorsANNUAL GROWTH IN PORTFOLIO
ANNUAL GROWTH IN BORROWERS
Annual growth in savingsAnnual growth in depositors
Productivity indictorsACTIVE BORROWERS PER LOAN OFFICER
Active borrower groups per loan officerNET LOAN PORTFOLIO PER LOAN OFFICER
Active clients per branchNet loan portfolio per branchSavings per branchYIELD GAP
Yield on performing assetsYIELD ON PORTFOLIO
Loan officers as a percentage of staffOPERATING COST RATIO
Average cost of debtAverage group sizeHead officer overhead share
Outreach indicatorsNUMBER OF ACTIVE CLIENTS
Percentage of female clientsNumber of active saversValue of all savings accountsMedian savings account balanceNumber of active borrowersVALUE OF NET OUTSTANDING LOAN PORTFOLIO
DROPOUT RATE
Median size of first loansMEDIAN OUTSTANDING LOAN BALANCE
Percentage of loans to targeted group
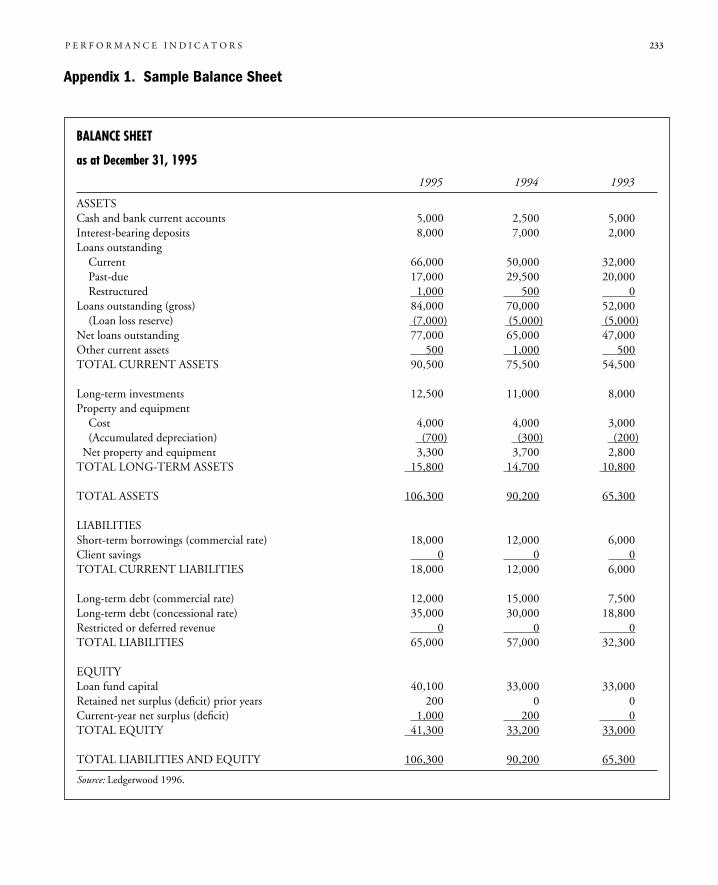
Appendix 1. Sample Balance Sheet
P E R F O R M A N C E I N D I C A T O R S 233
BALANCE SHEET
as at December 31, 1995
1995 1994 1993
ASSETSCash and bank current accounts 5,000 2,500 5,000Interest-bearing deposits 8,000 7,000 2,000Loans outstanding
Current 66,000 50,000 32,000Past-due 17,000 29,500 20,000Restructured 1,000 500 0
Loans outstanding (gross) 84,000 70,000 52,000(Loan loss reserve) (7,000) (5,000) (5,000)
Net loans outstanding 77,000 65,000 47,000Other current assets 500 1,000 500TOTAL CURRENT ASSETS 90,500 75,500 54,500
Long-term investments 12,500 11,000 8,000Property and equipment
Cost 4,000 4,000 3,000(Accumulated depreciation) (700) (300) (200)
Net property and equipment 3,300 3,700 2,800TOTAL LONG-TERM ASSETS 15,800 14,700 10,800
TOTAL ASSETS 106,300 90,200 65,300
LIABILITIESShort-term borrowings (commercial rate) 18,000 12,000 6,000Client savings 0 0 0TOTAL CURRENT LIABILITIES 18,000 12,000 6,000
Long-term debt (commercial rate) 12,000 15,000 7,500Long-term debt (concessional rate) 35,000 30,000 18,800Restricted or deferred revenue 0 0 0TOTAL LIABILITIES 65,000 57,000 32,300
EQUITYLoan fund capital 40,100 33,000 33,000Retained net surplus (deficit) prior years 200 0 0Current-year net surplus (deficit) 1,000 200 0TOTAL EQUITY 41,300 33,200 33,000
TOTAL LIABILITIES AND EQUITY 106,300 90,200 65,300
Source: Ledgerwood 1996.
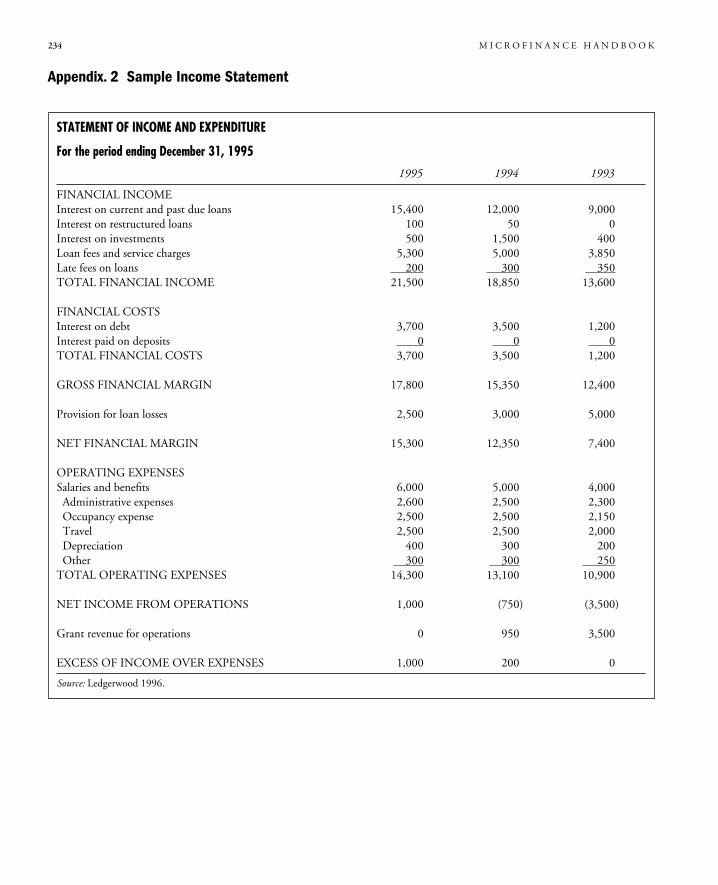
234 M I C R O F I N A N C E H A N D B O O K
STATEMENT OF INCOME AND EXPENDITURE
For the period ending December 31, 1995
1995 1994 1993
FINANCIAL INCOMEInterest on current and past due loans 15,400 12,000 9,000Interest on restructured loans 100 50 0Interest on investments 500 1,500 400Loan fees and service charges 5,300 5,000 3,850Late fees on loans 200 300 350TOTAL FINANCIAL INCOME 21,500 18,850 13,600
FINANCIAL COSTSInterest on debt 3,700 3,500 1,200Interest paid on deposits 0 0 0TOTAL FINANCIAL COSTS 3,700 3,500 1,200
GROSS FINANCIAL MARGIN 17,800 15,350 12,400
Provision for loan losses 2,500 3,000 5,000
NET FINANCIAL MARGIN 15,300 12,350 7,400
OPERATING EXPENSESSalaries and benefits 6,000 5,000 4,000Administrative expenses 2,600 2,500 2,300Occupancy expense 2,500 2,500 2,150Travel 2,500 2,500 2,000Depreciation 400 300 200Other 300 300 250
TOTAL OPERATING EXPENSES 14,300 13,100 10,900
NET INCOME FROM OPERATIONS 1,000 (750) (3,500)
Grant revenue for operations 0 950 3,500
EXCESS OF INCOME OVER EXPENSES 1,000 200 0
Source: Ledgerwood 1996.
Appendix. 2 Sample Income Statement
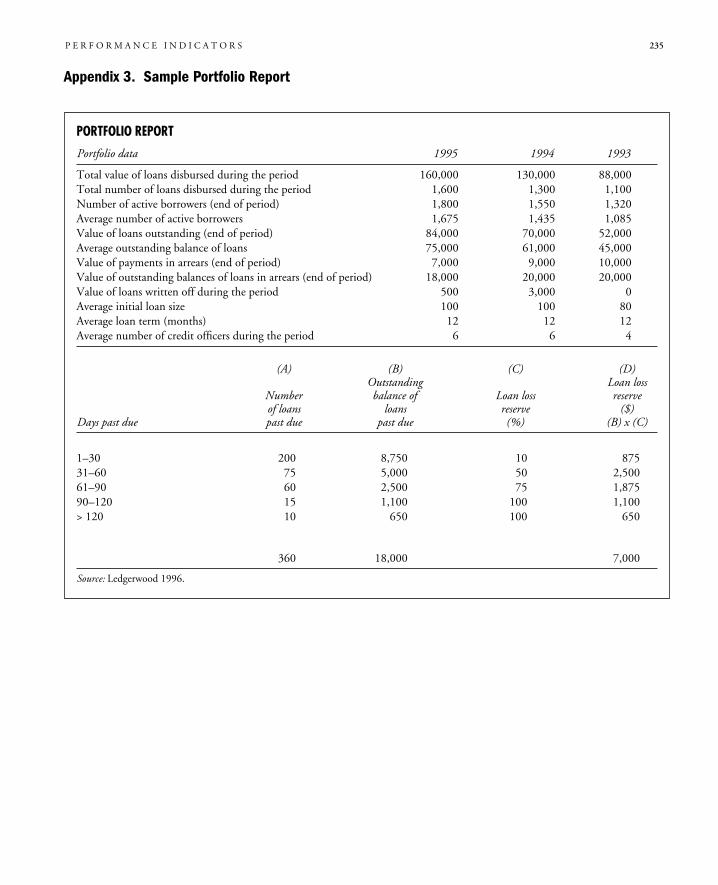
Appendix 3. Sample Portfolio Report
P E R F O R M A N C E I N D I C A T O R S 235
PORTFOLIO REPORT
Portfolio data 1995 1994 1993
Total value of loans disbursed during the period 160,000 130,000 88,000Total number of loans disbursed during the period 1,600 1,300 1,100Number of active borrowers (end of period) 1,800 1,550 1,320Average number of active borrowers 1,675 1,435 1,085Value of loans outstanding (end of period) 84,000 70,000 52,000Average outstanding balance of loans 75,000 61,000 45,000Value of payments in arrears (end of period) 7,000 9,000 10,000Value of outstanding balances of loans in arrears (end of period) 18,000 20,000 20,000Value of loans written off during the period 500 3,000 0Average initial loan size 100 100 80Average loan term (months) 12 12 12Average number of credit officers during the period 6 6 4
(A) (B) (C) (D)Outstanding Loan loss
Number balance of Loan loss reserveof loans loans reserve ($)
Days past due past due past due (%) (B) x (C)
1–30 200 8,750 10 87531–60 75 5,000 50 2,50061–90 60 2,500 75 1,87590–120 15 1,100 100 1,100> 120 10 650 100 650
360 18,000 7,000
Source: Ledgerwood 1996.
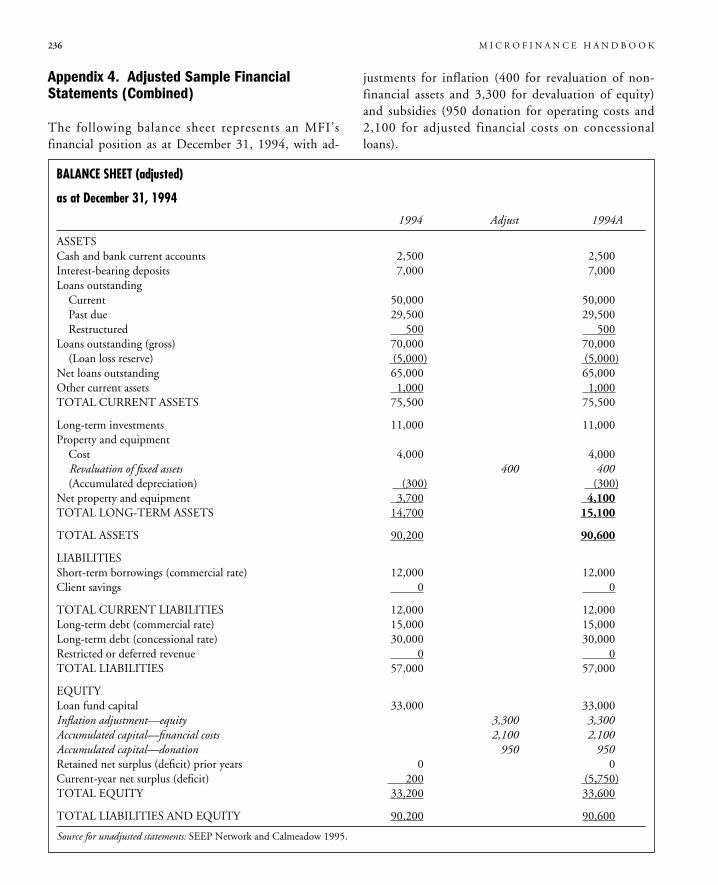
Appendix 4. Adjusted Sample FinancialStatements (Combined)
The following balance sheet represents an MFI’sfinancial position as at December 31, 1994, with ad-
justments for inflation (400 for revaluation of non-financial assets and 3,300 for devaluation of equity)and subsidies (950 donation for operating costs and2,100 for adjusted financial costs on concessionalloans).
236 M I C R O F I N A N C E H A N D B O O K
BALANCE SHEET (adjusted)
as at December 31, 1994
1994 Adjust 1994A
ASSETSCash and bank current accounts 2,500 2,500Interest-bearing deposits 7,000 7,000Loans outstanding
Current 50,000 50,000Past due 29,500 29,500Restructured 500 500
Loans outstanding (gross) 70,000 70,000(Loan loss reserve) (5,000) (5,000)
Net loans outstanding 65,000 65,000Other current assets 1,000 1,000TOTAL CURRENT ASSETS 75,500 75,500
Long-term investments 11,000 11,000Property and equipment
Cost 4,000 4,000Revaluation of fixed assets 400 400(Accumulated depreciation) (300) (300)
Net property and equipment 3,700 4,100TOTAL LONG-TERM ASSETS 14,700 15,100
TOTAL ASSETS 90,200 90,600
LIABILITIESShort-term borrowings (commercial rate) 12,000 12,000Client savings 0 0
TOTAL CURRENT LIABILITIES 12,000 12,000Long-term debt (commercial rate) 15,000 15,000Long-term debt (concessional rate) 30,000 30,000Restricted or deferred revenue 0 0TOTAL LIABILITIES 57,000 57,000
EQUITYLoan fund capital 33,000 33,000Inflation adjustment—equity 3,300 3,300Accumulated capital—financial costs 2,100 2,100Accumulated capital—donation 950 950Retained net surplus (deficit) prior years 0 0Current-year net surplus (deficit) 200 (5,750)TOTAL EQUITY 33,200 33,600
TOTAL LIABILITIES AND EQUITY 90,200 90,600
Source for unadjusted statements: SEEP Network and Calmeadow 1995.
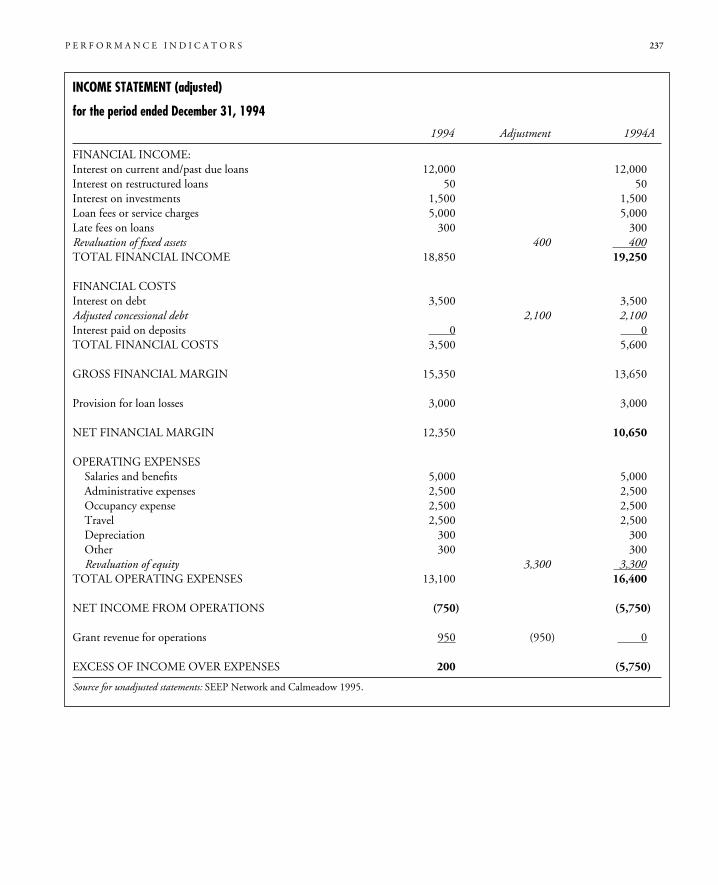
P E R F O R M A N C E I N D I C A T O R S 237
INCOME STATEMENT (adjusted)
for the period ended December 31, 1994
1994 Adjustment 1994A
FINANCIAL INCOME:Interest on current and/past due loans 12,000 12,000Interest on restructured loans 50 50Interest on investments 1,500 1,500Loan fees or service charges 5,000 5,000Late fees on loans 300 300Revaluation of fixed assets 400 400TOTAL FINANCIAL INCOME 18,850 19,250
FINANCIAL COSTSInterest on debt 3,500 3,500Adjusted concessional debt 2,100 2,100Interest paid on deposits 0 0TOTAL FINANCIAL COSTS 3,500 5,600
GROSS FINANCIAL MARGIN 15,350 13,650
Provision for loan losses 3,000 3,000
NET FINANCIAL MARGIN 12,350 10,650
OPERATING EXPENSESSalaries and benefits 5,000 5,000Administrative expenses 2,500 2,500Occupancy expense 2,500 2,500Travel 2,500 2,500Depreciation 300 300Other 300 300Revaluation of equity 3,300 3,300
TOTAL OPERATING EXPENSES 13,100 16,400
NET INCOME FROM OPERATIONS (750) (5,750)
Grant revenue for operations 950 (950) 0
EXCESS OF INCOME OVER EXPENSES 200 (5,750)
Source for unadjusted statements: SEEP Network and Calmeadow 1995.
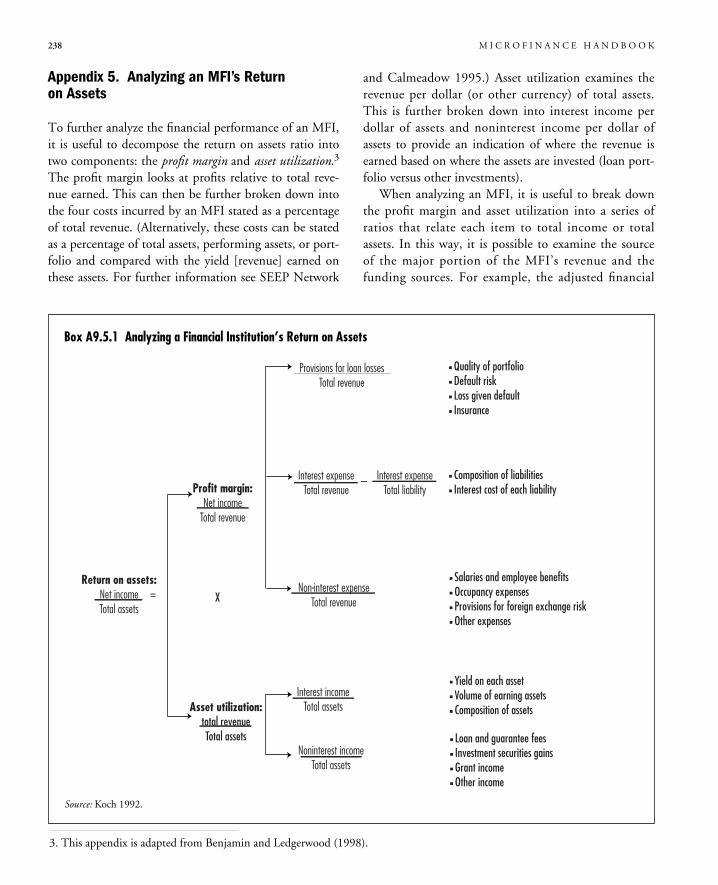
238 M I C R O F I N A N C E H A N D B O O K
Appendix 5. Analyzing an MFI’s Returnon Assets
To further analyze the financial performance of an MFI,it is useful to decompose the return on assets ratio intotwo components: the profit margin and asset utilization.3
The profit margin looks at profits relative to total reve-nue earned. This can then be further broken down intothe four costs incurred by an MFI stated as a percentageof total revenue. (Alternatively, these costs can be statedas a percentage of total assets, performing assets, or port-folio and compared with the yield [revenue] earned onthese assets. For further information see SEEP Network
and Calmeadow 1995.) Asset utilization examines therevenue per dollar (or other currency) of total assets.This is further broken down into interest income perdollar of assets and noninterest income per dollar ofassets to provide an indication of where the revenue isearned based on where the assets are invested (loan port-folio versus other investments).
When analyzing an MFI, it is useful to break downthe profit margin and asset utilization into a series ofratios that relate each item to total income or totalassets. In this way, it is possible to examine the sourceof the major portion of the MFI’s revenue and thefunding sources. For example, the adjusted financial
Profit margin:Net income
Total revenue
Provisions for loan lossesTotal revenue
Interest expenseTotal revenue
Non-interest expenseTotal revenue
Interest incomeTotal assetsAsset utilization:
total revenueTotal assets
Interest expenseTotal liability
–
X
Noninterest incomeTotal assets
Return on assets:Net incomeTotal assets
=
Box A9.5.1 Analyzing a Financial Institution’s Return on Assets
Source: Koch 1992.
3. This appendix is adapted from Benjamin and Ledgerwood (1998).
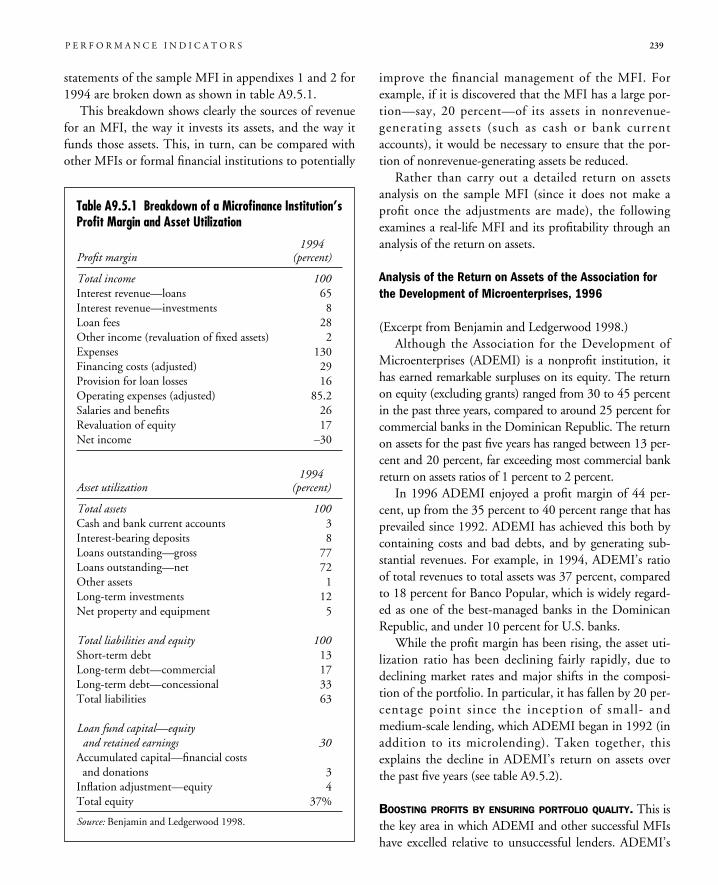
statements of the sample MFI in appendixes 1 and 2 for1994 are broken down as shown in table A9.5.1.
This breakdown shows clearly the sources of revenuefor an MFI, the way it invests its assets, and the way itfunds those assets. This, in turn, can be compared withother MFIs or formal financial institutions to potentially
improve the financial management of the MFI. Forexample, if it is discovered that the MFI has a large por-tion—say, 20 percent—of its assets in nonrevenue-generating assets (such as cash or bank currentaccounts), it would be necessary to ensure that the por-tion of nonrevenue-generating assets be reduced.
Rather than carry out a detailed return on assetsanalysis on the sample MFI (since it does not make aprofit once the adjustments are made), the followingexamines a real-life MFI and its profitability through ananalysis of the return on assets.
Analysis of the Return on Assets of the Association forthe Development of Microenterprises, 1996
(Excerpt from Benjamin and Ledgerwood 1998.)Although the Association for the Development of
Microenterprises (ADEMI) is a nonprofit institution, ithas earned remarkable surpluses on its equity. The returnon equity (excluding grants) ranged from 30 to 45 percentin the past three years, compared to around 25 percent forcommercial banks in the Dominican Republic. The returnon assets for the past five years has ranged between 13 per-cent and 20 percent, far exceeding most commercial bankreturn on assets ratios of 1 percent to 2 percent.
In 1996 ADEMI enjoyed a profit margin of 44 per-cent, up from the 35 percent to 40 percent range that hasprevailed since 1992. ADEMI has achieved this both bycontaining costs and bad debts, and by generating sub-stantial revenues. For example, in 1994, ADEMI’s ratioof total revenues to total assets was 37 percent, comparedto 18 percent for Banco Popular, which is widely regard-ed as one of the best-managed banks in the DominicanRepublic, and under 10 percent for U.S. banks.
While the profit margin has been rising, the asset uti-lization ratio has been declining fairly rapidly, due todeclining market rates and major shifts in the composi-tion of the portfolio. In particular, it has fallen by 20 per-centage point since the inception of small- andmedium-scale lending, which ADEMI began in 1992 (inaddition to its microlending). Taken together, thisexplains the decline in ADEMI’s return on assets overthe past five years (see table A9.5.2).
BOOSTING PROFITS BY ENSURING PORTFOLIO QUALITY. This isthe key area in which ADEMI and other successful MFIshave excelled relative to unsuccessful lenders. ADEMI’s
P E R F O R M A N C E I N D I C A T O R S 239
Table A9.5.1 Breakdown of a Microfinance Institution’sProfit Margin and Asset Utilization
1994Profit margin (percent)
Total income 100Interest revenue—loans 65Interest revenue—investments 8Loan fees 28Other income (revaluation of fixed assets) 2Expenses 130Financing costs (adjusted) 29Provision for loan losses 16Operating expenses (adjusted) 85.2Salaries and benefits 26Revaluation of equity 17Net income –30
1994Asset utilization (percent)
Total assets 100Cash and bank current accounts 3Interest-bearing deposits 8Loans outstanding—gross 77Loans outstanding—net 72Other assets 1Long-term investments 12Net property and equipment 5
Total liabilities and equity 100Short-term debt 13Long-term debt—commercial 17Long-term debt—concessional 33Total liabilities 63
Loan fund capital—equityand retained earnings 30
Accumulated capital—financial costsand donations 3
Inflation adjustment—equity 4Total equity 37%
Source: Benjamin and Ledgerwood 1998.
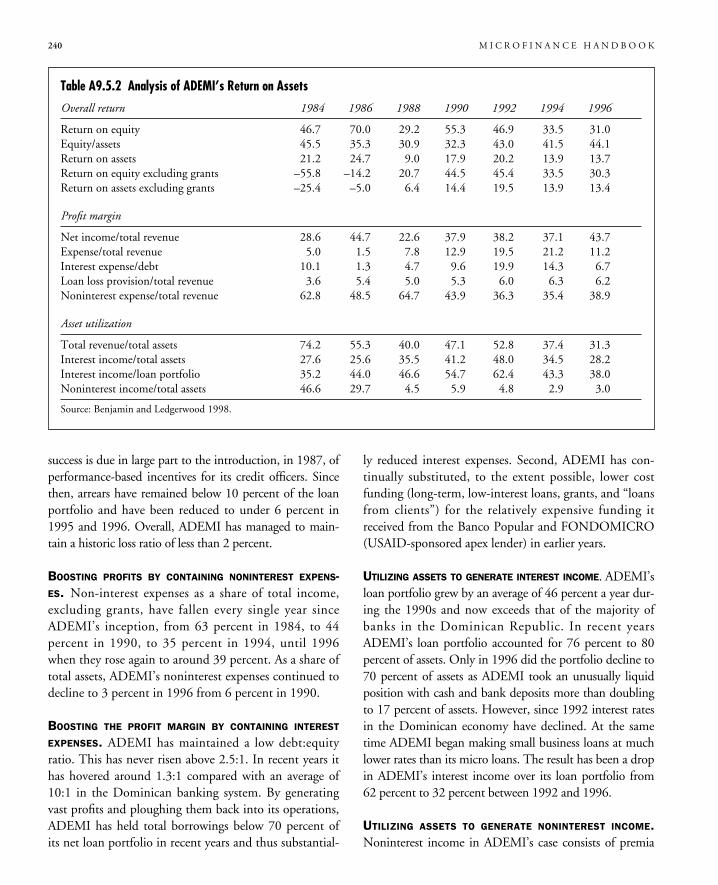
success is due in large part to the introduction, in 1987, ofperformance-based incentives for its credit officers. Sincethen, arrears have remained below 10 percent of the loanportfolio and have been reduced to under 6 percent in1995 and 1996. Overall, ADEMI has managed to main-tain a historic loss ratio of less than 2 percent.
BOOSTING PROFITS BY CONTAINING NONINTEREST EXPENS-ES. Non-interest expenses as a share of total income,excluding grants, have fallen every single year sinceADEMI’s inception, from 63 percent in 1984, to 44percent in 1990, to 35 percent in 1994, until 1996when they rose again to around 39 percent. As a share oftotal assets, ADEMI’s noninterest expenses continued todecline to 3 percent in 1996 from 6 percent in 1990.
BOOSTING THE PROFIT MARGIN BY CONTAINING INTEREST
EXPENSES. ADEMI has maintained a low debt:equityratio. This has never risen above 2.5:1. In recent years ithas hovered around 1.3:1 compared with an average of10:1 in the Dominican banking system. By generatingvast profits and ploughing them back into its operations,ADEMI has held total borrowings below 70 percent ofits net loan portfolio in recent years and thus substantial-
ly reduced interest expenses. Second, ADEMI has con-tinually substituted, to the extent possible, lower costfunding (long-term, low-interest loans, grants, and “loansfrom clients”) for the relatively expensive funding itreceived from the Banco Popular and FONDOMICRO(USAID-sponsored apex lender) in earlier years.
UTILIZING ASSETS TO GENERATE INTEREST INCOME. ADEMI’sloan portfolio grew by an average of 46 percent a year dur-ing the 1990s and now exceeds that of the majority ofbanks in the Dominican Republic. In recent yearsADEMI’s loan portfolio accounted for 76 percent to 80percent of assets. Only in 1996 did the portfolio decline to70 percent of assets as ADEMI took an unusually liquidposition with cash and bank deposits more than doublingto 17 percent of assets. However, since 1992 interest ratesin the Dominican economy have declined. At the sametime ADEMI began making small business loans at muchlower rates than its micro loans. The result has been a dropin ADEMI’s interest income over its loan portfolio from62 percent to 32 percent between 1992 and 1996.
UTILIZING ASSETS TO GENERATE NONINTEREST INCOME.Noninterest income in ADEMI’s case consists of premia
240 M I C R O F I N A N C E H A N D B O O K
Table A9.5.2 Analysis of ADEMI’s Return on Assets
Overall return 1984 1986 1988 1990 1992 1994 1996
Return on equity 46.7 70.0 29.2 55.3 46.9 33.5 31.0Equity/assets 45.5 35.3 30.9 32.3 43.0 41.5 44.1Return on assets 21.2 24.7 9.0 17.9 20.2 13.9 13.7Return on equity excluding grants –55.8 –14.2 20.7 44.5 45.4 33.5 30.3Return on assets excluding grants –25.4 –5.0 6.4 14.4 19.5 13.9 13.4
Profit margin
Net income/total revenue 28.6 44.7 22.6 37.9 38.2 37.1 43.7Expense/total revenue 5.0 1.5 7.8 12.9 19.5 21.2 11.2Interest expense/debt 10.1 1.3 4.7 9.6 19.9 14.3 6.7Loan loss provision/total revenue 3.6 5.4 5.0 5.3 6.0 6.3 6.2Noninterest expense/total revenue 62.8 48.5 64.7 43.9 36.3 35.4 38.9
Asset utilization
Total revenue/total assets 74.2 55.3 40.0 47.1 52.8 37.4 31.3Interest income/total assets 27.6 25.6 35.5 41.2 48.0 34.5 28.2Interest income/loan portfolio 35.2 44.0 46.6 54.7 62.4 43.3 38.0Noninterest income/total assets 46.6 29.7 4.5 5.9 4.8 2.9 3.0
Source: Benjamin and Ledgerwood 1998.
on life insurance policies, which are mandatory for unse-cured microenterprise loans and are assessed at a rate of 28basis points per peso lent, income from disposition ofacquired assets, fee income from Banco Popular related tothe ADEMI MasterCard, and income from grants. (WhileADEMI charges up-front fees on loans, these are classifiedunder interest income.) Since 1992 there has been onlyone year in which grants accounted for more than 1.2 per-cent of total revenue. While other noninterest income hasgrown slightly as a share of total income, rising to aroundnine percent by 1996, it has declined relative to totalassets, from 4.2 percent in 1992 to 2.7 percent in 1996.
Sources and Further Reading
Bartel, Margaret, Michael J. McCord, and Robin R. Bell. 1995.Financial Management Ratios I: Analyzing Profitability inMicrocredit Programs. GEMINI Technical Note 7. FinancialAssistance to Microenterprise Programs: DevelopmentAlternatives Inc. Washington, D.C.: USAID.
Benjamin, McDonald, and Joanna Ledgerwood. 1998. “TheAssociation for the Development of Microenterprises(ADEMI): ‘Democratising Credit’ in the DominicanRepublic.” Case Study for the Sustainable Banking with thePoor Project, World Bank, Washington, D.C.
Christen, Robert, Elisabeth Rhyne, Robert Vogel, andCressida McKean. 1995. Maximizing the Outreach ofMicroenterprise Finance: An Analysis of Successful Micro-finance Programs. Program and Operations AssessmentReport 10. U.S. Agency for International Development,Washington, D.C.
CGAP (Consultative Group to Assist the Poorest). 1997.Format for Appraisal of Micro-Finance Institutions. WorldBank, Washington, D.C.
Evans, AnnaCor. 1997. “PEARLS: A Tool for FinancialStabilization, Monitoring, and Evaluation.” NEXUSNewsletter 38. Small Enterprise Education and PromotionNetwork, New York.
Koch, Timothy. 1992. Bank Management. 2d ed. Chicago:Dryden Press.
Ledgerwood, Joanna. 1995. “Philippines Poverty StrategyReport: Access to Credit for the Poor.” World Bank, EastAsia Country Department, Washington, D.C.
Ledgerwood, Joanna. 1996. Financial Management Training forMicrofinance Organizations: Finance Study Guide. NewYork: PACT Publications (for Calmeadow).
Ledgerwood, Joanna, and Kerri Moloney. 1996. FinancialManagement Training for Microfinance Organizations:
Accounting Study Guide. New York: PACT Publications(for Calmeadow).
Paxton, Julia. 1997. “Guatemala CARE Village Banks Project.”Case Study for the Sustainable Banking with the PoorProject, World Bank, Washington, D.C.
Paxton, Julia, and Carlos Cuevas. 1997. “Outreach andSustainability of Member-Based Rural FinancialIntermediaries.” Sustainable Banking with the Poor Project,World Bank, Washington, D.C.
Paxton, Julia, and Cecile Fruman. 1998. “Outreach andSustainability of Savings-First vs. Credit-First FinancialInstitutions: A Comparative Analysis of Eight MicrofinanceInstitutions in Africa.” Sustainable Banking with the PoorProject, World Bank, Washington, D.C.
Saltzman, Sonia B., Rachel Rock, and Darcy Salinger. 1998.Performance and Standards in Microfinance: ACCION’sExperience with the CAMEL Instrument. DiscussionDocument 7. Washington, D.C.: ACCION International.
SEEP (Small Enterprise Education and Promotion) Networkand Calmeadow. 1995. Financial Ratio Analysis of Micro-Finance Institutions. New York: PACT Publications.
Stearns, Katherine. 1991. The Hidden Beast: Delinquency inMicroenterprise Programs. Washington, D.C.: ACCIONInternational.
Vogel, Robert C. 1988. “Measurement of Loan RepaymentPerformance: Basic Considerations and Major Issues.”World Bank, Economic Development Institute,Washington, D.C.
Von Pischke, J.D. 1991. Finance at the Frontier: Debt Capacityand the Role of Credit in the Private Economy. Washington,D.C.: World Bank, Economic Development Institute.
———.1994. “Measuring the Performance of Small EnterpriseLenders.” Paper prepared for a conference on FinancialServices and the Poor, Brookings Institution, September28–30, Washington, D.C.
Waterfield, Charles, and Nick Ramsing. 1998. “ManagementInformation Systems for Microfinance Institutions: AHandbook.” Prepared for the Consultative Group to Assistthe Poorest by Deloitte Touche Tohmatsu International inassociation with MEDA Trade & Consulting andShorebank Advisory Services, Washington, D.C.
Yaron, Jacob. 1992a. Assessing Development Finance Institutions:A Public Interest Analysis. World Bank Discussion Paper174. Washington, D.C.
———. 1992b. Successful Rural Finance Institutions. WorldBank Discussion Paper 150. Washington, D.C.
Yaron, Jacob, McDonald P. Benjamin Jr., and Gerda L. Piprek.1997. Rural Finance: Issues, Design, and Best Practices.Environmentally and Socially Sustainable DevelopmentStudies and Monographs Series 14. Washington, D.C.:World Bank.
P E R F O R M A N C E I N D I C A T O R S 241

243
PerformanceManagement
C H A P T E R T E N
The effective financial management of an MFIrequires an understanding of how various opera-tional issues affect financial performance. The per-
formance indicators presented in chapter 9 provide a meansof analyzing the financial performance of an MFI anddetermining the improvements that might be required.This chapter offers information on effectively managing thefinancial and operational aspects of an MFI to improve per-formance.
It addresses three main areas of performance manage-ment:� Delinquency� Productivity and efficiency� Risk, including liquidity and interest rate risk, foreign
exchange risk, and operating risk (credit risk is dis-cussed under delinquency management).Much of the focus in this chapter is on controlling
costs and increasing revenue. Profitability and financialviability are not discussed here, because financial viabilityis a result of dealing successfully with all of the issues dis-cussed in parts II and III of this handbook. Specifically,once MFIs have determined appropriate demand, theymust then develop and price their products (chapters 5and 6), create effective and useful management informa-tion systems (chapter 7), produce accurate and timelyfinancial statements (chapter 8), calculate appropriate andrelevant performance indicators (chapter 9), and effective-ly manage delinquency, productivity, liquidity risk, inter-est rate risk, and operating risk (chapter 10). Thus thischapter, while not directly addressing financial viabilityissues, does address the financial management issues thatultimately affect financial viability.
Effective performance management is of concern pri-marily to practitioners and consultants, because it is theywho must implement or advise on effective financial man-agement tools and policies. Donors will be interested inthis chapter to the extent that they must ensure that theMFIs they support are moving toward developing manage-ment practices that will result in financial sustainability.1
Delinquency Management
Delinquent loans play a critical role in an MFI’s expenses,cash flow, revenue, and profitability.
Additional efforts to collect delinquent loans usuallymean additional expenses for closer monitoring, more fre-quent visits to borrowers, more extensive analysis of theportfolio, legal fees for pursuing seriously delinquentborrowers, and so forth. The more time, effort, andresources that are put into controlling delinquency, theless there are available for the MFI to reach new borrow-ers and expand services or outreach.
Delinquency can result in a slower turnover of theloan portfolio and an inability to pay expenses due toreduced cash flow. If loan principal is not recovered atthe scheduled time, loans to other borrowers cannot bemade, and payment of some expenses may also have tobe delayed. Also, with reduced cash flow, the MFI maybe unable to make timely repayment of borrowed fundsor meet the demand for savings withdrawals.
Delinquent loans also result in postponed or lostinterest revenue. To determine the amount of post-poned revenue resulting from delinquent loans, the
1. Portions of this chapter are based on material originally published in Ledgerwood (1996).
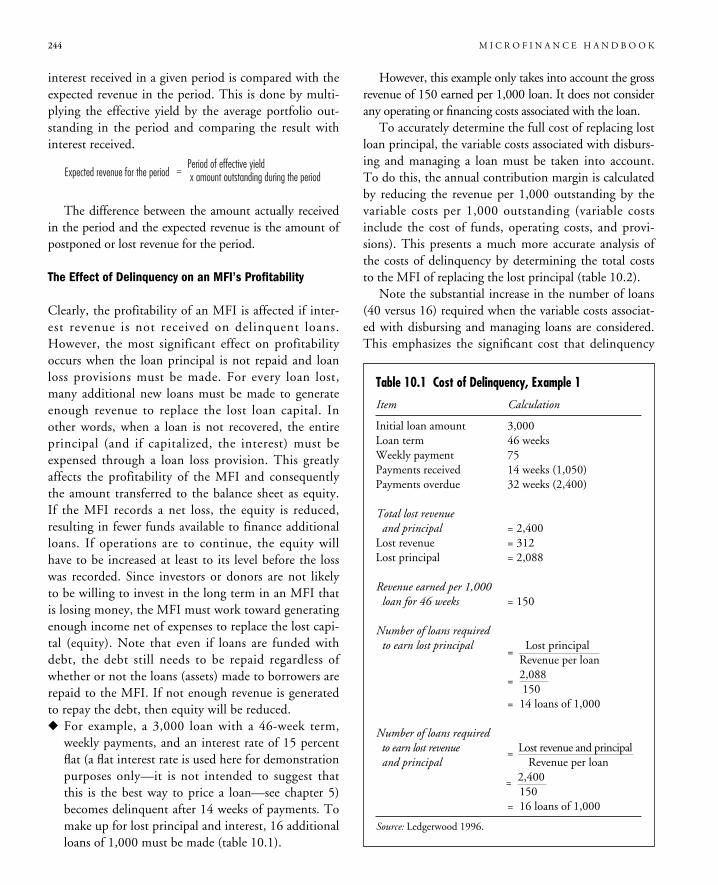
244 M I C R O F I N A N C E H A N D B O O K
interest received in a given period is compared with theexpected revenue in the period. This is done by multi-plying the effective yield by the average portfolio out-standing in the period and comparing the result withinterest received.
The difference between the amount actually receivedin the period and the expected revenue is the amount ofpostponed or lost revenue for the period.
The Effect of Delinquency on an MFI’s Profitability
Clearly, the profitability of an MFI is affected if inter-est revenue is not received on delinquent loans.However, the most significant effect on profitabilityoccurs when the loan principal is not repaid and loanloss provisions must be made. For every loan lost,many additional new loans must be made to generateenough revenue to replace the lost loan capital. Inother words, when a loan is not recovered, the entireprincipal (and if capitalized, the interest) must beexpensed through a loan loss provision. This greatlyaffects the profitability of the MFI and consequentlythe amount transferred to the balance sheet as equity.If the MFI records a net loss, the equity is reduced,resulting in fewer funds available to finance additionalloans. If operations are to continue, the equity willhave to be increased at least to its level before the losswas recorded. Since investors or donors are not likelyto be willing to invest in the long term in an MFI thatis losing money, the MFI must work toward generatingenough income net of expenses to replace the lost capi-tal (equity). Note that even if loans are funded withdebt, the debt still needs to be repaid regardless ofwhether or not the loans (assets) made to borrowers arerepaid to the MFI. If not enough revenue is generatedto repay the debt, then equity will be reduced.� For example, a 3,000 loan with a 46-week term,
weekly payments, and an interest rate of 15 percentflat (a flat interest rate is used here for demonstrationpurposes only—it is not intended to suggest thatthis is the best way to price a loan—see chapter 5)becomes delinquent after 14 weeks of payments. Tomake up for lost principal and interest, 16 additionalloans of 1,000 must be made (table 10.1).
However, this example only takes into account the grossrevenue of 150 earned per 1,000 loan. It does not considerany operating or financing costs associated with the loan.
To accurately determine the full cost of replacing lostloan principal, the variable costs associated with disburs-ing and managing a loan must be taken into account.To do this, the annual contribution margin is calculatedby reducing the revenue per 1,000 outstanding by thevariable costs per 1,000 outstanding (variable costsinclude the cost of funds, operating costs, and provi-sions). This presents a much more accurate analysis ofthe costs of delinquency by determining the total coststo the MFI of replacing the lost principal (table 10.2).
Note the substantial increase in the number of loans(40 versus 16) required when the variable costs associat-ed with disbursing and managing loans are considered.This emphasizes the significant cost that delinquency
Period of effective yieldx amount outstanding during the periodExpected revenue for the period =
Table 10.1 Cost of Delinquency, Example 1
Item Calculation
Initial loan amount 3,000Loan term 46 weeksWeekly payment 75Payments received 14 weeks (1,050)Payments overdue 32 weeks (2,400)
Total lost revenueand principal = 2,400
Lost revenue = 312Lost principal = 2,088
Revenue earned per 1,000loan for 46 weeks = 150
Number of loans requiredto earn lost principal Lost principal=
Revenue per loan2,088=150
= 14 loans of 1,000
Number of loans requiredto earn lost revenue = Lost revenue and principaland principal Revenue per loan
= 2,400150
= 16 loans of 1,000
Source: Ledgerwood 1996.
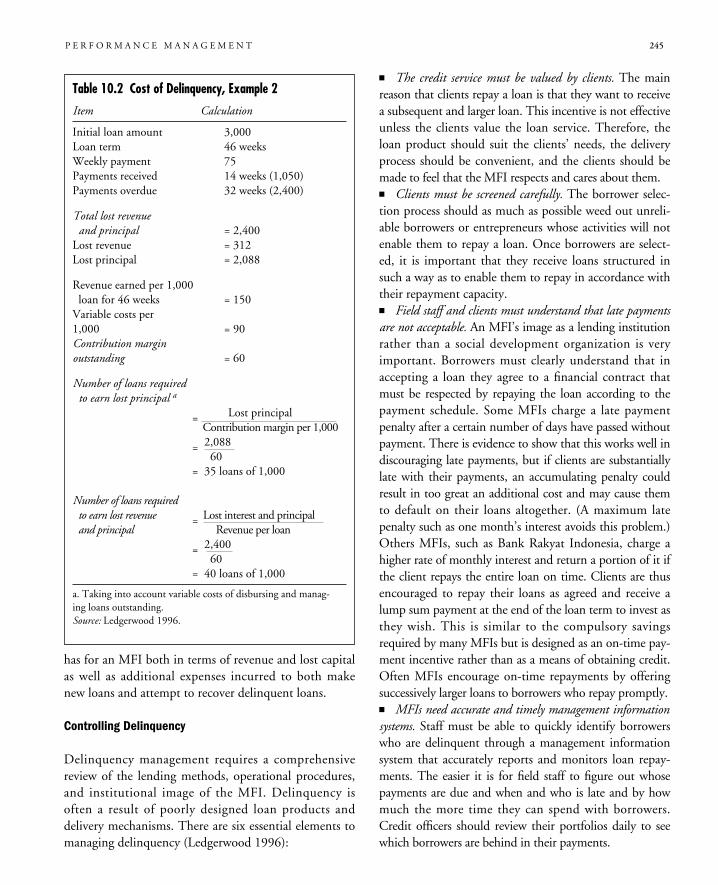
P E R F O R M A N C E M A N A G E M E N T 245
has for an MFI both in terms of revenue and lost capitalas well as additional expenses incurred to both makenew loans and attempt to recover delinquent loans.
Controlling Delinquency
Delinquency management requires a comprehensivereview of the lending methods, operational procedures,and institutional image of the MFI. Delinquency isoften a result of poorly designed loan products anddelivery mechanisms. There are six essential elements tomanaging delinquency (Ledgerwood 1996):
� The credit service must be valued by clients. The mainreason that clients repay a loan is that they want to receivea subsequent and larger loan. This incentive is not effectiveunless the clients value the loan service. Therefore, theloan product should suit the clients’ needs, the deliveryprocess should be convenient, and the clients should bemade to feel that the MFI respects and cares about them.� Clients must be screened carefully. The borrower selec-tion process should as much as possible weed out unreli-able borrowers or entrepreneurs whose activities will notenable them to repay a loan. Once borrowers are select-ed, it is important that they receive loans structured insuch a way as to enable them to repay in accordance withtheir repayment capacity.� Field staff and clients must understand that late paymentsare not acceptable. An MFI’s image as a lending institutionrather than a social development organization is veryimportant. Borrowers must clearly understand that inaccepting a loan they agree to a financial contract thatmust be respected by repaying the loan according to thepayment schedule. Some MFIs charge a late paymentpenalty after a certain number of days have passed withoutpayment. There is evidence to show that this works well indiscouraging late payments, but if clients are substantiallylate with their payments, an accumulating penalty couldresult in too great an additional cost and may cause themto default on their loans altogether. (A maximum latepenalty such as one month’s interest avoids this problem.)Others MFIs, such as Bank Rakyat Indonesia, charge ahigher rate of monthly interest and return a portion of it ifthe client repays the entire loan on time. Clients are thusencouraged to repay their loans as agreed and receive alump sum payment at the end of the loan term to invest asthey wish. This is similar to the compulsory savingsrequired by many MFIs but is designed as an on-time pay-ment incentive rather than as a means of obtaining credit.Often MFIs encourage on-time repayments by offeringsuccessively larger loans to borrowers who repay promptly.� MFIs need accurate and timely management informationsystems. Staff must be able to quickly identify borrowerswho are delinquent through a management informationsystem that accurately reports and monitors loan repay-ments. The easier it is for field staff to figure out whosepayments are due and when and who is late and by howmuch the more time they can spend with borrowers.Credit officers should review their portfolios daily to seewhich borrowers are behind in their payments.
Table 10.2 Cost of Delinquency, Example 2
Item Calculation
Initial loan amount 3,000Loan term 46 weeksWeekly payment 75Payments received 14 weeks (1,050)Payments overdue 32 weeks (2,400)
Total lost revenueand principal = 2,400
Lost revenue = 312Lost principal = 2,088
Revenue earned per 1,000loan for 46 weeks = 150
Variable costs per1,000 = 90Contribution marginoutstanding = 60
Number of loans requiredto earn lost principal a
= Lost principalContribution margin per 1,000
= 2,08860
= 35 loans of 1,000
Number of loans requiredto earn lost revenue = Lost interest and principaland principal Revenue per loan
= 2,40060
= 40 loans of 1,000
a. Taking into account variable costs of disbursing and manag-ing loans outstanding.Source: Ledgerwood 1996.
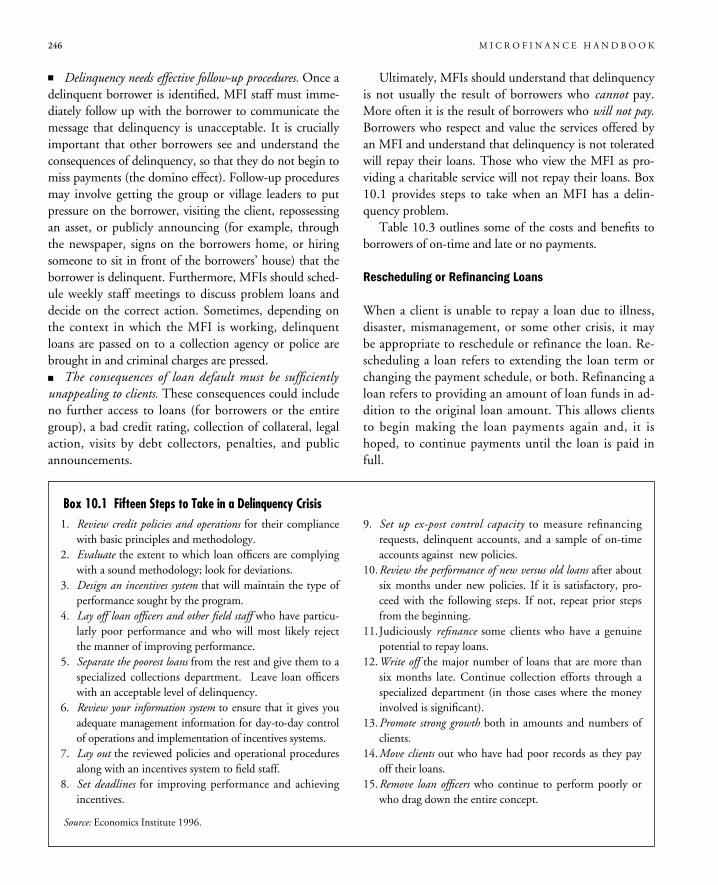
� Delinquency needs effective follow-up procedures. Once adelinquent borrower is identified, MFI staff must imme-diately follow up with the borrower to communicate themessage that delinquency is unacceptable. It is cruciallyimportant that other borrowers see and understand theconsequences of delinquency, so that they do not begin tomiss payments (the domino effect). Follow-up proceduresmay involve getting the group or village leaders to putpressure on the borrower, visiting the client, repossessingan asset, or publicly announcing (for example, throughthe newspaper, signs on the borrowers home, or hiringsomeone to sit in front of the borrowers’ house) that theborrower is delinquent. Furthermore, MFIs should sched-ule weekly staff meetings to discuss problem loans anddecide on the correct action. Sometimes, depending onthe context in which the MFI is working, delinquentloans are passed on to a collection agency or police arebrought in and criminal charges are pressed.� The consequences of loan default must be sufficientlyunappealing to clients. These consequences could includeno further access to loans (for borrowers or the entiregroup), a bad credit rating, collection of collateral, legalaction, visits by debt collectors, penalties, and publicannouncements.
Ultimately, MFIs should understand that delinquencyis not usually the result of borrowers who cannot pay.More often it is the result of borrowers who will not pay.Borrowers who respect and value the services offered byan MFI and understand that delinquency is not toleratedwill repay their loans. Those who view the MFI as pro-viding a charitable service will not repay their loans. Box10.1 provides steps to take when an MFI has a delin-quency problem.
Table 10.3 outlines some of the costs and benefits toborrowers of on-time and late or no payments.
Rescheduling or Refinancing Loans
When a client is unable to repay a loan due to illness,disaster, mismanagement, or some other crisis, it maybe appropriate to reschedule or refinance the loan. Re-scheduling a loan refers to extending the loan term orchanging the payment schedule, or both. Refinancing aloan refers to providing an amount of loan funds in ad-dition to the original loan amount. This allows clientsto begin making the loan payments again and, it ishoped, to continue payments until the loan is paid infull.
246 M I C R O F I N A N C E H A N D B O O K
1. Review credit policies and operations for their compliancewith basic principles and methodology.
2. Evaluate the extent to which loan officers are complyingwith a sound methodology; look for deviations.
3. Design an incentives system that will maintain the type ofperformance sought by the program.
4. Lay off loan officers and other field staff who have particu-larly poor performance and who will most likely rejectthe manner of improving performance.
5. Separate the poorest loans from the rest and give them to aspecialized collections department. Leave loan officerswith an acceptable level of delinquency.
6. Review your information system to ensure that it gives youadequate management information for day-to-day controlof operations and implementation of incentives systems.
7. Lay out the reviewed policies and operational proceduresalong with an incentives system to field staff.
8. Set deadlines for improving performance and achievingincentives.
9. Set up ex-post control capacity to measure refinancingrequests, delinquent accounts, and a sample of on-timeaccounts against new policies.
10.Review the performance of new versus old loans after aboutsix months under new policies. If it is satisfactory, pro-ceed with the following steps. If not, repeat prior stepsfrom the beginning.
11.Judiciously refinance some clients who have a genuinepotential to repay loans.
12.Write off the major number of loans that are more thansix months late. Continue collection efforts through aspecialized department (in those cases where the moneyinvolved is significant).
13.Promote strong growth both in amounts and numbers ofclients.
14.Move clients out who have had poor records as they payoff their loans.
15.Remove loan officers who continue to perform poorly orwho drag down the entire concept.
Box 10.1 Fifteen Steps to Take in a Delinquency Crisis
Source: Economics Institute 1996.
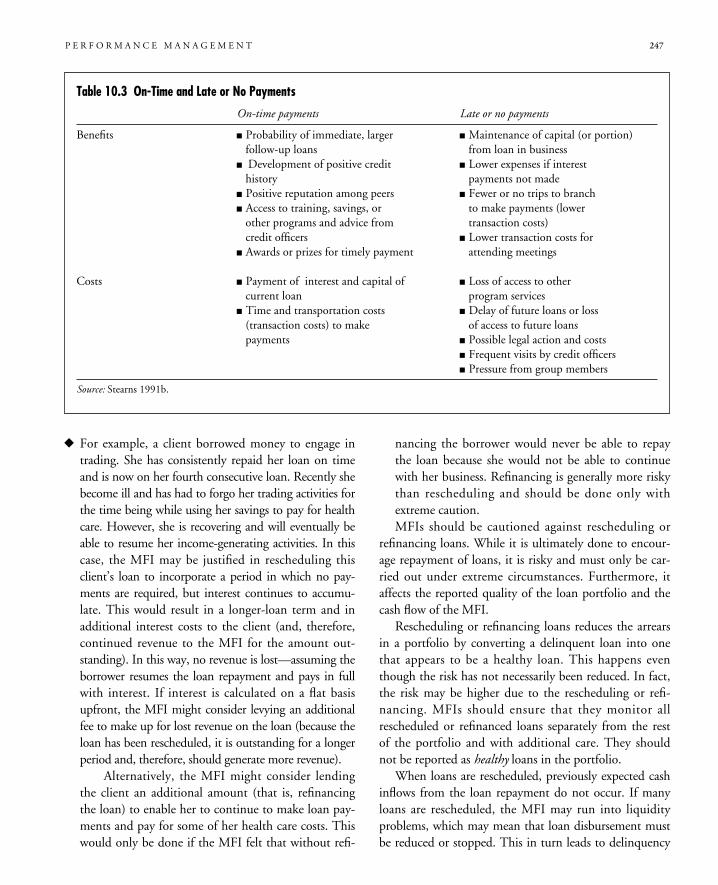
P E R F O R M A N C E M A N A G E M E N T 247
� For example, a client borrowed money to engage intrading. She has consistently repaid her loan on timeand is now on her fourth consecutive loan. Recently shebecome ill and has had to forgo her trading activities forthe time being while using her savings to pay for healthcare. However, she is recovering and will eventually beable to resume her income-generating activities. In thiscase, the MFI may be justified in rescheduling thisclient’s loan to incorporate a period in which no pay-ments are required, but interest continues to accumu-late. This would result in a longer-loan term and inadditional interest costs to the client (and, therefore,continued revenue to the MFI for the amount out-standing). In this way, no revenue is lost—assuming theborrower resumes the loan repayment and pays in fullwith interest. If interest is calculated on a flat basisupfront, the MFI might consider levying an additionalfee to make up for lost revenue on the loan (because theloan has been rescheduled, it is outstanding for a longerperiod and, therefore, should generate more revenue).
Alternatively, the MFI might consider lendingthe client an additional amount (that is, refinancingthe loan) to enable her to continue to make loan pay-ments and pay for some of her health care costs. Thiswould only be done if the MFI felt that without refi-
nancing the borrower would never be able to repaythe loan because she would not be able to continuewith her business. Refinancing is generally more riskythan rescheduling and should be done only withextreme caution.MFIs should be cautioned against rescheduling or
refinancing loans. While it is ultimately done to encour-age repayment of loans, it is risky and must only be car-ried out under extreme circumstances. Furthermore, itaffects the reported quality of the loan portfolio and thecash flow of the MFI.
Rescheduling or refinancing loans reduces the arrearsin a portfolio by converting a delinquent loan into onethat appears to be a healthy loan. This happens eventhough the risk has not necessarily been reduced. In fact,the risk may be higher due to the rescheduling or refi-nancing. MFIs should ensure that they monitor allrescheduled or refinanced loans separately from the restof the portfolio and with additional care. They shouldnot be reported as healthy loans in the portfolio.
When loans are rescheduled, previously expected cashinflows from the loan repayment do not occur. If manyloans are rescheduled, the MFI may run into liquidityproblems, which may mean that loan disbursement mustbe reduced or stopped. This in turn leads to delinquency
Table 10.3 On-Time and Late or No Payments
On-time payments Late or no payments
Benefits � Probability of immediate, larger � Maintenance of capital (or portion)follow-up loans from loan in business
� Development of positive credit � Lower expenses if interesthistory payments not made
� Positive reputation among peers � Fewer or no trips to branch� Access to training, savings, or to make payments (lowerother programs and advice from transaction costs)credit officers � Lower transaction costs for
� Awards or prizes for timely payment attending meetings
Costs � Payment of interest and capital of � Loss of access to othercurrent loan program services
� Time and transportation costs � Delay of future loans or loss(transaction costs) to make of access to future loanspayments � Possible legal action and costs
� Frequent visits by credit officers� Pressure from group members
Source: Stearns 1991b.
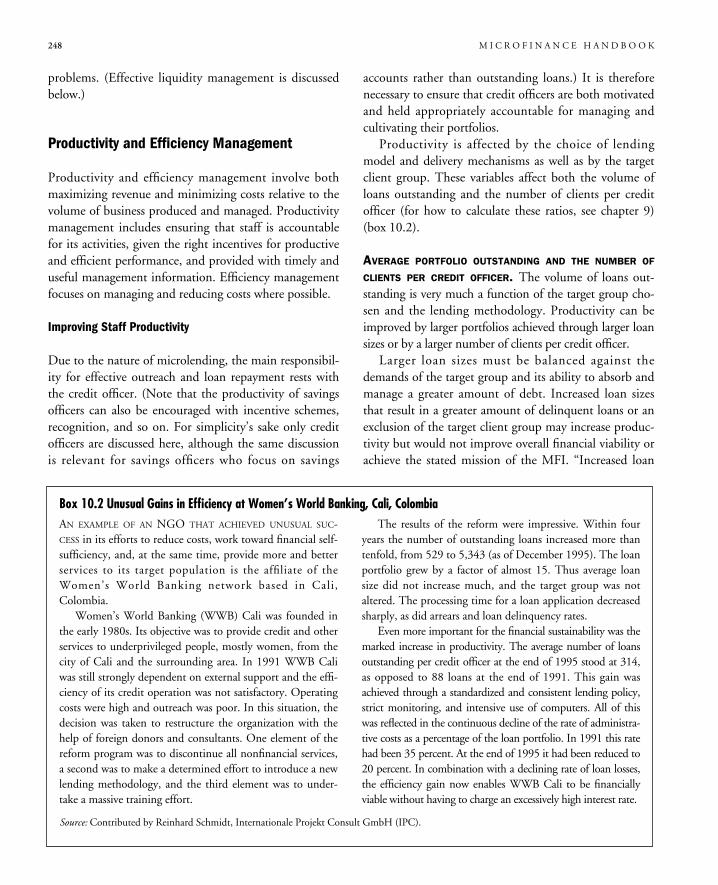
248 M I C R O F I N A N C E H A N D B O O K
problems. (Effective liquidity management is discussedbelow.)
Productivity and Efficiency Management
Productivity and efficiency management involve bothmaximizing revenue and minimizing costs relative to thevolume of business produced and managed. Productivitymanagement includes ensuring that staff is accountablefor its activities, given the right incentives for productiveand efficient performance, and provided with timely anduseful management information. Efficiency managementfocuses on managing and reducing costs where possible.
Improving Staff Productivity
Due to the nature of microlending, the main responsibil-ity for effective outreach and loan repayment rests withthe credit officer. (Note that the productivity of savingsofficers can also be encouraged with incentive schemes,recognition, and so on. For simplicity’s sake only creditofficers are discussed here, although the same discussionis relevant for savings officers who focus on savings
accounts rather than outstanding loans.) It is thereforenecessary to ensure that credit officers are both motivatedand held appropriately accountable for managing andcultivating their portfolios.
Productivity is affected by the choice of lendingmodel and delivery mechanisms as well as by the targetclient group. These variables affect both the volume ofloans outstanding and the number of clients per creditofficer (for how to calculate these ratios, see chapter 9)(box 10.2).
AVERAGE PORTFOLIO OUTSTANDING AND THE NUMBER OF
CLIENTS PER CREDIT OFFICER. The volume of loans out-standing is very much a function of the target group cho-sen and the lending methodology. Productivity can beimproved by larger portfolios achieved through larger loansizes or by a larger number of clients per credit officer.
Larger loan sizes must be balanced against thedemands of the target group and its ability to absorb andmanage a greater amount of debt. Increased loan sizesthat result in a greater amount of delinquent loans or anexclusion of the target client group may increase produc-tivity but would not improve overall financial viability orachieve the stated mission of the MFI. “Increased loan
AN EXAMPLE OF AN NGO THAT ACHIEVED UNUSUAL SUC-CESS in its efforts to reduce costs, work toward financial self-sufficiency, and, at the same time, provide more and betterservices to its target population is the affiliate of theWomen’s World Banking network based in Cali,Colombia.
Women’s World Banking (WWB) Cali was founded inthe early 1980s. Its objective was to provide credit and otherservices to underprivileged people, mostly women, from thecity of Cali and the surrounding area. In 1991 WWB Caliwas still strongly dependent on external support and the effi-ciency of its credit operation was not satisfactory. Operatingcosts were high and outreach was poor. In this situation, thedecision was taken to restructure the organization with thehelp of foreign donors and consultants. One element of thereform program was to discontinue all nonfinancial services,a second was to make a determined effort to introduce a newlending methodology, and the third element was to under-take a massive training effort.
The results of the reform were impressive. Within fouryears the number of outstanding loans increased more thantenfold, from 529 to 5,343 (as of December 1995). The loanportfolio grew by a factor of almost 15. Thus average loansize did not increase much, and the target group was notaltered. The processing time for a loan application decreasedsharply, as did arrears and loan delinquency rates.
Even more important for the financial sustainability was themarked increase in productivity. The average number of loansoutstanding per credit officer at the end of 1995 stood at 314,as opposed to 88 loans at the end of 1991. This gain wasachieved through a standardized and consistent lending policy,strict monitoring, and intensive use of computers. All of thiswas reflected in the continuous decline of the rate of administra-tive costs as a percentage of the loan portfolio. In 1991 this ratehad been 35 percent. At the end of 1995 it had been reduced to20 percent. In combination with a declining rate of loan losses,the efficiency gain now enables WWB Cali to be financiallyviable without having to charge an excessively high interest rate.
Box 10.2 Unusual Gains in Efficiency at Women’s World Banking, Cali, Colombia
Source: Contributed by Reinhard Schmidt, Internationale Projekt Consult GmbH (IPC).
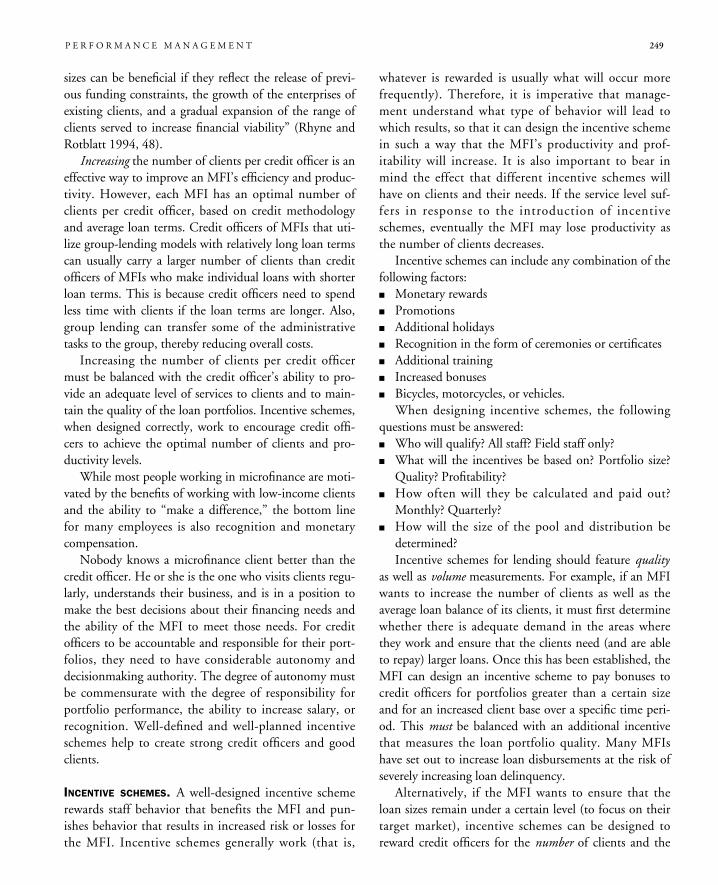
sizes can be beneficial if they reflect the release of previ-ous funding constraints, the growth of the enterprises ofexisting clients, and a gradual expansion of the range ofclients served to increase financial viability” (Rhyne andRotblatt 1994, 48).
Increasing the number of clients per credit officer is aneffective way to improve an MFI’s efficiency and produc-tivity. However, each MFI has an optimal number ofclients per credit officer, based on credit methodologyand average loan terms. Credit officers of MFIs that uti-lize group-lending models with relatively long loan termscan usually carry a larger number of clients than creditofficers of MFIs who make individual loans with shorterloan terms. This is because credit officers need to spendless time with clients if the loan terms are longer. Also,group lending can transfer some of the administrativetasks to the group, thereby reducing overall costs.
Increasing the number of clients per credit officermust be balanced with the credit officer’s ability to pro-vide an adequate level of services to clients and to main-tain the quality of the loan portfolios. Incentive schemes,when designed correctly, work to encourage credit offi-cers to achieve the optimal number of clients and pro-ductivity levels.
While most people working in microfinance are moti-vated by the benefits of working with low-income clientsand the ability to “make a difference,” the bottom linefor many employees is also recognition and monetarycompensation.
Nobody knows a microfinance client better than thecredit officer. He or she is the one who visits clients regu-larly, understands their business, and is in a position tomake the best decisions about their financing needs andthe ability of the MFI to meet those needs. For creditofficers to be accountable and responsible for their port-folios, they need to have considerable autonomy anddecisionmaking authority. The degree of autonomy mustbe commensurate with the degree of responsibility forportfolio performance, the ability to increase salary, orrecognition. Well-defined and well-planned incentiveschemes help to create strong credit officers and goodclients.
INCENTIVE SCHEMES. A well-designed incentive schemerewards staff behavior that benefits the MFI and pun-ishes behavior that results in increased risk or losses forthe MFI. Incentive schemes generally work (that is,
whatever is rewarded is usually what will occur morefrequently). Therefore, it is imperative that manage-ment understand what type of behavior will lead towhich results, so that it can design the incentive schemein such a way that the MFI’s productivity and prof-itability will increase. It is also important to bear inmind the effect that different incentive schemes willhave on clients and their needs. If the service level suf-fers in response to the introduction of incentiveschemes, eventually the MFI may lose productivity asthe number of clients decreases.
Incentive schemes can include any combination of thefollowing factors:� Monetary rewards� Promotions� Additional holidays� Recognition in the form of ceremonies or certificates� Additional training� Increased bonuses� Bicycles, motorcycles, or vehicles.
When designing incentive schemes, the followingquestions must be answered:� Who will qualify? All staff? Field staff only?� What will the incentives be based on? Portfolio size?
Quality? Profitability?� How often will they be calculated and paid out?
Monthly? Quarterly?� How will the size of the pool and distribution be
determined?Incentive schemes for lending should feature quality
as well as volume measurements. For example, if an MFIwants to increase the number of clients as well as theaverage loan balance of its clients, it must first determinewhether there is adequate demand in the areas wherethey work and ensure that the clients need (and are ableto repay) larger loans. Once this has been established, theMFI can design an incentive scheme to pay bonuses tocredit officers for portfolios greater than a certain sizeand for an increased client base over a specific time peri-od. This must be balanced with an additional incentivethat measures the loan portfolio quality. Many MFIshave set out to increase loan disbursements at the risk ofseverely increasing loan delinquency.
Alternatively, if the MFI wants to ensure that theloan sizes remain under a certain level (to focus on theirtarget market), incentive schemes can be designed toreward credit officers for the number of clients and the
P E R F O R M A N C E M A N A G E M E N T 249
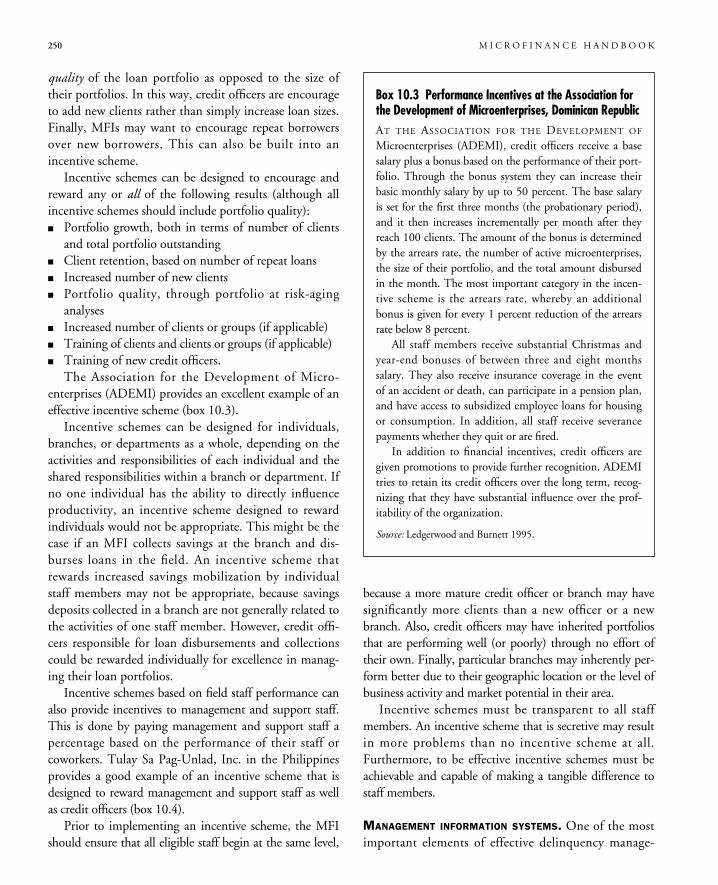
quality of the loan portfolio as opposed to the size oftheir portfolios. In this way, credit officers are encourageto add new clients rather than simply increase loan sizes.Finally, MFIs may want to encourage repeat borrowersover new borrowers. This can also be built into anincentive scheme.
Incentive schemes can be designed to encourage andreward any or all of the following results (although allincentive schemes should include portfolio quality):� Portfolio growth, both in terms of number of clients
and total portfolio outstanding� Client retention, based on number of repeat loans� Increased number of new clients� Portfolio quality, through portfolio at risk-aging
analyses� Increased number of clients or groups (if applicable)� Training of clients and clients or groups (if applicable)� Training of new credit officers.
The Association for the Development of Micro-enterprises (ADEMI) provides an excellent example of aneffective incentive scheme (box 10.3).
Incentive schemes can be designed for individuals,branches, or departments as a whole, depending on theactivities and responsibilities of each individual and theshared responsibilities within a branch or department. Ifno one individual has the ability to directly influenceproductivity, an incentive scheme designed to rewardindividuals would not be appropriate. This might be thecase if an MFI collects savings at the branch and dis-burses loans in the field. An incentive scheme thatrewards increased savings mobilization by individualstaff members may not be appropriate, because savingsdeposits collected in a branch are not generally related tothe activities of one staff member. However, credit offi-cers responsible for loan disbursements and collectionscould be rewarded individually for excellence in manag-ing their loan portfolios.
Incentive schemes based on field staff performance canalso provide incentives to management and support staff.This is done by paying management and support staff apercentage based on the performance of their staff orcoworkers. Tulay Sa Pag-Unlad, Inc. in the Philippinesprovides a good example of an incentive scheme that isdesigned to reward management and support staff as wellas credit officers (box 10.4).
Prior to implementing an incentive scheme, the MFIshould ensure that all eligible staff begin at the same level,
because a more mature credit officer or branch may havesignificantly more clients than a new officer or a newbranch. Also, credit officers may have inherited portfoliosthat are performing well (or poorly) through no effort oftheir own. Finally, particular branches may inherently per-form better due to their geographic location or the level ofbusiness activity and market potential in their area.
Incentive schemes must be transparent to all staffmembers. An incentive scheme that is secretive may resultin more problems than no incentive scheme at all.Furthermore, to be effective incentive schemes must beachievable and capable of making a tangible difference tostaff members.
MANAGEMENT INFORMATION SYSTEMS. One of the mostimportant elements of effective delinquency manage-
250 M I C R O F I N A N C E H A N D B O O K
Box 10.3 Performance Incentives at the Association forthe Development of Microenterprises, Dominican RepublicAT THE ASSOCIATION FOR THE DEVELOPMENT OF
Microenterprises (ADEMI), credit officers receive a basesalary plus a bonus based on the performance of their port-folio. Through the bonus system they can increase theirbasic monthly salary by up to 50 percent. The base salaryis set for the first three months (the probationary period),and it then increases incrementally per month after theyreach 100 clients. The amount of the bonus is determinedby the arrears rate, the number of active microenterprises,the size of their portfolio, and the total amount disbursedin the month. The most important category in the incen-tive scheme is the arrears rate, whereby an additionalbonus is given for every 1 percent reduction of the arrearsrate below 8 percent.
All staff members receive substantial Christmas andyear-end bonuses of between three and eight monthssalary. They also receive insurance coverage in the eventof an accident or death, can participate in a pension plan,and have access to subsidized employee loans for housingor consumption. In addition, all staff receive severancepayments whether they quit or are fired.
In addition to financial incentives, credit officers aregiven promotions to provide further recognition. ADEMItries to retain its credit officers over the long term, recog-nizing that they have substantial influence over the prof-itability of the organization.
Source: Ledgerwood and Burnett 1995.
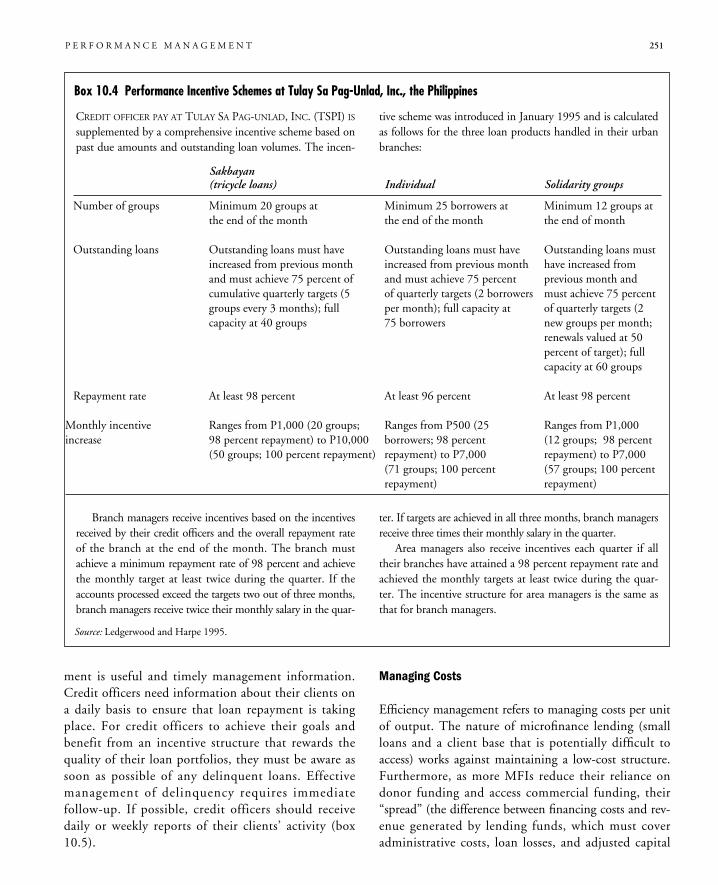
ment is useful and timely management information.Credit officers need information about their clients ona daily basis to ensure that loan repayment is takingplace. For credit officers to achieve their goals andbenefit from an incentive structure that rewards thequality of their loan portfolios, they must be aware assoon as possible of any delinquent loans. Effectivemanagement of delinquency requires immediatefollow-up. If possible, credit officers should receivedaily or weekly reports of their clients’ activity (box10.5).
Managing Costs
Efficiency management refers to managing costs per unitof output. The nature of microfinance lending (smallloans and a client base that is potentially difficult toaccess) works against maintaining a low-cost structure.Furthermore, as more MFIs reduce their reliance ondonor funding and access commercial funding, their“spread” (the difference between financing costs and rev-enue generated by lending funds, which must coveradministrative costs, loan losses, and adjusted capital
P E R F O R M A N C E M A N A G E M E N T 251
CREDIT OFFICER PAY AT TULAY SA PAG-UNLAD, INC. (TSPI) IS
supplemented by a comprehensive incentive scheme based onpast due amounts and outstanding loan volumes. The incen-
tive scheme was introduced in January 1995 and is calculatedas follows for the three loan products handled in their urbanbranches:
Box 10.4 Performance Incentive Schemes at Tulay Sa Pag-Unlad, Inc., the Philippines
Branch managers receive incentives based on the incentivesreceived by their credit officers and the overall repayment rateof the branch at the end of the month. The branch mustachieve a minimum repayment rate of 98 percent and achievethe monthly target at least twice during the quarter. If theaccounts processed exceed the targets two out of three months,branch managers receive twice their monthly salary in the quar-
ter. If targets are achieved in all three months, branch managersreceive three times their monthly salary in the quarter.
Area managers also receive incentives each quarter if alltheir branches have attained a 98 percent repayment rate andachieved the monthly targets at least twice during the quar-ter. The incentive structure for area managers is the same asthat for branch managers.
Source: Ledgerwood and Harpe 1995.
Sakbayan(tricycle loans) Individual Solidarity groups
Number of groups Minimum 20 groups at Minimum 25 borrowers at Minimum 12 groups atthe end of the month the end of the month the end of month
Outstanding loans Outstanding loans must have Outstanding loans must have Outstanding loans mustincreased from previous month increased from previous month have increased fromand must achieve 75 percent of and must achieve 75 percent previous month andcumulative quarterly targets (5 of quarterly targets (2 borrowers must achieve 75 percentgroups every 3 months); full per month); full capacity at of quarterly targets (2capacity at 40 groups 75 borrowers new groups per month;
renewals valued at 50percent of target); fullcapacity at 60 groups
Repayment rate At least 98 percent At least 96 percent At least 98 percent
Monthly incentive Ranges from P1,000 (20 groups; Ranges from P500 (25 Ranges from P1,000increase 98 percent repayment) to P10,000 borrowers; 98 percent (12 groups; 98 percent
(50 groups; 100 percent repayment) repayment) to P7,000 repayment) to P7,000(71 groups; 100 percent (57 groups; 100 percentrepayment) repayment)
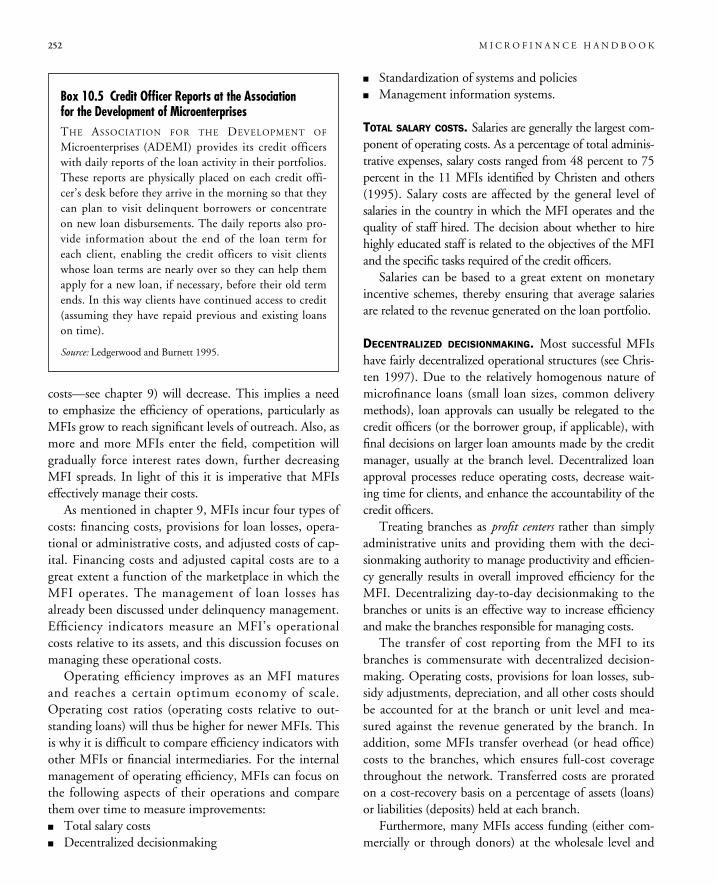
costs—see chapter 9) will decrease. This implies a needto emphasize the efficiency of operations, particularly asMFIs grow to reach significant levels of outreach. Also, asmore and more MFIs enter the field, competition willgradually force interest rates down, further decreasingMFI spreads. In light of this it is imperative that MFIseffectively manage their costs.
As mentioned in chapter 9, MFIs incur four types ofcosts: financing costs, provisions for loan losses, opera-tional or administrative costs, and adjusted costs of cap-ital. Financing costs and adjusted capital costs are to agreat extent a function of the marketplace in which theMFI operates. The management of loan losses hasalready been discussed under delinquency management.Efficiency indicators measure an MFI’s operationalcosts relative to its assets, and this discussion focuses onmanaging these operational costs.
Operating efficiency improves as an MFI maturesand reaches a certain optimum economy of scale.Operating cost ratios (operating costs relative to out-standing loans) will thus be higher for newer MFIs. Thisis why it is difficult to compare efficiency indicators withother MFIs or financial intermediaries. For the internalmanagement of operating efficiency, MFIs can focus onthe following aspects of their operations and comparethem over time to measure improvements:� Total salary costs� Decentralized decisionmaking
� Standardization of systems and policies� Management information systems.
TOTAL SALARY COSTS. Salaries are generally the largest com-ponent of operating costs. As a percentage of total adminis-trative expenses, salary costs ranged from 48 percent to 75percent in the 11 MFIs identified by Christen and others(1995). Salary costs are affected by the general level ofsalaries in the country in which the MFI operates and thequality of staff hired. The decision about whether to hirehighly educated staff is related to the objectives of the MFIand the specific tasks required of the credit officers.
Salaries can be based to a great extent on monetaryincentive schemes, thereby ensuring that average salariesare related to the revenue generated on the loan portfolio.
DECENTRALIZED DECISIONMAKING. Most successful MFIshave fairly decentralized operational structures (see Chris-ten 1997). Due to the relatively homogenous nature ofmicrofinance loans (small loan sizes, common deliverymethods), loan approvals can usually be relegated to thecredit officers (or the borrower group, if applicable), withfinal decisions on larger loan amounts made by the creditmanager, usually at the branch level. Decentralized loanapproval processes reduce operating costs, decrease wait-ing time for clients, and enhance the accountability of thecredit officers.
Treating branches as profit centers rather than simplyadministrative units and providing them with the deci-sionmaking authority to manage productivity and efficien-cy generally results in overall improved efficiency for theMFI. Decentralizing day-to-day decisionmaking to thebranches or units is an effective way to increase efficiencyand make the branches responsible for managing costs.
The transfer of cost reporting from the MFI to itsbranches is commensurate with decentralized decision-making. Operating costs, provisions for loan losses, sub-sidy adjustments, depreciation, and all other costs shouldbe accounted for at the branch or unit level and mea-sured against the revenue generated by the branch. Inaddition, some MFIs transfer overhead (or head office)costs to the branches, which ensures full-cost coveragethroughout the network. Transferred costs are proratedon a cost-recovery basis on a percentage of assets (loans)or liabilities (deposits) held at each branch.
Furthermore, many MFIs access funding (either com-mercially or through donors) at the wholesale level and
252 M I C R O F I N A N C E H A N D B O O K
Box 10.5 Credit Officer Reports at the Associationfor the Development of MicroenterprisesTHE ASSOCIATION FOR THE DEVELOPMENT OF
Microenterprises (ADEMI) provides its credit officerswith daily reports of the loan activity in their portfolios.These reports are physically placed on each credit offi-cer’s desk before they arrive in the morning so that theycan plan to visit delinquent borrowers or concentrateon new loan disbursements. The daily reports also pro-vide information about the end of the loan term foreach client, enabling the credit officers to visit clientswhose loan terms are nearly over so they can help themapply for a new loan, if necessary, before their old termends. In this way clients have continued access to credit(assuming they have repaid previous and existing loanson time).
Source: Ledgerwood and Burnett 1995.
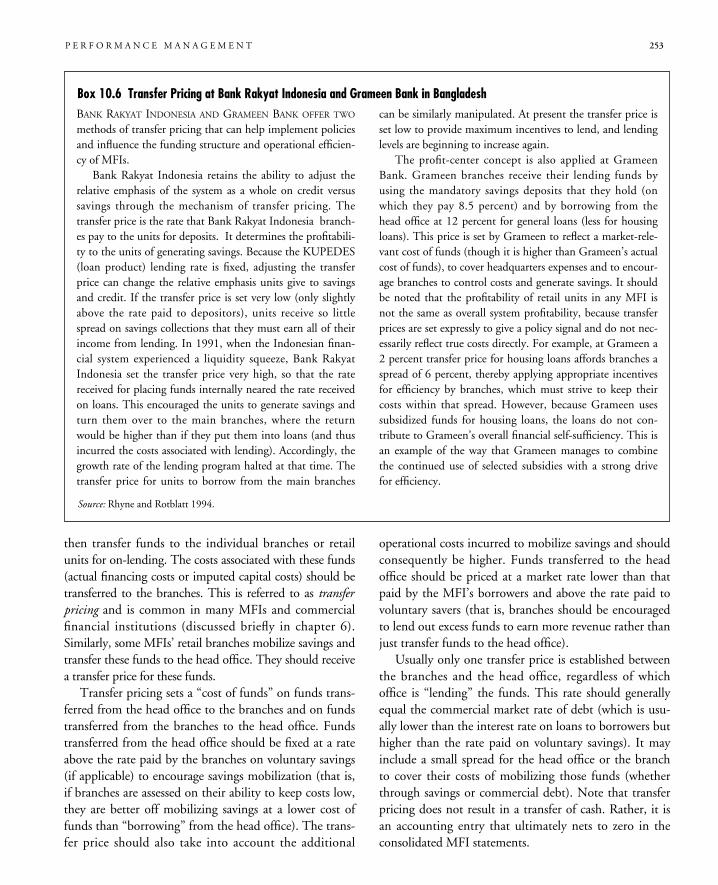
P E R F O R M A N C E M A N A G E M E N T 253
then transfer funds to the individual branches or retailunits for on-lending. The costs associated with these funds(actual financing costs or imputed capital costs) should betransferred to the branches. This is referred to as transferpricing and is common in many MFIs and commercialfinancial institutions (discussed briefly in chapter 6).Similarly, some MFIs’ retail branches mobilize savings andtransfer these funds to the head office. They should receivea transfer price for these funds.
Transfer pricing sets a “cost of funds” on funds trans-ferred from the head office to the branches and on fundstransferred from the branches to the head office. Fundstransferred from the head office should be fixed at a rateabove the rate paid by the branches on voluntary savings(if applicable) to encourage savings mobilization (that is,if branches are assessed on their ability to keep costs low,they are better off mobilizing savings at a lower cost offunds than “borrowing” from the head office). The trans-fer price should also take into account the additional
operational costs incurred to mobilize savings and shouldconsequently be higher. Funds transferred to the headoffice should be priced at a market rate lower than thatpaid by the MFI’s borrowers and above the rate paid tovoluntary savers (that is, branches should be encouragedto lend out excess funds to earn more revenue rather thanjust transfer funds to the head office).
Usually only one transfer price is established betweenthe branches and the head office, regardless of whichoffice is “lending” the funds. This rate should generallyequal the commercial market rate of debt (which is usu-ally lower than the interest rate on loans to borrowers buthigher than the rate paid on voluntary savings). It mayinclude a small spread for the head office or the branchto cover their costs of mobilizing those funds (whetherthrough savings or commercial debt). Note that transferpricing does not result in a transfer of cash. Rather, it isan accounting entry that ultimately nets to zero in theconsolidated MFI statements.
BANK RAKYAT INDONESIA AND GRAMEEN BANK OFFER TWO
methods of transfer pricing that can help implement policiesand influence the funding structure and operational efficien-cy of MFIs.
Bank Rakyat Indonesia retains the ability to adjust therelative emphasis of the system as a whole on credit versussavings through the mechanism of transfer pricing. Thetransfer price is the rate that Bank Rakyat Indonesia branch-es pay to the units for deposits. It determines the profitabili-ty to the units of generating savings. Because the KUPEDES(loan product) lending rate is fixed, adjusting the transferprice can change the relative emphasis units give to savingsand credit. If the transfer price is set very low (only slightlyabove the rate paid to depositors), units receive so littlespread on savings collections that they must earn all of theirincome from lending. In 1991, when the Indonesian finan-cial system experienced a liquidity squeeze, Bank RakyatIndonesia set the transfer price very high, so that the ratereceived for placing funds internally neared the rate receivedon loans. This encouraged the units to generate savings andturn them over to the main branches, where the returnwould be higher than if they put them into loans (and thusincurred the costs associated with lending). Accordingly, thegrowth rate of the lending program halted at that time. Thetransfer price for units to borrow from the main branches
can be similarly manipulated. At present the transfer price isset low to provide maximum incentives to lend, and lendinglevels are beginning to increase again.
The profit-center concept is also applied at GrameenBank. Grameen branches receive their lending funds byusing the mandatory savings deposits that they hold (onwhich they pay 8.5 percent) and by borrowing from thehead office at 12 percent for general loans (less for housingloans). This price is set by Grameen to reflect a market-rele-vant cost of funds (though it is higher than Grameen’s actualcost of funds), to cover headquarters expenses and to encour-age branches to control costs and generate savings. It shouldbe noted that the profitability of retail units in any MFI isnot the same as overall system profitability, because transferprices are set expressly to give a policy signal and do not nec-essarily reflect true costs directly. For example, at Grameen a2 percent transfer price for housing loans affords branches aspread of 6 percent, thereby applying appropriate incentivesfor efficiency by branches, which must strive to keep theircosts within that spread. However, because Grameen usessubsidized funds for housing loans, the loans do not con-tribute to Grameen’s overall financial self-sufficiency. This isan example of the way that Grameen manages to combinethe continued use of selected subsidies with a strong drivefor efficiency.
Box 10.6 Transfer Pricing at Bank Rakyat Indonesia and Grameen Bank in Bangladesh
Source: Rhyne and Rotblatt 1994.
� For example, assume an MFI accesses commercialfunds at a cost of 10 percent a year and it mobilizes sav-ings at a cost of 5 percent per year. Within its branchnetwork there will be some branches that mobilizemore savings than the amount of loans they disburse.Other branches will disburse a greater amount of loansthan the amount of savings collected. For the branchthat has excess funds (more savings than loans), it lendsthese funds to the head office and receives a transferprice for them (probably close to 10 percent). Thebranch that requires funds (more loans than savings)borrows funds from head office at the transfer price.
STANDARDIZED SYSTEMS AND POLICIES. Highly standard-ized systems and policies in MFIs contribute to overallefficiency. The functions of each staff member must beclearly defined, and daily and weekly schedules of activi-ties should be made routine in all branches. A high levelof standardization is essential for an MFI to monitor per-formance, expand outreach, and achieve operational effi-ciency. Regular procedures also enable clients to arrangetheir schedules around the policies of the MFI.
Standardized procedures also benefit an MFI that isgrowing rapidly or help when staff is transferred to differ-ent branches. However, procedures must also allow forsome autonomy at the branch level, particularly whenthey are treated as profit centers. Core activities such ascredit and savings should be highly standardized, whereasclient visits, involvement in the community, and otherinitiatives may be less so.
MANAGEMENT INFORMATION SYSTEMS. (see chapter 7 andChristen 1997). Effective management information sys-tems are essential for an MFI to control its costs andmanage efficiency. Timely and accurate informationmust be available to management to manage productivityat the branch or unit level and at the overall MFI level.Good information systems must be built on goodadministrative systems and procedures.
The importance of information to calculate key indi-cators has been emphasized in previous sections of thishandbook. In addition to financial management infor-mation, “supervisors and policymakers need a full rangeof supporting information, and frontline staff need infor-mation to manage their own daily activities” (Rhyne andRotblatt 1994, 59).
Risk Management
Risk management is one of the most important areas offinancial management for MFIs. Risk management canbe broadly grouped under asset and liability managementand operating risk management.
Asset and Liability Management
Asset and liability management refers to the financial riskmanagement of a financial institution. Generally, anyaction to increase the expected returns of an MFI willalso increase its risk structure. Asset and liability manage-ment (ALM) involves understanding those risk andreturn tradeoffs and making them clear so that the boardof directors and senior management can make informedbusiness judgments about the best course for the MFI.
ALM manages the structure of an MFI’s balance sheetand the risks and returns inherent in this structure. Mostnarrowly defined, asset and liability management refersto spread management or the maintenance of a positivespread between the interest rate on earning assets and theinterest cost of funds.
Since many MFIs do not act as true financial inter-mediaries (by providing loans and collecting savings),they may not be overly concerned with asset and liabil-ity management. However, as time goes on, ALM willbecome more important as the availability of donorfunds declines and MFIs take on more commercialdebt.
254 M I C R O F I N A N C E H A N D B O O K
Box 10.7 Standardization at Grameen BankGRAMEEN BANK DIRECTS CREDIT OFFICERS TO TAKE THE
initiative in reducing rural poverty in any way they can,and this leads to a proliferation of small local activitiesand experiments. Grameen’s client centers provide a vehi-cle for local initiatives because the centers often decide tomake collective investments or carry out ongoing activitiessuch as starting informal schools. However, even atGrameen such activities do not detract from the corebusiness of providing credit, and each Grameen branchcarries out its credit operations in a standard way. A gen-eral conclusion is that local variation beyond a certain tol-erance is not compatible with scale.
Source: Rhyne and Rotblatt 1994.
P E R F O R M A N C E M A N A G E M E N T 255
In formal financial institutions asset and liability manage-ment is normally carried out by a committee, because itinvolves both operations management and treasury activities.This committee is commonly referred to as the asset and lia-bility committee or ALCO and it sets policies and guidelinesto establish the risk tolerance of the organization. These po-licies are generally ratified by the board of directors. The assetand liability committee meets frequently and determines thelending organization’s current position in every risk di-mension while also forecasting for all future time periods. Ifthe organization is currently or expected to be outside of itsrisk limits, then the asset and liability committee must makea decision as to how to correct the situation. This couldinvolve a change in the structure of the balance sheet toensure that the level of risk is appropriate or, less commonly,a change in the policies and guidelines of theMFI.
Most MFIs do not have the depth of financial andoperational management to create a committee. Henceasset and liability management will likely be carried outby the director and the financial manager of the MFI.
The goal of asset and liability management is to maxi-mize the risk-adjusted returns to shareholders over thelong run. The major categories of asset and liability man-agement risk that an MFI needs to consider are:� Credit risk� Liquidity risk� Interest rate risk� Foreign exchange risk.
Two other types of risk are also often cited: capitaladequacy risk and fiduciary risk. “Capital adequacy risk”is something of a misnomer, because capital is a fundingsource, not a source of risk. However, there is an optimalcapital structure for MFIs, and thus the primary risk isthat capital is improperly allocated, affecting pricing poli-cies and strategic decisions. Fiduciary risk refers to the riskthat management will make imprudent decisions aboutthe management of external resources. Beyond the discus-sion in chapter 9 of capital adequacy, this handbook willnot discuss optimal capital structures or fiduciary risk.
Credit risk represents the potential loss resulting fromthe poor quality of the organization’s assets, particularlyits loan portfolio. Credit risk is by far the most impor-tant of risk categories and is discussed above underdelinquency management.
LIQUIDITY RISK. Liquidity refers to the ability of an MFIto meet its immediate demands for cash, that is, loan
disbursement, bill payments, and debt repayment. AnMFI is in a liquid position if it is able to meet its currentobligations as they become due. An MFI is in an illiquidposition if it is unable to meet claims for funds. Li-quidity risk refers to the risk of incurring additional ex-penses for borrowing relatively expensive short-termfunds to finance an illiquid position. Liquidity manage-ment is the process of ensuring that the demand forfunds is readily met without additional borrowing. Thegoal of liquidity management is to maintain an accept-able level of liquidity while balancing the need to earnrevenue. Too much cash in a branch or head officeresults in lost income, since idle cash does not earn anyrevenue but does incur a cost of funds. Too little cashresults in missed loan disbursement opportunities,delayed bill payments, or higher borrowing costs for theMFI (overdraft charges).
Liquidity management and cash flow management areoften used interchangeably. In fact, liquidity manage-ment includes the management of not only cash but alsoother short-term assets and short-term liabilities.
Cash flow management refers to the timing of cashflows to ensure that cash coming in (cash inflow) is equalto or greater than cash going out (cash outflow). Cashflow analysis identifies the amount of cash needed fordaily operations as well as idle funds that can be used forinvestment or loans. The purpose of cash flow manage-ment is to maintain an adequate level of cash both in thebranches (if applicable) and at the head office. This isdone by accurately forecasting cash needs.
An effective cash management program ensures that:� Policies are set for minimum and maximum cash levels� Cash needs are forecast� Cash budgets are continuously updated� Surplus funds are invested or disbursed as loans� Cash is available for savings withdrawals and loans.
Various ratios can be calculated to help determine theappropriate level of cash flow. Three are presented here:the idle funds ratio, the liquidity ratio, and the currentratio.
The idle funds ratio deals with funds that an MFI hasbut that are not earning any revenue or are earning lessrevenue than what could be earned if they were lent outto borrowers.
Cash + near cash
Total outstanding portfolio
Idle funds ratio =
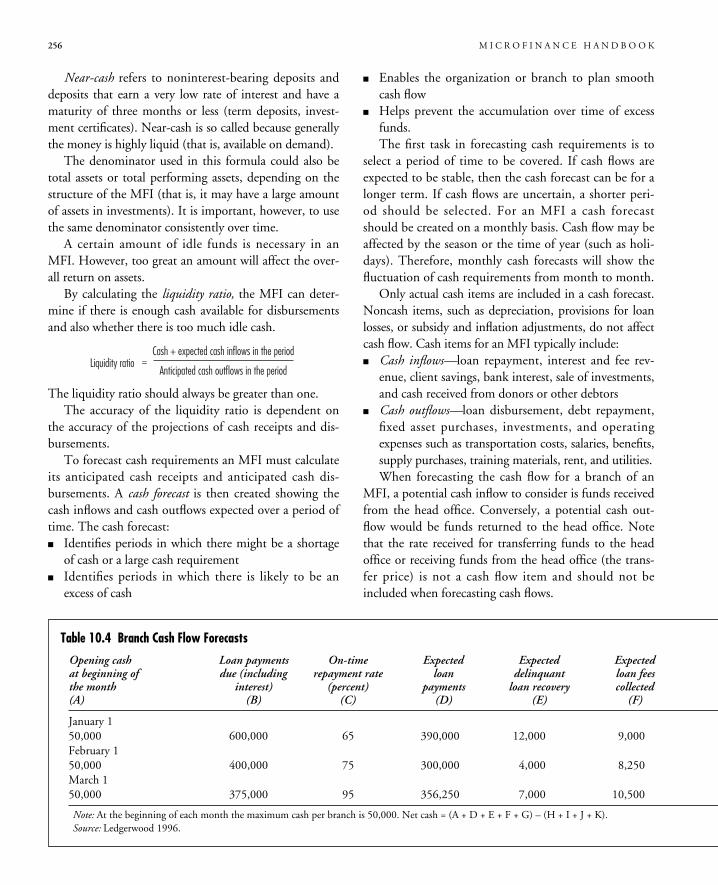
256 M I C R O F I N A N C E H A N D B O O K
Near-cash refers to noninterest-bearing deposits anddeposits that earn a very low rate of interest and have amaturity of three months or less (term deposits, invest-ment certificates). Near-cash is so called because generallythe money is highly liquid (that is, available on demand).
The denominator used in this formula could also betotal assets or total performing assets, depending on thestructure of the MFI (that is, it may have a large amountof assets in investments). It is important, however, to usethe same denominator consistently over time.
A certain amount of idle funds is necessary in anMFI. However, too great an amount will affect the over-all return on assets.
By calculating the liquidity ratio, the MFI can deter-mine if there is enough cash available for disbursementsand also whether there is too much idle cash.
The liquidity ratio should always be greater than one.The accuracy of the liquidity ratio is dependent on
the accuracy of the projections of cash receipts and dis-bursements.
To forecast cash requirements an MFI must calculateits anticipated cash receipts and anticipated cash dis-bursements. A cash forecast is then created showing thecash inflows and cash outflows expected over a period oftime. The cash forecast:� Identifies periods in which there might be a shortage
of cash or a large cash requirement� Identifies periods in which there is likely to be an
excess of cash
� Enables the organization or branch to plan smoothcash flow
� Helps prevent the accumulation over time of excessfunds.The first task in forecasting cash requirements is to
select a period of time to be covered. If cash flows areexpected to be stable, then the cash forecast can be for alonger term. If cash flows are uncertain, a shorter peri-od should be selected. For an MFI a cash forecastshould be created on a monthly basis. Cash flow may beaffected by the season or the time of year (such as holi-days). Therefore, monthly cash forecasts will show thefluctuation of cash requirements from month to month.
Only actual cash items are included in a cash forecast.Noncash items, such as depreciation, provisions for loanlosses, or subsidy and inflation adjustments, do not affectcash flow. Cash items for an MFI typically include:� Cash inflows—loan repayment, interest and fee rev-
enue, client savings, bank interest, sale of investments,and cash received from donors or other debtors
� Cash outflows—loan disbursement, debt repayment,fixed asset purchases, investments, and operatingexpenses such as transportation costs, salaries, benefits,supply purchases, training materials, rent, and utilities.When forecasting the cash flow for a branch of an
MFI, a potential cash inflow to consider is funds receivedfrom the head office. Conversely, a potential cash out-flow would be funds returned to the head office. Notethat the rate received for transferring funds to the headoffice or receiving funds from the head office (the trans-fer price) is not a cash flow item and should not beincluded when forecasting cash flows.
Cash + expected cash inflows in the period
Anticipated cash outflows in the period
Liquidity ratio =
Table 10.4 Branch Cash Flow Forecasts
Opening cash Loan payments On-time Expected Expected Expectedat beginning of due (including repayment rate loan delinquant loan feesthe month interest) (percent) payments loan recovery collected(A) (B) (C) (D) (E) (F)
January 150,000 600,000 65 390,000 12,000 9,000February 150,000 400,000 75 300,000 4,000 8,250March 150,000 375,000 95 356,250 7,000 10,500
Note: At the beginning of each month the maximum cash per branch is 50,000. Net cash = (A + D + E + F + G) – (H + I + J + K).Source: Ledgerwood 1996.
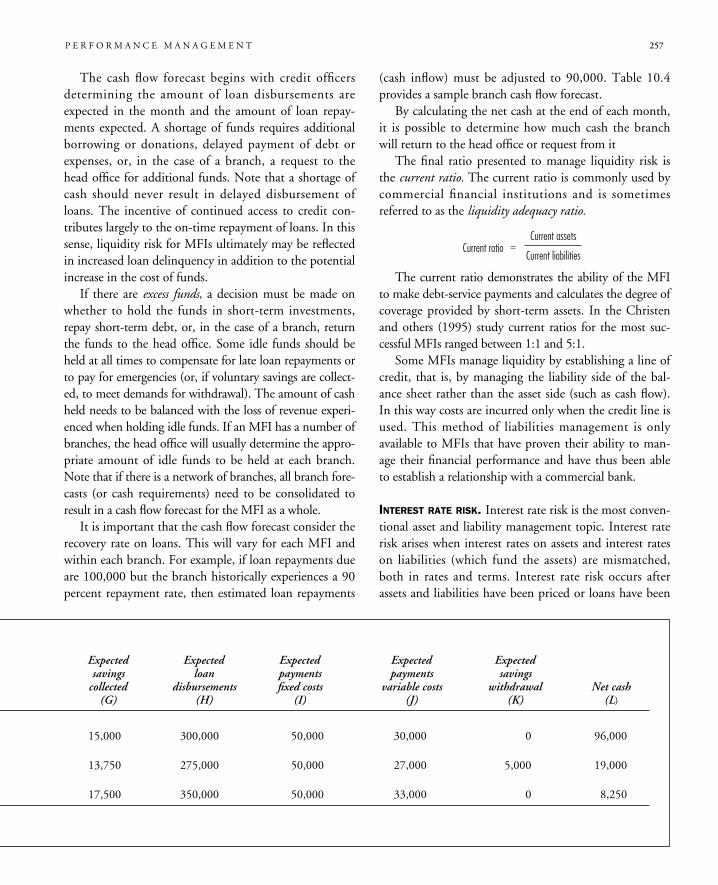
P E R F O R M A N C E M A N A G E M E N T 257
The cash flow forecast begins with credit officersdetermining the amount of loan disbursements areexpected in the month and the amount of loan repay-ments expected. A shortage of funds requires additionalborrowing or donations, delayed payment of debt orexpenses, or, in the case of a branch, a request to thehead office for additional funds. Note that a shortage ofcash should never result in delayed disbursement ofloans. The incentive of continued access to credit con-tributes largely to the on-time repayment of loans. In thissense, liquidity risk for MFIs ultimately may be reflectedin increased loan delinquency in addition to the potentialincrease in the cost of funds.
If there are excess funds, a decision must be made onwhether to hold the funds in short-term investments,repay short-term debt, or, in the case of a branch, returnthe funds to the head office. Some idle funds should beheld at all times to compensate for late loan repayments orto pay for emergencies (or, if voluntary savings are collect-ed, to meet demands for withdrawal). The amount of cashheld needs to be balanced with the loss of revenue experi-enced when holding idle funds. If an MFI has a number ofbranches, the head office will usually determine the appro-priate amount of idle funds to be held at each branch.Note that if there is a network of branches, all branch fore-casts (or cash requirements) need to be consolidated toresult in a cash flow forecast for the MFI as a whole.
It is important that the cash flow forecast consider therecovery rate on loans. This will vary for each MFI andwithin each branch. For example, if loan repayments dueare 100,000 but the branch historically experiences a 90percent repayment rate, then estimated loan repayments
(cash inflow) must be adjusted to 90,000. Table 10.4provides a sample branch cash flow forecast.
By calculating the net cash at the end of each month,it is possible to determine how much cash the branchwill return to the head office or request from it
The final ratio presented to manage liquidity risk isthe current ratio. The current ratio is commonly used bycommercial financial institutions and is sometimesreferred to as the liquidity adequacy ratio.
The current ratio demonstrates the ability of the MFIto make debt-service payments and calculates the degree ofcoverage provided by short-term assets. In the Christenand others (1995) study current ratios for the most suc-cessful MFIs ranged between 1:1 and 5:1.
Some MFIs manage liquidity by establishing a line ofcredit, that is, by managing the liability side of the bal-ance sheet rather than the asset side (such as cash flow).In this way costs are incurred only when the credit line isused. This method of liabilities management is onlyavailable to MFIs that have proven their ability to man-age their financial performance and have thus been ableto establish a relationship with a commercial bank.
INTEREST RATE RISK. Interest rate risk is the most conven-tional asset and liability management topic. Interest raterisk arises when interest rates on assets and interest rateson liabilities (which fund the assets) are mismatched,both in rates and terms. Interest rate risk occurs afterassets and liabilities have been priced or loans have been
Current assets
Current liabilities
Current ratio =
Expected Expected Expected Expected Expectedsavings loan payments payments savingscollected disbursements fixed costs variable costs withdrawal Net cash
(G) (H) (I) (J) (K) (L)
15,000 300,000 50,000 30,000 0 96,000
13,750 275,000 50,000 27,000 5,000 19,000
17,500 350,000 50,000 33,000 0 8,250
258 M I C R O F I N A N C E H A N D B O O K
booked. It should not be confused with pricing loans tocover the MFI’s costs and expected returns.
Interest rate risk is particularly a problem for MFIsoperating in countries with unpredictable inflation rates,which directly affects interest rates on debt. If the infla-tion rate rises, the interest rate set on loans will not behigh enough to offset the effects of inflation. An MFI’sability to adjust interest rates on its loans is determinedby the degree to which short-term liabilities are used tofund longer-term loans within the portfolio; in otherwords, short-term liabilities may be repriced before theMFI is able to change the interest rates on its loans(assets), reducing spread (Bartel, McCord, and Bell1995). Interest rate risk is primarily of concern to MFIsthat mobilize deposits or have relatively long loan terms(of greater than one year).
Interest rate risk analysis begins with two mainquestions:� What is the amount of funds at risk for a given shift in
interest rates?� What is the timing of the cash flow changes that will
be experienced for a given interest rate shift?It is important to know how large the effect of a
change in interest rates will be in present value terms andwhen the effect will be felt.
To determine the amount of funds at risk for a givenshift in interest rates, it is necessary to look at the differentassets and liabilities of an MFI. Not all assets or liabilitiesbehave the same given a percentage change in interestrates. This is referred to as interest rate sensitivity. MFIclients are generally not interest rate sensitive. Given thelack of alternatives for credit or savings services in theinformal sector, a percentage change in interest rates(either credit or savings) will not greatly influence theirbehavior. What is important is the availability, quality, andconvenience of services. (Alternatively, time deposits andlarger loans are provided to more sophisticated clients whoare generally more interest rate sensitive. However, basedon the premise that microfinance serves lower-incomeclients, we can assume that interest rate sensitivity is forthe most part less important to managing interest rate riskthan responding to the timing of any cash flow shifts.)
For the timing of cash flow shifts, there are two tech-niques in general use. They are gap analysis and simulationmodeling. Only gap analysis is presented here, because sim-ulation modeling involves very sophisticated techniquesnot appropriate for most MFIs at this time. Gap analysis
refers to determining the gap between rate-sensitive assetsand rate-sensitive liabilities. Rate-sensitive assets or liabili-ties are those that mature or can be priced either upwardor downward over the next few months (Christen 1997).Gap analysis allows for managers to manage their gap posi-tion based on their expectations of future interest ratechanges (see appendix 1 for more information).
While gap analysis may seem unnecessary for mostMFIs, it will become more important as more MFIsmature and begin to take on different types of funding,such as voluntary deposits or commercial debt. Gap posi-tions will have to be managed effectively to maintain (orachieve) financial sustainability. Again, as with mostfinancial self-sufficiency issues, gap analysis will becomemore common for MFIs as donor funding decreases andthey begin to take on more liabilities.
FOREIGN EXCHANGE RISK. Most MFIs are exposed to for-eign exchange risk if they receive donor or investmentfunds in other than their local currency or if they holdcash or other investments in foreign currency. The deval-uation or revaluation of these assets and liabilities acts thesame way as interest rates in exposing the MFI to poten-tial gain or loss. Managing this risk can influence theprofitability of an MFI.
Managing foreign exchange risk refers to measuringtraditional currency mismatches by the maturity of themismatch. However, most often MFIs only need to worryabout foreign exchange risk if they must repay loans (todonors or commercial sources) in a foreign currency thatthey have converted to local currency (either immediatelyor as needed) and, therefore, on which they are earningrevenue in local currency. This means that funds that arereceived in one currency and lent out in another must bemanaged to reduce potential losses when they are convert-ed back to the foreign currency. This can be donethrough gap analysis similar to that done for interest raterisk, except that this measurement is of currency mis-matches rather than maturity mismatches.
Operating Risk Management
Operating risk refers to the risk of losses or unexpectedexpenses associated with fraud, inefficiency, errors, andunforeseen contingencies. Clear and transparent opera-tional guidelines and policies help to reduce all types ofoperating risk, including errors. Unforeseen contingen-
cies can be minimized through experience. Operationalguidelines should be reviewed (although not too fre-quently, because staff may be operating under olderguidelines if not properly informed) and revised periodi-cally. Annual external audits can also contribute to thereduction of operating risk.
REDUCING THE LIKELIHOOD OF FRAUD. The decentralizednature of microfinance activities lends itself to fraud.Common types of fraud are fictitious loans, claimingborrowers have not repaid when they have, acceptingsavings contributions without recording them, or dis-bursing smaller loan amounts than recorded (box 10.8).
Controlling fraud is difficult in MFIs. Four aspectsare crucial for successful fraud control: market pricing,adequate salaries for credit officers, simplicity of opera-tions, and accountability and transparency (Hook 1995).
Below-market pricing invites bribes to MFI employeeswho make loan decisions. At low rates, the borrower canafford to pay a bribe and still benefit from taking the loan.Artificially low rates also invite borrowers to on-lend thefunds at higher rates, often to the intended target market.
Credit officers who do not feel that they are earningan adequate salary will be more apt to commit fraud as ameans of supplementing their low salaries, either throughtaking bribes or creating fictitious loans.
The more standardized the credit operations, thefewer opportunities for individual negotiation of termsand the fewer opportunities for fraud.
The accounting system must be developed in a de-centralized manner so that management can see clearlywhat lending and recovery is taking place at the creditofficer level. An effective way to control fraud is to doperiodic audits of branches’ and credit officers’ records.These audits should include a review of operational pro-cedures and periodic visits to clients to verify recordedinformation. Further control measures are establishedwith an effective and timely management informationsystem.
Box 10.9 lists the internal controls and operationalissues the Mennonite Economic Development Asso-ciation (MEDA) identified in response to an incidentof fraud that seriously undermined one of its creditoperations.
AUDITING MICROFINANCE INSTITUTIONS. Audits are per-formed to verify that the financial statements of an MFIfairly reflect its performance. There are a number of peo-ple interested in external audits, including the manage-ment of the MFI, the board, donors, lenders, investors,and regulators. Auditors should review the accountingsystem and the loan-tracking system. Most particularly,external audits should verify the quality of the loan port-folio, including loan loss provisioning and write-offpolicies.
Although most large MFIs are externally audited eachyear, most auditors are not familiar with microfinanceand there are few procedures in place for auditing MFIs.
P E R F O R M A N C E M A N A G E M E N T 259
THERE ARE SEVERAL FEATURES THAT MAKE MFIS MORE
vulnerable to fraud:� A weak information system exposes the institution to fraud-
ulent practices. If an MFI cannot detect instances of delin-quency at the loan officer level, it could have significantproblems with fraud.
� A change in the information system is a time of particularvulnerability. To protect against fraud when an institutionintroduces a new computer system, it is common practiceto run the old and new system in tandem until both havebeen audited.
� Weak or nonexistent internal control procedures create anenvironment in which fraud can be prevalent. Many MFIsdo not have an internal audit function and their external
auditors do not even visit branches, much less confirmclient balances.
� MFIs are vulnerable when they have high employeeturnover at management, administrative, or loan officerlevels.
� If the organization offers multiple loan products or if itsproducts are not standardized, staff and clients have anopportunity to negotiate mutually beneficial arrangements.
� If loan officers handle cash and if clients do not understandthe importance of demanding an official receipt, the MFIis extremely vulnerable to wide-scale petty fraud.
� When an MFI experiences rapid growth, it is difficult tocultivate the depth of integrity that is required among staffmembers and for internal control practices to keep pace.
Box 10.8 Institution Vulnerability to Fraud
Source: Valenzuela 1998.
260 M I C R O F I N A N C E H A N D B O O K
“External auditors in traditional finance have amuch easier job than those dealing with MFIs,because the most crucial measure of financialhealth—the quality of assets—has a number ofinternal procedures and cross-checks that allowfor external verification and validation. The lackof collateral in microfinance throws auditing offbalance. The financial assets of an MFI are notbacked by the type of assets or security withwhich an auditor feels comfortable.” (Jackelen1998, 57)There are four possible ways for auditors to make up
for the lack of collateral common in microfinance(Jackelen 1998):� Procedural audit. This audit should make sure that
loan applications and loan analysis were done cor-rectly, loan sizes and terms comply with MFI poli-cies, loans were approved by the proper people, legaldocuments were properly signed and notarized andkept in the appropriate place, and delinquency man-agement timing and procedures are correctly fol-lowed. These items cannot be checked simply bylooking at documents. Auditors need to observe theprocedures in action to assess whether they were fol-lowed properly.
� Portfolio quality. Portfolio reports need to be recon-ciled with client information. The main issues are
the actual amounts outstanding and the accuracy ofthe portfolio classification. In addition, refinanced orrestructured loans must be looked at carefully.
� Client sampling. Auditors need to verify informationwith a statistical sampling of clients. This requiresphysically visiting the clients and having them vol-unteer their account balances.
� Industry benchmarking and trend analysis. The micro-finance industry needs established standards orbenchmarks to allow auditors to compare the perfor-mance of one MFI with that of another. Auditorsshould also complete a trend analysis on the portfo-lio quality. This analysis will demonstrate that eventhough loans of MFIs are often unsecured, they canbe safe.
Appendix 1. Gap Analysis
The concept of gap analysis is relatively simple. Eachasset and liability category is classified according to thetime that it will be repriced and is then placed in agrouping called a time bucket. Time buckets refer to thetime that assets or liabilities mature, generally grouped inthree-month to one-year intervals.
In microfinance organizations, the assets are frequentlyshort-term (loans, term deposits, and so on) while the lia-
THE MENNONITE ECONOMIC DEVELOPMENT ASSOCIATION
(MEDA) recently enforced the following policies to controlfraud:� Checks never written to cash� Payments only to the cashier� Complete documentation of clients� Adherence to the defined lending methodology� Regular internal and external audits� Accountability of loan officers for the performance of
their portfolios� Accurate and timely reporting� Reliable client-tracking database� Monthly reconciliation of portfolio records and the
accounting system.MEDA also identified the following organizational and
management lessons that help in controlling fraud:
� Entrench the vision. Carefully recruit and check refer-ences; provide training complemented by modeling andtesting.
� Control growth. Begin with a pilot program; put an earlyemphasis on operations, not institutional development;do not scale up until everything is working; have thecourage to say no and to shut the funding tap periodi-cally.
� Make sure management stays close to operations. Encouragean open management environment; avoid distance man-agement; ensure management structure demandsaccountability for results; demand timely and accuratereports; monitor, monitor, monitor.
� Understand your clients. Use pilot phases to test metho-dology; ensure staff knows the impact on clients’ busi-nesses.
Box 10.9 Fraud Control at Mennonite Economic Development Association
Source: Contributed by Allan Sauder, Mennonite Economic Development Association.
bilities are frequently long term (concessional loans, com-pulsory deposits). This results in a funds gap. A funds gapis defined as assets minus liabilities within each time buck-et. The gap ratio is assets divided by liabilities in each timebucket. A funds gap or gap ratio of zero means that theMFI has exactly matched the maturity of its assets and thatof its liabilities. This match, however, is difficult to achievebased on the balance sheet structure of most MFIs.
Gap positions are measured for each time bucketusing the following formula:
An acceptable level for this ratio depends on the aver-age loan term, terms of the liabilities, and expectationsabout the movement of interest rates (Bartel, McCord,and Bell 1995). If the gap ratio is greater than one, it isreferred to as a positive gap or asset-sensitive position. Thismeans that there are more interest rate sensitive assets for aparticular time period than liabilities. If an MFI expectsinterest rates to rise, it will likely maintain a positive short-term gap. However, if interest rates decline, both assetsand liabilities will be repriced at a lower rate when the timeperiod ends. Because there are fewer repriced liabilities tofund the repriced assets, the result is increased risk (that is,the lower repriced assets will be funded in part with higherliabilities that have not yet been repriced).
On the other hand, if the gap ratio is less than oneor if there is a negative gap, a liability-sensitive positionresults. If interest rates decline, risk is reduced becausethe lower-priced liabilities will be funding more assetsthat are still priced at the higher rate. If an MFI antici-pates declining interest rates, it will maintain negativeshort-term gaps, which allow more liabilities to repricerelative to assets.
Sources and Further Reading
Bartel, Margaret, Michael J. McCord, and Robin R. Bell. 1995.Financial Management Ratios II: Analyzing for Quality andSoundness in Microcredit Programs. GEMINI TechnicalNote 8. Financial Assistance to Microenterprise Programs,Development Alternatives Inc. Washington, D.C.: U.S.Agency for International Development.
Christen, Robert Peck. 1997. Banking Services for the Poor:Managing for Financial Success. Washington, D.C.:ACCION International.
Christen, Robert, Elisabeth Rhyne, Robert Vogel, and CressidaMcKean. 1995. Maximizing the Outreach of MicroenterpriseFinance: An Analysis of Successful Microfinance Programs.Program and Operations Assessment Report 10. Washington,D.C.: U.S. Agency for International Development.
Churchill, Craig, ed. 1998. Moving Microfinance Forward:Ownership, Competition, and Control of MicrofinanceInstitutions. Washington, D.C.: MicroFinance Network.
Economics Institute. 1996. “Managing the DelinquencyCrisis.” Microfinance Training Program, Boulder, Colo.
Fitzgerald, Thomas M. 1997. “Risk Management.”Comptroller of the Currency, Administrator of NationalBanks, Washington, D.C.
Flaming, Mark. 1994. Technical Guide for the Analysis ofMicoenterprise Finance Institutions. Washington, D.C.:Inter-American Development Bank.
Hook, Richard. 1995. “Controlling Fraud in MicrofinancePrograms.” Microenterprise Development Brief 6. U.S.Agency for International Development, Washington, D.C.
Jackelen, Henry. 1998. “Auditing: The Missing Dimension inMicrofinance.” In Craig Churchill, ed., MovingMicrofinance Forward: Ownership, Competition, and Controlof Microfinance Institutions. Washington, D.C.:MicroFinance Network.
Ledgerwood, Joanna. 1996. Financial Management Training forMicrofinance Organizations: Finance Study Guide. NewYork: PACT Publications (for Calmeadow).
Ledgerwood, Joanna, and Jill Burnett. 1995. ADEMI CaseStudy. Calmeadow, Toronto, Canada.
Ledgerwood, Joanna, and Stefan Harpe. 1995. “Tulay Sa Pag-Unlad.” Calmeadow, Toronto, Canada.
Mommartz, R., and M. Holtman. 1996. Technical Guide forAnalyzing the Efficiency of Credit Granting NGOs.Saarbrücken, Germany: Verlag fur EntwicklungspolitikSaarbrücken.
Morris, D.D., A. Power, and D.K. Varma, eds. 1986. Guide toFinancial Reporting for Canadian Banks. Ottawa, Canada:Touche Ross.
Rhyne, Elisabeth, and Linda S. Rotblatt. 1994. “What MakesThem Tick? Exploring the Anatomy of MajorMicroenterprise Finance Organizations.” Monograph 9.Washington, D.C.: ACCION International.
Stearns, Katherine. 1991a. The Hidden Beast: Delinquency inMicroenterprise Programs. Washington, D.C.: ACCIONInternational.
———. 1991b. “Methods for Managing Delinquency.” GEM-INI Technical Report. Development Alternatives, Inc.,Bethesda, Md.
Assets maturing (or eligible for repricing)within one year – liabilities maturing
(or eligible for repricing) within one year
Total Assets
Cumulative gap tototal assets ratio
=
P E R F O R M A N C E M A N A G E M E N T 261

Uyemura, Dennis G., and Donald R. van Deventer. 1993.Financial Risk Management in Banking: The Theory andApplication of Asset and Liability Management. Bankline,Salem, Mass: Bank Administration Institute Foundation.
Valenzuela, Liza. 1998. “Overview on Microfinance Fraud.” InCraig Churchill, ed., Moving Microfinance Forward:Ownership, Competition, and Control of MicrofinanceInstitutions. Washington, D.C.: MicroFinance Network.
262 M I C R O F I N A N C E H A N D B O O K

Glossary

265
Glossary
Adjusted cost of capital: the cost of maintaining the value of the equity rela-tive to inflation (or the market rate of equity) and accessing commercialrate liabilities rather than concessional loans.
Apex institution: a legally registered wholesale institution that providesfinancial, management, and other services to retail MFIs.
Arrears: the amount of loan principal (or principal plus interest) that hasbecome due and has not been received by the MFI.
Arrears rate: the amount of overdue loan principal (or principal plus interest)divided by the portfolio outstanding.
Asset utilization: provides an indication of where revenue is earned based onwhere the assets are invested.
Asset and liability management: the financial risk management of a financialinstitution, particularly regarding the structure of its balance sheet and therisks and returns inherent in this structure.
CAMEL: a system to analyze the five traditional aspects considered to be mostimportant in the operation of a financial intermediary. These five areasreflect the financial condition and general operational strength of an MFIand include capital adequacy, asset quality, management, earnings, and liq-uidity.
Capital: invested funds in the form of member shares, notes payable, andinvestments by outsiders. Institutional capital is capital in the form ofretained earnings and reserves.
Capital adequacy: the amount of capital an MFI has relative to assets, indi-cating a sufficient level of capital to absorb potential losses while ensuringfinancial sustainability.
Capitalize: record as an asset on the balance sheet to be depreciated in thefuture (through a depreciation expense on the income statement).
Cash flow analysis: identification of the cash flows of an MFI relative to theamount of cash needed for operations and the amount of funds availablefor investment.
Cash inflows: cash received by the business or household in the form ofwages, sales revenues, loans, or gifts.
Cash outflows: cash paid by the business or household to cover payments orpurchases.
Cash management: the timing of cash flows to ensure that cash coming in(cash inflow) is equal to or greater than cash going out (cash outflow).
Collateral: traditionally, property, land, machinery, and other fixed assets.Alternative forms of collateral include group guarantees, compulsory sav-ings, nominal assets, and personal guarantees.
Concessional loans: loans with rates of interest lower than the market rates.Covariance risk: the risk that exists if the majority of clients are active in the
same economic sector—that is, if they are all traders in the same area ormanufacturers of the same products.
Cosigner: a person who agrees to be legally responsible for a loan but has notusually received a loan of her or his own from the MFI.
Credit: borrowed funds with specified terms for repayment.Credit unions: see Financial cooperatives.Current ratio: a ratio indicating the ability of an MFI to make debt-service
payments—that is the degree of coverage provided by short-term assets.(Also called the liquidity adequacy ratio.)
Declining balance method: a method of calculating interest as a percentageof the amount outstanding over the loan term.
Debt: monies borrowed by the MFI to fund its assets.Debt capacity: the ability of a client (or an MFI) to repay borrowed funds.Depth of outreach activities: the poverty level of clients reached by an MFI.
(See also scale of outreach.)Depreciation: an annual expense determined by estimating the useful life of
each asset.DEVCAP: a shared mutual fund designed to provide financial returns to its
investors and to member microfinance institutions.Direct targeting: the allocation of a specific amount of funds to provide cred-
it to a particular sector of the economy or population.Econometrics: an analytical technique applying statistical methods to eco-
nomic problems.Efficiency indicator: see operating cost ratio.Efficiency management: the management of costs per unit of output.Enterprise development services: nonfinancial services for microentrepre-
neurs, including business training, marketing and technology services,skills development, and subsector analysis.
Financial cooperatives: member-owned financial institutions that have noexternal shareholders, with each member having the right to one vote inthe organization. Members may deposit money with the organization orborrow from it, or both.
Financial intermediation: the provision of financial products and services,such as savings, credit, insurance, credit cards, and payment systems.
Financial regulation: the body of principles, rules, standards, and compli-ance procedures that apply to financial institutions.
Financial supervision: the examination and monitoring of organizations forcompliance with financial regulation.
266 M I C R O F I N A N C E H A N D B O O K
Financial viability: the ability of an MFI to cover its costs with earned rev-enue.
Fixed assets: machinery, equipment, and property (for example, motorcycles,sewing machines, egg incubators, or rickshaws).
Fixed asset loans: loans made for the purchase of assets that are used overtime in the business.
Flat method: a method for calculating interest as a percentage of the initialloan amount rather than as the amount outstanding during the term of theloan.
Formal institutions: financial institutions that are subject not only to generallaws and regulations but also to specific banking regulation and supervi-sion.
Fungible: Exchangeable, replaceable. For example, fungible money is moneyintended for purpose x that may be used for purpose y.
Gap analysis: a determination of the gap between rate-sensitive assets andrate-sensitive liabilities.
Group-based lending: lending involving the formation of groups of peoplewho have a common wish to access financial services; often includes groupguarantees.
Group social intermediation: assistance in building the capacity of groupsand investing in the human resources of their members so that they canbegin to function on their own.
Idle funds: funds held by an MFI that are not earning any revenue or areearning less revenue than could be earned if they were lent out to borrow-ers or invested.
Impact analysis: a determination of the outcome of an intervention.Indirect targeting: the design of products and services for people who are
beyond the frontiers of normal formal finance (rather than the mandatingof specific funds for particular groups with a narrowly defined profile).
Informal providers: organizations or individuals, but generally not institu-tions, that are not subject to special banking laws or general commerciallaws, whose operations are so “informal” that disputes arising from contactwith them often cannot be settled by recourse to the legal system.
Integrated MFIs: MFIs offering financial intermediation as well as enterprisedevelopment, social, or other services.
Interest rate risk: the risk that rises when interest rates on assets and interestrates on liabilities funding the assets are mismatched in both rates andterms.
Leverage: the amount of money borrowed by an MFI relative to its amountof equity.
Liquidity: the amount of cash (or near-cash) available to an MFI relative toits demand for cash.
Liquidity adequacy ratio: see current ratio.Liquidity ratio: a calculation determining whether enough cash is available
for disbursements and also whether there is too much idle cash.
G L O S S A R Y 267
Liquidity risk: the risk of not having enough cash to meet demands for cashleading to additional expenses for borrowing relatively expensive short-term funds to fund an illiquid position.
Loan loss ratio: a calculation determining the rate of loan losses for a specificperiod (usually a year).
Loan loss reserve: the cumulative amount of loan loss provisions (recorded asan expense on the income statement) minus loan write-offs; generallyrecorded on the balance sheet as a negative asset.
Loan loss reserve ratio: a calculation showing the percentage of the loanportfolio that has been reserved for future loan losses.
Microfinance: the provision of financial services to low-income clients,including the self-employed. In addition to financial intermediation, someMFIs also provide social intermediation services, including help in groupformation and the development of self-confidence, financial literacy, andother services.
Minimalist MFIs: MFIs offering financial intermediation only.Monopsony: a market with a single buyer, in distinction to a monopoly,
which is a market with a single seller.Moral hazard: the incentive of an agent who holds an asset belonging to
another person to endanger the value of that asset because the agent bearsless than the full consequence of any loss.
Near-cash: noninterest-bearing deposits and deposits earning a very low rateof interest and having a maturity of three months or less (that is, termdeposits, investment certificates). Near-cash is money that is generallyhighly liquid (available on demand).
Nonbank financial institutions: financial institutions that circumvent theinability of some microfinance institutions to meet commercial bank stan-dards and requirements due to the nature of their lending.
Operating cost ratio: a calculation determining operating costs relative tooutstanding loans (or performing assets); regarded as an indication of theefficiency of the lending operations. (Also called the efficiency indicator.)
Operating risk: the risk of losses or unexpected expenses associated withfraud, inefficiency, errors, and unforeseen contingencies.
PERLAS (or PEARLS): a system of 39 financial ratios used by the WorldCouncil of Credit Unions to monitor the performance of credit unions.
Performance indicators: ratios comparing one piece of financial data toanother. (See trend analysis.)
Portfolio diversification: the avoidance by a financial institution of a portfo-lio that is concentrated in one geographic sector or market segment.
Portfolio at risk: the outstanding balance of all loans having an amount over-due. In distinction to arrears, portfolio at risk includes the amount inarrears plus the remaining outstanding balance of the loan.
Portfolio outstanding: the principal amount of loans outstanding in a micro-finance institution.
Portfolio quality ratios: calculations providing information on the percent-
268 M I C R O F I N A N C E H A N D B O O K
age of nonearning assets, which in turn decrease the revenue and liquidityposition of an MFI.
Productivity: the volume of business generated (output) for a given resourceor asset (input).
Productivity and efficiency ratios: calculations providing information aboutthe rate at which an MFI generates revenue to cover expenses.
Profit margin: profits relative to total revenue earned.ProFund: an equity investment fund that provides equity and quasi-equity
(subordinated debt) to selected MFIs to support the growth of regulatedand efficient financial intermediaries that serve the small business andmicroenterprise market in Latin America and the Caribbean.
Ratios: calculations comparing one piece of financial data to another, oftenreferred to as performance indicators.
Refinancing a loan: providing an amount of loan funds in addition to theoriginal loan amount.
Repayment rate: the historic rate of loan recovery, measuring the amount ofpayments received with respect to the amount due.
Rescheduling a loan: extending the loan term or changing the paymentschedule of an existing loan.
Return on assets: a ratio measuring the net income earned on the assets of amicrofinance institution.
Return on equity: a ratio measuring the return on funds that are owned bythe organization.
Scale of outreach: the number of clients served by an MFI. (See also depthof outreach.)
Securitization: a method of linking MFIs to capital markets by issuing corpo-rate debentures backed by (and serviced by) the MFI’s portfolio.
Semiformal institutions: institutions that are formal in the sense that theyare registered entities subject to all relevant general laws, including com-mercial law, but informal insofar as they are, with few exceptions, not sub-ject to bank regulation and supervision.
Sharia: the Islamic law, administered by councils of advisors, that dictateswhich financial products and services are viewed as correct.
Social capital: those features of social organization, such as networks, norms,and trust, that facilitate coordination and cooperation for mutual benefit.
Social intermediation: the process of building the human and social capitalrequired for sustainable financial intermediation for the poor.
Social services: nonfinancial services that focus on improving the well-beingof microentrepreneurs.
Spread: the difference between the rate of interest paid by a financial institu-tion to borrow money and the rate of interest charged by that institutionto lend money; used to cover administrative costs, loan losses, and adjust-ed capital costs.
Subsidy dependence index: the percentage increase required in the on-lendinginterest rate to completely eliminate all subsidies received in a given year.
G L O S S A R Y 269

Target market: a group of potential clients sharing certain characteristics,tending to behave in similar ways, and likely to be attracted to a specificcombination of products and services.
Transfer pricing: the practice of pricing services or funds between the headoffice and branches on a cost-recovery basis.
Trend analysis: the comparison of performance indicators over time.
270 M I C R O F I N A N C E H A N D B O O K
Index


273
Index
Accion Comunitaria del Peru, 100, 101; ProFund equityinvestment and, 115; startup considerations of, 109
ACCION International, 2; Bridge Fund, 113; CAMELsystem of performance standards, 227, 229; financial-ly viable lending and, 67; MFI business plan elabora-tion and, 123; microfinance approach of, 83;ProFund sponsorship, 115; Publications Department,6; securitization and, 116–17; solidarity group lend-ing by, 69, 84
Accounting adjustments, 188–94; accrued interestexpense, 194; accrued interest revenue, 193–94; depre-ciating fixed assets, 187, 192–93; loan losses, 188–92
Accounting principles, international, 157Accounting systems, 171–72; cash versus accrual, 194;
growth enterprises and, 45; subsidies and, 195Accrued interest expense, accounting for, 194Accrued interest revenue, accounting for, 193–94Accumulated capital, concessional loan subsidies, 196;
loan fund subsidies and, 197Accumulated depreciation, 192–93ACEP (Association de Crédit et d’Epargne pour la
Production), Senegal, 174Adams, Dale, 113ADEMI. See Association for the Development of Micro-
enterprisesADEMI MasterCard, 75, 241Adjustments, financial statement, 187–204; accounting,
188–94; inflation samples, 202–3; restating in con-stant currency terms, 199; subsidies and inflation,194–99; subsidies samples, 200–201
Administrative costs, 149; Banco Caja Social, Colombia,167
Advocacy, 29–30Agence de Credit pour l’Enterprise Privée, Senegal, 83
Agence de Financement des Initiatives de Base, Benin,78
Aging analysis, 190Agricultural Credit Review Committee, India, 15Albania, Albanian Development Fund, 28; Foundation
for Enterprise Finance and Development (FEFAD),45, 46
Alexandria Business Association, Egypt, 20; individuallending by, 83; management information systems of,174
Alternative Bank, Switzerland, 101AMPES-Servicio Crediticio, El Salvador, 110Annual contribution margin calculation, 244Apex institutions, 26, 108; creating, 106–9Appropriate Technology International, 116Argentina, tax laws in, 29Arrears rate, 207–8; sample portfolio with aging and,
209Asociación Grupos Solidarios de Colombia, 84–85Asset accumulation, household-level impacts and, 53;
quantitative impact assessment and, 58Asset and liability committee (ALCO), 254Asset and liability management, 254–58; credit risk,
255; foreign exchange risk, 255, 258; interest raterisk, 257–58; liquidity risk, 255–57
Asset growth, regulatory restrictions and, 21Assets, inflation and revaluation of, 198; pledged at value
less than loan, as collateral, 138; quality of, 24; ratioof return on, 220, 221–22, 238–41; utilization of,220, 238
Association de Crédit et d’Epargne pour la Production(ACEP), Senegal, 174
Association for the Development of Microenterprises(ADEMI), Dominican Republic, 43, 69; ADEMI
MasterCard, 75, 241; analysis of return on assets of,239–41; Banco de Desarollo ADEMI, S.A. and, 112;collateral requirements, 139; credit card services, 74;cross-subsidization of loans, 143; individual lendingand, 68, 83; loan activity reports, daily, 252; manage-ment information systems at, 177; performanceincentives of, 250; personal guarantees as collateraland, 138
Association of Micro and Small Entrepreneurs (AMPES),El Salvador, 110
Audits, fraud control and, 259–60
Badan Kredit Kecamatan, Indonesia, 67Bad debt, impact of failure to write-off, 191, 210–11Banco de Desarollo ADEMI, S.A., Dominican Republic,
112Banco Desarrollo, Chile, 106Banco Empresarial, Guatemala, 115Banco Popular Dominicano, 75, 240, 241BancoSol Bolivia, 101; capital adequacy of, 24; group
lending and, 84; marketing savings products by, 162;ProFund equity investment and, 115; savings mobi-lization and, 163; women clients of, 38
Banco Solidario, Ecuador, 115Bangladesh, human dynamic and BRAC success in, 51;
Rural Advancement Committee, 84Bank for Agriculture and Agricultural Cooperatives
(BAAC), Thailand, 98, 159, 161; growing savingsmobilization of, 72
Banking supervision, 26, 157Bank loans, leveraging capital and, 224Bank Perkredital Rakyats, Indonesia, 108Bank Rakyat Indonesia, 2; cross-subsidization of
loans, 143; financially viable lending and, 67; asgood government-run microfinance program, 15;growing savings mobilization of, 72; individuallending by, 83; marketing savings products by,162; mobile banking by, 163; on-time paymentincentives of, 245; prompt payment incentives of,138; savings mobilization at, 157, 158; savingsproducts of, 165; transfer pricing at, 253; unit desasystem, 16, 143
Bank supervisors, 26Banque Nationale de Développement Agricole (BNDA),
Mali, 98BASE Kenya “Micro Finance Institution Monitoring
and Analysis System,” 227
Basle Accord, 225Below-market pricing, 259Benin, Agence de Financement des Initiatives de Base,
78; Catholic Relief Services, 85; Fédération desCaisses d’Epargne et de Crédit Agricole Mutuel(FECECAM), 68, 69, 76, 83, 102
Benjamin, McDonald P., Jr., 219n, 238nBennett, Lynn, 64nBerenbach, Shari, 30–31Bolivia, Caja de Ahorro y Prestamo Los Andes, 100,
101; Freedom from Hunger, 85; group lending,PRODEM, 84; MFI regulation in, 25; private finan-cial funds, 25; Pro-Credito, 101; PRODEM impactanalysis, 50; Superintendency of Banks, 101
Branch offices, cash flow forecasts of, 256–57; manage-ment information systems and, 175
Bratton, M., 71Bridge Fund, ACCION International, 113Burkina Faso, Freedom from Hunger, 85; group loan
repayment study in, 71; indirect advisory services ofcarpenters association in, 79; Reseau des CaissesPopulaires, 178; Sahel Action, 84; self-reliant villagebanking in, 86
Business, ratio of return on, 220, 222–23Business activity types, 45–46; versus income-generating
activities, 48Business base, 222–23Business development level, MFI target markets and,
43–45Business NGOs, 64Business plan, MFI, definition of, 123; elaboration of,
123–28; financial statements, 128; financing expan-sion, 127; format of, 125; institutional analysis,125–26; institutional capacity building and, 117;operational costs analysis, 127–28; portfolio analy-sis/projections, 126–27; premises of, 126; priorityprojects, 128; process of, 124
Business Women’s Association, Swaziland, 79
Caisses Villageoises d’Epargne et de Crédit Autogérées.See also Village banks, BNDA lending to, 98; growingsavings mobilization of, 72; local human resources in,162; self-reliant village banking and, 86
Caja de Ahorro y Prestamo Los Andes, Bolivia, 100,101; ProFund equity investment and, 115
Caja Municipales, Peru, 83Caja Social, Colombia, 83, 100
274 M I C R O F I N A N C E H A N D B O O K
Calmeadow, Resource Center, contacting, 6; MFI opera-tional review tool and, 118; PRODEM impact analy-sis and, 50; ProFund sponsorship, 115
Calvert Group, 116CAMEL system, ACCION International, 227, 229Cameroon, self-reliant village banking in, 86Capacity-building, institutional capacity, social interme-
diation and, 77Capital adequacy, 23–24, 223–25; risk and, 29, 255; tar-
get objectives and, 34Capital costs, 139; adjusted, financial self-sufficiency
and, 217–18; allowance for, 193; calculating, finan-cial viability and, 216
Capitalization rate, 150Capital markets access, 113–17; debt, 113–14; equity,
114–15; equity investment funds, 115–16; securitiza-tion, 116–17; socially responsible mutual funds, 116
Capital requirements, 23, 26, 109, 157CARE Guatemala, subsidy dependence index of, 221;
village banking and, 85, 104CARE International, 77, 104Cash flow, delinquent loans and, 243; loan amounts
and, 133–34; management, 255; market size and, 35Cash forecast, 256–57CASHPOR (Credit and Savings for the Hard-core Poor
Network), 52Caste, microfinance and, 41Catholic Relief Services, 77; Cooperative Association for
Western Rural Development, Guatemala and, 110;credit education and, 82; DEVCAP and, 116; usingapex model for expansion, 108; village banking and,85
Centre for International Development and Research, 85CENTRO ACCION Microempresarial, Colombia, 123Centro de Creditos y Capacitacion Humanistica,
Integral y Sistematica para la Pequena y Microempres(CHISPA), Nicaragua, 106, 107
CGAP (Consultative Group to Assist the Poorest), 19;contacting the Secretariat, 6; tracking performancethrough standard indicators of, 232
Character-based lending, collateral and, 137Chart of accounts, 171–72Check cashing/writing services, 75CHISPA (Centro de Creditos y Capatacion Human-
istica, Integral y Sistematica para la Pequena y Micro-empres), Nicaragua, 106, 107
Churchill, Craig, 30–31
Client-oriented impact analysis, 49–52; absence of ser-vices hypotheses and, 51–52; attribution and, 51;human subject as dynamic target and, 50–51; man-agement information systems and, 178; temporaryimpacts and, 51–52; transparency, honesty and, 51;vested interests of assessment team and, 51
Clients, audits and sampling of, 260; delinquency con-trol and screening of, 245; MFI operational reviewand, 120; transaction costs for, 71, 94
COFIDE (development bank), Peru, 101Collateral, loan, 137–38; alternative forms of, 138; sub-
stitutes, 137–38Collateral versus peer pressure, group lending and, 70Colombia, Asociación Grupos Solidarios de, 84–85;
Caja Social, 83, 100; CENTRO ACCIONMicroempresarial, 123; DESAP (financial NGO),103; Finansol, 21; Finansol and Corposol, 22;Fundacion Carvajal, 2, 79; reserve requirements in,158; Women’s World Banking efficiency gains, 248
Commercial banks, as MFIs, 99–100Commercial capital, linkages to, 18Compounding, borrower’s cost and, 148; internal rate of
return calculation and, 146–48Compulsory savings, 72–73, 105, 138; effective interest
rate and, 146–47; with interest, effective interest ratecalculation and, 151; payment incentive alternativeto, 245
Concessional loans, 195, 196Conference on Hunger 1993, 19Configuration, management information systems,
178–79Constant currency terms, financial statement adjust-
ments and, 187, 199Constraints, industry, subsector enterprise development
and, 88Consultative Group to Assist the Poorest (CGAP), 6, 19,
232Consumption loans, 3; unstable survivors and, 44Contextual factors, 11–32; economic/social policy envi-
ronment and, 26–30; financial intermediation suppli-ers, 12–17; government view of microenterprisesector, 29–30; human resource development, 28–29;infrastructure investment, 28–29; legal environmentand, 17–20; poverty levels, 28; regulation and super-vision issues, 20–26
Contingencies, appropriation for, 224Control methods, impact analysis, 53
I N D E X 275
Cooperative Association for Western Rural Development,Guatemala, 110
Cooperatives, financial, 101–3; versus financial NGOs,103
COPEME, Peru, 108; startup considerations of, 109Corporate governance, operational review and, 119–20Corposol (Colombian NGO), 22Costa Rica, FINCA village banking, 77, 85Cost of funds, 149; concessional loans, 196; fundraising,
195; savings products and, 167; subsidies and, 195;transfer pricing and, 253–54
Cost per loan made, efficiency ratios and, 214–15Cost per unit of currency lent, efficiency ratios and, 214Costs. See also Transaction costs, average, of funds, 139;
decentralized decisionmaking and, 252–54; delin-quent loans, 244; financing, 139; guarantee funds,113; management information systems and, 254;managing, performance efficiency and, 251–54;mobilizing voluntary savings, 166–67; operational,business plan analysis of, 127–28; standardized sys-tems/policies and, 254; total salary, 252
Country context, understanding. See Contextual factorsCovariance risk, 45Credibility, investor, 117Credit, 66–71. See also Loans; access, training courses
and, 43; delivery methods, 67–68; direct programsfor, 34–35; education with, 81–82; financially viable,67; growth enterprises and longer term investment,45; methodology, operational review and, 120–21;product design, 133–53; productive, 3; as service val-ued by clients, 245; subsidized, 15; targeted subsi-dized, 2, 34; trade, 104; types of, 66–67
Credit and Savings for the Hard-core Poor Network(CASHPOR), 52
Credit cards, 74, 75, 241Credit Mutuel, France, 101Credit officers, average salary as multiple of per capita
GDP, 214; cash handling, fraud control and, 259;daily loan activity reports for, 251, 252; efficien-cy/productivity incentives for, 248–49; fraud, ade-quate salaries and, 259; performance-based incentivesfor, 240; visits, collateral and, 137
Credit unions, 101–3; Benin, payment services and, 76;depth of outreach diamonds for, 228; Guatemala,retooling of, 118; Nicaragua, 107; rural Mexico, 14;social services and, 81
Cross-section samples, econometrics, 56, 59
Cross-subsidization of loans, 143Cuchubales (Guatemalan ROSCAs), 70Cultural impacts, MFI, 47–48Current ratio, 255, 257
DataEase software, 174Data transfer, management information systems installa-
tion and, 179–80Debt, accessing, 113–14; measures for, 114Debt capacity, definition of, 35; MFI target markets
and, 36; unstable survivors and, 43Debt to equity ratio, ADEMI’s low, 240; leverage and,
224Decentralized operations, decisionmaking, cost manage-
ment and, 252–54; fraud control and, 259; manage-ment risk and, 30–31
Declining balance method, depreciation, 192, 193; effec-tive interest rate calculation, 144, 145, 150–51; inter-est rate calculation, 140–41
Defaulted loans, 189; defined unappealing consequencesof, 246; internal rate of return and, 146
Delinquency crisis, steps to take in, 246Delinquency management, 243–48; control mecha-
nisms, 245–46; costs, 251–54; effect on profitability,244–45; rescheduling/refinancing and, 246–48
Delinquent borrowers rate, 208Delinquent loans, 189; definition of, 208, 210–11Department for International Development (DFID),
MFI performance standards and, 227Deposit collectors, India, 156Deposit insurance, 158–60Deposit Insurance and Credit Guarantee Corporation,
India, 159Deposit mobilization, calculating return on business
ratio and, 222–23; capital leveraging and, 224;growth, average per capita GNP growth and, 71;MFI regulation and, 21; nonbank MFIs and, 20
Depreciation, fixed asset, accounting for, 192–93; finan-cial statement adjustments and, 187
Depth of outreach, diamonds, 228; performance indica-tors and, 225–27
DESAP, Colombia, 103Deutsche Gesellschaft für Technische Zusammenarbeit
(GTZ), 78, 160nDEVCAP (Development Capital Fund), 116Development Alternatives, Inc., 76Development banks, 98
276 M I C R O F I N A N C E H A N D B O O K
Dichter, Thomas, on enterprise development services,78–80, 86–90; on impact analysis, 46–57
Dirección General Impositiva, Argentina, 29Direct costs, savings products and, 166Direct enterprise advisory services, 79Direct targeting, 34–35Disbursement per period per credit officer, productivity
and, 213Diversification, untested, 31; Finansol and, 22Dominican Republic. See also Association for the Devel-
opment of Microenterprises, Banco de DesarolloADEMI, S.A., 112
Domini Social Index, 116Donors, microfinance, 16–17; accounting for equity
and, 195, 196–97; accounting for in-kind donationsand, 195–96; accounting for loan capital and,196–97; accounting for operating costs and, 195–96;capital adequacy and, 224–25; comparing perfor-mance through currency conversion calculation for,199; MFI growth and, versus deposit-based growth,71–72; MFI ownership and, 111–12; political unrestand, 27
Downscaling, 100Dropouts, as impact analysis unit, 57; rates of, 51–52
Econometrics, 55–56, 58Economic sectors, business activity types and, 45–46Economic stability, 26–27; growth rate and, 27; infla-
tion and, 26–27Ecuador, estimating market size in, 126; Fundacion
Ecuatoriana de Desarollo (FED), 116–17EDPYME (Entidades de Desarrollo para la Pequena y
Microempresa), 101, 108Effective rate of interest, 143–48; definition of, 143; esti-
mating, 144–46; internal rate of return and, 146–48;variables in, 144, 147; varying cash flows and,147–48, 152–53
Effective yield, 148; annualized, 149Efficiency, cost management and, 251–54; institutional
capacity building and, 118; management, 31; organi-zational, sustainable interest rates and, 150; subsectorenterprise development and, 88–89; Women’s WorldBanking gains in, 248
Efficiency indicators, 214, 252Efficiency ratios, 212, 213–15; average credit officer
salary as multiple of per capita GDP, 214; cost perloan made, 214–15; cost per unit of currency lent,
214; operating cost ratio and, 214; salaries/benefits toaverage portfolio outstanding, 214; sample calcula-tions of, 215
Egypt, Alexandria Business Association, 20, 83, 174;rotating savings and credit associations in, 70
El Salvador, Association of Micro and Small Entre-preneurs (AMPES), 110; Save the Children, villagebanking and, 85; subsector policy dialogue in, 90
Empowerment impacts, 48–49Empretec training program, Ghana, 79Enterprise development services, 63, 64–65, 78–80;
beyond local marketplace and, 89–90; business opera-tion and, 87–88; business operator and, 86–87; costand impact value, 80; nonfinancial interventions of,78–79; results documentation of, 80; subsector and,88–89
Entidades de Desarrollo para la Pequena y Microempresa(EDPYME), Peru, 101, 108
Entrepreneurs clubs, subsector enterprise developmentand, 89
Equity, accessing, 114–15; calculating inflation cost on,198–99; debt ratio to, leverage and, 224; donated,195, 196–97; minimal requirement for, 36; returnratio on, 220, 223
Equity investment funds, 115–16Estimation method, effective interest rate, 144–46; sus-
tainable interest rate, 149Ethnicity, microfinance and, 41European Bank for Reconstruction and Development,
100Expansion, within existing structure, growth manage-
ment and, 106; financing, business plan and, 127;using apex model for, 108
Expenses, definition of, 215; delinquent loans and, 243
FAO Microbanking System, 181Fédération des Caisses d’Epargne et de Crédit Agricole
Mutuel (FECECAM), Benin, 68, 69; individuallending by, 83; payment services program, 76; reha-bilitation of, 102
Feedback loop effects, human dynamics, 51Fees, effective interest rate and, 146; full-cost, 67; loan,
142Fiduciary responsibility, 111Fiduciary risk, 255Finance Against Poverty, 39Financial indicators, chart of accounts and, 171–72
I N D E X 277
Financial intermediation, 64, 66–76; credit, 66–71;credit cards, 74; groups’ role in, 72; insurance, 74;payment services, 75–76; savings mobilization and,71–74, 161–62; smart cards, 75; social capital and,77
Financial intermediation suppliers, 12–17. See alsoFormal microfinance institutions; Informal financialsector; Semiformal microfinance institutions; existingproviders, 14–16; as political tool, 15
Financial management, evaluating MFIs, 122–23; insti-tutional capacity building and, 117–18
Financial paper, 115Financial Ratio Analysis of Micro-Finance Institutions,
227, 230Financial sector, policies, legal enforcement and, 17–20;
regulation and supervision, 20–25; savings mobiliza-tion and, 157–60
Financial self-sufficiency, 215, 217–18Financial spread, 216; asset/liability management and,
254Financial statements, business plan and, 128; nonadjust-
ed, financial viability calculations and, 216; nonad-justed, subsidy dependence index calculation and,218; sample, adjusted for inflation, 202–3; sample,adjusted for inflation and subsidies, 236–37; sample,adjusted for subsidies, 200–201
Financial systems approach, microfinance, 2–3Financial viability, 215–20; calculating sample ratios of,
218, 219; financial self-sufficiency and, 217–18;financial spread and, 216; lending and, 67; opera-tional self-sufficiency and, 217; subsidy dependenceindex, 218–20
Financiera Calpía, El Salvador, 110Finansol, Colombia, 21, 22, 115FINCA (Foundation for International Community
Assistance), 69–70, 77, 85Fixed assets, depreciating, 187, 192–93; loans, 136–37Fixed-term deposits, 166Flat interest, effective interest rate calculation, 144, 145,
151; interest rate calculation, 141–42FONDOMICRO, support of ADEMI, 240Foreign exchange risk, 255, 258Formal microfinance institutions, 12, 97–101; commer-
cial banks, 99–100; creating, 109–10; developmentbanks, 98; individual loans and, 68; nonbank finan-cial institutions, 100–101; postal savings banks, 98;private development banks, 97–98; public develop-
ment banks, 97; rural development banks, 97; savingsbanks, 98; small business development banks, 97
Formal sector, growth enterprises and, 44–45Foundation for Enterprise Finance and Development
(FEFAD), Albania, 45, 46Foundation for International Community Assistance
(FINCA), 69–70, 77, 85Fraud, 23, 148, 259, 260Freedom From Hunger, 77; credit education and,
81–82; framework for management information sys-tems, 178; as partner institution, 96; village bankingand, 85
Fruman, Cecile, 29Fundación Calpía, El Salvador, 110Fundación Carvajal, Colombia, 2, 79Fundación Ecuatoriana de Desarollo (FED), Ecuador,
116–17Fundación Paraguaya de Cooperacion y Desarrollo, 115FUNDES, ProFund sponsorship and, 115Fungibility, money, 136–37
The Gambia, Village Savings and Credit Associations(VISACA), 86
Gam’iyas (Egyptian ROSCAs), 70Gap analysis, 260–61; interest rate risk and, 258Gap ratio, 261Genesis, group lending program, Guatemala, 85Geographic focus, 40–41Germany, Deutsche Gesellschaft für Technische
Zusammenarbeit (GTZ), 78, 160n; InternationaleProjekt Consult GmbH (IPC), 101
Ghana, Empretec training program, 79; Freedom FromHunger, 85; MFI regulation in, 25; NonbankFinancial Institutions Law, 26; savings banks in, 98;“susu men” of, 104
Goldschmidt, Yaaqov, 197Governance, MFI, 30, 111; BAAC, Thailand, 161; sav-
ings mobilization and, 160Government, credit allocation intervention and, 34;
microenterprise sector position of, 29–30; microfi-nance programs, 14–15
Grace period, effective rate of interest and, 148, 152–53Grameen Bank, Bangladesh, 2; cross-subsidization of
loans, 143; effect on other MFI providers, 16; finan-cially viable lending and, 67; financial paper and,115; geographic focus of, 41; group lending by, 69;securitization and, 116–17; solidarity lending, 82,
278 M I C R O F I N A N C E H A N D B O O K
83–84; standardization at, 254; transfer pricing at,253; women’s enterprises and, 38
Grameen Trust, 82, 84Group fund contribution, effective interest rate calcula-
tion and, 151Groups. See also Self-help groups, joint liability, 67;
lending to, efficiency/productivity of, 249; loan guar-antees of, 137; loans to, 68–71; social intermediationand, 77–78
Growth management, 22, 31, 106–17; capital marketsaccess and, 113–17; creating apex institutions, 106–9;creating formal financial intermediary, 109–10;expansion within existing structure, 106; fraud controland, 259; governance, ownership and, 110–13
Growth Trust Corporation, Kingdom of Swaziland, 75, 76GTZ (Deutsche Gesellschaft für Technische
Zusammenarbeit), 78, 160nGuarantee funds, 113–14; collateral and, 137Guatemala, Cooperative Association for Western Rural
Development, 110; credit unions retooled in, 118;Genesis (group lending program), 85; rotating savingsand credit associations in, 70
Holt, S., 80Household-level impacts, 58; asset accumulation and,
53; intrahousehold, 57; microfinance and, 48Hulme, David, 39Human resource management, 121–22; savings mobi-
lization and, 161–62
Idle funds, 257. See also Excess funds; ratio, 255Impact analysis, 33, 46–57; after intervention, 52; baseline,
52; client-oriented, 49–52; continuous assessment and,52–53; definition of, 46; enterprise development ser-vices, 80; integrating qualitative versus quantitative, 56;kinds of, 47–48; methods of, 53; MFI impacts kinds of,48–49; paying for, 57; proxies for, 49; qualitative,53–54; qualitative versus quantitative, 56; quantitative,54–56; timing of, 52–53; unit choice in, 56–57
Incentives, financially viable lending and, 67; indirecttargeting and compatibility of, 35; staff productivityand, 249–50
India, Agricultural Credit Review Committee, 15;deposit collectors in, 156; Deposit Insurance andCredit Guarantee Corporation, 159; rural, economicimpact of finance on, 47; Self-Employed Women’sAssociation (SEWA), 75, 83
Indirect costs, savings products and, 166–67Indirect targeting, 34, 35Individuals, impact analysis and, 57, 58; loans to, 68,
69, 82, 83Indonesia. See also Bank Rakyat Indonesia, Badan
Kredit Kecamatan, 67; Bank Perkredital Rakyats,108; MFI regulation in, 25; reserve requirementsin, 158; Self Reliance Corporation, 108; UsahaBersamas, 108
Inflation, accounting for, 187, 197–99; in Albania, 28;asset revaluation, 198; calculating cost on equity,198–99; deposit ratios and, 71; donations for loanfund capital and, 197; interest rate risk and, 258;Islamic banking and, 42; MFIs and, 26–27; samplefinancial statement adjusted for, 202–3
Informal financial sector, 13, 104–6In-kind donations, 195–96Institutional capacity, creating formal financial institu-
tions and, 109; expanding, 18, 117–18; savingsmobilization and, 160–64
Institutions, analysis of, business planning and, 125–26;assessment of, management information systems and,178; attributes of good, 94; formal financial institu-tions, 97–101; importance of, 93–97; informalfinancial institutions, 104–6; maturity of, perfor-mance standards and, 206; partner institutions and,94–97; semiformal financial institutions, 101–4;types of, 97–106
Insurance, 74, 75Integrated approach, 64, 65–66Intensivity, impact analysis and, 54Inter-American Development Bank, 100, 227Interest expense, 240Interest income, 189, 240Interest rate risk, 255, 257–58Interest rates, calculating, 140–42; calculating effective,
143–48; declining balance calculation, 140–41;fees/service charges and, 142; flat method calculation,141–42; full-cost, 67; periodic, 148; savings products,167–68; setting MFI, 127; setting sustainable,149–50; sustainable, 139
Interest rate sensitivity, 258Internal controls, 163, 259Internal rate of return calculation, 146–47, 150–51International Accounting Standard 29, inflation and, 198International Development Bank, Multilateral Investment
Fund, 115
I N D E X 279
Internationale Projekt Consult GmbH (IPC), Germany,101
International Finance Corporation, 115Internet, microfinance information, 6Intrahousehould impact analysis, 57IPC Banking System, 181Islamic banking, 42Itinéraire de Formation-Diffusion (African replicators
training program), 83
Jamaica, Workers Bank of, 176Job creation, growth enterprises and, 44–45Joint liability groups, 67, 71, 77
Kenya, 27; Rural Enterprise Programme (K-REP), 40
Language, multiple-dialects and, 41, 174Late payments, 146, 148Latin America, ProFund, 115; solidarity group lending
in, 82, 84–85Ledgerwood, Joanna, 206n, 238n, 243nLending product design, 133–53; cash patterns, loan
terms, payment frequency and, 133–37; effectiveinterest rate calculation, 143–48; internal rate ofreturn calculation, 150–51; loan collateral, 137–38;loan pricing, 138–43; sustainable loan rate, 149–50;varying cash flows and, 152–53
Leverage, 223–24; debt, 113–14;Liquid accounts, 165; interest rates and, 167Liquidity, institutions and, 94; management of, 163–64;
requirements, 24; risk, 255–57; savings, 156Loan loss, accounting for, 188–92; financial statement
adjustments and, 187; loan loss provision and,190–91; loan loss reserve and, 190; portfolio reportand, 188–89; provisions, 139; rate, 149; ratio calcula-tions, 211–12; recording write-offs of, 191–92,210–11
Loan loss reserve, 189, 190; ratio, calculating, 211Loans. See also Credit, active, per credit officer, produc-
tivity and, 212–13; amounts of, cash patterns and,133–34; collateral for, 137–38; concessional, 195,196; cross-subsidization of, 143; donated capital for,196–97; fees/service charges and, 142; fixed asset,136–37; management information systems parame-ters and, 175; non-revenue-generating, 148; paymentfrequency of, 136; payment incentives for, 245; port-folio report and, 188–89; pricing of, 138–43; rapid
availability of, institutions and, 94; recovery rate,206; rescheduled/refinanced, 246–48; self-selectionand, 70; variable costs of, delinquent loans and, 244;variables of, internal rate of return and, 146–47; vari-ations in, performance standards and, 206; workingcapital, 136
Loan term, 134–36, 146; defaulted loans and, 189; port-folio quality calculations and, 210
Loan-tracking software, 172–78. See also Managementinformation systems; assessing, 173; ease-of-useand, 173–74; features of, 174–75; MFI in-housesystems of, 174; reports from, 175; security,175–76; software/hardware issues, 176–77; supportfor, 177–78
Local area networks, management information systemsand, 176–77
Lump sum payment, effective rate of interest and, 148,152–53
Madagascar, Savings Bank of (Caisse d’épargneMadagascar), 99; self-reliant village banking in, 86
Mali. See also Caisses Villageoises d’Epargne et de CréditAutogérées, Banque Nationale de DéveloppementAgricole (BNDA), 98; cattle owners’ enterprise devel-opment strategy, 79; Dogon village dialects, 41;Freedom From Hunger, 85
Management information systems, 169–83. See alsoLoan-tracking software; accounting systems, 171–72;accurate/timely, delinquency control and, 245; clientimpact tracking and, 178; commercial softwareoverview, 180–82; communication with systems per-sonnel and, 170; cost management and, 254; creat-ing formal financial institutions and, 109;credit/savings monitoring and, 172–78; delinquencymanagement and, 250–51; errors, delayed collectionsand, 148; evaluating, 122, 183; FAO MicrobankingSystem, 181; fraud control and, 259; informationneeds analysis and, 170; installing, 178–80; institu-tional capacity building and, 117; IPC BankingSystem, 181; issues overview, 170–71; lending meth-ods and, 175; multiple-dialects and, 174; RelianceCredit Union Management System, 181–82; savingsmobilization and, 163; setup options of, 174–75;SiBanque System, 182; Solace for Workgroups, 182;unrealistic expectations of, 170–71
Management Information Systems for MicroFinanceInstitutions, 227, 232
280 M I C R O F I N A N C E H A N D B O O K
Marketing, advice, growth enterprises and, 45; savingsmobilization and, 162
Market research, savings products and, 157Markets, estimating penetration of, 127; estimating size
of, 126; MFI operational review and, 120; size of,36–37
Mennonite Economic Development Association(MEDA), 107, 259, 260
Mexico, FINCA village banking, 77, 85; rotating savingsand credit associations in, 70; rural, formal sectorfinancial suppliers in, 14
MFIs (microfinance institutions), 1n, 12–17, 93–130.See also Institutions; characteristics of strong, 95; coststructure, sustainable loan rates and, 149; direct ver-sus indirect targeting for, 34–35; donors’ role in,16–17; effect on other MFI providers, 16; existingproviders, 14–16; financial NGOs as, 103–4; formalinstitutions, 12, 97–101; growth, donor-funded ver-sus deposit-based, 71–72; growth and transformationof, 106–17; informal intermediaries, 13, 104–6;information needs analysis, 170; institutional struc-ture of, 21; management oversight in, 30; minimalistversus integrated, 65–66; operational review tool,118–23; organizational/ownership structures of, 30;other microfinance providers and, 16; as politicaltool, 15; products and services, 63–91; risks in,30–31; savings products for, 164–66; semiformalinstitutions, 12–13, 101–4; target market objectives,33–34; voluntary savings mobilization conditions, 73;voluntary savings mobilization requirements, 73–74
MicroBanking Financial Review, 227Microenterprise types, MFI target markets and, 42–46;
business activity types and, 45–46; business develop-ment level and, 43–45; existing versus startup, 42–43
Microfinance, approaches to, 82–86; background, 2–3;caveat regarding, 7; contextual factors, 11–32; defini-tion of, 1–2; growth, reasons for, 3–4; industry size,3; risks of, 4, 22
“Micro Finance Institution Monitoring and AnalysisSystem,” BASE Kenya, 227
Microfinance institutions. See MFIsMicro Finance Network, contacting, 6Minimalist approach, 65–66Minimum capital requirements, 23; Bolivian private
financial funds, 25; Ghana, 26Mobile banking, 163Moral hazard, MFI lending and, 36
Mosley, Paul, 39Multilateral development banks, microfinance strategies,
18Multilateral Investment Fund, International Development
Bank, 115Mutual funds, socially responsible, 116
National Agricultural Bank, Mali, 73National Agricultural Credit Bank, Benin, 102National Credit Union Federation, 118National Development Bank, Sri Lanka, 114Near cash, 255–56Negros Women for Tomorrow Foundation, 208Nepal, self-help groups in, 105Networks, management information systems and,
176–77Nicaragua, Centro de Creditos y Capatacion Humanistica,
Integral y Sistematica para la Pequena y Microempres(CHISPA), 106, 107
Nonbank Financial Institutions Law, Ghana, 26Nongovernmental organizations (NGOs), microfinance,
2; bridging mechanisms with new formal financialinstitution of, 109–10; business, 64; local, villagebanks and, 77; as MFI owners, 112; as partner institu-tions, 96–97; regulatory standards and, 21; as semifor-mal financial institutions, 12; social services and, 81
Operating cost ratio, 214Operating costs, accounting for donations for, 195–96;
efficiency ratios and, 213–15; loan pricing and, 139;savings products and, 167
Operating risk management, 258–60Operational review tool, MFI, 118–23; computerization,
122; corporate governance, 119–20; credit methodol-ogy, 120–21; definition, 118; distribution, 121;financial management, 122–23; human resourcemanagement, 121–22; markets and clients, 120;using, 119
Operational self-sufficiency, 215, 217Organizational structure, savings mobilization and,
160–61; stability of, 94Ostry, Jonathan D., 167–68Otero, Maria, 49Outreach, depth, performance indicators and, 225–27;
diamond charts of depth of, 228; enterprise develop-ment services and, 80; evidence of, impact analysisand, 49; as MFI goal, 34; MFI target markets and, 39
I N D E X 281
Oversight, enhancing, 23; of MFI management, 29,30–31
Ownership, MFI, 30, 111–13; BAAC, Thailand, 161;responsibilities and duties of, 112; savings mobiliza-tion and, 160
PACT Publications, contacting, 6Paraguay, Fundacion Paraguaya de Cooperacion y
Desarrollo, 115Parallel operations, management information system,
180, 259Partner institutions, 94–97Partnerships, systems framework and, 64PEARLS performance rating system, 227, 231Peer pressure versus collateral, group lending and, 70, 137Performance, loan-collection, bad debt write-offs and,
191Performance indicators, 205–41; capital adequacy, 223,
224–25; depth of outreach indicators, 225–27;efficiency ratios, 212, 213–15; financial viability,215–20; leverage, 223–24; portfolio quality, 206–12;productivity ratios, 212–13; profitability ratios,220–23; scale indicators, 225–27; standards, varia-tions in, 227
Performance management, 243–62; delinquency,243–48; productivity/efficiency, 248–54; risk, 254–60
Performance standards, 18; enterprise development ser-vices and, 80; management information systems and,175; MFI range of, 206; ratings agency, PrivateSector Initiatives Corporation, 227; variations in, 227
Personal guarantees, 138Personal impacts, microfinance and, 48; MFI and,
48–49Peru, Accion Communitaria del, 100, 101; Caja
Municipales, 83; COFIDE (development bank), 101;COPEME, 108; Entidades de Desarrollo para laPequena y Microempresa, 108; MFI regulation in,25; savings banks in, 98
Philippines, MFI regulation in, 25; Project Dungganon,84, 208; reserve requirements in, 158; Tulay sa Pag-Unlad, Inc., 84, 99, 250, 251
Piprek, Gerda L., 219nPolicy, financial sector, deposit insurance, 158–60;
financial contracts enforcement, 19–20; governmentmandates for sectoral credit allocations, 19; interestrates, 18; legal enforcement and, 17–20; legal require-ments, 157–58; MFI advocacy in, 29–30; reform,
MFI donors and, 17; savings mobilization and,157–60
Political stability, 26, 27; unrest in Albania, 28Poor, bankable, 39; entrepreneurs, lending preferences
of, 67; financial services outreach to, 226; focus on,18; MFI planning and, 28; MFI target markets and,39, 43–44; savings by, 71
Population characteristics, MFI, 37–42; ethnicity, caste,and religion, 41–42; female clients, 37–39; geograph-ic focus, 40–41; poverty levels, 39
Portfolio analysis/projections, 126–27; defining marketin, 126; estimating market penetration in, 127; inter-est rate policies and, 127; projecting portfolio for,127
Portfolio at risk, 189; calculating, 210; ratio, 208; sam-ple portfolio with aging of, 209
Portfolio diversification, 24–25Portfolio outstanding, 189; average, per credit officer,
productivity and, 213; salaries/benefits to average,efficiency ratio and, 214
Portfolio quality, 206–12; arrears rate, 206–8; audits,operating risk management and, 260; boosting profitsby ensuring, 239–40; calculating sample portfolioquality ratios, 212; delinquent borrowers rate, 208;delinquent loan definition, 208, 210–11; portfolio atrisk ratio, 208; portfolio quality ratios, 207–12; rates ofversus repayment rates, 208; repayment rates, 206–7
Portfolio report, 188–89; sample of, 188, 235Postal savings banks, as MFIs, 98Prepayments, 135, 148Present value, internal rate of return and, 146–47Private development banks, 97–98, 99Private financial funds, Bolivia, 25Private Sector Initiatives Corporation, 227Private sector MFIs, 12, 17; effect on other suppliers, 16;
government-run microfinance programs and, 14–15Pro-Credito, Bolivia, 101PRODEM, Bolivia, group lending and, 84; impact
analysis of, 50; management information systems of,174; startup considerations of, 109
Productivity, active loans per credit officer and, 212–13;amount disbursed per period per credit officer and,213; average portfolio outstanding per credit officerand, 213; calculating ratios of, 213; enhancement,institutional capacity building and, 118; improvingstaff, 248–51; management, 248–54; ratios, perfor-mance standards and, 212–13
282 M I C R O F I N A N C E H A N D B O O K
Products and services, microfinance, 63–91; approachesto, 82–86; enterprise development services, 78–80;financial intermediation, 66–76; minimalist versusintegrated, 65–66; social intermediation, 76–78;social services, 80–81; systems framework, 64–65
Profitability ratios, 220–23; return on assets, 221–22;return on business, 222–23; return on equity, 223
Profit centers, branch/field offices as, 160–61, 252–54Profit margin, as component of return on assets ratio,
238; analysis, 220ProFund, Latin America, 115Project Dungganon, Philippines, 84, 208PROSEM, Guatemala, 85Public development banks, 97Public sector rural institutions, 12
Qualitative impact analysis, 53–54Quantitative impact analysis, 54–56, 58–59; economet-
rics, 55; experimental methods, 55; nonexperimentalmethods, 55; quasi-experimental methods, 55
Raiffeisen model, Germany, 2, 101Rapid rural appraisal, impact analysis and, 54Refinanced loans, 246–48Regression analysis, econometrics, 55, 58Regulation, financial sector, 20–26; approaches to,
22–23; considerations for MFIs, 23–25; countryapproaches to, 25–26; definition of, 20; excessive, 29;Finansol and, 22; MFIs, deposit mobilization and,21–23; MFIs, risk factors of, 22; MFIs and, 157
Reinhart, Carmen M., 167–68Reliance Credit Union Management System, 181–82Religion, microfinance and, 41, 42Repayment, delinquency control elements, 245; group
loans, Burkina Faso study of, 71; loan terms and,134–36; motivation for, 67; on-time versus late orno, 247; payment frequency and, 136; prepaymentsand, 135; rates, as performance indictor, 206–7; ratesversus portfolio quality rates, 208; upfront interestand, 151; women’s enterprises and, 38
Reporting, financial, accounting software and, 172, 175;Ghana format for, 26; improving standardized soft-ware formats for, 176
Rescheduled loans, 246–48Reseau des Caisses Populaires, Burkina Faso, 178Return on assets ratio, 220, 221–22Return on business ratio, 220, 222–23
Return on equity ratio, 220, 223; leverage and, 224Revenue, definition of, 215; delinquent loans and, 243Rhyne, Elizabeth, 49, 80Risk, accessing debt and, 113; asset/liability management
and, 255–58; covariance, 45; group loan repaymentand, 71; growth enterprises and, 44–45; loanamounts, cash patterns and, 133–34; management,quantitative impact assessment and, 58; MFI, issuingfinancial paper and, 115; of microfinance, 4, 22,30–31, 157; operating risk management and,258–60; owner, MFI viability and, 21; performancemanagement and, 254–60; shared, Islamic bankingand, 42
Robinson, Marguerite, 160nRockefeller Foundation, 115Rogaly, Ben, 48Rotating savings and credit associations (ROSCAs), 69,
70, 104; Nepal, 105Rural areas. See also Village banks, economic impact of
finance on, India, 47; financial services outreach to,226; as MFI target, 40–41; public sector institutionsserving, 12; village banking and, 85
Rural development banks, 97Russia Small Business Fund, 100
SAARI software, 174Sahel Action, Burkina Faso, 71, 84Salaries, efficiency ratios and, average credit officer, as
multiple of per capita GDP, 214; and benefits toaverage portfolio outstanding, 214; performancemanagement and, 252
Sampling, quantitative impact analysis and, 54–55São Tomé, self-reliant village banking in, 86Save the Children, 85, 116Savings, 71–74. See also Deposit; Rotating savings and
credit associations; capital leveraging and, 224; com-pulsory, 72–73, 105, 138; mobilization costs of,166–67; secure facilities for, 3, 156; village banks and,77; voluntary, 73–74; voluntary, legal requirementsfor, 157–58; funding the loan portfolio, 220
Savings and loan cooperatives, 101Savings banks, as MFIs, 98; depth of outreach diamonds
of, 228Savings products, 155–68; demand for, 156–57; enabling
environment for, 157–60; human resources and,161–62; infrastructure and, 163; institutional capacityfor, 160–64; licensing and, 157; liquidity manage-
I N D E X 283
ment and, 163–64; management information systemsand, 163; marketing of, 162; organizational structureand, 160–61; ownership/governance and, 160; pric-ing, 167–68; reserve requirements and, 157–58;security and internal controls of, 163; sequencingintroduction of, 164; tracking software for, 172; typesof, 164–66
Schmidt, Reinhardt, 93–106Screened mutual funds, 116Securitization, 116–17Security, management information systems, 175–76;
savings, 3, 156, 163Seed Capital Development Fund, 116SEEP (Small Enterprise Education and Promotion Net-
work), 77; financial ratio analysis guide, 227, 230;MFI business plan elaboration and, 123; MFI opera-tional review tool and, 118
Self-Employed Women’s Association (SEWA), India,75, 83
Self-help groups, 104; in Nepal, 105–6; Kenyan loanprogram for, 40; reduced loan transaction costs and,71; versus financial NGOs, 103
Self Reliance Corporation, Indonesia, 108Self-reliant village banks, 41, 73, 82, 85–86Self-sufficiency, 216–18; financial, 217–18; operational,
217; time-frame for reaching, 39Semiformal microfinance institutions, 12–13, 101–4;
credit unions, 101–3Semiliquid accounts, 165–66Senegal, Agence de Credit pour l’Enterprise Privée, 83;
Association de Crédit et d’Epargne pour laProduction (ACEP), 174
Service charges, loan, 142; effective interest rate calcula-tion and, 151
Servicredit, Nicaragua, 115Shared return funds, 116Sheldon, Tony, 169–82SiBanque System, 182Simulation modeling, interest rate risk and, 258Single purpose corporation, 116Small Enterprise Development Company, Ltd., Thailand,
108Small Enterprise Development Journal, 50Smart cards, 75, 76Social capital, 76Social intermediation, 63, 64, 76–78Socially responsible mutual funds, 116
Social services, 63, 65; access, client base and, 28–29Société d’Investissement et de Développement Inter-
national (SIDI), France, 115Sociopolitical impacts, MFI, 47–48Solace for Workgroups, 182South Africa, MFI regulation in, 25; rotating savings and
credit associations in, 70Southwest China Poverty Reduction Project, 89Spread, financial, 216; asset/liability management and,
254Sri Lanka, guarantee scheme in, 114St. Francis Xavier Workmen’s Circle and Savings Bank,
100Staff productivity, 248–51; average portfolio outstand-
ing, number of clients per credit officer and, 248–49;incentives schemes for, 249–50; management infor-mation systems and, 250–51
Staff turnover, fraud control and, 259Standardized systems/policies, costs and, 254; fraud con-
trol and, 259Startup microenterprises, 42, 43Stokvels (South African ROSCAs), 70Straight-line method, depreciation, 192Subsector, enterprise development services and, 88–89;
as unit choice in impact analysis, 57Subsidies, accounting for, 187, 195–97; calculating
dependence index of, 218–20, 221; credit, 15; insti-tutional independence from, 94; reducing/elim-inating factors, 220; sample financial statementadjusted for, 200–201; systems framework and, 64;targeted credit model of, 2, 34
Subsidy dependence index, 218–20Supervision, financial sector, 20–25; definition of,
20–21; MFIs and, 157Supervision, MFIs, 26; institutional responsibility for,
111Sustainability, credit and, 67; of interest rates, 139;
intermediation as separate from, 64; as MFI goal, 34Sustainable Banking with the Poor Project, 3, 39, 52Susus (West African ROSCAs), 70Swaziland, Kingdom of, Business Women’s Association,
direct advisory services of, 79; Swazi Business GrowthTrust, 76
Systems framework, microfinance, 64–65; enterprisedevelopment services, 64–65; financial intermedia-tion, 64; social intermediation, 64; social services,65
284 M I C R O F I N A N C E H A N D B O O K
Tandas (Mexican ROSCAs), 70Targeted credit model, subsidized, 2, 34Target markets, 33–61; cash flow and, 35; debt capacity
and, 36; direct versus indirect, 34–35; equity require-ments and, 36; identifying, 37–46; market size and,36–37; MFI objectives and, 33–34; microenterprisetypes and, 42–46; moral hazard and, 36; populationcharacteristics, 37–42
Technical Guide for the Analysis of MicroenterpriseFinance Institutions, 227
Terms, loan, 134–36, 146Thailand, Bank for Agriculture and Agricultural Co-
operatives, 72, 98, 159, 161; Catholic Relief Services,85; Freedom from Hunger, 85; reserve requirementsin, 158; Small Enterprise Development Company,Ltd., 108
Tontines (West African ROSCAs), 70Trademarks, savings product, 162Training, business skills, 79; centers for, 18; costs, group
loans and, 71; efficiency gains and, 248; managementinformation systems, 180; startup microenterprisesand, 43
Transaction costs, accessing debt and, 113; client, insti-tutions and, 94; group lending and, 70–71; socialintermediation and, 77
Transfer and remittance, fund, 75–76Transfer pricing, decentralized decisionmaking and,
253–54; savings mobilization and, 160–61Transition economies, 27Transparency, client honesty and, 51; Finansol and, 22;
operational risk management and, 258–59Trend analysis, 205Triodos (Holland), 101Tulay sa Pag-Unlad, Inc., Philippines, 84, 99, 250, 251
Unit choice in impact analysis, 56–57; client as client,56–57; client as individual, 57; enterprise as, 57;household economic portfolio as, 57; nonusers as, 56;subsector as, 57
Unit desa system, Bank Rakyat Indonesia, 16, 143United India Insurance Company, 75United Nations Development Fund for Women, 80Upfront interest payments, effective interest rate calcula-
tion and, 151Urban areas, as MFI target, 40U.S. Agency for International Development, enterprise
development service programs study, 79; Guatemalan
credit unions and, 118; PEARLS performance ratingsystem, 227
User fees, 29Usury laws, 21, 22
Venn diagrams, impact analysis and, 54Vietnam Women’s Union, 84Village banks, 82. See also Caisses Villageoises d’Epargne
et de Crédit Autogérées; Foundation for InternationalCommunity Assistance; Burkina Faso, 71, 86; indi-rect lending to, Mali, 98; joint social and financialintermediation by, 77; self-managed, 41, 73, 82,85–86
Village Savings and Credit Associations (VISACA), TheGambia, 86
Von Pischke, J.D., 35n, 226
Web sites, microfinance information, 6Weekly payments, effective interest rate calculation and,
151Weighted average cost of capital method, sustainable
interest rate and, 149–50West Africa, African replicators training program
(Itinéraire de Formation-Diffusion), 83; rotating sav-ings and credit associations in, 70; social intermedia-tion in, 78
West African Economic and Monetary Union, 19, 25,102
Women, enterprise development services and, 80; finan-cial services outreach to, 226; Grameen solidaritygroup lending and, 84; as stable survivors, 44; tradeunions of, in India, 75
Women’s enterprises, 37–39; cultural barriers for,37–38; responsibility in, 38; versus men’s, 38–39
Women’s World Banking, Colombia, 248Workers Bank of Jamaica, 176Working capital, growth enterprises and, 45; loans,
136World Bank, Agence de Financement des Initiatives de
Base and, 78; CGAP and, 19; guarantee scheme, SriLanka, 114; lending study, small and microenterpriseprojects, 34; Mexican economic/social sector study,14; MFI performance standards and, 227; repayment,women’s enterprises and, 38; savings mobilizationstudies, 71, 103; social services providers study, 81;social services providers study., 81; Southwest ChinaPoverty Reduction Project, 89
I N D E X 285
World Council of Credit Unions, 118, 227, 231World Relief, credit education and, 82“Worldwide Inventory of Microfinance Institutions,”
71, 103Write-offs, recording loan loss, 191–92; portfolio quality
ratios and, 210–11
Yaqub, Jacob, 51Yaron, Jacob, 195, 197, 218, 219n, 225Yield, 148; annualized effective, 149Yunus, Mohammed, 2
Zaire, enterprise development in, 88
286 M I C R O F I N A N C E H A N D B O O K