public or perish? from founding to initial public offering
TRANSCRIPT
Vol.:(0123456789)
Review of Managerial Science (2021) 15:1573–1610https://doi.org/10.1007/s11846-020-00390-4
1 3
ORIGINAL PAPER
Public or perish? From founding to initial public offering
Yuji Honjo1
Received: 17 April 2019 / Accepted: 5 April 2020 / Published online: 20 April 2020 © The Author(s) 2020
AbstractWe examine the factors affecting the time to initial public offering (IPO), using a sample of more than 10,000 start-up firms in Japan. We provide evidence that start-up firms engaging in innovative and uncertain businesses are more likely to go pub-lic earlier than other firms. The results also reveal that start-up firms that rely on equity financing at founding are more likely to go public earlier than others. Moreo-ver, we find that start-up firms in highly valued industries are more likely to go pub-lic earlier than in other industries and that the likelihood of an IPO among start-up firms depends on market conditions.
Keywords Initial public offering · Start-up · Survival analysis
JEL Classification G30 · L26 · M13 · O32
1 Introduction
An initial public offering (IPO) is not a stage that all firms eventually reach, but it is a critical stage in the growth process. While some entrepreneurs pursue the possibil-ity of access to public equity markets through an IPO, most firms remain privately held. Essentially, it is not easy for start-up firms to go public within a short period of time. Nevertheless, high-tech start-ups with uncertain businesses—for example, bio-technology start-ups for drug discovery—often seek access to public equity markets through an IPO, despite their lack of business history and track record. Such firms require massive research and development (R&D) expenditures and often demand funds for R&D projects. Going public within a short period allows high-tech start-ups to secure funds for R&D projects. Although IPO firms (publicly listed firms) represent only a small proportion of the entire population of start-up firms, they are
* Yuji Honjo [email protected]
1 Faculty of Commerce, Chuo University, 742-1 Higashinakano, Hachioji, Tokyo 192-0393, Japan
1574 Y. Honjo
1 3
expected to promote economic growth because of their growth potential. Some IPO firms indeed achieve rapid growth by accessing public equity markets.
It has often been argued in the literature that start-up firms play a significant role in economic growth (e.g., Audretsch 1995; Audretsch and Acs 2003). The emer-gence of start-up firms that achieve rapid growth—sometimes called “gazelles”—has been the focus of much public policy discussion because such firms are essential contributors to future economic growth (e.g., Henrekson and Johansson 2010; Koski and Pajarinen 2013). Not surprisingly, young IPO firms outperform others by a wide margin, and they are expected to boost economic growth through innovation and job creation. These firms can also provide early-stage shareholders with high capital gains by going public, which often attracts venture capitalists, despite the high risks involved. Thus, the creation of young IPO firms has become one of the most critical issues, especially in stagnating developed economies. Nevertheless, little attention has been paid to which start-up firms achieve IPOs sooner. Whereas an IPO is well-known as a typical sellout strategy for early-stage shareholders, the determinants of an IPO among start-up firms have not been entirely clear in the literature.
This study explores the IPOs of start-up firms. We examine the factors affect-ing the time to IPO, using a sample of more than 10,000 start-up firms (joint-stock companies) in Japan. Specifically, we examine whether start-up firms that engage in innovative and uncertain businesses, which are measured by R&D expenditures and capital flexibility, are more likely to go public earlier than other firms. We provide evidence that the time to IPO depends on the type of start-ups at the time of found-ing (incorporating) and that start-up firms engaging in innovative and uncertain businesses are more likely to go public earlier than other firms, suggesting that such uncertainty may result in hasty IPOs. The results also reveal that start-up firms that rely on equity financing at founding are more likely to go public earlier than others. We provide rigorous evidence on the effect of initial capital structure on the time to IPO while considering competing risks, such as firm exits due to business failure.1 Moreover, we find that start-up firms in highly valued industries are more likely to go public earlier than in other industries and that the likelihood of an IPO among start-up firms depends on market conditions.
This study contributes to providing evidence on whether start-up firms that engage in innovative and uncertain businesses tend to access public equity markets. Some studies have emphasized the importance of equity financing for R&D invest-ment (e.g., Carpenter and Petersen 2002a; Hall 2002; Colombo and Grilli 2007). Innovative and risky start-ups, which are devoted to innovative and uncertain pro-jects, tend to face difficulties in raising debt financing because banks are reluctant to provide funds to such firms. Several countries, including some European countries and Japan, have introduced “junior stock markets” (also called “second-tier stock markets” or “new stock markets”) since the mid and late 1990s, in order to provide
1 While “exit” has often been used to a shareholder’s sellout in the literature on corporate finance, it has traditionally indicated a firm’s exit from the market in the literature on industrial organization (e.g., Harhoff et al. 1998). In this study, we use “firm exit” or “exit” as the latter; hence, IPO is not included in firm exit.
1575
1 3
Public or perish? From founding to initial public offering
equity financing for young and innovative firms with growth potential. Indeed, IPOs in these markets have accounted for a large portion of IPOs during recent years. Nevertheless, little is known about whether the introduction of junior stock markets helps innovative start-ups conduct early IPOs. The findings of this study suggest that innovative and risky start-ups tend to go public within a short period of time, which would support the view that junior stock markets play a role in providing equity capital to these start-ups. Moreover, we examine the time from the founding of firms to their IPOs, while little attention has been paid in the literature to the IPOs of start-up firms (e.g., Pagano et al. 1998; De Jong et al. 2012). By doing so, we provide new insights into the determinants of IPOs, such as capital structure and firm size, from the perspective of the firm’s growth cycle. We present different results for their determinants from previous studies and emphasize the importance of path depend-ence of capital structure. Furthermore, we pay attention to firm exits due to business failure, other than IPOs, because innovative and risky start-ups have a higher prob-ability of bankruptcy. This study provides evidence that risky start-ups, measured by capital flexibility, are more likely to fail within a short period. Our findings suggest that such firms are more likely to not only go public sooner but also disappear, that is, “public or perish.”
The remainder of this paper is organized as follows. The following section intro-duces the research background, including the literature review. In the third section, we discuss the hypothesis development on the determinants of IPOs. The fourth and fifth sections explain the method and data used, respectively. The sixth section pre-sents the estimation results. Finally, we present some concluding remarks.
2 Literature review and research background
2.1 Financing of innovative and uncertain businesses
Innovation produced by start-up firms affects the existing sources of market power by spurring the “gale of creative destruction,” as described by Joseph Schumpeter (Gans et al. 2002: p. 571). According to the replacement effect, young and innova-tive firms, especially high-tech start-ups, have a stronger incentive for innovation than existing firms. Such firms play a pivotal role in promoting innovation as a vehi-cle for transferring and capitalizing knowledge (Audretsch et al. 2008; Colombo et al. 2016; Block et al. 2018). To promote the emergence of young and innovative firms with growth potential, policymakers have focused on how these firms secure financing for risky R&D projects.
Not surprisingly, start-up firms do not always obtain the required funds at found-ing, even if they require investment to maintain their businesses. These firms some-times encounter financial constraints. Generally, external suppliers of capital, such as banks, have less information about firms’ projects unlike the firms themselves, and such information is costly to obtain (Binks et al. 1992; Binks and Ennew 1996). In particular, uncertainty and information asymmetries between entrepreneurs and external suppliers of capital are more severe for start-up firms due to their lack of operating history and track record (Honjo et al. 2014). Such uncertainty and
1576 Y. Honjo
1 3
information asymmetries prevent start-up firms from obtaining bank loans because the cost of capital increases with information asymmetries, in addition to the uncer-tainty in business prospects. Start-up firms are more likely to encounter costs arising from uncertainty and information asymmetries.
Among start-up firms, high-tech start-ups are more likely to require exter-nal financing for massive R&D expenditures. However, information asymmetries between high-tech start-ups and external suppliers of capital, such as banks, become more severe. Indeed, banks hesitate to provide additional funds to high-tech start-ups because debt financing increases the probability of bankruptcy. Previous studies have emphasized that moral hazard and adverse selection problems due to informa-tion asymmetries hinder the external financing of highly risky businesses, including high-tech start-ups (e.g., Arrow 1962; Himmelberg and Petersen 1994; Carpenter and Petersen 2002a). Banks are reluctant to lend money to high-tech start-ups, pri-marily because of the difficulty involved in evaluating new businesses and technolo-gies. The returns of R&D projects are highly uncertain, and their quality is difficult to evaluate (Müller and Zimmermann 2009). R&D investment has a higher probabil-ity of becoming a sunk cost, and such firms have few tangible assets to provide suf-ficient collateral (Kamien and Schwartz 1978; Carpenter and Petersen 2002b; Hall 2002). Start-up firms that engage in R&D projects are more likely to face higher costs arising from uncertainty and information asymmetries due to the difficulty involved in evaluating new businesses and technologies (Honjo et al. 2014). These firms may encounter financial constraints for R&D investment because they have not accumulated profits or steady cash flow from their R&D projects (Czarnitzki and Hottenrott 2011). R&D investment is considered a firm risk due to the uncertainty inherent in such explorative investment (Arrfelt et al. 2018).
Some studies have argued that new equity has many advantages over debt for financing high-tech investment (e.g., Carpenter and Petersen 2002a; Hall 2002; Colombo and Grilli 2007). As discussed above, innovative and risky start-ups tend to face difficulties in raising debt financing, such as bank loans, even though they require capital to continue their projects. Since many high-tech start-ups do not generate cash flow within a short period of time, debt-financing interest payments often become a burden on them. To continue their projects, including R&D, high-tech start-ups are more likely to rely on equity financing, rather than debt financing. Moreover, early-stage shareholders, including entrepreneurs, have an incentive to go public, which could secure them the opportunity to sell their highly risky shares. Furthermore, for high-tech start-ups, an IPO is often a means to pursue investment and acquire participation in other firms (Vismara 2014). It is conceivable that start-up firms devoted to innovative and uncertain projects tend to seek access to public equity markets.
2.2 Decision to go public
An IPO has been considered simply as a stage in the growth process, but the deci-sion to go public is essentially more complex (Pagano et al. 1998). Previous stud-ies have emphasized the benefits of going public: diversification, the possibility of
1577
1 3
Public or perish? From founding to initial public offering
equity financing beyond the initial entrepreneurs’ limited wealth, less costly access to the capital market, increased liquidity of the firms’ share, some outside monitor-ing, enhanced company image and publicity, motivating management and employ-ees, and cashing in (Zingales 1995; Röell 1996; Pagano et al. 1998). Ritter and Welch (2002) also reviewed the theories and evidence on IPO activity, and identi-fied the life cycle and market-timing theories in the decision to go public. From the viewpoint of the firms, the decision to go public eventually depends on the trade-off between their benefits and costs of going public; that is, firms have an incentive to go public if the expected net benefits from it are larger than the expected net ben-efits from remaining private.2 The benefits of going public may increase with the demand for investment. The opportunity to access public equity markets is particu-larly appealing for firms with investment opportunities (Pagano et al. 1998). Such firms expect to mitigate financial constraints by acquiring access to equity markets.
While there are many arguments for going public, some empirical studies directly estimate the determinants of IPOs. Previous studies found from the data on Euro-pean and US firms that firm characteristics, such as firm size and age, affect the decision to go public (e.g., Pagano et al. 1998; Chemmanur et al. 2010; Aslan and Kumar 2011; De Jong et al. 2012; Cattaneo et al. 2015).3 However, although Ritter and Welch (2002) emphasized the viewpoint on the life cycle of firms, few studies have focused on IPOs in the growth process of firms. Even though previous studies have provided some evidence on the determinants of IPOs, their results may be due to survivor bias. Specifically, firms that are privately held for a long period of time are always included in the sample, while young and small firms tend to be excluded because these firms are more likely to disappear due to bankruptcy or liquidation during the start-up stage. Thus, we should pay more attention to the competing events prior to an IPO, especially when investigating the IPOs of start-up firms. Moreover, for example, if a positive effect of firm size on the likelihood of an IPO is found in the analysis, the results may be due to causality problems because firms enlarge their sizes to adopt listing requirements to access public equity markets. Accordingly, the majority of these problems in previous studies come from samples regardless of firm age, in addition to the ignorance of the time from founding to going public.
Much attention should be paid to the IPO decision of younger firms, rather than older ones, from the perspective of fostering start-up firms with growth potential. It is conceivable that an IPO is closely related to firm age from the perspective of the financial growth cycle of firms (Berger and Udell 1998). Despite the importance of young IPO firms in boosting economic growth, few studies have examined the IPOs of start-up firms. In addition, according to the perspective of path depend-ence in financing, initial conditions may continuously dominate post-entry behavior,
2 Going public entails additional costs, such as registration, underwriting, underpricing, and annual dis-closure costs. Pagano et al. (1998) identified adverse selection, administrative expenses and fees, and loss of confidentiality as the costs of going public.3 Moreover, Brau and Fawcett (2006) examined motivations for conducting IPOs using an original ques-tionnaire survey in the United States. Bodnaruk et al. (2008) examined shareholders’ diversification and the decision to go public using data on IPOs in Sweden.
1578 Y. Honjo
1 3
although their effects diminish over time. To the best of our knowledge, few stud-ies have examined the impact of initial conditions on the likelihood of an IPO. By focusing on start-up firms, we provide more conclusive evidence on the determi-nants of IPOs, in addition to new insights into the role of initial financial conditions in the IPO process. Such research enables us to elucidate the IPO decision in the growth process, which may also mitigate the problems associated with survivor bias and causality.
Meanwhile, IPOs become less attractive for start-up firms with growth potential. The number of IPOs in the United States—especially small-firm IPOs—decreased after 2000. While excessive regulatory costs, triggered by the Sarbanes-Oxley Act of 2002, may cause the low IPO volume, Gao et al. (2013) emphasized that small firms sell themselves out in a trade sale rather than to go public and remain independ-ent, as these firms realize economies of scale and rapid product expansion through merger and acquisition (M&A). Traditionally, M&A (or trade sale) is considered an alternative to an IPO, and both IPO and M&A are considered strategic sellouts (trade sales) of early-stage shareholders, including venture capitalists in the litera-ture (e.g., Brau et al. 2003; Giot and Schwienbacher 2007; Poulsen and Stegemoller 2008). The benefits and costs of growing as an independent firm, compared to those of trade sales, are an important determinant of the decision to go public (Bayar and Chemmanur 2011; Signori and Vismara 2018). Thus, IPOs may become less attrac-tive for some start-up firms with growth potential, despite the importance of equity financing for these firms.
2.3 IPOs in junior stock markets
Since the mid and late 1990s, some countries, such as Canada, European countries, and Japan, have introduced new stock markets (junior stock markets) following the National Association of Securities Dealers Automated Quotation (NASDAQ) in the United States, to provide equity financing for young firms with growth potential. To allow small and high-tech firms to go public without the burden of excessive regulations, stock exchanges have launched secondary and unregulated markets in Europe (Vismara et al. 2012). For instance, Alternative Investment Market (AIM) (United Kingdom; UK), Neuer Markt (Germany), Nouveau Marché (France), and Nuovo Mercato (Italy) have been launched since the mid and late 1990s. As the list-ing requirements in established stock exchanges are more stringent for young and small firms, these stock markets are designed to meet the needs of the firms (Ritter et al. 2013).
Junior stock markets were expected to provide equity financing opportunities for young IPO firms that achieve rapid growth, which would play a vital role in the revi-talization and development of industries. Because of less stringent listing require-ments, IPOs in these markets have accounted for a large portion of IPOs during the period 1995–2009 in the four largest European economies: France, Germany, Italy, and the UK (Vismara et al. 2012). However, despite the expectation of an increase in the number of IPOs, the number of IPOs decreased in and after 2008 in European countries (Vismara et al. 2012; Ritter et al. 2013; Akyol et al. 2014). This is due to
1579
1 3
Public or perish? From founding to initial public offering
the sluggish IPO markets affected by economic conditions. More importantly, firms’ propensity to go public may be changed. Gao et al. (2013) suggested that small firms lose benefits from going public and conversely seek strategic sellouts through the M&A alternative to IPOs using data on IPOs in the United States. Small firms may not rely exclusively on organic growth to expand.
It is of interest to highlight IPOs after the reform of stock exchanges in the mid and late 1990s, which would further advance the study of the promotion of young and innovative firms. Indeed, several studies have examined IPO and post-IPO performance, including the impact of regulations (listing requirements) of stock exchanges (e.g., Gerakos et al. 2013; Akyol et al. 2014). It is found that tighten-ing regulations improve IPO survival, while easing of regulations tends to harm it (Cattaneo et al. 2015). However, although much attention has been paid to the IPOs of young and innovative firms, there is little evidence on how these firms secure equity financing through the creation of junior stock markets. How young and inno-vative firms conduct IPOs in the growth process remain an open question. Moreover, although an IPO seems to be less important as a strategic sellout in some countries, such as the United States, young and innovative firms may still seek external financ-ing through an IPO in other countries. It is noteworthy to examine the IPOs of young and innovative firms in countries where IPOs are common as a strategic sellout.
2.4 IPOs in Japan
There have been fewer listings in Japan than in other countries, such as the United States. One reason for this is that listing requirements for young firms were much more strictly enforced in Japan (Matsuda et al. 1994).
Similar to the reform of stock exchanges in European countries, a trend toward the creation of new stock markets for innovative firms has been observed in Japan since the mid and late 1990s. In Japan, a special-rule issues market of the over-the-counter (OTC) market was opened in July 1995 to enable young and small firms investing heavily in R&D to list their stocks, even though they ran deficits.4 Then, the Market of High-Growth and Emerging Stocks (MOTHERS) was opened on the Tokyo Stock Exchange (TSE) in November 1999 to target young and small firms with growth potential at an early stage of their development. Until the early 2000s, the stock markets of Ambitious, Centrex, Hercules, and Q-board were founded on established stock exchanges in Sapporo, Nagoya, Osaka, and Fukuoka, respectively. In addition, the OTC market in Japan was renamed “JASDAQ” after NASDAQ, and it was reorganized as a general stock exchange. In reality, JASDAQ and MOTH-ERS are major junior stock markets in Japan. While some European stock markets, such as Neuer Market (Germany) and Nouveau Marché (France), disappeared or merged in the 2000s, the Japanese stock markets, such as JASDAQ and MOTH-ERS, still exist (until 2019). Since a certain portion of firms listed on JASDAQ and
4 However, only three firms were listed in this market, which was closed and absorbed into the original OTC market in December 1998.
1580 Y. Honjo
1 3
MOTHERS have been transferred to the main markets, such as the TSE, junior stock markets in Japan play a role of “feeder” (Granier et al. 2019).
Less stringent listing requirements in stock markets enable young and small firms to go public (Takahashi and Yamada 2015). The number of IPOs in junior stock markets is higher than in established stock exchanges in Japan: for example, 155 IPOs in junior stock markets and 33 IPOs in established stock exchanges in 2006, according to Kabusihi Kokai Hakusho (White Paper on Initial Public Offerings). However, the number of IPOs in junior stock markets decreased from 89 in 2007 to 42 in 2008, and it was the lowest with 13 in 2009.5 This trend in the Japanese stock markets is similar to that in the European stock markets discussed in Sect. 2.3.
Although junior stock markets for young and small firms have been introduced, Japan, as well as Germany, is traditionally considered as having a bank-centered capital market, in contrast to the United States, from a conventional perspective (Black and Gilson 1998). In Japan, the debt financing system, including bank loans, is well established and plays a critical role in providing funds to small businesses. Meanwhile, venture capital (VC) and business angel financing are advocated as important sources of financing for young and innovative firms (Block et al. 2018). However, Japan has the lowest level of investment by individuals in new businesses, and private equity financing from individual investors is limited (Honjo 2015). In addition, VC firms in Japan tend to invest in the early stages, and bridge financ-ing is not easily available (Honjo and Nagaoka 2018). These notions suggest that Japan’s private equity financial system is underdeveloped. In such countries, young and innovative firms may seek to acquire equity financing by accessing public equity markets, instead of private equity capital.
More importantly, in Japan, an IPO appears to be virtually established as the most successful sellout (exit) strategy for early-stage shareholders, including venture capi-talists. One reason is that M&A (trade sale) is less common as a strategic sellout in Japan than in other countries, such as the United States and European countries.6 Because of the less common M&A and poor private equity financing system, some start-up firms seek IPOs to secure equity financing. In particular, start-up firms that require the external financing of innovative and uncertain businesses may seek access to public equity markets because of underdeveloped private equity capital in bank-centered financial systems, such as Japan. This also indicates that start-up firms that require equity financing must rely on public equity markets to secure
6 According to Venture Enterprise Center (2015), the number of IPOs (116) among VC exits in Japan is higher than that of M&A (36) in the 2014 fiscal year. In contrast, the number of IPOs in European coun-tries and the United States is much lower than that of M&A in 2014. Meanwhile, according to the Small and Medium Enterprise Agency (2009: p. 147), a large percentage of VC firms recovered investments through IPOs and selling back stock to company managers, but only 3.4% said that they had recovered investments through “selling to a third party.” According to the Venture Capital Firms Supply Condi-tions Survey carried out by Tokyo Shoko Research, Ltd., the reasons why investment recovery is biased toward IPOs are that VC firms said that they “cannot make an adequate profit from any investment recov-ery methods other than IPOs,” “M&A markets are not well enough established,” and they have “a lack of experience in recovering venture capital.”
5 These numbers are counted, based on IPOs irrespective of firm age; therefore, they are much higher than IPOs in our sample.
1581
1 3
Public or perish? From founding to initial public offering
external financing, while those without innovative and uncertain businesses can rely on bank loans. For start-up firms with innovative and uncertain businesses, includ-ing their early-stage shareholders, junior stock markets are imperative to secure external financing, especially for R&D investment. Research on the determinants of an IPO in Japan will provide valuable insights into whether junior stock markets play a role in providing funds to young and innovative firms in countries depending heavily on bank financing.7
3 Hypotheses development
3.1 Innovative and uncertain businesses
As equity financing is not equivalent to debt financing, the likelihood of an IPO depends more on the demand for equity financing. The difference between debt and equity financing influences the decision to go public. We consider that the benefits and costs of going public are heterogeneous across firms and depend on firm-spe-cific characteristics.
According to arguments in the literature, information asymmetries between start-up firms and external suppliers of capital—specifically, high-tech start-ups and banks—in addition to the existence of uncertainties, prevent start-up firms from raising debt financing (e.g., Czarnitzki and Hottenrott 2011). While high-tech start-ups often require massive R&D investment, banks are reluctant to lend them money, primarily because it is difficult to evaluate their businesses and technologies. As dis-cussed, equity financing has advantages over debt financing for high-tech investment (Carpenter and Petersen 2002a; Hall 2002; Colombo and Grilli 2007). It is conceiv-able that start-up firms that engage in innovative and uncertain businesses have an incentive to go public early to secure equity financing for a large amount of invest-ment, including R&D. These firms require early access to public equity markets to continue their projects, partly because bridge financing is underdeveloped in Japan (Honjo and Nagaoka 2018). Moreover, early-stage shareholders may pursue IPOs to sell their highly risky shares. Thus, we consider the following hypothesis:
H1 Start-up firms that engage in innovative and uncertain businesses are more likely to go public earlier than others
However, going public has the disadvantage of releasing confidential information to competitors that can then compete more effectively with the firms going public (Chemmanur et al. 2010). In particular, firms in high-tech sectors may have less incentive to go public due to the loss of confidentiality (Pagano et al. 1998). These firms are reluctant to reveal detailed information about projects, as required by out-side lenders, fearing disclosure to potential rivals (Campbell 1979; Yosha 1995).
7 For more studies on IPOs in Japan, see, for example, Honjo (2001), Honjo and Kutsuna (2010), Yam-ada (2013), Takahashi and Yamada (2015), and Takahashi (2018).
1582 Y. Honjo
1 3
This study examines whether start-up firms that engage in innovative businesses have more incentive to go public, which would provide evidence on the validity of the loss of confidentiality.
3.2 Initial capital structure
Previous studies have argued the importance of an IPO alternative to financing. Access to new finance is one of the most important reasons for going public (Röell 1996). Firms can mitigate the debt overhang and other agency problems in future by reducing debt financing and strengthening equity financing. Gaining access to an alternative source of finance to banks provides benefits to firms, enabling the firms to rebalance their accounts (Pagano et al. 1998). Entrepreneurs expect to reduce bor-rowing costs by creating new access to finance, which will lead to higher valuation of firms by gaining more profits. A firm’s portfolio choice of borrowing sources cir-cumscribes the power of banks (Rajan 1992). By gaining access to public equity markets and disseminating information to general investors, firms elicit outside competition to their lenders and ensure a lower cost of credit (Rajan 1992; Pagano et al. 1998). Therefore, start-up firms that rely heavily on debt financing have a greater incentive to rebalance their capital structures by going public. Highly lever-aged firms seek to go public to reduce financing costs. These firms may mitigate borrowing constraints through IPOs to obtain a stronger bargaining position against banks owing to the availability of an alternative source of funds. In practice, some empirical studies found that leverage is positively associated with the decision to go public (Aslan and Kumar 2011; De Jong et al. 2012). Thus, we consider the follow-ing hypothesis, namely, “rebalance hypothesis.”
H2a Start-up firms that rely heavily on debt financing are more likely to go public earlier than others
However, although Pagano et al. (1998) argued that firms need to obtain a stronger bargaining position against banks, they found no significant effects of lever-age, bank rate, and concentration borrowing on the likelihood of an IPO. In fact, few studies attempt to explain why firms that can rely on debt financing require access to public equity markets. If firms maintain debt financing through good relationships with banks, they have less incentive to rebalance their capital structures by access-ing public equity markets. Firms that rely heavily on bank loans as initial funding may expect benefits from debt financing. Such firms hope to maintain good relation-ship with banks because relationship lending helps attenuate the asymmetric infor-mation problems (Petersen and Rajan 1994; Berger and Udell 1995). Conversely, banks are reluctant to lend money to firms that they do not have strong relation-ships with. Rather, firms that cannot rely on bank loans as initial funding may prefer equity financing to debt financing.
According to the resource-based view, the entrepreneurial process depends on the sources the entrepreneurs acquire and develop, and new business outcome is to a large extent determined by the nature of the sources the entrepreneurs can acquire
1583
1 3
Public or perish? From founding to initial public offering
(Aspelunda et al. 2005). In this context, initial financial conditions represent entre-preneurs’ capacity about how entrepreneurs can raise funds at founding. Some stud-ies have emphasized the importance of initial conditions in the literature on entre-preneurship and small business (e.g., Cooper et al. 1994). It is plausible that initial financial conditions play a key role in the IPO decision. A firm’s access to funding sources prior to an IPO influences the decision to go public. Rather, initial financial conditions may determine the future sources of financing—the path of the firm’s growth process.
Bhamra et al. (2010) emphasized the path dependence of capital structure. Given the existence of path dependence in the firm’s financing, it is conceivable that ini-tial funding—specifically, debt or equity financing—predicts financing strategies, including IPOs. According to the path dependence of capital structure, start-up firms that rely on equity financing at founding have more incentives to access public equity markets in their growth process. It is plausible that these firms expect the benefits of going public. The shareholders of these firms may have stronger con-trol rights than creditors (banks) and an incentive to go public due to benefits from the liquidity of shares, such as high capital gains, in addition to better reputation through an IPO by disseminating information to general investors. Eventually, such firms seek IPOs; thus, we consider the opposite hypothesis to H2a, namely “path dependence hypothesis,” as follows:
H2b Start-up firms that rely heavily on equity financing are more likely to go pub-lic earlier than others
Little is known about the impact of initial financial conditions on the IPO deci-sion in the growth process of firms. We examine the effect of initial capital structure on the likelihood of an IPO to test if the financing of start-up firms follows the rebal-ance hypothesis or the path dependence hypothesis.
Additionally, Holmström and Tirole (1993) focused on short- and long-term incentives and showed that the fraction of firms going public increases with the amount of long-term capital. Following their model, long-term financing, rather than debt financing, may have a stronger impact on the likelihood of an IPO. This study also examines whether start-up firms that rely heavily on long-term capital are more likely to go public earlier than others, using more detailed account items about equity capital as covariates.
3.3 Growth opportunities and market timing
Essentially, the IPO decision depends on the benefit of going public, which may be significantly associated with future growth opportunities. Start-up firms with growth opportunities presumably demand funds for investment, although they may encounter financial constraints due to a large amount of investment. There-fore, start-up firms with growth opportunities are more likely to go public earlier than others, in order to secure alternative sources of finance. Meanwhile, some scholars posit that managers strategically determine IPOs to take advantage of
1584 Y. Honjo
1 3
“window of opportunity” in stock markets that allow higher offer price (e.g., Pagano et al. 1998; Aslan and Kumar 2011). The window of opportunity is par-ticularly appealing for shareholders, including entrepreneurs, who seek large capital gains through an IPO. For these reasons, it is conceivable that growth opportunities have a significant impact on the likelihood of an IPO; thus, we test the following hypothesis:
H3 Start-up firms with growth opportunities are more likely to go public earlier than others
Furthermore, the likelihood of an IPO also depends on stock market conditions. The literature on corporate finance has argued that the IPO market exhibits dra-matic swings in issuance, which are often referred to as hot and cold markets (e.g., Ibbotson and Jaffe 1975; Ritter 1984; Helwege and Liang 2004). It is also found that the likelihood of an IPO is positively affected by the stock market valuation of firms (e.g., Pagano et al. 1998; Signori and Vismara 2018). Firm are more likely to go public when equity valuations are high, and they may employ private financing when values are lower (Lerner 1994). Based on these arguments, we test the follow-ing hypothesis:
H4 Start-up firms are more likely to go public when market conditions are more favorable
IPOs should be compared with their counterparts by controlling for firm hetero-geneity and different conditions. As described in the following section, when testing the above hypotheses, we control for some factors, such as capital expenditures and initial firm size.
4 Methods
4.1 Survival analysis
A firm having experienced an IPO once does not need to conduct an IPO. In addi-tion, the time to an event—IPO in this study—is not always observed for all firms in the observation window. Therefore, the time to IPO can be regarded as duration data, and right censoring is the most common in the analysis. In this case, a sur-vival analysis framework is better for estimating the determinants of the time to IPO. Using this framework, we investigate the IPO process while tracing the his-tory of firms from founding. It is important to note that the literature on the post-entry performance of firms measures time by firm age (e.g., Mata and Portugal 1994; Audretsch and Mahmood 1995; Mata et al. 1995). We employ two methods: the cumulative hazard function (non-parametric approach) and the proportional haz-ards and competing-risks regressions (semi-parametric approach). We describe the
1585
1 3
Public or perish? From founding to initial public offering
cumulative hazard function using the method proposed by Nelson (1972) and Aalen (1978).8
Let Ti denote the time from founding to IPO for firm i ; that is, Ti indicates how long it takes for firm i to conduct an IPO after founding. Let Ci denote the censor-ing time, which is the duration of the observation window for firm i , and the time to IPO, Ti , is observed if Ti ≤ Ci . Suppose that the time to IPO is observed for n firms in the sample and T1 ≤ T2 ≤ ⋯ ≤ Tn . In this case, the cumulative hazard function proposed by Nelson (1972) and Aalen (1978) is given by
where dj is the number of firms that experience the event at time Tj, and nj is the number of firms that have not yet conducted an IPO at that time. Following Eq. (1), we obtain the cumulative hazard estimates of IPOs.
4.2 Proportional hazards and competing risks regressions
To show the factors affecting the time to IPO, we employ a proportional hazards regression proposed by Cox (1972). In general, the hazard (function), hi(t) , is defined as follows:
In the proportional hazards regression, the hazard is assumed to be written by
where xi is the vector of the covariates affecting the IPO; � is the vector of estimated parameters (coefficients); and h0(t) is the baseline hazard. To estimate � and the haz-ard ratio, we specify the following likelihood function, L:
where Rj is a risk set at Tj and firm k satisfies the condition that Tj < Tk.However, the estimation has an issue. Some IPOs cannot be observed when firms
are forced out of business before going public. The presence of a competing event may impede the event of interest, which is an IPO in this analysis. To take into
(1)H(t) =
n∑
j|Tj<t
dj
nj.
(2)hi(t) = limΔt→0
Pr(t < Ti ≤ t + Δt|Ti > t
)
Δt.
(3)hi(t;x) = h0(t)exp(x�
i�),
(4)L =
n�
j=1
h0(t) exp�x�
j�
�
∑k∈Rj
h0(t) exp�x�
k�� =
n�
j=1
exp�x�
j�
�
∑k∈Rj
exp�x�
k�� ,
8 In this study, we capture the time from founding to IPO, which is similar to the method used in Honjo and Nagaoka (2018). We also employ the cumulative hazard function and the competing risks regression, following previous studies (e.g., Honjo and Kato 2019). Giot and Schwienbacher (2007) examined the time to IPO, trade sale, and liquidation from the viewpoint of venture capitalists, using the competing risks regression.
1586 Y. Honjo
1 3
account the different types of events other than an IPO, we employ a competing risks regression. Specifically, the competing events prior to the IPO, such as firm exits due to business failure, tend to occur during the start-up period. Consider-ing the competing events prior to the IPO will significantly improve the estimation method for the decision to go public.
More precisely, Ti is observable if a firm goes public up to the censoring time, Ci , and the firm is not forced out of business; otherwise, Ti is unobservable. There are two events in the analysis: an IPO and an exit, which is a competing event alterna-tive to an IPO. Let Ti denote the time from founding to the competing event for firm i . We observe either an IPO or the competing event when min
{Ti, Ti
}≤ Ci . Gray
(1988) and Fine and Gray (1999) proposed the hazard of the sub-distribution for the competing event. Following the specification, we formalize the hazard for an IPO, hi(t) , as follows:
where a ∧ b denotes min{a, b} . To estimate the determinants of an IPO, we assume that its subdistribution hazard is written as follows:
where � is the vector of estimated parameters (coefficients) and h0(t) is the baseline sub-hazard. Using the similar likelihood function shown in Eq. (3), we obtain � and the hazard ratio.
5 Data
5.1 Data sources
The data set used in the analysis is extracted from a database compiled by Teikoku Databank, Ltd. (TDB), which is one of the major credit investigation companies in Japan (comparable to Dun & Bradstreet in the United States). The TDB database comprises unconsolidated financial statements prepared using the Japanese Gener-ally Accepted Accounting Principles. We obtained data on financial statements in the first (initial) accounting year after founding (incorporating).9 Using the TDB database, we identified the IPOs of start-up firms, including stock markets. We also obtained data on market indices from the Nikkei Needs Financial Quest.
In Japan, there are several legal forms of firms, including sole proprietorship and partnership. While sole proprietorship and partnership are introduced as forms of private holding, a joint-stock company is the most typical form of a limited liability company. In this study, we target joint-stock companies, mainly because the TDB
(5)hi(t) = limΔt→0
Pr(t < Ti ≤ t + Δt|Ci ∧ Ti > t ∪ Ti ≤ t
)
Δt,
(6)hi(t;x) = h0(t)exp(x�
i𝛾),
9 We do not have data on all firms’ financial statements for the second and any later accounting years and information about entrepreneurs’ personal attributes and ownership structure.
1587
1 3
Public or perish? From founding to initial public offering
database does not sufficiently cover the financial statements of sole proprietorships and partnerships. In addition, there is very little possibility of sole proprietorships and partnerships going public within a short period of time. In this study, we could ensure a certain number of IPOs by focusing on join-stock companies.
Using the TDB database, we constructed the sample of start-up firms founded from the mid-1990s when the junior stock markets were introduced in Japan, in order to identify the factors affecting the time to IPO. For our sample, we selected firms incorporated from January 1995 to December 2010. To observe the IPO event, we set up an observation window from January 1995 to January 2011. This obser-vation window was set before the Great East Japan Earthquake in March 2011. While the day, month, and year are specified for the firm’s IPO event, only month and year are specified for a part of the firm’s founding and other event dates in the data source. In this study, we measure the time to IPO by month, although the time to IPO for most firms is censored. We observe the time to IPO in the range of 1 month (for firms founded in December 2010) to 192 months (for firms founded in January 1995) in the sample. Generally, several IPOs were made from the early-2000s, mainly because junior stock markets were introduced from the mid-1990s to the early 2000s, and the so-called “Internet bubble” occurred around 2000 in Japan. However, the number of IPOs decreased drastically in 2008 because of the recession along with the collapse of Lehman Brothers. Therefore, it is predicted that the likeli-hood of an IPO depends heavily on market conditions in Japan.
The sample covers firms in the manufacturing, information and communications technology (ICT), wholesale and retail trade, and service sectors.10 This contrasts with some earlier studies that focused only on start-up firms in the manufacturing sector (e.g., Huyghebaert et al. 2007). Although high-tech start-ups, which require massive R&D expenditures, tend to be included in the manufacturing sector, this sector is progressively contracting in most developed countries, including Japan. In practice, the ICT and service sectors, rather than the manufacturing sector, have attracted many new entrants in recent years, and these industries seem to contribute the most to future economic growth.
The sample included a few large firms. Although these firms might possibly be de-novo entrants, those with 500 employees and more in the first accounting year were considered as outliers, and we excluded these from the sample. In addition, a few firms went public within 1 month after founding because of the reorganization of group firms. We excluded these firms from the sample. Moreover, we excluded some firms regarded as outliers from the sample. Consequently, the sample com-prises 10,397 joint-stock companies founded in Japan from 1995 to 2010.11
10 From the sample, we exclude firms in relatively unimportant sectors or those in highly regulated industries, such as agriculture, forestry, fisheries, mining, finance, insurance, and public services. We also exclude firms in the construction sector because the TDB database tends to extremely cover firms in this sector but most firms do not go public.11 In Japan, regulations related to minimum paid-in capital requirements—more precisely, capital stock of no less than 10 million yen for a joint-stock company—were in place in and after April 1990, as a means of increasing initial equity financing, even for small firms. The regulations mandated entrepre-neurs to obtain 10 million yen in capital to found joint-stock companies. However, the requirements were
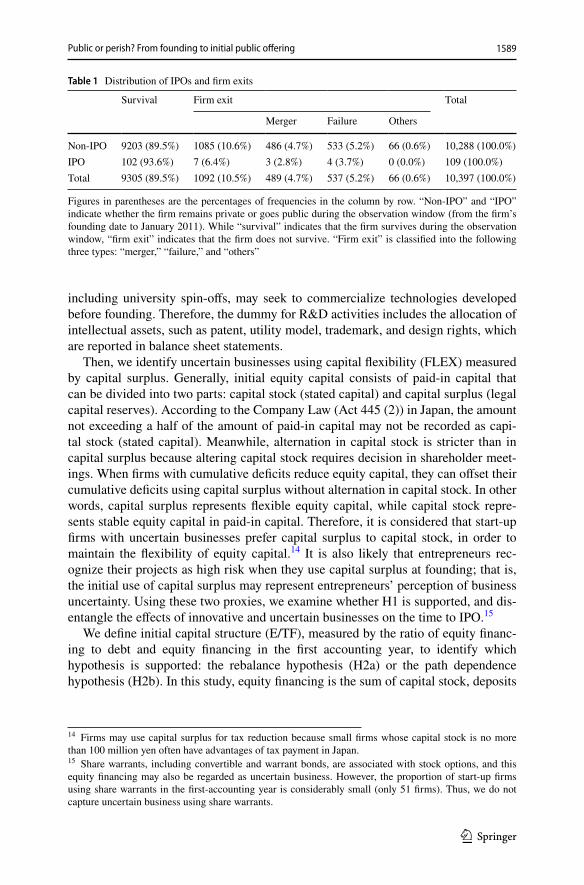
1588 Y. Honjo
1 3
Table 1 describes the distribution of IPOs in the sample. The interest event tar-gets IPOs not only in established stock exchanges, such as TSE, but also in junior stock markets, such as JASDAQ and MOTHERS. Among the start-up firms, 109 had experience in IPO by January 2011. In practice, all 109 firms went public in junior stock markets. In this respect, junior stock markets play a critical role in pro-viding equity capital to start-up firms in Japan. Table 1 also presents the distribution of firm exits, except for IPOs, which is regarded as a competing event for an IPO in this study. In the sample, 1092 firms exited due to merger, business failure (bank-ruptcy) or others in the observation window. The proportion of firm exits is more than 10% in the sample. Among the 1092 firms, 489 firms merged, 537 firms failed, and 66 firms exited due to other reasons. While 1085 firms that had experience in the competing event (firm exit) prior to an IPO did not conduct IPOs, seven IPO firms exited in the observation window. In Table 1, we also find that the proportion of firm exits for non-IPOs (10.6%) is higher than that for IPOs (6.4%). This suggests that non-IPO firms (privately held firms) are more likely to disappear than IPO firms (publicly listed firms), indicating that “public or perish.”
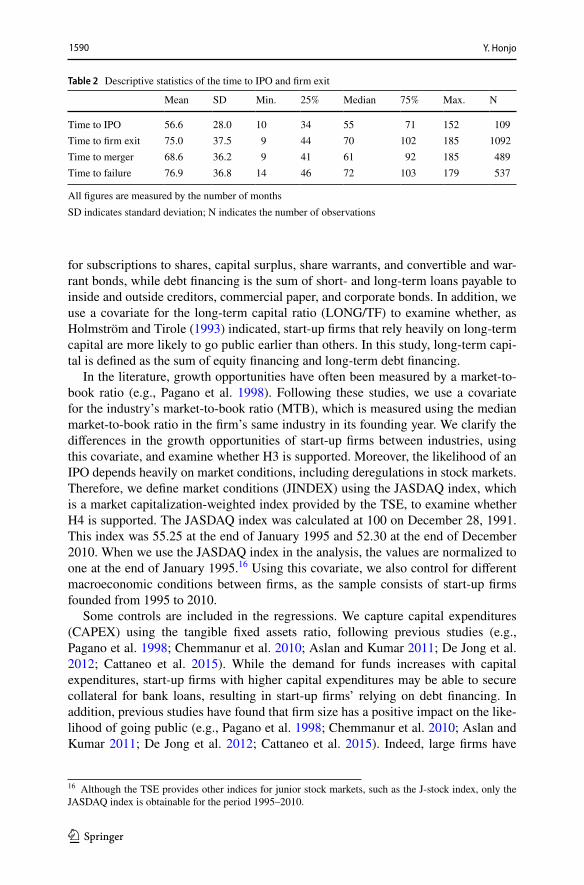
Moreover, Table 2 describes the descriptive statistics of the time from founding to IPO. On average, the time to IPO is approximately 57 months for the 109 IPO firms. In the sample, the earliest IPO is November 1997, and the minimum time to IPO is 10 months (297 days) for an ICT start-up. Table 2 also presents the time to merger and to failure, in addition to the time to firm exit. On average, the time to merger and failure are both longer than the time to IPO.12
5.2 Covariates
Following the hypotheses discussed in Sect. 3, we define the covariates affecting the time to IPO. Although it is difficult to identify innovative and uncertain busi-nesses, we propose two proxies that are obtainable from financial statements. First, R&D activities are used to capture innovative businesses. We measure R&D activi-ties (RD) using the dummy for R&D expenditures in the first accounting year. R&D activities include not only R&D expenditures but also patent royalty pay-ments, which are reported in income statements.13 Moreover, several start-up firms,
Footnote 11 (continued)removed when the new Companies Act was introduced in May 2006. Therefore, from the sample, we excluded firms with less than 10 million yen for firms founded before May 2006. Moreover, we excluded the following firms as outliers; specifically (i) equity financing was zero, negative or unavailable, (ii) capital surplus was negative, (iii) paid-in capital (capital stock plus capital surplus) plus treasury shares was zero, (iv) fixed tangible assets were unavailable, (v) tangible assets were negative, or (vi) total assets were zero.12 As Tables 1 and 2 show, only a few firms exit after going public. Recent studies examined post-IPO mergers and merger synergies (e.g., Bade 2018; Signori and Vismara 2018), and it may be interesting to examine the likelihood of a merger among IPO firms. This will probably remain as a future subject.13 Instead of the dummies, the covariates for innovative and uncertain businesses can be defined as the ratio measures, such as the ratio of R&D expenditures to sales. However, such ratios differ consider-ably between start-up firms, partly because a few firms have massive R&D expenditures, and some firms spend a small amount, probably due to financial constraints. Therefore, we simply identify innovative and uncertain businesses using the dummies.
1589
1 3
Public or perish? From founding to initial public offering
including university spin-offs, may seek to commercialize technologies developed before founding. Therefore, the dummy for R&D activities includes the allocation of intellectual assets, such as patent, utility model, trademark, and design rights, which are reported in balance sheet statements.
Then, we identify uncertain businesses using capital flexibility (FLEX) measured by capital surplus. Generally, initial equity capital consists of paid-in capital that can be divided into two parts: capital stock (stated capital) and capital surplus (legal capital reserves). According to the Company Law (Act 445 (2)) in Japan, the amount not exceeding a half of the amount of paid-in capital may not be recorded as capi-tal stock (stated capital). Meanwhile, alternation in capital stock is stricter than in capital surplus because altering capital stock requires decision in shareholder meet-ings. When firms with cumulative deficits reduce equity capital, they can offset their cumulative deficits using capital surplus without alternation in capital stock. In other words, capital surplus represents flexible equity capital, while capital stock repre-sents stable equity capital in paid-in capital. Therefore, it is considered that start-up firms with uncertain businesses prefer capital surplus to capital stock, in order to maintain the flexibility of equity capital.14 It is also likely that entrepreneurs rec-ognize their projects as high risk when they use capital surplus at founding; that is, the initial use of capital surplus may represent entrepreneurs’ perception of business uncertainty. Using these two proxies, we examine whether H1 is supported, and dis-entangle the effects of innovative and uncertain businesses on the time to IPO.15
We define initial capital structure (E/TF), measured by the ratio of equity financ-ing to debt and equity financing in the first accounting year, to identify which hypothesis is supported: the rebalance hypothesis (H2a) or the path dependence hypothesis (H2b). In this study, equity financing is the sum of capital stock, deposits
Table 1 Distribution of IPOs and firm exits
Figures in parentheses are the percentages of frequencies in the column by row. “Non-IPO” and “IPO” indicate whether the firm remains private or goes public during the observation window (from the firm’s founding date to January 2011). While “survival” indicates that the firm survives during the observation window, “firm exit” indicates that the firm does not survive. “Firm exit” is classified into the following three types: “merger,” “failure,” and “others”
Survival Firm exit Total
Merger Failure Others
Non-IPO 9203 (89.5%) 1085 (10.6%) 486 (4.7%) 533 (5.2%) 66 (0.6%) 10,288 (100.0%)IPO 102 (93.6%) 7 (6.4%) 3 (2.8%) 4 (3.7%) 0 (0.0%) 109 (100.0%)Total 9305 (89.5%) 1092 (10.5%) 489 (4.7%) 537 (5.2%) 66 (0.6%) 10,397 (100.0%)
14 Firms may use capital surplus for tax reduction because small firms whose capital stock is no more than 100 million yen often have advantages of tax payment in Japan.15 Share warrants, including convertible and warrant bonds, are associated with stock options, and this equity financing may also be regarded as uncertain business. However, the proportion of start-up firms using share warrants in the first-accounting year is considerably small (only 51 firms). Thus, we do not capture uncertain business using share warrants.
1590 Y. Honjo
1 3
for subscriptions to shares, capital surplus, share warrants, and convertible and war-rant bonds, while debt financing is the sum of short- and long-term loans payable to inside and outside creditors, commercial paper, and corporate bonds. In addition, we use a covariate for the long-term capital ratio (LONG/TF) to examine whether, as Holmström and Tirole (1993) indicated, start-up firms that rely heavily on long-term capital are more likely to go public earlier than others. In this study, long-term capi-tal is defined as the sum of equity financing and long-term debt financing.
In the literature, growth opportunities have often been measured by a market-to-book ratio (e.g., Pagano et al. 1998). Following these studies, we use a covariate for the industry’s market-to-book ratio (MTB), which is measured using the median market-to-book ratio in the firm’s same industry in its founding year. We clarify the differences in the growth opportunities of start-up firms between industries, using this covariate, and examine whether H3 is supported. Moreover, the likelihood of an IPO depends heavily on market conditions, including deregulations in stock markets. Therefore, we define market conditions (JINDEX) using the JASDAQ index, which is a market capitalization-weighted index provided by the TSE, to examine whether H4 is supported. The JASDAQ index was calculated at 100 on December 28, 1991. This index was 55.25 at the end of January 1995 and 52.30 at the end of December 2010. When we use the JASDAQ index in the analysis, the values are normalized to one at the end of January 1995.16 Using this covariate, we also control for different macroeconomic conditions between firms, as the sample consists of start-up firms founded from 1995 to 2010.
Some controls are included in the regressions. We capture capital expenditures (CAPEX) using the tangible fixed assets ratio, following previous studies (e.g., Pagano et al. 1998; Chemmanur et al. 2010; Aslan and Kumar 2011; De Jong et al. 2012; Cattaneo et al. 2015). While the demand for funds increases with capital expenditures, start-up firms with higher capital expenditures may be able to secure collateral for bank loans, resulting in start-up firms’ relying on debt financing. In addition, previous studies have found that firm size has a positive impact on the like-lihood of going public (e.g., Pagano et al. 1998; Chemmanur et al. 2010; Aslan and Kumar 2011; De Jong et al. 2012; Cattaneo et al. 2015). Indeed, large firms have
Table 2 Descriptive statistics of the time to IPO and firm exit
All figures are measured by the number of monthsSD indicates standard deviation; N indicates the number of observations
Mean SD Min. 25% Median 75% Max. N
Time to IPO 56.6 28.0 10 34 55 71 152 109Time to firm exit 75.0 37.5 9 44 70 102 185 1092Time to merger 68.6 36.2 9 41 61 92 185 489Time to failure 76.9 36.8 14 46 72 103 179 537
16 Although the TSE provides other indices for junior stock markets, such as the J-stock index, only the JASDAQ index is obtainable for the period 1995–2010.
1591
1 3
Public or perish? From founding to initial public offering
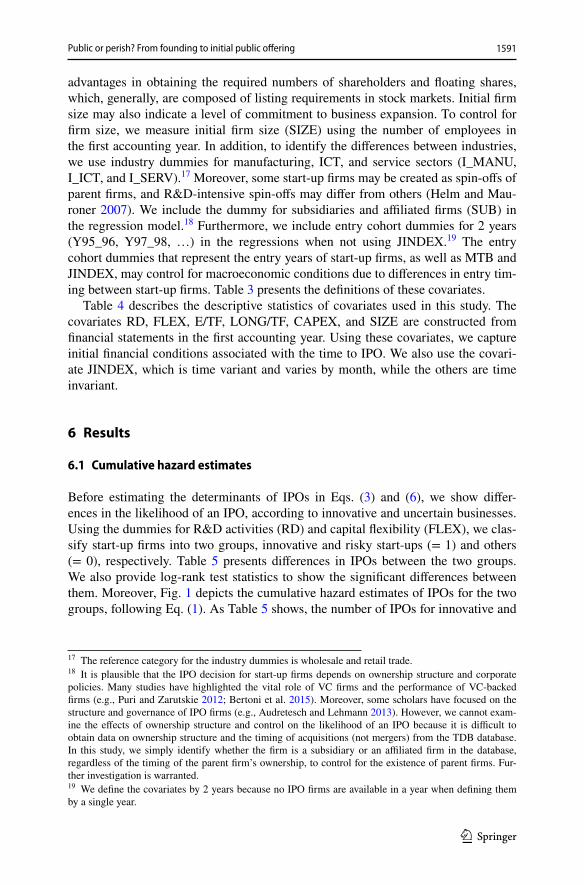
advantages in obtaining the required numbers of shareholders and floating shares, which, generally, are composed of listing requirements in stock markets. Initial firm size may also indicate a level of commitment to business expansion. To control for firm size, we measure initial firm size (SIZE) using the number of employees in the first accounting year. In addition, to identify the differences between industries, we use industry dummies for manufacturing, ICT, and service sectors (I_MANU, I_ICT, and I_SERV).17 Moreover, some start-up firms may be created as spin-offs of parent firms, and R&D-intensive spin-offs may differ from others (Helm and Mau-roner 2007). We include the dummy for subsidiaries and affiliated firms (SUB) in the regression model.18 Furthermore, we include entry cohort dummies for 2 years (Y95_96, Y97_98, …) in the regressions when not using JINDEX.19 The entry cohort dummies that represent the entry years of start-up firms, as well as MTB and JINDEX, may control for macroeconomic conditions due to differences in entry tim-ing between start-up firms. Table 3 presents the definitions of these covariates.
Table 4 describes the descriptive statistics of covariates used in this study. The covariates RD, FLEX, E/TF, LONG/TF, CAPEX, and SIZE are constructed from financial statements in the first accounting year. Using these covariates, we capture initial financial conditions associated with the time to IPO. We also use the covari-ate JINDEX, which is time variant and varies by month, while the others are time invariant.
6 Results
6.1 Cumulative hazard estimates
Before estimating the determinants of IPOs in Eqs. (3) and (6), we show differ-ences in the likelihood of an IPO, according to innovative and uncertain businesses. Using the dummies for R&D activities (RD) and capital flexibility (FLEX), we clas-sify start-up firms into two groups, innovative and risky start-ups (= 1) and others (= 0), respectively. Table 5 presents differences in IPOs between the two groups. We also provide log-rank test statistics to show the significant differences between them. Moreover, Fig. 1 depicts the cumulative hazard estimates of IPOs for the two groups, following Eq. (1). As Table 5 shows, the number of IPOs for innovative and
17 The reference category for the industry dummies is wholesale and retail trade.18 It is plausible that the IPO decision for start-up firms depends on ownership structure and corporate policies. Many studies have highlighted the vital role of VC firms and the performance of VC-backed firms (e.g., Puri and Zarutskie 2012; Bertoni et al. 2015). Moreover, some scholars have focused on the structure and governance of IPO firms (e.g., Audretesch and Lehmann 2013). However, we cannot exam-ine the effects of ownership structure and control on the likelihood of an IPO because it is difficult to obtain data on ownership structure and the timing of acquisitions (not mergers) from the TDB database. In this study, we simply identify whether the firm is a subsidiary or an affiliated firm in the database, regardless of the timing of the parent firm’s ownership, to control for the existence of parent firms. Fur-ther investigation is warranted.19 We define the covariates by 2 years because no IPO firms are available in a year when defining them by a single year.
1592 Y. Honjo
1 3
Tabl
e 3
Defi
nitio
ns o
f cov
aria
tes
All
the
dum
my
varia
bles
take
a v
alue
of o
ne if
the
stat
ed c
ondi
tion
hold
s, an
d ze
ro o
ther
wis
e. T
he c
ovar
iate
s fo
r inn
ovat
ive
and
unce
rtain
bus
ines
ses,
initi
al e
quity
ratio
, lo
ng-te
rm c
apita
l rat
io, c
apita
l exp
endi
ture
s, an
d in
itial
size
are
con
struc
ted
from
fina
ncia
l sta
tem
ents
in th
e fir
st ac
coun
ting
year
. The
refe
renc
e ca
tego
ries f
or th
e in
dustr
y an
d en
try c
ohor
t dum
mie
s are
show
n in
the
estim
atio
n re
sults
Cov
aria
teSy
mbo
lD
efini
tion
Inno
vativ
e an
d un
certa
in b
usin
esse
sR
DD
umm
y va
riabl
e fo
r R&
D e
xpen
ditu
res,
pate
nt ro
yalty
pay
men
ts, o
r the
allo
catio
n of
inte
llect
ual a
sset
s (p
aten
t, ut
ility
mod
el, t
rade
mar
k, a
nd d
esig
n rig
hts)
FLEX
Dum
my
varia
ble
for c
apita
l sur
plus
(leg
al c
apita
l res
erve
s)In
itial
equ
ity ra
tioE/
TFE/
(E +
D)
Equi
ty fi
nanc
ing
(E) i
s the
sum
of c
apita
l sto
ck (s
tate
d ca
pita
l), d
epos
its fo
r sub
scrip
tions
to sh
ares
, cap
i-ta
l sur
plus
(leg
al c
apita
l res
erve
s), s
hare
war
rant
s, an
d co
nver
tible
and
war
rant
bon
ds. D
ebt fi
nanc
ing
(D) i
s the
sum
of s
hort-
and
long
-term
loan
s pay
able
to in
side
and
out
side
cre
dito
rs, c
omm
erci
al p
aper
, an
d co
rpor
ate
bond
sLo
ng-te
rm c
apita
l rat
ioLO
NG
/TF
Sum
of l
ong-
term
loan
s pay
able
to in
side
and
out
side
cre
dito
rs, a
nd c
orpo
rate
bon
ds, p
lus e
quity
fina
nc-
ing,
div
ided
by
tota
l fina
ncin
gC
apita
l exp
endi
ture
sCA
PEX
Rat
io o
f tan
gibl
e fix
ed a
sset
s to
tota
l ass
ets
Initi
al si
zeSI
ZELo
garit
hm o
f the
num
ber o
f em
ploy
ees p
lus o
neM
arke
t con
ditio
nsJI
ND
EXJA
SDA
Q in
dex
base
d on
the
mon
th-e
nd c
losi
ng p
rice,
nor
mal
ized
by
its v
alue
at t
he e
nd o
f Jan
uary
199
5 (=
1)
Indu
stry
mar
ket-t
o-bo
ok ra
tioM
TBM
edia
n m
arke
t-to-
book
ratio
of p
ublic
firm
s in
the
indu
stry
at th
e tw
o-di
git i
ndus
try c
lass
ifica
tion
in th
e ye
ar w
hen
the
firm
was
foun
ded
Indu
stry
dum
mie
sI_
MA
NU
FD
umm
y va
riabl
e fo
r man
ufac
turin
gI_
ICT
Dum
my
varia
ble
for I
CT
I_TR
AD
ED
umm
y va
riabl
e fo
r who
lesa
le a
nd re
tail
trade
I_SE
RVD
umm
y va
riabl
e fo
r ser
vice
and
oth
er in
dustr
ies
Subs
idia
ry d
umm
ySU
BD
umm
y va
riabl
e fo
r sub
sidi
arie
s and
affi
liate
d fir
ms
Entry
coh
ort d
umm
ies
Y 9
5_96
, Y 9
7_98
,…D
umm
y va
riabl
e fo
r the
firm
foun
ded
durin
g th
e pe
riod
of 1
995–
1996
, 199
7–19
98, e
tc.
1593
1 3
Public or perish? From founding to initial public offering
Table 4 Descriptive statistics of covariates
The descriptive statistics of JINDEX is based on the estimation results for the time to IPO and IPO/merger reported in column (v) of Tables 6 and 7SD indicates standard deviation; N indicates the number of observations
Covariate Mean SD 25% Median 75% N
RD 0.113 – – – – 10397FLEX 0.069 – – – – 10397E/TF 0.597 0.354 0.263 0.592 1.000 10397LONG/TF 0.826 0.267 0.723 1.000 1.000 10397CAPEX 0.105 0.173 0.000 0.027 0.123 10397SIZE 1.871 1.240 1.099 1.792 2.565 10397JINDEX 1.181 0.417 0.875 1.032 1.515 700469MTB 1.404 1.396 0.790 1.025 1.576 10397I_MANUF 0.107 – – – – 10397I_ICT 0.233 – – – – 10397I_TRADE 0.383 – – – – 10,397I_SERV 0.277 – – – – 10,397SUB 0.251 – – – – 10,397Y95_96 0.068 – – – – 10,397Y97_98 0.063 – – – – 10,397Y99_00 0.096 – – – – 10,397Y01_02 0.088 – – – – 10,397Y03_04 0.101 – – – – 10,397Y05_06 0.160 – – – – 10,397Y07_08 0.226 – – – – 10,397Y09_10 0.199 – – – – 10,397Number of employees 15.556 38.761 2.000 5.000 12.000 10,397
Table 5 Log-rank tests: IPOs and firm exits of innovative/uncertain businesses and others among start-up firms
“IPO” indicates the number of IPOs in the observation window (from the firm’s founding date to January 2011). “Firm exit” indicates the number of firm exits in the observation window. “Firm exit” includes the following three types: “failure,” “merger,” and “others.” “Expected” indicates the expected values. “Log rank” indicates the log-rank test statistics
Covariate IPO Expected Log rank Firm exit Expected Log rank
RD 0 77 95.7 29.9*** 946 958.0 1.23 1 32 13.3 146 134.0
FLEX 0 68 102.5 197*** 989 1031.8 32.6*** 1 41 6.5 103 60.2
Total 109 109.0 1092 1092.0
1594 Y. Honjo
1 3
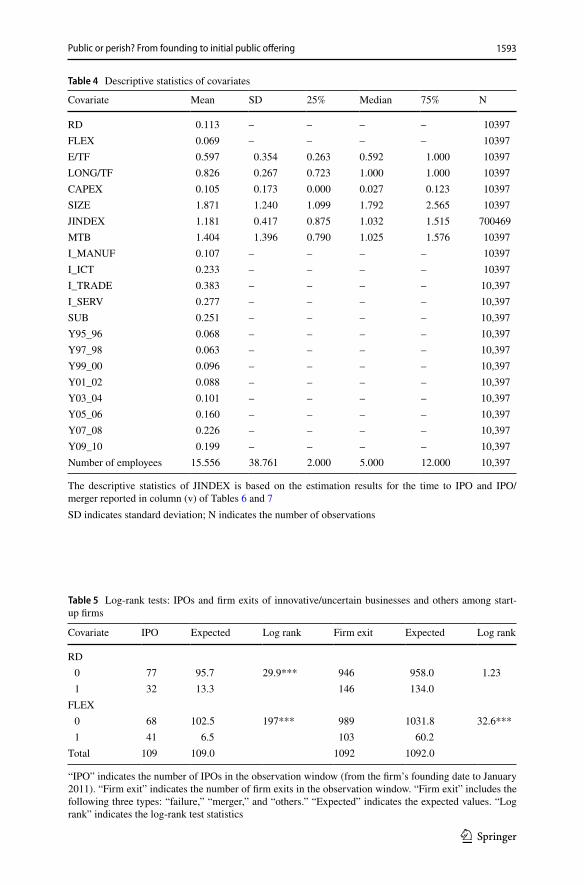
risky start-ups is higher than expected IPOs. As Fig. 1 shows, the cumulative hazard estimates of IPOs for innovative and risky start-ups tend to increase faster than for others. These results indicate that start-up firms that engage in innovative and uncer-tain businesses are more likely to go public earlier than others.
Panel (a): R&D activities (RD)
Panel (b): Capital flexibility (FLEX)
Fig. 1 Cumulative hazard estimates of IPOs. Source: Author’s elaboration based on the TDB database
1595
1 3
Public or perish? From founding to initial public offering
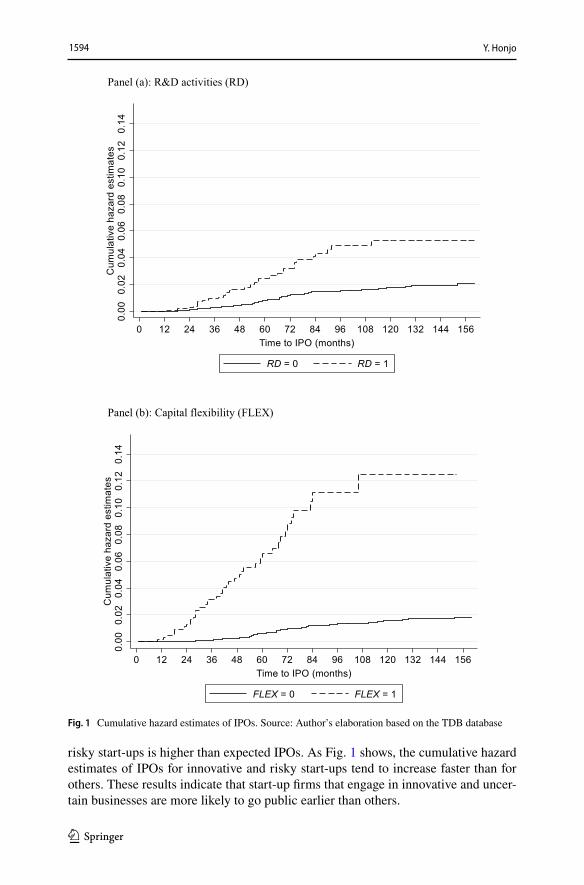
Table 5 also presents differences in firm exits between the two groups. Follow-ing Fig. 1, Fig. 2 depicts the cumulative hazard estimates of firm exits for the two groups. As shown in the table and figure, the cumulative hazard estimates of firm
Panel (a): R&D activities (RD)
Panel (b): Capital flexibility (FLEX)
Fig. 2 Cumulative hazard estimates of firm exits. Source: Author’s elaboration based on the TDB data-base
1596 Y. Honjo
1 3
exits regarding R&D activities (RD) do not differ between the two groups. Mean-while, the cumulative hazard estimates of firm exits regarding capital flexibility (FLEX) differ between the two groups. These results indicate that start-up firms that engage in uncertain businesses measured by capital flexibility are more likely to dis-appear earlier than others, and the difference is backed up by the log-rank test.
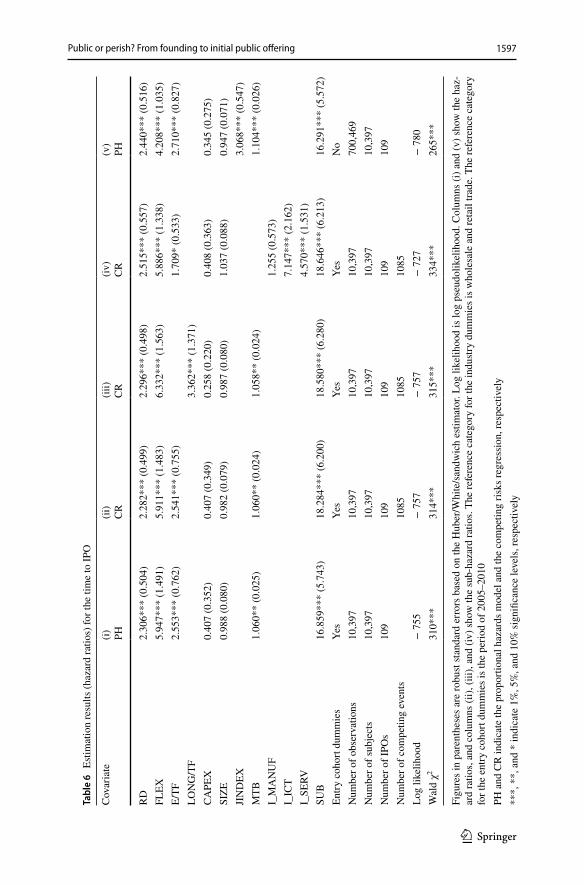
6.2 Determinants of the time to IPO
Table 6 presents the estimated hazard ratios for IPOs. The estimated coefficients for IPOs are presented in Table 9 in the Appendix. Column (i) of Table 6 shows the estimated results using the proportional hazards regression when RD, FLEX, E/TF, CAPEX, SIZE, MTB, SUB, and the entry cohort dummies are included in the model. Columns (ii), (iii), and (iv) show the estimated results using the com-peting risks regression, instead of the proportional hazards regression. As already mentioned, Holmström and Tirole (1993) argued that the fraction of firms going public increases with the amount of long-term capital. Column (iii) shows the effect of long-term capital on the time to IPO when LONG/TF, instead of EF/TF, is used. To identify the differences in IPOs between industries, column (iv) shows the esti-mated results using the industry dummies (I_MANU, I_ICT, and I_SERV), instead of MTB. Moreover, column (v) shows the estimated results with the time-variant covariate, JINDEX.20
As Table 6 shows, overall, we obtain rigorous results even when the alternative covariates or estimation methods are used. In Table 6, the hazard ratios of RD are more than one and statistically significant, indicating that start-up firms that engage in R&D activities seek IPOs. Moreover, FLEX has a positive and significant effect on the time to IPO.21 The results of this study indicate that start-up firms that engage in innovative and uncertain businesses, such as high-tech start-ups, are more likely to go public earlier than others. Previous studies have argued that access to bank loans is difficult for firms with R&D investment and equity financing has advantages over debt financing for R&D investment (e.g., Carpenter and Petersen 2002a; Hall 2002; Colombo and Grilli 2007). We provide supportive evidence on H1, whereas some scholars emphasized the problem of loss of confidentiality for firms in high-tech sectors (e.g., Campbell 1979; Yosha 1995; Pagano et al. 1998). The findings suggest that high-tech start-ups are expected to compensate for such uncertainty with growth potential through the IPO. In this respect, junior stock markets could provide opportunities for raising equity financing for start-up firms that engage in innovative businesses. The findings also suggest that early-stage shareholders’
20 We do not employ the competing risks regression when the time-invariant covariate is included. Moreover, taking into account the heterogeneity between the entry cohorts, we use the proportional haz-ards model with shared frailty based on the entry cohort years. As a result, we obtain similar results to those in Table 6.21 We define a covariate for the ratio of capital surplus to total finance and estimate its effect on the time to IPO. As a result, its coefficient is positive at the 1% significance level. This indicates that start-up firms that raise equity financing through capital surplus are more likely to go public earlier than others.
1597
1 3
Public or perish? From founding to initial public offering
Tabl
e 6
Esti
mat
ion
resu
lts (h
azar
d ra
tios)
for t
he ti
me
to IP
O
Figu
res i
n pa
rent
hese
s are
robu
st st
anda
rd e
rror
s bas
ed o
n th
e H
uber
/Whi
te/s
andw
ich
estim
ator
. Log
like
lihoo
d is
log
pseu
dolik
elih
ood.
Col
umns
(i) a
nd (v
) sho
w th
e ha
z-ar
d ra
tios,
and
colu
mns
(ii),
(iii)
, and
(iv)
show
the
sub-
haza
rd ra
tios.
The
refe
renc
e ca
tego
ry fo
r the
indu
stry
dum
mie
s is w
hole
sale
and
reta
il tra
de. T
he re
fere
nce
cate
gory
fo
r the
ent
ry c
ohor
t dum
mie
s is t
he p
erio
d of
200
5–20
10PH
and
CR
indi
cate
the
prop
ortio
nal h
azar
ds m
odel
and
the
com
petin
g ris
ks re
gres
sion
, res
pect
ivel
y**
*, *
*, a
nd *
indi
cate
1%
, 5%
, and
10%
sign
ifica
nce
leve
ls, r
espe
ctiv
ely
Cov
aria
te(i) PH
(ii)
CR
(iii)
CR
(iv)
CR
(v)
PH
RD
2.30
6***
(0.5
04)
2.28
2***
(0.4
99)
2.29
6***
(0.4
98)
2.51
5***
(0.5
57)
2.44
0***
(0.5
16)
FLEX
5.94
7***
(1.4
91)
5.91
1***
(1.4
83)
6.33
2***
(1.5
63)
5.88
6***
(1.3
38)
4.20
8***
(1.0
35)
E/TF
2.55
3***
(0.7
62)
2.54
1***
(0.7
55)
1.70
9* (0
.533
)2.
710*
** (0
.827
)LO
NG
/TF
3.36
2***
(1.3
71)
CAPE
X0.
407
(0.3
52)
0.40
7 (0
.349
)0.
258
(0.2
20)
0.40
8 (0
.363
)0.
345
(0.2
75)
SIZE
0.98
8 (0
.080
)0.
982
(0.0
79)
0.98
7 (0
.080
)1.
037
(0.0
88)
0.94
7 (0
.071
)JI
ND
EX3.
068*
** (0
.547
)M
TB1.
060*
* (0
.025
)1.
060*
* (0
.024
)1.
058*
* (0
.024
)1.
104*
** (0
.026
)I_
MA
NU
F1.
255
(0.5
73)
I_IC
T7.
147*
** (2
.162
)I_
SERV
4.57
0***
(1.5
31)
SUB
16.8
59**
* (5
.743
)18
.284
***
(6.2
00)
18.5
80**
* (6
.280
)18
.646
***
(6.2
13)
16.2
91**
* (5
.572
)En
try c
ohor
t dum
mie
sYe
sYe
sYe
sYe
sN
oN
umbe
r of o
bser
vatio
ns10
,397
10,3
9710
,397
10,3
9770
0,46
9N
umbe
r of s
ubje
cts
10,3
9710
,397
10,3
9710
,397
10,3
97N
umbe
r of I
POs
109
109
109
109
109
Num
ber o
f com
petin
g ev
ents
1085
1085
1085
Log
likel
ihoo
d−
755
− 7
57−
757
− 7
27−
780
Wal
d χ2
310*
**31
4***
315*
**33
4***
265*
**
1598 Y. Honjo
1 3
response to innovative and uncertain businesses in the demand for initial equity cap-ital is significantly associated with the likelihood of an IPO.
With respect to initial capital structure, Table 6 shows that the hazard ratios of E/TF are more than one and statistically significant. This indicates that the likeli-hood of an IPO increases with the ratio of equity financing at founding, which is consistent with Cattaneo et al. (2015) who found that firm leverage has a negative on this likelihood. We provide evidence that start-up firms that rely heavily on equity financing, rather than on debt financing, are more likely to go public earlier than others. The results also suggest that some start-up firms that rely heavily on equity capital provided by early-stage shareholders, including entrepreneurs, tend to seek IPOs to access public equity markets. Early-stage shareholders who bear a large pro-portion of initial funds may have a strong incentive to go public early, partly because they can secure an opportunity to sell their highly risky shares. Moreover, the hazard ratios of LONG/TF are more than one and statistically significant in column (iii) of Table 6.22 We provide evidence that the likelihood of an IPO is positively associated with long-term capital, which is consistent with Holmström and Tirole (1993). This indicates that start-up firms that rely heavily on long-term capital are more likely to go public earlier than others.
Consequently, our results do not support the rebalance hypothesis (H2a) but do support the path dependence hypothesis (H2b). Our findings contradict those of Aslan and Kumar (2011) and De Jong et al. (2012). However, these studies exam-ined the decision to go public, regardless of firm age, while our study focuses only on start-up firms. In this respect, the determinants of IPOs for start-up firms differ from those for established firms, suggesting that the effect of capital structure on the likelihood of an IPO depends on the growth process. In other words, incentives to go public may evolve over time. Whether start-up firms seek to expand equity financ-ing—eventually, to conduct IPOs—may be affected by the inherent capital struc-ture, since debt is likely to be a poor substitute for equity (Carpenter and Petersen 2002a). The financial strategies of start-up firms depend on their inherent capital structure, and path dependence may exist in the capital structure of start-up firms. Conversely, the results reveal that start-up firms that rely heavily on debt financ-ing, such as bank loans, have less incentive to go public. In this respect, initial debt financing may trigger relationships with banks. The findings suggest that start-up firms that can rely on financial institutions, including main banks, at founding do not need to access public equity markets, presumably because financial institutions help provide capital to these firms.
Table 6 shows that the hazard ratios of MTB are more than one and statistically significant. We find a significant effect of the industry’s market-to-book ratio on the IPO decision. We provide support for H3, which is consistent with Pagano et al. (1998), Aslan and Kumar (2011), and De Jong et al. (2012). The results indicate that growth opportunities have a significant impact on the likelihood of an IPO. More-over, the industry dummies for I_ICT and I_SERV are higher than other industry
22 We also estimate the effect of long-term debt ratio, measured by the ratio of long-term debt to total assets, on the time to IPO. As a result, the coefficient of the long-term debt ratio is negative but insignifi-cant for the time to IPO.
1599
1 3
Public or perish? From founding to initial public offering
dummies. The results indicate that start-up firms in industries with higher market-to-book ratios, such as the ICT and service industries, are more likely to go public earlier than those in other industries. This indicates that start-up firms in the ICT industry—so-called “ICT ventures”—are more likely to go public earlier, in com-parison to those in other industries. The results indicate that start-up firms tend to go public in growing industries because shareholders expect higher valuation in stock markets. These findings suggest that the likelihood of an IPO is affected not only by growth opportunities but also by stock market conditions.
In column (v) of Table 6, the hazard ratio of JINDEX is more than one and sig-nificant. This indicates that the IPO decision depends heavily on market conditions, such as hot and cold markets, and that the likelihood of an IPO increases as market conditions are more favorable, which provides support for H4. This finding is con-sistent with previous studies (e.g., Ibbotson and Jaffe 1975; Ritter 1984; Helwege and Liang 2004). As Pagano et al. (1998) argued, there is a positive relationship between the likelihood of an IPO and the stock market valuation of firms, and a boom may raise awareness of IPOs. The result reveals that the likelihood of an IPO is influenced by macroeconomic conditions that start-up firms face.
Regarding the controls, Table 6 shows that the hazard ratios of CAPEX are insignificant. Although De Jong et al. (2012) emphasized that growing and heav-ily investing firms seek to finance their growth with public equity capital, we find no evidence that start-up firms with high capital expenditures are more likely to go public earlier than others. The results indicate that initial capital expenditures are not associated with the likelihood of an IPO. Initial capital expenditures may not reflect the demand for access to public equity markets, partly because many start-up firms encounter financial constraints at founding. Rather, firms with higher initial capital expenditures might rely on bank loans due to the availability of collateral. Moreover, Table 6 shows that the hazard ratios of SIZE are insignificant. We find little evidence that larger firms at founding are more likely to go public earlier than others.23 Our findings are not consistent with Pagano et al. (1998), Chemmanur et al. (2010), De Jong et al. (2012), and Cattaneo et al. (2015). Furthermore, in Table 6, the hazard ratios of SUB are more than one and statistically significant. The results indicate that subsidies and affiliated firms tend to go public among start-up firms.
6.3 Robustness check
In the previous subsection, we presented the estimated results using the survival analysis approach, while taking into account the occurrence of a competing event alternative to an IPO. In the analysis, mergers were regarded as the competing event because, as discussed, M&A is much less common as a strategic sellout in Japan. It is possible that some mergers are successful sellouts through the eventual sale of shares, although others show bailout mergers. Recently, Signori and Vismara (2018) examined the decision to go public relative to merger opportunity, and they argued that young and innovative firms expect potential merger synergies.
23 When excluding the dummy for subsidies from the sample, we find a significant effect of initial firm size on the time to IPO.
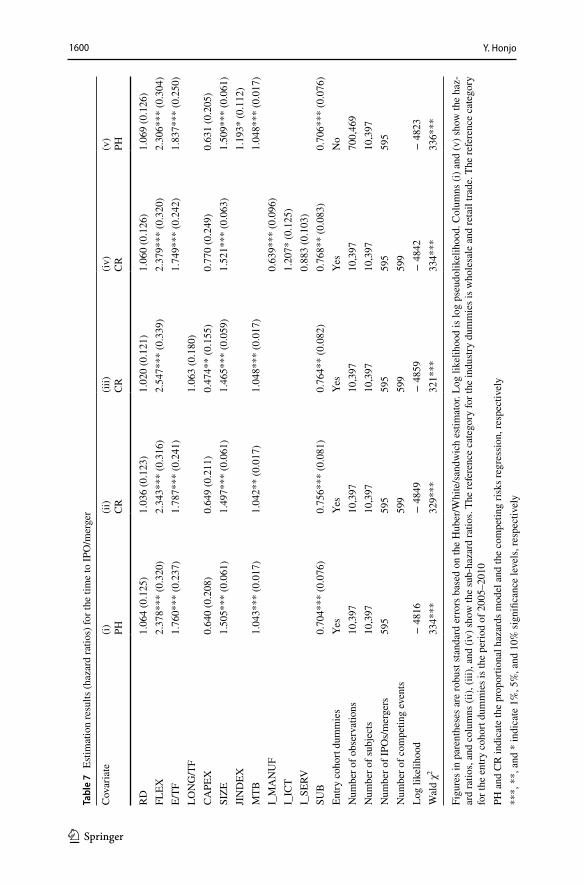
1600 Y. Honjo
1 3
Tabl
e 7
Esti
mat
ion
resu
lts (h
azar
d ra
tios)
for t
he ti
me
to IP
O/m
erge
r
Figu
res i
n pa
rent
hese
s are
robu
st st
anda
rd e
rror
s bas
ed o
n th
e H
uber
/Whi
te/s
andw
ich
estim
ator
. Log
like
lihoo
d is
log
pseu
dolik
elih
ood.
Col
umns
(i) a
nd (v
) sho
w th
e ha
z-ar
d ra
tios,
and
colu
mns
(ii),
(iii)
, and
(iv)
show
the
sub-
haza
rd ra
tios.
The
refe
renc
e ca
tego
ry fo
r the
indu
stry
dum
mie
s is w
hole
sale
and
reta
il tra
de. T
he re
fere
nce
cate
gory
fo
r the
ent
ry c
ohor
t dum
mie
s is t
he p
erio
d of
200
5–20
10PH
and
CR
indi
cate
the
prop
ortio
nal h
azar
ds m
odel
and
the
com
petin
g ris
ks re
gres
sion
, res
pect
ivel
y**
*, *
*, a
nd *
indi
cate
1%
, 5%
, and
10%
sign
ifica
nce
leve
ls, r
espe
ctiv
ely
Cov
aria
te(i) PH
(ii)
CR
(iii)
CR
(iv)
CR
(v)
PH
RD
1.06
4 (0
.125
)1.
036
(0.1
23)
1.02
0 (0
.121
)1.
060
(0.1
26)
1.06
9 (0
.126
)FL
EX2.
378*
** (0
.320
)2.
343*
** (0
.316
)2.
547*
** (0
.339
)2.
379*
** (0
.320
)2.
306*
** (0
.304
)E/
TF1.
760*
** (0
.237
)1.
787*
** (0
.241
)1.
749*
** (0
.242
)1.
837*
** (0
.250
)LO
NG
/TF
1.06
3 (0
.180
)CA
PEX
0.64
0 (0
.208
)0.
649
(0.2
11)
0.47
4**
(0.1
55)
0.77
0 (0
.249
)0.
631
(0.2
05)
SIZE
1.50
5***
(0.0
61)
1.49
7***
(0.0
61)
1.46
5***
(0.0
59)
1.52
1***
(0.0
63)
1.50
9***
(0.0
61)
JIN
DEX
1.19
3* (0
.112
)M
TB1.
043*
** (0
.017
)1.
042*
* (0
.017
)1.
048*
** (0
.017
)1.
048*
** (0
.017
)I_
MA
NU
F0.
639*
** (0
.096
)I_
ICT
1.20
7* (0
.125
)I_
SERV
0.88
3 (0
.103
)SU
B0.
704*
** (0
.076
)0.
756*
** (0
.081
)0.
764*
* (0
.082
)0.
768*
* (0
.083
)0.
706*
** (0
.076
)En
try c
ohor
t dum
mie
sYe
sYe
sYe
sYe
sN
oN
umbe
r of o
bser
vatio
ns10
,397
10,3
9710
,397
10,3
9770
0,46
9N
umbe
r of s
ubje
cts
10,3
9710
,397
10,3
9710
,397
10,3
97N
umbe
r of I
POs/
mer
gers
595
595
595
595
595
Num
ber o
f com
petin
g ev
ents
599
599
599
Log
likel
ihoo
d−
481
6−
484
9−
485
9−
484
2−
482
3W
ald
χ233
4***
329*
**32
1***
334*
**33
6***
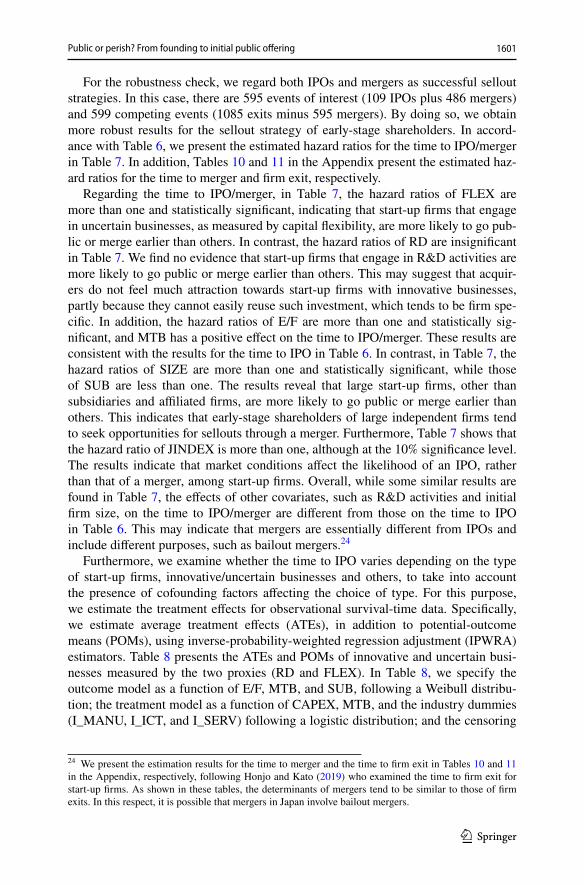
1601
1 3
Public or perish? From founding to initial public offering
For the robustness check, we regard both IPOs and mergers as successful sellout strategies. In this case, there are 595 events of interest (109 IPOs plus 486 mergers) and 599 competing events (1085 exits minus 595 mergers). By doing so, we obtain more robust results for the sellout strategy of early-stage shareholders. In accord-ance with Table 6, we present the estimated hazard ratios for the time to IPO/merger in Table 7. In addition, Tables 10 and 11 in the Appendix present the estimated haz-ard ratios for the time to merger and firm exit, respectively.
Regarding the time to IPO/merger, in Table 7, the hazard ratios of FLEX are more than one and statistically significant, indicating that start-up firms that engage in uncertain businesses, as measured by capital flexibility, are more likely to go pub-lic or merge earlier than others. In contrast, the hazard ratios of RD are insignificant in Table 7. We find no evidence that start-up firms that engage in R&D activities are more likely to go public or merge earlier than others. This may suggest that acquir-ers do not feel much attraction towards start-up firms with innovative businesses, partly because they cannot easily reuse such investment, which tends to be firm spe-cific. In addition, the hazard ratios of E/F are more than one and statistically sig-nificant, and MTB has a positive effect on the time to IPO/merger. These results are consistent with the results for the time to IPO in Table 6. In contrast, in Table 7, the hazard ratios of SIZE are more than one and statistically significant, while those of SUB are less than one. The results reveal that large start-up firms, other than subsidiaries and affiliated firms, are more likely to go public or merge earlier than others. This indicates that early-stage shareholders of large independent firms tend to seek opportunities for sellouts through a merger. Furthermore, Table 7 shows that the hazard ratio of JINDEX is more than one, although at the 10% significance level. The results indicate that market conditions affect the likelihood of an IPO, rather than that of a merger, among start-up firms. Overall, while some similar results are found in Table 7, the effects of other covariates, such as R&D activities and initial firm size, on the time to IPO/merger are different from those on the time to IPO in Table 6. This may indicate that mergers are essentially different from IPOs and include different purposes, such as bailout mergers.24
Furthermore, we examine whether the time to IPO varies depending on the type of start-up firms, innovative/uncertain businesses and others, to take into account the presence of cofounding factors affecting the choice of type. For this purpose, we estimate the treatment effects for observational survival-time data. Specifically, we estimate average treatment effects (ATEs), in addition to potential-outcome means (POMs), using inverse-probability-weighted regression adjustment (IPWRA) estimators. Table 8 presents the ATEs and POMs of innovative and uncertain busi-nesses measured by the two proxies (RD and FLEX). In Table 8, we specify the outcome model as a function of E/F, MTB, and SUB, following a Weibull distribu-tion; the treatment model as a function of CAPEX, MTB, and the industry dummies (I_MANU, I_ICT, and I_SERV) following a logistic distribution; and the censoring
24 We present the estimation results for the time to merger and the time to firm exit in Tables 10 and 11 in the Appendix, respectively, following Honjo and Kato (2019) who examined the time to firm exit for start-up firms. As shown in these tables, the determinants of mergers tend to be similar to those of firm exits. In this respect, it is possible that mergers in Japan involve bailout mergers.
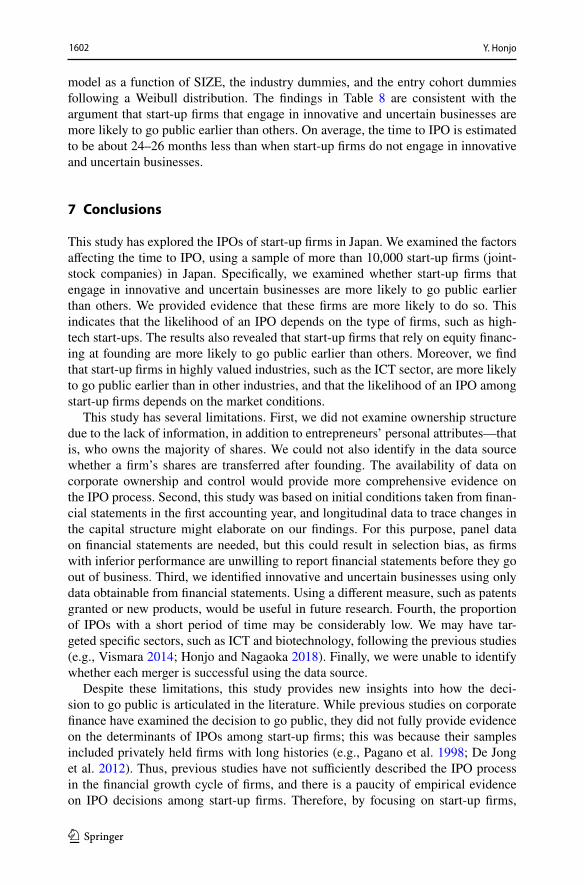
1602 Y. Honjo
1 3
model as a function of SIZE, the industry dummies, and the entry cohort dummies following a Weibull distribution. The findings in Table 8 are consistent with the argument that start-up firms that engage in innovative and uncertain businesses are more likely to go public earlier than others. On average, the time to IPO is estimated to be about 24–26 months less than when start-up firms do not engage in innovative and uncertain businesses.
7 Conclusions
This study has explored the IPOs of start-up firms in Japan. We examined the factors affecting the time to IPO, using a sample of more than 10,000 start-up firms (joint-stock companies) in Japan. Specifically, we examined whether start-up firms that engage in innovative and uncertain businesses are more likely to go public earlier than others. We provided evidence that these firms are more likely to do so. This indicates that the likelihood of an IPO depends on the type of firms, such as high-tech start-ups. The results also revealed that start-up firms that rely on equity financ-ing at founding are more likely to go public earlier than others. Moreover, we find that start-up firms in highly valued industries, such as the ICT sector, are more likely to go public earlier than in other industries, and that the likelihood of an IPO among start-up firms depends on the market conditions.
This study has several limitations. First, we did not examine ownership structure due to the lack of information, in addition to entrepreneurs’ personal attributes—that is, who owns the majority of shares. We could not also identify in the data source whether a firm’s shares are transferred after founding. The availability of data on corporate ownership and control would provide more comprehensive evidence on the IPO process. Second, this study was based on initial conditions taken from finan-cial statements in the first accounting year, and longitudinal data to trace changes in the capital structure might elaborate on our findings. For this purpose, panel data on financial statements are needed, but this could result in selection bias, as firms with inferior performance are unwilling to report financial statements before they go out of business. Third, we identified innovative and uncertain businesses using only data obtainable from financial statements. Using a different measure, such as patents granted or new products, would be useful in future research. Fourth, the proportion of IPOs with a short period of time may be considerably low. We may have tar-geted specific sectors, such as ICT and biotechnology, following the previous studies (e.g., Vismara 2014; Honjo and Nagaoka 2018). Finally, we were unable to identify whether each merger is successful using the data source.
Despite these limitations, this study provides new insights into how the deci-sion to go public is articulated in the literature. While previous studies on corporate finance have examined the decision to go public, they did not fully provide evidence on the determinants of IPOs among start-up firms; this was because their samples included privately held firms with long histories (e.g., Pagano et al. 1998; De Jong et al. 2012). Thus, previous studies have not sufficiently described the IPO process in the financial growth cycle of firms, and there is a paucity of empirical evidence on IPO decisions among start-up firms. Therefore, by focusing on start-up firms,
1603
1 3
Public or perish? From founding to initial public offering
we contribute to the literature on the determinants of an IPO. This study shed some light on the growth process from the founding of a firm to its IPO, which could provide valuable insights into the financial growth cycle of firms and create a link between entrepreneurship and corporate finance, including management studies. In practice, the findings of this study indicate that initial conditions, such as capital structure, affect the likelihood of an IPO. This study provides support for the path dependence hypothesis, and the findings of the study indicate that the extension of equity financing at the time of founding leads to a future IPO. Geroski et al. (2010) suggested that research on the effects of initial conditions on the post-entry perfor-mance of firms has implications for entrepreneurs and policymakers. For entrepre-neurs, these effects suggest that a great deal of care should be taken in preparing for the founding of firms. For policymakers, these effects suggest that financial support to foster start-up firms with growth potential—especially young IPO firms—would be needed depending on the circumstances of their birth. The extension of equity financing at the time of founding leads to a future IPO, and the inherent characteris-tics of firms may determine the likelihood of an IPO. In this sense, path dependence in financing can be observed in the growth cycle of firms. Initial conditions may determine the fate of start-up firms, just as a gene determines an individual’s traits and characteristics in biology.
Moreover, this study provides further policy implications. The type of start-up firms that go public early would be of interest not only to entrepreneurs but also to investors, including venture capitalists and business angels, who look to IPOs to diversify their investment portfolios. In particular, young IPO firms often attract policymakers because they are expected to stimulate future economic growth. To provide equity financing—more precisely, opportunities to access public equity mar-kets—for innovative and risky start-ups, junior stock markets have been introduced
Table 8 Treatment-effects estimators for the time to IPO: innovative and uncertain businesses
All figures are measured by the number of months. The IPWRA estimator is used. The outcome model is a function of E/F, MTB, and SUB following a Weibull distribution. The treatment model is a function of CAPEX, MTB, and the industry dummies (I_MANU, I_ICT, and I_SERV) following a logistic distribution. The censoring model is a function of SIZE, the industry dummies, and the entry cohort dummies following a Weibull distribution. The number of observations is 10,397SE indicates robust standard errors; ATE indicates average treatment effects; POM indicates potential-outcome means*** indicates 1% significance level
Covariate Coef. SE |z| 95% conf. interval
RD ATE −23.7 7.16 3.31*** −37.7 −9.67 POM 64.7 6.84 9.46*** 51.3 78.1
FLEX ATE −25.5 9.47 2.70*** −44.1 −6.97 POM 66.7 7.49 8.90*** 52.0 81.4
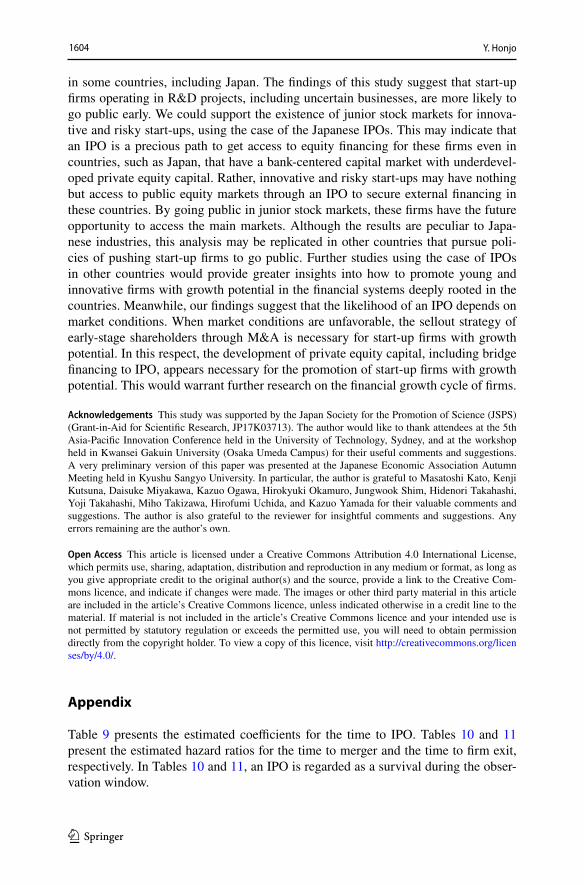
1604 Y. Honjo
1 3
in some countries, including Japan. The findings of this study suggest that start-up firms operating in R&D projects, including uncertain businesses, are more likely to go public early. We could support the existence of junior stock markets for innova-tive and risky start-ups, using the case of the Japanese IPOs. This may indicate that an IPO is a precious path to get access to equity financing for these firms even in countries, such as Japan, that have a bank-centered capital market with underdevel-oped private equity capital. Rather, innovative and risky start-ups may have nothing but access to public equity markets through an IPO to secure external financing in these countries. By going public in junior stock markets, these firms have the future opportunity to access the main markets. Although the results are peculiar to Japa-nese industries, this analysis may be replicated in other countries that pursue poli-cies of pushing start-up firms to go public. Further studies using the case of IPOs in other countries would provide greater insights into how to promote young and innovative firms with growth potential in the financial systems deeply rooted in the countries. Meanwhile, our findings suggest that the likelihood of an IPO depends on market conditions. When market conditions are unfavorable, the sellout strategy of early-stage shareholders through M&A is necessary for start-up firms with growth potential. In this respect, the development of private equity capital, including bridge financing to IPO, appears necessary for the promotion of start-up firms with growth potential. This would warrant further research on the financial growth cycle of firms.
Acknowledgements This study was supported by the Japan Society for the Promotion of Science (JSPS) (Grant-in-Aid for Scientific Research, JP17K03713). The author would like to thank attendees at the 5th Asia-Pacific Innovation Conference held in the University of Technology, Sydney, and at the workshop held in Kwansei Gakuin University (Osaka Umeda Campus) for their useful comments and suggestions. A very preliminary version of this paper was presented at the Japanese Economic Association Autumn Meeting held in Kyushu Sangyo University. In particular, the author is grateful to Masatoshi Kato, Kenji Kutsuna, Daisuke Miyakawa, Kazuo Ogawa, Hirokyuki Okamuro, Jungwook Shim, Hidenori Takahashi, Yoji Takahashi, Miho Takizawa, Hirofumi Uchida, and Kazuo Yamada for their valuable comments and suggestions. The author is also grateful to the reviewer for insightful comments and suggestions. Any errors remaining are the author’s own.
Open Access This article is licensed under a Creative Commons Attribution 4.0 International License, which permits use, sharing, adaptation, distribution and reproduction in any medium or format, as long as you give appropriate credit to the original author(s) and the source, provide a link to the Creative Com-mons licence, and indicate if changes were made. The images or other third party material in this article are included in the article’s Creative Commons licence, unless indicated otherwise in a credit line to the material. If material is not included in the article’s Creative Commons licence and your intended use is not permitted by statutory regulation or exceeds the permitted use, you will need to obtain permission directly from the copyright holder. To view a copy of this licence, visit http://creat iveco mmons .org/licen ses/by/4.0/.
Appendix
Table 9 presents the estimated coefficients for the time to IPO. Tables 10 and 11 present the estimated hazard ratios for the time to merger and the time to firm exit, respectively. In Tables 10 and 11, an IPO is regarded as a survival during the obser-vation window.
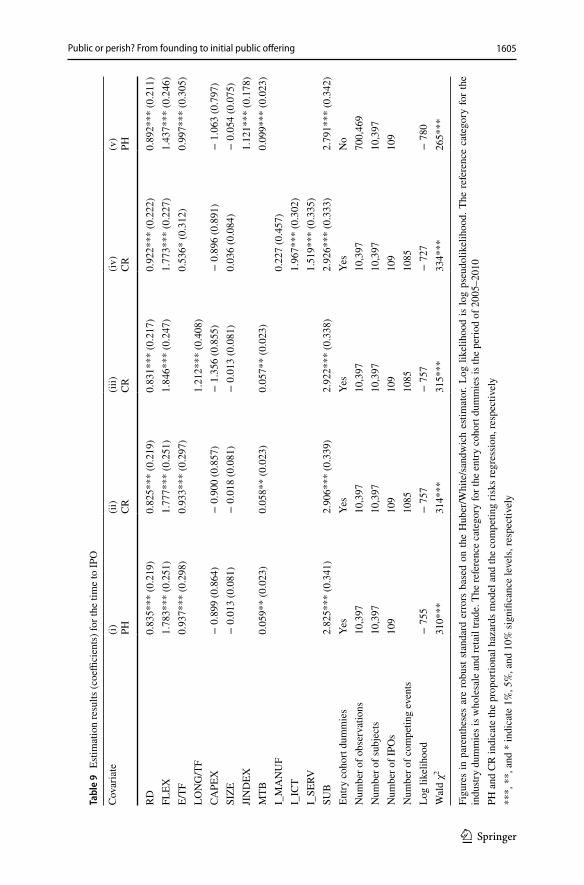
1605
1 3
Public or perish? From founding to initial public offering
Tabl
e 9
Esti
mat
ion
resu
lts (c
oeffi
cien
ts) f
or th
e tim
e to
IPO
Figu
res
in p
aren
thes
es a
re r
obus
t sta
ndar
d er
rors
bas
ed o
n th
e H
uber
/Whi
te/s
andw
ich
estim
ator
. Log
like
lihoo
d is
log
pseu
dolik
elih
ood.
The
ref
eren
ce c
ateg
ory
for
the
indu
stry
dum
mie
s is w
hole
sale
and
reta
il tra
de. T
he re
fere
nce
cate
gory
for t
he e
ntry
coh
ort d
umm
ies i
s the
per
iod
of 2
005–
2010
PH a
nd C
R in
dica
te th
e pr
opor
tiona
l haz
ards
mod
el a
nd th
e co
mpe
ting
risks
regr
essi
on, r
espe
ctiv
ely
***,
**,
and
* in
dica
te 1
%, 5
%, a
nd 1
0% si
gnifi
canc
e le
vels
, res
pect
ivel
y
Cov
aria
te(i) PH
(ii)
CR
(iii)
CR
(iv)
CR
(v)
PH
RD
0.83
5***
(0.2
19)
0.82
5***
(0.2
19)
0.83
1***
(0.2
17)
0.92
2***
(0.2
22)
0.89
2***
(0.2
11)
FLEX
1.78
3***
(0.2
51)
1.77
7***
(0.2
51)
1.84
6***
(0.2
47)
1.77
3***
(0.2
27)
1.43
7***
(0.2
46)
E/TF
0.93
7***
(0.2
98)
0.93
3***
(0.2
97)
0.53
6* (0
.312
)0.
997*
** (0
.305
)LO
NG
/TF
1.21
2***
(0.4
08)
CAPE
X−
0.8
99 (0
.864
)−
0.9
00 (0
.857
)−
1.3
56 (0
.855
)−
0.8
96 (0
.891
)−
1.0
63 (0
.797
)SI
ZE−
0.0
13 (0
.081
)−
0.0
18 (0
.081
)−
0.0
13 (0
.081
)0.
036
(0.0
84)
− 0
.054
(0.0
75)
JIN
DEX
1.12
1***
(0.1
78)
MTB
0.05
9**
(0.0
23)
0.05
8**
(0.0
23)
0.05
7**
(0.0
23)
0.09
9***
(0.0
23)
I_M
AN
UF
0.22
7 (0
.457
)I_
ICT
1.96
7***
(0.3
02)
I_SE
RV1.
519*
** (0
.335
)SU
B2.
825*
** (0
.341
)2.
906*
** (0
.339
)2.
922*
** (0
.338
)2.
926*
** (0
.333
)2.
791*
** (0
.342
)En
try c
ohor
t dum
mie
sYe
sYe
sYe
sYe
sN
oN
umbe
r of o
bser
vatio
ns10
,397
10,3
9710
,397
10,3
9770
0,46
9N
umbe
r of s
ubje
cts
10,3
9710
,397
10,3
9710
,397
10,3
97N
umbe
r of I
POs
109
109
109
109
109
Num
ber o
f com
petin
g ev
ents
1085
1085
1085
Log
likel
ihoo
d−
755
− 7
57−
757
− 7
27−
780
Wal
d χ2
310*
**31
4***
315*
**33
4***
265*
**
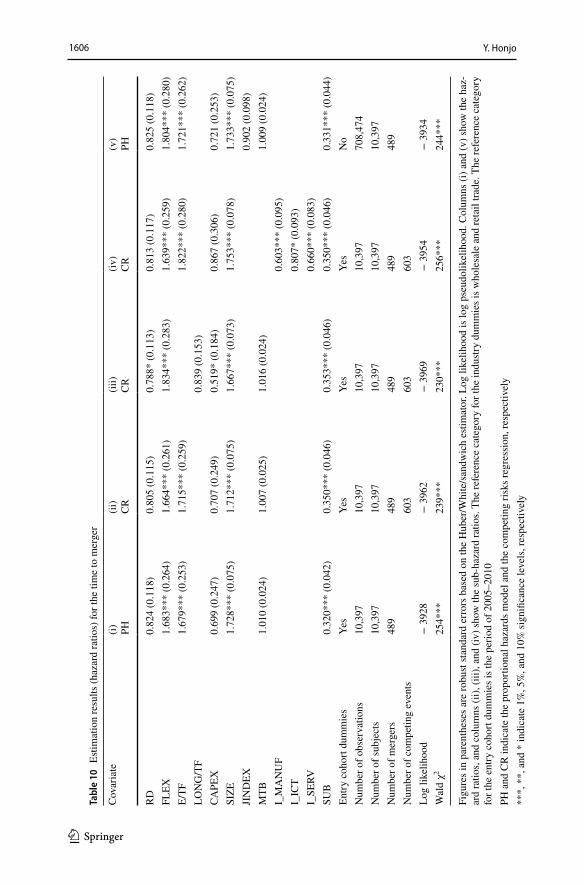
1606 Y. Honjo
1 3
Tabl
e 10
Es
timat
ion
resu
lts (h
azar
d ra
tios)
for t
he ti
me
to m
erge
r
Figu
res i
n pa
rent
hese
s are
robu
st st
anda
rd e
rror
s bas
ed o
n th
e H
uber
/Whi
te/s
andw
ich
estim
ator
. Log
like
lihoo
d is
log
pseu
dolik
elih
ood.
Col
umns
(i) a
nd (v
) sho
w th
e ha
z-ar
d ra
tios,
and
colu
mns
(ii),
(iii)
, and
(iv)
show
the
sub-
haza
rd ra
tios.
The
refe
renc
e ca
tego
ry fo
r the
indu
stry
dum
mie
s is w
hole
sale
and
reta
il tra
de. T
he re
fere
nce
cate
gory
fo
r the
ent
ry c
ohor
t dum
mie
s is t
he p
erio
d of
200
5–20
10PH
and
CR
indi
cate
the
prop
ortio
nal h
azar
ds m
odel
and
the
com
petin
g ris
ks re
gres
sion
, res
pect
ivel
y**
*, *
*, a
nd *
indi
cate
1%
, 5%
, and
10%
sign
ifica
nce
leve
ls, r
espe
ctiv
ely
Cov
aria
te(i) PH
(ii)
CR
(iii)
CR
(iv)
CR
(v)
PH
RD
0.82
4 (0
.118
)0.
805
(0.1
15)
0.78
8* (0
.113
)0.
813
(0.1
17)
0.82
5 (0
.118
)FL
EX1.
683*
** (0
.264
)1.
664*
** (0
.261
)1.
834*
** (0
.283
)1.
639*
** (0
.259
)1.
804*
** (0
.280
)E/
TF1.
679*
** (0
.253
)1.
715*
** (0
.259
)1.
822*
** (0
.280
)1.
721*
** (0
.262
)LO
NG
/TF
0.83
9 (0
.153
)CA
PEX
0.69
9 (0
.247
)0.
707
(0.2
49)
0.51
9* (0
.184
)0.
867
(0.3
06)
0.72
1 (0
.253
)SI
ZE1.
728*
** (0
.075
)1.
712*
** (0
.075
)1.
667*
** (0
.073
)1.
753*
** (0
.078
)1.
733*
** (0
.075
)JI
ND
EX0.
902
(0.0
98)
MTB
1.01
0 (0
.024
)1.
007
(0.0
25)
1.01
6 (0
.024
)1.
009
(0.0
24)
I_M
AN
UF
0.60
3***
(0.0
95)
I_IC
T0.
807*
(0.0
93)
I_SE
RV0.
660*
** (0
.083
)SU
B0.
320*
** (0
.042
)0.
350*
** (0
.046
)0.
353*
** (0
.046
)0.
350*
** (0
.046
)0.
331*
** (0
.044
)En
try c
ohor
t dum
mie
sYe
sYe
sYe
sYe
sN
oN
umbe
r of o
bser
vatio
ns10
,397
10,3
9710
,397
10,3
9770
8,47
4N
umbe
r of s
ubje
cts
10,3
9710
,397
10,3
9710
,397
10,3
97N
umbe
r of m
erge
rs48
948
948
948
948
9N
umbe
r of c
ompe
ting
even
ts60
360
360
3Lo
g lik
elih
ood
− 3
928
− 3
962
− 3
969
− 3
954
− 3
934
Wal
d χ2
254*
**23
9***
230*
**25
6***
244*
**
1607
1 3
Public or perish? From founding to initial public offering
References
Aalen OO (1978) Nonparametric inference for a family of counting processes. Ann Stat 6:701–726Akyol AC, Cooper T, Meoli M, Vismara S (2014) Do regulatory changes affect the underpricing of Euro-
pean IPOs? J Bank Finance 45:43–58Arrfelt M, Mannor M, Nahrgang JD, Christensen AL (2018) All risk-taking is not the same: examining
the competing effects of firm risk-taking with meta-analysis. Rev Manag Sci 12:621–660Arrow KJ (1962) Economic welfare and the allocation of resources for innovation. In: Nelson RR (ed)
The rate and direction of inventive activity: economic and social factors. Princeton University Press, Princeton, pp 609–625
Aslan H, Kumar P (2011) Lemons or cherries? Growth opportunities and market temptations in going public and private. J Financ Quant Anal 46:489–526
Aspelunda A, Berg-Utbya T, Skjevdal R (2005) Initial resources’ influence on new venture survival: a longitudinal study of new technology-based firms. Technovation 25:1337–1347
Audretsch DB (1995) Innovation and industry evolution. MIT Press, CambridgeAudretsch DB, Acs ZJ (eds) (2003) Handbook of entrepreneurship research. Kluwer Academic, BostonAudretsch DB, Bönte W, Keilbach M (2008) Entrepreneurship capital and its impact on knowledge diffu-
sion and economic performance. J Bus Ventur 23:687–698Audretsch DB, Lehmann EE (2013) Corporate governance in newly listed companies. In: Levis M, Vis-
mara S (eds) Handbook of research on IPOs. Edward Elgar Publishing, Cheltenham, pp 552–567
Table 11 Estimation results (hazard ratios) for the time to firm exit
Figures in parentheses are robust standard errors based on the Huber/White/sandwich estimator. Log likelihood is log pseudolikelihood. The reference category for the industry dummies is wholesale and retail trade. The reference category for the entry cohort dummies is the period of 2009–2010PH indicates the proportional hazards model***, **, and * indicate 1%, 5%, and 10% significance levels, respectively
Covariate (i)PH
(ii)PH
(iii)PH
(iv)PH
RD 1.046 (0.094) 1.042 (0.093) 1.049 (0.094) 1.053 (0.095)FLEX 1.557*** (0.184) 1.587*** (0.186) 1.546*** (0.184) 1.696*** (0.199)E/TF 1.112 (0.108) 1.172 (0.117) 1.144 (0.111)LONG/TF 0.973 (0.121)CAPEX 0.702 (0.152) 0.663* (0.140) 0.787 (0.172) 0.720 (0.156)SIZE 1.418*** (0.040) 1.410*** (0.039) 1.440*** (0.041) 1.419*** (0.040)JINDEX 0.801*** (0.060)MTB 1.007 (0.016) 1.009 (0.016) 1.003 (0.016)I_MANUF 0.767** (0.081)I_ICT 0.843** (0.068)I_SERV 0.777*** (0.064)SUB 0.300*** (0.028) 0.300*** (0.028) 0.298*** (0.027) 0.310*** (0.029)Entry cohort dummies Yes Yes Yes NoNumber of observations 10,397 10,397 10,397 708,474Number of subjects 10,397 10,397 10,397 10,397Number of firm exits 1092 1092 1092 1092Log likelihood − 8807 − 8807 − 8800 − 8820Wald χ2 314*** 313*** 320*** 293***
1608 Y. Honjo
1 3
Audretsch DB, Mahmood T (1995) New firm survival: new results using a hazard function. Rev Econ Stat 60:441–450
Bade M (2018) Determinants of IPO-firms’ merger appetite. Rev Manag Sci. https ://doi.org/10.1007/s1184 6-018-0291-2
Bayar O, Chemmanur TJ (2011) IPOs versus acquisitions and the valuation premium puzzle: a theory of exit choice by entrepreneurs and venture capitalists. J Financ Quant Anal 46:1755–1793
Berger AN, Udell GF (1995) Relationship lending and lines of credit in small firm finance. J Bus 68:351–381
Berger AN, Udell GF (1998) The economies of small business finance the roles of private equity and debt markets in the financial growth cycle. J Bank Finance 22:613–673
Bertoni F, Colombo MG, Quas A (2015) The patterns of venture capital investment in Europe. Small Bus Econ 45:543–560
Bhamra HS, Kuehn L-A, Strebulaev IA (2010) The aggregate dynamics of capital structure and macro-economic risk. Rev Financ Stud 23:4187–4241
Binks MR, Ennew CT (1996) Growing firms and the credit constraint. Small Bus Econ 8:17–25Binks MR, Ennew CT, Reed GV (1992) Information asymmetries and the provision of finance to small
firms. Int Small Bus J 11:35–46Black BS, Gilson RJ (1998) Venture capital and the structure of capital markets: banks versus stock mar-
kets. J Financ Econ 47:243–277Block JH, Colombo MG, Cumming DJ, Vismara S (2018) New players in entrepreneurial finance and
why they are there. Small Bus Econ 50:239–250Bodnaruk A, Kandel E, Massa M, Simonov A (2008) Shareholder diversification and the decision to go
public. Rev Financ Stud 21:2779–2824Brau JC, Fawcett SE (2006) Initial public offerings: an analysis of theory and practice. J Finance
61:399–436Brau JC, Francis B, Kohers N (2003) The choice of IPO versus takeover: empirical evidence. J Bus
76:583–612Campbell TS (1979) Optimal investment financing decisions and the value of confidentiality. J Financ
Quant Anal 14:913–924Carpenter RE, Petersen BC (2002a) Capital market imperfections, high-tech investment, and new equity
financing. Econ J 112:F54–F72Carpenter RE, Petersen BC (2002b) Is the growth of small firms constrained by internal finance? Rev
Econ Stat 84:298–309Cattaneo M, Meoli M, Vismara S (2015) Financial regulation and IPOs: evidence from the history of the
Italian stock market. J Corp Finance 31:116–131Chemmanur TJ, He S, Nandy DK (2010) The going-public decision and the product market. Rev Financ
Stud 23:1855–1908Colombo MG, Cumming DJ, Vismara S (2016) Governmental venture capital for innovative young firms.
J Technol Transf 41:10–24Colombo MG, Grilli L (2007) Funding gaps? Access to bank loans by high-tech start-ups. Small Bus
Econ 29:25–46Cooper AC, Gimeno-Gascon FJ, Woo CY (1994) Initial human and financial capital as predictors of new
venture performance. J Bus Ventur 9:371–395Cox DR (1972) Regression models and life-tables (with discussion). J R Stat Soc B 34:187–220Czarnitzki D, Hottenrott H (2011) R&D investment and financing constraints of small and medium-sized
firms. Small Bus Econ 36:65–83De Jong A, Huijgen CA, Marra TA, Roosenboom P (2012) Why do firms go public? The role of the prod-
uct market. J Bus Finance Acc 39:165–192Fine JP, Gray RJ (1999) A proportional hazards model for the subdistribution of a competing risk. J Am
Stat Assn 94:496–509Gans JS, Hsu DH, Stern S (2002) When does start-up innovation spur the gale of creative destruction?
Rand J Econ 33:571–586Gao X, Ritter JR, Zhu Z (2013) Where have all the IPOs gone? J Financ Quant Anal 48:1663–1692Gerakos J, Lang M, Maffett M (2013) Post-listing performance and private sector regulation: the experi-
ence of London’s Alternative Investment Market. J Acc Econ 56:189–215Geroski PA, Mata J, Portugal P (2010) Founding conditions and the survival of new firms. Strateg Manag
J 31:510–529

1609
1 3
Public or perish? From founding to initial public offering
Giot P, Schwienbacher A (2007) IPOs, trade sales and liquidations: modelling venture capital exits using survival analysis. J Bank Finance 31:679–702
Granier C, Revest V, Sapio A (2019) SMEs and junior stock markets: a comparison between European and Japanese markets. J Innov Econ Manag 29:43–67
Gray RJ (1988) A class of k-sample tests for comparing the cumulative incidence of a competing risk. Ann Stat 16:1141–1154
Hall BH (2002) The financing of research and development. Oxf Rev Econ Policy 18:35–51Harhoff D, Stahl K, Woywode M (1998) Legal form, growth and exit of West German firms—empirical
results for manufacturing. J Ind Econ 46:453–488Helm R, Mauroner O (2007) Success of research-based spin-offs. State-of-the-art and guidelines for fur-
ther research. Rev Manag Sci 1:237–270Helwege J, Liang N (2004) Initial public offerings in hot and cold markets. J Financ Quant Anal
39:541–569Henrekson M, Johansson D (2010) Gazelles as job creators: a survey and interpretation of the evidence.
Small Bus Econ 35:227–244Himmelberg CP, Petersen BC (1994) R&D and internal finance: a panel study of small firms in high-tech
industries. Rev Econ Stat 76:38–51Holmström B, Tirole J (1993) Market liquidity and performance monitoring. J Polit Econ 101:678–709Honjo Y (2001) Do innovative start-ups really wish to go public? Evidence from Japanese electrical man-
ufacturing companies. Appl Econ Lett 8:493–497Honjo Y (2015) Why are entrepreneurship levels so low in Japan? Jpn World Econ 36:88–101Honjo Y, Kato M (2019) Do initial financial conditions determine the exit routes of start-up firms? J Evol
Econ 29:1119–1147Honjo Y, Kato M, Okamuro H (2014) R&D investment of start-up firms: does founders’ human capital
matter? Small Bus Econ 42:207–220Honjo Y, Kutsuna K (2010) An empirical analysis of the initial public offering intention: evidence from
start-up firms in Japan. Corp Owner Contr 7:127–141Honjo Y, Nagaoka S (2018) Initial public offering and financing of biotechnology start-ups: evidence
from Japan. Res Policy 47:180–193Huyghebaert N, Van de Gucht L, Van Hulle C (2007) The choice between bank debt and trade credit in
business start-ups. Small Bus Econ 29:435–452Ibbotson R, Jaffe J (1975) Hot issue markets. J. Finance 30:1027–1042Kamien MI, Schwartz NL (1978) Self-financing of an R and D project. Am Econ Rev 68:252–261Koski H, Pajarinen M (2013) The role of business subsidies in job creation of start-ups, gazelles and
incumbents. Small Bus Econ 41:195–214Lerner J (1994) Venture capitalists and the decision to go public. J Financ Econ 35:293–316Mata J, Portugal P (1994) Life duration of new firms. J Ind Econ 42:227–245Mata J, Portugal P, Guimarães P (1995) The survival of new plants: start-up conditions and post-entry
evolution. Int J Ind Organ 13:413–614Matsuda S, Vanderwerf P, Scarbrough P (1994) A comparison of Japanese and U.S. firms completing
initial public offerings. J Bus Ventur 9:205–222Müller E, Zimmermann V (2009) The importance of equity finance for R&D activity. Small Bus Econ
33:303–318Nelson W (1972) Theory and applications of hazard plotting for censored failure data. Technometrics
14:945–966Pagano M, Panetta F, Zingales L (1998) Why do companies go public? An empirical analysis. J Finance
53:27–64Petersen MA, Rajan RG (1994) The benefits of lending relationships: evidence from small business data.
J Finance 49:3–37Poulsen AB, Stegemoller M (2008) Moving from private to public ownership: selling out to public firms
versus initial public offerings. Financ Manag 37:81–101Puri M, Zarutskie R (2012) On the life cycle dynamics of venture-capital- and non-venture-capital-
financed firms. J Finance 67:2247–2293Rajan RG (1992) Insiders and outsiders: the choice between informed and arm’s-length debt. J Finance
47:1367–1400Ritter JR (1984) The “hot issue” market of 1980. J Bus 57:215–240Ritter JR, Signori A, Vismara S (2013) Economies of scope and IPO activity in Europe. In: Levis M,
Vismara S (eds) Handbook of research on IPOs. Edward Elgar Publishing, Cheltenham, pp 11–34
1610 Y. Honjo
1 3
Ritter JR, Welch I (2002) A review of IPO activity, pricing, and allocations. J Finance 62:1759–1828Röell A (1996) The decision to go public: an overview. Eur Econ Rev 40:1071–1081Signori A, Vismara S (2018) M&A synergies and trends in IPOs. Technol Forecast Soc Change
127:141–153Small and Medium Enterprise Agency (2009) White paper on small and medium enterprise in Japan,
2009. Japan Small Business Research Institute, TokyoTakahashi H (2018) Affiliation ties and underwriter selection. Small Bus Econ 50:325–338Takahashi H, Yamada K (2015) IPOs, growth, and the impact of relaxing listing requirements. J Bank
Finance 59:505–519Venture Enterprise Center (2015) VEC Yearbook 2015: annual report on Japanese Startup business 2018.
Venture Enterprise Center, TokyoVismara S (2014) Patents, R&D investments and post-IPO strategies. Rev Manag Sci 8:419–435Vismara S, Paleari S, Ritter JR (2012) Europe’s second markets for small companies. Eur Financ Manag
18:352–388Yamada K (2013) How bank health affects the capital structure and performance of IPO firms: evidence
from the Japanese financial crisis in the 1990s. In: Levis M, Vismara S (eds) Handbook of research on IPOs. Edward Elgar Publishing, Cheltenham, pp 552–567
Yosha O (1995) Information disclosure costs and the choice of financing source. J Financ Intermed 4:3–20
Zingales L (1995) Insider ownership and the decision to go public. Rev Econ Stud 62:425–448
Publisher’s Note Springer Nature remains neutral with regard to jurisdictional claims in published maps and institutional affiliations.