public opinion in the european...
TRANSCRIPT

Standard Eurobarometer 80
Autumn 2013
PUBLIC OPINION IN THE EUROPEAN UNION
FIRST RESULTS
Fieldwork: November 2013
Publication: December 2013
This survey has been requested and co-ordinated by the European Commission,
Directorate-General for Communication.
http://ec.europa.eu/public_opinion/index_en.htm
This document does not represent the point of view of the European Commission. The interpretations and opinions contained in it are solely those of the authors.
Standard Eurobarometer 80 / Autumn 2013 – TNS opinion & social

Standard Eurobarometer 80 Autumn 2013
First results
Survey conducted by TNS opinion & social at the request of the European Commission,
Directorate-General for Communication
Survey co-ordinated by the European Commission, Directorate-General for Communication
(DG COMM “Strategy, Corporate Communication Actions and Eurobarometer” Unit)

STANDARD EUROBAROMETER 80 FIRST RESULTS – AUTUMN 2013
1
TABLE OF CONTENTS
INTRODUCTION .................................................................................................. 3
I. EUROPEANS AND POLITICAL INSTITUTIONS ............................................................. 5
1. TRUST IN NATIONAL GOVERNMENTS AND PARLIAMENTS, AND IN THE EUROPEAN UNION: TREND ............................................................................................................... 5
2. THE IMAGE OF THE EUROPEAN UNION: TREND ...................................................... 6
3. MY VOICE COUNTS IN THE EUROPEAN UNION: TREND ............................................. 7
4. MY VOICE COUNTS IN THE EUROPEAN UNION: NATIONAL RESULTS ............................ 8
5. THE FUTURE OF THE EUROPEAN UNION: TREND ..................................................... 9
6. THE FUTURE OF THE EUROPEAN UNION: NATIONAL RESULTS .................................. 10
II. THE MAIN CONCERNS OF EUROPEANS ................................................................... 11
1. MAIN CONCERNS AT NATIONAL LEVEL ............................................................... 11
2. MAIN CONCERNS AT NATIONAL LEVEL: NATIONAL RESULTS .................................... 12
3. MAIN CONCERNS AT PERSONAL LEVEL ............................................................... 13
4. MAIN CONCERNS AT PERSONAL LEVEL: NATIONAL RESULTS .................................... 14
5. MAIN CONCERNS AT EUROPEAN LEVEL ............................................................... 15
6. MAIN CONCERNS AT EUROPEAN LEVEL: NATIONAL RESULTS .................................... 16
III. EUROPEANS AND THE ECONOMIC SITUATION .......................................................... 17
1. ASSESSMENT OF THE CURRENT SITUATION: GENERAL AND PERSONAL ASPECTS ........... 17
2. CURRENT SITUATION OF THE ECONOMY AT NATIONAL LEVEL: TREND ......................... 18
3. CURRENT SITUATION OF THE ECONOMY AT NATIONAL LEVEL: NATIONAL RESULTS AND
EVOLUTION ....................................................................................................... 19
4. EXPECTATIONS FOR THE NEXT TWELVE MONTHS: GENERAL AND PERSONAL ASPECTS ..... 21
5. EXPECTATIONS FOR THE NEXT TWELVE MONTHS FOR THE ECONOMY AT NATIONAL LEVEL: NATIONAL RESULTS AND EVOLUTION ....................................................................... 22
IV. THE CRISIS .................................................................................................... 24
1. SUPPORT FOR THE EUROPEAN ECONOMIC AND MONETARY UNION WITH A SINGLE
CURRENCY, THE EURO: TREND ............................................................................... 24
2. SUPPORT FOR THE EUROPEAN ECONOMIC AND MONETARY UNION WITH A SINGLE
CURRENCY, THE EURO: NATIONAL RESULTS ............................................................... 25
3. IMPACT OF THE CRISIS ON JOBS: TREND ............................................................ 26
4. IMPACT OF THE CRISIS ON JOBS: NATIONAL RESULTS AND EVOLUTIONS .................... 27
5. WHAT IS THE MOST EFFECTIVE LEVEL AT WHICH TO TACKLE THE CRISIS? ................... 29
V. EUROPE 2020 .............................................................................................. 30
1. PERCEIVED IMPORTANCE OF THE EUROPE 2020 STRATEGY INITIATIVES ................... 30
2. THE EUROPE 2020 TARGETS .......................................................................... 32
3. OVERALL .................................................................................................... 33

STANDARD EUROBAROMETER 80 FIRST RESULTS – AUTUMN 2013
2
VI. EUROPEAN CITIZENSHIP ............................................................................ 34
1. FEELING LIKE A CITIZEN OF THE EUROPEAN UNION: TREND ................................... 34
2. FEELING LIKE A CITIZEN OF THE EUROPEAN UNION: NATIONAL RESULTS ................... 34
3. KNOWLEDGE OF RIGHTS : TRENDS .................................................................... 35
4. KNOWLEDGE OF RIGHTS : NATIONAL RESULTS ..................................................... 36
5. INFORMATION ABOUT EU CITIZENS' RIGHTS : TRENDS .......................................... 36
6. INFORMATION ABOUT EU CITIZENS' RIGHTS : NATIONAL RESULTS ........................... 37
7. MOST POSITIVE RESULTS OF THE EU ................................................................ 38
CONCLUSION .................................................................................................... 39
ANNEXES
TECHNICAL SPECIFICATIONS

STANDARD EUROBAROMETER 80 FIRST RESULTS – AUTUMN 2013
3
INTRODUCTION
This report presents the first results of the Standard Eurobarometer 80 survey, which was carried out between 2 and 17 November 2013 in 34 countries or territories1: the 28 European Union Member States2, the five candidate countries (the Former Yugoslav Republic of Macedonia, Turkey, Iceland, Montenegro and Serbia), and the Turkish Cypriot Community in the part of the country that is not controlled by the government of the Republic of Cyprus.
This “First results” report provides a selection of data on various topics such as the economy and the European political situation. It is published jointly with the results of the Standard Eurobarometer questions on the economic crisis and other political trends in the EU, which are set out in an annex.
The previous Standard Eurobarometer survey of spring 2013 (EB79) was marked by relatively stable indicators regarding the evaluation of the current economic situation, while pessimism for the next twelve months was in decline.
A few days after the beginning of the fieldwork for the present survey, the autumn 2013 forecasts were published by the European Commission3. Growth in the second half of 2013 is expected to stand at 0.5% compared to the same period in 2012, representing GDP growth for the whole year 2013 of 0% in the EU, and –0.4% in the euro area. In 2014, economic activity is forecast to expand by 1.4% in the EU and 1.1 % in the euro area. Unemployment statistics were published on 31 October 20134. In September 2013, the unemployment rate in the EU28 had remained stable since August 2013 but had risen since September 2012, from 11.6% to 12.2% in the euro area and from 10.6% to 11% in the EU28.
Since the Standard Eurobarometer survey of spring 2013 (EB79), national elections have taken place in Germany, Austria, Luxembourg and the Czech Republic. Negotiations on the composition of the governments in these four countries were on-going at the time of the fieldwork.
This report focuses on the results obtained in the 28 EU Member States and is divided into six parts. The first part analyses how Europeans perceive their political institutions: national governments and parliaments, and the EU and its institutions. The second part looks at the main concerns of Europeans at personal, national and European levels, and at their expectations for the next twelve months. The report then considers how respondents perceive the current economic situation, while the fourth part is devoted to the euro and the issues raised by the crisis. The report next examines the way in which Europeans perceive the various initiatives of the Europe 2020 strategy and whether they think that the European Union is going in the right direction to emerge from the crisis. In a final part, the report looks at European citizenship.
As these questions have been asked in previous Standard Eurobarometer surveys we are able to analyse trends in opinion. 1 Please consult the technical specifications for the exact fieldwork dates in each Member State 2 It is the first Standard Eurobarometer carried out since Croatia joined the EU on 1 July 2013. Therefore, the EU results presented in this report represent the average results for the 28 Member States 3 http://ec.europa.eu/economy_finance/eu/forecasts/2013_autumn_forecast_en.htm, published 5 November 2013 4 http://epp.eurostat.ec.europa.eu/cache/ITY_PUBLIC/3-31102013-BP/EN/3-31102013-BP-EN.PDF
STANDARD EUROBAROMETER 80 FIRST RESULTS – AUTUMN 2013
4
The methodology used is that of the Eurobarometer surveys carried out by the Directorate-General for Communication (“Strategy, Corporate Communication Actions and Eurobarometer” Unit)5. A technical note concerning the interviews conducted by the member institutes of the TNS Opinion & Social network is annexed to this report. It also specifies the confidence intervals6.
In this report, the following abbreviations are used:
ABBREVIATIONS BE Belgium LV Latvia CZ Czech Republic LU Luxembourg BG Bulgaria HU Hungary DK Denmark MT Malta DE Germany NL The Netherlands EE Estonia AT Austria EL Greece PL Poland ES Spain PT Portugal FR France RO Romania HR Croatia SI Slovenia IE Ireland SK Slovakia IT Italy FI Finland CY Republic of Cyprus*** SE Sweden LT Lithuania UK The United Kingdom
CY (tcc) Turkish Cypriot Community EU28 European Union – weighted average for the 28 Member States
TR Turkey EURO AREA BE, FR, IT, LU, DE, AT, ES, PT, IE, NL, FI, EL, EE, SI, CY,
MT, SK
MK Former Yugoslav Republic of Macedonia ****
NON-EURO AREA
BG, CZ, DK, LV, LT, HU, PL, RO, SE, UK, HR
IS Iceland
ME Montenegro
RS Serbia
*** Cyprus as a whole is one of the 28 European Union Member States. However, the “acquis communautaire” has been suspended in the part of the country which is not controlled by the government of the Republic of Cyprus. For practical reasons, only the interviews carried out in the part of the country controlled by the government of the Republic of Cyprus are included in the “CY” category and in the EU28 average. The interviews carried out in the part of the country that is not controlled by the government of the Republic of Cyprus are included in the “CY(tcc)” [tcc: Turkish Cypriot Community category]
**** Provisional abbreviation which in no way prejudges the definitive name of this country, which will be agreed once the current negotiations at the United Nations have been completed
* * * * *
We wish to thank all the people interviewed throughout Europe
who took the time to take part in this survey. Without their active participation, this survey would not have been possible.
5 http://ec.europa.eu/public_opinion/index_en.htm 6 The results tables are annexed. It should be noted that the total of the percentages indicated in the tables in this report may exceed 100% when the respondent was able to choose several answers to the same question

STANDARD EUROBAROMETER 80 FIRST RESULTS – AUTUMN 2013
5
I. EUROPEANS AND POLITICAL INSTITUTIONS
1. TRUST IN NATIONAL GOVERNMENTS AND PARLIAMENTS, AND IN THE
EUROPEAN UNION: TREND
While trust in national political institutions continues to decrease (23%, -2 percentage points since spring 2013 for national governments, 25%, -1 for national parliaments), trust in the European Union is at a relatively higher level and remains unchanged (31%). The proportions of Europeans who tend not to trust national governments (72%, +1) and national parliaments (69%, +1) have increased, while the number of respondents who do not trust the European Union has fallen (58%, -2).

STANDARD EUROBAROMETER 80 FIRST RESULTS – AUTUMN 2013
6
2. THE IMAGE OF THE EUROPEAN UNION: TREND
A relative majority of Europeans have a neutral image of the EU (39%, unchanged since spring 2013). However, the proportion of respondents for whom the EU conjures up a positive image has risen slightly (31%, +1) while there has been a slight decrease in the number of Europeans with a negative image of the EU (28%, -1).

STANDARD EUROBAROMETER 80 FIRST RESULTS – AUTUMN 2013
7
3. MY VOICE COUNTS IN THE EUROPEAN UNION: TREND
Two-thirds of Europeans consider that their voice does not count in the EU (66%, -1 percentage point since spring 2013). Despite a 1-point increase since spring 2013, the proportion of Europeans considering that their voice counts in the EU still represents less than three Europeans in ten (29%).

STANDARD EUROBAROMETER 80 FIRST RESULTS – AUTUMN 2013
8
4. MY VOICE COUNTS IN THE EUROPEAN UNION: NATIONAL RESULTS
Respondents in Denmark stand out from the rest of Europeans: an absolute majority of them believe that their voice counts in the EU (57% vs. 41%). 40% or more of respondents also share this view in Belgium (47%), Sweden (47%), Malta (46%), Croatia (42%), Luxembourg (42%), Germany (41%) and Netherlands (40%). However, absolute majorities of respondents believe that their voice does not count in the EU in 26 countries, in proportions that vary from 50% in Sweden and 51% in Belgium, up to 86% in both Cyprus and Greece. In Malta, citizens are evenly divided: 46% think that their voice counts, while 46% disagree with this statement.

STANDARD EUROBAROMETER 80 FIRST RESULTS – AUTUMN 2013
9
5. THE FUTURE OF THE EUROPEAN UNION: TREND
More than half of Europeans are optimistic about the future of the EU (51%, +2 percentage points since spring 2013). Conversely, pessimism has decreased (43%, -3). Eight percentage points now separate optimists and pessimists, which represents the largest difference since spring 2011 (EB75).

STANDARD EUROBAROMETER 80 FIRST RESULTS – AUTUMN 2013
10
6. THE FUTURE OF THE EUROPEAN UNION: NATIONAL RESULTS
In 20 countries, majorities of respondents say that they are optimistic about the future of the EU (up from 19 countries in spring 2013). There are now six countries where at least two-thirds of respondents are optimistic about the future of the EU: Denmark, which was the only one in this position in spring 2013 (75%, +3), is now joined by Ireland (67%, +9), Malta (67%, +4), Poland (66%, +3), Estonia (66%, +2) and Lithuania (66%, +2). Overall, optimism has risen in 22 Member States: in addition to the 9-point increase seen in Ireland, steep increases are also seen in Spain (48%, +8), and Czech Republic (48%, +6). Conversely, pessimism is the majority view in eight Member States: Greece, Cyprus, Portugal, France, Italy, Hungary, the UK and Czech Republic. Optimism has decreased in four Member States: France (40%, -4), Italy (40%, -4), Austria (47%, -1) and Greece (29%, -1).
STANDARD EUROBAROMETER 80 FIRST RESULTS – AUTUMN 2013
11
II. THE MAIN CONCERNS OF EUROPEANS
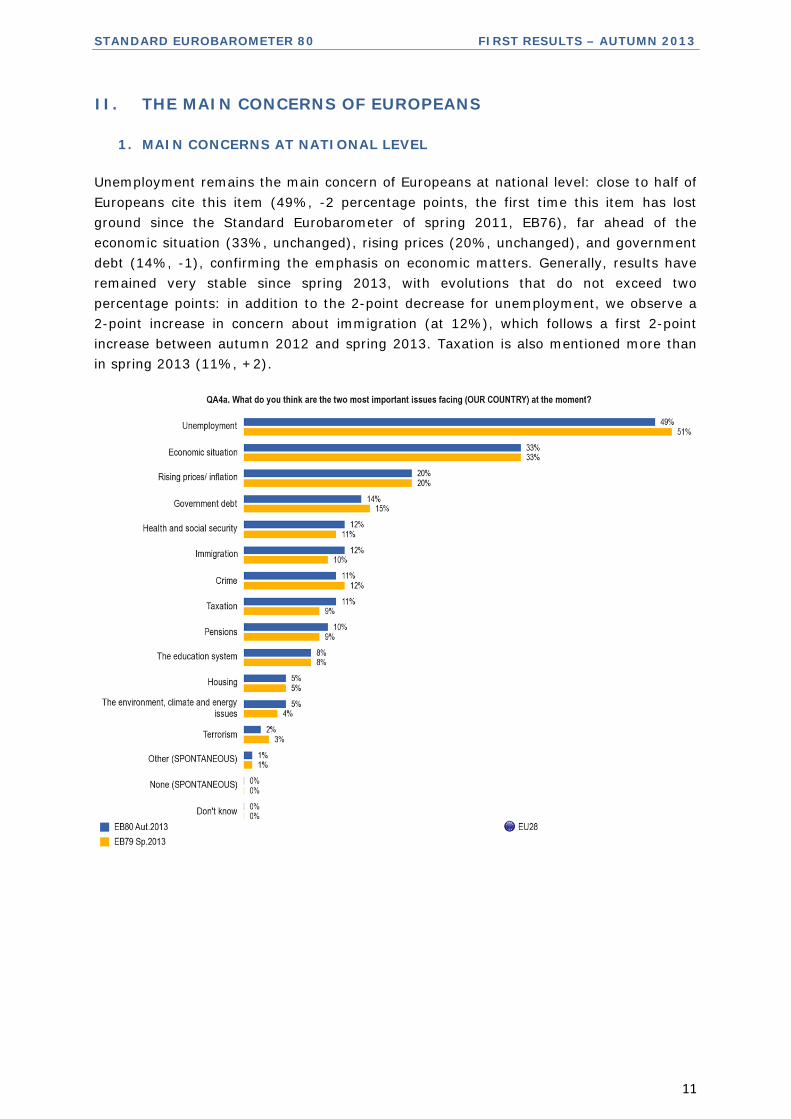
1. MAIN CONCERNS AT NATIONAL LEVEL
Unemployment remains the main concern of Europeans at national level: close to half of Europeans cite this item (49%, -2 percentage points, the first time this item has lost ground since the Standard Eurobarometer of spring 2011, EB76), far ahead of the economic situation (33%, unchanged), rising prices (20%, unchanged), and government debt (14%, -1), confirming the emphasis on economic matters. Generally, results have remained very stable since spring 2013, with evolutions that do not exceed two percentage points: in addition to the 2-point decrease for unemployment, we observe a 2-point increase in concern about immigration (at 12%), which follows a first 2-point increase between autumn 2012 and spring 2013. Taxation is also mentioned more than in spring 2013 (11%, +2).

STANDARD EUROBAROMETER 80 FIRST RESULTS – AUTUMN 2013
12
2. MAIN CONCERNS AT NATIONAL LEVEL: NATIONAL RESULTS
In a large majority of Member States, respondents consider unemployment as the most important problem facing their country: despite the slight decrease in mentions of unemployment at EU level, it is now the most cited item in 22 countries, whereas this was the case in 21 countries in spring 2013. The economic situation is the main concern in the Netherlands (53%) and Romania (41%). Inflation comes first in Estonia (50%), Lithuania (40%) and Germany (25%), where government debt is no longer the main concern for the first time since the item was first asked in autumn 20107. Malta continues to stand out from the other Member States, being the only country where the most important concern is not directly related to the economy (immigration, 63%, following a 34-point increase), and where unemployment is not one of the three most mentioned items.
7 Standard Eurobarometer 74

STANDARD EUROBAROMETER 80 FIRST RESULTS – AUTUMN 2013
13
3. MAIN CONCERNS AT PERSONAL LEVEL
The main personal concerns of Europeans have remained fairly stable since spring 2013: following the 3-point fall measured in spring 2013, rising prices/inflation continues to lose some ground, but is still by far the main personal concern (40%, -1). Unemployment registers the only 2-point evolution since spring 2013 (20%, -2). Other items remain unchanged or almost unchanged (1-point change maximum).
STANDARD EUROBAROMETER 80 FIRST RESULTS – AUTUMN 2013
14
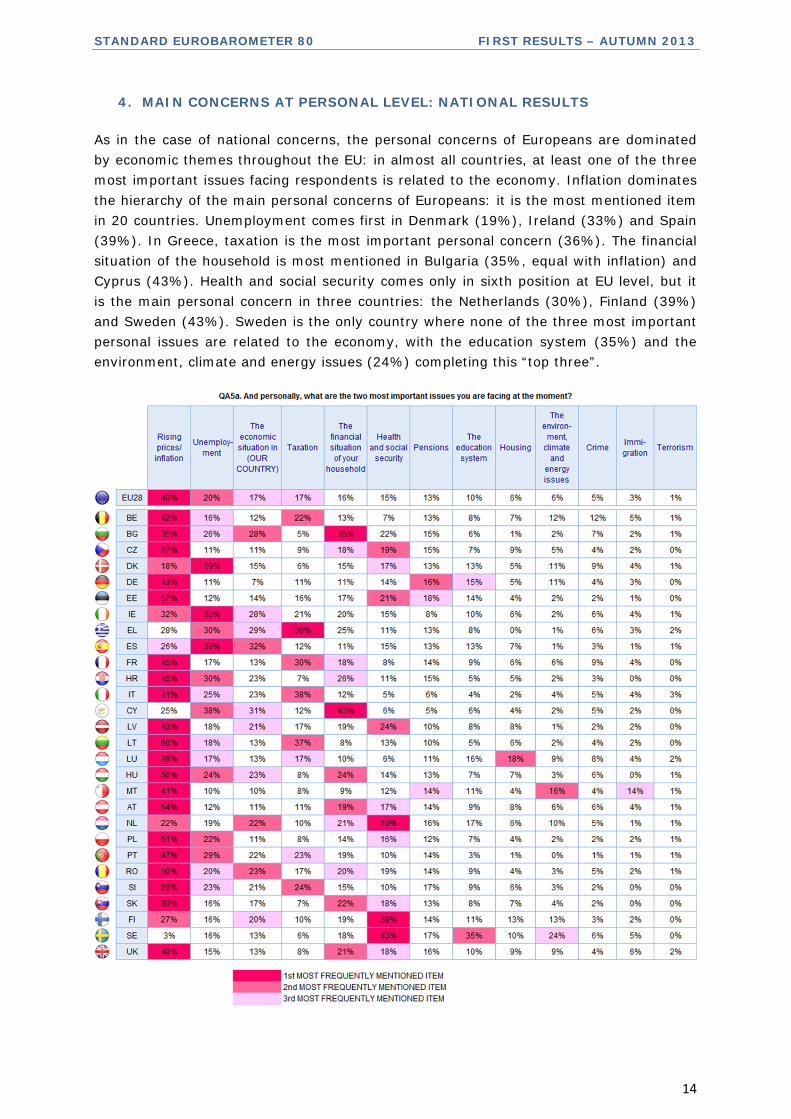
4. MAIN CONCERNS AT PERSONAL LEVEL: NATIONAL RESULTS
As in the case of national concerns, the personal concerns of Europeans are dominated by economic themes throughout the EU: in almost all countries, at least one of the three most important issues facing respondents is related to the economy. Inflation dominates the hierarchy of the main personal concerns of Europeans: it is the most mentioned item in 20 countries. Unemployment comes first in Denmark (19%), Ireland (33%) and Spain (39%). In Greece, taxation is the most important personal concern (36%). The financial situation of the household is most mentioned in Bulgaria (35%, equal with inflation) and Cyprus (43%). Health and social security comes only in sixth position at EU level, but it is the main personal concern in three countries: the Netherlands (30%), Finland (39%) and Sweden (43%). Sweden is the only country where none of the three most important personal issues are related to the economy, with the education system (35%) and the environment, climate and energy issues (24%) completing this “top three”.
STANDARD EUROBAROMETER 80 FIRST RESULTS – AUTUMN 2013
15
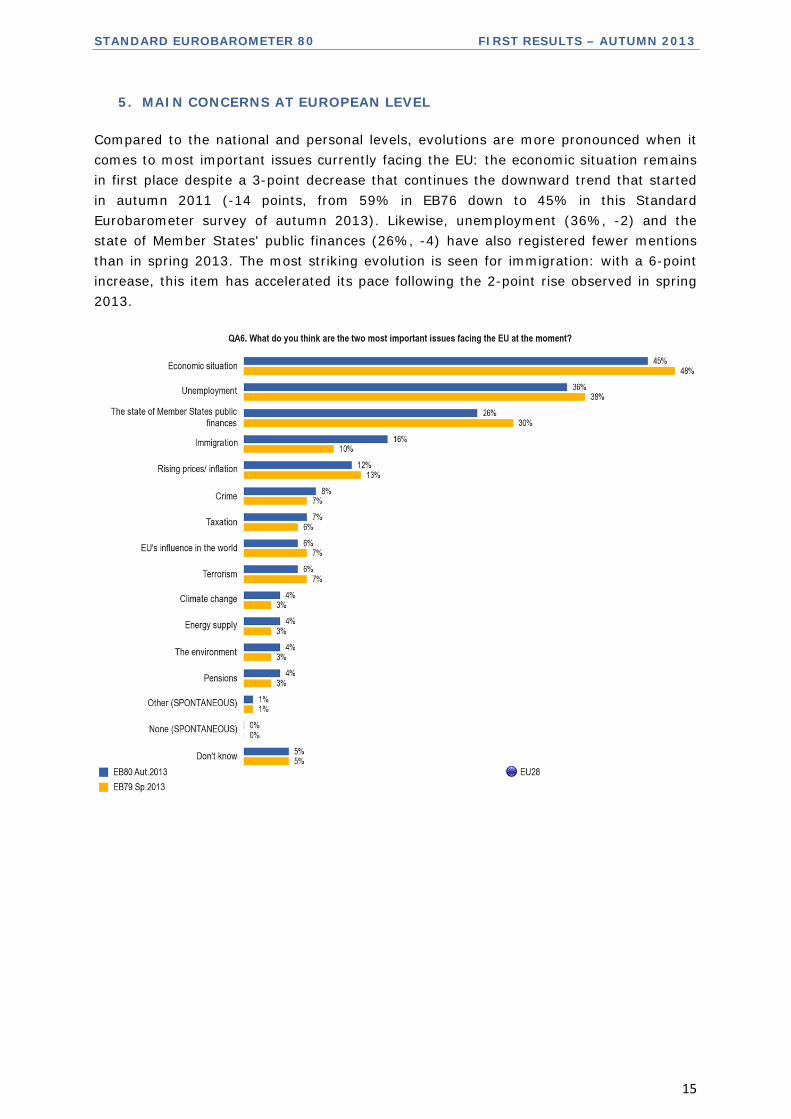
5. MAIN CONCERNS AT EUROPEAN LEVEL
Compared to the national and personal levels, evolutions are more pronounced when it comes to most important issues currently facing the EU: the economic situation remains in first place despite a 3-point decrease that continues the downward trend that started in autumn 2011 (-14 points, from 59% in EB76 down to 45% in this Standard Eurobarometer survey of autumn 2013). Likewise, unemployment (36%, -2) and the state of Member States' public finances (26%, -4) have also registered fewer mentions than in spring 2013. The most striking evolution is seen for immigration: with a 6-point increase, this item has accelerated its pace following the 2-point rise observed in spring 2013.

STANDARD EUROBAROMETER 80 FIRST RESULTS – AUTUMN 2013
16
6. MAIN CONCERNS AT EUROPEAN LEVEL: NATIONAL RESULTS
According to Europeans, the three most important issues facing the EU at the moment are also related to the economy: the economic situation is the most mentioned concern in 22 countries, and comes in second position in the six remaining Member States. Unemployment is the main concern at European level in Cyprus (61%), Italy (49%), and Luxembourg (48%). In Austria, Germany and Finland, the state of Member States’ public finances is seen as the most important issue that the EU is currently facing. Immigration is mentioned much more often in Malta than by Europeans generally (40%, in second position, compared with 16% at EU level), and respondents in Italy seem particularly concerned with taxation (21%, in third position, compared with 7% at EU level).

STANDARD EUROBAROMETER 80 FIRST RESULTS – AUTUMN 2013
17
III. EUROPEANS AND THE ECONOMIC SITUATION
1. ASSESSMENT OF THE CURRENT SITUATION: GENERAL AND PERSONAL
ASPECTS
Positive evolutions can be seen in perceptions of the economic situation at national level (total ‘good’ +5 percentage points, total ‘bad’ -4), and to a greater extent at European level (total ‘good’ +7, total ‘bad’ -7). However, the way respondents judge their personal situation has remained almost unchanged since the previous survey carried out in spring 2013: close to two-thirds say that the financial situation of their household is good (63%, unchanged), and 54% say the same about their personal job situation (+1).

STANDARD EUROBAROMETER 80 FIRST RESULTS – AUTUMN 2013
18
2. CURRENT SITUATION OF THE ECONOMY AT NATIONAL LEVEL: TREND
A long term analysis demonstrates that despite the positive evolution measured in this standard Eurobarometer survey of autumn 2013, more than two-thirds of Europeans perceive the situation of their national economy as bad for now the eleventh time in a row. However, the increase in the number of Europeans judging that their country’s economic situation is good means that this proportion now exceeds 30% for the first time since autumn 2007 (EB68).

STANDARD EUROBAROMETER 80 FIRST RESULTS – AUTUMN 2013
19
3. CURRENT SITUATION OF THE ECONOMY AT NATIONAL LEVEL: NATIONAL
RESULTS AND EVOLUTION
While more Europeans perceive the situation of their national economy as ‘good’ compared with spring 2013, the gap between the different Member States has widened: 83 percentage points now separate Sweden, where 85% of respondents think that the economic situation in their country is good, and Greece, where just 2% of the population share this view. The largest gap was 79 points in the spring 2013 survey (EB79) (between Sweden and Spain), and 74 in the autumn 2012 survey (EB78) (between Sweden and Greece). In Sweden, Germany, Denmark, Luxembourg and Malta, more than two-thirds of respondents consider that the economic situation of their country is good (this was the case for just three countries in spring 2013). At the other end of the scale, less than 10% of respondents hold this opinion in nine countries (compared with 11 countries in spring 2013, Romania and Ireland having left this group).
In 20 Member States, the proportion of respondents who consider that the economic situation of their country is good has increased since spring 2013: the largest evolutions are seen in Denmark (74%, +16 since spring 2013), the UK (38%, +14), Poland (35%, +13) and Ireland (18%, +11). Conversely, in five countries, the proportion of respondents who are positive about the situation of their national economy has decreased, most strikingly in Finland (47%, -6): as a result of this evolution, Finland now falls into the group of countries where a majority of respondents consider that their national economy is ‘bad’.

STANDARD EUROBAROMETER 80 FIRST RESULTS – AUTUMN 2013
20
STANDARD EUROBAROMETER 80 FIRST RESULTS – AUTUMN 2013
21
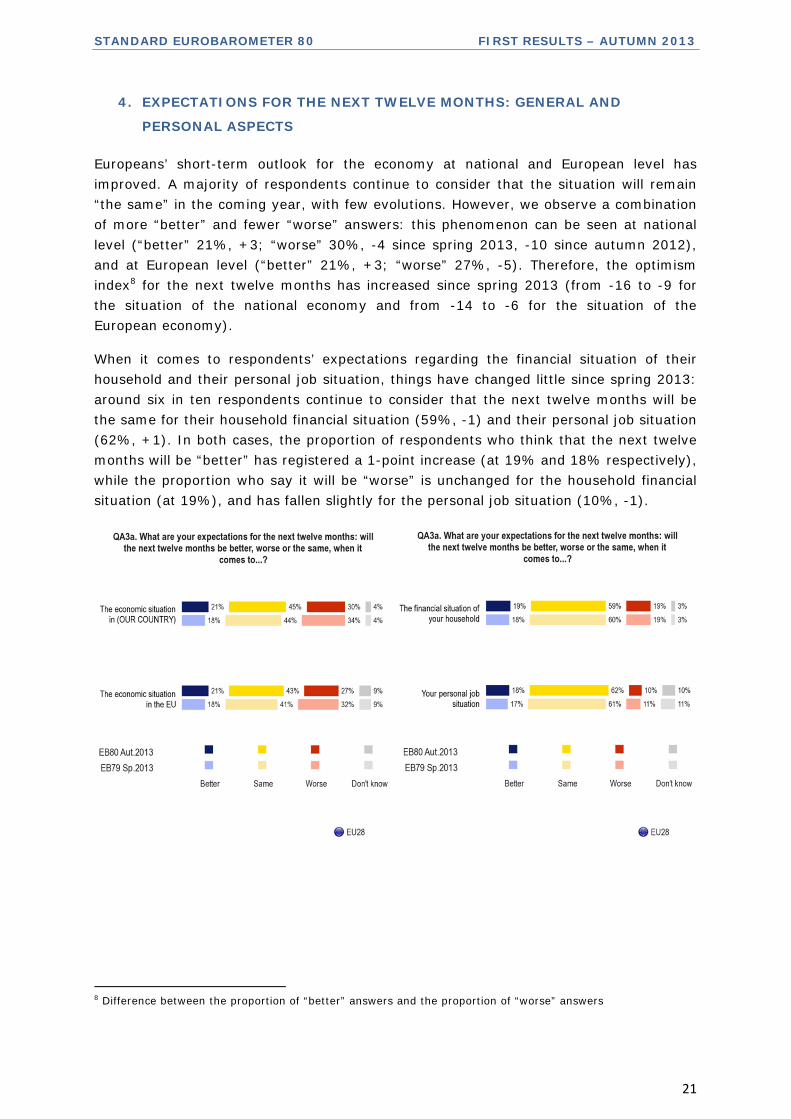
4. EXPECTATIONS FOR THE NEXT TWELVE MONTHS: GENERAL AND
PERSONAL ASPECTS
Europeans’ short-term outlook for the economy at national and European level has improved. A majority of respondents continue to consider that the situation will remain “the same” in the coming year, with few evolutions. However, we observe a combination of more “better” and fewer “worse” answers: this phenomenon can be seen at national level (“better” 21%, +3; “worse” 30%, -4 since spring 2013, -10 since autumn 2012), and at European level (“better” 21%, +3; “worse” 27%, -5). Therefore, the optimism index8 for the next twelve months has increased since spring 2013 (from -16 to -9 for the situation of the national economy and from -14 to -6 for the situation of the European economy).
When it comes to respondents’ expectations regarding the financial situation of their household and their personal job situation, things have changed little since spring 2013: around six in ten respondents continue to consider that the next twelve months will be the same for their household financial situation (59%, -1) and their personal job situation (62%, +1). In both cases, the proportion of respondents who think that the next twelve months will be “better” has registered a 1-point increase (at 19% and 18% respectively), while the proportion who say it will be “worse” is unchanged for the household financial situation (at 19%), and has fallen slightly for the personal job situation (10%, -1).
8 Difference between the proportion of “better” answers and the proportion of “worse” answers

STANDARD EUROBAROMETER 80 FIRST RESULTS – AUTUMN 2013
22
5. EXPECTATIONS FOR THE NEXT TWELVE MONTHS FOR THE ECONOMY AT
NATIONAL LEVEL: NATIONAL RESULTS AND EVOLUTION
In 20 Member States, majorities of respondents think that the next twelve months will be “the same” when it comes to the economic situation in their country. In six EU Member States, the "worse" answer is the majority view: Cyprus (72%), Greece (63%), Portugal (57%), Slovenia (56%), Italy (44%) and Croatia (42%). Conversely, majorities expect the national economic situation to be “better” in two countries: Malta (42%) and the Netherlands (42%). This is the first time since spring 2011 (EB75) that there are countries in which a majority of respondents think that the national economic situation will improve over the next twelve months: in each Standard Eurobarometer survey between spring 2011 (EB 75) and spring 2013 (EB 79), in all EU Member States, the respondents who were optimistic about the year ahead had always been outnumbered by those who thought the situation would stay “the same” or would get “worse”.
Overall, optimism about the situation of the national economy over the next twelve months has grown in 20 countries, most strikingly in the Netherlands (42%, +19 for the answer “better” since spring 2013), Denmark (44%, +8) and Ireland (28%, +8). Conversely, optimism has lost ground in eight countries.

STANDARD EUROBAROMETER 80 FIRST RESULTS – AUTUMN 2013
23

STANDARD EUROBAROMETER 80 FIRST RESULTS – AUTUMN 2013
24
IV. THE CRISIS
1. SUPPORT FOR THE EUROPEAN ECONOMIC AND MONETARY UNION WITH
A SINGLE CURRENCY, THE EURO: TREND
The support of Europeans for the economic and monetary union with a single currency, the euro, has remained almost stable, with more than half of Europeans in favour (52%, +1 since spring 2013), and 41% opposed (-1). Though very limited, this decrease in opposition to the euro is the first since the Standard Eurobarometer of autumn 2010 (EB74).

STANDARD EUROBAROMETER 80 FIRST RESULTS – AUTUMN 2013
25
2. SUPPORT FOR THE EUROPEAN ECONOMIC AND MONETARY UNION WITH
A SINGLE CURRENCY, THE EURO: NATIONAL RESULTS
In 21 Member States, an absolute majority of respondents are in favour of the euro, with the highest levels recorded in Luxembourg (79%), Slovenia (78%), Slovakia (78%), Estonia (76%), and Finland (75%). At the other end of the scale, opposition is strongest in Denmark (65%), the Czech Republic (70%), Sweden (74%) and the UK (74%). Cyprus is the only member of the euro area where a majority of the population is against the euro (52% vs. 44% in favour). Support for the single currency has grown the most in Latvia (53%, +10, vs. 40%,-11), which will adopt the euro in January 2014: support for the single currency has become the majority opinion in Latvia.
Support for the euro has gained ground in the euro area (63%, +1 percentage point), but more strikingly outside it (34%, +5): however, the gap between the two remains very wide (29 percentage points).

STANDARD EUROBAROMETER 80 FIRST RESULTS – AUTUMN 2013
26
3. IMPACT OF THE CRISIS ON JOBS: TREND
Europeans are more and more divided regarding the impact of the crisis on the job market: half continue to think that “the worst is still to come”, but this proportion has decreased since spring 2013 (50%, -5 percentage points). Conversely, the feeling that this impact has “already reached its peak” has become more widespread (40%, +4). When compared with the Standard Eurobarometer of autumn 2011 (EB76), these evolutions are more pronounced: -18 for “the worst is still to come”, and +17 for “already reached its peak”.
STANDARD EUROBAROMETER 80 FIRST RESULTS – AUTUMN 2013
27
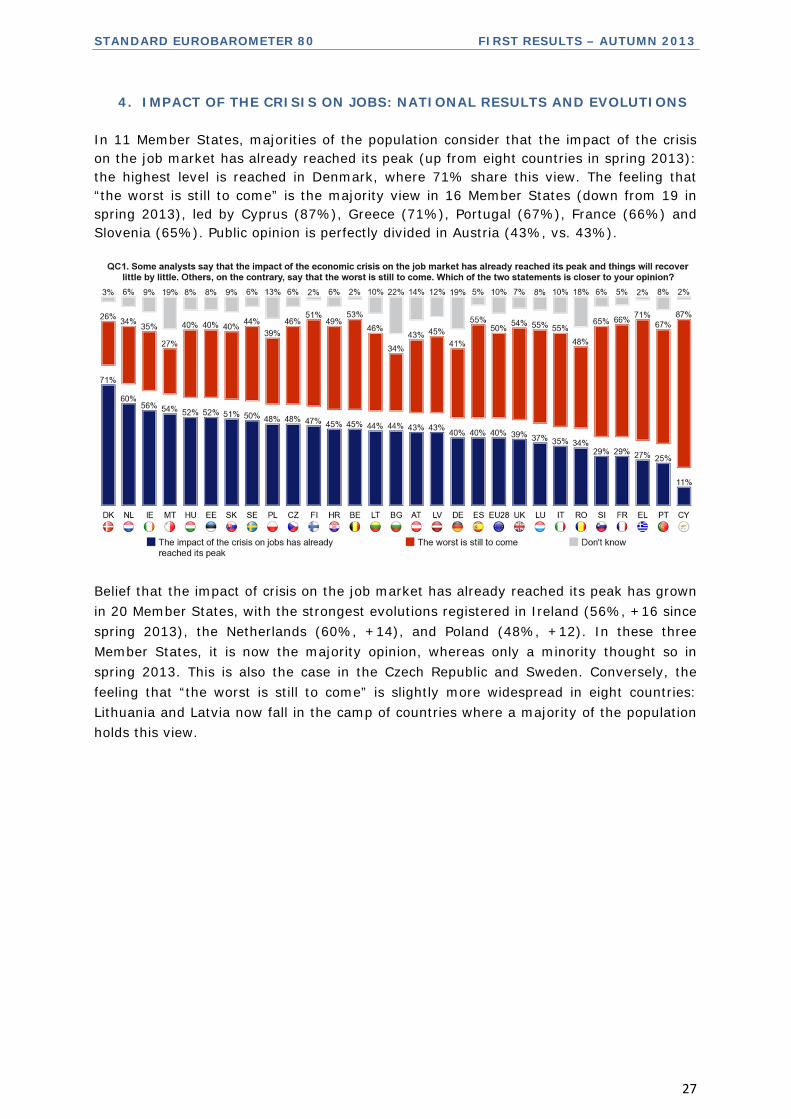
4. IMPACT OF THE CRISIS ON JOBS: NATIONAL RESULTS AND EVOLUTIONS
In 11 Member States, majorities of the population consider that the impact of the crisis on the job market has already reached its peak (up from eight countries in spring 2013): the highest level is reached in Denmark, where 71% share this view. The feeling that “the worst is still to come” is the majority view in 16 Member States (down from 19 in spring 2013), led by Cyprus (87%), Greece (71%), Portugal (67%), France (66%) and Slovenia (65%). Public opinion is perfectly divided in Austria (43%, vs. 43%).
Belief that the impact of crisis on the job market has already reached its peak has grown in 20 Member States, with the strongest evolutions registered in Ireland (56%, +16 since spring 2013), the Netherlands (60%, +14), and Poland (48%, +12). In these three Member States, it is now the majority opinion, whereas only a minority thought so in spring 2013. This is also the case in the Czech Republic and Sweden. Conversely, the feeling that “the worst is still to come” is slightly more widespread in eight countries: Lithuania and Latvia now fall in the camp of countries where a majority of the population holds this view.

STANDARD EUROBAROMETER 80 FIRST RESULTS – AUTUMN 2013
28

STANDARD EUROBAROMETER 80 FIRST RESULTS – AUTUMN 2013
29
5. WHAT IS THE MOST EFFECTIVE LEVEL AT WHICH TO TACKLE THE CRISIS?
The hierarchy of the actors best placed to take effective actions against the effects of the financial and economic crisis has remained almost unchanged since spring 2013: the EU is still perceived as the best placed actor (22%, unchanged), and now shares this first place with the national government, which has gained ground slightly (22%, +1). The IMF comes in third place (13%, unchanged), just above the G20 (12%, -1).

STANDARD EUROBAROMETER 80 FIRST RESULTS – AUTUMN 2013
30
V. EUROPE 2020
1. PERCEIVED IMPORTANCE OF THE EUROPE 2020 STRATEGY INITIATIVES
The seven objectives of the Europe 2020 strategy are considered important by an outright majority of Europeans, with proportions ranging from 51% for “to develop the e-economy by strengthening ultra-fast Internet within the EU”, up to 81% for “to help the poor and socially excluded and enable them to play an active part in society”. And this feeling is more widespread than in the survey of spring 2013: whereas the proportion of ‘important’ answers decreased or remained stable between autumn 2012 (EB78) and spring 2013 (EB79), it has now increased for six initiatives (with increases ranging from +1 to +3), and is unchanged for the seventh.
Five of the Europe 2020 strategy initiatives are perceived as important by more than seven in ten Europeans, with the highest level measured for “to help the poor and socially excluded and enable them to play an active part in society” (81%, +3). Eight in ten Europeans consider it important “to modernise labour markets, with a view to raising employment levels” (80%, unchanged), and 75% believe that it is important “to support an economy that uses less natural resources and emits less greenhouse gas” (+2). Around three-quarters of Europeans also consider it important “to help the EU’s industrial base to be more competitive by promoting entrepreneurship and developing new skills” (73%, +3) and “to enhance the quality and appeal of the EU’s higher education system” (72%, +3).
Close to two-thirds of Europeans believe that it is important “to increase the support for research and development policies and turn inventions into products” (64%, +3), whereas despite a slight rise in the proportions who consider it important, “to develop the e-economy by strengthening ultra-fast Internet within the EU” continues to be the initiative most likely to divide Europeans (51% ‘important’, +1, vs. 16% ‘not important’, -1).
Since spring 2010, when this question was first asked (EB73)9, all the initiatives are now perceived as more important, with increases varying from two to five points for five of the seven initiatives.
9 The European Commission launched the Europe 2020 strategy in March 2010 in order to prepare the European economy for the key issues and challenges of the 2010-2020 decade. http://ec.europa.eu/europe2020/index_en.htm

STANDARD EUROBAROMETER 80 FIRST RESULTS – AUTUMN 2013
31

STANDARD EUROBAROMETER 80 FIRST RESULTS – AUTUMN 2013
32
2. THE EUROPE 2020 TARGETS
The eight Europe 2020 strategy targets are considered “about right” by majorities of Europeans, in proportions that are fairly stable or unchanged since spring 2013.
For six in ten Europeans, “to increase energy efficiency in the EU by 20% by 2020” is a credible target: 60% think that this objective is “about right” (+1 since spring 2013). 58% consider it credible that in 2020, “three-quarters of men and women between 20 and 64 years of age should have a job”, and 57% say that “to increase the share of renewable energy in the EU by 20% by 2020” is “about right” (unchanged). These are followed by “the share of funds invested in research and development should reach 3% of the wealth produced in the EU each year” (56%, unchanged) and “to reduce EU greenhouse gas emissions by at least 20% by 2020 compared to 1990” (54%, unchanged).
Half of Europeans consider that it is reasonable that “the number of young people leaving school with no qualifications should fall to 10%” (50%, -1), and a similar proportion that “the number of Europeans living below the poverty line should be reduced by a quarter by 2020” (48%, -1) and that “at least 40% of the people aged 30 to 34 should have a degree or a diploma” (48%, +1)
A long-term analysis reveals that since spring 2010, the perceived credibility of these different objectives has either remained unchanged (for “to increase energy efficiency in the EU by 20% by 2020”, at 60%, and “the share of funds invested in research and development should reach 3% of the wealth produced in the EU each year”, at 56%), or has declined (the six remaining objectives, with falls ranging from -1 to -5 percentage points).

STANDARD EUROBAROMETER 80 FIRST RESULTS – AUTUMN 2013
33
3. OVERALL
A relative majority of European citizens consider that the European Union is going “in the right direction” to emerge from the crisis and face the new world challenges (43%), and this proportion has registered a slight increase since spring 2013 (+1). Over the longer term, the answer “in the right direction” has gained ground continuously, though moderately, in each Standard Eurobarometer survey since autumn 2011 (from 38% up to 43%). Around three Europeans in ten consider that the EU is going “in the wrong direction” (29%, -1), and less than one in five said spontaneously “neither the one nor the other” (19%, -1).
Within the euro area, a relative majority thinks that things are going “in the right direction” (38%, +1, vs. 33%, +1). Outside the euro area, this opinion is more widespread, representing an absolute majority (51%, +1, vs. 24%, -2).

STANDARD EUROBAROMETER 80 FIRST RESULTS – AUTUMN 2013
34
VI. EUROPEAN CITIZENSHIP
1. FEELING LIKE A CITIZEN OF THE EUROPEAN UNION: TREND
Close to six in ten Europeans feel that they are citizens of the EU (59%, -3 since spring 2013). Conversely, four in ten do not feel they are citizens of the EU (40%, +3). This combination of a 3-point decrease in the feeling of being a citizen of the EU, combined with a 3-point increase in the opposite opinion, is the strongest evolution registered since spring 2010 (EB73).
2. FEELING LIKE A CITIZEN OF THE EUROPEAN UNION: NATIONAL RESULTS
In 23 EU Member States, outright majorities of respondents feel that they are citizens of the EU: the highest proportions are reached in Luxembourg (85%), Malta (74%), Germany (73%), and Finland (73%). The exceptions are Greece (42%), the UK (42%), Italy (45%), Cyprus (46%) and Bulgaria, where respondents are almost perfectly divided (49%, vs. 50% who do not feel they are EU citizens). After a 7-point decrease, Italy now belongs to the group of countries where a majority of the population does not feel they are EU citizens.
The feeling of EU citizenship continues to be more widespread within the euro area (62%) than outside it (54%), but it has decreased in both areas (-2 and -3 percentage points respectively).

STANDARD EUROBAROMETER 80 FIRST RESULTS – AUTUMN 2013
35
3. KNOWLEDGE OF RIGHTS : TRENDS
A substantial minority of Europeans say that they know their rights as citizens of the EU (43%, -3 since spring 2013). An absolute majority of Europeans continue to say that they do not know their rights as citizens of the EU (55%, +2). Whereas between spring 2011 (EB75) and spring 2013 (EB79), the proportion of Europeans answering that they knew their rights as citizens of the EU varied between 45% and 47%, the level measured now is closer to that recorded in spring 2010 (EB73), the first time this question was asked (42%).
STANDARD EUROBAROMETER 80 FIRST RESULTS – AUTUMN 2013
36
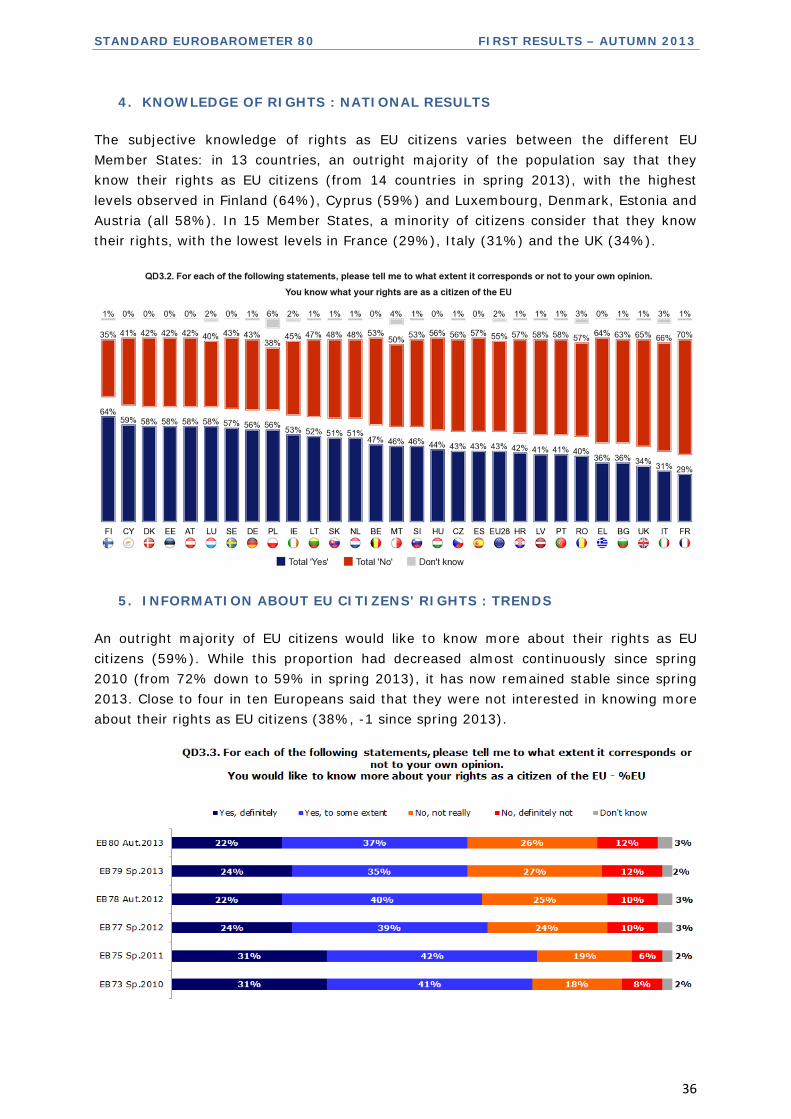
4. KNOWLEDGE OF RIGHTS : NATIONAL RESULTS
The subjective knowledge of rights as EU citizens varies between the different EU Member States: in 13 countries, an outright majority of the population say that they know their rights as EU citizens (from 14 countries in spring 2013), with the highest levels observed in Finland (64%), Cyprus (59%) and Luxembourg, Denmark, Estonia and Austria (all 58%). In 15 Member States, a minority of citizens consider that they know their rights, with the lowest levels in France (29%), Italy (31%) and the UK (34%).
5. INFORMATION ABOUT EU CITIZENS' RIGHTS : TRENDS
An outright majority of EU citizens would like to know more about their rights as EU citizens (59%). While this proportion had decreased almost continuously since spring 2010 (from 72% down to 59% in spring 2013), it has now remained stable since spring 2013. Close to four in ten Europeans said that they were not interested in knowing more about their rights as EU citizens (38%, -1 since spring 2013).

STANDARD EUROBAROMETER 80 FIRST RESULTS – AUTUMN 2013
37
6. INFORMATION ABOUT EU CITIZENS' RIGHTS : NATIONAL RESULTS
In a large majority of EU Member States, the public would like to be better informed about their rights as EU citizens: this is the case in 23 countries, led by Cyprus (83%) and Sweden (76%), two countries that are currently in very contrasting economic situations. In five EU Member States, the proportion of respondents who would like to know more about their rights as EU citizens represents a minority: Austria (41%), Bulgaria (44%), Portugal (46%), the UK (48%), and Finland (49%).

STANDARD EUROBAROMETER 80 FIRST RESULTS – AUTUMN 2013
38
7. MOST POSITIVE RESULTS OF THE EU
The hierarchy of the most positive results of the EU has remained almost unchanged since spring 2013. Two items continue to be mentioned by more than half of Europeans, and unquestionably dominate this hierarchy: “the free movement of people, goods and services within the EU” (57%, +1) and “peace amongst the Member States of the EU” (53%, unchanged).
A second group contains three items mentioned by between a fifth and a quarter of Europeans: “the euro” (25%, +1), “student exchange programmes such as ERASMUS” (23%, unchanged), and “the economic power of the EU” (20%, unchanged). “The political and diplomatic influence of the EU in the rest of the world” follows closely (19%, -1), while the 2-point decrease registered for “the level of social welfare (healthcare, education, pensions) in the EU” (17%, -2) is the largest evolution measured on this question since spring 2013. This same decrease is seen for “the common agricultural policy” (10%, -2), confirming its position at the bottom of the list. A substantial proportion of Europeans spontaneously answer “none” when asked which are the most positive results of the EU (12%, +1).

STANDARD EUROBAROMETER 80 FIRST RESULTS – AUTUMN 2013
39
CONCLUSION
The results of this Standard Eurobarometer survey conducted in November 2013 (EB80) show that the downward trend that characterised the attitudes of Europeans towards the EU and its institutions seems to have been halted. Though these indicators remain at low levels, they are either stable (trust in the EU) or gaining ground, whether slightly (image of the EU), or significantly (future of the EU).
The economy continues to dominate the concerns of Europeans at all levels (personal, national and European), but the trend identified in the previous survey of spring 2013 (EB79) is confirmed: these economic concerns are become less prominent (including unemployment, which had gained ground between autumn 2012 and spring 2013). Meanwhile, social themes, though still below the economic ones, are become more important. This is especially the case for immigration as a European concern, with a 6-point increase following a 2-point rise between autumn 2012 and spring 2013.
Europeans continue to perceive the current economic situation at national and European level as bad. However, their perceptions have registered significant improvements since spring 2013. The gap between countries has grown since spring 2013, continuing the trend observed between autumn 2012 and spring 2013: more than 80 percentage points now separate countries with the best and worst perceptions of their national economic situation. When it comes to economic expectations at national and European level, optimism has also increased slightly, though majorities of Europeans continue to think that the situation of the national and European economies will stay the same.
Support for the euro has remained almost stable, with more than half of Europeans in favour (52%, +1). There is still a large difference in between support within the euro area (63%, +1) and outside it (34%, +5). Half of Europeans consider that the worst is still to come regarding the impact of the crisis on the job market, but the gap between them and those who instead consider that this impact has reached its peak has continued to reduce: 10 percentage points now separate the two groups, whereas this gap was 45 percentage points in autumn 2011 (EB76). The European Union remains perceived as the actor best able to take effective action to tackle the effects of the crisis, along with national governments.
All seven initiatives of the Europe 2020 strategy are considered important by absolute majorities of Europeans, and this perceived importance has even increased (for six initiatives) or remained stable (for one) since spring 2013. A growing relative majority of them also think that the EU is going in the right direction to emerge from the crisis and face the new challenges.
The proportion of Europeans who feel they are citizens of the EU still represents an absolute majority, but has reduced since spring 2013. More than four Europeans in ten know their rights as EU citizens, but this proportion has also declined since spring 2013. The hierarchy of the most positive results of the EU for Europeans has remained almost unchanged: free movement of people, goods and services within the EU, and peace among the Member States of the EU are still perceived as by far the most positive results of the EU.

STANDARD EUROBAROMETER 80 FIRST RESULTS – AUTUMN 2013
TS1
STANDARD EUROBAROMETER 80 Public opinion in the European Union
TECHNICAL SPECIFICATIONS Between the 2nd and the 17th of November 2013, TNS opinion & social, a consortium created between TNS plc and TNS opinion, carried out the wave 80.1 of the EUROBAROMETER survey, on request of the EUROPEAN COMMISSION, Directorate-General for Communication, “Research and Speechwriting”. The wave 80.1 is the STANDARD EUROBAROMETER 80 survey and covers the population of the respective nationalities of the European Union Member States, resident in each of the Member States and aged 15 years and over. The STANDARD EUROBAROMETER 80 survey has also been conducted in the five candidate countries (Turkey, the Former Yugoslav Republic of Macedonia, Iceland, Montenegro and Serbia) and in the Turkish Cypriot Community. In these countries, the survey covers the national population of citizens and the population of citizens of all the European Union Member States that are residents in these countries and have a sufficient command of the national languages to answer the questionnaire. The basic sample design applied in all states is a multi-stage, random (probability) one. In each country, a number of sampling points was drawn with probability proportional to population size (for a total coverage of the country) and to population density.
In order to do so, the sampling points were drawn systematically from each of the "administrative regional units", after stratification by individual unit and type of area. They thus represent the whole territory of the countries surveyed according to the EUROSTAT NUTS II (or equivalent) and according to the distribution of the resident population of the respective nationalities in terms of metropolitan, urban and rural areas. In each of the selected sampling points, a starting address was drawn, at random. Further addresses (every Nth address) were selected by standard "random route" procedures, from the initial address. In each household, the respondent was drawn, at random (following the "closest birthday rule"). All interviews were conducted face-to-face in people's homes and in the appropriate national language. As far as the data capture is concerned, CAPI (Computer Assisted Personal Interview) was used in those countries where this technique was available. For each country a comparison between the sample and the universe was carried out. The Universe description was derived from Eurostat population data or from national statistics offices. For all countries surveyed, a national weighting procedure, using marginal and intercellular weighting, was carried out based on this Universe description. In all countries, gender, age, region and size of locality were introduced in the iteration procedure. For international weighting (i.e. EU averages), TNS Opinion & Social applies the official population figures as provided by EUROSTAT or national statistic offices. The total population figures for input in this post-weighting procedure are listed below.

STANDARD EUROBAROMETER 80 FIRST RESULTS – AUTUMN 2013
TS2
Readers are reminded that survey results are estimations, the accuracy of which, everything being equal, rests upon the sample size and upon the observed percentage. With samples of about 1,000 interviews, the real percentages vary within the following confidence limits:
various sample sizes are in rows various observed results are in columns
5% 10% 15% 20% 25% 30% 35% 40% 45% 50%
95% 90% 85% 80% 75% 70% 65% 60% 55% 50%
N=50 6,0 8,3 9,9 11,1 12,0 12,7 13,2 13,6 13,8 13,9 N=50
N=500 1,9 2,6 3,1 3,5 3,8 4,0 4,2 4,3 4,4 4,4 N=500
N=1000 1,4 1,9 2,2 2,5 2,7 2,8 3,0 3,0 3,1 3,1 N=1000
N=1500 1,1 1,5 1,8 2,0 2,2 2,3 2,4 2,5 2,5 2,5 N=1500
N=2000 1,0 1,3 1,6 1,8 1,9 2,0 2,1 2,1 2,2 2,2 N=2000
N=3000 0,8 1,1 1,3 1,4 1,5 1,6 1,7 1,8 1,8 1,8 N=3000
N=4000 0,7 0,9 1,1 1,2 1,3 1,4 1,5 1,5 1,5 1,5 N=4000
N=5000 0,6 0,8 1,0 1,1 1,2 1,3 1,3 1,4 1,4 1,4 N=5000
N=6000 0,6 0,8 0,9 1,0 1,1 1,2 1,2 1,2 1,3 1,3 N=6000
N=7000 0,5 0,7 0,8 0,9 1,0 1,1 1,1 1,1 1,2 1,2 N=7000
N=7500 0,5 0,7 0,8 0,9 1,0 1,0 1,1 1,1 1,1 1,1 N=7500
N=8000 0,5 0,7 0,8 0,9 0,9 1,0 1,0 1,1 1,1 1,1 N=8000
N=9000 0,5 0,6 0,7 0,8 0,9 0,9 1,0 1,0 1,0 1,0 N=9000
N=10000 0,4 0,6 0,7 0,8 0,8 0,9 0,9 1,0 1,0 1,0 N=10000
N=11000 0,4 0,6 0,7 0,7 0,8 0,9 0,9 0,9 0,9 0,9 N=11000
N=12000 0,4 0,5 0,6 0,7 0,8 0,8 0,9 0,9 0,9 0,9 N=12000
N=13000 0,4 0,5 0,6 0,7 0,7 0,8 0,8 0,8 0,9 0,9 N=13000
N=14000 0,4 0,5 0,6 0,7 0,7 0,8 0,8 0,8 0,8 0,8 N=14000
N=15000 0,3 0,5 0,6 0,6 0,7 0,7 0,8 0,8 0,8 0,8 N=15000
5% 10% 15% 20% 25% 30% 35% 40% 45% 50%
95% 90% 85% 80% 75% 70% 65% 60% 55% 50%
Statistical Margins due to the sampling process
(at the 95% level of confidence)

STANDARD EUROBAROMETER 80 FIRST RESULTS – AUTUMN 2013
TS3