landscape of the european chemical industry 2018 -...
TRANSCRIPT

Landscape of the European Chemical Industry 2018
1
EU28Cefic
Number of companies Turnover National contact
28,329 €507 billion
René van SlotenExecutive Director Industrial [email protected]
Capital spending Direct employees
€21.7 billion 1,140,000R&D investment
€9.1 billion
A CORNERSTONE OF THE EUROPEAN ECONOMY
The European chemical industry is of major importance for economic development and wealth, providing modernproducts and materials and enabling solutions in virtually all sectors. It is a wealth generating sector of the economy,and a valuable part of Europe’s economic infrastructure. It aims to provide solutions for the achievement of acompetitive, low carbon and circular economy in Europe and beyond.
Industry is the biggest customer for EU chemicals

Landscape of the European Chemical Industry 2018
2
EU CHEMICAL INDUSTRY SNAPSHOT
The chemical industry generates 1.1 per cent of EU gross domestic product (GDP).
The European chemical industry is highly successful. Traditionally, it has been a world leader in chemicals production.
With 1.14 million workers and sales of €507 billion (2016), it is one of the largest industrial sectors and a leadingsource of direct and indirect employment in many regions.
Landscape of the European Chemical Industry 2018
3
Cefic supports the Commission’s goal for industry to contribute 20% of GDP by 2020. That’s a bold ambition, not anabsolute target. Today, industry contributes about 15% of GDP, and industrial investment is declining. As investmentshare in primary production falls, Europe is losing ground in technological capability, and European value chains areat risk.
On a promising trend
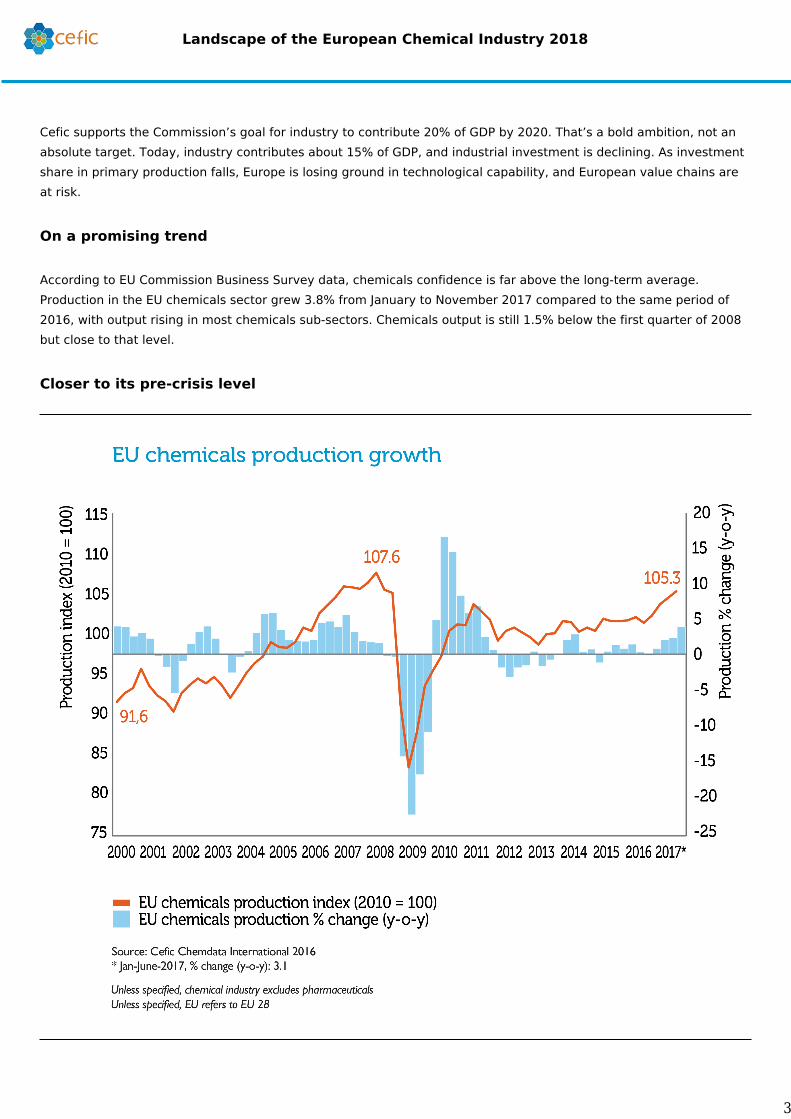
According to EU Commission Business Survey data, chemicals confidence is far above the long-term average.Production in the EU chemicals sector grew 3.8% from January to November 2017 compared to the same period of2016, with output rising in most chemicals sub-sectors. Chemicals output is still 1.5% below the first quarter of 2008but close to that level.
Closer to its pre-crisis level

Landscape of the European Chemical Industry 2018
4
ASIA RISING
World chemicals sales were €3,360 billion in 2016, up 0.4% from €3,347 billion in 2015. This is not spectaculargrowth. The modest recovery was largely driven by China, where chemicals surged by €50.8 billion to reach €1,331billion.
Asia forges ahead
Europe still strong on sales
The EU chemical industry ranks second by sales, a whisker ahead of the United States. Including non-EU countries,total European chemicals sales reached €597 billion in 2016, or 17.8 per cent of world output. But China hasleapfrogged Europe to top global sales ranking.

Landscape of the European Chemical Industry 2018
5
In 2016, sales from the 30 largest chemical-producing countries totalled €3,066 billion. Twelve of the top 30 were inAsia. Their €1,916 billion of sales contributed to top 30 chemicals sales and captured 57.0 per cent of world chemicalssales.
China dominates chemicals world rankings
China plans ahead
The world landscape of the chemical industry is changing rapidly. China is planning an ambitious industrial policystrategy to take its chemical industry to the next stage of development – a strategy outlined in the “13th Five-YearPlan” on the Chinese petroleum and chemical industry. China is looking to move from “following the lead” to “takingthe lead” and from a “big country” to a “great power” of the petroleum and chemical industry, leading on technologyinnovation and trade and prevailing in international markets.
THOUGH SALES ARE UP, EU MARKET SHARE HAS HALVED
The EU chemical industry’s share of world markets has declined in the past two decades. In 1996 EU industry saleswere €334 billion – 32.5 per cent of world chemicals sales. EU chemicals sales have since grown by 52 per cent.

Landscape of the European Chemical Industry 2018
6
But worldwide, chemical sales have soared from €1,029 billion in 1996 to €3,360 billion in 2016. So the EU’s marketshare has fallen to 15.1 per cent in 2016. This “dilution effect” looks set to continue. Demand for chemicals isgrowing strongly in China, India and other emerging countries but slowly in Europe and North America, where Europesells most of its chemicals.
A smaller share of a bigger cake
Losing competitiveness
A study of EU chemical industry competitiveness commissioned by Cefic from Oxford Economics (2014) blamed highenergy prices, currency appreciation, high labour costs, and regulatory and tax burdens, among other factors of theloss in competitiveness. Oxford Economics found that R&D intensity, energy prices and exchange rates stronglyshaped competitiveness.

Landscape of the European Chemical Industry 2018
7
By 2030, world chemicals sales are expected to reach €6.3 trillion in 2030. But the EU chemical industry is expectedto fall into third place, behind China, with 44% of the world market, and the US.
A shrinking slice
An export opportunity
Although competition in China’s chemical market is intensifying and demand growing more weakly, China still offers ahuge and attractive market both for chemical suppliers and their customer industries. In the medium-term, European

Landscape of the European Chemical Industry 2018
8
chemical producers are expected to benefit through increased exports or via local investments, thanks to theirtechnological capabilities and innovative products, notably in consumer chemicals, automotive, electronics, food andnutrition.
THE EU REMAINS A NET EXPORTER OF CHEMICALS
Trading chemicals around the world stimulates competition, provides an incentive to develop new markets throughinnovation, stimulates production efficiency and helps improve the quality of human life. Historically a big exporter,EU chemical industry achieved a significant extra-EU net trade surplus of €47.3 billion in 2016.
Trade agreements could open markets further
Trade agreements with key partners such as the US, Mercosur and Japan would enable our industry to enhanceefficiency and better exploit our technical strengths.
Trading benefits

Landscape of the European Chemical Industry 2018
9
The flow of chemicals between the EU and its trading partners, calculated as total exports plus imports, was valued atnearly €245.2 billion in 2016. The US was by far the EU’s biggest trading partner in chemicals in 2016, buying €30.6billion of EU exports, and providing €23.0 billion of EU imports – nearly 22 per cent of total EU chemicals trade in2016.
Who buys what

Landscape of the European Chemical Industry 2018
10
An emerging US energy advantage
Transatlantic trade flows are expected to change considerably in the next five years, because the US shale gas boomhas triggered a massive build-up of new chemicals production capacity there. Any EU-US deal would therefore needto contain strong provisions regarding access for EU companies to US energy and feedstock.
Narrowing the gas price gap with the US is especially important for petrochemicals and polymers, which have lostglobal export competitiveness in the past decade because gas, used both as a feedstock and to provide energy forcrackers, can account for as much as 60% of operating costs.
Grasping Chinese opportunities
China is the EU’s second-biggest chemicals trading partner, accounting for nearly 9 per cent of EU exports. China hasbecome the most important growth market for global chemical companies and a major investment location. ThoughChinese chemical companies are increasing their focus on specialty chemicals, the country will remain a majorimporter of commodity chemicals for some time to come.

Landscape of the European Chemical Industry 2018
11
HIGH ENERGY COSTS IMPACT EUROPEAN COMPETITIVENESS
The chemical industry is energy-intensive and competes globally. Anything that increases energy costs in Europerelative to our competitors has a major impact on competitiveness. Rivals in the oil and gas-rich Middle East, andmore recently the United States benefit from advantageous energy and feedstock prices. The shale gas boom in theUnited States has greatly reduced the cost of producing ethylene, a vital chemical industry building-block.
Ethylene is the foundation for production of plastics, detergents and coatings. In 2013, making ethylene in Europewas three times more expensive than in the US or the Middle East. This is boosting profits abroad and attractingbillions of dollars in investment, including from European chemical companies. Falling oil prices have reduced EUcosts, but EU producers remain at a cost disadvantage for producing base chemicals.
REGULATORY COSTS HAMPER EU CHEMICALS
EU legislation adds many costs for the European chemical industry, hampering its international competitiveness.

Landscape of the European Chemical Industry 2018
12
Under the REFIT Programme, the European Commission has evaluated cumulative costs arising from existing EUlegislation, to better understand how legislation affects the sector’s international competitiveness, and help shapepolicy-making.
The Cumulative Cost Assessment (CCA) (July 2016) found that legislation cost companies in six subsectors €10 billiona year on average during 2004-2014. Regulatory costs were 12% of value added, and 30%, of Gross OperatingSurplus (GOS), a proxy for profit.
The main drivers of regulatory cost are industrial emissions (33%), chemicals (30%) and worker safety (24%),together 87% of total regulatory costs. Costs ranged from 23.2% of value added in agrochemicals to 2.7% in plastics.In specialty chemicals regulatory costs were 16.7% of value added, for inorganic basic chemicals 12.1%, for organicbasic chemicals 11.3% and for soaps and detergents 11.4%.

Landscape of the European Chemical Industry 2018
13
EU REGULATORY COSTS DOUBLED IN A DECADE
During 2004-2014 compliance costs were driven up by the introduction of REACH regulations in 2007, CLP in 2008,investment ahead of Seveso III in 2012 and ETS Phase 3 in 2013. Energy legislation also contributes to the risingcosts, especially after 2012.
The Cumulative Cost Assessment (CCA) is a tool to show policy-makers the impact of regulation on thecompetitiveness of the European chemical industry. Simultaneously, the European Commission is conducting aFitness Check on Chemical Legislation and has reviewed REACH. The aim is to ensure legislation is achieving itsobjectives in the most efficient way, and rectify any shortcomings without compromising health, safety andenvironmental protection.

Landscape of the European Chemical Industry 2018
14
Europe’s chemical industry needs a regulatory framework that is fit for purpose, consistent, cost-effective and whichdoes not negatively impact its competitiveness vs other regions.
CAPITAL SPENDING INTENSITY REACHED THE HIGHEST LEVEL IN EIGHT YEARS
Investment (in absolute figures) has been increasing from 2004 to 2008, registering a positive trend at a consistentpace. The year 2010, however, experienced a steep decline compared to 2008, down by nearly 24.0%. A gradualincrease occurred from 2010 to 2015. The year 2016 posted a similar range of value on chemicals investment (€21.7billion).
In relative terms, the ratio of capital spending to added value, or capital intensity, has been increasing graduallysince 2010, reaching the value of 19.4% in 2016. This is the highest value on capital intensity observed since 2009. Itis however below its record level of 20.8% registered in 2000.
Shifting investment abroad

Landscape of the European Chemical Industry 2018
15
Chemical companies in the world invested in 2016 a total value of €212.8 billion, up from €83.8 billion in 2006. On aglobal basis, the level of investment in the chemicals sector was 2.5 times higher in 2016 compared to ten years ago.
China is by far and away outpacing the other economies in the world. China contributed nearly 47% of globalinvestment, up from 25% in 2006.
EU CHEMICALS ENERGY EFFICIENCY DOUBLES
EU chemical producers, including pharmaceuticals have sharply reduced fuel and power energy consumption per unitof production. By 2015, energy intensity – energy consumption per unit of production – in the chemical industry,including pharmaceuticals, was 57.9 per cent lower than in 1990.

Landscape of the European Chemical Industry 2018
16
Further energy efficiency gains are subject to decreasing returns. Yet during the 25 years from 1990 to 2015 theindustry increased output without raising energy inputs, lowering its energy intensity by an average of 3.6 per centper year.
Improvements on energy efficiency have been spectacular during the first 15 years from 1990 to 2005. The past 10years from 2005 to 2015 show moderate improvements.
ENHANCING ENVIRONMENTAL PERFORMANCE
Over the last two decades, the chemical industry, including pharmaceuticals, has made an enormous effort tominimise the environmental impact of its production. Greenhouse gas (GHG) emissions per unit of energy used fell 48per cent between 1990 and 2015. GHG intensity – the GHG emissions per unit of production – was cut 79 per centfrom 1990 to 2015.

Landscape of the European Chemical Industry 2018
17
Please note that no figures are available for Cyprus, Luxembourg and Malta.
Landscape of the European Chemical Industry Website:
http://www.chemlandscape.cefic.org/country/eu/