public health and components of particulate matter: the changing assessment of black carbon
DESCRIPTION
Public Health and Components of Particulate Matter: The Changing Assessment of Black Carbon. Thomas J. Grahame, US Department of Energy [email protected] Rebecca Klemm, Klemm Analysis Group Richard B. Schlesinger, Pace University. Disclaimer. - PowerPoint PPT PresentationTRANSCRIPT

Public Health and Components of
Particulate Matter: The Changing Assessment of
Black Carbon
Thomas J. Grahame, US Department of Energy
Rebecca Klemm, Klemm Analysis Group
Richard B. Schlesinger, Pace University

Disclaimer
The views expressed are those of the authors alone, and do not necessarily reflect the viewpoint of any U.S. Government Agency

Caveat There have been considerable reductions of
particulate vehicular emissions (including black carbon [BC]), under legislation and regulations predating and including the Clean Air Act, which deal with reducing vehicular emissions of all types (next slide).
As we discuss recently emerging science on health effects of BC under another section of CAA, regarding National Ambient Air Quality Standards (NAAQS), we don’t want to leave impression that substantial progress hasn’t been made.

Reductions in San Francisco annual BC concentrations over
time(Kirchstetter, 2008, LBL – black line w/black dots
= BC)

Assessments of Black Carbon (BC) and Diesel Emissions
Today
World Health Organization (WHO, EU branch) suggested consideration of a additional health standard for BC (2012)
IARC (International Agency for Research on Cancer, part of WHO) declared diesel exhaust a known human carcinogen (2012)
Janssen et al. (2011) found that reducing one unit of BC in air will lengthen survival 4 to 9 times more than reducing one unit of PM2.5
PM2.5 = Particulate Matter 2.5 micrometers or less

Assessments of BC and Diesel Emissions Circa 2000
BC barely mentioned in North American air pollution studies
Vehicular emissions rarely mentioned in air pollution epidemiology
How did we get from “barely mentioned” to calling for BC standard, finding BC 4 to 9 times more lethal, labelling diesel emissions carcinogenic, in a bit more than a decade?
A major theme of the Critical Review

What is Black Carbon (BC)?
BC consists of a core of graphite-like elemental carbon (EC), on which is adsorbed many carbonaceous species, metals, etc.
BC is product of incomplete combustion of carbonaceous materials (diesel, biomass, gasoline, coal, natural gas [e.g., flaring]) w/o adequate controls U.S. control requirements for post-2006 on-road
diesels eliminate virtually all BC when in working order
Adsorbed materials add ~ 25% to mass of EC Polycyclic Aromatic Hydrocarbons (PAHs) are
among adsorbed materials

Representation of diesel particles, their formation (Courtesy Dr. Ning Li)

Sources of Ambient BC in U.S. (from EPA Black Carbon Report to Congress)

Mobile sources of BC (from EPA Black Carbon Report to Congress)
On road diesel: 153,477 (short tons)
Nonroad diesel 112,058
On road gasoline 14,510
Other (e.g., locomotives) ~ another 50,000
Diesel = ~ 80% of mobile sources BC

EC/BC is mostly in ultrafine range (from Mauderly and Chow, 2008;
Fresno)

Particulate Matter (PM) Research in 1970s through 1990s (very short overview)
1970s and 1980s A few seminal PM epidemiological studies
in 1980s, often noting still current methodological issues, such as:
health relevance of different pollutants not monitored at time (e.g., cancer researchers want info on organics)
A central monitor pollution measurement is a poor proxy for expressing exposure for everyone in a metro area, for spatially variable pollutants (BC) – details to follow

Particulate Matter (PM) Research in 1970s through 1990s (cont.)
1970s and 1980s (cont.) Monitoring for many potentially health-
relevant PM2.5 species, including BC/EC, was lacking
Sulfate only PM species routinely monitored Studies of PM didn’t mention vehicular,
diesel, black carbon, PAHs Exception of Stern et al., 1988, next,
which looked at vehicular emissions only generally, in study of tunnel and bridge officers in NYC

The Exception: Stern et al. (1988): Tunnel Officers vs. Bridge Officers (Risks of ASHD Disease Mortality)

But….Stern et al (1988) dismissed particles and organics
as cause
Study clearly showed benefits of reducing exposure to vehicular emissions
But benefits seen by authors as reflecting reduction in CO
Benefits of reductions of other vehicular emissions, such as “nitric oxides, hydrocarbons, particles, lead…highly speculative…”
Lost opportunity to start looking at vehicular PM emissions

In the 1990s…
Two seminal air pollution studies: 6 Cities Study (Dockery et al., 1993) American Cancer Society (ACS) Study (Pope et
al., 1995) Seminal because these were the studies
which convinced people that tiny particles in air, which often couldn’t be seen, could sicken and kill
But (reflecting lack of monitoring), neither mentioned BC/EC, PAHs, diesel emissions

1998 “Research Priorities for Airborne Particulate Matter”
National Research Council (NRC) report (body of National Academy of Sciences)
Also a seminal work, NRC Reviewed state of U.S. research on particulates and made crucial recommendations

Findings of 1998 NRC Report
“The biological basis of most of the [particulate] associations is essentially unknown . . .”
“There is . . . limited scientific information about the specific types of particles that might cause adverse health effects…”
Suggested using laboratory and human clinical studies to explore toxicological mechanisms by which particles may cause mortality and morbidity
These toxicology tests should examine the “most biologically important components” of particles, including both size and chemistry
Suggested expanded monitoring, to avoid issue that “monitoring is not measuring the most biologically important aspects of particulate matter…”
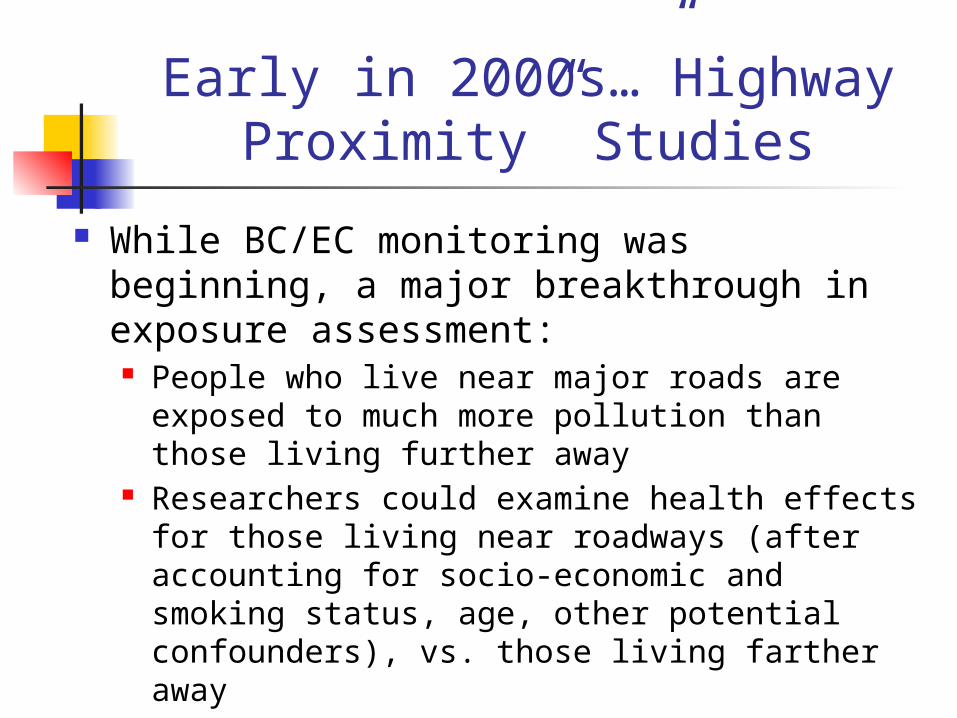
Early in 2000s…”Highway Proximity” Studies
While BC/EC monitoring was beginning, a major breakthrough in exposure assessment: People who live near major roads are exposed
to much more pollution than those living further away
Researchers could examine health effects for those living near roadways (after accounting for socio-economic and smoking status, age, other potential confounders), vs. those living farther away
Example of pollutants’ spatial variability (next slide)

Vehicular Pollutants Fall within ~100 to 150 meters of major road
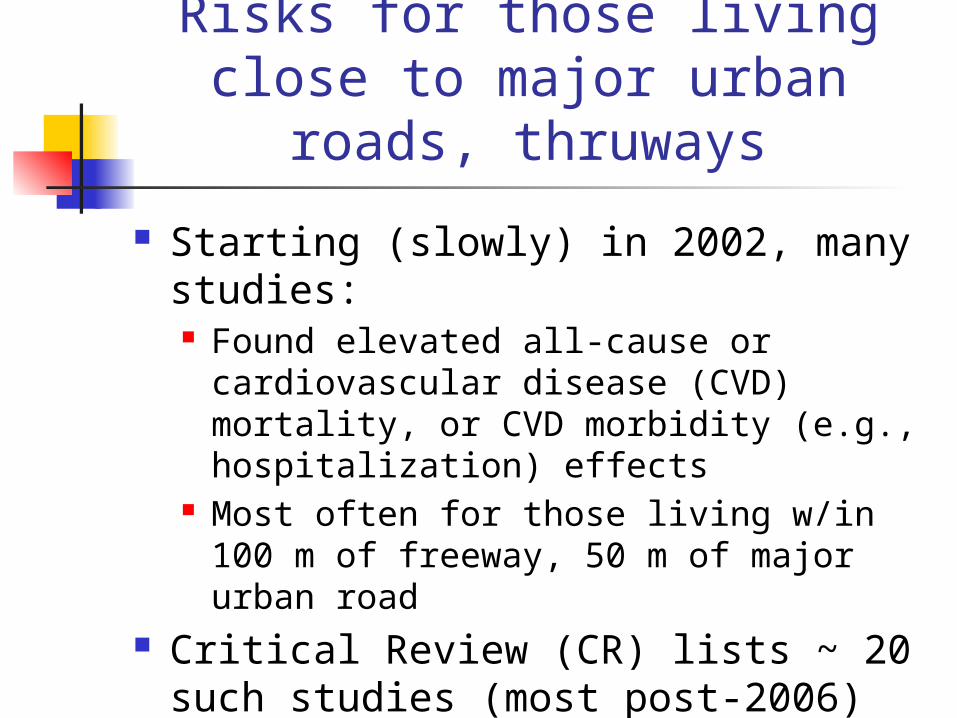
Risks for those living close to major urban roads, thruways
Starting (slowly) in 2002, many studies: Found elevated all-cause or
cardiovascular disease (CVD) mortality, or CVD morbidity (e.g., hospitalization) effects
Most often for those living w/in 100 m of freeway, 50 m of major urban road
Critical Review (CR) lists ~ 20 such studies (most post-2006) in Table S2, discusses several in body of CR

Risks for those living close to major urban roads, thruways
(cont.)
Some examples: Finkelstein et al. (2004): Living in close proximity
to such roads costs 2.5 years of life (not much less than for major diseases like ischemic heart disease)
Gan et al. (2010): ~ 30% elevated risk of coronary heart disease mortality for those living in close proximity to major roads for length of study, > than risks for those who moved closer or further during study
Hoffmann et al. CVD morbidity studies Significantly increased risks of congestive heart disease
(2006), coronary artery disease (2007), peripheral artery disease (2009) for those living near major roads
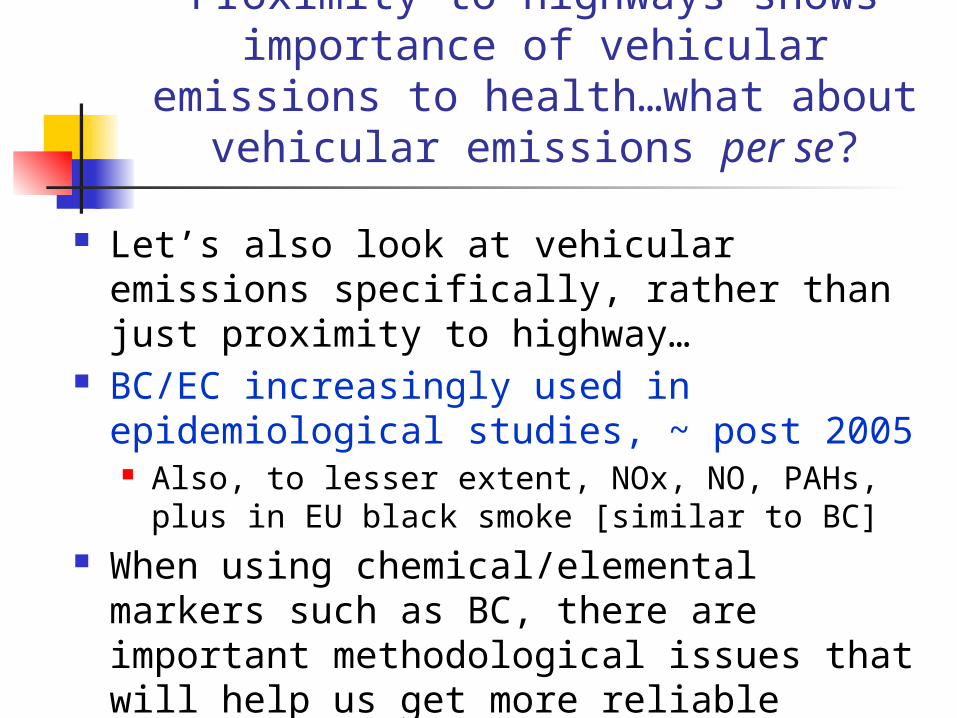
Proximity to highways shows importance of vehicular emissions to
health…what about vehicular emissions per se?
Let’s also look at vehicular emissions specifically, rather than just proximity to highway…
BC/EC increasingly used in epidemiological studies, ~ post 2005 Also, to lesser extent, NOx, NO, PAHs, plus in EU
black smoke [similar to BC] When using chemical/elemental markers
such as BC, there are important methodological issues that will help us get more reliable results…

Need to compare effects of vehicular PM emissions vs. other PM2.5 species
1. Why compare many PM2.5 species, including BC/EC, against same health endpoints in same epidemiology studies?
Can’t find associations for a PM2.5 species not included in model (obviously)
Association may “migrate” from a health relevant PM2.5 species not in model, to emissions included in model
Goal: is a given PM2.5 species more strongly, consistently associated with health effect than other PM2.5 species?
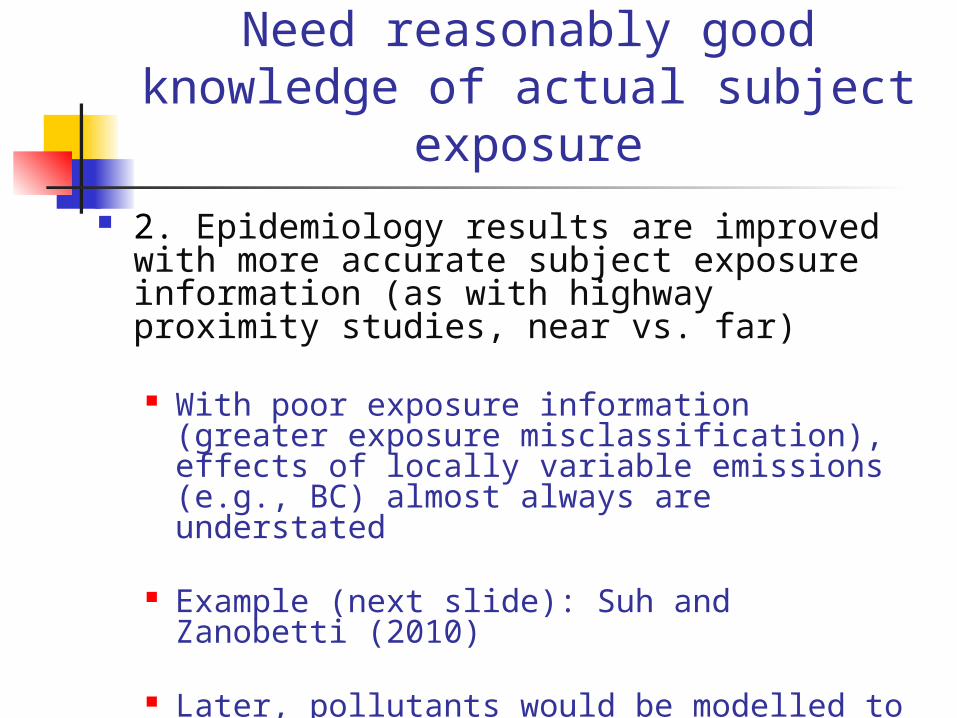
Need reasonably good knowledge of actual subject
exposure 2. Epidemiology results are improved with
more accurate subject exposure information (as with highway proximity studies, near vs. far)
With poor exposure information (greater exposure misclassification), effects of locally variable emissions (e.g., BC) almost always are understated
Example (next slide): Suh and Zanobetti (2010)
Later, pollutants would be modelled to homes of subjects (hospital admissions, mortality)

When exposure to BC is accurate….vs. when it isn’t…
Association Between 24-hour Ambient and Personal EC Concentrations
with Different HRV Measures (from Suh and Zanobetti, 2010)
Ambient (Central Monitor) Personal Monitor HRV Measure Change (%), 95% C.I. Change (%), 95% C.I. SDNN -1.0 -3.7 to 1.7 -4.66 -7.99 to -1.22 RMSSD -3.6 -9.5 to 2.8 -10.97 -18.00 to -3.34 PNN50 -0.34 -10.55 to 11.04 -15.16 -26.33 to -2.29 HF -2.36 -11.67 to 7.92 -13.41 -23.95 to -1.41 LF/HF ratio 2.60 -1.89 to 7.29 6.22 0.15 to 12.64 (Bold = statistically significant at 95% level)

When you have exposure misclassification…
Takeaway from Suh and Zanobetti (2010):
If you have large exposure misclassification, you will understate actual effects in most cases
Does NOT mean that you won’t find some (smaller) significant associations when using a central monitor…other studies do….only that they will very likely be understated

Examine biological mechanisms which may explain epidemiological
associations for specific PM2.5 species
3. Combine toxicology (finding biological mechanisms for specific PM2.5 species) with human panel and controlled human exposure studies, to explain outcomes (e.g., CVD effects) found in population based epidemiology (NRC recommendation again)
Illustrative references Health Effects Institute, 2010 Grahame and Schlesinger, 2010 (BC and CVD)
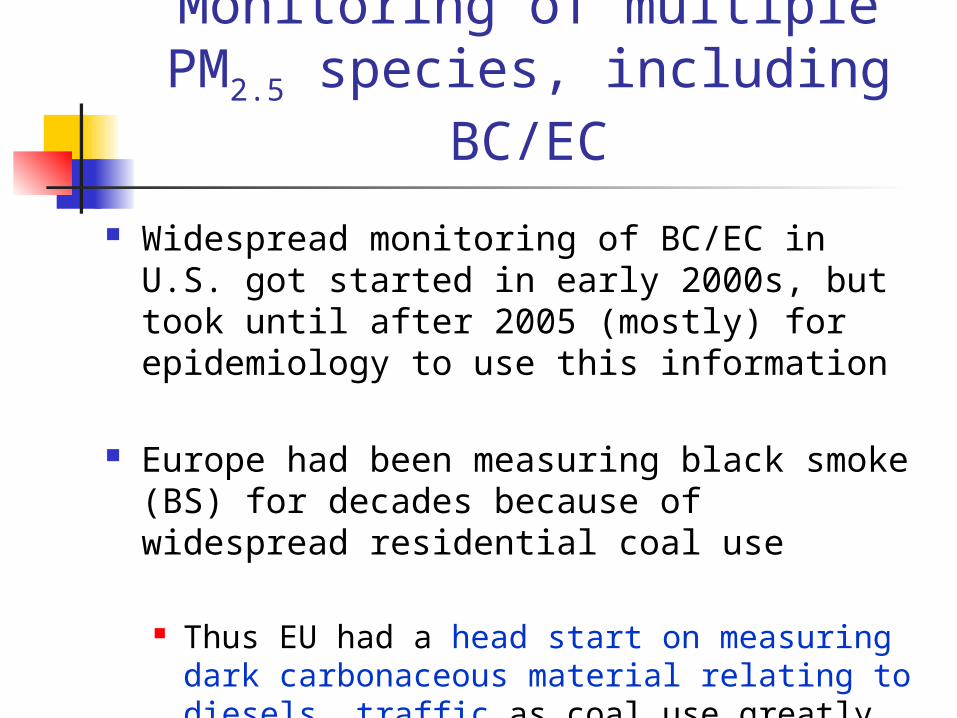
Monitoring of multiple PM2.5 species, including BC/EC
Widespread monitoring of BC/EC in U.S. got started in early 2000s, but took until after 2005 (mostly) for epidemiology to use this information
Europe had been measuring black smoke (BS) for decades because of widespread residential coal use
Thus EU had a head start on measuring dark
carbonaceous material relating to diesels, traffic as coal use greatly diminished

2006 Critical Review (Pope and Dockery)
Well over 100 studies discussed in 2006 CR Great majority examined only size fractions
of PM (PM10, PM2.5, a few ultrafine) A few EU studies using black smoke (the
“head start”) Two highway proximity studies 20 studies of heart rate variability (HRV), all
using PM size fractions None using BC/EC

2006 Critical Review (Pope and Dockery), cont.
Want to be clear: no criticism implied!
Researchers can’t report on BC/EC associations if studies using recently available BC information have yet to be done

What about BC/EC, vehicular emissions studies now?
Current (2014) CR lists in Tables S2 through S10, and/or text, ~140 studies of vehicular emission effects in humans
Great majority published after 2005 Most use BC/EC, a small number use other highway
emissions, ~ 20 use highway proximity, ~ 5 use traffic density (a few use more than one indicator)
~ 15 of the most recent studies model vehicular emissions to the home of subjects (visual of modelled emissions next slide)
~ 20 are controlled human exposure studies using mostly diesel emissions, some using wood smoke emissions (getting to biological mechanisms)

NO2 modelled to residences in Toronto (Jerrett et al., 2009)
Health Outcomes These BC/EC/ Vehicular Emissions Studies
Examined
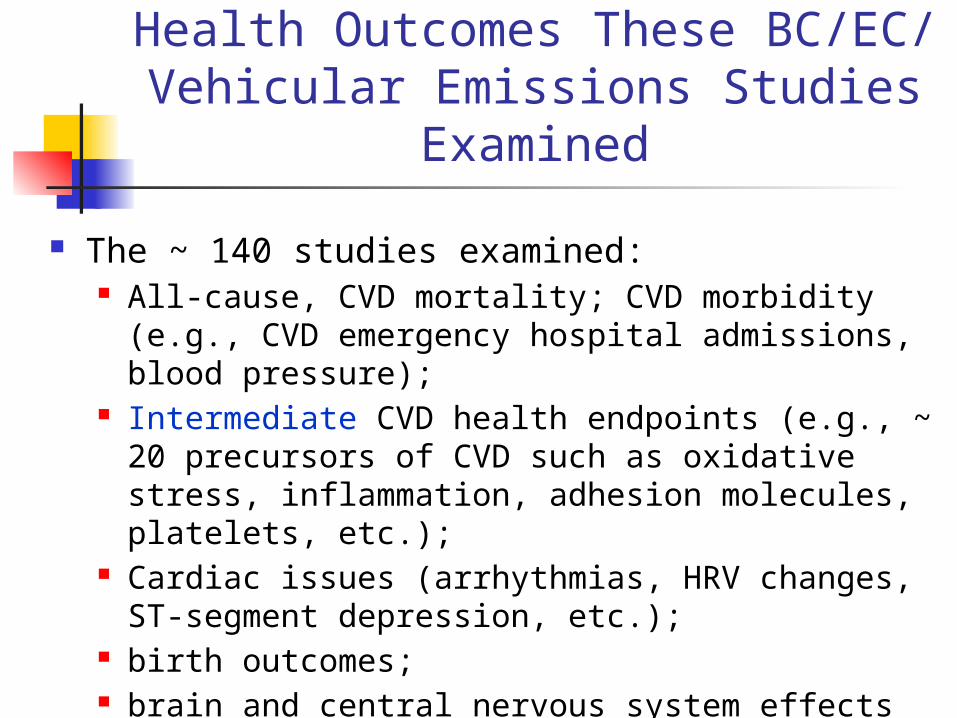
The ~ 140 studies examined: All-cause, CVD mortality; CVD morbidity (e.g.,
CVD emergency hospital admissions, blood pressure);
Intermediate CVD health endpoints (e.g., ~ 20 precursors of CVD such as oxidative stress, inflammation, adhesion molecules, platelets, etc.);
Cardiac issues (arrhythmias, HRV changes, ST-segment depression, etc.);
birth outcomes; brain and central nervous system effects

Health Outcomes These BC/EC/ Vehicular Emissions Studies
Examined
Discuss only a few lung cancer studies very briefly in CR IARC/WHO 2012 conclusion that diesel
emissions cause lung cancer makes in-depth discussion extraneous
Illustrate here with one recent study of cancer and diesel emissions (next slide)

Cancer risks from air toxics
Morello-Frosch and Jesdale (2006) Modelled concentrations of 33 Air Toxics
(including DPM, diesel particulate matter) to census tracts
Estimated cancer risks by multiplying potencies by amounts of each air toxic
Mobile sources contributed 88% of cancer risks
DPM contributed 82% of cancer risks

Caveat (1) We do not use source apportionment
studies, as in our judgment, they increase rather than reduce uncertainty (details in CR)
Researchers routinely come up with different numbers of factors (“sources”) for same locality
Grahame and Hidy, 2007; HEI, 2010
Not possible to determine, in any case, differential exposure to a “diesel emissions factor” (exposure misclassification)

Caveat (2)
For reasons of space, we do not include in CR (or today) the voluminous number of studies relating vehicular emissions to respiratory diseases (see HEI, 2010)

Caveat (3): Toxicology, Some Observational Studies: Discussed in Depth in CR (not in
Tables)
Also no time for reviewing today: Several sections in CR on toxicology of diesel and BC
(animal/cells), lengthier versions in Supplemental Material
These link biological mechanisms for health effects in epidemiological studies
Additional to the ~ 140 epidemiological or controlled human exposure studies in Tables S2 through S10
Many observational studies in CR (health effects in workers in trucking companies exposed to different levels of emissions; oxidative stress at beginning vs. end of work week in diesel repair, etc.) linking exposure to different levels of vehicular emissions to health endpoints (example)

Tables S3, S4, S5
Over 30 population-based epidemiology studies, each using many PM2.5 species (always including BC/EC), in these tables S3: mortality associations w/o accurate
exposure information (central monitor concentrations)
S4: hospital admissions (morbidity) associations w/o accurate exposure information
S5: mortality and morbidity associations when BC or other vehicular emissions are modelled to home of subjects (good exposure information)

Some results of studies using many PM2.5 species (multi county studies,
from Tables S3 and S4)
Multi-County Studies
GeographicalArea
Health Effect Studied
PM2.5 Species, Other Pollution Variables
1. Peng et al., 2009
119 counties Daily emergency CVD hospital admissions
7 largest PM2.5 components (sulfate, nitrate, silicon, BC, organic carbon, sodium and ammonium ions) Component associations: BC
2. Bell et al., 2009
106 counties Daily CVD hospital admissions
20 PM2.5 components (7 in Peng et al. [2009] above, plus 13 elements, mostly metals, incl. Fe, Zn, V and NiComponent associations: BC, V, Ni
3. Lipfert et al., 2009
206 rural and urban counties
Prospective cohort study, survival since enrollment
Twelve HAPs (incl. Ni, As, benzene, diesel exhaust noted by diesel particulates, formaldehyde, polycyclic organic materials [POM]), sulfate, NOx, EC, traffic density (proxy for traffic emissions)Early mortality associations with traffic density, benzene, formaldehyde, diesel particulate, POM, NOx, EC, Ni

Human Panel Studies (studies of specific subjects known to
researchers)
Benefits of human panel studies (type of epidemiological study) Researchers can know individual
subject’s health in detail (weight, medications, smoking, conditions, etc.), can control for these before examining effects of pollutants
Two sets of human panel studies in CR Harvard School of Public Health (Table S6,
37 studies) Delfino et al. group (Table S7, 7 studies)

HSPH studies, all including BC/EC
Health endpoints (mostly cardiovascular intermediate and cardiac endpoints) studied include:
Oxidative stress, ST-segment reduction, HRV changes, carotid artery thickness, several circulating markers of inflammation, systolic and diastolic blood pressure, soluble adhesion molecules (involved in atherosclerosis), vascular reactivity, fibrinogen, homocysteine, LINE-1 methylation, risks of different arrhythmias, T-wave alternans, telomere length
Cognition: in elderly, in children

HSPH studies, all including BC/EC
In the 10 studies (of 37) with good subject exposure to BC/EC: All 10 found BC/EC associations In 4 studies using PM2.5, half found PM2.5
associations In 2 studies using sulfate or regional emissions,
no associations In this limited sample with good exposure,
higher % of BC associations than for either PM2.5 or sulfate
Schwartz et al. (2005) example of benefits of good exposure, monitoring several PM2.5 species (next slides)

Schwartz et al. (2005) study of 4 HRV measures
8 tests of pollution associations: (two time periods, 4 different measures of HRV)
Study found associations with BC in 7/8 tests
PM2.5 associations found in 3/8 tests Authors subtracted BC from PM2.5 on
hourly basis, called the remainder “secondary PM” No associations with “secondary PM,”
similar to findings of Suh and Zanobetti (2010) and others

Monotonic decrease in HRV with increase in BC (Schwartz et al, 2005)

No HRV associations with regional PM2.5 with accurate BC
exposure

Importance of Schwartz et al. (2005)
Allows comparing effects of different PM2.5 species, with good exposure information, thus can show importance of BC as a result
Before BC monitoring, this study would have been just one more study simply finding PM2.5 associations, unable to interpret which PM2.5 species might be harmful

HSPH studies, all including BC
Remaining 27 HSPH studies, which do NOT have good BC exposure information
Significant BC associations in 20/27 studies (surprisingly, despite poor exposure information)
Significant PM2.5 associations in 20/25 studies
Significant sulfate associations in 8/14 studies
No metals included, something for future research

HSPH studies, last slide
Several of these 27 studies stated that BC associations were unexpected, that BC associations should have been attenuated. Example: “Particle measurements with…local sources,
such as mobile source emissions of BC, are typically more spatially heterogeneous than regional pollutants ...Therefore, we would have expected associations to be most attenuated for BC due to measurement error. This was not the case, as most of the strongest observed associations involved BC…” (O’Neill et al., 2007)

Delfino et al. studies
Included BC, EC, OC, particle number, “quasi-ultrafine” PM, secondary and primary OC
Excellent exposure information (monitors inside and outside residences of retirees in Los Angeles area)
Studied many intermediate CVD outcomes Daily averaging times up to 9 days BC/EC/primary OC associated with outcomes in large majority
of cases Where compared, secondary organic carbon usually not
associated, or less strongly associated that primary organic carbon
Among first studies to do such a comparison (need more study)

Introduction of EZ Pass and Birth Outcomes
(green circles = toll plazas)

Examples: Birth Outcomes - Introduction of EZ Pass
When EZ pass was introduced in late 1990s in New Jersey, and Pennsylvania, two results Less congestion, less idling, less acceleration =
> less pollution at toll plazas After EZ pass introduction, for mothers living
w/in 2 km of toll plazas, 11% reduction in prematurity, 12% reduction in lower birth weight, vs. those living w/in 2 km of freeways, but further from toll plazas
(Currie and Walker, 2009, including graphic on previous slide)


Birth Outcomes with Traffic Emissions – Studies by Ritz, Wilhelm and colleagues, other researchers
Researchers found associations with a range of adverse birth outcomes (Table S9, 19 studies):
pre-term birth and measures of low birth weight (most studies), spontaneous abortion, preeclampsia in mother, small for gestational age, (childhood cancers - one study)
Outcomes associated with many different measures of vehicular emissions:
Various vehicular emissions modelled to residence Proximity to major highways Cumulative traffic density near residence Central monitor readings (but only if not too distant
from residence)

Effects on Brain and Central Nervous System
DNA adduct: bonding of DNA to a carcinogen, such as PAH, causes mutations and other biological changes, marker for exposure (courtesy Dr. Frederica Perera)

Maternal PAH exposure and IQ of child (Perera et al., 2009)
Pregnant women wore personal monitors to record exposure to PAHs
After controlling for smoking, mother’s IQ and education level: Children with prenatal maternal PAH
exposure above the median exposure had full scale and verbal IQ scores 4.31 and 4.67 points lower than children with PAH exposure below median
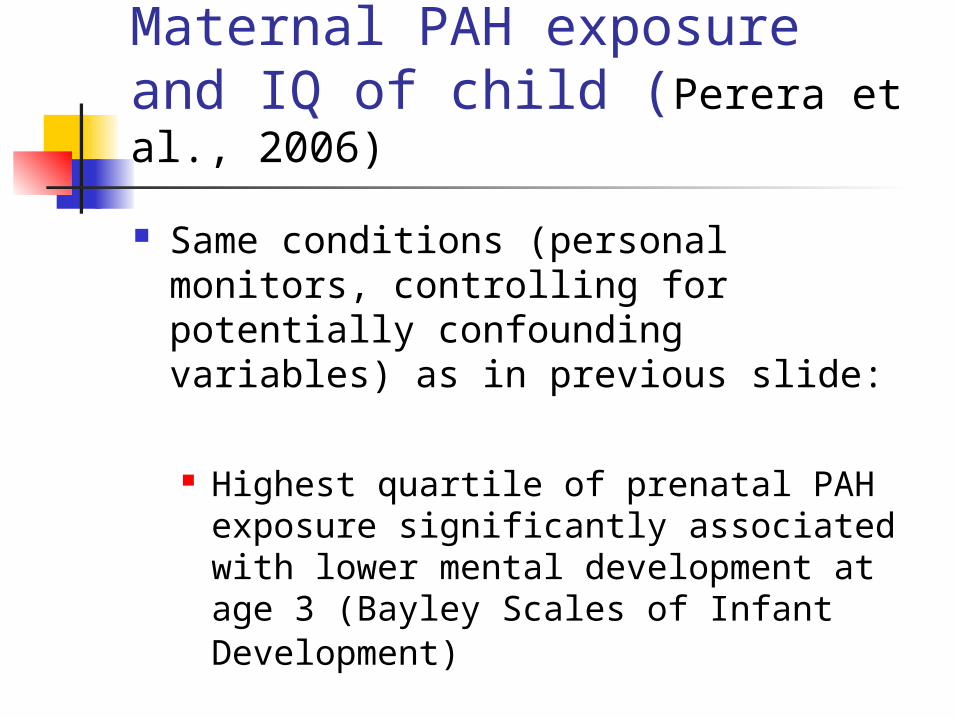
Maternal PAH exposure and IQ of child (Perera et al., 2006)
Same conditions (personal monitors, controlling for potentially confounding variables) as in previous slide:
Highest quartile of prenatal PAH exposure significantly associated with lower mental development at age 3 (Bayley Scales of Infant Development)
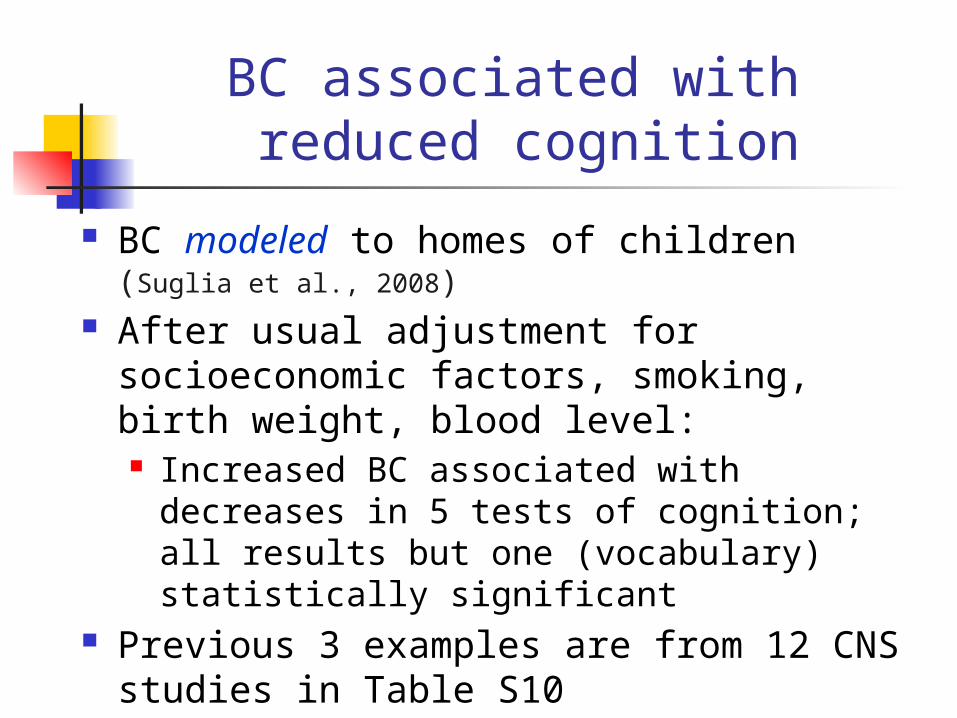
BC associated with reduced cognition
BC modeled to homes of children (Suglia et al.,
2008) After usual adjustment for socioeconomic
factors, smoking, birth weight, blood level: Increased BC associated with decreases in
5 tests of cognition; all results but one (vocabulary) statistically significant
Previous 3 examples are from 12 CNS studies in Table S10

How best judge which PM2.5 species are causally related to mortality, morbidity outcomes?
EPA uses several appropriate criteria to determine potential causality of PM2.5
We recommend that their use be extended to examine effects of different PM2.5 species, whenever any governing or regulatory body may wish to go beyond PM mass, regulate specific PM2.5 species

Several EPA Criteria for judging Causality of PM2.5
1. “Consistency of the observed association”
Do many epidemiology studies, using different designs, in multiple locations, with different data sets, consistently show elevated risks for a given mortality or morbidity endpoint?

Several EPA Criteria for judging Causality of PM2.5
2. “Coherence”
Are consistent associations in population based epidemiological studies supported by other findings from human panel, controlled human exposure, and animal toxicology studies? (Emphasis on continuity across study types)

Several EPA Criteria for judging Causality of PM2.5
3. “Biological plausibility”
Have biological mechanisms been found supporting links between exposure to an agent and adverse effects in humans? (emphasis on finding biological mechanisms which explain epidemiological findings)

Several EPA Criteria for judging Causality of PM2.5
4. “Experimental evidence” (Natural Interventions, such as ventilation of tunnels, introduction of EZ pass)
Does a change in exposure to an emission bring about a change in occurrence of health effects?

Assessing BC/EC with these metrics
So….what do we find?

1. Consistency of Associations for BC
YES Only handful of ~ 140 studies failed to find
BC/EC association (or associations using other markers for vehicular emissions)
This was true even for the large majority of studies, which used central monitor data, which should have lessened and minimized associations
Associations were more frequent for BC/EC/vehicular than with any other PM2.5 species, despite less exposure misclassification for several other species

1. Consistency of Associations for BC
These findings help explain Janssen et al. (2011) findings that reducing a unit of BC will extend life by 4 to 9 times as will reducing an equivalent unit of PM2.5
“Face Mask” studies show that removing diesel PM abrogates diesel-emission effects in healthy humans Use of face mask increases vasodilation,
decreases thrombus formation, increases release of “clot-busting” tPA (Lucking et al., 2011)
1. Consistency of Associations
Mostofsky et al. (2012), next slide: instead of different authors, mixes of PM2.5 species, populations, we have the same authors, PM2.5 species, population
But we have 3 different approaches to modelling associations in same study, with same data
Result is still consistent results for BC (but not for other PM2.5 species, except Ni)

Mostofsky et al., 2012: (3 different methods of examining ischemic stroke associations with same
data)

2. Coherence
Yes. Evidence from human panel
studies, controlled human exposure studies, toxicology supports CVD associations with BC found in population based epidemiological studies of all types examined today

3. “Biological plausibility”
Yes. Multiple biological mechanisms
(intermediate causes of CVD mortality, morbidity) found in toxicology studies of cells, animals;
Many of these same mechanisms found in human panel studies, controlled human exposure studies to diesel emissions

4. “Experimental evidence”
Yes. Bridge and traffic officers (Stern et
al., 1988); EZ Pass study We might think of highway
proximity studies in the same way (differential exposures)

Importance of size, chemistry (NRC 1998 Recommendation)
Both are important to CVD, other outcomes:
Tiniest particles penetrate deeper into lung, penetrate cell wall more easily; smaller PM often more harmful than larger PM of same type, everything else equal
But if the particle doesn’t disrupt cellular activity, may cause little harm – hence role for chemically active compounds (next slide)

Examples of importance of chemistry
Several studies find increased arterial plaque, lipoperoxidation, or oxidative potential caused by exposure to BC, by denuded organics from BC, or by SVOCs, but not by EC core itself:
Kleinman et al., 2013; Verma et al., 2011; Biswas et al., 2009
Other studies have found that tiny ultrafine PM (12 nm) does not cause DNA strand breaks or increases in DNA repair sites, but slightly larger SVOC PM (23 nm) and ultrafine “soot” PM, enriched in organics (57 nm), do cause one or both (Brauner et al., 2007)

Ultrafine PM causes more oxidative stress than larger PM, contains more
PAHs; more PAHs => oxidative stress (Li et al., 2003)

Does exposure to BC/diesel emissions shorten life by shortening telomeres?
Telomeres are like plastic caps on shoelaces, except they are at the end of your chromosomes, serve a similar protective function
When your cells divide, telomeres insure that cells divide perfectly, but they shorten with each division
When telomeres get too short, your cells don’t divide any more => senescence, biological aging
Dr. Elizabeth Blackburn won Nobel Prize (2009) for her work with telomeres

Chromosome with telomere highlighted

Can diesel/BC cause shortened telomeres, accelerated biological
aging? Tale of two literatures
Large biology literature finds that chronic oxidative stress causes telomeres to shorten more quickly, thereby accelerating biological aging, especially CVD states
Air pollution literature finds that diesel emissions/BC are associated with chronic oxidative stress HEI (2010) speculated whether oxidative stress
might be major underlying mechanism by which vehicular emissions cause harm (telomeres not addressed)

Can diesel/BC cause shortened telomeres, accelerated biological aging?
Grahame/Schlesinger (2012) hypothesize that diesel/BC emissions might cause the accelerated CVD (mortality and morbidity), observed near roadways, and with exposure to BC, via oxidative stress which may shorten telomeres, cause biological aging, various CVD morbidity states
Theory obviously needs replication, very easily could be wrong, but has possible advantage of single explanation for many different CVD effects (vs. many different explanations)

Very brief look at pollutants, health effects elsewhere
Natural experiments PAHs, BC concentrations

“Natural Experiments” Elsewhere
Launceston, Australia (Johnston et al., 2013) Town of ~ 67,000, in a valley subject to
inversions, much burning of wood for heating
Big push to convert to electric heat (hydro)
3 years later, wood heat dropped from 66% to 30% of households
14.4% drop in all-cause, 17.9% drop in CVD mortality rate among men, not observed in other locales

Huai River policy: North of river, coal (no pollution controls) provided free for heating for decades, equipment
still used

Effects of Huai River Policy Natural Experiment
Life expectancy north of Huai river 5.5 years less than south of river, mainly due to cardiorespiratory mortality
Equivalent to 2.5 billion (with a B) life years lost, based upon 500 million people living north of river

PAH levels in Northern China, where coal is used extensively
for heating
Wu et al. (2011): PAH levels in Tianjin were 2165.2 ng/m3 in winter (vs. 11.72 ng/m3 in autumn)
Wang et al. (2011): 39.4 ng/m3 (“Background site”), 355 ng/m3 (“rural village”), 1010 ng/m3 (“urban”) annual levels Comparison: Boston, MA = 18 ng/m3 (Levy et
al., 2003)

BC Estimated Emissions in Different Countries (excl. open
biomass burning)
US: 294 Gg/yr OECD Europe: 293 “ “ China: 1706 “
“ India: 406 “ “
Source: Representative Concentration Pathways (RCP) database (version 2.0) assembled for the IPCC Fifth Assessment Report (AR5) – see Table 1 in CR

Conclusion
BC and other traffic emissions (e.g., PAHs, SVOCs) appear to be causally associated with all-cause and CVD mortality, CVD morbidities, lung cancer mortality (IARC) Probably also with adverse birth
outcomes and central nervous system effects, evidence appears strong, may need more replication

Thank you!


Remaining slides to be used only if needed for discussion

Diesel Exhaust as a Hazardous Air Pollutant
http://www.epa.gov/ttn/atw/natamain/gloss1.html (last updated Feb. 22, 2011)
Diesel particulate matter: Diesel particulate matter (diesel PM) is a mixture of particles that is a component of diesel exhaust (DE). EPA lists DE as a mobile source air toxic due to the cancer and noncancer health effects associated with exposure to whole DE.

Example: Laden et al, 2000 (sulfates from different sources are present)
Study examines associations with daily mortality in six cities (1979-1988) of markers for:
vehicular emissions (Pb) dust (Si) coal combustion (Se)
For Se, and separately for sulfate as S, findings are counterintuitive –
Only Boston (city with lowest Se, and near lowest S) had significant mortality associations for either Se or S
Localities with considerably higher Se and S (St. Louis, Steubenville, Knoxville) had no Se or S mortality associations

Laden et al (2000) Se and S findings

Example: Laden et al., 2000
Why the “reverse dose response function”?
Long story short: Residual oil as burned contains traces of Se Using EPA data source for ratio of V to Se in
as-burned residual oils, over 2/3rds of Se in Boston air from local residual oil (1,700 MW) in 1980s
Calculated that about half Boston sulfate was also from residual oil combustion, mostly primary V sulfates, with Ni as well
Residual oil emissions are very toxic relative to secondary sulfate, coal fly ash

Conclusions re Laden et al (2000) findings
Se and S were significantly associated with daily mortality only in Boston, because only in Boston was residual oil an important source of each in ambient air
Se and S were not associated with daily mortality in localities with higher levels of each, because in those localities, there were no residual oil emissions
Associations per se don’t necessarily point to harm – have to understand toxicity of different co-emissions, in this case V and Ni from residual oil
Reference: Grahame and Hidy, 2004