improvement of npi fugitive particulate matter emission ... · particulate matter emission...
TRANSCRIPT
Improvement of NPI FugitiveParticulate Matter EmissionEstimation Techniques
Final May 2005

Improvement of NPI Fugitive ParticulateMatter Emission Estimation Techniques
RFQ NO. 0027/2004 Final May 2005
Sinclair Knight MerzABN 37 001 024 0957th Floor, Durack Centre263 Adelaide TerracePO Box H615Perth WA 6001 Australia
Tel: +61 8 9268 4400Fax: +61 8 9268 4488Web: www.skmconsulting.com
COPYRIGHT: The concepts and information contained in this document are the property of SinclairKnight Merz Pty Ltd. Use or copying of this document in whole or in part without the writtenpermission of Sinclair Knight Merz constitutes an infringement of copyright.

SINCLAIR KNIGHT MERZ
I:\WVES\Projects\WV02688\Deliverables\Final\R23npi_dust_review.doc PAGE i
Contents
Executive Summary 1
1. Introduction 9
2. Particulate Matter 102.1 Introduction 102.2 Terminology 102.3 Sampling Methodology 122.4 Sources of Particulate Matter from Crustal Sources 142.5 Particulate Removal 15
3. Review of Overseas Reporting Requirements 163.1 US Toxics Release Inventory (TRI) 163.2 US - National Emission Inventory (NEI) 183.2.1 Canadian National Pollutant Release Inventory (NPRI). 19
4. Emission Factor Developments in the US 234.1 Overview of US Developments 234.2 Overestimation of PM2.5 Emissions 234.3 USEPA Review of AP-42 244.4 WRAPAIR 254.5 CAAQES 25
5. Emission Factor Review 275.1 Unpaved Roads 275.1.1 USEPA Factors/Equations 275.1.1.1 USEPA AP-42 (1985 4th Edition and 1988 4th Edition Supplement B) 275.1.1.2 USEPA AP-42 (1998) 5th Edition, Supplement E 285.1.1.3 USEPA AP-42 (2003) 5th Update 2003 295.1.2 Application in US Inventories 315.1.3 NERRDC Coal Mining Fugitive Particulate Matter Studies - Hunter Valley 315.1.4 NPI EETs 315.1.4.1 Mining EET Manual - March 1999 315.1.4.2 Mining EET Manual Versions 2.0 (2000) and 2.3 (2001) 325.1.4.3 Draft Fugitive Emissions (Version 1.1 - September 2002) 325.1.4.4 EET for Aggregated Emissions from Paved and Unpaved Roads –
September 1999 335.1.4.5 Kalgoorlie NPI Trial 335.1.5 Other Australian Research 345.1.6 Particulate Matter Controls 35

SINCLAIR KNIGHT MERZ
I:\WVES\Projects\WV02688\Deliverables\Final\R23npi_dust_review.doc PAGE ii
5.1.6.1 Comparison of Equations and defaults used in the NPI EETs 365.1.7 Recommendations for Unpaved Roads 395.2 Wind erosion from Industrial Areas and Mine Sites 405.2.1 USEPA methods 405.2.1.1 Industrial Wind Erosion 405.2.1.2 Western Surface Coal Mining 425.2.1.3 Other Models Considered Relevant 425.2.1.4 NPI Methods 465.2.1.5 Control factors 475.2.1.6 Other Australian Studies 485.2.2 Summary and Recommendations 515.3 Material Handling Load-in/Load-out 525.3.1 USEPA AP-42 525.3.2 NPI and Australian Studies 535.3.2.1 Truck Loading and Dumping 535.3.2.2 Transfer Points, Stacking and Reclaiming 545.3.2.3 Crushing 585.3.2.4 Screening 585.4 Blasting 595.4.1 USEPA AP-42 595.4.2 NPI 625.5 General Comments on Control Factors 635.6 Particulate Removal 64
6. Particulate Size Distributions 65
7. Metal Speciation 707.1 Default NPI Speciation Provided 707.2 Recommendations 72
8. Prioritising Particulate Matter Issues 748.1 Comparison to Survey Respondents 75
9. Conclusion and Recommendations 779.1 General Comments 779.2 Specific Recommendations 78
10. Glossary 84
11. References 88

SINCLAIR KNIGHT MERZ
I:\WVES\Projects\WV02688\Deliverables\Final\R23npi_dust_review.doc PAGE iii
Document History and StatusRevision Date issued Reviewed by Approved by Date approved Revision type
A 5/11/2004 B.BrownM.Pickett
5/11/2004 Draft
B 2/2/2005 B.BrownO.Pitts
J.Harper 2/2/2005 Final Draft
C 8/4/2005 P.MendeO.Pitts
J.Harper 8/4/2005 Final Draft
1 9/5/2005 O.PittsB.Brown
B.Brown 9/5/2005 Final
Distribution of copiesRevision Copy no Quantity Issued to
A Draft 4 Ross Yarwood
A Draft Electronic Ross Yarwood
B Final Draft 4 Ross Yarwood
B Final Draft Electronic Ross Yarwood
C Final Draft 3 Ross Yarwood
C Final Draft Electronic Ross Yarwood
1 Final 4 Ross Yarwood
1 Final Electronic Ross Yarwood
Printed: 16 May 2005
Last saved: 13 May 2005 09:37 AM
File name: I:\WVES\Projects\WV02688\Deliverables\Final\R23npi_dust_review.doc
Author: Owen Pitts
Project manager: Jon Harper
Name of organisation: WA Department of Environment
Name of project: Improvement of Fugitive Particulate Matter Emission Estimation Techniques
Name of document: Improvement of Fugitive Particulate Matter Emission Estimation Techniques
Document version: Final
Project number: WV02688

SINCLAIR KNIGHT MERZ
I:\WVES\Projects\WV02688\Deliverables\Final\R23npi_dust_review.doc PAGE 1
Executive SummaryThe NPI is a program designed to provide the community, industry and government with information onthe types and amounts of certain substances being emitted to the air, land and water.
The NPI program published the Mining Emission Estimation Technique Manual (hereafter referred to asthe NPI Mining Manual) in June 1999, after its development by consultants and many mining industryrepresentatives. This manual contains emission estimation techniques (EET) and emission factors forparticulate matter with a diameter of less than 10 µm (PM10) and Total Suspended Particulate (TSP) basedon a variety of sources, including many from the United States Environmental Protection Agency(USEPA) and the Australian coal mining industry.
There has been significant feedback from the wider non-coal mining industry to the NPI programexpressing concerns over the calculation methods and emission factors included in the NPI MiningManual for fugitive PM10 and metal and compounds emissions from mining activities such as stockpiles,open areas and windblown dust. In many instances facilities have been directed to use coal emissionfactors in the absence of emission factors for their specific ore or waste types.
The emission of “toxic” metals in particulate matter is a potentially highly contentious issue. Particulateemissions are an environmental issue in towns such as Port Hedland and Esperance, and in other locationsin Australia where large quantities of mining material are handled. NPI reporters from mining, quarrying,mineral sands and other industries have expressed strong interest in improving estimates of PM10.
As a result, a study was conducted to review the status of, and identify and recommend ways to improve,emission estimation methodologies for fugitive (non-combustion) PM2.5, PM10, TSP and metals/metalcompounds in particulate matter from mining (non-coal) and other industrial activities for NPI reporting.The first phase of the review was a consultation with mining companies and consultancies covering abroad range of non-coal mining industries. This report presents the second phase of the project andcontains a review of the status of techniques listed in USEPA AP-42 and the USA’s Toxic ReleaseInventory (US TRI), as well as the Canadian National Pollutant Release Inventory (NPRI). The reportalso develops recommendations on potential improvements to the current methods, further test work thatcan be conducted to improve the techniques to Australian non-coal mining conditions and the potentialcosts that such work may incur.
With respect to general comments, the review concludes that particulate matter emission sectionsincluded in the NPI Mining Manual and the current draft of the NPI Fugitive Emissions EmissionEstimation Technique Manual (NPI Fugitive Emissions Manual) are not well written or documented, withmany of the emission factors in need of revision.

SINCLAIR KNIGHT MERZ
I:\WVES\Projects\WV02688\Deliverables\Final\R23npi_dust_review.doc PAGE 2
Other general recommendations include:
1) As a priority, the draft NPI Fugitive Emissions Manual should be rewritten to incorporate thechanges recommended in this report. This will involve incorporating the newer USEPA AP-42emission factors;
2) Individual default factors should be removed where possible with only the emission equationsupplied, or the equation and a range of default factors; and
3) A number of actions and studies be undertaken to obtain/collate data to improve the factors for theAustralian situation. It is recommended that, if funding permits, these studies be conducted with anyresultant improvements to estimation techniques being added to future versions of relevant EETManuals.
Specific recommendations of the report comprise:
Vehicle Emissions - Unpaved RoadsR1 Incorporate the recent December 2003 USEPA AP-42 unpaved road equations into the NPI
Fugitive Emissions Manual. It is noted that the draft version of the NPI Fugitive EmissionsManual has a number of errors that require correction, such as deletion of the soil moisture table.
R2 Single default emission factors should not be provided as there can be large variations betweenthe vehicle fleets and road characteristics at different sites. If defaults are to be provided theyshould be given for the various combinations of typical vehicle fleets (for example vehicle usageon haul roads at a mine site and a typical light vehicle fleet) and for typical uncontrolled andcontrolled roads. To assist companies in estimating the appropriate emission factor for their site,it is recommended that the NPI Fugitive Emissions Manual include a compilation of typical siltcontents, as well as moisture contents for various Australian industry groups, as per the USEPAguides.
R3 Update the unpaved road control factor with separate methods for:
Fresh water, using either:
- The equation of Cowherd et al (1988). This will require mines to estimate the numberof vehicle passes and watering rates on the various roads. Estimates of the hourlyevaporation rate could be undertaken using annual evaporation estimates andconverting these to a maximum hourly value using a multiplier as in Cowherd et al(1988); or
- The current USEPA approach where moisture contents for the road in a controlled anduncontrolled state under typical traffic conditions are measured.
Use of organic chemical suppressants, using for example the US AP-42 methodology; and
SINCLAIR KNIGHT MERZ
I:\WVES\Projects\WV02688\Deliverables\Final\R23npi_dust_review.doc PAGE 3
Use of salts including the use of hyper-saline water. It is considered that test work,estimated at $20,000, is required to develop appropriate control factors.
R4 Though not strictly applicable to the NPI Mining Manual, it is considered that the AggregatedEmissions from Paved and Unpaved Roads EET Manual should be updated to include the newAP-42 equations, including a default moisture content of 1% (following the US NEI) and typicalAustralian data for road silt contents. This may involve a desktop study or in-field sampling.
Wind ErosionR5 The current default factor should be deleted. It is considered that emission estimates can be
readily obtained with the current NPI equation and this should be used to take into accountclimate variations across Australia. This will result in some areas having emission factors that aretwice as high as the current default with some areas having considerably lower emissions;
R6 Though the current NPI equation is considered indicative only, there appears to be no readyreplacement, with the existing AP-42 equation considered to be based on little data for non-coalmines and difficult to implement (eg. estimation of threshold friction velocities). Therefore it isrecommended that:
The current NPI equation should be retained in the interim.
The NPI coordinate with the US groups (USEPA and WRAPAIR) to determine and progresstoward a new equation with more supporting studies for this.
The NPI liaise with the wind erosion community within Australia to see if a more suitableequation or simple model for mines could be developed. Such work may includeundertaking a single case study to verify the methodology or the development of portablewind tunnel methodology to determine relative erodibility potential of materials.
R7 The NPI develops or commissions estimates for all fugitive particulate matter sources withinAustralia, such that the mining fugitive emissions can be placed in context, as is provided in theUS NEI. At present in most regions of Australia, fugitive particulate matter from mining ispresented as the only large source, with other larger sources of PM10 and “metals” such as fromwind erosion of non mine areas, from agricultural activities and bush fires omitted. For winderosion estimates it is recommended that the NPI liaise with those in the Australian Air QualityForecasting System (AAQFS) who are currently evaluating a system that predicts PM10 winderosion emissions and the resultant PM10 concentrations for Australia. Alternatively, a systemusing the CARB approach as used in the Pilbara and Bunbury airsheds (SKM, 2003 and SKM,2003b) and recently undertaken for Victoria (Ng, 2004) could be used. The use of a nationalapproach would also have the advantage of providing consistency across Australia. Other sourcesof particulate matter from agricultural practices and fires could also be coordinated at a nationalor at least state level. PM10 estimates from fires could be obtained in conjunction with the

SINCLAIR KNIGHT MERZ
I:\WVES\Projects\WV02688\Deliverables\Final\R23npi_dust_review.doc PAGE 4
national greenhouse gas emission estimates as they both require fuel loading and the area burned.The development of estimates for all fugitive particulate matter sources within Australia has thepotential to cost around $100,000.
R8 Alternative methods, such as using validated particulate matter dispersion models, should behighlighted as an acceptable alternative to the AP-42 equation. Such a method can consist ofwell-sited ambient monitors that are free from confounding sources, along with the use of back-calculation techniques involving dispersion models. It is recommended that all such studies havean independent technical review to ensure that the estimates are acceptable. This method wouldinitially require a statement in the manual indicating that is an acceptable option, though requiringagreement on a case by case basis with the relevant State NPI department.
R9 Wind erosion control factors need to be improved to provide more detail on how to classifysurface types. A possible method may be to supply photographic examples of bare areas as perthe method used in RWEQ. This is recommended as greater than a factor of two variation canoccur due to the subjective interpretation involved in classifying the amount of erodible area andthe relevant control factors for a particular site.
R10 A wider range of control factors is needed for water cannon control to give credit to facilities withwell designed and maintained systems. To undertake this, a review of water cannon control isrecommended as a first step. The authors are aware of one study currently underway to determinecontrol factors for water cannon.
Material HandlingR11 For loading/unloading trucks it is recommended that, as a first step, an in-depth review of the
derivation of the USEPA AP-42 load-in/load-out emission equation is required to resolve theapparent large underestimation in emissions when using this equation, compared to that measuredat Australian mines.
R12 For transfers, reclaimers and stackers, it is recommended that, as per loading/unloading trucks areview of the derivation of the USEPA load-in/load-out equations be undertaken to resolve theapparent underestimation of emissions. As an interim measure it is recommended that thedefaults be retained but usage of the equation be dissuaded.
R13 When considering the moisture content of ores, as a second higher level of complexity to usingthe default 4% cut off between high and low moisture content ores, mines should be encouragedto use the rotating drum test to classify the dustiness of the ore as either high or low moisture. Ingeneral, the available data supports the default 4% cut off but the limited test work presented inthis report indicates that thresholds may vary between at least 3 to 5.5%.

SINCLAIR KNIGHT MERZ
I:\WVES\Projects\WV02688\Deliverables\Final\R23npi_dust_review.doc PAGE 5
R14 As a low priority task, it is recommended that dustiness tests be used to account for the dustinessof the ores as a function of moisture. It is considered that this captures the true dustiness of theore rather than trying to fit a simple universal moisture and silt particulate matter relationship tothe ore as is used for moisture in the current and both moisture and silt in the older AP-42material handling equations.
R15 For crushing emissions, the new AP-42 stone crushing and quarrying factors be included as thedefaults for the stone crushing and quarrying industry.
R16 For screening emissions, the emission factors should be updated with those in the new AP-42crushed stone processing and pulverised minerals guide. For primary, secondary and tertiaryscreening at stone processing and quarrying operations the AP-42 “screening” factors areapplicable, whilst for iron ore re-screening the “fines screening” factor is considered applicable.
BlastingR17 Though there is little support for the application of the current AP-42 blasting equation, and
despite it being dropped from AP-42 Crushed Stone Processing and Pulverized MineralProcessing guide, it is recommended that:
The new AP-42 equation be retained in the interim;
NPI liaise with the USEPA to investigate further work planned to improve this factor; and
NPI investigate the feasibility of conducting Australian testing using aircraft to profile theparticulate matter plume to derive estimates. Such methods have been used for otheraerosols such as smoke plumes from fires and industrial sources using the FlindersUniversity aircraft and CSIRO.
Issue of Particulate RemovalR18 It is recommended that the NPI review the issue of particulate removal, noting that depletion for
pit retention is incorporated but other removal mechanisms, such as vegetation belts, are not. Inthe case of mines, it is considered that the pit retentions are very indicative and that guidanceshould be provided so mines can develop site-specific factors using a model such as ISC3.
Particulate Size IssuesR19 Fugitive particulate matter PM2.5 emissions should not be included in NPI reporting at this stage.
There is a need to resolve the various issues with estimating PM2.5 from fugitive crustal sources,with the PM2.5 emission factors likely to be revised substantially in the next few years. Secondly,fugitive PM2.5 from crustal sources are a small component of overall PM2.5 emissions, based onUS work, with the majority of PM2.5 originating from gas to particle conversion or from sourcesnot covered in the current NPI reporting. Additionally, there are a number of issues in the TSPand PM10 emission estimation methods that should be resolved as a higher priority.

SINCLAIR KNIGHT MERZ
I:\WVES\Projects\WV02688\Deliverables\Final\R23npi_dust_review.doc PAGE 6
R20 With the large amount of knowledge available on wind erosion (from wind erosion scientists) it isrecommended that their work and models be utilised to develop more realistic particle sizedistributions at emission. It is considered that particle size distributions may have some windspeed dependence, and should not be a constant factor as in the current AP-42.
Metal SpeciationR21 Collate and review available metal speciation undertaken by different mining sectors to determine
if sector based default factors can be developed. The speciations should preferably be for the siltfraction or even dust fraction and not the bulk ore;
R22 If insufficient quality data is available from R21, it is recommended that the NPI coordinate astudy to obtain particulate matter speciation for fugitive particulate matter sources from miningactivities within Australia. Such a study should involve:
Coordinating particulate matter samples taken from representative mining sectors with thesamples sent to a central laboratory for analysis. It is considered that coordinating onelaboratory with the samples processed in a batch should achieve cost reductions and ensureconsistency and quality of the data;
Sampling sources from the surfaces of unpaved roads, wind erosion of stockpile areas and“tailings areas” using standard sampling techniques for roads and other areas. Unpaved andpaved road areas should be composites of a facility’s roads weighted by their contribution toparticulate matter emissions or split into areas adjacent to stockpiles and elsewhere. Thiswould provide representative road surfaces where there is deposition of ore and thereforepotential enhancement of metals derived from the ore body. It is also suggested that analysisbe conducted on the parent material to determine the potential enrichment for the metals;
Conducting the analysis in a laboratory through sieving, re-suspension of the particulatematter and then sampling with the selected particle size sampler as described by Watson et al(1998). This procedure is recommended as this method is considered easier, subject to lessinterference from other particulate matter sources and more cost effective than sampling witha high volume air sampler immediately downwind of such sources.
Sampling of mining sectors should include, but not be limited to iron ore, gold, quarrying,mineral sand and bauxite (including refineries). It is suggested that the size fraction forsampling should be PM10 to be consistent with CARB. Additionally, as this is between thePM2.5 and TSP fractions, the speciation should not be too dissimilar to either of these sizefractions; and
Analysis of the full range of metals in the NPI list, and any others recorded by standardanalytical methods as detailed in Chow and Watson (1998), with method detection limitsbelow 0.01 ppm.

SINCLAIR KNIGHT MERZ
I:\WVES\Projects\WV02688\Deliverables\Final\R23npi_dust_review.doc PAGE 7
R23 The NPI program consider undertaking testing for public unpaved roads at the same time as thetesting in R22. Such testing could involve sampling up to five representative unpaved roadsurfaces in each State. In Western Australia, this could include a typical Pilbara road, a coastallimestone-based road, a typical Wheatbelt road etc. This would significantly improve unpavedroad metal speciation and would also provide data for comparison to mining road speciation. It isnoted that in the Bunbury airshed study (SKM, 2003) unpaved/paved roads were estimated tocontribute 85% of the PM10 emissions and over 73% of the emission for the 11 metals providedwith default speciations.
Table 1 has been compiled to assist in determining the costs associated with the recommendations listedabove. This table also suggests wether the necessary work can be conducted as a desktop review or iffieldwork is required. The costs presented in this table are an approximate estimate only as more accuratecostings can only be determined with a comprehensive scope of work.
Table 1 Possible testwork and estimated costs of completing recommendations
RecommendationNo. Possible Testwork Estimated
Cost
R1 Incorporate the recent 2003 USEPA unpaved road equation into the NPI FugitiveEmission Manual.Correct errors in the NPI Fugitive Emission Manual.
$4,000
R2 Compilation of default emission factorsCompile a list of typical silt and moisture contents for various industry groups.Collaboration between mines in similar areas has the potential to decrease thecosts associated and increase the accuracy of the results.
$5,000$30,000
R3 Update the unpaved road control factor for:- Fresh water using either Cowherd et al (1988) or the current USEPA approach- Chemical suppressants (including AP-42 methodology) (desktop study)- Applicable reductions for use of saline/hyper-saline water (field work)
$1,500$2,000$20,000
R4 Update the Aggregated Emissions from Paved and Unpaved Roads EET Manualto include the new AP-42 equations with a default moisture content and typicalroad silt content for Australian roads- Desktop study- Field work (could potentially be conducted in-conjunction with R2)
$5,000$30,000
R6 Development of a suitable wind erosion equation for mines.- Case study to verify methodology of an existing equation- Development of portable wind tunnel methodology
$10,000$40,000
R7 Develop estimates for all fugitive particulate matter sources within Australia. $100,000R9 Provide further detail on how to classify surface types. A request to NPI
reporters to submit photographs should be sufficient. Various photographs canthen be incorporated into the NPI Mining Manual as examples.
$1,000
R10 Development of control factors for the use of water cannons. As the authors areaware of at least one study the first step would be to obtain the results of thisstudy and determine its applicability. The second step would be to determinewhat other studies have been conducted in Australia. This recommendationwould primarily be a desktop study.
$5,000

SINCLAIR KNIGHT MERZ
I:\WVES\Projects\WV02688\Deliverables\Final\R23npi_dust_review.doc PAGE 8
R11 In-depth review of how the USEPA derived the equation for loading/unloadingtrucks.
$6,000
R12 In-depth review of how the USEPA derived the equations for load in/load out. $7,000R17 Using airborne monitoring equipment to profile the particulate plumes derived
from blasting.$60,000
R18 The review of particulate removal (green belts and pit retention) would initially bea desktop study into its applicability to the mining industry and the potential useof models.
$7,000
R20 Develop realistic particle size distributions at the emission source by collatingcurrently available information.
$10,000
R21 To determine if industry specific metal speciation is required a review of thecurrent speciation from various mines/industries would need to be conducted.
$15,000
R22 If required, further investigations into metal speciation would requireCoordinating samples from representative industries to a central laboratory. Thesamples would be obtained from unpaved roads, tailing dams, stockpiles anderodible open areas using a standard sampling technique.Laboratory analysis
$20,000
$50,000
R23 Conduct testing of unpaved public roads at the same time as the sampling inR22
$80,000

SINCLAIR KNIGHT MERZ
I:\WVES\Projects\WV02688\Deliverables\Final\R23npi_dust_review.doc PAGE 9
1. IntroductionThe Western Australian Department of Environment (DoE) has commissioned Sinclair Knight Merz toreview the status of, and identify and recommend ways to improve, the current emission estimationmethodologies used to calculate fugitive (non-combustion) particulate matter. The review is to cover allcomponents of fugitive emissions including PM2.5, PM10, TSP and metals/metal compounds from non-coal mining industries (gold, base metals, iron ore, bauxite, quarries).
The first phase of this review was a summary response document compiled from a questionnaire sent tovarious mining companies and consultancies covering a broad range of non-coal mining industries. Thesummary document contains the responses to the questionnaire as well as including all the comments andconcerns that various companies have regarding fugitive particulate matter emission estimation.
This report covers the second phase of the project and contains a review of current emission estimationtechniques used in the NPI Mining Manual and Aggregated Emissions from Paved and Unpaved RoadsEET Manual. The report also presents a review of the status of techniques listed in the USEPA AP-42,US NEI and the US TRI, as well as the NPRI. The report provides recommendations on potentialimprovements to the current EETs, further test work that can be conducted to improve the techniques forAustralian non-coal mining conditions and the potential costs that such work may incur.

SINCLAIR KNIGHT MERZ
I:\WVES\Projects\WV02688\Deliverables\Final\R23npi_dust_review.doc PAGE 10
2. Particulate Matter
2.1 IntroductionSuspended particulate matter can be defined by its size, chemical composition and source. Particles canalso be defined by whether they are primary particles, such as pollens, sea salt from evaporating seaspray, a suspension of the fine fraction of soil by wind erosion or soot particles from incompletecombustion; or secondary particles, such as those formed from gas by particle conversion of sulphate ornitrate particles from sulphur dioxide and oxides of nitrogen. In this report, only particulate matter andthe emission factors applying to (non-combustion) fugitive and crustal sources are discussed. Fugitiveparticulate matter is particulate matter that cannot be reasonably collected by passing through a stack,chimney or vent. Sources of such particulate matter include wind erosion, wheel generated dust, roadrepairs, blasting, storage or transportation of particulate matter, sandblasting, tilling, feedlots and metallicfumes from many industrial processes such as welding.
For simplicity in this report, fugitive dust will be referred to as particulate matter. It is noted that thereare other types of particulate matter, however these are beyond the scope of this report.
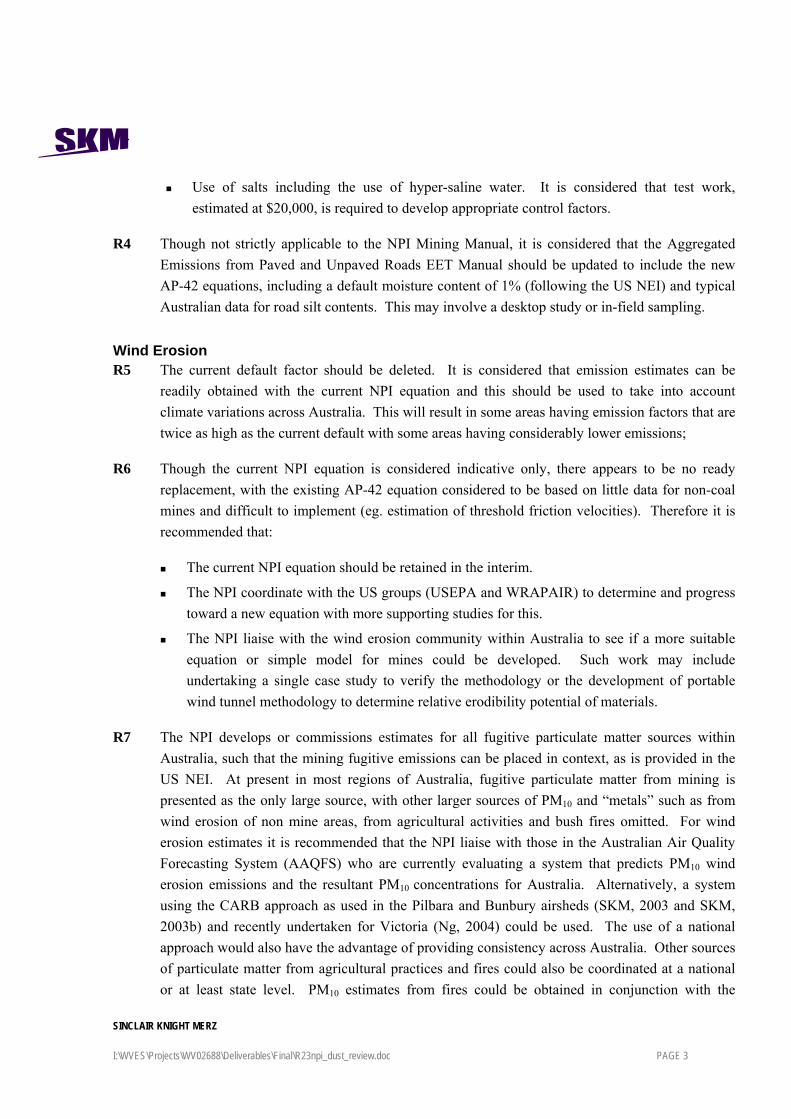
2.2 TerminologyTypically, particulate matter is characterised by its size as measured by collection devices specified byregulatory agencies. The particulate size ranges specified in ambient air criteria are total suspendedparticulate (TSP), particulate matter below 10 microns (PM10) and particulate matter below 2.5 microns(PM2.5) (see Figure 1).
TSP refers to particulate that can remain suspended in the air or can be measured though a TSP sampler(see Section 2.3). This particle size does not correspond to a fixed physical size, but varies, as the size ofparticle that can remain suspended in the air is a function of air turbulence. Under strong winds and overrough surfaces, particles with aerodynamic diameters up to 100 microns can remain suspended, whilstunder lighter wind conditions these particles will typically fall out within several minutes. Theaerodynamic diameter is the diameter of a sphere of density 1 gm/cm3 that has the same settling velocityas the particle of concern. Aerodynamic diameters are used to standardise particle sizes because particlesettling velocity, and the ability to penetrate into the respiratory tract (or be separated by a samplinghead), are dependent on the size, shape and density of the particle. For example, an iron ore particle ofphysical size of 4.5 microns with density 5.2 g/cm3 will behave as an aerodynamic particle ofapproximately 10 microns.
SINCLAIR KNIGHT MERZ
I:\WVES\Projects\WV02688\Deliverables\Final\R23npi_dust_review.doc PAGE 11
Figure 1 Typical particle size distributions from Watson and Chow. Fugitive particulate matterdominates the coarse mode.
PM10 and PM2.5 particles are those that are sampled with PM10 and PM2.5 samplers, which have a 50% cutpoint at 10 and 2.5 microns respectively. An illustration of the size of a particle of 10 and 2.5 micronsdiameter in relation to a human hair is presented in Figure 2.

SINCLAIR KNIGHT MERZ
I:\WVES\Projects\WV02688\Deliverables\Final\R23npi_dust_review.doc PAGE 12
Figure 2 Example of particle sizes (From Qld EPA, 2005)Note: 1,000 microns (µm) = 1 millimeter
2.3 Sampling MethodologyFor TSP measurements, high volume air samplers are the reference sampler used in the US. In Australiathere is an Australian standard (AS/NZS 3580.9.3:2003) covering their operation. High volume TSPsamplers typically have a simple tent shaped covering, which is designed to keep the rain off the filterpaper. Due in part to the simple tent shaped head, the collection efficiency of a TSP sampler is verydependent on the ambient wind speed and the orientation of the sampler to the wind. Generally the lowerthe wind speed, the higher the collection efficiency. This is illustrated in Figure 3. Being dependent onthe wind speed and orientation, the 50% cut off for the sampler will vary between 30 and 80 microns.Additionally, even at a given wind speed and direction “the efficiency curve of the sampler is very broad,extending from 100 percent capture of particles smaller than 10 µm to a few percent capture of particlesas large as 100 µm” (MRI, 1998). In the US an effective cut off point of 30 µm aerodynamic diameter isfrequently assigned to the standard high volume air sampler with this termed suspended particulate (SP).SP, also be denoted as PM30 is often used as a surrogate for TSP. (MRI, 1998).
The above collection efficiency variation of TSP samplers is important as the concentrations and theemission factors determined are a function of the wind conditions at the time the measurements weretaken. Therefore, in some cases PM30 emission factors (as often reported in the US AP-42) maysignificantly under-represent the actual TSP emissions as a significant proportion of larger particles maynot be accounted for.

SINCLAIR KNIGHT MERZ
I:\WVES\Projects\WV02688\Deliverables\Final\R23npi_dust_review.doc PAGE 13
Figure 3 Collection efficiency of TSP samplers (from Aerosols, Ess and Schneider, et al, 1986,p. 27). Note SSI is Size Selective Inlet
Ambient air PM10 and PM2.5 samplers are defined by their 50% cut off point and the slope of thecollection efficiency at their cut point. The collection efficiency is independent of the wind speed, unlikethe older TSP samplers. Plots of the collection efficiency curves for PM10 and PM2.5 and their comparisonto respirable, thoracic and inhalable size fractions are presented in Figure 4. This indicates that for PM10
samplers, particles up to around 15 µm aerodynamic size can be measured, though at a low probability.Therefore, greater than 50% of the particulate measured by a PM10 sampler may be in fact greater than 10micron if the ambient particulate has the majority of its mass larger than 10 microns, as occurs for mostcrustal particulate matter (see Figure 4). This is a result of the broad PM10 sampler cut point and haslarge implications on the comparability of emission factors and estimates for different sources of PM10
(see Section 4.5).

SINCLAIR KNIGHT MERZ
I:\WVES\Projects\WV02688\Deliverables\Final\R23npi_dust_review.doc PAGE 14
0%
20%
40%
60%
80%
100%
1 10 100Aerodynamic Diameter (µm)
Cum
ulat
ive
Effic
ienc
y
Respirable Fraction Thoracic Fraction Inhalable FractionEPA PM2.5 Sampling Criteria EPA PM10 Sampling Criteria
2.5
Figure 4 Sampling Efficiency Curves for Particulate Samplers from Shaw et al (2004). Notecumulative efficiency should read collection efficiency
2.4 Sources of Particulate Matter from Crustal SourcesParticulate matter from crustal sources is generated by the suspension of the fine fraction of crustalmaterials through either wind or mechanical processes.
Wind generated particulate matter occurs when the wind speed exceeds the “threshold” velocity forerosion of the underlying surface. Under these conditions, particles greater than 100 microns thatprotrude above the surface are dislodged by shear forces and bounce and creep across the surface. Theseparticles by their bouncing, skipping motion can dislodge smaller particles, which then remain suspendedin the air. The amount of particulate matter generated is therefore highly dependent upon the wind speed.Below the wind speed threshold, (normally in the range of 5 to 10 m/s measured at 10 m above groundlevel), no particulate matter is generated, whilst above the threshold, particulate matter generation tends toincrease with the cube of the wind speed. The amount of particulate matter generated is also dependenton the surface properties; including whether the material is crusted, the amount of non-erodible particlespresent (particles greater than several millimetres that tend to protect the smaller particles) and the sizedistribution of the material.

SINCLAIR KNIGHT MERZ
I:\WVES\Projects\WV02688\Deliverables\Final\R23npi_dust_review.doc PAGE 15
Mechanical processes that generate and potentially release particulate matter include material movement(such as grinding operations, dropping at conveyor transfer points, stacking, reclaiming and ship loading),blasting and vehicular movement. The amount of particulate matter generated from these processes doesnot have as high a wind speed dependency as that from wind erosion, and is dependent on the moistureproperties of the material being transferred, size distribution of the material, drop heights and theparticulate matter controls in place.
Particulate from crustal sources y generally have a median diameter in the range of 10 to 20 micron withthe majority of the particulate greater than 10 micron. Figure 1 for example indicates that crustal fugitiveparticulate matter from mining operations and wind erosion have a mode around 10 microns with minimalparticulate matter below one micron. TSP samplers and even PM10 samplers will therefore measure asignificant fraction of the coarse mode, whilst PM2.5 samplers will only sample the very tail of fugitivecrustal particulate matter. PM2.5 samplers will instead contain a relatively greater fraction of particulatematter from non-crustal sources such as particulate from gas to particle conversion.
2.5 Particulate RemovalParticulate matter below one micron is removed through processes such as coagulation to form largerparticles; by acting as condensation nuclei for the formation of cloud droplets; and through precipitationscavenging by falling water droplets. Particulate matter below one micron has negligible settling velocityand is not removed appreciably by sedimentation or impaction onto surfaces such as vegetation. Forparticulate matter greater than several microns, gravitational and inertia effects are important with theparticles removed reasonably efficiently by vegetation and other obstacles. In addition to removal bysettling and capture, removal can occur through “filtering” of the air by vegetation, as commonly occurswith trees along the sides of unpaved roads. Recently in the US there has been much work on definingthe removal of PM2.5. The studies showed that capture rates of up to 80% can occur in areas wherebuildings or dense vegetation surround the emission sources, which is much higher than has beenconsidered in the past for these small particles (Pace, 2004). Large particles greater than tens of micronsare removed primarily through gravitational settling.

SINCLAIR KNIGHT MERZ
I:\WVES\Projects\WV02688\Deliverables\Final\R23npi_dust_review.doc PAGE 16
3. Review of Overseas Reporting RequirementsThis section provides a review of the requirements for reporting PM2.5, PM10, TSP and metals or metalcompounds in particulate matter in use or planned by the US TRI and the NPRI.
3.1 US Toxics Release Inventory (TRI)The TRI was developed from community requests for the right to know what was emitted from industryand is legislated under the Emergency Planning and the Community Right-to-Know-Act (EPRCA). Thegoal of TRI is to empower citizens, through information, to hold companies and local governmentsaccountable in terms of how toxic chemicals are managed. The USEPA compiles the TRI data each yearand makes it available through several data access tools, including the TRI Explorer and Envirofacts.
The TRI program commenced in 1987 with the first reporting year being 1988. Since its inception thenumber of chemicals and chemical categories has roughly doubled to approximately 650. The TRIprogram does not cover all industry groups in the US, but was expanded in 1999 to cover seven additionalindustry sectors beyond the original manufacturing industries. Included amongst these were the majorityof the mining industry. Recently, the reporting thresholds for certain persistent, bio-accumulative, andtoxic (PBT) chemicals have been reduced in order to be able to provide additional information to thepublic on these chemicals.
Reporting by a facility is required if the facility meets all the following points:
1) It is covered under an industry category. Industry categories included are Metal Mining and CoalMining. Sub categories under Metal Mining include:
1021 - Copper ores
1031 - Lead and zinc ores
1041 - Gold ores
1044 - Silver ores
1016 - Ferroalloy ores, except vanadium
1099 - Miscellaneous ores, not elsewhere classified, including bauxite, ilmenite, rare earthsmining, tin and titanium mining.
It is noted however that mining of iron ore, uranium-radium-vanadium ores and metal mining servicesare exempt as well as non-metals mining, such as quarrying for aggregate, sand and clays.
2) The number of employees exceed 10 or more full time employees (20,000 hours) per year;
3) The facility manufactures (which includes importation), processes, or otherwise uses the listedchemicals; and

SINCLAIR KNIGHT MERZ
I:\WVES\Projects\WV02688\Deliverables\Final\R23npi_dust_review.doc PAGE 17
4) Thresholds are exceeded for the listed chemicals. The thresholds are 25,000 pounds for non-persistent bio-accumulative toxic from manufacturing or processing (applicable to mining), and10,000 pounds for otherwise use.
If the reporting threshold listed above is exceeded and the “use” of that chemical exceeds the de minimusamount of 1% (or 0.1% for certain air toxics), then reporting is required for the various pathways of thechemical including emissions to air. A de minimus amount is an amount considered so minor that it canbe disregarded.
For metal mining facilities, the industry guidance in the Metal Mining Facilities (Handbook)(USEPA, 1999) provides little guidance on the exact procedures to be followed. The guidance indicatesthat direct monitoring (eg a point source such as the exhaust from a scrubber), mass balance, emissionfactors such as from AP-42 or engineering calculations (eg Raoult’s law etc for vapour emissions) areapplicable. For crushing and grinding the USEPA does provide default values per tonne of ore for a lowand high moisture content case which have been adopted into the NPI Mining Manual.
For metal mining there are no requirements for reporting PM10 or PM2.5 emissions, only the metals thatexceed the thresholds. This is a result of the TRI being focussed on chemicals. Furthermore, emissionsfrom the transport of the ore itself and emissions of road particulate matter that may be low in the TRI-listed chemicals are apparently omitted. The sources required to be considered in reporting are transferactivities, crushing and screening of the ore itself.
In response to facility concerns, the USEPA is currently conducting a stakeholder dialogue process toidentify improvements to the TRI and to develop opportunities to reduce the burden on reportingfacilities.
Of particular relevance to NPI reporting requirements for mining facilities:
Not all mining sectors (and hence facilities) are covered.
The application of a de minimus exemption (except for wastes) for elements with concentrations inmaterials less than 1%, except for OHSA defined carcinogens which is 0.1%. Therefore mostcontaminants in ores do not need to be considered when determining whether the facility hasprocessed or used that element.
Emissions of PM2.5 and PM10 are not required.
Emissions from wind erosion or from the road particulate matter itself are not to be included.Sources to be included comprise; transport, (eg haulage, conveying), crushing, loading andunloading.
TRI provides little guidance on EETs, referring to AP-42 and associated software.

SINCLAIR KNIGHT MERZ
I:\WVES\Projects\WV02688\Deliverables\Final\R23npi_dust_review.doc PAGE 18
3.2 US - National Emission Inventory (NEI)The National Emissions Inventory (NEI) is a US inventory of criteria and hazardous air pollutants (HAP)emissions from point area and mobile sources (see http://www.epa.gov/ttn/chief/trends/). It is similar tothe diffuse emissions (e.g. motor vehicles) included in the NPI. The NEI is not presented in conjunctionwith the TRI. Currently there are six criteria pollutants of which four are reported in the NEI (carbonmonoxide, sulphur dioxide, PM (PM10 and PM2.5) and NOX) and 188 hazardous air pollutants. The firstNEI inventory was conducted for 1999 and was finalised in 2003, with the current 2002 inventoryscheduled for completion in 2005/2006. Prior to the 1999 inventory, criteria pollutant emission estimateswere undertaken in the National Emission Trends (NET) inventory (1996 and 1999), whilst HAPemission estimates were maintained in the National Toxics Inventory (NTI) database. The NEI istherefore a more integrated approach to the previous inventories, combining both the NTI and NET data.The NEI is jointly developed by the USEPA, state and tribal agencies.
The NEI database provides estimates of annual emissions by source of air pollutants in all 50 States, theDistrict of Colombia, Puerto Rico, and the Virgin Islands. Emission estimates for individual point ormajor sources (facilities), as well as county level estimates for area, mobile and other sources, areavailable currently for years 1985 through 1999 for criteria pollutants, and for years 1996 and 1999 forHAPs. Note that prior to 1999, the estimates are from the earlier programs.
Of note to the mining industry is that:
The NEI is not estimated by industry but by government agencies, using gross “production” statisticsby state and, if possible, county levels. It does not provide emissions on a facility basis.
The NEI inventory includes PM10 and PM2.5 from mining and rock quarrying that is the sum ofemissions from metallic and non-metallic ore mines, and surface coalmines. These include fourspecific operations; overburden removal, drilling and blasting, loading and unloading, andoverburden replacement. Not included are any conveyor operations, crushing and screeningoperations and storage. PM2.5 emissions were estimated as 0.2 of the PM10 emissions.(http://www.epa.gov/ttn/chief/eiip/pm25inventory/areasource.html).
The NEI provides an inventory of all sources of metals allowing, a more accurate picture of therelative contribution from mining to be assessed, unlike the situation in Australia where there are anumber of large sources of PM and metals, such as unpaved roads, wildfires etc which are notgenerally reported. Within Australia, emissions from the “full” range of non-industry diffuse sourceshave been determined only for select locations (ie. Perth, Pilbara and Bunbury regions). Australia’sNPI would be improved if diffuse emissions were considered for the entire nation.
By providing the total emission inventory, the emission estimates can be used to effectively targetsources that require control, as is undertaken for the areas out of compliance with the US PM10 andthe new PM2.5 standards. This has been one of the major drivers for the development of emissioninventories in the US, unlike that in Australia.

SINCLAIR KNIGHT MERZ
I:\WVES\Projects\WV02688\Deliverables\Final\R23npi_dust_review.doc PAGE 19
There are guidance documents for average silt and default dry moisture contents for sources such asunpaved roads.
An example of a inventory for the US is presented in Figure 5, which highlights the overall lowcontribution to fugitive particulate from mining activities. It is noted that later inventories such as the2001 NEI, use updated emission factors, particularly for unpaved roads, and now estimate an evensmaller percentage of particulate matter from fugitive sources for the US.
3.2.1 Canadian National Pollutant Release Inventory (NPRI).The NPRI is similar to the US TRI in that it has an employee facility threshold of 20,000 hours. It alsouses mass and general concentration thresholds to eliminate ores and overburden with minor orinsignificant metal concentrations.
The NPRI determines substances that are manufactured, processed or otherwise used (MPO), orincidentally manufactured and released to the environment, trigger the reporting threshold if the mass ofthe MPO substance:
1) at a concentration above the applicable threshold; and
2) released as a product, at any concentration, on site to the environment, offsite or disposed of(including treatment)
is greater than the mass threshold. Note that no threshold is applied for release of the substance, though a1% exemption was applied before 2002.
The mass thresholds and the concentration thresholds are listed in Table 2.
Once it is determined that a substance has triggered the reporting threshold, all on site releases, and all offsite transfers for disposal or recycling of that substance, are reportable regardless of their concentration orquantity (including zero releases and transfers).

SINCLAIR KNIGHT MERZ
I:\WVES\Projects\WV02688\Deliverables\Final\R23npi_dust_review.doc PAGE 20
Wind Erosion17.8%
Cement0.5%
Crops14.6%
Livestock1.1%
Unpaved Roads41.1%
Quarries, Mining, Other3.0%
Paved Road8.4%
Construction13.4%
PM10 Fugitive Particulate matter = 29,778 of 33,574 thousand tpy of PM10
Wind Erosion4.9%
Cement3.0%
Crops18.3%
Livestock1.0%
Unpaved Roads38.6%
Quarries, Mining,Other5.7%
Paved Road13.0%
Construction15.4%
PM2.5 Fugitive Particulate matter = 5,511 of 8,288 thousand tpy of PM2.5
Fraction of PM10 and PM2.5 fugitive emissions for unpaved roads, paved roads, construction, wind erosion,crops, livestock and industrial sources. Fugitive particulate matter constitutes 88% of total PM10 and 66% ofPM2.5 emissions
Figure 5 Percentage contribution to fugitive particulate matter from Watson and Chow (2000)

SINCLAIR KNIGHT MERZ
I:\WVES\Projects\WV02688\Deliverables\Final\R23npi_dust_review.doc PAGE 21
Table 2 Canadian NPRI
Part Substance MassThreshold
ConcentrationThreshold
Substances Reported by Miningin Canada
Part 1Group 1
241 substances 10 tonnes 1% Antimony, Chromium, Cobalt,Copper, Cyanides (ionic),Manganese, Nickel, Selenium,Silver, Vanadium, Zinc
Part 1Group 2
Mercury 5 kg n/a Mercury
Cadmium 5kg 0.1% CadmiumArsenic, Chromium VIcompounds, lead,tetraethyl lead
50kg 0.1% Arsenic, Chromium VIcompounds, Lead
Part 2 17 Individual PAHs n/a Generally not applicable thoughone facility reported all
Part 3 Dioxins and Furans andHCB
Activitybased
n/a
Part 4 Criteria Air ContaminantsCONOXSO2TPMVOCPM10PM2.5
20 tonnes
10 tonnes0.5 tonnes0.3 tonnes
n/a
n/an/an/a
Prior to 2003, mining facilities involving activities up to and including the primary crushing of ores(stand-alone mines with no mill) were wholly exempt from all provisions of the NPRI and the associatedreporting requirements. Beginning in 2003 however, all mining facilities, including those previouslyexempt, became subject to at least some provisions of the NPRI as outlined in the Canada Gazette Notice(MAC, 2004). Exemptions from reporting must now be determined on a facility-by-facility basis. Thecurrent exemption for mining is for activities related to the actual removal of ore, rock or overburden, upto and including primary crushing. This exemption, however, does not apply to Part 4 substances(Criteria Air Contaminants) and the facility would have to report if the mining operation ran a stationarycombustion unit with capacity greater than certain criteria. As such, mines that only process the ore up toprimary crushing may be exempt, which may apply to stockpiling and ship-loading facilities provided nofurther crushing occurs.
For Part 4 substances, total particulate matter (TPM), PM10 and PM2.5 originating from road particulatematter are not included in the reporting, nor are pollutants released from motor vehicle exhausts (NOX,SO2, particulate matter etc).
The Canadian NPRI, like the US TRI, does not attempt to provide detailed guidance for themethodologies to be used in estimating emissions. As for the TRI, the NPRI guidance specifies that arange of methodologies can be used. The guidance also provides links to other sites and software, notably

SINCLAIR KNIGHT MERZ
I:\WVES\Projects\WV02688\Deliverables\Final\R23npi_dust_review.doc PAGE 22
the US AP-42 documentation and associated software (FIRE, Speciate and PM10 calc), and references tothe Ontario Ministry of Environment (MOE) methodology and to the Australian NPI EETs. Possibly inresponse to difficulties found in using the methodology, the Mining Association of Canada also has acomprehensive web site to assist mining companies and to simplify the NPRI process.(http://www.mining.ca/english/).
The Canadian NPRI also requires estimated releases for the next three years into the future. Theseforecasts are not binding but “you should make your best effort to honour the commitment to thereductions in releases of NPRI substances that you release” (MAC, 2004).
Currently a working group is reviewing speciation, which primarily includes speciation of VOCs but alsoPM2.5.
SINCLAIR KNIGHT MERZ
I:\WVES\Projects\WV02688\Deliverables\Final\R23npi_dust_review.doc PAGE 23
4. Emission Factor Developments in the US
4.1 Overview of US DevelopmentsAs the Australian NPI EETs are primarily based on USEPA AP-42 guidance, a brief review ofdevelopments in the US is provided.
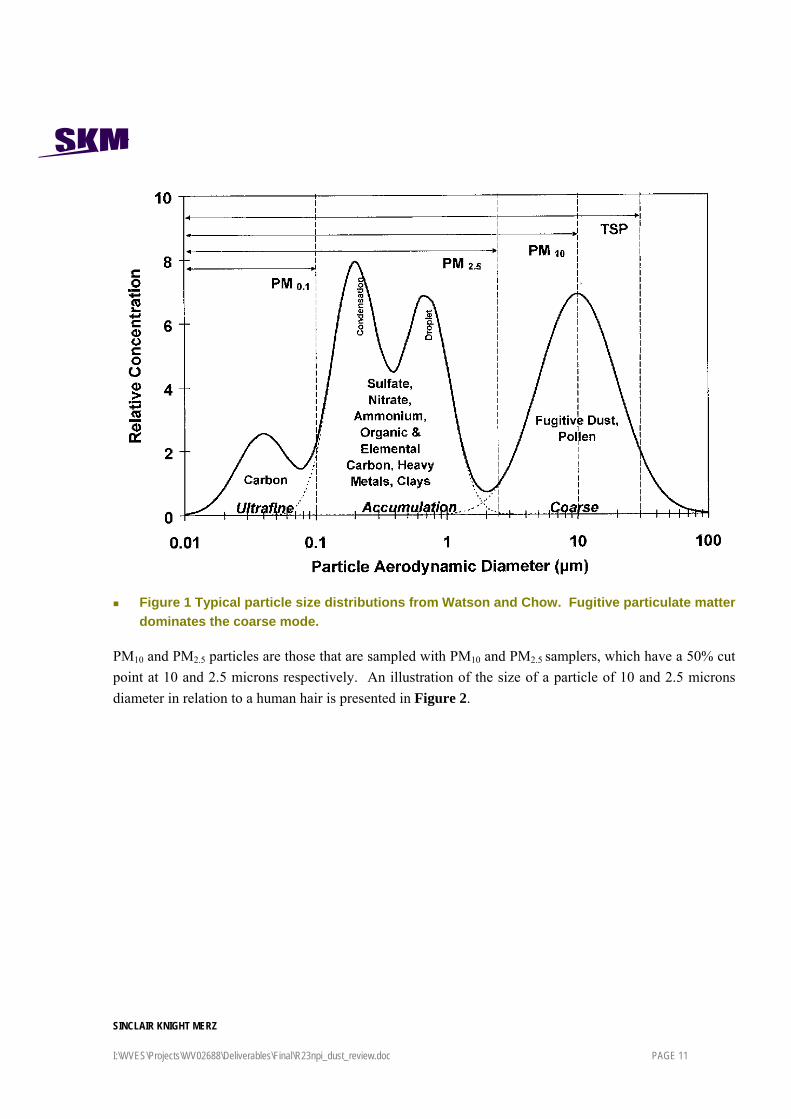
4.2 Overestimation of PM2.5 EmissionsIn the late nineties it became apparent that there was a discrepancy in particulate matter emissionsestimated using the USEPA AP-42 guidance and emissions determined from source attribution fromanalysis of ambient filter samples. Figure 6 from Watson and Chow (2000) provides a typical exampleof the differences between the two methods.
Figure 6 Comparison between fractional source PM2.5 contributions estimated by the CMBreceptor model and the emissions inventory for Denver during 1996 (Watson andChow, 2000).
0
10
20
30
40
50
FTP gasolin
e veh
icle e
xhau
st
Poorly-m
aintai
ned gas
oline v
ehicl
e exh
aust
Cold-start
gasolin
e veh
icle e
xhau
st
On- & off-
road
diesel
vehicl
e exh
aust
Residen
tial w
ood burning
Fugitive d
ust
Coal-fir
ed power
statio
ns
Other industr
ies
Restau
rant c
ooking
Natural
gas hea
ting
Secondary
ammonium nitr
ate
Secondary
ammonium su
lfate
Source Category
Sour
ce C
ontr
ibut
ion
(%) Emissions Inventory
Receptor Model, %Total
Receptor Model, %Primary

SINCLAIR KNIGHT MERZ
I:\WVES\Projects\WV02688\Deliverables\Final\R23npi_dust_review.doc PAGE 24
This large apparent over-prediction in the fugitive particulate matter emissions led some to argue that theemission factors were incorrect and that a reduction of up to a factor of four was necessary in theemission estimates.
Research into this issue has indicated that a major component of the apparent over-prediction was due tonear source removal by particle settling and filtration by vegetation (Etyemexian et al, 2003). Emissionfactors are typically derived at or near the source (tens of metres) before significant depletion occurs andtherefore essentially comprise the total particulate emitted. However, ambient monitoring may be severalkilometres from the major sources at which a significant proportion of even the PM2.5 may have beenremoved.
The particle capture fraction is a function of the underlying roughness of the surface including thevegetation, buildings, terrain etc. For emissions from vehicles on unpaved roads, the deposition ofparticulate matter is potentially large as the release height is generally low, with many roads being treelined which act to filter the low lying particulate matter plume as it is swept past.
Another potential reason for the over-prediction is that the unpaved road emission factors used in theUSEPA’s AP-42 had no vehicle speed dependence. As particulate matter from vehicles on unpaved roadsis generally considered to be wind speed dependent, the emissions at lower speeds were overestimated.
Another hypothesis being currently tested is that the PM2.5 emission estimates are overstated due to themeasurement method employed. Generally the PM2.5 emission factors used in the USEPA’s AP-42guidance for fugitive particulate matter sources were determined by using hi-volume samplers fitted witha PM10 head and a subsequent cascade impactor for the sizing below PM10. With the use of the cascadeheads, it is hypothesised that particle bounce on the cascade impactor stages may have resulted in higherPM2.5 concentrations than actually occurred. That is, larger particles that should have been retained athigher size fractions passed through the impactor stages and were recorded at the lower size fractions. “Ifso, this may help to explain why the AP-42 emission factors for fugitive dust sources appear tooverestimate PM2.5 emissions”. (WRAPAIR, 2004)
4.3 USEPA Review of AP-42Recently the USEPA has conducted a review of the use of the AP-42 factors (USEPA, 2004a). Thereview entailed a survey of industry and government departments. Major recommendations from thesurvey were that:
A more open and less cumbersome approach needs to be established that allows interested parties toassist in the improvement and development of emissions factors;
The format of AP-42 should be updated along with the methods for accessing the factors andassociated documentation;

SINCLAIR KNIGHT MERZ
I:\WVES\Projects\WV02688\Deliverables\Final\R23npi_dust_review.doc PAGE 25
Guidance is needed to help users select the most appropriate factor; understand how to consideruncertainties when using factors; and gather data to estimate emissions when a factor is not available.Guidance is also needed with respect to applying factors in permitting and enforcement applications;and
Existing emission factors should be updated and more factors are needed where gaps currently exist.In many cases, the new factors requested were related to more speciation (particle size for PM,specific chemicals for air toxics and VOCs). Attention also needs to be given to the development ofregional factors and factors for unique events and circumstances (USEPA 2004a).
For the fugitive sources comments were particularly directed towards the paved and unpaved roads.
4.4 WRAPAIRThe Western Regional Air Partnership (WRAP), covering roughly the western half of continental USA,has set up a number of studies that are attempting to improve fugitive particulate emission estimates.Relevant studies include work on developing improved wind erosion estimates (ENVIRON, 2004), andthe quantification of the particle depletion work. As such, revisions and improvements to fugitiveparticulate matter emissions should occur over the next few years. Under the WRAP, a contract has beenlet to develop a fugitive particulate matter handbook and website. This will compile emission estimationmethods and control techniques on paved roads, unpaved roads, materials handling, wind erosion frommaterial storage piles, construction and demolition, open area wind erosion, agricultural tilling andagricultural wind erosion (WRAPAIR, 2004). This is scheduled to be ready in early 2005.
4.5 CAAQESThe Centre for Agricultural and Air Quality Engineering and Science (CAAQES) at the Texas A & MUniversity is undertaking numerous studies related to emission estimates of particulate matter fromagricultural activities and the representativeness of PM10 and PM2.5 samplers for agricultural particulatematter (website http://caaqes.tamu.edu/). The research indicates that over-sampling of PM10 occurs forparticulate matter with mass mean diameters (MMD) greater than the sampler 50% cut off point. Wanget al (2003) argue that the cut off point of the sampler increases with high MMD particles and that over-sampling of the particulate matter occurs. CAAQES therefore has been arguing that the performance ofthe PM10 and PM2.5 samplers has not been clearly ascertained for particle sizes larger than 10 microns.
The acceptance of the CAAQES work by the USEPA is not known at this stage. However,notwithstanding the issue of the cut off point increasing with high MMD particles, it does highlight thatwhen sampling particulate matter from agricultural or mining operations with a broad cut point PM10
sampler, the majority of the PM10 sampled will in fact be greater than 10 µm. It is likely to be in therange of 10 to 15 µm. (see Figure 4). To correct this overestimation, the use of samplers with very sharpcut off points are required, which would result in much lower emission estimates for PM10 and PM2.5
emissions from mining and agriculture.

SINCLAIR KNIGHT MERZ
I:\WVES\Projects\WV02688\Deliverables\Final\R23npi_dust_review.doc PAGE 26
This issue is important due to the perception that a PM10 sampler only samples particulate below 10 µm,the public perception that all PM10 has the same health effects and the usage of NPI data to compare andrank sources of PM10. Use of a PM10 sampler with a sharper cut off point could decrease theconcentrations and derived emissions from mining operations by up to a factor of two, but would makenegligible difference to most particulate measured from combustion sources.

SINCLAIR KNIGHT MERZ
I:\WVES\Projects\WV02688\Deliverables\Final\R23npi_dust_review.doc PAGE 27
5. Emission Factor ReviewThe following sections provide details of the emission factors and past development of thefactors/equations used in the NPI EET Manuals.
5.1 Unpaved Roads
5.1.1 USEPA Factors/EquationsThe following equations have been used in emission estimation from vehicles and are of relevance tothose used in NPI Mining Manuals.
5.1.1.1 USEPA AP-42 (1985 4th Edition and 1988 4th Edition Supplement B)The fourth edition of AP-42 (USEPA, 1985, Section 13.2.2 Unpaved Roads) recommended particulatematter emissions from unpaved roads (including industrial roads), be estimated by:
E (kg/VKT) = 1.7 k (s/12) (S/48) (W/2.7)0.7 (w/4)0.5 (365-p)/365 Eq 5.1
Where k = the aerodynamic particle size multiplier for the given particle size, such as for PM30, PM10 etc. For PM10
k is equal to 0.36. Note, that the emission equations are specified with a subscript if they are specific to aparticle size and without, if they are generic with the emissions for particle size determined by theappropriate k.
s = silt content of the road (%)
S = average vehicle speed (km/hr)
W = mean vehicle weight (tonne)
w =mean number of wheels
p = number of days with greater than 0.25mm precipitation
VKT = Vehicle kilometre travelled
For surface coal mining, Section 8.2.4 “Western Surface Coal Mining” a separate equation for haultrucks and light duty vehicles was provided with PM30 emissions estimated as:
E30 (kg/VKT)= 0.0019 w 3.4 L 0.2 Eq 5.2
Where w = number of wheels
L = silt loading (g/m2)
In the 4th edition, Supplement B (September 1988), a PM10 factor was added with:
E10 (kg/VKT)= 0.00087 w3.5 Eq 5.3
This equation and the PM30 equation were derived from test data on haul trucks (Axetel and Cowherd,1981), with the number of wheels in the range of 6 to 10 and with silt loadings between 3.8 and 254 g/m2

SINCLAIR KNIGHT MERZ
I:\WVES\Projects\WV02688\Deliverables\Final\R23npi_dust_review.doc PAGE 28
(USEPA, 1988). Gross weights are not stated in the AP-42 documentation, but these are supplied in thereview by MRI (1998), indicating that gross tonnages were typically in the range of 50 to 100 ton (USshort ton), with a maximum value tested of 125 ton. These emission factors were for “uncontrolled”sources with no reduction provided for watering or other particulate matter suppressants.
Particulate matter emissions from light medium duty vehicles at Western Surface Coal Mines were alsospecified as:
E10 (kg/VKT)= 0.63 / M 4.3 Eq 5.4
Where M = Material moisture content (%)
This equation was derived from limited surface moistures in the range of 0.9 to 1.7%.
5.1.1.2 USEPA AP-42 (1998) 5th Edition, Supplement EThe vehicle emission factors for industrial unpaved roads and Western Surface Coal Mining were bothsubstantially revised in the AP-42 5th edition Supplement E (1998). These revisions were due primarily toconcerns with the accuracy of the haul truck factors. As detailed in the Supplement E (footnote to Table11.9-1), “Section 234 of the Clean Air Act of 1990 required EPA to review and revise the emissionfactors in this Section (and models used to evaluate air quality impact), to ensure that they did notoverestimate emissions from western surface coal mines. Due to resources and technical limitations, thehaul road emission factors were isolated to receive the most attention during these studies, as the largestcontributor to emissions”.
This review is summarised in MRI (1998), and found that equation 5.1 for independent haul truck datafor western surface coal mines,
“severely under-predicted the emission factors. On average, equation 3.2 (note the equation numbersrefer to those in the MRI document) under-predicted the independent test data by a factor greater than 5.In contrast equation 3.1 for the light vehicles tended to over-predict the independent test data, but by afactor of less than 2 on average. Equation 3.1 also performed reasonably well (within 20 percent onaverage) when applied to independent tests on light-duty traffic emissions. Although the AP-42light/medium duty factor provided reasonably accurate (within a factor of 2) estimates in two of threecases, the industry specific factor over-predicted a third independent test result by a factor of 20“(MRI, 1998).
Based on the findings of this report, the haul trucks and light/medium duty vehicles predictive emissionfactors were removed from the Western Surface Coal Mines section (October 1998) and replaced with afootnote referring users to the recently revised unpaved road section in the Miscellaneous Sourceschapter. It was noted that the emission factors for PM10 still tended to over-predict impacts with

SINCLAIR KNIGHT MERZ
I:\WVES\Projects\WV02688\Deliverables\Final\R23npi_dust_review.doc PAGE 29
regulatory modelling and users were cautioned as to the limitation of this factor. See Section 4 for moredetail.
The new unpaved road emission equation (Section 13.2.2 - Unpaved Roads, 1998) removed theparameters of speed and the number of wheels in equation 5.1, whilst introducing a road surface moisturecontent parameter as follows:
E (kg/VKT) = k (s/12) 0.8 (W/2.7) 0.4 (M/0.2) -0.3 Eq 5.5
Note, this equation has been converted using a conversion of 1 US short ton = 0.907 tonnes and1 lb/VMT (vehicle miles travelled) = 0.282 kg/VKT. The 1998 unpaved road equation was developedempirically from a wide range of mean vehicle weights (1.4 to 260 tonnes), mean vehicle speeds (8 to 88km/hr), surface moisture contents (0.03 to 20%) and mean number of wheels (4 to 7).
It was noted that the new equation, without the vehicle speed dependency, over-predicted emissions foraverage vehicle speeds less than 15 mph. As such, for cases for vehicle speeds less than 15 mph, AP-42recommended multiplying the emission factor by S/15 where S is the mean vehicle speed in mph.
To account for precipitation in annual inventories, AP-42 recommended:
E (kg/VKT) = k (s/12) 0.8 (W/2.7) 0.4 (Mdry/0.2) -0.3 (365-p)/365 Eq 5.6
In this equation Mdry represents the surface moisture under dry worst case conditions, as the equationassumes that emissions are at the dry uncontrolled road emissions for days without rain and are negligiblefor days with measurable precipitation (MRI, 1998, page 2-1). In the absence of appropriate site-specificinformation, the default value for Mdry of 0.2% was recommended.
For roads with particulate matter controlled by watering or the addition of chemical dust suppressants,equation 3.5 was recommended with the moisture to be the average value during periods of traffic fordifferent periods of the year. If only one set of samples was to be collected, then these must be collectedduring worst case, hot summertime conditions.
For roads with chemical dust suppressant added, AP-42 provides a simple chart for determining thecontrol efficiency that can occur, dependent on the accumulated inventory of product applied to the roadsurface, with up to a 80% control factor achievable.
5.1.1.3 USEPA AP-42 (2003) 5th Update 2003In October 2001, the USEPA published a new draft section 13.2.2 “Unpaved roads” for AP-42 andrequested comments. This draft:
proposed two separate emission factor models for public and industrial roads;

SINCLAIR KNIGHT MERZ
I:\WVES\Projects\WV02688\Deliverables\Final\R23npi_dust_review.doc PAGE 30
incorporated speed as an input parameter for public roads to overcome the shortcoming of theprevious model which over-predicted emissions for low vehicle speeds; and
revised the watering control effectiveness discussion (MRI 2001).
In December 2003 the USEPA finalised this revision with slight changes. The current AP-42 equation forvehicles travelling on unpaved surfaces at industrial sites is:
E10 (kg/VKT) = 0.423 (s/12) 0.9 (W/2.7) 0.45 Eq 5.7
And, for vehicles travelling on publicly accessible roads, dominated by light duty vehicles:
E10 (kg/VKT) = 0.508 (s/12) (S/30) 0.5 (M/0.5) -0.2 - C Eq 5.8
Where C = emission factor for 1980’s vehicle fleet exhaust, brake wear and tyre wear equal to 0.00047 lb/VMT(0.000133kg/VKT)
For estimating the various parameters, AP-42 recommends the use of site-specific silt content informationand where this is absent provides mean values for industrial roads. For surface moisture, AP-42 stronglyrecommends site-specific measurements be undertaken due to the significant variation that can occurbetween different types of road surfaces and discourages the use of the default moisture content of 0.5%.(Note, this was 0.2% in the 1998 version).
The effect of rainfall can be estimated simply by the following equation:
Ext = E (365-p)/365 Eq 5.9
Where Ext = annual size-specific emission factor extrapolated for natural mitigation.
With road watering, the degree of control is determined based on the ratio of the “controlled” to“uncontrolled” road moistures. These are to be measured for periods with typical traffic with theuncontrolled moisture content measured at least 24-hours after watering or rain, with the averagecontrolled value measured “either as a series of samples between water applications or a single sampleat the midpoint” (USEPA, 2003, 13.2.2.-11). This ratio will vary with season and vehicle frequency suchthat representative sampling, particularly of hot summer time conditions, is required.
By doubling the surface moisture content of the road the AP-42 estimates that a 70% control is achievedwith greater than 90% control achieved by increasing the moisture five times. For chemical dustsuppressants, the same control factors as supplied in the 1998 AP-42 are recommended with up to 80%controls achieved for PM10.
That the equation for industrial sites does not have speed dependence is surprising. Anecdotal evidencesuggests that for many of the larger pits in WA with long inclines, vehicle speeds are very low(<15 km/hr) with particulate matter emissions that appear to be minimal. Under these conditions it may

SINCLAIR KNIGHT MERZ
I:\WVES\Projects\WV02688\Deliverables\Final\R23npi_dust_review.doc PAGE 31
be appropriate to have a speed dependent factor such as in the 1998 AP-42 guide for very low windspeeds.
5.1.2 Application in US InventoriesIn estimating emissions from unpaved public roads, the NEI recommends use of the AP-42 emissionfactors, whilst providing State average silt values which vary between an average of 3.8% and amaximum of 7.9% (current file http://www.epa.gov/ttn/chief/ap42/ch13/related/r13s0202_decv03.xls).The NEI also provides State representative rain days and specifies a dry uncontrolled moisture of 1%.For California, the Californian Air Resources Board (CARB) have developed their own State specificemission factor of 2.27 lb PM10 VMT (0.64 kg/VKT) (Gaffney, 2004) from their own measurementprogram.
5.1.3 NERRDC Coal Mining Fugitive Particulate Matter Studies - Hunter ValleyThe National Energy Research Development and Demonstration Council (NERDDC) funded a study todetermine emission factors for fugitive particulate matter from coal mines in Australia using datacollected from the Hunter Valley in NSW. This study used an array of five high volume samplers fittedwith vane-orientated heads that sampled in an iso-kinetic fashion. These samplers were located in a lineextending approximately 10 to 200 m from the sources except for draglines. The emission factors werecalculated using a simple gaussian dispersion model and by taking into account particulate matterdepletion. A comparison was made to US PM30 factors as reported by Axetell and Cowherd (1981), byconverting the iso-kinetic sampled particles to a PM30 fraction using particle sizing data and taking intoaccount particle density and shape as presented in SPCC (1986). The comparison indicated goodagreement between the values excepting that the NERDDC study was for mines with typical particulatematter controls at the time, whereas the US factors were for uncontrolled emissions. Therefore, theNERDDC uncontrolled factors would be higher than the USEPA factors.
5.1.4 NPI EETs
5.1.4.1 Mining EET Manual - March 1999The original NPI Mining Manual (NPI, 1999a) recommended the USEPA (1988a) Surface Coal Miningfactors for coal mines as per equation 5.2 and 5.3 for “wheel generated dust”. Equation 5.3 was used asa first choice for PM10 with a default value of 0.42 kg/VKT (rounded to 0.4 in the summary table), formodern mines with large trucks travelling at low speeds (<30 km/h). Note, the default factor shouldactually be 0.46 kg/VKT for a mean number of six wheels. For mines that used smaller trucks (<100 t)that travel at higher speeds, a default PM10 factor of 0.9 kg/VKT was recommended based on the 1980’sNERDDC study.
This derivation of the default value of 0.42 kg/VKT for PM10 in the original NPI Mining Manual is notclear since the NERDDC value is for a “watered” haul road and as such is not actually uncontrolled orcomparable to the USEPA uncontrolled factor. The NERDDC report states that TSP emissions of

SINCLAIR KNIGHT MERZ
I:\WVES\Projects\WV02688\Deliverables\Final\R23npi_dust_review.doc PAGE 32
2.2 kg/VKT “were for normal operating mines practising normal dust control measures as applied in theHunter Valley. The Axetall and Cowherd emission rates apply before the application of controlmeasures” (NERDDC, 1988, page 27).
Additionally, the Axetell and Cowherd (1981) study is based on 1979 and 1980 testing with mean grosstruck weights in the range of 50 to 100 ton (US short ton), whilst the NERDDC study is based on 1986and 1987 tests in the Hunter Valley and an assumed weight of 100 tonnes (NERDDC, 1988, page 24).Therefore, the USEPA emission equation relates to older trucks and lower weights and not vice versa asargued in the NPI Mining Manual (NPI, 1999a, page 41). As such, the Australian data for coal mines didnot support the default uncontrolled factor of 0.42 kg/VKT in the 1999 NPI Mining Manual.
5.1.4.2 Mining EET Manual Versions 2.0 (2000) and 2.3 (2001)Version 2.0 (2000) of the NPI Mining Manual (NPI, 2000) revised the wheel generated particulate matterequation following concern that it could over-predict particulate matter emissions, as concluded from theKalgoorlie NPI trial (see Section 5.1.4.5). This revised equation remains the current equationrecommended in the NPI Mining Manual (NPI, 2001, version 2.3).
The equation used in version 2.0 to 2.3 was adopted from the AP-42 general unpaved road equation(USEPA, 1998) (equation 5.8) that was current at the time that version 2 was drafted. With this equationa new default uncontrolled PM10 emission factor of 0.96 kg/VKT was developed based on an assumedsurface silt content of 10%, vehicle gross mass of 48 tonnes and a moisture content of 2% (see SectionA1.1.11, NPI, 2001). This default is 4.8 times higher than the 1999 default. It is noted, however, that theuse of 2% moisture for an uncontrolled moisture value is considered high given that:
Values of 0.2% and 0.5% were given in the USEPA unpaved road manuals;
A value of 1%, is given for unpaved roads in the NEI;
A default value of 0.2% is given in Aggregated Emissions from Paved and Unpaved Roads EETManual (NPI, 1999b); and
A value of around 1% is typical of much of the uncontrolled road tests summarised in MRI (1998).
As such, the resultant NPI default uncontrolled emission factor is considered to be on the low side.
5.1.4.3 Draft Fugitive Emissions (Version 1.1 - September 2002)The current draft emission factor in the unpublished NPI Fugitive Emissions Manual (NPI, 2002,version 1.1) has incorporated the current NPI Mining Manual sections, though also including the earlier1988 Western Surface Mining equation back into the manual with no recommendation as to whichequation should be used. The default uncontrolled emission factors given are 2 kg/VKT for TSP and0.4 kg/VKT for PM10.

SINCLAIR KNIGHT MERZ
I:\WVES\Projects\WV02688\Deliverables\Final\R23npi_dust_review.doc PAGE 33
The draft also provides a table for default moisture contents (Table 8) for various soils with valuesranging from 8 to 66% which are intended to supply guidance for road surface moistures. These valuesare for soils and are totally irrelevant to road surface values which will be much lower and therefore thedraft Table 8 should be deleted.
In general the draft version has a number of errors and should be substantially revised before release.
5.1.4.4 EET for Aggregated Emissions from Paved and Unpaved Roads –September 1999
The Aggregated Emissions from Paved and Unpaved Roads EET Manual adopts the 1998 USEPAunpaved road emission (equation 5.5). For the required parameters, the average vehicle weight can becalculated by supplied weight for typical class of vehicles which is not problematic. Silt contents areprovided for two road types with values of 6.4% and 11% as provided in AP-42 (USEPA, 1998). Forcomparison to these defaults, the NEI now provide default values for the various States that range from1.5% to 7.2% with an average of 3.8%, with a value of 2.6% for California (USEPA, 2004b). These werederived from approximately 200 tests conducted around the US, with States having no testwork dataassigned the mean value. Countess (1999) reported for the South Coast Air Quality Management District(Los Angelas, San Bernadino etc) an average silt content of 10.8%, which was less than the CARB Statevalue of 15%. These variations indicate that there is a quite a large degree of scatter in the results, with atendency for lower values in the more recent studies. This highlights the need for actual measurements.
5.1.4.5 Kalgoorlie NPI TrialThe Kalgoorlie NPI trial estimated emissions from aggregated sources defined in Coffey (1999), withpoint sources estimated by the WA Department of Environmental Protection (WA DEP) and the overallwork summarised (WA DEP, 1999). Coffey (1999) estimated the unpaved road particulate emissionsusing the AP-42 equation (equation 5.6) along with estimates of the silt content, average vehicle weightand measurements of the number of rain days. In summarising the results of fugitive particulate,WA DEP (1999) undertook a brief comparison of the estimates obtained using the equation used byCoffey (1999) and the NPI Mining Manual equation and default factor at that time (NPI, 1999a,version 1). Using a range of vehicles, including a 60 wheel 120 tonne road train, the study estimatedemissions that varied by up to several orders of magnitude. With such a large variation, WA DEP (1999)recommended that the NPI “consider estimating particulate emissions only at this stage or report themseparately to fugitive dust generated PM10 emissions. Further direct monitoring studies are required todetermine the validity of fugitive dust PM10 emission factors”. (page xiv, WA DEP, 1999). Based on thisapparent uncertainty and difficulties encountered in estimating wind blown dust, the report concluded that“it is impossible to estimate with a reasonable degree of accuracy the total PM10 emissions from aregional centre, without conducting a long term monitoring program”,… “the results are likely to beorder of magnitude estimates only”.

SINCLAIR KNIGHT MERZ
I:\WVES\Projects\WV02688\Deliverables\Final\R23npi_dust_review.doc PAGE 34
This conclusion, however, is considered to be overstated in that:
The NPI Mining Manual equation used was derived from a narrow range of number of wheels(6 to 10), with the equation in the Kalgoorlie trial applied significantly outside its range ofapplicability;
The default factor specified in the NPI Mining Manual is for a specific situation only. The aboveexample for the Kalgoorlie trial demonstrates that one default factor cannot be applicable for therange of vehicle fleets that can be encountered; and
The equations were applied to individual vehicles and not to the weighted average weight andnumber of wheels as required.
As such, the conclusions in the NPI trial for fugitive PM10 estimates were based on the misapplication ofcertain techniques, which unfortunately have increased the perception that fugitive particulate matteremission estimates have little credibility.
5.1.5 Other Australian ResearchPitts (2000) reported results from using an upwind downwind method using a portable DustTrak monitor.It is noted that the methodology has a number of uncertainties including:
The need to estimate a vertical profile of the plume. This was undertaken using standard Gaussianplume dispersion curves;
The need to account for particle depletion. This was undertaken using the models ISC3 and theassumed initial particle distribution from AP-42 for wind erosion; and
Calibration of the DustTrak particulate matter monitor for that particulate and the collectionefficiency of the sampler. An attempt was made to calibrate the DustTrak sampler for the particle asa function of wind speed with limited success.
Estimated PM10 emission values from haul trucks (average 80 tonne gross weight and speeds of 40 to60 km/hr) ranged from 3.5 kg/VKT for a reasonably uncontrolled road to 0.5 kg/VKT for a controlledroad with approximately hourly watering. Notwithstanding the uncertainty in the absolute values, it doesindicate that uncontrolled emissions are much greater than version 1 of the NPI Mining Manual and thatcontrols of 85% can be achieved.
Using a wind tunnel, Air Noise Environment (2003) found an average control efficiency of 70% (range of55 to 89%) in the particulate matter emissions for the watered haul roads tested which had less than1 m2/hr applied. These results, however, are for wind blown dust, and are not considered readilyapplicable to vehicle emissions due to the different particulate matter emission processes involved.
Leys et al (1998) determined emissions from tractor cultivation on a cotton farm and a light vehicle onfarm roads using a vertical array of sampling inlets from a following vehicle. Lateral plume width was

SINCLAIR KNIGHT MERZ
I:\WVES\Projects\WV02688\Deliverables\Final\R23npi_dust_review.doc PAGE 35
measured on successive runs with the vertical array profile offset. They estimated relatively high TSPemissions of 3.7 kg/VKT. Of note is that, estimated from their figures, less than 1% of the TSP wasbelow 2.5 microns.
5.1.6 Particulate Matter ControlsThe various versions of the NPI Mining Manual have all specified the controls for watering of unpavedroad as:
50% control for level 1 watering (1 L/m2/hr); and
75% for level 2 watering (>2 L/m2/hr).
The basis for these factors is not clear as it is not referenced. It appears that control factors were based onestimates of the watering rates and typical Hunter Valley haul road usage using the equation of Cowherdet al (1988) (Holmes, per comm., 2004). The equation of Cowherd et al (1988) specifies
C = 100 - (0.8 P d t)/ I Eq 5.10
Where C - average control efficiency percent (%);
P = potential average daytime evaporation rate mm/hr;
d = average hourly traffic rate (hr-1);
I = application intensity L/m2; and
t = time between applications.
Based on what may have been the values of 30 truck passes per hour (Holmes, pers comm., 2004), and amaximum extreme hourly evaporation rate of 2 mm/hr (for a hot windy day), application of 1 and2 L/m2/hr gives 50% and 75% control. This equation was listed in Cowherd et al (1988) along withanother method (which is currently used in US AP-42 for unpaved roads) which Cowherd et al (1988),commented may be more suitable for regulatory applications. The equation has been used by the USEPAto develop a spreadsheet to predict control factors using hourly rainfall rates (USEPA, 2004b).
Therefore, the control factors given for watering are very site-specific in terms of vehicle usage and theassumed evaporation rate. Areas with lower evaporation rates and lower vehicle usage could have muchlarger controls than provided in the NPI Mining Manual. Other problems with the control factorsprovided in the NPI Mining Manual are:
No advice is given for low watering rates (between 0 and 1 L/m2/hr). That is, what should be donefor a watering rate of 0.5 L/m2/hr which is considered typical (see Air Noise Environment, 2003);
For low vehicle rates the control tends to 100% even for very low watering rates. That is,evaporation due to solar radiation and wind has little effect in comparison, which appears unrealistic;
SINCLAIR KNIGHT MERZ
I:\WVES\Projects\WV02688\Deliverables\Final\R23npi_dust_review.doc PAGE 36
Chemical suppressants are not considered. These should be incorporated by using the AP-42methods;
The use of salts, such as magnesium chloride or the effects of hyper-saline water, is not accountedfor. In WA mines, hyper-saline water is often used due to lack of available fresh water. This water(up to 250,000 mg/L of total dissolved salts, McDougall, 2004), is noted to have improved particulatematter control properties compared to fresh water. As this effect is not currently considered, moreinvestigation is recommended. This can easily be achieved in a relative sense by using a DustTrak todetermine the percent control, or a more rigorous quantitative study could be adopted using theUSEPA methodology.
Therefore, it is recommended that the current NPI control factors be modified as follows:
For watering controls with fresh water, either
- The equation of Cowherd et al (1988) should be provided such that the control efficiency isestimated. It is considered that this has been the basis of the current factors but now site-specific factors will be used. This will require mines to estimate the number of vehicle passesand watering rate on the various roads. Estimates of the hourly evaporation rate could beundertaken using annual evaporation estimates and converting these to a maximum hourly valueusing a multiplier as in Cowherd et al (1988).
- The current USEPA approach should be provided for mines if they choose to measure typicalmoisture contents for controlled and uncontrolled roads to determine the moisture increase.
For chemical suppressants the US methodology should be included;
For addition of salts, including hyper-saline water, it is considered that test work is required todevelop factors. A study to undertake this could be undertaken for a ballpark figure of $20,000.
5.1.6.1 Comparison of Equations and defaults used in the NPI EETsTo illustrate the range of emissions in the various equations and to determine how the new US AP-42equations compare, the emission for haul trucks and light vehicles have been estimated and presented inTable 3 and Figure 7.

SINCLAIR KNIGHT MERZ
I:\WVES\Projects\WV02688\Deliverables\Final\R23npi_dust_review.doc PAGE 37
Table 3 Comparison of unpaved road emissions
Haul Truck
(kg/VKT)
Light Vehicles
(kg/VKT)
Source Eq No.
Dry Dry Dry Watered Dry Watered Dry
VariablesSurface Moisture Content (%) 1.0 1.0 1.0 3.0 1.0 3.0 1.0Silt Content (%) 10 10 10 10 10 10 10Average Weight (tonne) 150 150 80 80 2.5 2.5 2.5Speed (km/hr) 15 40 40 40 50 50 25Number of Wheels 6 6 6 6 4 4 4EquationsUSEPA (1988), Western Coal. Used in NPIMining Manual v1 5.3 0.46 0.46 0.46 0.23
USEPA (1998) Used in NPI Mining Manualv2 to v2.3 5.6 1.95 1.95 1.52 1.09 0.38 0.27 0.38
USEPA (2003) Industrial 5.7 2.23 2.23 1.68 0.30 0.35 0.06 0.35USEPA (1983 - 95) Unpaved roads 5.1 3.9 10.4 6.70 1.20 0.60 0.11 0.30USEPA (2003) Public roads (weight 1 -2.7 tonne only) 5.8 N/A N/A N/A N/A 0.48 0.38 0.34
DefaultsNPI Mining Manual v2.0 to 2.3 based onNERDDC (1986) 0.96 0.96 0.96 0.96 0.96 0.96 0.96
NPI Mining Manual v1 0.2 0.2 0.2 0.2 0.46 0.46 0.46NPI Fugitive Emissions Manual draft v1.1 0.4 0.4 0.4 0.2 0.4 0.4 0.4Notes:
1) N/A is not applicable as the vehicle weight is above the weight range for which the equation was developed
2) Watered particulate matter estimates are based on assuming 50% control for eq 5.3 based on the NPI recommendations,using the 3% moisture content in equations 5.6 and 5.8, whilst in equations 5.1 and 5.7 the current USEPA equationusing Cowherd et al (1988) assumes the moisture increase is three times, giving a control efficiency of 82%.

SINCLAIR KNIGHT MERZ
I:\WVES\Projects\WV02688\Deliverables\Final\R23npi_dust_review.doc PAGE 38
0.0
0.5
1.0
1.5
2.0
2.5
3.0
3.5
4.0
4.5
5.0
150 tonne 15 km/hruncontrolled
80 tonne 40 km/hruncontrolled
80 tonne 40 km/hr watered
PM10
Em
issi
ons
(kg/
VKT)
AP-42 1988 (Western Surface Coal Mine). Used in NPI mining v1
AP-42 1998. Used in NPI mining v2 to 2.3
AP-42 2003 Industrial Roads
NERDDC 1988 Hunter Valley Measurements
Figure 7 Particulate matter emissions from haul trucks
Table 3 and Figure 7 indicate that:
The 1988 equation used for the NPI Mining Manual predicts much lower emission factors than theother equations and the current equation. This is consistent with the NERDDC study which foundthat the PM10 emissions for haul trucks at the time (100 tonnes) with typical controls (watering) was0.96 kg/VKT. Likewise, the NPI default uncontrolled factors are lower than estimated with thenewer equations. For the 2001 default, this is due to the estimate being based on 2% surfacemoisture which has some degree of control;
The 1998 equation has no dependence on factors such as weight, speed and moisture;
The 2003 equation has a much greater dependency on watering than previously given; and
For light vehicles on uncontrolled surfaces, the emissions are all very similar for vehicle speeds of50 km/hr at around 0.5 kg/VKT. This in line with the Californian uncontrolled unpaved road valueof 0.64 kg/VKT.

SINCLAIR KNIGHT MERZ
I:\WVES\Projects\WV02688\Deliverables\Final\R23npi_dust_review.doc PAGE 39
5.1.7 Recommendations for Unpaved RoadsThe following are recommended:
R5.1 Incorporate the recent December 2003 USEPA AP-42 unpaved road equations into the NPIFugitive Emissions Manual. It is noted that the draft version of the NPI Fugitive EmissionsManual has a number of errors that require correction, such as deletion of the soil moisture table.
R 5.2 Single default emission factors should not be provided as there can be large variations betweenthe vehicle fleets and road characteristics at different sites. If defaults are to be provided theyshould be given for the various combinations of typical vehicle fleets (for example vehicle usageon haul roads at a mine site and a typical light vehicle fleet) and for typical uncontrolled andcontrolled roads. To assist companies in estimating the appropriate emission factor for their site,it is recommended that the NPI Fugitive Emissions Manual include a compilation of typical siltcontents, as well as moisture contents for various Australian industry groups, as per the USEPAguides.
R 5.3 Update the unpaved road control factor with separate methods for:
Fresh water, using either:
- The equation of Cowherd et al (1988). This will require mines to estimate the numberof vehicle passes and watering rates on the various roads. Estimates of the hourlyevaporation rate could be undertaken using annual evaporation estimates andconverting these to a maximum hourly value using a multiplier as in Cowherd et al(1988); or
- The current USEPA approach where moisture contents for the road in a controlled anduncontrolled state under typical traffic conditions are measured.
Use of organic chemical suppressants, using for example the US AP-42 methodology; and
Use of salts including the use of hyper-saline water. It is considered that test work,estimated at $20,000, is required to develop appropriate control factors.
R 5.4 Though not strictly applicable to the NPI Mining Manual, it is considered that the AggregatedEmissions from Paved and Unpaved Roads EET Manual should be updated to include the newAP-42 equations, including a default moisture content of 1% (following the US NEI) and typicalAustralian data for road silt contents. This may involve a desktop study or in-field sampling.
It is noted that the adoption of the above will result in higher uncontrolled particulate matter emissionestimates, but higher control factors should result in comparable emission estimates for vehicles.

SINCLAIR KNIGHT MERZ
I:\WVES\Projects\WV02688\Deliverables\Final\R23npi_dust_review.doc PAGE 40
5.2 Wind erosion from Industrial Areas and Mine Sites
5.2.1 USEPA methods
5.2.1.1 Industrial Wind ErosionWind erosion for active storage piles was specified from the Third Edition, Supplement 14 (USEPA,1983) up to the Fourth Edition, Supplement B (USEPA, 1988a) as:
ETSP = 1.9 (s/1.5) (365-p)/235 (f/15) (kg/ha/day) Eq 5.11
Where: p = the number of days with less than or equal to 0.25mm (0.01 in) precipitation
f = the percentage of time the unobstructed wind at the mean pile height exceeds 5.4 m/s
This equation is based on a study of particulate matter emissions from a sand and gravel storage pile areaas reported by Cowherd (1974). It is rated C for application in the sand and gravel industry and D forother industries using the US EPA quality rating for emission factors. This rating system is as follows:
A: Excellent;
B: Above average;
C: Average;
D: Below average; and
E: Poor.
It is important to note that the storage pile is active, that is either the surface is being disturbed frequentlyenough such that fresh material is available for wind erosion, or the surface is not depleted or crusted.
In the Fourth Edition, Supplement B (USEPA, 1988a) this equation was replaced in the new section“Industrial Wind Erosion” with a more detailed procedure for “wind erosion of open aggregate storagepiles and other exposed areas within an industrial facility” (USEPA, 1988a). This procedure is still thecurrent method within AP-42. (Note that within USEPA, 1988b, both equations are given with thecurrent equation to apply to surfaces which are limited in the amount of erodible material and the formerequation to unlimited or active surfaces).
The current AP-42 method was developed by Cowherd (1983) for coal stockpiles based on wind tunneltesting of coal storage piles and other areas such as overburden. Critical to this method is that it is basedon wind tunnel tests showing that particulate emissions decay rapidly, with a half life of a few minutesduring an erosion event, because there is limited availability of erodible material. This is unlike the activesand stockpiles on which the previous equation was developed. Based on the wind tunnel observations,the method assumes that because the erosion potential increases rapidly with wind speed, the particulatematter emissions between times when the surface area is disturbed can be approximated by the particulatematter emitted only during the peak one minute wind. That is, no particulate matter is assumed emitted

SINCLAIR KNIGHT MERZ
I:\WVES\Projects\WV02688\Deliverables\Final\R23npi_dust_review.doc PAGE 41
for lower wind gusts which exceed the threshold velocity, or the method allows for particulate matterfrom these events by calibrating the coefficients in the equation.
In the method of Cowherd (1983), the erosion potential (P) of each particulate matter event is defined as:
P (g/m2) = 58(u∗ - u∗t)2 + 25(u∗ - u∗t) for u∗ ≥ u∗t. Eq 5.12
P (g/m2) = 0 for u∗ ≤ u∗t.
Where u∗ = the friction velocity (m/s)
u∗t = the threshold friction velocity (m/s)
This method is conceptually sounder than the previous method in that it takes into account:
That the threshold friction velocity will vary with the material and that this is the appropriate measureof the erodibility of the material;
The variation in wind speed over a stockpile by using wind tunnel test work from scale models fortwo simple stockpile shapes; and
That the erosion potential of most surfaces is limited with a finite reservoir of particles and will notbe replenished until the surface is disturbed.
This method, however, does have limitations in that:
The equation is based on a small amount of wind tunnel testing, with limitations on determining theparticulate matter flux for larger areas as detailed in Section 5.2.1.3.
There appears to be little validation data to support the method apart from the wind tunnel tests;
There is no apparent supporting data for non-coal mine material;
It does not take into account that the friction velocity will vary with the angle of the surface material,which for stockpiles is the angle of repose (typically 30 to 40 degrees). As such, material should beeasier to dislodge when sitting on the side of a stockpile, especially when the wind is across the slopeof the stockpile;
Only approximate methods are provided for the estimation of threshold friction velocity (eg using themode of the dry aggregate size distribution of samples according to a sieving procedure), though theresults are very sensitive to this estimate; and
Difficulties from an Australian context are that the fastest mile of wind is not recorded routinely.The Bureau of Meteorology (BoM) routinely records wind every 10 minutes on the hour. Most othermonitoring sites measure 10-minute or 1-hour averages and some may record peak gusts (eg gustslasting two or three seconds) within that period. Therefore for Australian sites, fastest mile data isnot available and must be estimated. A possible method that could be used is the use of gust factortheory to estimate a fastest mile “gust”. Assuming a gust wind speed of 15 m/s, the time taken to

SINCLAIR KNIGHT MERZ
I:\WVES\Projects\WV02688\Deliverables\Final\R23npi_dust_review.doc PAGE 42
travel one mile is 107 seconds. Therefore assuming a 107-second “gust” and data or relationshipssuch as in presented in Krayer and Marshall (1992), the fastest mile wind speed would beapproximately 1.18 to 1.27.times the hourly wind speed.
The uncertainty in the current USEPA method is also detailed in USEPA (1984) with the followingconcluding comments indicating its preliminary nature and inherent uncertainty: “Taking all the sourcesof uncertainty into account, it is thought that the wind erosion emission factors for surfaces similar tothose tested are accurate to within a factor of about three”; and “Until further research is accomplished,it is recommended that wind erosion factors be used with full consideration of their uncertainty andpreliminary nature. It is recommended that their use be restricted to estimates of emissions relative toother mines sources and that they not be used for estimating the ambient air impact of wind erosion atsurface coal mines”.
5.2.1.2 Western Surface Coal MiningThe AP-42 Fourth Edition Supplement 14 (USEPA, 1983) for Western Surface Coal Mining specifies adefault TSP factor of 0.85 tonne/ha/year (0.1 kg/ha/hr) for seeded land, stripped overburden and gradedoverburden. This was derived using upwind downwind sampling using high volume air samplers for thecoal mines listed in Table 8.24-5, which are all in reasonably dry areas (rainfall 280 to 430 mm/year) andhave relatively high wind speeds (four sites with average wind speeds of 4.8 to 6 m/s and one with 2.3m/s). Therefore, the equation appears to be based on reasonably dry and windy sites. As PM10 will beless than 50% of TSP, the PM10 emissions will be less than 0.05 kg/ha/hr.
For active storage piles, the fourth edition specifies that wind erosion (and maintenance) for PM30 is givenas 1.8u (kg/ha/hr) where “u” is the wind speed (m/s). This equation is obtained from the study of Axetel(1978) and is implied to be for annual estimates even though it is given on an hourly basis. In thefootnote to Table 11-9-2, it is noted that to estimate shorter times (eg, a worst case day) the procedurereferenced in Section 13.2.5 should be adopted. Using this equation and an annual average wind speed of3 m/s (such as for Kurri Kurri in the Hunter Valley, NSW), this equation estimates PM30 emissions of 5.4kg/ha/hr. Assuming that PM10 is 50% of this gives a value of 2.7 kg/ha/hr. These equations are still listedin the current version of AP-42 for Western Surface Coal Mining..
5.2.1.3 Other Models Considered RelevantA good summary of available particulate matter models for regional scales is provided in Countess et al(2001a). This review was conducted for WRAPAIR which is estimating particulate matter emissionsfrom wind erosion for the western States of the US (ENVIRON, 2004) and is undertaking a number ofstudies to improve emission estimates from fugitive particulate matter sources. The following isabbreviated from this review for models considered relevant.

SINCLAIR KNIGHT MERZ
I:\WVES\Projects\WV02688\Deliverables\Final\R23npi_dust_review.doc PAGE 43
Wind Erosion Equation (WEQ)The WEQ is an empirical wind erosion equation developed by Woodruff and Siddoway (1965) and usedby the U.S. Soil Conservation Service to inventory the potential of soils for wind erosion. The WEQestimates the average annual mass of soil lost off the downwind edge of the field (not particulate matterloss) as:
E = I C K L' V' Eq 5.13
where E = the potential average annual soil loss
I = the soil erodibility index
K = the soil ridge roughness factor
C = the climate factor
L’ = the unsheltered distance across a field
V’ = the equivalent vegetative cover
For estimating TSP emissions, the USEPA estimated that 0.025 and 0.038 kg/ha of the soil transported offagricultural land or a road will remain as TSP (USEPA, 1974 and USEPA, 1988b). To estimate PM10
emissions, the CARB (1997) assumed that 50% of the TSP was PM10.
The CARB has modified the WEQ to improve the emission estimate for California, to better reflectseasonal changes in the climate, winds and rainfall and crop conditions (fraction of bare soil etc).Monthly values of climatic factors are used to better resolve the variation in climate, rather than an annualfactor which may not capture variations in wind and rainfall regimes. The CARB (1997) methodologyhas been used to estimate particulate matter emissions for the Pilbara Airshed Study (SKM, 2003a), theBunbury Airshed study (SKM, 2003b) and for Victoria (Ng, 2004). One limitation of this approach isthat the climate factor does not adequately capture the upper extreme of wind distribution, which has thegreatest bearing on annual particulate matter emissions. For example, in Australia studies have shownthat it is the infrequent dust storms which contribute the majority of particulate matter emissions from anarea. Another limitation is that the percentage of the saltation flux assumed to be TSP and PM10 is veryapproximate and neglects how this percentage may vary with soil type and wind speed.
Revised Wind Erosion Equation (RWEQ)The revised wind erosion equation (RWEQ) (Fryrear et. al, 1998) improved the original WEQ, and wasvalidated with field data. A significant modification included in the RWEQ is the assumption that themaximum transport capacity occurs a short distance downwind from the field boundary, beyond which nonet soil loss occurs. Though this is in an improvement on the WEQ, its major limitation (like WEQ) isthat it only predicts the soil loss from an area and does not predict the vertical particulate matter flux.

SINCLAIR KNIGHT MERZ
I:\WVES\Projects\WV02688\Deliverables\Final\R23npi_dust_review.doc PAGE 44
NAPAP Model - Gillette and Passi (1988)Gillette and Passi (1988) developed a model to estimate total particulate matter production by winderosion for the US, for the National Acid Precipitation Assessment Program (NAPAP). The particulatematter model estimates particulate matter emission from soils based on the threshold friction velocity ofthat soil which takes into account the effects of soil type, soil moisture, soil texture and vegetative cover,with the threshold friction velocities for soil type based on a large number of wind tunnel tests. TheNAPAP methodology was modified for the purpose of assessing annual PM10 emissions for EPA’semissions trends report (Barnard and Stewart, 1992).
Wind Erosion Prediction System (WEPS)The Wind Erosion Prediction System (WEPS) developed by Hagen and others (eg, Hagen, 1995) isintended to replace the WEQ and RWEQ. Unlike the previous wind erosion models, WEPS is a process-based, continuous, daily time-step model that simulates weather, field conditions, and erosion. WEPSsimulates complex field shapes and topography, and takes into account spatial and temporal variability offield conditions and soil loss or deposition. WEPS is by far the most complex of the above models and isnot considered applicable for use in the mining area or larger regional areas because of its complexity.
Wind erosion models based on the Sand Saltation Scheme of Shao et al (1996) and Luand Shao (2001)The particulate matter emissions scheme initially developed by Shao et al (1996), Shao and Leslie (1997)and modified by Lu and Shao (2001), estimates the particulate matter flux based on a physically basedmodel of the saltation process. The particulate matter flux is determined from discrete saltation particlesizes using the particle size distribution of the actual soil. The saltation flux for each particle size is basedon the friction velocity for that particle size which is determined from particle diameter, soil moisture,non-erodible surface roughness elements and effects of surface aggregation and crusting. The particulatematter scheme has been utilised in different modelling systems with land use classification systems andregional wind models to provide winds to estimate particulate matter emission and to then estimate thetransport and dispersion of the dust.
This wind erosion scheme has been incorporated into models for Australia by Shao et al (1996), Shao andLeslie (1997) and Leys et al (2002) and recently into the Australian Air Quality Forecasting System(AAQFS) by Lu et al (2003 and 2004). The scheme was also used in the Integrated Wind ErosionModelling System (IWEMS) for the northeast Asian dust storms as detailed by Shao et al (2003) where itwas shown to provide a good quantitative comparison between observed and predicted TSP, PM10 andPM2.5 concentrations.
The particulate matter model for the AAQFS is currently under trial with predictions in real time beingmade of particulate matter emissions and concentrations over Australia for the summer of 2004/2005.

SINCLAIR KNIGHT MERZ
I:\WVES\Projects\WV02688\Deliverables\Final\R23npi_dust_review.doc PAGE 45
WRAPAIRWRAPAIR is a collaborative effort of tribal governments, state governments and various federal agenciesto implement the Grand Canyon Visibility Transport Commission's recommendations, and to develop thetechnical and policy tools needed by the western States and tribes to comply with the USEPA's regionalhaze regulations. As part of the plans, WRAPAIR is developing an emission inventory for the westernhalf of the US of wind-generated particulate matter using an empirical scheme as detailed in MacDougalland Uhl (2002). This method estimates the particulate matter fluxes based on wind tunnel derived teststhat are a function of wind speed, soil group and whether the soil is stable or unstable.
Stable land or soils are assumed to emit particulate matter only during the first hour of a wind event andas such have only a limited reservoir available for wind erosion. For unstable, disturbed lands thereservoir of particulate matter is much greater with the particulate matter depleted within 10 hours of anywind event. Particulate matter reservoirs are recharged within 24 hours of a wind event, with a windevent defined as any time period for which the winds exceed the threshold wind velocity (taken as20 mph, approximately 9 m/s at 10 m) separated by at least 24 hours. Precipitation was consideredsimplistically within the first phase modelling, with any rain considered to suppress particulate matter for72 hours after the event. Winds and precipitation for the estimates were derived from hourly valuespredicted by the model MM5 on a 36 km grid. MM5 (Mesoscale Model) is a non-hydrostatic, terrainfollowing model that is designed to simulate or predict atmospheric circulation. The results gave spatiallyand temporally variable particulate matter fluxes across the western half of the US. For the trial year of1996, 5.4 Mtpa of PM10 was predicted to be emitted with major sources in Texas and New Mexico andthe major land use category being desert barren land (ENVIRON, 2004). PM2.5 emissions were estimatedas 22% of PM10 from an analysis by CARB, though the details of the derivation were not provided.
This model is sensitive to a number of assumptions and simplifications, including definition of the windspeed threshold, the reservoir recharge time and the effect of rainfall. These are subject to further studies.
In a review of the WRAPAIR approach, Countess et al (2002) argued that particulate matter fluxes baseddirectly on wind tunnel measurements as used in the “MacDougall” method (MacDougall and Uhl, 2002)have the following shortcomings:
1. Limited fetch length: Fugitive particulate matter emissions often have a very significant fetch lengthdependence;
2. Limitation of loose material in the surface: Using a wind tunnel causes a rapid depletion of all thesurface material contained within the tunnel. However, in natural situations loose material fromupwind continues to be resuspended. Thus, wind tunnels will underestimate the amount of particulatematter emissions;
3. Feeding of sand into the tunnel from outside does not duplicate nature: That is, inserting saltatingsand into the tunnel does not necessarily fix the problem of (2) above. One must refer emissionfactors to the amount of sand fed into the tunnel. In other words, this technique is only good for some

SINCLAIR KNIGHT MERZ
I:\WVES\Projects\WV02688\Deliverables\Final\R23npi_dust_review.doc PAGE 46
problems like measuring the ratio of vertical particulate matter flux to horizontal sand flux (and thenonly with great caution);
4. Wind tunnels limit the size of natural roughness that can be measured (i.e., wind tunnels must bemuch larger than the roughness); and
5. An efficiently run wind tunnel investigation will measure parameters that are important in a generalsense (eg, quantifying variables in a computer model) but not in matching a large number of real-world erosion scenarios.
Countess et al (2002) also noted that models of particulate matter fluxes generally had the followingproblems, which limit the accuracy that can be achieved:
Difficulty in determining the threshold friction velocity: As the particulate matter predictions areusually determined using equations where the particulate matter flux is estimated as the differencebetween the friction velocity and the threshold friction velocity, the specification of these is critical.
Use of average wind velocities: Average wind speeds, (in time and in space) smooth out the extremesof the wind speeds, which can lead to a significant under-prediction of particulate matter emissions.
Neglect of small-scale topographic features, such as small hills, embankments, buildings, trees andshelter belts affect both the threshold friction velocity and the local wind speed and, therefore,friction velocity. These are generally not included in modelling.
5.2.1.4 NPI MethodsMethods in the NPI have remained constant since the first version in 1999. The NPI Mining Manualsuggests the use of equation 5.11, which is recommended in the third and fourth editions of AP-42(USEPA, 1983 and 1988). That is, the NPI did not adopt the US EPA method current at the time asintroduced in “wind erosion of open aggregate storage piles and other exposed areas within an industrialfacility” (USEPA, 1988a). Using equation 5.11, the NPI Mining Manual derives a TSP emission of1.82 kg/ha/hr using values of p=80 days/year, s=15% and f=30%. The rationale behind these estimates,however, is not provided. The manual then quotes the value given in SPCC (1983) for wind erosion of0.4 kg/ha/hr of TSP, which it suggests should be adopted as the default in the absence of otherinformation. Assuming 50% of the TSP is PM10 (from USEPA, 1998) a PM10 emission factor of 0.2kg/ha/hr is obtained. This value is provided as the default factor and as no equation is provided in thesummary table, is implied to be the preferred method. For other exposed areas the same default factor isrecommended.
Review of the derivation of the SPCC (1983) factor indicates that this was not based on measurements,but is likely an estimate using equation 5.11 and typical Hunter Valley values with a silt content of 7%(for coal and overburden, NERDDC, 1986 Table 8), number of rain days (80) and with 13.4% of the windgreater than 5.4 m/s (as taken from the Bureau of Meteorology site at Kurri Kurri). Therefore, the defaultvalue is highly specific to a location and ore type. Additionally, it is for a surface that is continually
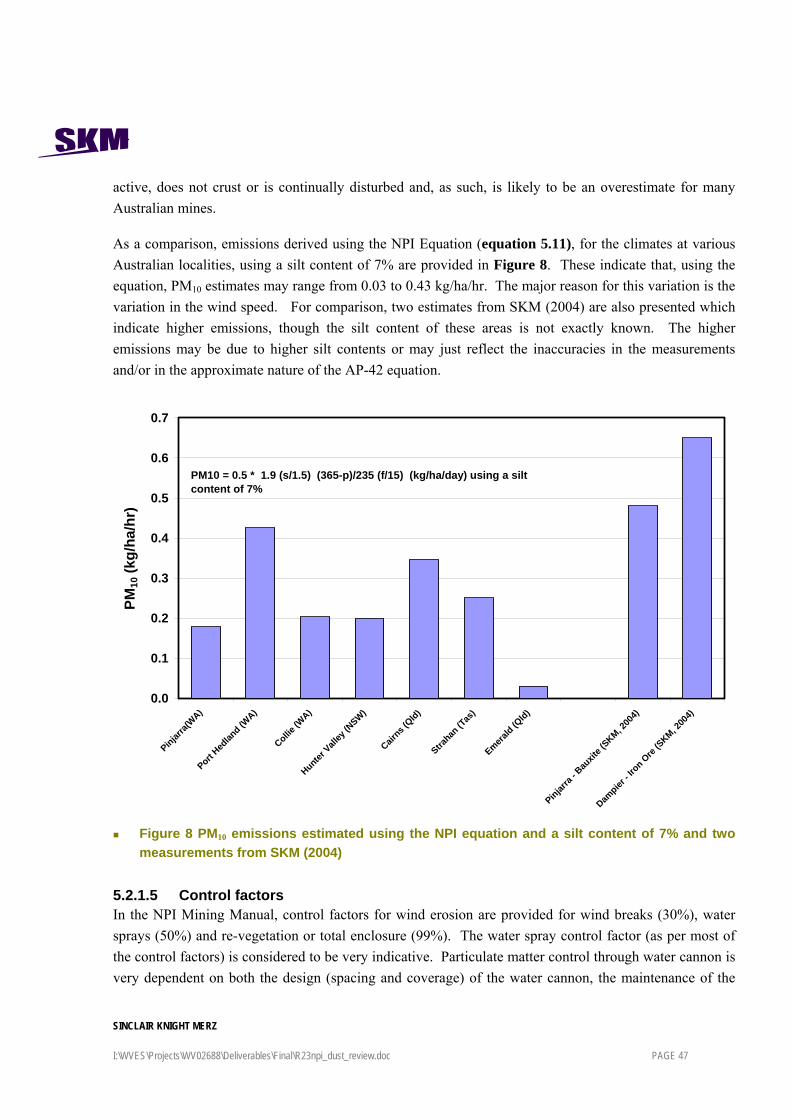
SINCLAIR KNIGHT MERZ
I:\WVES\Projects\WV02688\Deliverables\Final\R23npi_dust_review.doc PAGE 47
active, does not crust or is continually disturbed and, as such, is likely to be an overestimate for manyAustralian mines.
As a comparison, emissions derived using the NPI Equation (equation 5.11), for the climates at variousAustralian localities, using a silt content of 7% are provided in Figure 8. These indicate that, using theequation, PM10 estimates may range from 0.03 to 0.43 kg/ha/hr. The major reason for this variation is thevariation in the wind speed. For comparison, two estimates from SKM (2004) are also presented whichindicate higher emissions, though the silt content of these areas is not exactly known. The higheremissions may be due to higher silt contents or may just reflect the inaccuracies in the measurementsand/or in the approximate nature of the AP-42 equation.
0.0
0.1
0.2
0.3
0.4
0.5
0.6
0.7
Pinjarra(
WA)
Port Hed
land (W
A)
Collie (W
A)
Hunter Vall
ey (N
SW)
Cairns (
Qld)
Strahan
(Tas
)
Emerald (Q
ld)
Pinjarra
- Bau
xite (
SKM, 200
4)
Dampier
- Iro
n Ore
(SKM, 2
004)
PM10
(kg/
ha/h
r)
PM10 = 0.5 * 1.9 (s/1.5) (365-p)/235 (f/15) (kg/ha/day) using a silt content of 7%
Figure 8 PM10 emissions estimated using the NPI equation and a silt content of 7% and twomeasurements from SKM (2004)
5.2.1.5 Control factorsIn the NPI Mining Manual, control factors for wind erosion are provided for wind breaks (30%), watersprays (50%) and re-vegetation or total enclosure (99%). The water spray control factor (as per most ofthe control factors) is considered to be very indicative. Particulate matter control through water cannon isvery dependent on both the design (spacing and coverage) of the water cannon, the maintenance of the

SINCLAIR KNIGHT MERZ
I:\WVES\Projects\WV02688\Deliverables\Final\R23npi_dust_review.doc PAGE 48
system (fixing broken cannon, pumps etc) and the operation of the system. In some newer systems,weather forecasts are used to enable the cannon to cycle and pre-wet areas before the strong windseventuate when the cannon has less coverage. In properly designed and maintained automatic systemswhich are based on wind, evaporation rates and weather forecasts to determine wetting cycles, controlhigher than 90% may be achieved.
In determining the control factors and areas subject to each control it is considered that the NPI currentlyprovides minimal guidance. For most mines in the more arid parts of Australia there are generally largebare areas that are non-erodible, with a high proportion of gravel sized or larger “rocks”, or with thesurface crusted due to rain or water application, with vehicle access restricted. At the other end of thespectrum there are lay-down areas and areas around stockpiles that may have frequent vehicle usage andinfrequent watering that can be very erodible. In deriving PM10 estimates, such areas must be quantifiedas to the level of particulate matter control. It is considered that more guidance, primarily pictorially suchas used in RWEQ, should be provided to lessen the subjective interpretation of control factors.
5.2.1.6 Other Australian StudiesSmall portable wind tunnels have been used to characterise relative particulate matter emissions ontailings dams and material at mines, for example work by Carras et al (1999) on tailings dams andLeys et al (2002) at iron ore ship loading facilities. These studies have been used to determine therelative dustiness potential of the surfaces (to highlight areas for improved particulate matter controls)and to assess particulate matter control measures.
Air Noise Environment conducted a study for the Australian Coal Association Research Programme tovalidate existing particulate emission estimation techniques for open area sources at coal mines (AirNoise Environment, 2003). The study used a large portable wind tunnel 1 m wide, 1.2 m high with a 5 mlong working section. The wind tunnel was run for an initial 60 seconds where the “spike” in initialparticulate matter was removed. The tunnel was then run for a period of 90 minutes with saltationmaterial introduced at the beginning of the working section, with TSP and PM10 measured 1 m before theend of the tunnel at 0.3 and 0.75 m above the surface, and with the wind speed measured at 1 m.
The major conclusions from the study were:
The particulate emission data from the wind tunnel testing suggests that PM10 may comprise asignificantly higher proportion of TSP, more than the 50% assumed by the NPI;
The open area emission factor (for TSP) of 0.4 kg/ha/hr may overestimate by a significant marginactual particulate emissions from tested open area surfaces for some open cut mines; and
The NPI emission equation (see equation 5.11) may overestimate the actual emissions from activecoal stockpiles.

SINCLAIR KNIGHT MERZ
I:\WVES\Projects\WV02688\Deliverables\Final\R23npi_dust_review.doc PAGE 49
The conclusions from this report however are considered indicative only due to problems with windtunnel derived emissions as discussed by Countess et al (2002) (see Section 5.2.1.3). Also, there appearto be a number of other issues with the study including:
Particulate matter emissions appeared to be derived using average concentrations measured at 0.3 and0.75 m above the surface and then multiplied by the flow rate. The particulate matter flux howevershould be determined using the profile of wind speed and the particulate matter concentrations asdetailed in ENVIRON (2004) and Countess et al (2001).
The particulate matter emissions appear not to have been corrected to a standard wind speed at 10 m;and
The particulate matter flux from the first 60 seconds was not included in the measurements, but wasonly used to estimate the natural saltation rate. This exclusion, along with the long sampling time of90 minutes at a constant wind speed, may result in armouring of the surface, (where the larger non-erodible elements protect the surface), and as such, the average concentrations may be lower thanthat measured over a shorter period.
Other large wind tunnel studies that have been conducted in Australia for mining applications that theauthors are aware of include:
Portable wind tunnel studies to investigate the wind erosion potential of various residue surfaces atthe Pinjarra alumina refinery, as reported in Bell (1984) and later in Scott (1994); and
Use of Agwest wind tunnel on a variety of surfaces bauxite refinery surfaces (SKM, 1997).
SKM (2004) provides a summary of two studies of open stockpile areas and two of drying areas usingportable samplers to profile the particulate matter plumes in the horizontal. These studies used thehorizontal particulate matter profiles and an estimated vertical Gaussian plume spread, mean wind speedat plume height and particle depletion to back-calculate the particulate matter emissions. These studieshave limitation in the absolute accuracy as detailed in Section 5.1.5.
The results were fitted to the form of particulate matter flux proposed by Shao et al (1996) of:
PM10 (g/m2/s) = k [WS 3 x (1 – (WSo2)/WS 2)], WS> WS0 (Eq. 5.14)
PM10 (g/m2/s) = 0, WS < WS0
Where: WS is the wind speed (m/s)
WSo is the threshold for particulate matter lift-off (m/s)
k is a constant.
Using these equations and annual hourly wind records, estimates of the annual PM10 emissions weremade.

SINCLAIR KNIGHT MERZ
I:\WVES\Projects\WV02688\Deliverables\Final\R23npi_dust_review.doc PAGE 50
Table 4 Particulate Matter emission fluxes as presented in SKM(2004)
SurfaceControls in
AreaK
(g/m2/s)WSo at 10mo
(m/s)
Annual Average
PM10(kg/ha/hr)
Bauxite Stockpile Area Uncontrolled 3.39e-7 8.5 0.48
Residue Area Wind Erosion - Area 1Residue Area Wind Erosion - Area 2
Well ControlledWell Controlled
1.32e-7
5.7e-7
9.86.5
0.050.04
Iron Ore Stockpiles - Main Live stockpile area Uncontrolled 5.2e-7 7.5 0.65
Note: Iron Ore data from Environmental Alliances (2003).
The results indicate that:
Wind speed thresholds (hourly average at 10 m) were in the range of 6.25 to 9.8 m/s;
Estimates for the controlled sites, using water cannons to increase the cloddiness of the site, were25% of the default NPI emission rate for PM10 of 0.2 kg/ha/hr; and
Annual PM10 emissions for the uncontrolled surfaces were 0.48 and 0.65 kg/ha/hr. This is higherthan the default NPI PM10 value, but could be due to the windy nature of the sites, uncertainty in siltcontent, potential errors in the measurements and the approximate nature of equation 5.11.
Coffey and Evans (2000) present a variation on the above method whereby a network of 24 hour samplerssurrounding a large residue drying area was used to back-calculate the particulate matter emissions. Anuncertainty with this method is the need to assume the sampler 24 hour concentrations are representativeof a large wind sector and as such the method requires good coverage around the particulate mattersource. Another uncertainty arises from the concentrations being averaged over 24 hours, which requiresthe particulate matter contribution at each monitor to be apportioned over the period when the wind wasfrom the source to the monitor. This can cause ambiguity as the particulate matter emission estimates aredependent on the wind speed and the correct apportionment for the various wind conditions. Thisproblem can be overcome if hourly average data is used. This method has acceptance by the NPI inWestern Australia as an approved alternative for the three surfaces in Table 4.
Another alternative to this method is the use of dispersion models such as ISC3 or AUSPLUME thatmodel the dispersion and the depletion of the plume. It is considered that such a method with suitablewell-sited monitors (free from other local sources), appropriate choice of wind erosion function such asequation 5.14 and a reasonably accurate wind speed threshold will provide a better estimate of theparticulate matter emissions than the use of equations such as equation 5.11. Therefore, given theuncertainty in the current method, it is recommended that these methods be proposed as alternativemethods, provided they are subject to an independent review by suitably qualified practitioners toevaluate the accuracy and adequacy of the estimates.

SINCLAIR KNIGHT MERZ
I:\WVES\Projects\WV02688\Deliverables\Final\R23npi_dust_review.doc PAGE 51
5.2.2 Summary and RecommendationsThe current NPI recommendation for wind erosion is the PM10 default factor of 0.2 kg/ha/hr. This isbased on the older AP-42 equation (pre 1988, equation 5.11) for active storage piles with a continualsupply of fresh material, use of Hunter valley coal and overburden characteristics, and Hunter Valleywind and rainfall values. It is therefore unlikely to be representative of conditions for all Australianmines, as it does not take into account the differences in climate and ore types and, since it was developedfor an active storage pile, tends to overestimate emissions.
Furthermore, both the original and the current AP-42 equations appear to be based on limited data forcoal mines. The current method in particular, is based on a small number of wind tunnel measurementswhich are subject to uncertainties, especially when extrapolating to larger areas.
As such, the following are recommended:
R 5.5 The current default factor should be deleted. It is considered that emission estimates can bereadily obtained with the current NPI equation and this should be used to take into accountclimate variations across Australia. This will result in some areas having emission factors that aretwice as high as the current default with some areas having considerably lower emissions;
R 5.6 Though the current NPI equation is considered indicative only, there appears to be no readyreplacement, with the existing AP-42 equation considered to be based on little data for non-coalmines and difficult to implement (eg. estimation of threshold friction velocities). Therefore it isrecommended that:
The current NPI equation should be retained in the interim.
The NPI coordinate with the US groups (USEPA and WRAPAIR) to determine and progresstoward a new equation with more supporting studies for this.
The NPI liaise with the wind erosion community within Australia to see if a more suitableequation or simple model for mines could be developed. Such work may includeundertaking a single case study to verify the methodology or the development of portablewind tunnel methodology to determine relative erodibility potential of materials.
R 5.7 The NPI develops or commissions estimates for all fugitive particulate matter sources withinAustralia, such that the mining fugitive emissions can be placed in context, as is provided in theUS NEI. At present in most regions of Australia, fugitive particulate matter from mining ispresented as the only large source, with other larger sources of PM10 and “metals” such as fromwind erosion of non mine areas, from agricultural activities and bush fires omitted. For winderosion estimates it is recommended that the NPI liaise with those in the Australian Air QualityForecasting System (AAQFS) who are currently evaluating a system that predicts PM10 winderosion emissions and the resultant PM10 concentrations for Australia. Alternatively, a systemusing the CARB approach as used in the Pilbara and Bunbury airsheds (SKM, 2003 and

SINCLAIR KNIGHT MERZ
I:\WVES\Projects\WV02688\Deliverables\Final\R23npi_dust_review.doc PAGE 52
SKM, 2003b) and recently undertaken for Victoria (Ng, 2004) could be used. The use of anational approach would also have the advantage of providing consistency across Australia.Other sources of particulate matter from agricultural practices and fires could also be coordinatedat a national or at least state level. PM10 estimates from fires could be obtained in conjunctionwith the national greenhouse gas emission estimates as they both require fuel loading and the areaburned. The development of estimates for all fugitive particulate matter sources within Australiahas the potential to cost around $100,000.
R 5.8 Alternative methods, such as using validated particulate matter dispersion models, should behighlighted as an acceptable alternative to the AP-42 equation. Such a method can consist ofwell-sited ambient monitors that are free from confounding sources, along with the use of back-calculation techniques involving dispersion models. It is recommended that all such studies havean independent technical review to ensure that the estimates are acceptable. This method wouldinitially require a statement in the manual indicating that is an acceptable option, though requiringagreement on a case by case basis with the relevant State NPI department.
R 5.9 Wind erosion control factors need to be improved to provide more detail on how to classifysurface types. A possible method may be to supply photographic examples of bare areas as perthe method used in RWEQ. This is recommended as greater than a factor of two variation canoccur due to the subjective interpretation involved in classifying the amount of erodible area andthe relevant control factors for a particular site.
R 5.10 A wider range of control factors is needed for water cannon control to give credit to facilities withwell designed and maintained systems. To undertake this, a review of water cannon control isrecommended as a first step. The authors are aware of one study currently underway to determinecontrol factors for water cannon.
5.3 Material Handling Load-in/Load-out
5.3.1 USEPA AP-42Emission factors from AP-42 of relevance are those under:
Aggregate handling and storage piles (AP-42 Section 13.2.4, 1995). This contains general equationsfor continuous or batch drop operations:
E (kg/tonne) = k (0.0016) (U/2.2)1.3 (M/2)-1.4 (Eq 5.15)
Where k = particle size multiplier
U = mean wind speed (m/s)
M = material moisture content (%)

SINCLAIR KNIGHT MERZ
I:\WVES\Projects\WV02688\Deliverables\Final\R23npi_dust_review.doc PAGE 53
This equation is specified for loading in (truck dumping to pile, stacking into pile) and loading outfrom the pile (e.g. a front-end loader loading a truck).
Western Surface Coal Mining (Section 11.9, 1998) contains truck loading and truck dumping factorsfor coal.
Crushed Stone Processing and Pulverised Mineral Processing (Section 11.19.2, August 2004)contains emission factors for tertiary crushing, screening, conveyor transfers and truck unloading
Taconite Ore Processing (Section 11.23.1, February 1997) contains emission factors for primary,secondary and tertiary crushing.
Sand and Gravel Processing (Section 11.19, November 1995) contains a factor for sand handling andstorage with a wet scrubber.
Metallic Minerals Processing (Section 11.24, 1982, reformatted January 1995) provides factors forlow and high moisture ores (the cut off defined as 4%) for primary, secondary and tertiary crushingand material handling and transfer for uncontrolled sources. It is noted that the factors for crushingand drying operations are for the process as a whole and cover all the separate particulate mattersources such as hoppers, surge bins or transfer points that are integral with these facilities. Thisdefinition of crushing needs to be clearly spelt out to ensure that no double counting of transfers etcoccurs.
In AP-42 material aggregate handling (AP-42 4th edition), the equations were:
E (kg/tonne) = k (0.0009) (s/5) (U/2.2) (H/1.5) (M/2)-2 (Y/4.6) 0.33 (batch drop) (Eq 5.16)
E (kg/tonne) = k (0.0009) (s/5) (U/2.2) (H/3.0) (M/2)-2 (continuous drop) (Eq 5.17)
These were replaced with the current equations in 1995, which have removed the silt content and dropdistance dependence.
5.3.2 NPI and Australian Studies
5.3.2.1 Truck Loading and DumpingThe NERDDC study on Australian coal mine operations (NERDDC, 1986) found very similar emissionfactors for truck and shovel loading of coal and overburden to that reported by Axetall and Cowherd(1981). However, in the comparison of the NERDDC emission factors to the present AP-42 batchloading equation, Holmes Air Sciences (1998) found that the equations give much lower particulatematter emissions for operations such as overburden and coal dumping and load-in to haul trucks. Inreviewing the applicability of the AP-42 equations Holmes Air Sciences (1998) state that the AP-42equation,
“gives much lower dust emissions than the Australian research (NERDCC, 1988 and SPCC, 1983), orindeed than earlier US research. It is likely that the reason for this is that the earlier equations treat the
SINCLAIR KNIGHT MERZ
I:\WVES\Projects\WV02688\Deliverables\Final\R23npi_dust_review.doc PAGE 54
entire loading operation as a single operation. The entire operation involves using a shovel/excavator orfront end loader to scoop up a load, move to a loading position, dump material into a truck, reload andrepeat the process. After the new loading operation is completed the loaded vehicle moves off and isreplaced by a new vehicle. If the newer equation simply considers a pure batch or continuous load-outoperation, for example as might be found in a facility using a clamshell, or loading from a conveyor to astockpile then many of the dust producing actions will not be included. It would seem that the (NERDCC,1988), (SPCC 1983) and earlier US equations would be more appropriate, for both coal andmetalliferous mines, than the newer equation proposed by the EPA (NSW).”
In the original NPI Mining Manual (version 1), a comparison was presented of the estimates from the AP-42 for aggregate handling and measurements of loading overburden to trucks at a coal mine. The AP-42values were up to 90 times lower than those obtained from the NERDDC study (see Section A1.1.3).Therefore, the NPI Mining Manual recommended the NERDDC values. Similarly, for dumping coal andoverburden the NPI Mining Manual again recommended the NERDDC values. For loading coal acomparison was made to the available equation in AP-42 Western Surface Coal Mining which comparedwell with the NERDDC measurements. As such, the equation was recommended. For metalliferousmines, as there was no Australian data the AP-42 equation was recommended as the only availableoption, though it was considered that this equation may underestimate actual emissions by a factor of 5 to10.
Therefore, for metalliferous mines the available Australian data indicates that these sources may beunderestimated by use of the current AP-42 equations.
R 5.11 For loading/unloading trucks it is recommended that, as a first step, an in-depth review of thederivation of the USEPA AP-42 load-in/load-out emission equation is required to resolve theapparent large underestimation in emissions when using this equation, compared to that measuredat Australian mines.
5.3.2.2 Transfer Points, Stacking and ReclaimingParticulate matter emission factors in the NPI Mining Manual for coal mining transfer stations were givenby the AP-42 load-in/load-out equation. No Australian data were available for comparison of thesevalues. The AP-42 equation and a default based on “typical” conditions” are provided in a summary tablein the NPI Mining Manual (version 2.3). For metalliferous mines, emission factor defaults are providedfor both low moisture content ores (below 4%) and high moisture content ores (greater than 4%) obtainedfrom the AP-42 metallic minerals processing handbook. The source of these factors in the AP-42 guide isnot clear and, due to the approximate step change cut off, are considered to have a high degree ofuncertainty. The AP-42 classifies these with a rating of C.
In practice, the mining industry generally uses the AP-42 load-in/load-out equation given in the coalmining section, though this is not provided in the metalliferous section of the NPI Mining Manual.

SINCLAIR KNIGHT MERZ
I:\WVES\Projects\WV02688\Deliverables\Final\R23npi_dust_review.doc PAGE 55
Apart from the metallic minerals processing factors, and aggregate handling equation, the new crushedstone processing and pulverised minerals processing guide (USEPA, 2004c) contains emission factors forconveyor transfer points as well as crushing and screening. These factors are all generally well below themetallic minerals factors. It is considered that for some of the hard rock mines these factors may be moreapplicable than those from the metallic minerals processing guide (USEPA, 1982).
With the current NPI defaults, the division of ores into either low or high moisture is approximate andreduces the dustiness of ores into two states only, instead of the continuum of dustiness that can occurover several orders of magnitude. The change in dustiness with moisture can be determined in thelaboratory by the rotating drum test used in defining coal dustiness (AS4156.6-2000). These tests havebeen used in a modified format in Western Australian iron ore operations to account for the density ofiron ore when defining the relative dustiness and the moisture content needed to suppress dust. Indicativeresults for three ore types are presented in Figure 9. This figure shows that:
Different iron ores can exhibit differences of about 2% in the moisture cut off between high and lowdusting ores. The actual value is dependent on the definition of the level of “no” dust, but it is likelyto be in the range of 3% to 5.5 % moisture content for the ores tested. This is in approximateagreement with the metallic minerals processing guide of 4%.
Ores with low silt contents, such as lump ores, have the potential to be dustier than fines with highersilt contents. Lump ores are the premium product from the screened mined ore with an approximate6 to 32 mm size, whilst fines are product smaller than 6 mm. The lumps can be more dusty at a givenmoisture content because the small fraction of fines can be in loose adherence to the larger lumpmaterial and can be easily dislodged and winnowed during material handling.
There is a much greater variation in particulate matter emissions than is indicated in the metallicminerals guide (USEPA, 1982) where moist ores are specified to have particulate matter emissions ofbetween 10 to 20% of the low moisture ores. Conversely very dry ores can have much higherparticulate matter emissions. It is noted that the magnitude of the difference from the rotating drumtest is overstated as the particulate matter is drawn out of the sample for a period of five minutes withcontinual tumbling, unlike in a conveyor transfer point in which the ore is passed through only once.
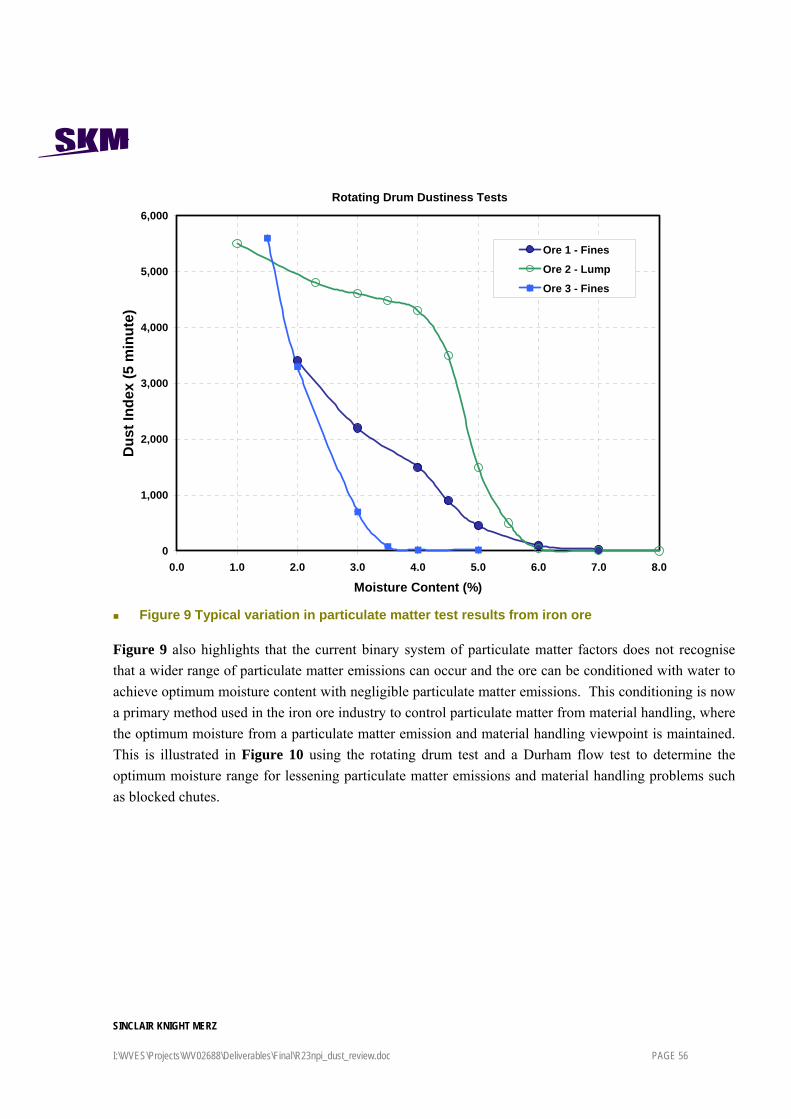
SINCLAIR KNIGHT MERZ
I:\WVES\Projects\WV02688\Deliverables\Final\R23npi_dust_review.doc PAGE 56
Rotating Drum Dustiness Tests
0
1,000
2,000
3,000
4,000
5,000
6,000
0.0 1.0 2.0 3.0 4.0 5.0 6.0 7.0 8.0
Moisture Content (%)
Dus
t Ind
ex (5
min
ute)
Ore 1 - Fines
Ore 2 - Lump
Ore 3 - Fines
Figure 9 Typical variation in particulate matter test results from iron ore
Figure 9 also highlights that the current binary system of particulate matter factors does not recognisethat a wider range of particulate matter emissions can occur and the ore can be conditioned with water toachieve optimum moisture content with negligible particulate matter emissions. This conditioning is nowa primary method used in the iron ore industry to control particulate matter from material handling, wherethe optimum moisture from a particulate matter emission and material handling viewpoint is maintained.This is illustrated in Figure 10 using the rotating drum test and a Durham flow test to determine theoptimum moisture range for lessening particulate matter emissions and material handling problems suchas blocked chutes.

SINCLAIR KNIGHT MERZ
I:\WVES\Projects\WV02688\Deliverables\Final\R23npi_dust_review.doc PAGE 57
1
10
100
1000
0.0 1.0 2.0 3.0 4.0 5.0 6.0 7.0 8.0 9.0 10.0 11.0 12.0 13.0 14.0%H2O
Dus
t Num
ber (
Dus
t Yie
ld x
100,
000)
0
20
40
60
80
100
120
Dur
ham
Con
e Fl
ow T
ime
(s)
Dust Number Flow Time
Flow stopped
OptimumMoisture
range
Figure 10 Particulate matter number and Durham cone flow time as a function of moisturecontent for an iron ore
The rotating drum tests also indicate that the current material handling dependence on moisture contentand silt content are very simplistic and do not hold for all ore types. Instead, it would be preferable todevelop a method whereby the dustiness of an ore was determined as a function of moisture by a test suchas the rotating drum. The test results could then be incorporated into a predictive factor that took intoaccount the operating dependent emissions.
Another important issue with the application of appropriate moisture content is that this is relevant tounbound moisture only. AP-42 for Western Surface Coal Mining states the unbound sorbed moisture isto be used in the equations and not bound moisture. This is supported by Smithman and Nicol (1990),who tested Australian coals using wind tunnels, and Lu (1997) for Chinese coals. Lu (1997) usesdefinitions of inherent moisture (moisture that is preserved in air-dried coal and that which is held in theinternal pores etc); free moisture (that which can be air-dried), and the total moisture. Lu (1997) foundthat some coal, with moisture contents in the 6 to 8% range could be very dusty as all the moisture washeld internally as inherent moisture. Lu found that free moisture was a much better predictor of thedustiness of the coal. For most metallic ores it is considered that inherent moisture will be low, thoughfor some ores with high internal pores this may be an issue. As such, this definition needs to be betterhighlighted in the NPI Mining manual.
Pitts (2000) provides a comparison of the emissions from iron ore operations for transfers, stacking andreclaiming. The study indicated reasonable agreement with the default NPI factors taken from the AP-42

SINCLAIR KNIGHT MERZ
I:\WVES\Projects\WV02688\Deliverables\Final\R23npi_dust_review.doc PAGE 58
metalliferous default factor. However, a comparison of the emissions estimated by the AP-42 aggregatehandling equation, assuming typical wind speeds of 4 m/s and moisture contents of 3 and 5% for the lowand high moisture content ores, indicates that the AP-42 derived values are generally 5 to 25 times lowerthan the default NPI factors or as presented by Pitts (2000). As such, and as also found by Holmes AirSciences (1988), it appears that the AP-42 equation under-predicts the particulate matter emissions.
The following are recommended for transfer stations, stackers and reclaimers:
R 5.12 For transfers, reclaimers and stackers, it is recommended that, as per loading/unloading trucks areview of the derivation of the USEPA load-in/load-out equations be undertaken to resolve theapparent underestimation of emissions. As an interim measure it is recommended that thedefaults be retained but usage of the equation be dissuaded.
R 5.13 When considering the moisture content of ores, as a second higher level of complexity to usingthe default 4% cut off between high and low moisture content ores, mines should be encouragedto use the rotating drum test to classify the dustiness of the ore as either high or low moisture. Ingeneral, the available data supports the default 4% cut off but the limited test work presented inthis report indicates that thresholds may vary between at least 3 to 5.5%.
R 5.14 As a low priority task, it is recommended that dustiness tests be used to account for the dustinessof the ores as a function of moisture. It is considered that this captures the true dustiness of theore rather than trying to fit a simple universal moisture and silt particulate matter relationship tothe ore as is used for moisture in the current and both moisture and silt in the older AP-42material handling equations.
5.3.2.3 CrushingThe current NPI Mining Manual has adopted the AP-42 values from Metallic Minerals Processing(Chapter 11.24) (USEPA, 1982). As noted in Section 5.3.1, the Crushed Stone Processing and PulverisedMinerals Processing (USEPA, 2004c) also provides a value for tertiary crushing which is substantiallybelow that from metallic minerals. As such, it is recommended that:
R 5.15 For crushing emissions, the new AP-42 stone crushing and quarrying factors be included as thedefaults for the stone crushing and quarrying industry.
5.3.2.4 ScreeningScreening generally occurs in combination with crushing operations to size the crushed product. The NPIMining Manual provides emission factors for screening for one all encompassing ore type at a “low”moisture content, with TSP and PM10 emissions of 0.08 and 0.06 kg/tonne respectively. The source ofthese factors is not given in the NPI Mining Manual, with the derivation not clear. The values are similarto those provided in the Crushed Stone Processing and Pulverised Minerals Processing section of AP-42(USEPA, 2004c) for uncontrolled fines screening of 0.15 and 0.036 kg/tonne. Fines screening takes place

SINCLAIR KNIGHT MERZ
I:\WVES\Projects\WV02688\Deliverables\Final\R23npi_dust_review.doc PAGE 59
after tertiary screening to produce manufactured sand with a maximum screen size of 50 mm.Uncontrolled screening factors for use with screening in primary to tertiary crushing are quoted at 0.0125and 0.0043 kg/tonne for TSP and PM10 respectively, with a PM10 controlled factor of 0.00037 kg/tonne(controlled) which gives a control efficiency of 91.6%.
In practice, screening emissions for most sites will be covered under the crushing factors as this factorincludes the system of crushers, screens, hoppers and transfers. However, iron ore port operations oftenhave separate re-screening facilities to screen the lump ore before shipment and remove the fines forreturn to the fines product stockpiles. This re-screening is required due to “degradation” of the orethrough handling, primarily through the many conveyor transfers which can break off fine particles,therefore producing a sizeable proportion of fines in the lump ore.
Pitts (2000) measured the emissions from these screening plants, (including all sources, hoppers andconveyor transfers) at an average 0.004 kg/tonne. The screens themselves were controlled withparticulate matter extraction to scrubbers with the hoppers (bins) mainly enclosed. If control efficienciesof 93.5% and 89% are assumed for the entire plant, which appears reasonable, the measurements of Pitts(2000) imply uncontrolled values of 0.06 and 0.036 kg/tonne respectively, which are in agreement withthe values used by the NPI EET and that for fines screening in stone quarrying as reported in AP-42. Assuch, for the iron ore industry, the fines screening value in the new crushed stone processing andpulverised minerals appear appropriate, with a typical overall control factor of 90% based on operationsin a partially enclosed building with dust extraction from the screens and partial enclosure of hoppers.
Therefore, it is recommended that:
R 5.16 For screening emissions, the emission factors should be updated with those in the new AP-42crushed stone processing and pulverised minerals guide. For primary, secondary and tertiaryscreening at stone processing and quarrying operations the AP-42 “screening” factors areapplicable, whilst for iron ore re-screening the “fines screening” factor is considered applicable.
5.4 Blasting
5.4.1 USEPA AP-42Until 1998, the USEPA AP-42 recommended the following equation for coal and overburden blasting:
ETSP (kg/blast) = 344 (A 0.8) (M -1.9) (D -1.8) (Eq 5.18)
Where A = the area of the blast (m2)
M = the moisture content (unbound moisture content) (%)
D =the blast depth (m)
This area dependent equation was recommended for all blasting from coal, overburden and otherun-fractured rock blasting with quality ratings for TSP of C and D for both PM10 and PM2.5.

SINCLAIR KNIGHT MERZ
I:\WVES\Projects\WV02688\Deliverables\Final\R23npi_dust_review.doc PAGE 60
This equation was developed from 14 coal and four overburden blasts at three western surface coalmines.This equation was included in the Crushed Stone Processing guideline in 1985, but was considered byindustry to overestimate the emissions due to the strong moisture dependence of the equation and themuch lower moistures in the stone processing industry (MEPA review, 1998). In response, the USEPAdeveloped a new equation for use in the crushed stone industry based on the original surface coal data thatonly included the area blasted. The data used and the equation developed are presented below and inFigure 11:
EF30 (kg/blast) = 0.00022 A 1.5 (Eq 5.19)
Note, this equation is as presented in the 1998 Western Surface Coal Mining which is all in metric units,though at various times a mixed unit equation has been given with emissions in lb/blast and area in squaremetres as per Figure 11.

SINCLAIR KNIGHT MERZ
I:\WVES\Projects\WV02688\Deliverables\Final\R23npi_dust_review.doc PAGE 61
Figure 11 Particulate matter emissions from blasting versus area blasted fromCowherd (1986).
As well as the coal mining data, two inferred estimates on granite and traprock were also presented whichwere commented to have “bracketed” the coal/overburden tests and the equation. The inferred granitetest result however, as indicated in Figure 11, is around 30 times greater than that estimated from theequation and does not appear to support the use of this equation outside the coal mining industry. Also,of note is that the blast area ranges from approximately 700 m2 up to 8,000 m2, whilst blasting inAustralian mining can be up to 45,000 m2 (McDougall, 2004). Currently there are no other equationsavailable to estimate particulate emissions from blasting.

SINCLAIR KNIGHT MERZ
I:\WVES\Projects\WV02688\Deliverables\Final\R23npi_dust_review.doc PAGE 62
Values of PM10 from blasting are then estimated at 52% of TSP, based on material handing PM10/TSPratios. PM2.5 values were originally estimated as 0.03 of TSP based on ratios from material handling. It isnoted that MRI (1998) removed the PM2.5 factor, whilst this is still in the 1998 AP-42 manual.
The recently updated Crushed Stone Processing and Pulverised Mineral Processing (August 2004) nowstates that “Emission factor estimates for stone quarry blasting operations are not presented because ofthe sparsity and unreliability of available tests. While a procedure for estimating blasting emissions ispresented in Section 11.9, Western Surface Coal Mining, that procedure should not be applied to stonequarries because of dissimilarities in blasting techniques, material blasted and size of blast areas”(USEPA 2004).
5.4.2 NPIThe 1999 NPI Mining Manual and current 2002 NPI Mining Manual (version 2.3) provided the twoAP-42 equations, but recommended the first equation with no default provided. This recommendationwas based on the comparison in Holmes Air Sciences (1998) which considered equation 5.18 to “givemore reasonable estimates of particulate matter emissions” as well incorporating the intuitivelydependent variables such as moisture content and blast depth. The current draft NPI Fugitive EmissionsManual (NPI, 2002), set to replace the NPI Mining Manual, has adopted the new equation although notext is provided to explain the changes.
A comparison of the estimates for a range of moisture contents, areas blasted and blast depths is given inTable 5.
Table 5 Blasting PM10 emissions for a range of conditions
MoistureContent
(%)
Area Blasted (m2) Blast Depth (m) PM10 Emissions
AP-42 (1988)
(kg/blast)
PM10 Emissions
AP-42 (1998)
(kg/blast)
Ratio Old/NewEstimate
3 2,000 4 800 10 78.23 2,000 6 386 10 37.710 2,000 6 39 10 3.810 15,000 6 196 210 0.93 15,000 6 1,933 210 9.23 15,000 8 1,152 210 5.5
This shows that, for moisture contents below 10%, there can be an appreciable difference between thetwo methods. For moisture contents around 3%, which typically occur in arid areas when mining abovethe water table, the new equation predicts 5 to 10 times lower concentrations for large blast areas. Forsmall blast areas (2,000 m2) the equation predicts 35 to 80 times lower emissions.

SINCLAIR KNIGHT MERZ
I:\WVES\Projects\WV02688\Deliverables\Final\R23npi_dust_review.doc PAGE 63
As such, replacing the existing equation with the new equation will lead to a generally very largereduction in blasting particulate matter emissions for reporters that have used the recommended equation.It is noted that, though not recommended, some reporters have been using the area-based equation due toits simplicity, requiring only the area blasted and not estimates of the moisture content, which at somemines are not undertaken. In fact, for the evaluation of the relative contribution of particulate mattersources at various mines presented in Section 8.1 and Figure 11, the relatively high contributions of up to11% from blasting were from mines which used the older equation, whilst the lower contributions werepredicted for mines that have used the current equation.
Of note in the NPI Mining Manual and NPI Fugitive Emissions Manual is that the area blasted (in m2) isnot clearly identified as area per blast. As a result, it is known that some NPI estimates have beenundertaken using the area from the total 12-month period. Use of the area from 12 months and the olderequation will result in lower than intended emissions whilst use of the new equation (in particular usingthe total area) will give an erroneously high particulate matter emission.
Based on the above review and the recent recommendation in the Crushed Stone Processing andPulverized Mineral Processing guide (USEPA, 2004c) it is seen that there is little if any justification forthe equations for the non-coal mining industry. Additionally, mines in Australia can have blast areassubstantially larger than that for which the current AP-42 equation in coal mining was developed (maxvalue of 9,600 m2) with two mining groups contacted having blast areas in the range of 11,000 to15,000 m2 and up to 45,000 m2. As such, it is recommended that:
R 5.17 Though there is little support for the application of the current AP-42 blasting equation, anddespite it being dropped from AP-42 Crushed Stone Processing and Pulverized MineralProcessing guide, it is recommended that:
The new AP-42 equation be retained in the interim;
NPI liaise with the USEPA to investigate further work planned to improve this factor; and
NPI investigate the feasibility of conducting Australian testing using aircraft to profile theparticulate matter plume to derive estimates. Such methods have been used for otheraerosols such as smoke plumes from fires and industrial sources using the FlindersUniversity aircraft and CSIRO.
5.5 General Comments on Control FactorsThe control factors listed in the NPI Mining Manual are generally limited and quite dated. It isconsidered that a review of the control factors should be conducted with more categories of controloptions provided.

SINCLAIR KNIGHT MERZ
I:\WVES\Projects\WV02688\Deliverables\Final\R23npi_dust_review.doc PAGE 64
5.6 Particulate RemovalIn general, the NPI requires particulate matter emissions to be estimated at the source and does not takeinto account deposition rates, which would allow estimation of the quantity of particulate matter that istransported beyond a site’s boundary (see Holmes Air Sciences, 1998 and NSWMC, 2000). This neglectof particulate removal does not recognise that many mines are planned such that have a good buffer zonearound the operations to ensure that the majority of the particulate matter is deposited before it leaves thesite. Such a buffer may be due to the “natural” revegetation or the land may be intentionally revegetatedto assist in removing particulate matter. Additionally, the NPI methodology does not distinguish betweenthe use of shelter belts and vegetation grown adjacent to sources (such as along road sides and aroundstockpiles) that reduce the wind speed (therefore reducing particulate matter emissions) and between theuse of vegetation downwind to trap the particulate matter once emitted. In the first case, the reduction ofwind speed to reduce particulate matter emissions can be incorporated into the applicable EET, whilst theuse of shelter belts to trap particulate matter cannot. Also, for particulate matter sources, fogger sprays tocapture particulate matter are counted as a dust control measure, whilst shelter belts immediatelydownwind are not. As detailed by Pace (2004), vegetation immediately downwind of sources can removean appreciable proportion of even the fine PM2.5 particulate.
Whilst not allowing for use of vegetation belt to remove particulate matter, the NPI Mining Manualallows for the capture or removal of particulate matter from mining activities within a pit to be used, andprovides a value of 50% and 5% retention for TSP and PM10. The source quoted for these factors in theNPI Mining Manual is Holmes Air Sciences (1998), but it would appear to be based on data presented inNSWMC (2000) using the model ISC3-ST, an assumed source particle size distribution and particular pitdimensions. Therefore it is specific to a particular mine and may under-predict that which occurs fromsome of the larger, deeper open cut mines.
From the US perspective, it is understood that emission inventories are to be at the source, with Pace(2004) recommending against incorporating near source particulate removal to derive emissioninventories.
R 5.18 It is recommended that the NPI review the issue of particulate removal, noting that depletion forpit retention is incorporated but other removal mechanisms, such as vegetation belts, are not. Inthe case of mines, it is considered that the pit retentions are very indicative and that guidanceshould be provided so mines can develop site-specific factors using a model such as ISC3.

SINCLAIR KNIGHT MERZ
I:\WVES\Projects\WV02688\Deliverables\Final\R23npi_dust_review.doc PAGE 65
6. Particulate Size DistributionsAs detailed in Sections 3 and 4, emission factors have principally been developed from samplingimmediately downwind of the sources using TSP samplers and PM10 samplers with cascade impactors todetermine the particle size distribution below 10 µm. Little work has been done with PM2.5 samplers,particularly those that meet Federal Reference Method requirements with a sharp cut point head. As aresult, fugitive particulate matter emission factors are relatively more uncertain for the smaller sizeparticulates.
In the US, the issue of the accuracy of the particle distribution, especially for PM2.5 fractions has been ofconcern due to the over-prediction of crustal material PM2.5 compared to its presence in ambientmonitoring (see Section 4.2). This has lead to WRAPAIR undertaking a study to evaluate the USEPA’sFugitive Particulate Matter Emission Factor Test Methods for PM2.5. One of the outcomes of the study isthat it highlighted the significance of particle capture near the source in removing even fine PM2.5
particulate. Though this can result in a large fraction of the PM2.5 captured, there remains concern that thePM2.5 emission factors may be overstated.
Other reasons for the uncertainty and possible over-prediction are:
Sampling methodology using high volume samplers fitted with a PM10 cyclone and cascade impactormay over-sample the lower size ranges due to particle bounce in the cascade impactor. This isimportant for high filter loads where the particles may bounce off the particles already captured onthe surface of the impactor plates, and therefore be collected in the next lower size fraction. Thismay help to explain why the AP-42 emission factors for fugitive particulate matter sources appear tooverestimate PM2.5 emissions (WRAPAIR, 2004).
The uncertainty in TSP measurements recorded with a high volume sampler. These, as detailed inSection 2, are very dependent on the wind orientation and speed during sampling. AP-42 factors arenormally presented as PM30, but it is not always clear whether the PM30 has been derived byassuming that the size distribution measured by a TSP sampler is approximately PM30, or byspecifying the particles collected by the TSP sampler as a PM30 subcategory.
Accounting for depletion of the particles between source and sampler. The size distributions aretypically determined from samplers tens to hundreds of metres downwind. At this distanceappreciable depletion of the larger particles can occur. In the AP-42 studies, simple depletion modelshave been used to account for the depletion (see MRI, 1998). In Australia, the method of Slinn(1982) has been used for the SPCC (1986) study.
PM2.5 sampling has used older broader cut points than those now specified for ambient samplerswhich have sharp cut points. Broader cut points will result in an over-sampling of crustal materialwith the potential that the majority of the sample is actually greater than 2.5 micron.

SINCLAIR KNIGHT MERZ
I:\WVES\Projects\WV02688\Deliverables\Final\R23npi_dust_review.doc PAGE 66
A comparison of available particle size distributions in the literature and within Australia is summarisedin Table 6. These have been derived from:
Current AP-42 factors;
The work of SPCC (1986), which is considered to be the only comprehensive study of source particlesize distribution data within Australian to date. This work was conducted on coal mining activities inthe mid-eighties to determine the particle size distribution of particulate matter from haul trucks andload-in and load-out operations. The study used:
- High volume samplers with iso-kinetic sampling heads mounted on wind vane heads, with thesampling velocity matched to the wind speed by using an adjacent wind sensor. Velocity wasobtained by the average of the last five seconds of wind run.
- Particle sizing obtained by washing and sonication of the papers in ethanol, with the particulatematter passed through a Malvern particle sizer. Physical particle sizes were converted toaerodynamic sizes by then correcting for the shape and density of the particles.
- Corrections for depletion, with a maximum of 10% to 30% correction for the larger particles andthe results presented as percentage of particles less than 30 µm (i.e. SP or PM30 and not TSP).
This data has been recently summarised in NSW Mineral Council (2000) with, on average, 4.7%and 39.1% of the PM30 being PM2.5 and PM10;
The work of Leys et al (1998) on agricultural machinery and unpaved road dust in northern NSW.This indicates that of the PM30, 1% was PM2.5, 15% was PM10 and only 5.6% of the PM10 was PM2.5;
The PM2.5/PM10 ratio of 22% for wind blown particulate matter used in WRAPAIR. This ratio isbased on work by CARB though its exact origins are not detailed (ENVIRON, 2004);
Wind erosion data as presented in Shao et al (2003) for Asian dust storms; and
Data as summarised by Watson and Chow (2000) of Ahuja et al (1989) and Houck et al (1989, 1990).

SINCLAIR KNIGHT MERZ
I:\WVES\Projects\WV02688\Deliverables\Final\R23npi_dust_review.doc PAGE 67
Table 6 Particulate Matter Size Distributions from the Literature
Size Load-in/Load-out Wheel Generated
Industrial
Wind Erosion
Percentage below PM2.5 PM10 PM15 PM2.5 PM10 PM15 PM2.5 PM10 PM15
AP-42 15 47 65 4.74.5
3130
--
20 50 60
SPCC (1986) 4 - 48-63 6 - 59 - - -
Watson and Chow 5.8 35 - 10.7 52.3 - - - -
Ratio PM2.5 /PM30
PM2.5 /PM10
PM10 /PM30
PM2.5 /PM30
PM2.5 /PM10
PM10 /PM30
PM2.5 /PM30
PM2.5 /PM10
PM10 /PM30
AP-42 15 32 47 4.6 15 31 20 40 50
SPCC (1986) 4 - - 6 - - - - -
Watson and Chow 5.8 17 - 10.7 20 - - - -
Shao et al (obs) - - - - - - - 16range18-29
-
CARB/WRAPAIR - - - - - - - 22 -
Notes:1) Shao et al (2003) are observations at distances hundreds to thousands of kilometres downwind. As such, the PM2.5 to
PM10 fraction should be greater than at the source.
Table 6 indicates the following:
Reasonable agreement between the AP-42 factors and vehicle generated particulate matter,particularly between AP-42 and SPCC (1986). Note the USEPA recently lowered the PM2.5 andPM10 fractions in unpaved road particulate matter emissions;
Higher percentage of smaller particulates from AP-42 factors for the load-in/load-out particles,especially for PM2.5; and
The AP-42 distribution has a much larger proportion of particles in the small size ranges for winderosion than the other data. The actual source of the USEPA particle size distribution is not given,but it appears to be a very approximate distribution. It should be noted that the paper by Cowherdand Kuykendak (1997) recommended a much lower fraction for wind erosion than in the currentAP-42 guide.
Besides the above data it is considered that, for wind erosion, there is a substantial amount of data on sizedistributions of wind blown particulate matter and reasonably sophisticated models for predictingparticulate matter emissions and concentrations downwind in the wind erosion sciences. For example, themodel of Alfaro and Gomes (2002) predicts the size distribution of particulate matter dependent on the

SINCLAIR KNIGHT MERZ
I:\WVES\Projects\WV02688\Deliverables\Final\R23npi_dust_review.doc PAGE 68
soil particle size distribution and the friction velocity. Size distribution data is also generated in themodel used by Lu et al (2004) though this is not routinely extracted or examined.
Another method that may be of use to assist in determining the particulate matter size distributions is theuse of ambient samplers placed near particulate matter sources, where depletion is not significant andsampled particulate matter is predominantly from the source. Sites that may provide good measurementsare those on mining area boundaries, such as those monitored by Alcoa, BHPBilliton at Port Hedland etc.Such data has not been assessed for this study, however it is recommended that a list of monitoring sitesbe compiled identifying sites, particularly with PM2.5 and PM10 samplers, that meet the US FederalReference Methods.
In summary, it is concluded that there are issues that are still being resolved with regard to particle sizedistribution of the various sources, with the current AP-42 distributions, for material handing (load-in/load-out) and wind erosion, possibly over-predicting the emissions of PM10 and particularly PM2.5. Thereason for this may be the sampling methodology used to derive these measurements and the sparsity ofdata.
With regard to PM2.5, it is noted that there is a new NEPM for PM2.5 with the goal to collect data tofacilitate a review of the standard. As such, there is an expectation that the NPI should also provide PM2.5
emission data. An argument against this, aside from the uncertainty in fugitive PM2.5 emissions, is thatmuch of the PM2.5 is formed from gas to particle conversions, forming sulphate and nitrate aerosols. Thisis highlighted in Figure 12 where it is considered that up to 90% of the PM2.5 measured in rural US areasare from non-crustal sources. Therefore, if an accurate PM2.5 inventory is required, the issue of gas toparticle conversion must be addressed.

SINCLAIR KNIGHT MERZ
I:\WVES\Projects\WV02688\Deliverables\Final\R23npi_dust_review.doc PAGE 69
Figure 12 Estimated annual PM2.5 composition for the U.S. from Countess et al (2000)
Based on the above it is recommended that:
R 6.1 Fugitive particulate matter PM2.5 emissions should not be included in NPI reporting at this stage.There is a need to resolve the various issues with estimating PM2.5 from fugitive crustal sources,with the PM2.5 emission factors likely to be revised substantially in the next few years. Secondly,fugitive PM2.5 from crustal sources are a small component of overall PM2.5 emissions, based onUS work, with the majority of PM2.5 originating from gas to particle conversion or from sourcesnot covered in the current NPI reporting. Additionally, there are a number of issues in the TSPand PM10 emission estimation methods that should be resolved as a higher priority.
R 6.2 With the large amount of knowledge available on wind erosion (from wind erosion scientists) it isrecommended that their work and models be utilised to develop more realistic particle sizedistributions at emission. It is considered that particle size distributions may have some windspeed dependence, and should not be a constant factor as in the current AP-42.
RURAL (IMPROVE) ANNUAL AVERAGESSep 2001--Aug 2002
SulfateEst. AmmoniumNitrateTCMCrustal
1.71 7.33 12.95

SINCLAIR KNIGHT MERZ
I:\WVES\Projects\WV02688\Deliverables\Final\R23npi_dust_review.doc PAGE 70
7. Metal SpeciationMetal speciation of fugitive particulate matter is determined typically (Watson et al, 1998) using either:
Source dominated samples, where the samples are generally taken close to the source with themeasured particulate matter sample dominated by the source in question; or
Grab sampling and re-suspension in the laboratory. Here the samples are collected by sweeping,shovelling or vacuuming the area of interest with five to ten samples from the same source averagedto obtain a representative source profile. “This method is semi-established, or at least as establishedas the chemical and physical analyses applied to it, because procedures are widely accepted andresults are reproducible within a method, though not necessarily among methods. The mainadvantages of grab sampling and re-suspension are simplicity, reliability, and low cost”. (Watson etal, 1998)
Speciation of particulate matter is required in cases where the composition of the processed material maybe significantly different to that of the parent material. This can occur if the elemental composition of thematerial differs with particle size. For example, the majority of the large size fractions in iron ore are ironoxides, with impurities (comprising mainly silica and alumina) associated with the silt fraction. Asparticulate matter is generated from the silt fraction; particulate matter will have a higher proportion ofthe impurities and a lower fraction of iron than the bulk sample. For instance, in iron ore, the generatedparticulate matter may only have 50% Fe compared to the bulk ore with 65% Fe.
For particulate matter from wind erosion, the enrichment of nutrients and trace elements often exceeds afactor of three (Gupta et al, 1981). Raupach et al (1994) presented data for Australian soils withenrichment ratios of nitrogen and phosphorus (the ratio of the elemental composition less than 44 µm tothe composition of the bulk samples) of around two for loamy soils and up to six and 19 for a coarsesandy soil.
Another example of enrichment occurs from particulate matter generated from drying areas of bauxiteresidue. In the drying process, sodium in the residue mud migrates to the surface and forms a white layerof sodium carbonate decahydrate. The sodium carbonate surfaces are very erodible and therefore,dependent on the fractional coverage and depth of these surfaces, will affect the composition of theparticulate matter generated from the overall drying area.
7.1 Default NPI Speciation ProvidedThe NPI requires estimates of the TSP emissions in the fugitive dust. The NPI Mining Manual states that“metal emissions can be estimated as a fraction of the TSP emissions, based on available assay data.Where no assay data or site-specific information is available for metals in TSP emissions, the defaultconcentrations in Appendix D, Table B2 can be used” (NPI, 2001). These default factors are provided forvery broad classes such as basalt, granite, coal, Earth’s crust, marine clays, marine carbonates, shale,

SINCLAIR KNIGHT MERZ
I:\WVES\Projects\WV02688\Deliverables\Final\R23npi_dust_review.doc PAGE 71
limestone, sandstone and sediment. A summary of some of these classes and element concentrations areprovided in Table 7and Figure 13.
The Aggregated Emissions from Paved and Unpaved Roads EET Manual (NPI, 1999b) lists a defaultspeciation based on composite profiles for unpaved roads in the state of California (CARB, 1991).CARB has revised this speciation, with the new proposed speciation for Californian unpaved roads alsolisted in Table 7.
Table 7 Summary of metal speciation from the NPI Mining Manual and Aggregated Emissionsfrom Paved and Unpaved Roads EET Manual
Source Antimony Arsenic Beryllium Cadmium Cobalt Lead Mercury Selenium
NPI Mining ManualCoal 3.5 6.5 1 0.2 5.4 40 0.23 2.9Soil 1 6 0.3 0.35 8 35 0.06 7Earth’s Crust 0.2 1 2.6 0.11 20 14 0.05 0.05Shale 1.5 13 3 0.22 19 23 0.18 0.5Limestone 0.3 1 <1 0.028 0.1 5.7 0.16 0.03Minimum Listed 0.5 1 <1 0.028 0.1 3 0.05 <0.01Maximum Listed 3.5 13 3 0.35 74 80 0.46 7CARB (1991) andAggregated Emissionsfrom Paved and UnpavedRoads EET Manual (1999)
8 14 Not given 36 143 870 15 1
Proposed Californianunpaved roads (% PM10)
81 15 Not given 13 5 130 14 3
Note: All concentrations are of the TSP fraction except the new CARB speciation which is the concentration within PM10
A comparison between the different speciation values in Table 7 indicates:
Large changes in the new CARB speciation, with antimony increasing by 10 times from the 1991CARB speciation, upon which the Aggregated Emissions from Paved and Unpaved Roads EETManual is based. On the other hand, cobalt and lead decrease by 29 and 6.7 times respectively, withthe large decrease in lead considered to be due to the change in petrol formulation, and
Large differences between the speciation provided in the NPI Mining Manual and AggregatedEmissions from Paved and Unpaved Roads EET Manual. For example cadmium and mercury in theNPI unpaved road emissions are higher by 103 and 33 times any of the speciation provided for any ofthe material classes provided in the NPI Mining Manual.
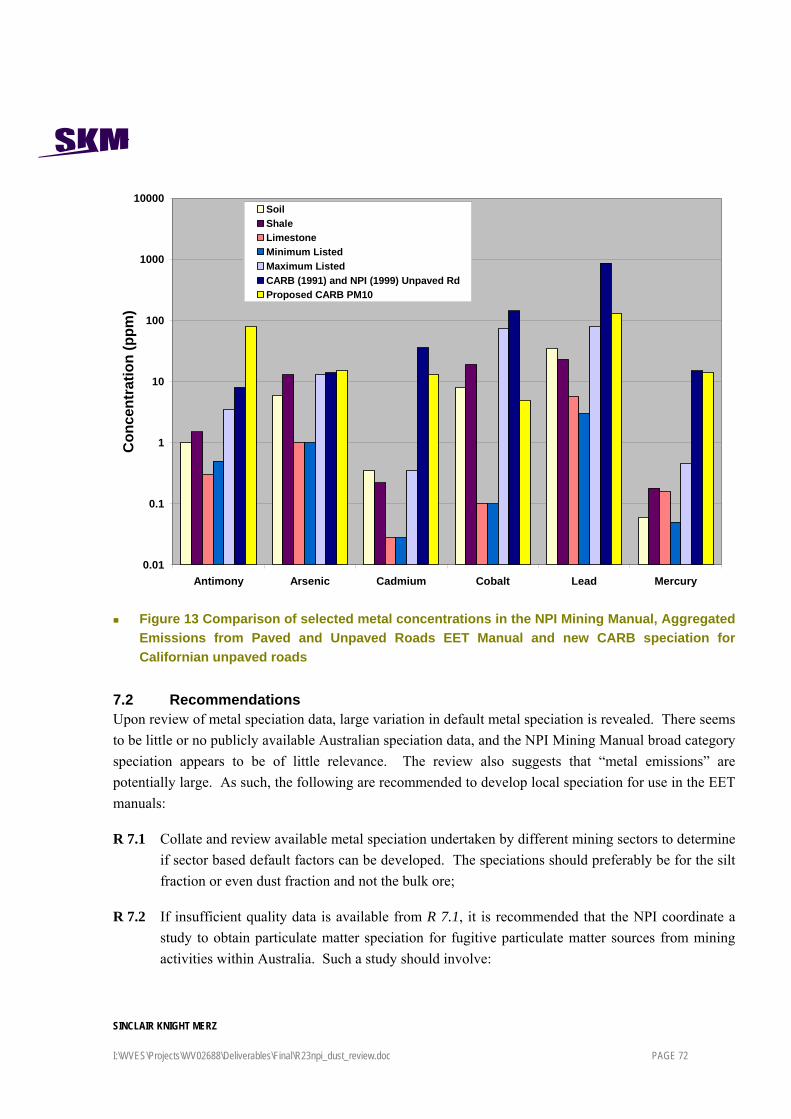
SINCLAIR KNIGHT MERZ
I:\WVES\Projects\WV02688\Deliverables\Final\R23npi_dust_review.doc PAGE 72
0.01
0.1
1
10
100
1000
10000
Antimony Arsenic Cadmium Cobalt Lead Mercury
Con
cent
ratio
n (p
pm)
SoilShaleLimestoneMinimum ListedMaximum ListedCARB (1991) and NPI (1999) Unpaved RdProposed CARB PM10
Figure 13 Comparison of selected metal concentrations in the NPI Mining Manual, AggregatedEmissions from Paved and Unpaved Roads EET Manual and new CARB speciation forCalifornian unpaved roads
7.2 RecommendationsUpon review of metal speciation data, large variation in default metal speciation is revealed. There seemsto be little or no publicly available Australian speciation data, and the NPI Mining Manual broad categoryspeciation appears to be of little relevance. The review also suggests that “metal emissions” arepotentially large. As such, the following are recommended to develop local speciation for use in the EETmanuals:
R 7.1 Collate and review available metal speciation undertaken by different mining sectors to determineif sector based default factors can be developed. The speciations should preferably be for the siltfraction or even dust fraction and not the bulk ore;
R 7.2 If insufficient quality data is available from R 7.1, it is recommended that the NPI coordinate astudy to obtain particulate matter speciation for fugitive particulate matter sources from miningactivities within Australia. Such a study should involve:

SINCLAIR KNIGHT MERZ
I:\WVES\Projects\WV02688\Deliverables\Final\R23npi_dust_review.doc PAGE 73
Coordinating particulate matter samples taken from representative mining sectors with thesamples sent to a central laboratory for analysis. It is considered that coordinating onelaboratory with the samples processed in a batch should achieve cost reductions and ensureconsistency and quality of the data;
Sampling sources from the surfaces of unpaved roads, wind erosion of stockpile areas and“tailings areas” using standard sampling techniques for roads and other areas. Unpaved andpaved road areas should be composites of a facility’s roads weighted by their contribution toparticulate matter emissions or split into areas adjacent to stockpiles and elsewhere. Thiswould provide representative road surfaces where there is deposition of ore and thereforepotential enhancement of metals derived from the ore body. It is also suggested that analysisbe conducted on the parent material to determine the potential enrichment for the metals;
Conducting the analysis in a laboratory through sieving, re-suspension of the particulatematter and then sampling with the selected particle size sampler as described by Watson et al(1998). This procedure is recommended as this method is considered easier, subject to lessinterference from other particulate matter sources and more cost effective than sampling witha high volume air sampler immediately downwind of such sources.
Sampling of mining sectors should include, but not be limited to iron ore, gold, quarrying,mineral sand and bauxite (including refineries). It is suggested that the size fraction forsampling should be PM10 to be consistent with CARB. Additionally, as this is between thePM2.5 and TSP fractions, the speciation should not be too dissimilar to either of these sizefractions; and
Analysis of the full range of metals in the NPI list, and any others recorded by standardanalytical methods as detailed in Chow and Watson (1998), with method detection limitsbelow 0.01 ppm.
R 7.3 The NPI program consider undertaking testing for public unpaved roads at the same time as thetesting in Recommendation 7.2. Such testing could involve sampling up to five representativeunpaved road surfaces in each State. In Western Australia, this could include a typical Pilbararoad, a coastal limestone-based road, a typical Wheatbelt road etc. This would significantlyimprove unpaved road metal speciation and would also provide data for comparison to miningroad speciation. It is noted that in the Bunbury airshed study (SKM, 2003) unpaved/paved roadswere estimated to contribute 85% of the PM10 emissions and over 73% of the emission for the 11metals provided with default speciations.

SINCLAIR KNIGHT MERZ
I:\WVES\Projects\WV02688\Deliverables\Final\R23npi_dust_review.doc PAGE 74
8. Prioritising Particulate Matter IssuesThis section provides a ranking of the fugitive particulate matter (PM2.5, PM10, TSP) and metal and metalcompound EETs in terms of priority for additional work to improve their accuracy.
Though the prioritising was requested in terms of accuracy only, the prioritising in this study has alsoincluded the size of the source as a criterion. As such, the ranking has been conducted based on the sizeof the emissions, EF accuracy and control factor accuracy. This approach differs to that typically used inthe US where prioritising is often undertaken in terms of the emission impacts on the community or to itscontribution to causing non-compliance to their National Air Quality Standards. For this study, noconsideration to the relative impact on the environment or public health and welfare is given, though themagnitude of the emissions will to some degree be related to offsite impacts.
The emissions have been ranked in Table 8 to give the perceived accuracy of the current EETs and themagnitude of the sources. This follows the approach used in California as presented in Gaffney (2004)where the sources were prioritised by primary source magnitude, emission factor quality, activity andsecondary scores of speciation data, spatial data and monthly variation quality (all with a weighting of 1/3of the primary categories).
Table 8 Prioritising NPI EETs
Source SourceMagnitude
EFAccuracy
DefaultEF
Accuracy
ControlFactor
Accuracy
ActivityData
MetalSpeciation
Total of SourceMagnitude andEF Accuracy
Blasting 3 5 N/A N/A 2 3 8
Crushing and Screening 3 4 4 3 2 3 7
Unpaved Roads 4 4 5 4 2 4 8
Wind Erosion 5 5 5 4 3 4 10
Material Handling 4 4 4 3 3 3 8
Average All Sources 3.8 4.4 4.5 3.4 2.4 3.4 8.2
Scale 5 = mostimportant
5 = v lowaccuracy
5 = v lowaccuracy
5 = v lowaccuracy
1= accurate
5 = vhard toquantify
5 lowaccuracy or
data
Notes: the values are for the current NPI Mining Manual
The scores in Table 8 were based on:
Source Magnitude: This was estimated from a survey of several of the NPI reporters in WesternAustralia who specified the relative contributions to their NPI estimates as presented in Figure 14.This indicates that wind erosion and material handling operations were major sources, followed byunpaved roads and then blasting. Unpaved roads have been given a weighting of 4 given thatUSEPA (1998) found that haul road emissions were the largest source from western surface coalmines and, as such, were targeted by the USEPA in the nineties for revision of the emission factors(page 11-9-8, USEPA, 1998).

SINCLAIR KNIGHT MERZ
I:\WVES\Projects\WV02688\Deliverables\Final\R23npi_dust_review.doc PAGE 75
Emission Factor Accuracy: The ranking of the emission factor accuracy is based on the findings inthis report, which consider blasting and wind erosion to be very approximate, though all factors areconsidered to have a significant degree of uncertainty.
Default Emission Factor Accuracy: Unpaved road and wind erosion are considered to have very lowaccuracy as they are based on very site-specific data, but have been recommended as defaults for allmines and climates within Australia.
Control Factor Accuracy: The control factor accuracy (as noted in Section 5.1.6) is very dated, withvery approximate control factors given for control by water cannon of wind erosion and for controlsfor road particulate matter suppression with no account for hyper-saline water control.
Activity Data (how often a process occurs). For most activities, this data is considered reasonablywell known or estimated. However, classifying areas that may be eroded by wind erosion isconsidered to be very subjective, with the interpretation of control factors also uncertain to a degree.
Metal Speciation: Metal speciation is considered to be potentially inaccurate due to the largevariations that can occur on a mine site. In addition, road particulate matter could be a mixture of oreand background soil type and the speciation of the particulate matter can be quite different to the bulkore or overburden.
The results of the ranking (based on size of the emissions, emission factor accuracy and control factoraccuracy), indicates that wind erosion factors, followed by unpaved roads, blasting and material handlingare the areas which require greatest attention.
8.1 Comparison to Survey RespondentsThe survey undertaken as part of this project (SKM, 2004b) was intended to provide an indication of theissues in terms of the methodologies used. It was not intended to rank the sources. In terms of the overallmethods, the survey indicated that, in decreasing order of importance, the most significant issues for therespondents were:
Accuracy of the reported emissions (average of 4.2 out of 5);
Accuracy of default emissions and/or parameters (average of 4);
Followed, with an average of 3.9, by:
- Wind erosion particulate matter estimates;
- The fact that the methods do not account for differences between source emissions andparticulate matter that crosses the boundary; and
- The accuracy of the control factors.
The survey, though not set in the same terms, indicates general agreement with the issues, with winderosion highlighted in the survey as the only specific source.

SINCLAIR KNIGHT MERZ
I:\WVES\Projects\WV02688\Deliverables\Final\R23npi_dust_review.doc PAGE 76
0
10
20
30
40
50
60
70
80
90
100
Perc
enta
ge o
f Tot
al (%
)
P1 P2 M1 M2 M3 P4 M4
Drilling & Blasting
Wheel Generated Dust
MaterialHandling/Processing
Wind Erosion
P - ProcessingM - Mine
Figure 14 Percentage of fugitive particulate matter emissions by various categories for Minesand Mining and Processing facilities such as refineries

SINCLAIR KNIGHT MERZ
I:\WVES\Projects\WV02688\Deliverables\Final\R23npi_dust_review.doc PAGE 77
9. Conclusion and Recommendations
9.1 General CommentsIt is considered that particulate matter emission sections included in the NPI Mining Manual and thecurrent draft of the NPI Fugitive Emissions Manual are generally not well written or documented, withmany of the emission factors in need of revision.
Therefore, it is recommended that:
1) As a priority, the draft NPI Fugitive Emissions Manual should be rewritten to incorporate thechanges recommended in this report. This will involve incorporating the newer AP-42 equations andcan be undertaken relatively quickly;
2) Individual default factors should be removed where possible with only the emission equationsupplied, or the equation and a range of defaults. This is necessary because individual defaults onoccasions may not be representative of the range of conditions that can occur within the miningindustry. Examples of this are for unpaved roads and wind erosion emissions.
3) A number of actions and studies be undertaken to obtain/collate data to improve the factors for theAustralian situation. It is recommended that, if funding permits, these studies be conducted with anyresultant improvements to estimation techniques being added to future versions of relevant EETManuals.
It is considered that the general poor state of the current NPI Mining Manual is due the lack of availablefunding and the lack of peer review before its release. It is suggested that to assist this process, industryshould have a much greater role in the work and funding of the mining EETs. An example of successfulindustry involvement is the role of the Electricity Supply Association of Australia in updating the EETManual Fossil Fuel Electric Power Generation (version 2.3) and the mineral sand industry’s involvementwith the Minerals Sands Mining and Processing EET Manual (version 1.0). To assist in any review, it isrecommended that revisions to Manuals should involve at least an independent review, possibly includingan international expert in the area.
With regards to the update it is noted that there appears to be some work in the U.S. to improve many ofthe factors. A recent survey by the U.S. on AP-42 concluded that:
“Existing emission factors should be updated and more factors are needed where gaps currently exist. Inmany cases, the new factors requested were related to more speciation (particle size for PM, specificchemicals for air toxics and VOCs). Attention also needs to be given to the development of regionalfactors and factors for unique events and circumstances.” USEPA (2004a).
In the western States of the US, the WRAP is developing a wind erosion methodology for the regionalscale and has commissioned a contract to develop a fugitive particulate matter handbook and website.
SINCLAIR KNIGHT MERZ
I:\WVES\Projects\WV02688\Deliverables\Final\R23npi_dust_review.doc PAGE 78
This will be a compilation of emission estimation methods and control techniques on paved roads,unpaved roads, materials handling, wind erosion from material storage piles, construction and demolition,open area wind erosion, agricultural tilling and agricultural wind erosion, and is due for release in early2005. As such, it is expected that there will be some revisions or new methods available for somecategories in the near future.
9.2 Specific RecommendationsThe following sections provide a summary of specific recommendations.
Vehicle Emissions - Unpaved RoadsR5.1 Incorporate the recent December 2003 USEPA AP-42 unpaved road equations into the NPI
Fugitive Emissions Manual. It is noted that the draft version of the NPI Fugitive EmissionsManual has a number of errors that require correction, such as deletion of the soil moisture table.
R 5.2 Single default emission factors should not be provided as there can be large variations betweenthe vehicle fleets and road characteristics at different sites. If defaults are to be provided theyshould be given for the various combinations of typical vehicle fleets (for example vehicle usageon haul roads at a mine site and a typical light vehicle fleet) and for typical uncontrolled andcontrolled roads. To assist companies in estimating the appropriate emission factor for their site,it is recommended that the NPI Fugitive Emissions Manual include a compilation of typical siltcontents, as well as moisture contents for various Australian industry groups, as per the USEPAguides.
R 5.3 Update the unpaved road control factor with separate methods for:
Fresh water, using either:
- The equation of Cowherd et al (1988). This will require mines to estimate the numberof vehicle passes and watering rates on the various roads. Estimates of the hourlyevaporation rate could be undertaken using annual evaporation estimates andconverting these to a maximum hourly value using a multiplier as in Cowherd et al(1988); or
- The current USEPA approach where moisture contents for the road in a controlled anduncontrolled state under typical traffic conditions are measured.
Use of organic chemical suppressants, using for example the US AP-42 methodology; and
Use of salts including the use of hyper-saline water. It is considered that test work,estimated at $20,000, is required to develop appropriate control factors.
R 5.4 Though not strictly applicable to the NPI Mining Manual, it is considered that the AggregatedEmissions from Paved and Unpaved Roads EET Manual should be updated to include the new

SINCLAIR KNIGHT MERZ
I:\WVES\Projects\WV02688\Deliverables\Final\R23npi_dust_review.doc PAGE 79
AP-42 equations, including a default moisture content of 1% (following the US NEI) and typicalAustralian data for road silt contents. This may involve a desktop study or in-field sampling.
Wind ErosionR 5.5 The current default factor should be deleted. It is considered that emission estimates can be
readily obtained with the current NPI equation and this should be used to take into accountclimate variations across Australia. This will result in some areas having emission factors that aretwice as high as the current default with some areas having considerably lower emissions;
R 5.6 Though the current NPI equation is considered indicative only, there appears to be no readyreplacement, with the existing AP-42 equation considered to be based on little data for non-coalmines and difficult to implement (e.g. estimation of threshold friction velocities). Therefore it isrecommended that:
The current NPI equation should be retained in the interim.
The NPI coordinate with the US groups (USEPA and WRAPAIR) to determine and progresstoward a new equation with more supporting studies for this.
The NPI liaise with the wind erosion community within Australia to see if a more suitableequation or simple model for mines could be developed. Such work may includeundertaking a single case study to verify the methodology or the development of portablewind tunnel methodology to determine relative erodibility potential of materials.
R 5.7 The NPI develops or commissions estimates for all fugitive particulate matter sources withinAustralia, such that the mining fugitive emissions can be placed in context, as is provided in theUS NEI. At present in most regions of Australia, fugitive particulate matter from mining ispresented as the only large source, with other larger sources of PM10 and “metals” such as fromwind erosion of non mine areas, from agricultural activities and bush fires omitted. For winderosion estimates it is recommended that the NPI liaise with those in the Australian Air QualityForecasting System (AAQFS) who are currently evaluating a system that predicts PM10 winderosion emissions and the resultant PM10 concentrations for Australia. Alternatively, a systemusing the CARB approach as used in the Pilbara and Bunbury airsheds (SKM, 2003 and SKM,2003b) and recently undertaken for Victoria (Ng, 2004) could be used. The use of a nationalapproach would also have the advantage of providing consistency across Australia. Other sourcesof particulate matter from agricultural practices and fires could also be coordinated at a nationalor at least state level. PM10 estimates from fires could be obtained in conjunction with thenational greenhouse gas emission estimates as they both require fuel loading and the area burned.The development of estimates for all fugitive particulate matter sources within Australia has thepotential to cost around $100,000.

SINCLAIR KNIGHT MERZ
I:\WVES\Projects\WV02688\Deliverables\Final\R23npi_dust_review.doc PAGE 80
R 5.8 Alternative methods, such as using validated particulate matter dispersion models, should behighlighted as an acceptable alternative to the AP-42 equation. Such a method can consist ofwell-sited ambient monitors that are free from confounding sources, along with the use of back-calculation techniques involving dispersion models. It is recommended that all such studies havean independent technical review to ensure that the estimates are acceptable. This method wouldinitially require a statement in the manual indicating that is an acceptable option, though requiringagreement on a case by case basis with the relevant State NPI department.
R 5.9 Wind erosion control factors need to be improved to provide more detail on how to classifysurface types. A possible method may be to supply photographic examples of bare areas as perthe method used in RWEQ. This is recommended as greater than a factor of two variation canoccur due to the subjective interpretation involved in classifying the amount of erodible area andthe relevant control factors for a particular site.
R 5.10 A wider range of control factors is needed for water cannon control to give credit to facilities withwell designed and maintained systems. To undertake this, a review of water cannon control isrecommended as a first step. The authors are aware of one study currently underway to determinecontrol factors for water cannon.
Material HandlingR 5.11 For loading/unloading trucks it is recommended that, as a first step, an in-depth review of the
derivation of the USEPA AP-42 load-in/load-out emission equation is required to resolve theapparent large underestimation in emissions when using this equation, compared to that measuredat Australian mines.
R 5.12 For transfers, reclaimers and stackers, it is recommended that, as per loading/unloading trucks areview of the derivation of the USEPA load-in/load-out equations be undertaken to resolve theapparent underestimation of emissions. As an interim measure it is recommended that thedefaults be retained but usage of the equation be dissuaded.
R 5.13 When considering the moisture content of ores, as a second higher level of complexity to usingthe default 4% cut off between high and low moisture content ores, mines should be encouragedto use the rotating drum test to classify the dustiness of the ore as either high or low moisture. Ingeneral, the available data supports the default 4% cut off but the limited test work presented inthis report indicates that thresholds may vary between at least 3 to 5.5%.
R 5.14 As a low priority task, it is recommended that dustiness tests be used to account for the dustinessof the ores as a function of moisture. It is considered that this captures the true dustiness of theore rather than trying to fit a simple universal moisture and silt particulate matter relationship tothe ore as is used for moisture in the current and both moisture and silt in the older AP-42material handling equations.

SINCLAIR KNIGHT MERZ
I:\WVES\Projects\WV02688\Deliverables\Final\R23npi_dust_review.doc PAGE 81
R 5.15 For crushing emissions, the new AP-42 stone crushing and quarrying factors be included as thedefaults for the stone crushing and quarrying industry.
R 5.16 For screening emissions, the emission factors should be updated with those in the new AP-42crushed stone processing and pulverised minerals guide. For primary, secondary and tertiaryscreening at stone processing and quarrying operations the AP-42 “screening” factors areapplicable, whilst for iron ore re-screening the “fines screening” factor is considered applicable.
BlastingR 5.17 Though there is little support for the application of the current AP-42 blasting equation, and
despite it being dropped from AP-42 Crushed Stone Processing and Pulverized MineralProcessing guide, it is recommended that:
The new AP-42 equation be retained in the interim;
NPI liaise with the USEPA to investigate further work planned to improve this factor; and
NPI investigate the feasibility of conducting Australian testing using aircraft to profile theparticulate matter plume to derive estimates. Such methods have been used for otheraerosols such as smoke plumes from fires and industrial sources using the FlindersUniversity aircraft and CSIRO.
Issue of Particulate RemovalR 5.18 It is recommended that the NPI review the issue of particulate removal, noting that depletion for
pit retention is incorporated but other removal mechanisms, such as vegetation belts, are not. Inthe case of mines, it is considered that the pit retentions are very indicative and that guidanceshould be provided so mines can develop site-specific factors using a model such as ISC3.
Particulate Size IssuesR 6.1 Fugitive particulate matter PM2.5 emissions should not be included in NPI reporting at this stage.
There is a need to resolve the various issues with estimating PM2.5 from fugitive crustal sources,with the PM2.5 emission factors likely to be revised substantially in the next few years. Secondly,fugitive PM2.5 from crustal sources are a small component of overall PM2.5 emissions, based onUS work, with the majority of PM2.5 originating from gas to particle conversion or from sourcesnot covered in the current NPI reporting. Additionally, there are a number of issues in the TSPand PM10 emission estimation methods that should be resolved as a higher priority.
R 6.2 With the large amount of knowledge available on wind erosion (from wind erosion scientists) it isrecommended that their work and models be utilised to develop more realistic particle sizedistributions at emission. It is considered that particle size distributions may have some windspeed dependence, and should not be a constant factor as in the current AP-42.

SINCLAIR KNIGHT MERZ
I:\WVES\Projects\WV02688\Deliverables\Final\R23npi_dust_review.doc PAGE 82
Metal SpeciationR 7.1 Collate and review available metal speciation undertaken by different mining sectors to determine
if sector based default factors can be developed. The speciations should preferably be for the siltfraction or even dust fraction and not the bulk ore;
R 7.2 If insufficient quality data is available from R 7.1, it is recommended that the NPI coordinate astudy to obtain particulate matter speciation for fugitive particulate matter sources from miningactivities within Australia. Such a study should involve:
Coordinating particulate matter samples taken from representative mining sectors with thesamples sent to a central laboratory for analysis. It is considered that coordinating onelaboratory with the samples processed in a batch should achieve cost reductions and ensureconsistency and quality of the data;
Sampling sources from the surfaces of unpaved roads, wind erosion of stockpile areas and“tailings areas” using standard sampling techniques for roads and other areas. Unpaved andpaved road areas should be composites of a facility’s roads weighted by their contribution toparticulate matter emissions or split into areas adjacent to stockpiles and elsewhere. Thiswould provide representative road surfaces where there is deposition of ore and thereforepotential enhancement of metals derived from the ore body. It is also suggested that analysisbe conducted on the parent material to determine the potential enrichment for the metals;
Conducting the analysis in a laboratory through sieving, re-suspension of the particulatematter and then sampling with the selected particle size sampler as described by Watson et al(1998). This procedure is recommended as this method is considered easier, subject to lessinterference from other particulate matter sources and more cost effective than sampling witha high volume air sampler immediately downwind of such sources.
Sampling of mining sectors should include, but not be limited to iron ore, gold, quarrying,mineral sand and bauxite (including refineries). It is suggested that the size fraction forsampling should be PM10 to be consistent with CARB. Additionally, as this is between thePM2.5 and TSP fractions, the speciation should not be too dissimilar to either of these sizefractions; and
Analysis of the full range of metals in the NPI list, and any others recorded by standardanalytical methods as detailed in Chow and Watson (1998), with method detection limitsbelow 0.01 ppm.
R 7.3 The NPI program consider undertaking testing for public unpaved roads at the same time as thetesting in Recommendation 7.2. Such testing could involve sampling up to five representativeunpaved road surfaces in each State. In Western Australia, this could include a typical Pilbararoad, a coastal limestone-based road, a typical Wheatbelt road etc. This would significantlyimprove unpaved road metal speciation and would also provide data for comparison to mining

SINCLAIR KNIGHT MERZ
I:\WVES\Projects\WV02688\Deliverables\Final\R23npi_dust_review.doc PAGE 83
road speciation. It is noted that in the Bunbury airshed study (SKM, 2003) unpaved/paved roadswere estimated to contribute 85% of the PM10 emissions and over 73% of the emission for the 11metals provided with default speciations.

SINCLAIR KNIGHT MERZ
I:\WVES\Projects\WV02688\Deliverables\Final\R23npi_dust_review.doc PAGE 84
10. GlossaryAAQFS Australian Air Quality Forecasting System
Aerodynamic diameter The diameter of a sphere of density 1g/cm3 that has the sameaerodynamic properties as the particle being considered
AP-42 USEPA’s emission factor publications, available on the internet athttp://www.epa.gov/ttn/chief/ap42/
ANZSIC Australia New Zealand Standard Industry Classification
AUSPLUME Gaussian Plume dispersion model developed in Australia by theVictorian EPA
CAAQES Centre for Agricultural and Air Quality Engineering and Science(Texas A & M University)
CARB California Air Resources Board
CSIRO Commonwealth Scientific and Industrial Research Organisation
Criteria pollutants A group of six common air pollutants that are regulated under theUS Clean Air Act. They include ozone, lead, nitrogen oxide, sulfurdioxide, carbon monoxide, and particulate matter.
de minimus amount An amount that is so minor that it can disregarded. This in someregulations is defined as a fixed quantity.
DoE Western Australian Department of Environment
EET Emissions Estimation Technique (coordinated by EnvironmentAustralia)
EF Emission Factor
EPA Environmental Protection Authority
EPHC Environmental Protection and Heritage Council
EPRCA Emergency Planning and the Community Right-to-Know Act
Fetch Length An area of the surface over which a wind with a constant directionand speed is blowing
Fugitive Particulate Matter Solid airborne particulate matter emissions, which cannot bereasonably collected and are passed through a stack, chimney, ventor equivalent opening. These include sources such as winderosion, wheel generated dust, road repairs, blasting, storage or

SINCLAIR KNIGHT MERZ
I:\WVES\Projects\WV02688\Deliverables\Final\R23npi_dust_review.doc PAGE 85
transportation of particulate matter, sandblasting, tilling andfeedlots.
HAP Hazardous Air Pollutants. These are pollutants defined in theUnited States Clean Air Act that are not covered by ambient airquality standards but may present a threat of adverse impact tohuman health and the environment
ISC3 Industrial Source Complex Model. The United States Gaussianplume model
IWEMS Integrated Wind Erosion Modelling System
MMD Mass mean diameter
MOE Ontario Ministry of Environment
MPO Manufactured, processed or otherwise used
MRI Midwest Research Institute
NAPAP National Acid Precipitation Assessment Program, USA
NEI National Emissions Inventory. Prepared by the USEPA
NEPM National Environmental Protection Measure
NERDDC National Energy Research Development and DemonstrationCouncil
NOx Nitrogen oxides
NPI National Pollutant Inventory. Australia's public database ofpollutant emissions
NPRI Canada’s National Pollutant Release Inventory
NSW New South Wales
NSWMC New South Wales Mining Council
NTI National Toxics Inventory
OHSA Occupational Health and Safety Act
PBT Persistent, bio-accumulative and toxic chemicals
PM Particulate Matter
PMx Particulate Matter with a diameter of less than x µm

SINCLAIR KNIGHT MERZ
I:\WVES\Projects\WV02688\Deliverables\Final\R23npi_dust_review.doc PAGE 86
Quality Rating The US EPA quality rating system for emission factors. Thisrating system varies from; A: excellent; B: above average; C:average; D: below average; and E: poor.
RWEQ Revised Wind Erosion Equation. From Fryrear et al. (1998)
SKM Sinclair Knight Merz
SPCC State Pollution Control Commission
TPM Total Particulate Matter
TRI The USA’s Toxics Release Inventory
TSP Total Suspended Particulate. Includes particles less than 50micrometers in diameter
USEPA United States Environmental Protection Agency
US NEI United States National Emissions Inventory
US TRI United States’ Toxic Release Inventory
VOC Volatile organic compound
VKT Vehicle Kilometres Travelled
VMT Vehicle Miles Travelled
WA Western Australia
WA DEP Western Australian Department of Environmental Protection
WEPS Wind Erosion Prediction System. Developed by Hagen et al (1995)
WEQ Wind Erosion Equation. Developed by Woodruff andSiddoway (1965)
WRAP Western Regional Air Partnership (Collaborative effort of tribalgovernments, state governments and various federal agencies to inthe western half of the United States).

SINCLAIR KNIGHT MERZ
I:\WVES\Projects\WV02688\Deliverables\Final\R23npi_dust_review.doc PAGE 87
Table of NomenclatureA area of blast (m2)
C As used in Equation 5.9: emission factor for 1980s vehicle fleet exhaust, brake wear andtyre wear (kg/VKT)
C As used in Equation 5.11: average control efficiency percent (%)
D blast depth (m)
d average hourly traffic rate (hr-1)
f percentage of time the unobstructed wind at the mean pile height exceeds 5.4 m/s
i application intensity (L/m2)
k As used in equation 5.14: constant
k As used in all other equations: aerodynamic particle size multiplier.
L silt loading (g/m2)
M material moisture content (%)
Mdry surface moisture under dry worst case conditions (%)
p number of days with >= 0.25mm (0.01 in) precipitation
P potential average daytime evaporation rate (mm/hr)
s silt content of the road (%)
S average vehicle speed (km/hr)
t time between applications
u∗ friction velocity (m/s), and
u∗t threshold friction velocity (m/s)
U mean wind speed
w number of wheels
W mean vehicle weight (tonnes)
WS wind speed (m/s)
WSo threshold for particulate matter lift off (m/s)
Y dumping device capacity (m3)

SINCLAIR KNIGHT MERZ
I:\WVES\Projects\WV02688\Deliverables\Final\R23npi_dust_review.doc PAGE 88
11. ReferencesAir Noise Environment, 2003. Improving Particulate Emissions Estimation.. Prepared for AustralianAssociation Research Programme, April 2003.
Alfaro, S, C, Gomes, L. 2001. Modelling mineral aerosol production by wind erosion: Emissionintensities and aerosol size distribution in source areas. J. Geophysical Res, 106, D16, 18,075-18,084.
Axetell K. 1978. Survey of Fugitive Dust from Coal mines. EPA-908/1/-78-003, U.S. EnvironmentalProtection Agency, Denver, CO, February 1978.
Axetell, C. and Cowherd, C 1981. Improved emission factors for fugitive dust from western surface coalmining sources. 2 Volumes, EPA contract N0. 68-03-2924, PEDCo Environmental, Inc., Kansas City,MO, July 1981.
Australian Standard 2000. Coal Preparation. Part C: Determination of dust/moisture relationship forcoal. AS4156.6-2000.
Barnard, W.R. and Stewart, M.A. 1992. Improved fugitive dust PM10 emissions estimates for trends.Proceedings, Emission Inventory Issues in the 1990s. Air & Waste Management Association, Pittsburgh,PA, pp. 673-684.
Buonicore, A. J. and Davis, W. T. 1992. Air Pollution Engineering Manual. Air & Waste ManagementAssociation (US), Van Nostrand Reinhold, New York.
Californian Air Resources Board (CARB). 1997. Section 7.11 Supplemental Documentation forWindblown dust - Agricultural Lands. April 1977. California Environmental Protection Agency AirResources Board.
Californian Air Resources Board (CARB) 1991. Identification of Particulate Matter Species Profile.CARB Speciation Manual, 2nd ed, Vol 1, Californian Air Resources Board, California, USA.
California Air Resources Board (CARB). 2004. Unpaved road dust speciation from spreadsheetpavenuroaddust.xls from http://www.arb.ca.gov/ei/speciate/pavedunroaddust.xls
Carras, J, N. Riley, K.W, Zegellin, S.J. and Barret, G.J. 1999. Use of a portable micro-wind tunnel tomeasure the dust yield potential from mineral tailings and other surfaces. 1999 Minerals Council ofAustralia Workshop.
Chow, J and Watson, J. 1998. Guideline on Speciated Particulate Monitoring. Desert Research Instituteprepared for Office of Air Quality Planning and Standards. U.S. Environmental Protection Agency.Research Triangle Park, NC 27711.

SINCLAIR KNIGHT MERZ
I:\WVES\Projects\WV02688\Deliverables\Final\R23npi_dust_review.doc PAGE 89
Coffey, P. and Evans, N. 2000. Estimation of fugitive PM10 dust emissions from exposed tailings bymonitoring & modelling. In Conference Proceedings of the 15th International Clean Air & EnvironmentConference. Sydney Australia, 26-30 November 2000.
Coffey. 1999. Department of Environmental Protection. National Pollutant Inventory Kalgoorlie MiningTrial Aggregated Emissions Study. Report prepared for the Department of Environmental Protection,Perth.
Countess, R, J. 2001. Development of a PM2.5 Emissions Inventory for the South Coast Air Basin. J. Air& Waste Manage. Assoc. 49, 125-132.
Countess, R.W. Barbard C, Claiborn, C. Gillette, D. Latimer, D. Pace, T. Watson, J. 2001. Methodologyfor estimating windblown and mechanically resuspended road dust emissions applicable for regionalscale air quality modelling. Final Report prepared for Western Governor’s Association, Electronicallypublished at http://www.wrapair.org/reports/Fugitive Dust Final.doc. April 2001
Countess, R.W. Barbard C, Claiborn, C. Gillette, D. Pace, T. Vimont, J. and Watson, J. 2002. A reviewand update of fugitive dust emission estimation methods. Final Report prepared for Western Governor’sAssociation, Electronically published athttp://www.wrapair.org/reports/Dust%20Expert%20Panel%20Follow-Up-Report.pdf. November 2002
Cowherd, C., Jr. Axetell, K. Guenther, M. and Jutze, G.A. 1974. Development of emission factors forfugitive dust sources. Midwest Research Institute, Kansas City, Mo. Prepared for the EnvironmentalProtection Agency, Research Triangle Park, N.C. under Contract No 68-02-0619. Publication No.EPA-450/3-74-037. June 1974.
Cowherd, C.Jr. 1983. A new approach to estimating wind generated emissions from coal storage piles.Presented at the APCA specialty conference on Fugitive dust Issues in the Coal Use Cycle, Pittsburg, PA,April 1983.
Cowherd, C. 1986. Memorandum from Chatten Cowherd, MRI, to James Southerland, EPA, June 1986.as presented in Appendix E of MRI (1998). Revision of Emission Factors for AP-42 Section 11.9.Western Surface Coal Mining. Revised Final Report for U.S. Environmental Protection Agency. EPAContract 68-D2-0159. September 1998.
Cowherd, C, Muleski G,E and Kinsey, J.S. 1998. Control of open fugitive dust sources. EPA-450/3-88-008. U.S. Environmental Protection Agency, Research Triangle Park, NC, September 1988.
ENVIRON, 2004. Final Report. Determining Fugitive Dust Emissions from Wind Erosion, prepared forWestern Governor’s Association.

SINCLAIR KNIGHT MERZ
I:\WVES\Projects\WV02688\Deliverables\Final\R23npi_dust_review.doc PAGE 90
Environment Canada (EC), 2002. Guide for reporting to the National Pollutant Inventory. 2002.Available at http://www.ec.gc.ca/pdb/npri/npri_home_e.cfm
Etyemezian, V, Gillies, J, Kuhns, H, Nikoloic D, Watson, J, Veranth, J, Laban, R, Seshadri, G andGillete, D. 2003. Field Testing and evaluation of dust deposition and removal mechanisms: Final Report.DRI Final Report prepared for the WESTAR council 1/1/03.
Fryrear, D.W., Bilbro, J.D., Saleh, A., Schomberg, H., Stout, J., and Zobeck, T.M. (1998). RWEQ:Improved with erosion technology. J. Soil Water Conserv. 55, 183-189.
Gillette, D.A. and Passi, R. 1988. Modeling dust emission caused by wind erosion. J. Geophys.Res. 93, 14233-14242.
Gupta, J.P, Aggarwal, R.K. and Rajkhy, N.P. 1981. Soil erosion by wind from bare sandy plains inwestern Rajasthan, India. J. Arid. Env. 4, 15-20.
Hagen, L. 1995. USDA wind erosion predictions system: Technical description: Introduction.Proceedings, WEPP/WEPS Symposium, Des Moines, IA.
Holmes, N. 2004. Personnel communication with Nigel Holmes of Holmes Air Sciences, Sydney.
Holmes Air Sciences. 1998. Review of Load Based Licensing Requirements and Exploration ofAlternative Approaches. Report to the Minerals' Council of NSW, April 1998.
Lee, S. Cope, M. and Hess, D. 2003. Forecasting wind-blown dust events with the Australian Air QualityForecasting System. In National Clean Air Conference, Newcastle, Australia, 23-27 November.
Lee, S. Cope, M. Hess, D. and Burgers, M. 2004. Forecasting wind blown dust events with the AustralianAir Quality Forecasting System (AAQFS). Wind-blown Dust Workshop - The emission, transport andimpacts of wind-blown dust from soil erosion: modelling and observation 8-10 November 2004 at CSIRODivision of Atmospheric Research, Aspendale, Victoria, Australia.
Leys, J.F. Larney, F.J. Müller, J.F. Raupach, M.R., McTainsh, G.H. and Lynch, A.W. 1998.Anthropogenic dust and endosulfan emissions on a cotton farm in northern New South Wales, Australia.The Science of the Total Environment, 220, 55-70.
Leys, J,F, Strong C, McTainsh, G, H. Heidenreich, S, Pitts, O, and French, P. 2002. Relative DustEmission Estimated from a mini-wind tunnel. In Lee J,A, and Zobeck T,NM, 2002. Proceedings ofICAR5/GCTE-SEN Joint Conference, International Centre for Arid and Semiarid Lands Studies, TexasTech University, Lubbock, Texas, USA, p117-121.
Lu, M. 1997. Dustiness of coal shipped in China. Bulk Solids Handling, vol 17, No. 4, 541-547.

SINCLAIR KNIGHT MERZ
I:\WVES\Projects\WV02688\Deliverables\Final\R23npi_dust_review.doc PAGE 91
Lu, H. and Shao, Y. 2001. Toward quantitative prediction of dust storms: an integrated wind erosionmodelling system and its applications. Env. Modelling & Software, 16, 233-249.
Krayer, W.R, and Marshall, R.D. 1992. Gust factors applied to Hurricane Winds. Bulletin AmericanMeteorological Society, 73, 613-617.
MacDougall, C. R. and Uhl. M.F. 2002. Empirical method for determining Fugitive dust emissions fromwind erosion of vacant land: “The MacDougall Method”. Clark County Department of air QualityManagement.
MacDougall, B. 2004. Personnel communication with Bryn MacDougall of Western MiningCorporation, Belmont., Perth.
Mining Association of Canada (MAC), 2004. Mining Association of Canada Guide for Completing the2003 National Pollutant Release Inventory (NPRI). Available athttp://www.mining.ca/english/publications/index.html
Midwest Research Institute (MRI), 1998. Emission factor documentation for AP-42. Section 13.2.2.Unpaved Roads. Final Report. Report prepared for U.S. Environmental Protection Agency.September 1998.
National Energy Research Development and Demonstration Council (NERDDC), 1988, Air Pollutionfrom Surface Coal Mining: Volume 2 Emission Factors and Model Refinement, Prepared by Dames &Moore 1988 for NERDDC, NERDDC Project Number 921.
National Pollutant Inventory (NPI). 1999a. Emission Estimation Technique Manual for Mining,Version 1.0, (March 1999). (part of the Mining Handbook)
National Pollutant Inventory (NPI). 1999b. Emission Estimation Technique Manual for AggregatedEmissions from Paved and Unpaved Roads (September 1999). Available by download from the NPIwebsite at: http://www.npi.gov.au/handbooks/aedmanuals/pavedunpaved_ff.html
National Pollutant Inventory (NPI). 1999c. Emission Estimation Technique Manual for FugitiveEmissions (December 1999). Available by download from the NPI website at:http://www.npi.gov.au/handbooks/approved_handbooks/pubs/ffugitive.pdf
National Pollutant Inventory (NPI). 2000. Emission Estimation Technique Manual for Mining,Version 2.0, (part of the Mining Handbook)
National Pollutant Inventory (NPI). 2001. Emission Estimation Technique Manual for Mining,Version 2.3, (5 December 2001) (part of the Mining Handbook). Available by download from the NPIwebsite at: http://www.npi.gov.au/handbooks/approved_handbooks/pubs/mining.pdf

SINCLAIR KNIGHT MERZ
I:\WVES\Projects\WV02688\Deliverables\Final\R23npi_dust_review.doc PAGE 92
National Pollutant Inventory (NPI). 2002. Emission Estimation Technique Manual for Fugitive Emissions(September 2002). Draft in preparation.
NSW Minerals Council. 2000. Particulate Matter and Mining. A NSW Minerals Council TechnicalPaper. Interim Report. 19 July 2000.
Ng, Y.L., 2004. Estimating annual average windblown dust emissions from agricultural lands andunpaved roads . Wind-blown Dust Workshop - the emission, transport and impacts of wind-blown dustfrom soil erosion: modelling and observation 8-10 November 2004 at Division of CSIRO AtmosphericResearch, Aspendale, Victoria, Australia.
Pace, T. G. 2004. Emission Inventory Training Course. Session VII. Reconciling Fugitive Dust.Emissions with Ambient Data. USEPA. Denver, CO March, 2004. Available athttp://www.westar.org/downloads.html
Pitts O. 2000. Fugitive PM10 Emission Factors. In Conference Proceedings of the 15th International CleanAir & Environmental Conference. Sydney Australia, 26-30 November 2000.
Queensland EPA (2005).http://www.epa.qld.gov.au/environmental_management/air/air_quality_monitoring/air_pollutants/airborne_particulates (accessed 11th January, 2005)
Raupach, M, McTainsh, G and Leys, J. 1994. Estimates of dust mass in recent major Australian duststorms. Aust. J. Soil and Water Conservation, vol 7, No 3, 20-24.
Scott, W.D. 1994. Wind erosion of residue waste. Part 1. Using the wind profile to characterise winderosion. Catena, 21, 291-203.
Shao, Y., Raupach, M.R., and Leys J.F. 1996. A model for predicting aeolian sand drift and dustentrainment on scales from paddock to region. Aust. J. Soils Res., 34, 309-342.
Shao, Y and Leslie, L.M. 1997. Wind erosion prediction over the Australian continent. J. of GeophysicalRes. 102, 30,091-30,105.
Shao, Y. Yang, Y, Wang, J. Song, Z, Leslie, L.M. Dong, C. Zhang, Z. Lin, Z. Kanai, Y. Yabuki, S andChun, Y. 2003. Northeast Asian dust storms: real-time numerical prediction and validation. J.Geophysical Res. 108, D22, 4691

SINCLAIR KNIGHT MERZ
I:\WVES\Projects\WV02688\Deliverables\Final\R23npi_dust_review.doc PAGE 93
Shaw, B.W, Lacey, R,E. Capareda, S. Parnell, C.B. Wanjura, J. Wang, L. and Faulkner, W. 2004.Performance of Particulate Matter Samplers When Exposed to Coarse Fraction Aerosol Particles.Power point presentation available at BF2004ASAE.ppt (http://caaqes.tamu.edu/ Center for AgriculturalAir Quality. Engineering and Science Biological and Agricultural Engineering Department Texas A&MUniversity
Sinclair Knight Merz (SKM), 1997. Dust Assessment - Pinjarra Bauxite Stockpile Area. Report preparedfor Alcoa of Australia
Sinclair Knight Merz (SKM), 2003a. Aggregated Emissions Inventory for the Pilbara Airshed.1999/2000. Emissions Inventory Report. Revision 2 - June 2003. Available athttp://www.npi.gov.au/publications/
Sinclair Knight Merz (SKM), 2003b. Aggregated Emissions Inventory of NPI Substances for theBunbury Regional Airshed. July 2003. Emissions Inventory report prepared for the WA Department ofEnvironment. Available at http://www.npi.gov.au/publications/
Sinclair Knight Merz (SKM), 2004a. Kwinana Residue Area - Dust Buffer Study. Report prepared forAlcoa World Alumina Australia.
Sinclair Knight Merz (SKM), 2004b. Improvement of NPI Fugitive Particulate Matter EmissionEstimation Techniques. Summary Response Document. Report prepared for WA Department ofEnvironment.
Slinn, W.G.N. 1982. Predictions for particle to vegetative canopies. Atmos. Environ, 16, 1785-1794.
Smithman, J.B. and Nicol, S.K. 1991. Physico-chemical principles controlling the emission of dust fromcoal stockpiles. Powder Technology, 64, 259-270
State Pollution Control Commission (SPCC) 1983. Air Pollution from Coal Mining and RelatedDevelopments, ISBN 0 7240 5936 9.
State Pollution Control Commission (SPCC). 1986. Particle size distributions in dust from open cut coalmines in the Hunter Valley. Report Number 10636-002-71, Prepared for the State Pollution ControlCommission of NSW by Dames & Moore, Sydney.
US Department of Energy (US DOE). 1984. Technical Guide for Estimating Fugitive Dust Impacts fromCoal Handling Operations, Report Prepared by Dames & Moore for US Department of Energy, Office ofFuels Programs, Division of Coal and Electricity, 1000 Independence Avenue, SW Washington, DC20585, Report Number DOE/RG/10312-1(Vol.1).

SINCLAIR KNIGHT MERZ
I:\WVES\Projects\WV02688\Deliverables\Final\R23npi_dust_review.doc PAGE 94
U.S. Environmental Protection Agency (USEPA), 1974. Development of emission factors for fugitive dustsources. Report No. EPA-450/3-74/037 by U.S. Environmental Protection Agency, Research Triangle Park,NC.
U.S. Environmental Protection Agency (USEPA), 1982. AP-42 Section 11.24 - Metallic MineralsProcessing. http://www.epa.gov/ttn/chief/ap42/ch11/final/c11s24.pdf
U.S. Environmental Protection Agency (USEPA), 1983. Compilation of Air Pollutant Emission Factors,AP-42, Third Edition. Supplement 14. United States Environmental Protection Agency, Office of Air andRadiation, Office of Air Quality Planning and Standards, Research Triangle Park, North Carolina, 27711.
U.S. Environmental Protection Agency (USEPA), 1984. Improved Emission Factors for Fugitive dust fromWestern Surface Coal Mines, EPA-600/7-84-048, U. S. Environmental Protection Agency, Volumes I and II,March 1984.
U.S. Environmental Protection Agency (USEPA), 1985. Compilation of Air Pollutant Emission Factors,AP-42, Fourth Edition United States Environmental Protection Agency, Office of Air and Radiation,Office of Air Quality Planning and Standards, Research Triangle Park, North Carolina, 27711.
U.S. Environmental Protection Agency (USEPA), 1988a. Supplement B to Compilation of Air PollutantEmission Factors, AP-42, Fourth Edition, United States Environmental Protection Agency, Office of Airand Radiation Office of Air Quality Planning and Standards, Research Triangle Park, NorthCarolina, 27711.
U.S. Environmental Protection Agency (USEPA), 1988b. Control of Open Fugitive Dust Sources. Officeof Air Quality Planning Standard Research Triangle Park. NC 27711, September 1988.
U.S. Environmental Protection Agency (USEPA), 1998. Supplement E to Compilation of Air PollutantEmission Factors, AP-42, Fifth Edition, United States Environmental Protection Agency, Office of Airand Radiation Office of Air Quality Planning and Standards, Research Triangle Park, NorthCarolina, 27711.
U.S. Environmental Protection Agency (USEPA), 1999. Metal Mining Facilities. Section 313 of theEmergency Planning and Community Right-to-Know-Act. Toxic Chemical Release Inventory, UnitedStates Environmental Protection Agency, Office of Pollution Prevention and Toxics, WashingtonDC, 20460. January 1999. EPA 756-B-99-001.
U.S. Environmental Protection Agency (USEPA), 2003. Compilation of Air Pollutant Emission Factors,AP-42, Fifth Edition, 2003. United States Environmental Protection Agency, Office of Air and RadiationOffice of Air Quality Planning and Standards, Research Triangle Park, North Carolina, 27711.
SINCLAIR KNIGHT MERZ
I:\WVES\Projects\WV02688\Deliverables\Final\R23npi_dust_review.doc PAGE 95
U.S. Environmental Protection Agency (USEPA), 2004a. Summary of Emissions Factors ImprovementProject Fact Finding Survey, U.S. Environmental Protection Agency. Office of Air Quality PlanningStandard. Emissions Monitoring and Analysis Division. Emission factors and Policy Applications Group.Research Triangle Park. NC 27711, June 2004.
U.S. Environmental Protection Agency (USEPA), 2004b. AP-42 Section 13.2.2 - Unpaved RoadsSpreadsheet available at http://www.epa.gov/ttn/chief/ap42/ch13/related/c13s02-2.html
U.S. Environmental Protection Agency (USEPA), 2004c. AP-42 Section 11.19.2 Crushed Stone Processingand Pulverised Mineral Processing. http://www.epa.gov/ttn/chief/ap42/ch11/final/c11s1902.pdf
Wang, L, Wanjura, J.D. Parnell, C.B, Lacey, R.E. and Shaw, B.W. 2003. Performance Characteristics oflow-volume PM10 Inlet and TEOM Continuous PM Sampler. 2003 ASAE Annual International meeting.Available at http://caaqes.tamu.edu/. Center for Agricultural Air Quality. Engineering and ScienceBiological and Agricultural Engineering Department Texas A&M University
Watson, J. G. Robinson, N.F. Lewis, C.W. Coulter, C.T. Chow, J.C. Fujita, E.M. Conner, T.L. and PaceT.G. 1998. CMB8 applications and validation protocol for PM2.5 and VOCs. Report No. 1808.2D1.Prepared for U.S. Environmental Protection Agency, Research Triangle Park, NC, by Desert ResearchInstitute, Reno, NV.
Watson, J. G. and Chow, J. 2000. Reconciling urban fugitive dust emissions inventory and ambientsource contribution estimates: Summary of current knowledge and needed research. DRI DocumentNo. 6110.4F
Western Australian Department of Environmental Protection (WADEP). 1999. National PollutantInventory. Kalgoorlie NPI Trial. October 1999. Available at http://www.npi.gov.au/publications/
Woodruff, N.P. and Siddoway, F.H. 1965. A wind erosion equation. Soil Science Society of AmericaJournal 29, 602-608.
WRAPAIR, 2004. Summary of WRAP Dust Emissions Joint Forum Projects, March 26, 2004. Availableat http://www.wrapair.org/forums/dejf/index.html projects_descriptions2.pdf