ptt exploration and production public company limited
TRANSCRIPT

PTT Exploration and Production Public Company Limited Management Discussion and Analysis (MD&A) for the second quarter of 2018
Executive Summary Economic Outlook Financial Performance Operational Highlights Corporate Strategy Business Outlook Page l 1
Executive Summary For Q2/2018, PTTEP’s core performance remained solid reflecting though an 3% increase in sales volume from previous quarter (Q1/2018) to 302,846 barrel of oil equivalent per day (BOED), mainly from the Zawtika and Sinphuhorm projects. Average selling price (ASP) also rose around 7% QoQ to 46.94 USD per barrel of oil equivalent (BOE) as a result of the global oil price rally. However, unit cost in Q2/2018 increased from 29.20 USD/BOE in Q1/2018 to 31.51 USD/BOE due to higher DD&A expenses as a result of larger completed assets recognition essentially from the S1 project, coupled with higher operating expenses driven by planned maintenance activities in the Bongkot Project. All in all, the Company reported recurring net income of 336 MMUSD, representing 1 1 % growth in relative to the previous quarter.
Nonetheless, the Company recorded losses from non-recurring items of 223 MMUSD, largely driven by losses and tax expenses owing to the depreciated Thai Baht in relative to the US Dollar during the quarter, which consequently lessened net income to 113 MMUSD. Despite of lower net income, the Company successfully generated positive operating cash flow of 1,241 MMUSD and maintained healthy EBITDA margin at 73%.
PTTEP has continued to operate under 3R strategy being RESET REFOCUS RENEW. The recent achievement was the completion of acquisition of additional stake in the Bongkot project which enhanced PTTEP’s effective interest in the project to 66.6667% along with immediate contribution of cash-flow, daily sales volume, and petroleum reserves. Moreover, the Board of Director approved, after the reporting date of Q2/2018 financial statements, the divestment of Montara field, a mature and high cost field in Australia, with the Sale and Purchase Agreement (SPA) signing on 15 July 2018. These portfolio rationalization were in line with the “REFOCUS” strategy aiming to maximize value as well as to appropriately manage risks through prioritizing investment in strategic areas with high expertise and low-risk e.g. Southeast Asia and repositioning our investment in other non-core areas. More importantly, the Company endeavors to strengthen our growth via M&A, acceleration of the Final Investment Decision (FID) of key pre-development projects, especially the Mozambique Rovuma Offshore Area 1 Project with significant progress on the LNG plant construction preparation and LNG sale and purchase agreement finalization, which will push forward the project’s targeted FID in 1H2019 as well as the execution of exploration drilling activities in existing assets. The Company is also in the bidding process of expiring Bongkot and Erawan concessions with the expected result announcement by the end of this year. The Company strongly believes that our solid financial position and concrete strategic plans will enable us to grow sustainably.
At the end of Q2/2018, the Company upheld its robust financial position, with total assets amounting to 19,4 0 3 MMUSD, of which 3,421 MMUSD was cash and short-term investments; while total liabilities were reported at 7,724 MMUSD in which interest-bearing debt accounted for 2,252 MMUSD; and total shareholders’ equity ended at 11,679 MMUSD.
Table of key financial results

PTT Exploration and Production Public Company Limited Management Discussion and Analysis (MD&A) for the second quarter of 2018
Executive Summary Economic Outlook Financial Performance Operational Highlights Corporate Strategy Business Outlook Page l 2
Economic Overview in the second quarter of 2018
Crude Oil Prices Crude oil prices are among the key determinants of the Company’s performance. Dubai crude price continued to rally from previous quarter of around 13% with the average of this quarter at 72.07 USD per barrel (Source: Platts) supported by lower crude supply due to the following reasons; the massive fall in Venezuela’s crude production from normal level of 2.5 million barrel per day (BPD) to 1.4 million BPD as a result of the US Financial Sanctions as well as the dispute with ConocoPhillips on the Country’s port, the Nuclear Sanctions on Iran’s crude export led by the US forcing a potential lower import by major importers namely South Korea and India have to reduce loading Iranian crude oil. Also, the high compliance rate of 150% on the supply cut agreement among the major crude producers headed by Saudi Arabia dragged OECD’s crude oil inventories down below 5-year average level to 2.8 billion barrel. Other positive drivers included the negotiation between Saudi Arabia and Russia aiming to stabilize crude price in long-term and the political uncertainty in the Middle East. Aforementioned factors boosted oil prices since April before reaching the highest level at 76 USD per barrel in May.
The US crude supply remains key swing factor with daily production hiked to 10.9 million BPD, however, the US output is starting to slow down due to the lack of pipeline capacity to transport crudes from the Permian Basin, a major Shale oil production area, to the export ports. Nonetheless, the crude price slightly plunged towards the end of Q2/2018 pressured by the announcement of up to 1 million BPD increase in crude production from Saudi Arabia and Russia to replace those missing volumes from Libya, Venezuela and Iran.
Liquefied Natural Gas (LNG) Prices
The Asian Spot Price for Q2/2018 decreased to 8.8 USD/MMBTU from 9.7 USD/MMBTU in the previous quarter (Source: Platts), mainly due to lower global LNG demand during summer season.
Thailand’s Energy Demand
Thailand’s energy demand from January to April of 2018 was reported at 2.17 million BOED, an increase of 1% relative to the same period of the previous year (Source: EPPO, The Ministry of Energy), driven by Thailand’s economic expansion. Crude oil and conventional sources of natural gas continued to be the primary sources of the domestic energy supply. However, due to changes in electricity consumption behavior following technological advances, solar power and LNG imports are gradually being adopted as alternative sources of energy supply.
Exchange Rates (Thai Baht against US Dollar)
Because PTTEP’s functional currency is the US Dollar whereas the tax filing currency is the Thai Baht, the THB:USD exchange rate is another factor affecting the Company’s financial performance. For Q2/2018, the Thai Baht continuously fluctuated and depreciated against US Dollar since the end of April, due to the foreign fund outflows in both debt and equity markets following the FED interest rate hike and the market’s expectation on series of interest-rate hike in the second half of this year together with the strong US economic data, while Bank of Thailand’s Interest Rate remains unchanged. Apparently, the depreciation of THB was in line with other currencies in the region. For this quarter, the THB:USD exchange rate closed weaker at 33.17 THB/USD, depreciated from 31.23 THB/USD at the end of Q1/2018, leading to foreign exchange-related losses and tax expenses for PTTEP.

PTT Exploration and Production Public Company Limited Management Discussion and Analysis (MD&A) for the second quarter of 2018
Executive Summary Economic Outlook Financial Performance
Operational Highlights Corporate Strategy Business Outlook Page l 3
Financial Performance
Average Sales Volume Unit: Barrels of Oil Equivalent per Day
For Second quarter of 2018 compared with First quarter of 2018
In Q2/2018, the average sales volume of PTTEP and its subsidiaries (the “Group”) increased to 302,846 BOED when compared with Q1/2018 of 293,099 BOED. The increase was primarily from the Zawtika and the Sinphuhorm projects due to higher nomination from buyers. The average selling price in Q2/2018 increased to 46.94 USD/BOE (Q1/2018: 44.01 USD/BOE).
For Second quarter of 2018 compared with Second quarter of 2017 When compared the average sales volume for Q2/2018 to Q2/2017 of 281,435 BOED, the average sales volume increased
primarily from the Contract 4 Project due to higher nomination from buyer, and from the MTJDA Project due to higher nomination from Malaysian buyer and lower numbers of shutdown days for maintenance than Q2/2017. The average selling price increased to 46.94 USD/BOE (Q2/2017: 38.08 USD/BOE).
For the six-month period ended June 2018 compared with 2017 The average sales volume for the six-month period ended June 2018, increased to 297,999 BOED when compared with the
same period of 2017 (for the six-month period ended June 2017 of 292,709 BOED). The increase was primarily from the Contract 4 Project due to higher nomination from buyer, and from the MTJDA Project due to higher nomination from Malaysian buyer and lower numbers of shutdown days for maintenance than the same period of prior year. The average selling price increased to 45.51 USD/BOE (for the six month period ended June 2017: 38.04 USD/BOE)
209,917 213,429 199,961 211,683 205,310
83,182 89,417 81,474 86,316 87,399
Q12018
Q22018
Q22017
6M2018
6M2017
By Product Type
Gas Liquid
302,846293,099 297,999
236,286 233,419 212,963 234,845 224,416
48,929 57,921 60,487 53,450 56,566
Q12018
Q22018
Q22017
6M2018
6M2017
By Geographical Region
Thailand Other Southeast Asia Rest of the World
281,435 292,709 293,099 302,846281,435 297,999 292,709
2018 2018 2017 Inc. (Dec.) Inc. (Dec.) 2018 2017 Inc. (Dec.)(Unit : US Dollar) QoQ YoY YTDAverage selling price (/BOE) 44.01 46.94 38.08 7 23 45.51 38.04 20 Average Dubai crude oil price (/BBL) 63.96 72.07 49.68 13 45 68.01 51.38 32
Average selling price and Dubai crude oil price
Q1 Q2 Q2 % 6M 6M %%
PTT Exploration and Production Public Company Limited Management Discussion and Analysis (MD&A) for the second quarter of 2018
Executive Summary Economic Outlook Financial Performance
Operational Highlights Corporate Strategy Business Outlook Page l 4
Overall Operating Results
For Second quarter of 2018 compared with First quarter of 2018
In Q2/2018, the Group had a net profit of 113 MMUSD, a decrease of 310 MMUSD or 73% when compared with a net profit of 423 MMUSD in Q1/2018. The net profit of Q2/2018 can be separated as the profit from normal operation of 336 MMUSD and loss from non-recurring items of 223 MMUSD. The profit from normal operation in Q2/2018 was 336 MMUSD, an increase of 32 MMUSD when compared with a profit of 304 MMUSD in Q1/2018. The reason was primarily due to an increase in sales revenue of 132 MMUSD from increases in both average selling price and sales volume, while depreciation, depletion and amortization expenses increase of 52 MMUSD mainly from an increase in development wells in the S1 Project, as well as an increase in crude sales volume from the PTTEP Australasia and the Algeria 433a and 416b projects in Q2/2018 than the prior quarter, and an increase in operating expenses of 28 MMUSD mainly due to higher crude sales volume from the PTTEP Australasia Project in Q2/2018 than the prior quarter.
By considering the loss from non-recurring items of Q2/2018, the Group reported a loss of 223 MMUSD, a decrease of 342 MMUSD when compared with Q1/2018 which reported a profit of 119 MMUSD. The reason was primarily due to a depreciation of Thai Baht against US Dollar in Q2/2018 at 1.94 Baht per USD while there was an appreciation of Thai Baht against US Dollar in Q1/2018 at 1.45 Baht per USD, resulting in an increase of 323 MMUSD in income tax expenses relating to changes in foreign exchange rate. For Second quarter of 2018 compared with Second quarter of 2017
When compared a net profit for Q2/2018 with the same period last year which reported a net profit of 220 MMUSD, the Group had a decrease in net profit by 107 MMUSD or 49%.
The profit from normal operation in Q2/2018 was 336 MMUSD, an increase of 169 MMUSD when compared with a profit of 167 MMUSD in Q2/2017. The reason was primarily due to an increase in sales revenue of 318 MMUSD from increases in both average selling price and sales volume, while depreciation, depletion and amortization expenses increase of 79 MMUSD mainly from an increase in development wells and wellhead platforms in the S1 and the Contract 4 projects as well as increases in operating expenses of 16 MMUSD mainly due to higher crude sales volume from the PTTEP Australasia Project in Q2/2018 than Q2/2017.
By considering the loss from non-recurring items of Q2/2018, the Group reported a loss of 223 MMUSD, a decrease of 276 MMUSD when compared with Q2/2017 which reported a profit of 53 MMUSD. The reason was primarily due to a depreciation of Thai Baht against US Dollar in Q2/2018 at 1.94 Baht per USD, while there was an appreciation of Thai Baht against US Dollar in Q2/2017 at 0.47 Baht per USD, resulted in an increase of 230 MMUSD in income tax expenses relating to changes in foreign exchange rate. For the six-month period ended June 2018 compared with 2017
For the six-month period ended June 2018, the Group had a net profit of 536 MMUSD, a decrease of 33 MMUSD or 6% when compared with the six-month period ended June 2017 of 569 MMUSD. The net profit for the six-month period ended June 2018 can be separated as the profit from normal operation of 640 MMUSD and loss from non-recurring items of 104 MMUSD.
The profit from normal operation for the six-month period ended June 2018 was 640 MMUSD, an increase of 262 MMUSD when compared with the profit for the six-month period ended June 2017 of 378 MMUSD. The reason was primarily due to an increase in sales revenue of 439 MMUSD from increases in both average selling price and sales volume, while depreciation, depletion and amortization expenses increase of 67 MMUSD mainly from an increase in development wells and wellhead platforms in the Contract 4 and the S1 projects, and an increase in petroleum royalties and remuneration of 38 MMUSD due to an increase in domestic sales revenue.
By considering the loss from non-recurring items for the six-month period ended June 2018 of 104 MMUSD, a decrease of 295 MMUSD when compared with the six-month period ended June 2017 which reported a profit of 191 MMUSD. The reason was primarily due to a depreciation of Thai Baht against US Dollar during the six-month period ended June 2018 at 0.49 Baht per USD, while there was an appreciation of Thai Baht against US Dollar during the six-month period ended June 2017 at 1.85 Baht per USD, resulted in an increase of 219 MMUSD in income tax expenses relating to changes in foreign exchange rate. In addition, the Group recognized

PTT Exploration and Production Public Company Limited Management Discussion and Analysis (MD&A) for the second quarter of 2018
Executive Summary Economic Outlook Financial Performance
Operational Highlights Corporate Strategy Business Outlook Page l 5
loss on financial instruments mainly from oil price hedging of 51 MMUSD for the six-month period ended June 2018, while recognized gain from such transaction of 3 MMUSD for the six-month period ended June 2017.
Operating Results by Segments
For Second quarter of 2018 compared with First quarter of 2018 For Q2/2018, the Group reported net profit of 113 MMUSD, a decrease of 310 MMUSD or 73% when compared with Q1/2018
of 423 MMUSD, primarily due to decreases in operating results of Head office and others segment of 242 MMUSD and Exploration and production segment in Thailand of 87 MMUSD, while there was an improvement from Other Southeast Asia segment of 18 MMUSD.
Head office and others segment For Q2/2018, the Head office and others segment reported net loss of 184 MMUSD, a decrease in operating results of 242
MMUSD or more than 100% when compared with net profit of 58 MMUSD in Q1/2018, primarily due to an increase in income tax expenses and a recognition of loss on foreign exchange rate which resulted from the effect of a depreciation of Thai Baht against US Dollar. However, the segment recognized gain on financial instruments mainly from forward contract in Q2/2018, while it recognized loss from such transaction in Q1/2018.
Exploration and production segment Thailand
For Q2/2018, Thailand segment reported net profit of 209 MMUSD, a decrease of 87 MMUSD or 29% when compared with net profit of 296 MMUSD in Q1/2018. The decreases were primarily due to an increase in income tax expenses due to a depreciation of Thai Baht against US Dollar, and an increase in depreciation, depletion and amortization expenses mainly from an increase in development wells from the S1 Project. However, sales revenue increased from an increase in average selling price.
Other Southeast Asia For Q2/2018, the Other Southeast Asia segment reported net profit of 22 MMUSD, an increase of 18 MMUSD or more than
100% from net profit of 4 MMUSD in Q1/2018, primarily due to an increase in sales revenue from an increase in average sales volume, mainly due to higher nomination from buyers from the Zawtika and the Yadana projects resulted in an increase in operating expenses. In addition, there was an increase in income tax expenses, mainly due to a depreciation of Thai Baht against US Dollar.
For Second quarter of 2018 compared with Second quarter of 2017 For Q2/2018, the Group reported net profit of 113 MMUSD, a decrease of 107 MMUSD or 49% when compared with net profit
of 220 MMUSD in Q2/2017, primarily due to a decrease in operating results of Head office and others segment of 202 MMUSD, while there were an improvement of operating results from Exploration and production segment in Thailand and Other Southeast Asia segment of 56 MMUSD and 17 MMUSD, respectively.
Head office and others segment For Q2/2018, the Head office and others segment reported net loss of 184 MMUSD, a decrease in operating results of 202
MMUSD or more than 100% when compared with a net profit of 18 MMUSD in Q2/2017, primarily due to an increase in income tax expenses and a recognition of loss on foreign exchange rate which resulted from the effect of a depreciation of Thai Baht against US Dollar.
Q1 Q2 Q2 % % 6M 6M %2018 2018 2017 Inc. (Dec.) Inc. (Dec.) 2018 2017 Inc. (Dec.)
(Unit: Million US Dollar) QoQ YoY YTDExploration and production 301 219 139 (27) 58 520 353 47
Thailand 296 209 153 (29) 37 504 351 44 Overseas 5 10 (14) 100 >100 16 2 >100- Other Southeast Asia 4 22 5 >100 >100 27 28 (4)- Australia (0.3) (2) (13) >(100) 85 (2) (17) 88 - America (1) (4) (2) >(100) (100) (5) (2) >(100)- Africa 2 (6) (4) >(100) (50) (4) (7) 43
Pipeline transportation 64 78 63 22 24 142 106 34 Head office and others 58 (184) 18 >(100) >(100) (126) 110 >(100)Total 423 113 220 (73) (49) 536 569 (6)
Net Profit ( loss)

PTT Exploration and Production Public Company Limited Management Discussion and Analysis (MD&A) for the second quarter of 2018
Executive Summary Economic Outlook Financial Performance
Operational Highlights Corporate Strategy Business Outlook Page l 6
Exploration and production segment Thailand
For Q2/2018, Thailand segment reported a net profit of 209 MMUSD, an increase of 56 MMUSD or 37% from net profit of 153 MMUSD in Q2/2017. The increase was primarily due to an increase in sales revenue mainly from an increase in average selling price, while there was an increase in depreciation, depletion and amortization expenses mainly from an increase of development wells and wellhead platforms from the S1 and the Contract 4 Projects. In addition, there was an increase in income tax expenses due to a depreciation of Thai Baht against US Dollar.
Other Southeast Asia For Q2/2018, the Other Southeast Asia segment reported net profit of 22 MMUSD, an increase of 17 MMUSD or more than
100% from net profit of 5 MMUSD in Q2/2017, primarily due to an increase in sales revenue from an increase in average selling price, while there was an increase in income tax expenses mainly from a depreciation of Thai Baht against US Dollar.
For the six-month period ended June 2018 compared with the 2017 For the six-month period ended June 2018, the Group reported a net profit of 536 MMUSD, a decrease of 33 MMUSD or
6% when compared with the six-month period ended June 2017 of 569 MMUSD, primarily due to an improvement of operating results from Exploration and production segment in Thailand of 153 MMUSD and Pipeline transportation segment of 36 MMUSD. However, there was a decrease in operating results from Head office and other segment of 236 MMUSD.
Exploration and production segment Thailand
For the six-month period ended June 2018, Thailand segment reported a net profit of 504 MMUSD, an increase of 153 MMUSD or 44% when compared with the six-month period ended June 2017 of 351 MMUSD. The increase was primarily due to an increase in sales revenue mainly from an increase in average selling price, while there was an increase in income tax expenses due to a depreciation of Thai Baht against US Dollar, as well as, an increase in depreciation, depletion and amortization expenses, mainly from an increase in development wells and wellhead platforms from the Contract 4 and the S1 projects.
Pipeline segment For the six-month period ended June 2018, Pipeline segment reported a net profit of 142 MMUSD, an increase of 36
MMUSD or 34% when compared with the six-month period ended June 2017 of 106 MMUSD. The increase was primarily due to an increase in revenue from an increase in sales volume and pipeline transportation tariff which resulted from an increase in gas selling price from the gas pipeline project in the Republic of the Union of Myanmar.
Head office and others segment For the six-month period ended June 2018, the Head office and others segment reported a net loss of 126 MMUSD,
a decrease in operating results of 236 MMUSD or more than 100% when compared with a net profit of 110 MMUSD in the six-month period ended June 2017, primarily due to an increase in income tax expenses and a recognition of loss on foreign exchange rate which resulted from the effect of a depreciation of Thai Baht against US Dollar. In addition, there was a the recognition of loss on financial instruments mainly from oil price hedging for the six-month period ended June 2018, while the segment recognized gain on such transaction for the same period in prior year.
PTT Exploration and Production Public Company Limited Management Discussion and Analysis (MD&A) for the second quarter of 2018
Executive Summary Economic Outlook Financial Performance
Operational Highlights Corporate Strategy Business Outlook Page l 7
Financial Position Unit: Million US Dollar
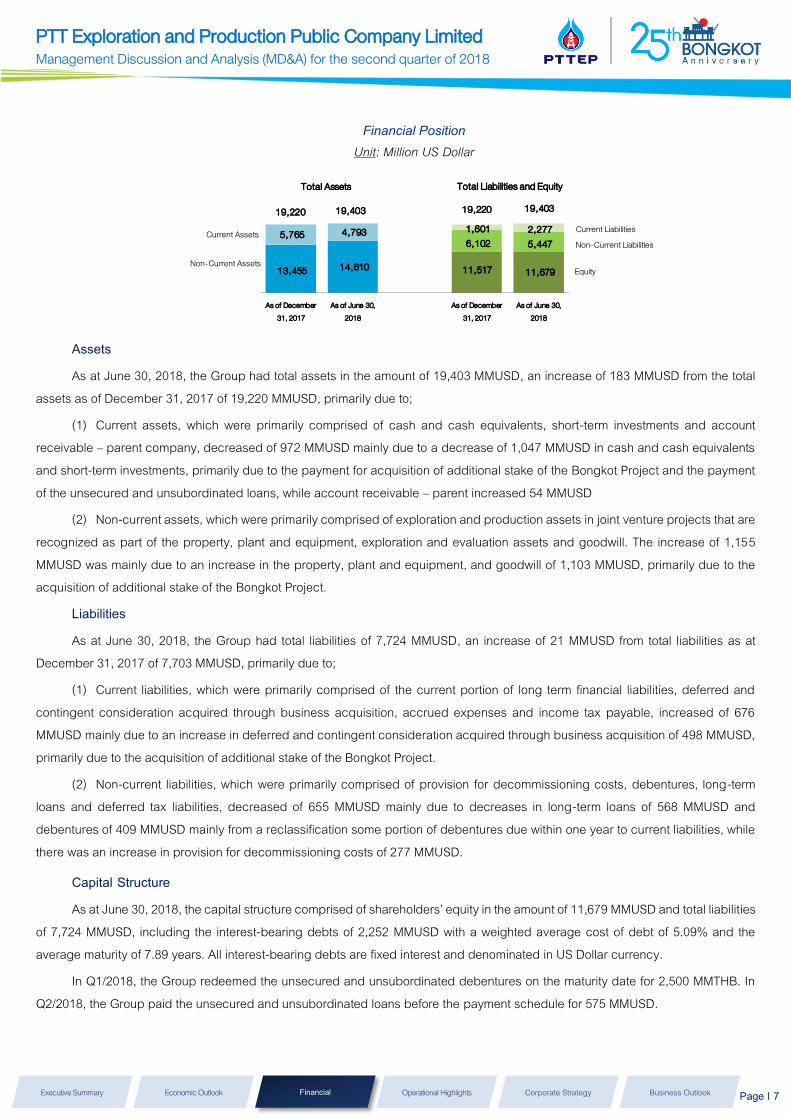
Assets As at June 30, 2018, the Group had total assets in the amount of 19,403 MMUSD, an increase of 183 MMUSD from the total
assets as of December 31, 2017 of 19,220 MMUSD, primarily due to; (1) Current assets, which were primarily comprised of cash and cash equivalents, short-term investments and account
receivable – parent company, decreased of 972 MMUSD mainly due to a decrease of 1,047 MMUSD in cash and cash equivalents and short-term investments, primarily due to the payment for acquisition of additional stake of the Bongkot Project and the payment of the unsecured and unsubordinated loans, while account receivable – parent increased 54 MMUSD
(2) Non-current assets, which were primarily comprised of exploration and production assets in joint venture projects that are recognized as part of the property, plant and equipment, exploration and evaluation assets and goodwill. The increase of 1,155 MMUSD was mainly due to an increase in the property, plant and equipment, and goodwill of 1,103 MMUSD, primarily due to the acquisition of additional stake of the Bongkot Project.
Liabilities As at June 30, 2018, the Group had total liabilities of 7,724 MMUSD, an increase of 21 MMUSD from total liabilities as at
December 31, 2017 of 7,703 MMUSD, primarily due to; (1) Current liabilities, which were primarily comprised of the current portion of long term financial liabilities, deferred and
contingent consideration acquired through business acquisition, accrued expenses and income tax payable, increased of 676 MMUSD mainly due to an increase in deferred and contingent consideration acquired through business acquisition of 498 MMUSD, primarily due to the acquisition of additional stake of the Bongkot Project.
(2) Non-current liabilities, which were primarily comprised of provision for decommissioning costs, debentures, long-term loans and deferred tax liabilities, decreased of 655 MMUSD mainly due to decreases in long-term loans of 568 MMUSD and debentures of 409 MMUSD mainly from a reclassification some portion of debentures due within one year to current liabilities, while there was an increase in provision for decommissioning costs of 277 MMUSD.
Capital StructureAs at June 30, 2018, the capital structure comprised of shareholders’ equity in the amount of 11,679 MMUSD and total liabilities
of 7,724 MMUSD, including the interest-bearing debts of 2,252 MMUSD with a weighted average cost of debt of 5.09% and the average maturity of 7.89 years. All interest-bearing debts are fixed interest and denominated in US Dollar currency.
In Q1/2018, the Group redeemed the unsecured and unsubordinated debentures on the maturity date for 2,500 MMTHB. In Q2/2018, the Group paid the unsecured and unsubordinated loans before the payment schedule for 575 MMUSD.
13,455 14,610
5,765 4,793
11,517 11,679
6,102 5,447 1,601 2,277
As of December31, 2017
As of June 30,2018
As of December31, 2017
As of June 30,2018
19,403
Total Assets Total Liabilities and Equity
19,220 19,40319,220
Current Assets
Non-Current Assets
Current LiabilitiesNon-Current Liabilities
Equity

PTT Exploration and Production Public Company Limited Management Discussion and Analysis (MD&A) for the second quarter of 2018
Executive Summary Economic Outlook Financial Performance
Operational Highlights Corporate Strategy Business Outlook Page l 8
Cash Flows Unit: Million US Dollar
As at June 30, 2018, the Group had cash and cash equivalents, including short-term investment in the form of bank fixed deposit with a maturity of more than three months, but within twelve months of 3,421 MMUSD, a decrease of 1,047 MMUSD from cash and cash equivalents including short-term investment as at December 31, 2017 of 4,468 MMUSD.
Sources of funds in the amount of 1,284 MMUSD primarily came from Net cash received from operating activities as a result of the positive net cash flows from sales revenues, offset with cash payments for expenditures and income tax expenses.
Uses of funds in the amount of 2,331 MMUSD primarily came from Net cash used in additional investment activities for exploration and production assets, primarily for the acquisition of additional stake of the Bongkot Project and investment in the Zawtika and the S1 Projects and Net cash used in financing activities which were mainly for the payment of loans and debentures, and the payment of dividend for the second half of 2017 which was paid in May 2018 of 347 MMUSD
Key Financial Ratios
Remark:
EBITDA to revenue from sales = Profit before deduction of interest, tax and depreciation to revenue from sales including revenue from pipeline transportation Return on equity Net profit margin
= =
Net profit to weighted average shareholders’ equity for the past 12 months Net profit to total revenue for the past 12 months
Debt to equity = Interest Bearing Debt to total shareholders’ equity Debt to EBITDA = Interest Bearing Debt to profit for the past 12 months before deduction of interest, tax and depreciation
1,241
43
647
347
580
757
1,284 2,331
For six months in 2018
Other investing activites
Source of Funds Use of Funds
Operating activities (including adjustment for the
effect of exchange rate changes)
Financing activities
Capital expenditures
Payment for business acquisition
Dividends paid
Q1 Q2 Q2 6M 6M2018 2018 2017 2018 2017
Profitability Ratio (%)
EBITDA to revenue from sales 74.22 73.20 68.96 73.69 71.40
Return on equity 5.71 4.80 6.17 4.80 6.17
Net profit margin 14.28 11.23 16.50 11.23 16.50
Leverage Ratio (Times)
Debt to equity 0.24 0.19 0.25 0.19 0.25
Debt to EBITDA 0.91 0.65 0.98 0.65 0.98

PTT Exploration and Production Public Company Limited Management Discussion and Analysis (MD&A) for the second quarter of 2018
Executive Summary Economic Outlook Financial Performance
Operational Highlights
Corporate Strategy Business Outlook Page l 9
Operational Highlights
As of Q2/2018, PTTEP’s domestic and international operations altogether sum to 40 projects in 11 countries, with key project highlights as follows;
Projects in Thailand PTTEP currently has 16 projects in Thailand, the majority of which are in the production phase, which had average sales volume
for this quarter of 233 ,4 1 9 BOED, accounting for 7 7 % of PTTEP’s total sales volume. These projects are located in both the Gulf of Thailand and onshore; including the Bongkot Project; the project achieved the production level as planned and also successfully completed the acquisition of additional 22.2222% stake from Shell on 21 June 2018. The Project is currently in the process of Dataroom assessment in order to bid for the expiring concession. The bidding result is expected within the end of 2018. The S1 Project has continuously drilled additional production wells to increase production levels in the future. Apart from production projects, Ubon Field of the Contract 4 Project is in the process of pre-development with expected first production of oil and natural gas by 2022 at planned capacity of 25,000 BPD and 50 MMSCFD (approximately 8,300 BOED), respectively.
Projects in Southeast Asia PTTEP has 15 projects in this region which are located in the Republic of the Union of Myanmar (Myanmar), the Socialist
Republic of Vietnam (Vietnam), Malaysia and the Republic of Indonesia (Indonesia). Sales volume for Q2/2018 from this region amounted to 57,921 BOED, representing 19% of PTTEP’s total sales volume.
The highlights of key projects in the production phase are as follows. The Zawtika Project, located in the Gulf of Moattama, Myanmar, has maintained its production as planned and continues to carry out producing well drilling activities. The Project completed production drilling from 1 out of 4 production platforms in Phase 1C aiming to maintain output level. For Q2/2018, natural gas sales averaged 327 MMSCFD (approximately 52,112 BOED). The Vietnam 16-1 Project, located offshore in the southeast of Vietnam, is preparing further production drilling plan to maintain production plateau with crude oil and natural gas sales in Q2/2018 of 20,736 BPD and 8 MMSCFD (approximately 1,961 BOED), orderly.
The exploration phase projects in this region are mainly located in onshore and offshore of Myanmar. The major highlights include the Myanmar M3 Project, has completed the Pre-FEED study and expects to propose the Field Development Plan to the Government of Myanmar within Q3/2018. The Project is also in the process of commercial framework discussion with the Government of Myanmar. The Myanmar MD-7 Project, is in the process of assessing the fields’ resource potential. The Myanmar M11 Project, is under preparation of exploration drilling plan and is seeking partner to manage the Project’s risk. The Myanmar MOGE 3 Project, is under drilling preparation of an exploration well. The Sarawak SK410B Project in Malaysia, is currently assessing the fields’ resource potential and under preparation to drill exploration well. The Vietnam B & 48/95 Project and the Vietnam 52/97 Project are located offshore of Vietnam. The projects have signed a letter of agreement between joint venture partners on wellhead gas prices and transportation costs in 2017 and are currently in the negotiation process on commercial terms in order to push forward the Final Investment Decision (FID) targeting first production by the end of 2021 with ramping up capacity to 490 MMSCFD.
Thailand and Southeast Asia America Australia Africa
PTT Exploration and Production Public Company Limited Management Discussion and Analysis (MD&A) for the second quarter of 2018
Executive Summary Economic Outlook Financial Performance
Operational Highlights
Corporate Strategy Business Outlook Page l 10
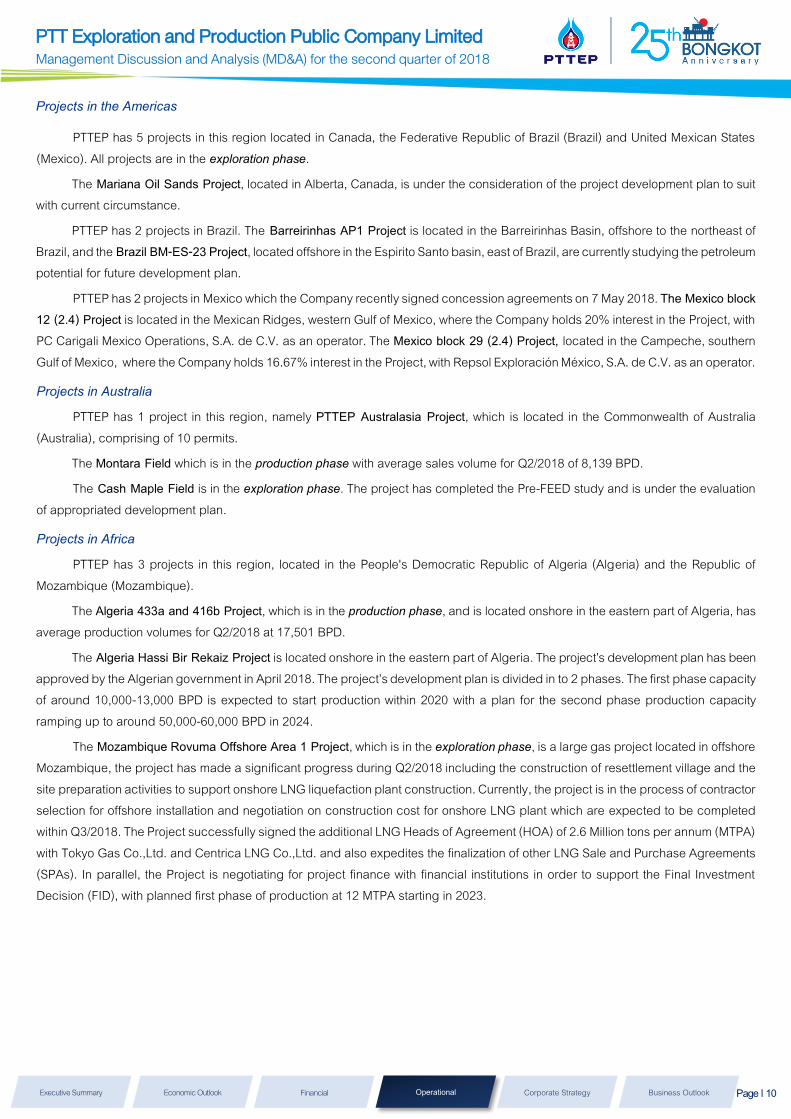
Projects in the Americas
PTTEP has 5 projects in this region located in Canada, the Federative Republic of Brazil (Brazil) and United Mexican States (Mexico). All projects are in the exploration phase.
The Mariana Oil Sands Project, located in Alberta, Canada, is under the consideration of the project development plan to suit with current circumstance.
PTTEP has 2 projects in Brazil. The Barreirinhas AP1 Project is located in the Barreirinhas Basin, offshore to the northeast of Brazil, and the Brazil BM-ES-23 Project, located offshore in the Espirito Santo basin, east of Brazil, are currently studying the petroleum potential for future development plan.
PTTEP has 2 projects in Mexico which the Company recently signed concession agreements on 7 May 2018. The Mexico block 12 (2.4) Project is located in the Mexican Ridges, western Gulf of Mexico, where the Company holds 20% interest in the Project, with PC Carigali Mexico Operations, S.A. de C.V. as an operator. The Mexico block 29 (2.4) Project, located in the Campeche, southern Gulf of Mexico, where the Company holds 16.67% interest in the Project, with Repsol Exploración México, S.A. de C.V. as an operator.
Projects in Australia PTTEP has 1 project in this region, namely PTTEP Australasia Project, which is located in the Commonwealth of Australia
(Australia), comprising of 10 permits. The Montara Field which is in the production phase with average sales volume for Q2/2018 of 8,139 BPD. The Cash Maple Field is in the exploration phase. The project has completed the Pre-FEED study and is under the evaluation
of appropriated development plan.
Projects in Africa PTTEP has 3 projects in this region, located in the People's Democratic Republic of Algeria (Algeria) and the Republic of
Mozambique (Mozambique). The Algeria 433a and 416b Project, which is in the production phase, and is located onshore in the eastern part of Algeria, has
average production volumes for Q2/2018 at 17,501 BPD. The Algeria Hassi Bir Rekaiz Project is located onshore in the eastern part of Algeria. The project’s development plan has been
approved by the Algerian government in April 2018. The project’s development plan is divided in to 2 phases. The first phase capacity of around 10,000-13,000 BPD is expected to start production within 2020 with a plan for the second phase production capacity ramping up to around 50,000-60,000 BPD in 2024.
The Mozambique Rovuma Offshore Area 1 Project, which is in the exploration phase, is a large gas project located in offshore Mozambique, the project has made a significant progress during Q2/2018 including the construction of resettlement village and the site preparation activities to support onshore LNG liquefaction plant construction. Currently, the project is in the process of contractor selection for offshore installation and negotiation on construction cost for onshore LNG plant which are expected to be completed within Q3/2018. The Project successfully signed the additional LNG Heads of Agreement (HOA) of 2.6 Million tons per annum (MTPA) with Tokyo Gas Co.,Ltd. and Centrica LNG Co.,Ltd. and also expedites the finalization of other LNG Sale and Purchase Agreements (SPAs). In parallel, the Project is negotiating for project finance with financial institutions in order to support the Final Investment Decision (FID), with planned first phase of production at 12 MTPA starting in 2023.

PTT Exploration and Production Public Company Limited Management Discussion and Analysis (MD&A) for the second quarter of 2018
Executive Summary Economic Outlook Financial Performance
Operational Highlights Corporate Strategy Business Outlook Page l 11
Company Strategy
The Company has continued to operate under the 3R strategy being “RESET REFOCUS RENEW” in order to cope with the changes in the industry landscape as well as to enhance our competitive advantages and sustainable growth.
RESET: The Company carries on cost management effort with the objective to maintain competitive cost among peers in the industry through the efficiency improvement and operational cost management.
REFOCUS: The Company endeavors to prioritize the investment in strategic areas including Southeast Asia and Middle East. Recent achievement was the completion of acquisition 22.2222% stake in the Bongkot Project from Shell which resulted in the Company’s increasing interest to 66.6667% with daily sales volume contribution of 35,000 BOED. Other key priorities apart from the Merger and Acquisition (M&A) to enhance reserves and growth are as follows;
The participation in the ongoing bidding process of expiring concessions in Gulf of Thailand, including the Bongkot and Erawan concessions. With more than 20 years of operatorship in the Bongkot field, the Company is well-positioned to continuously supply natural gas to the country in accordance with the Government’s policy.
The acceleration of the Final Investment Decision (FID) of pre-development projects including the Mozambique Rovuma Offshore Area 1 Project, the Algeria Hassi Bir Rekaiz Project, the Vietnam B & 48/95 Project and the Vietnam 52/97 Project as well as the Contract 4 (Ubon Field).
The execution of exploration activities in the current projects, while also seeking new opportunities in the high petroleum potential areas.
RENEW: The Company transformed ourselves to cope with the challenging era through closely assessment disruption trends for their impact and capture of new business opportunities relating to E&P activities plus other potential business opportunities. Recently, the Company has established the new subsidiary “EP-Tech Ventures Holding Company Limited” in order to enhance operational flexibility and competitiveness for sustainable growth.
To align with the Company’s strategic directions aiming to focus our investments in the high expertise and low-risk areas, the Board of Director approved, after the reporting date of Q2/2018 financial statements, the Divestment of Montara field, as part of the portfolio rationalization, and the Company signed the SPA with Jadestone Energy (Eagle) Pty Ltd on 15 July 2018, with the asset purchase price of 195 MMUSD (value as of 1 January 2018), to be adjusted for working capital, and additional contingent consideration amounts of up to 160 MMUSD depending on certain production, oil price and future development milestones being achieved. The transaction is expected to complete by the end of 2018. The Montara field is a mature oil field with high costs. At the end of Q2/2018, Montara field’s net asset (including working capital) was 268 MMUSD.
Capital Management
PTTEP focuses on ensuring effective financial management by maintaining a robust capital structure. As of the end of Q2/2018, the Company maintained a strong liquidity position with cash on hand of approximately USD 3.4 billion and debt-to-equity ratio of less than 0.2x, which is in line with the Company financial policies and also provides adequate liquidity in order to fund capital expenditure to maintain production, develop future projects in the pipeline, and carry out exploration activities as well as to support new investment opportunities through Merger and Acquisitions (M&A).
The Company has signed the Memorandum of Understanding (MOU) with Siam Commercial Bank Public Company Limited (SCB) to study and develop “Cross-board Payment” on Blockchain to enhance the efficiency of PTTEP’s cash transfers with our partners and service providers through faster and lower cost digitalized platform.

PTT Exploration and Production Public Company Limited Management Discussion and Analysis (MD&A) for the second quarter of 2018
Executive Summary Economic Outlook Financial Performance
Operational Highlights Corporate Strategy Business Outlook Page l 12
Cost Management
The Company emphasizes our cost control through the SPEND SMART to Business Sustainability campaign with the theme “Think Smart, Work Smart for Better Efficiency” focusing on efficient cost management and productivity gains such as the reduction of drilling days and cost optimization of wellhead platform design, contract renegotiations on current and future equipment rental and services, and logistical optimization through reducing number of supply boats as well as optimizing inventory management.
The Company believes that our cost management initiatives will allow us to deliver 2018 unit cost as per target of 30-31 USD/BOE. However, unit cost in this quarter was escalated to 31.51 USD/BOE due to higher DD&A expenses as a result of larger completed assets recognition essentially from the S1 project, coupled with higher operating expenses driven by planned maintenance activities in the Bongkot Project.
Sustainable Development PTTEP’s Sustainable Development is aligned with global principles and the United Nation’s Sustainable Development Goals
(SDGs) as reflected through its activities in the second quarter of 2018, covering three areas: business, social, and environment, as follows;
Business PTTEP allocates approximately 3% of net income each year as a budget for research and technology development. In the second quarter of this year, the key projects in progress are as follows:
Increase Exploration Success i.e. Electromagnetic for subsurface fluid movement monitoring Green Practice i.e. Diesel consumption reduction, Greenhouse gas (GHG) reduction and CO2 utilization. Petroleum Related Technology i.e. Autonomous Underwater Vehicle (AUV) and In-pipe Inspection Robot
Social PTTEP is committed to carrying out its business operations in a socially responsible manner, and still maintains its focus on four development areas: environment, fundamental needs, education, and culture. The key activities undertaken in the second quarter of 2018 included the expansion of crab hatchery into Ban Phangsai, Sathing Phra district, Songkhla province, training villagers for additional skills to increase extra income, engaging with a local health promoting hospital to arrange diabetic screening and toxic contamination check for the communities closed to the operating areas. In addition PTTEP scuba diving club has also volunteered to clean up the coastal areas of Krok and Lan islands in Chonburi province on a World Ocean day.
Safety, Security, Health and Environment PTTEP has an environmental management system which encompasses a project’s entire life cycle, and is a subset of PTTEP’s Safety, Security, Health and Environment Management System (SSHE MS). In the second quarter of 2018, PTTEP had a Lost Time Injury Frequency (LTIF) score of 0.15 and a Total Recordable Incident Rate (TRIR) score of 0.95. The Company’s performance on both safety indicators is comparable to the average of the members in the International Association of Oil and Gas Producers (IOGP). Moreover, PTTEP aims to become a Low Carbon Footprint organization, and has revised a goal to reduce its GHG emissions by a minimum 25% comparing with its 2012 base year figure by 2030. As of the second quarter of 2018, PTTEP has already achieved 4.9% reduction of GHG emissions target comparing to 2012.

PTT Exploration and Production Public Company Limited Management Discussion and Analysis (MD&A) for the second quarter of 2018
Executive Summary Economic Outlook Financial Performance
Operational Highlights Corporate Strategy Business Outlook Page l 13
Future Business Outlook
Oil Price Outlook PTTEP expects average Dubai crude prices in 2H2018 will be in a range between 65-75 USD/BBL. Bullish factors include the
prolonged decline in crude export from Venezuela and Iran due to the US Sanctions along with the slow-down in the US production due transporting pipeline capacity shortage. Another positive factor is a high possibility that the supply cut agreement among OPEC and non-OPEC will be extended from year-end 2018 to year-end 2019. The extension is matched with the Aramco’s IPO timeline in 2019.
On the other hand, there are several factors that still pressure the global crude price including the direction from Saudi Arabia and Russia on production uplift to replace those missing volumes from Libya, Iran and Venezuela, and the US import tax, mainly with China, possibly resulting in the US-China trade war and the upcoming Italy’s election timing by the end of 2018, which may subsequently create the adverse effect on the economic growth.
LNG Market In 2H2018, the global LNG market is forecasted to remain oversupply with total capacity of existing and upcoming LNG projects
growing by 3% to 320 million ton, while demand is expected to stabilize at 310 million ton. Even the LNG market is in supply glut situation, the global LNG price is expected to improve following the better oil price environment and the 2018 Average Asian Spot LNG price is forecasted to be in a range bound of 7.3-9.6 USD/MMBTU (Source: PTT Prism, Wood Mackenzie, and FGE).
However, the global LNG price could vary depending on other factors including bearish factor from increasing LNG supply from new projects and bullish factors such as disruption in existing LNG projects, better-than-expected demand especially in China and India coupled with energy policy from the governments. Nonetheless, the market foresees that LNG demand-supply tend to rebalance after 2022.
Thai Economy and Foreign Exchange Outlook The Bank of Thailand (BOT) expects the economy to continually expand at 4.4% in 2018, driven mostly by Thailand economic
growth from the export and tourism reflecting the improved global economic situations, expansion in agricultural and industrial incomes, the Government investment in infrastructure projects, and the firm investment policy on the Eastern Economic Corridor project.
The THB:USD exchange rate continues to embed a high degree of volatility. THB tends to weaken against USD in 2H2018 as a result of uncertainty around the monetary policy of major industrial countries, negative impact on domestic export from the trade war, the movement of major currency fund flows in the region, the insecurity of the EU economic, and the political instability in several regions. Nevertheless, there are factors to closely monitor including domestic economic growth, clarity on Thailand’s election coupled with the possibility of BOT’s interest rate hike by the end of this year.
PTTEP’s financial performance will be affected by THB:USD exchange rate fluctuations mainly through income tax. The effect arises because the Company adopts two different functional currencies, the THB for tax purposes and the USD for accounting. The effects mainly, however, do not impact the Company’s cash flows. Moreover, the possibility of increased interest rates has no impact on the Company’s financial performance as the Company’s total interest-bearing debt is fixed-rated.

PTT Exploration and Production Public Company Limited Management Discussion and Analysis (MD&A) for the second quarter of 2018
Executive Summary Economic Outlook Financial Performance
Operational Highlights Corporate Strategy Business Outlook Page l 14
PTTEP’s performance outlook for 2018
PTTEP’s performance depends on three major factors including Sales volumes, Selling price and Unit cost with the guidance summary as follows;
Sales volume: PTTEP focuses on maintaining the production level with the estimated sales volume for Q3/2018 and full-year 2018 of
approximately 308,000 BOED and 310,000 BOED, respectively. The higher sales volume outlook causes from sales volume contribution from the completion of acquisition of additional 22.2222% stake in the Bongkot Project, which was completed in late June 2018. The 2018 average sales volume still includes output from Montara Oil field in Australia until the completion of divestment process.
Sales price: PTTEP’s liquid prices will fluctuate relative with global crude prices. PTTEP’s gas prices are linked via a price formula with 6-12 months lag-time to referenced global oil prices indices. Average
gas price for Q3/2018 and full-year 2018 are estimated at approximately 6.5 USD/MMBTU reflecting the upturn in oil price environment. (Based on average Dubai price assumption for full-year 2018 of 70 USD/BBL)
Unit Cost:
PTTEP expects the unit cost will be in a range between 31-32 USD/BOE for Q3/2018, and 30-31 USD/BOE for the full-year 2018.
Q3 2018 Year 2018
Thousand BOED
~308 ~310 31031
Sales Volume
พันบาร์เรลเทียบเท่า Q3 2018 Year 2018
USD/BOE
31-32 30-31
Unit Cost
Q3 2018 Year 2018*
USD/MMBTU
~6.5 ~6.5
Gas Price
Year 2018
of sales revenue
70-75%
EBITDA Margin
*based on average Dubai price assumption of 70 USD/BBL for 2018