(unofficial translation) to: the shareholders of ptt...
TRANSCRIPT
(UNOFFICIAL TRANSLATION)
AUDITOR’S REPORT
TO: THE SHAREHOLDERS OF PTT PUBLIC COMPANY LIMITED
The Office of the Auditor General of Thailand has audited the consolidated and
separate financial statements of PTT Public Company Limited and its subsidiaries, which
comprise the consolidated and separate statements of financial position as at December 31,
2012, the consolidated and separate statements of income, statements of comprehensive
income, statements of changes in shareholders’ equity and statements of cash flows for the year
then ended, and a summary of significant accounting policies and other explanatory notes
Management’s Responsibility for the Consolidated and Separate Financial Statements
Management is responsible for the preparation and fair presentation of these
consolidated and separate financial statements in accordance with Thai Financial Reporting
Standards, and for such internal control as management determines is necessary to enable the
preparation of consolidated and separate financial statements that are free from material
misstatement, whether due to fraud or error.
Scope of review
The Office of the Auditor General of Thailand’s responsibility is to express an opinion
on these consolidated and separate financial statements based on audit. The Office of the
Auditor General of Thailand conducted an audit in accordance with Thai Standards on
Auditing. Those standards require that The Office of the Auditor General of Thailand complies
with ethical requirements, plans and performs the audit to obtain reasonable assurance about
whether the consolidated and separate financial statements are free from material misstatement.
An audit involves performing procedures to obtain audit evidence about the amounts
and disclosures in the financial statements. The procedures selected depend on the auditor’s
judgment, including the assessment of the risks of material misstatement of the financial
statements, whether due to fraud or error. In making those risk assessments, the auditor
considers internal control relevant to the entity’s preparation and fair presentation of the
financial statements in order to design audit procedures that are appropriate in the
circumstances, but not for the purpose of expressing an opinion on the effectiveness of the
entity’s internal control. An audit also includes evaluating the appropriateness of accounting
(UNOFFICIAL TRANSLATION)
policies used and the reasonableness of accounting estimates made by management, as well as
evaluating the overall presentation of the financial statements.
The Office of the Auditor General of Thailand believes that the audit evidence obtained
is sufficient and appropriate to provide a basis for an audit opinion.
Conclusion
In The Office of the Auditor General of Thailand’s opinion, the consolidated and
separate financial statements referred to above present fairly, in all material respects, the
financial position of PTT Public Company Limited and its subsidiaries and of PTT Public
Company Limited as at December 31, 2012, and its consolidated and separate results of
operations and its cash flows for the year then ended, presented in accordance with Thai
Financial Reporting Standards.
(Signed) Jiraporn Piriyakitpaiboon
(Jiraporn Piriyakitpaiboon)
Inspector General 1
(Signed) Doungporn Muennuch
(Doungporn Muennuch)
Director of Financial Audit Office No.7
Office of the Auditor General February 22, 2013
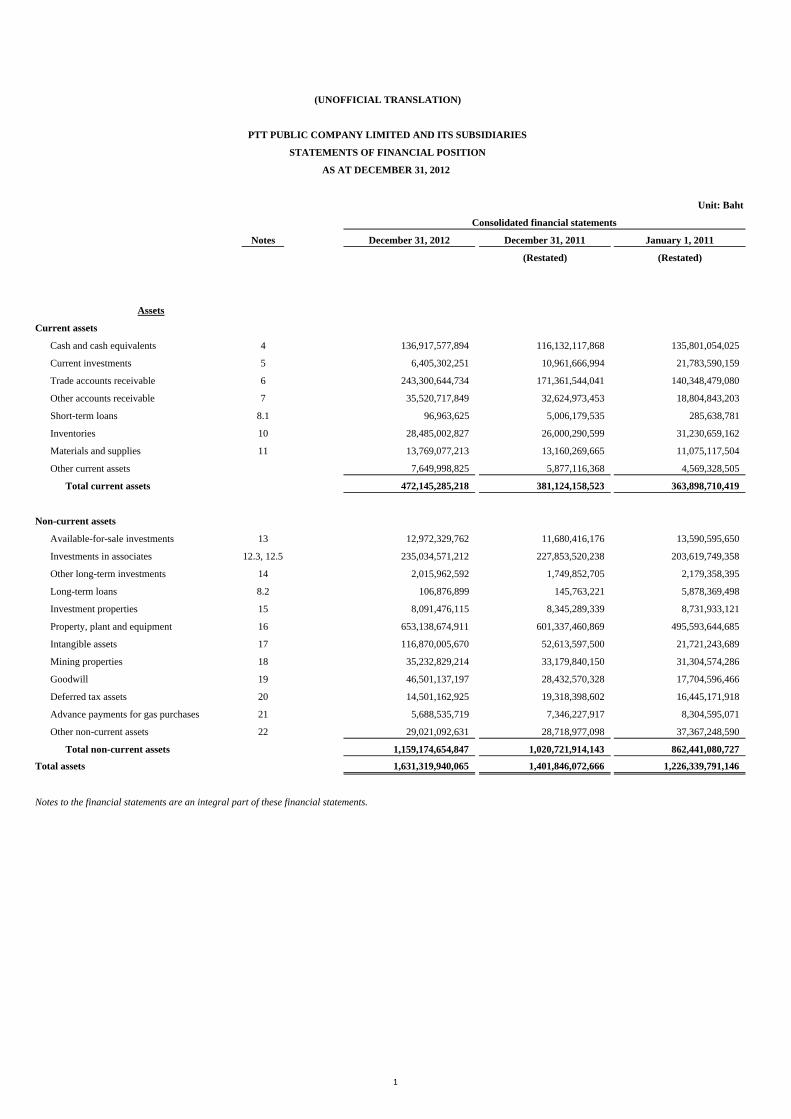
Unit: Baht
Notes December 31, 2012 December 31, 2011 January 1, 2011
(Restated) (Restated)
Assets
Current assets
Cash and cash equivalents 4 136,917,577,894 116,132,117,868 135,801,054,025
Current investments 5 6,405,302,251 10,961,666,994 21,783,590,159
Trade accounts receivable 6 243,300,644,734 171,361,544,041 140,348,479,080
Other accounts receivable 7 35,520,717,849 32,624,973,453 18,804,843,203
Short-term loans 8.1 96,963,625 5,006,179,535 285,638,781
Inventories 10 28,485,002,827 26,000,290,599 31,230,659,162
Materials and supplies 11 13,769,077,213 13,160,269,665 11,075,117,504
Other current assets 7,649,998,825 5,877,116,368 4,569,328,505
Total current assets 472,145,285,218 381,124,158,523 363,898,710,419
Non-current assets
Available-for-sale investments 13 12,972,329,762 11,680,416,176 13,590,595,650
Investments in associates 12.3, 12.5 235,034,571,212 227,853,520,238 203,619,749,358
Other long-term investments 14 2,015,962,592 1,749,852,705 2,179,358,395
Long-term loans 8.2 106,876,899 145,763,221 5,878,369,498
Investment properties 15 8,091,476,115 8,345,289,339 8,731,933,121
Property, plant and equipment 16 653,138,674,911 601,337,460,869 495,593,644,685
Intangible assets 17 116,870,005,670 52,613,597,500 21,721,243,689
Mining properties 18 35,232,829,214 33,179,840,150 31,304,574,286
Goodwill 19 46,501,137,197 28,432,570,328 17,704,596,466
Deferred tax assets 20 14,501,162,925 19,318,398,602 16,445,171,918
Advance payments for gas purchases 21 5,688,535,719 7,346,227,917 8,304,595,071
Other non-current assets 22 29,021,092,631 28,718,977,098 37,367,248,590
Total non-current assets 1,159,174,654,847 1,020,721,914,143 862,441,080,727
Total assets 1,631,319,940,065 1,401,846,072,666 1,226,339,791,146
Notes to the financial statements are an integral part of these financial statements.
(UNOFFICIAL TRANSLATION)
PTT PUBLIC COMPANY LIMITED AND ITS SUBSIDIARIES
STATEMENTS OF FINANCIAL POSITION
AS AT DECEMBER 31, 2012
Consolidated financial statements
1
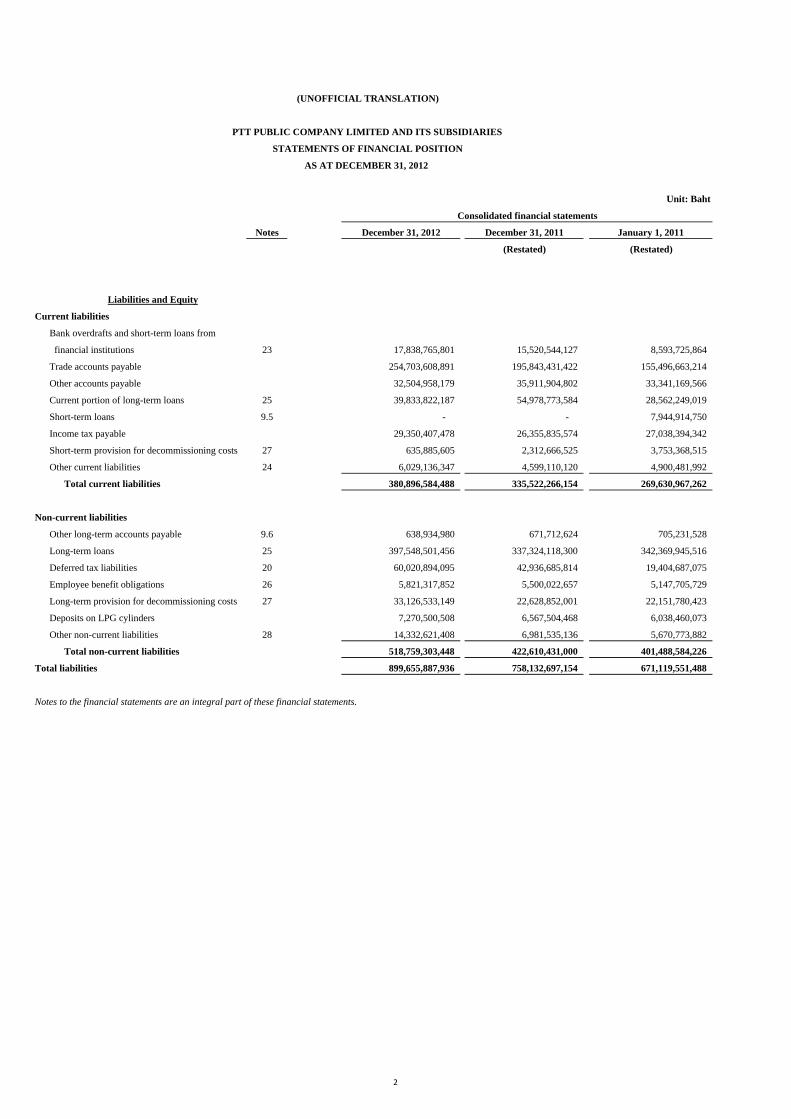
Unit: Baht
Notes December 31, 2012 December 31, 2011 January 1, 2011
(Restated) (Restated)
Liabilities and Equity
Current liabilities
Bank overdrafts and short-term loans from
financial institutions 23 17,838,765,801 15,520,544,127 8,593,725,864
Trade accounts payable 254,703,608,891 195,843,431,422 155,496,663,214
Other accounts payable 32,504,958,179 35,911,904,802 33,341,169,566
Current portion of long-term loans 25 39,833,822,187 54,978,773,584 28,562,249,019
Short-term loans 9.5 - - 7,944,914,750
Income tax payable 29,350,407,478 26,355,835,574 27,038,394,342
Short-term provision for decommissioning costs 27 635,885,605 2,312,666,525 3,753,368,515
Other current liabilities 24 6,029,136,347 4,599,110,120 4,900,481,992
Total current liabilities 380,896,584,488 335,522,266,154 269,630,967,262
Non-current liabilities
Other long-term accounts payable 9.6 638,934,980 671,712,624 705,231,528
Long-term loans 25 397,548,501,456 337,324,118,300 342,369,945,516
Deferred tax liabilities 20 60,020,894,095 42,936,685,814 19,404,687,075
Employee benefit obligations 26 5,821,317,852 5,500,022,657 5,147,705,729
Long-term provision for decommissioning costs 27 33,126,533,149 22,628,852,001 22,151,780,423
Deposits on LPG cylinders 7,270,500,508 6,567,504,468 6,038,460,073
Other non-current liabilities 28 14,332,621,408 6,981,535,136 5,670,773,882
Total non-current liabilities 518,759,303,448 422,610,431,000 401,488,584,226
Total liabilities 899,655,887,936 758,132,697,154 671,119,551,488
Notes to the financial statements are an integral part of these financial statements.
(UNOFFICIAL TRANSLATION)
PTT PUBLIC COMPANY LIMITED AND ITS SUBSIDIARIES
STATEMENTS OF FINANCIAL POSITION
AS AT DECEMBER 31, 2012
Consolidated financial statements
2
Unit: Baht
Notes December 31, 2012 December 31, 2011 January 1, 2011
(Restated) (Restated)
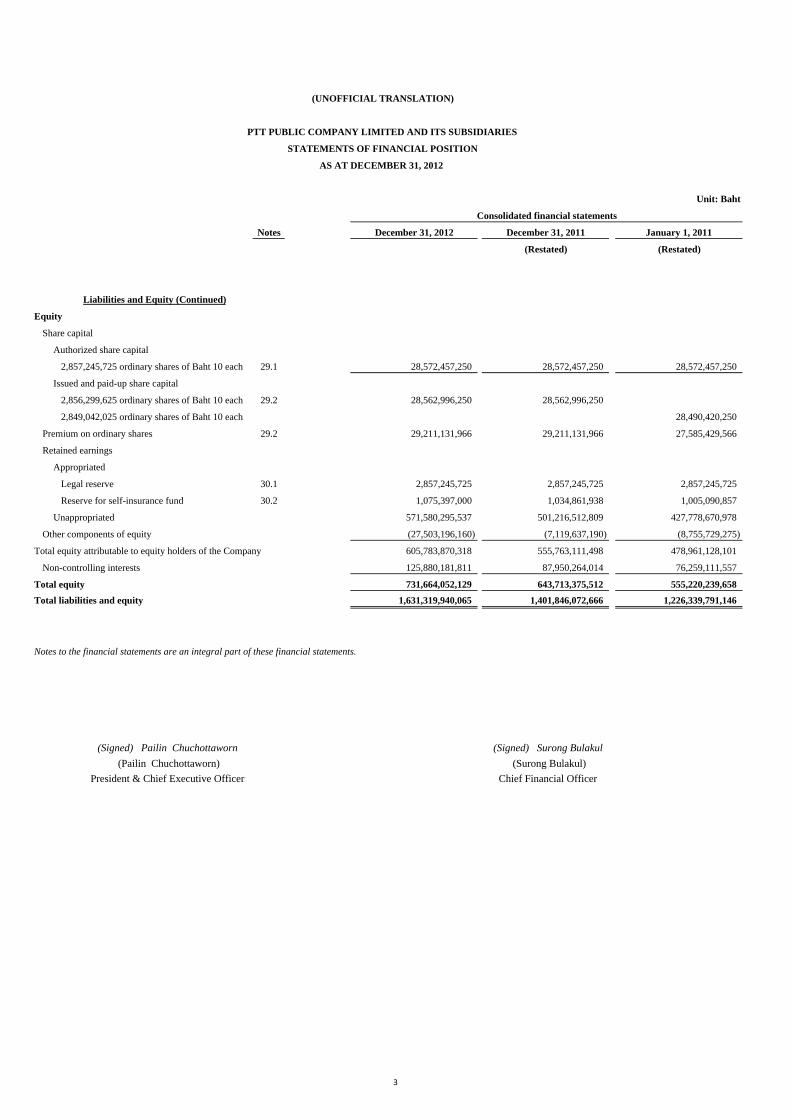
Liabilities and Equity (Continued)
Equity
Share capital
Authorized share capital
2,857,245,725 ordinary shares of Baht 10 each 29.1 28,572,457,250 28,572,457,250 28,572,457,250
Issued and paid-up share capital
2,856,299,625 ordinary shares of Baht 10 each 29.2 28,562,996,250 28,562,996,250
2,849,042,025 ordinary shares of Baht 10 each 28,490,420,250
Premium on ordinary shares 29.2 29,211,131,966 29,211,131,966 27,585,429,566
Retained earnings
Appropriated
Legal reserve 30.1 2,857,245,725 2,857,245,725 2,857,245,725
Reserve for self-insurance fund 30.2 1,075,397,000 1,034,861,938 1,005,090,857
Unappropriated 571,580,295,537 501,216,512,809 427,778,670,978
Other components of equity (27,503,196,160) (7,119,637,190) (8,755,729,275)
Total equity attributable to equity holders of the Company 605,783,870,318 555,763,111,498 478,961,128,101
Non-controlling interests 125,880,181,811 87,950,264,014 76,259,111,557
Total equity 731,664,052,129 643,713,375,512 555,220,239,658 Total liabilities and equity 1,631,319,940,065 1,401,846,072,666 1,226,339,791,146
- - -
Notes to the financial statements are an integral part of these financial statements.
(UNOFFICIAL TRANSLATION)
PTT PUBLIC COMPANY LIMITED AND ITS SUBSIDIARIES
STATEMENTS OF FINANCIAL POSITION
AS AT DECEMBER 31, 2012
Consolidated financial statements
(Signed) Surong Bulakul
(Surong Bulakul)Chief Financial Officer
(Signed) Pailin Chuchottaworn
(Pailin Chuchottaworn)President & Chief Executive Officer
3
Unit: Baht
Notes December 31, 2012 December 31, 2011
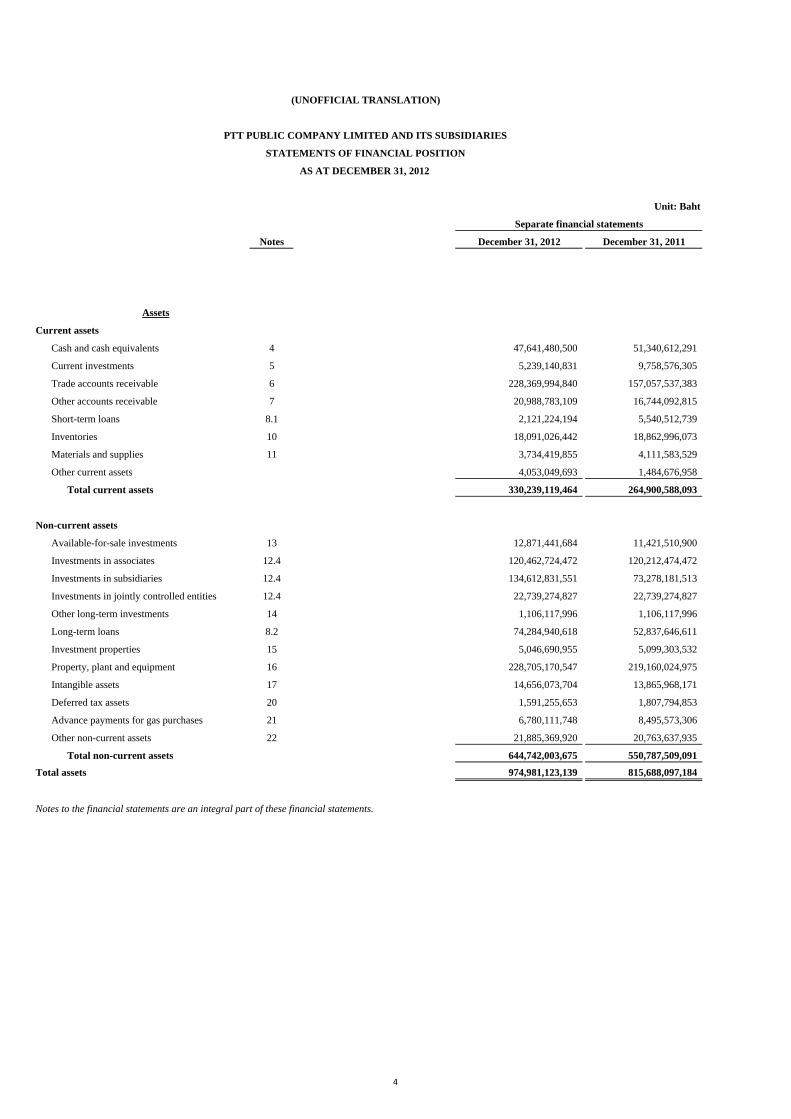
Assets
Current assets
Cash and cash equivalents 4 47,641,480,500 51,340,612,291
Current investments 5 5,239,140,831 9,758,576,305
Trade accounts receivable 6 228,369,994,840 157,057,537,383
Other accounts receivable 7 20,988,783,109 16,744,092,815
Short-term loans 8.1 2,121,224,194 5,540,512,739
Inventories 10 18,091,026,442 18,862,996,073
Materials and supplies 11 3,734,419,855 4,111,583,529
Other current assets 4,053,049,693 1,484,676,958
Total current assets 330,239,119,464 264,900,588,093
Non-current assets
Available-for-sale investments 13 12,871,441,684 11,421,510,900
Investments in associates 12.4 120,462,724,472 120,212,474,472
Investments in subsidiaries 12.4 134,612,831,551 73,278,181,513
Investments in jointly controlled entities 12.4 22,739,274,827 22,739,274,827
Other long-term investments 14 1,106,117,996 1,106,117,996
Long-term loans 8.2 74,284,940,618 52,837,646,611
Investment properties 15 5,046,690,955 5,099,303,532
Property, plant and equipment 16 228,705,170,547 219,160,024,975
Intangible assets 17 14,656,073,704 13,865,968,171
Deferred tax assets 20 1,591,255,653 1,807,794,853
Advance payments for gas purchases 21 6,780,111,748 8,495,573,306
Other non-current assets 22 21,885,369,920 20,763,637,935
Total non-current assets 644,742,003,675 550,787,509,091
Total assets 974,981,123,139 815,688,097,184
Notes to the financial statements are an integral part of these financial statements.
(UNOFFICIAL TRANSLATION)
PTT PUBLIC COMPANY LIMITED AND ITS SUBSIDIARIES
STATEMENTS OF FINANCIAL POSITION
AS AT DECEMBER 31, 2012
Separate financial statements
4
Unit: Baht
Notes December 31, 2012 December 31, 2011
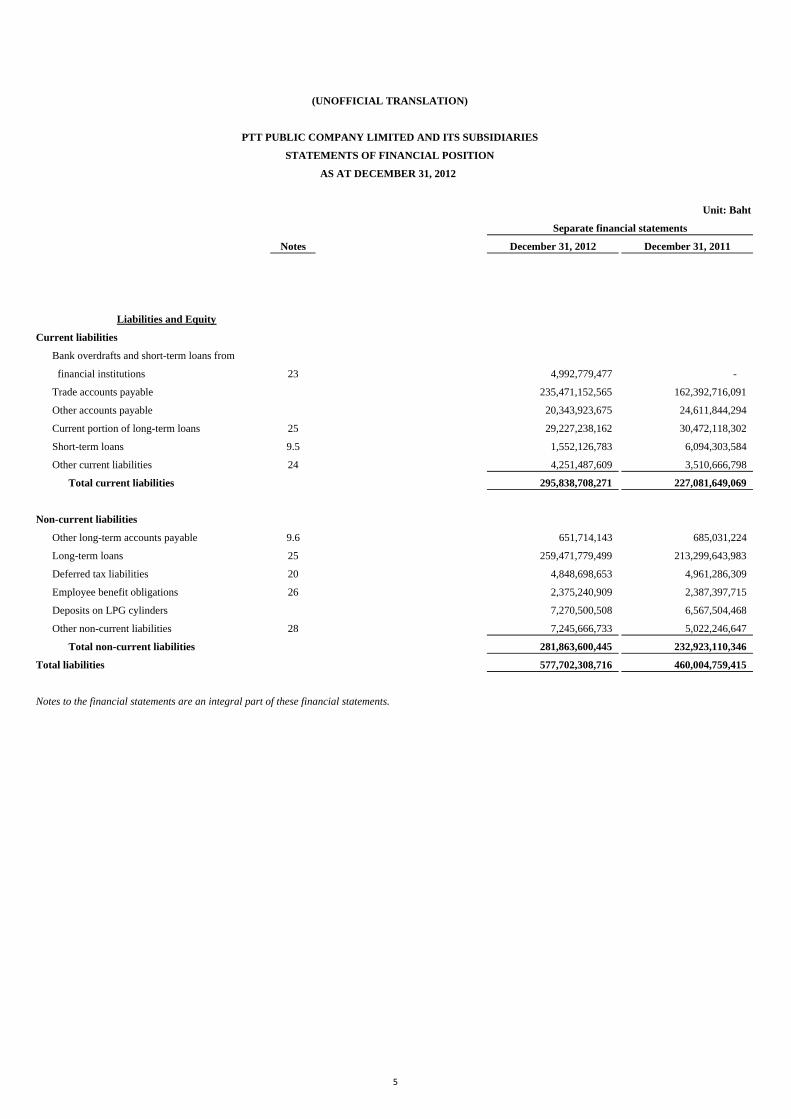
Liabilities and Equity
Current liabilities
Bank overdrafts and short-term loans from
financial institutions 23 4,992,779,477 -
Trade accounts payable 235,471,152,565 162,392,716,091
Other accounts payable 20,343,923,675 24,611,844,294
Current portion of long-term loans 25 29,227,238,162 30,472,118,302
Short-term loans 9.5 1,552,126,783 6,094,303,584
Other current liabilities 24 4,251,487,609 3,510,666,798
Total current liabilities 295,838,708,271 227,081,649,069
Non-current liabilities
Other long-term accounts payable 9.6 651,714,143 685,031,224
Long-term loans 25 259,471,779,499 213,299,643,983
Deferred tax liabilities 20 4,848,698,653 4,961,286,309
Employee benefit obligations 26 2,375,240,909 2,387,397,715
Deposits on LPG cylinders 7,270,500,508 6,567,504,468
Other non-current liabilities 28 7,245,666,733 5,022,246,647
Total non-current liabilities 281,863,600,445 232,923,110,346
Total liabilities 577,702,308,716 460,004,759,415
Notes to the financial statements are an integral part of these financial statements.
(UNOFFICIAL TRANSLATION)
PTT PUBLIC COMPANY LIMITED AND ITS SUBSIDIARIES
STATEMENTS OF FINANCIAL POSITION
AS AT DECEMBER 31, 2012
Separate financial statements
5
Unit: Baht
Notes December 31, 2012 December 31, 2011
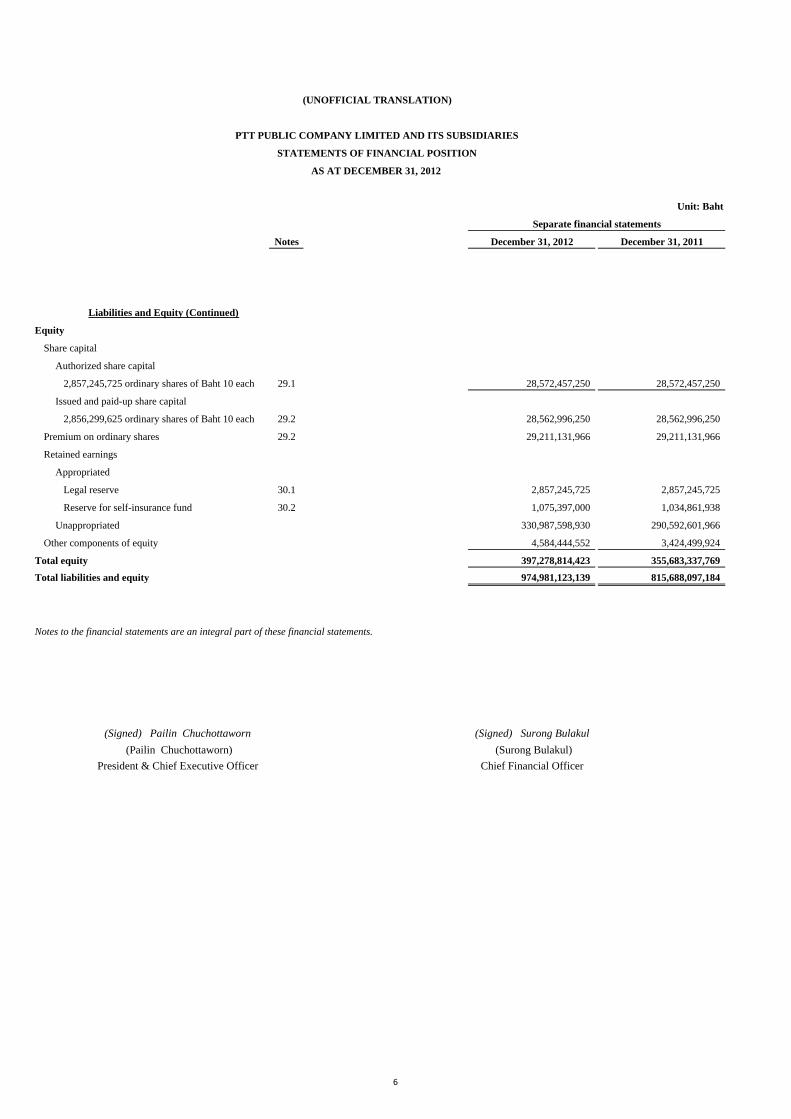
Liabilities and Equity (Continued)
Equity
Share capital
Authorized share capital
2,857,245,725 ordinary shares of Baht 10 each 29.1 28,572,457,250 28,572,457,250
Issued and paid-up share capital
2,856,299,625 ordinary shares of Baht 10 each 29.2 28,562,996,250 28,562,996,250
Premium on ordinary shares 29.2 29,211,131,966 29,211,131,966
Retained earnings
Appropriated
Legal reserve 30.1 2,857,245,725 2,857,245,725
Reserve for self-insurance fund 30.2 1,075,397,000 1,034,861,938
Unappropriated 330,987,598,930 290,592,601,966
Other components of equity 4,584,444,552 3,424,499,924
Total equity 397,278,814,423 355,683,337,769
Total liabilities and equity 974,981,123,139 815,688,097,184
- -
Notes to the financial statements are an integral part of these financial statements.
(Signed) Pailin Chuchottaworn
(Pailin Chuchottaworn)President & Chief Executive Officer
(Signed) Surong Bulakul
(Surong Bulakul)Chief Financial Officer
(UNOFFICIAL TRANSLATION)
PTT PUBLIC COMPANY LIMITED AND ITS SUBSIDIARIES
STATEMENTS OF FINANCIAL POSITION
AS AT DECEMBER 31, 2012
Separate financial statements
6
Unit: Baht
Notes 2012 2011 2012 2011
(Restated)
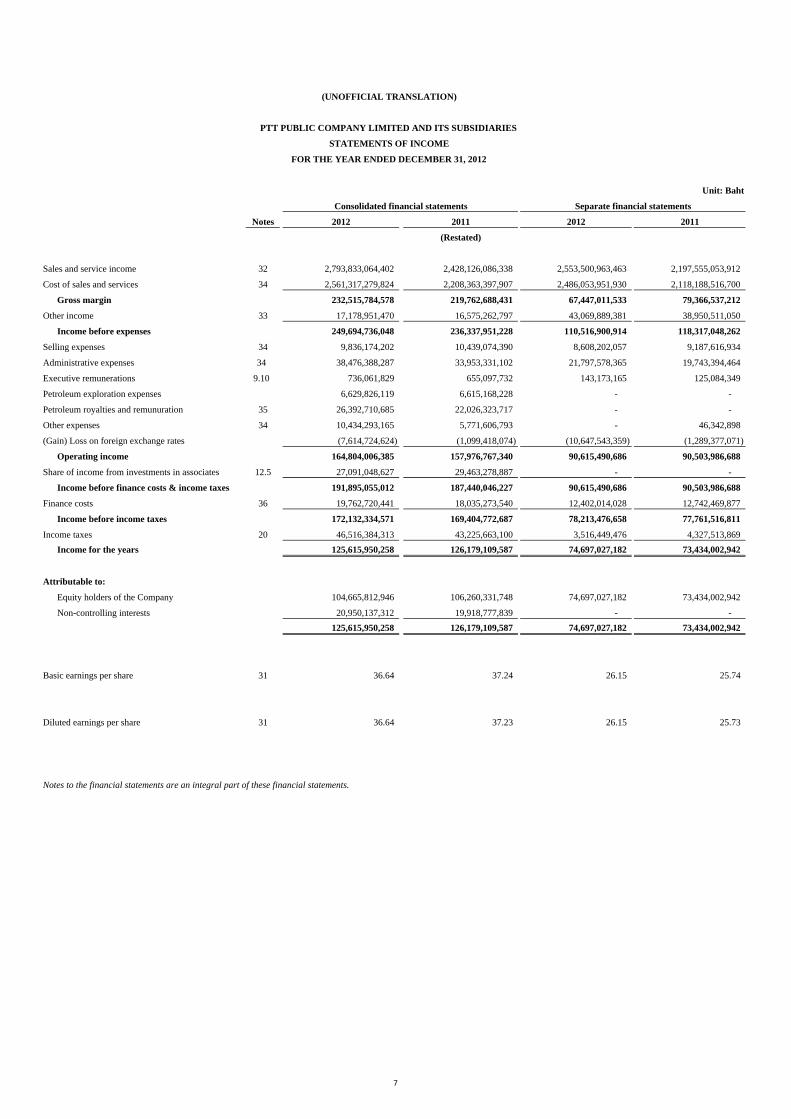
Sales and service income 32 2,793,833,064,402 2,428,126,086,338 2,553,500,963,463 2,197,555,053,912
Cost of sales and services 34 2,561,317,279,824 2,208,363,397,907 2,486,053,951,930 2,118,188,516,700
Gross margin 232,515,784,578 219,762,688,431 67,447,011,533 79,366,537,212
Other income 33 17,178,951,470 16,575,262,797 43,069,889,381 38,950,511,050
Income before expenses 249,694,736,048 236,337,951,228 110,516,900,914 118,317,048,262
Selling expenses 34 9,836,174,202 10,439,074,390 8,608,202,057 9,187,616,934
Administrative expenses 34 38,476,388,287 33,953,331,102 21,797,578,365 19,743,394,464
Executive remunerations 9.10 736,061,829 655,097,732 143,173,165 125,084,349
Petroleum exploration expenses 6,629,826,119 6,615,168,228 - -
Petroleum royalties and remunuration 35 26,392,710,685 22,026,323,717 - -
Other expenses 34 10,434,293,165 5,771,606,793 - 46,342,898
(Gain) Loss on foreign exchange rates (7,614,724,624) (1,099,418,074) (10,647,543,359) (1,289,377,071)
Operating income 164,804,006,385 157,976,767,340 90,615,490,686 90,503,986,688
Share of income from investments in associates 12.5 27,091,048,627 29,463,278,887 - -
Income before finance costs & income taxes 191,895,055,012 187,440,046,227 90,615,490,686 90,503,986,688
Finance costs 36 19,762,720,441 18,035,273,540 12,402,014,028 12,742,469,877
Income before income taxes 172,132,334,571 169,404,772,687 78,213,476,658 77,761,516,811
Income taxes 20 46,516,384,313 43,225,663,100 3,516,449,476 4,327,513,869 Income for the years 125,615,950,258 126,179,109,587 74,697,027,182 73,434,002,942
Attributable to:
Equity holders of the Company 104,665,812,946 106,260,331,748 74,697,027,182 73,434,002,942
Non-controlling interests 20,950,137,312 19,918,777,839 - - 125,615,950,258 126,179,109,587 74,697,027,182 73,434,002,942
Basic earnings per share 31 36.64 37.24 26.15 25.74
Diluted earnings per share 31 36.64 37.23 26.15 25.73
Notes to the financial statements are an integral part of these financial statements.
(UNOFFICIAL TRANSLATION)
PTT PUBLIC COMPANY LIMITED AND ITS SUBSIDIARIES
STATEMENTS OF INCOME
FOR THE YEAR ENDED DECEMBER 31, 2012
Consolidated financial statements Separate financial statements
7
Unit: Baht
2012 2011 2012 2011
(Restated)
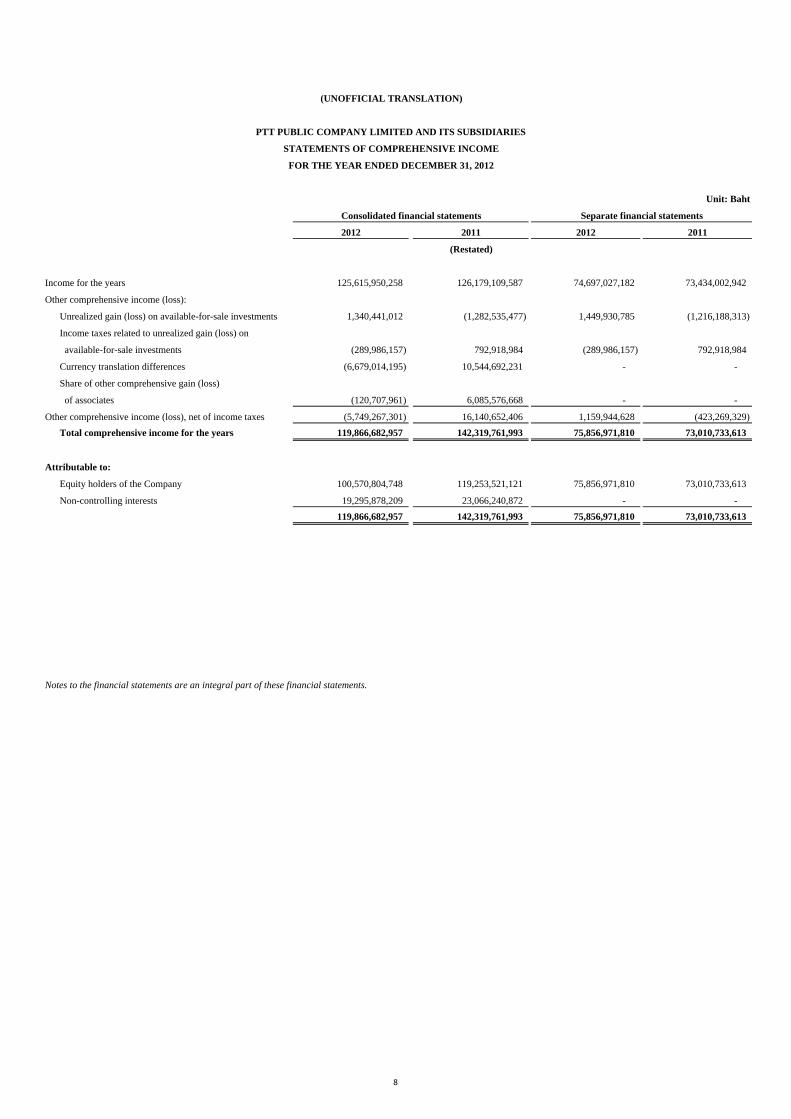
Income for the years 125,615,950,258 126,179,109,587 74,697,027,182 73,434,002,942
Other comprehensive income (loss):
Unrealized gain (loss) on available-for-sale investments 1,340,441,012 (1,282,535,477) 1,449,930,785 (1,216,188,313)
Income taxes related to unrealized gain (loss) on
available-for-sale investments (289,986,157) 792,918,984 (289,986,157) 792,918,984
Currency translation differences (6,679,014,195) 10,544,692,231 - -
Share of other comprehensive gain (loss)
of associates (120,707,961) 6,085,576,668 - -
Other comprehensive income (loss), net of income taxes (5,749,267,301) 16,140,652,406 1,159,944,628 (423,269,329) Total comprehensive income for the years 119,866,682,957 142,319,761,993 75,856,971,810 73,010,733,613
Attributable to:
Equity holders of the Company 100,570,804,748 119,253,521,121 75,856,971,810 73,010,733,613
Non-controlling interests 19,295,878,209 23,066,240,872 - - 119,866,682,957 142,319,761,993 75,856,971,810 73,010,733,613
Notes to the financial statements are an integral part of these financial statements.
(UNOFFICIAL TRANSLATION)
PTT PUBLIC COMPANY LIMITED AND ITS SUBSIDIARIES
STATEMENTS OF COMPREHENSIVE INCOME
FOR THE YEAR ENDED DECEMBER 31, 2012
Consolidated financial statements Separate financial statements
8
Unit: Baht
Share of Surplus (Deficit) from Total equity
Reserve for Currency other comprehensive the change in Total other attributable to
Issued and paid-up Premium on Legal self-insurance translation Available-for-sale gain (loss) the ownership interests components equity holders Non-controlling Total
Notes share capital share capital reserve fund Unappropriated differences investments of associates in subsidiaries of equity of the Company interests equity
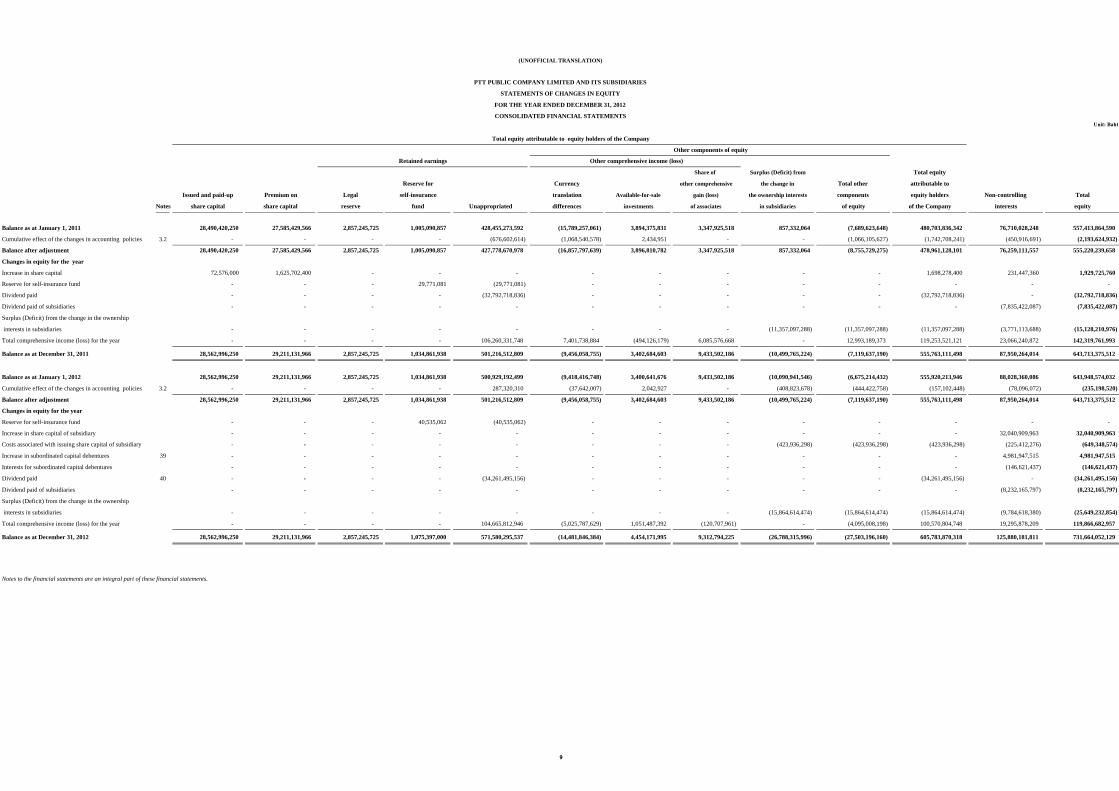
Balance as at January 1, 2011 28,490,420,250 27,585,429,566 2,857,245,725 1,005,090,857 428,455,273,592 (15,789,257,061) 3,894,375,831 3,347,925,518 857,332,064 (7,689,623,648) 480,703,836,342 76,710,028,248 557,413,864,590
Cumulative effect of the changes in accounting policies 3.2 - - - - (676,602,614) (1,068,540,578) 2,434,951 - - (1,066,105,627) (1,742,708,241) (450,916,691) (2,193,624,932)
Balance after adjustment 28,490,420,250 27,585,429,566 2,857,245,725 1,005,090,857 427,778,670,978 (16,857,797,639) 3,896,810,782 3,347,925,518 857,332,064 (8,755,729,275) 478,961,128,101 76,259,111,557 555,220,239,658
Changes in equity for the year
Increase in share capital 72,576,000 1,625,702,400 - - - - - - - - 1,698,278,400 231,447,360 1,929,725,760
Reserve for self-insurance fund - - - 29,771,081 (29,771,081) - - - - - - - -
Dividend paid - - - - (32,792,718,836) - - - - - (32,792,718,836) - (32,792,718,836)
Dividend paid of subsidiaries - - - - - - - - - - - (7,835,422,087) (7,835,422,087)
Surplus (Deficit) from the change in the ownership
interests in subsidiaries - - - - - - - - (11,357,097,288) (11,357,097,288) (11,357,097,288) (3,771,113,688) (15,128,210,976)
Total comprehensive income (loss) for the year - - - - 106,260,331,748 7,401,738,884 (494,126,179) 6,085,576,668 - 12,993,189,373 119,253,521,121 23,066,240,872 142,319,761,993
Balance as at December 31, 2011 28,562,996,250 29,211,131,966 2,857,245,725 1,034,861,938 501,216,512,809 (9,456,058,755) 3,402,684,603 9,433,502,186 (10,499,765,224) (7,119,637,190) 555,763,111,498 87,950,264,014 643,713,375,512
Balance as at January 1, 2012 28,562,996,250 29,211,131,966 2,857,245,725 1,034,861,938 500,929,192,499 (9,418,416,748) 3,400,641,676 9,433,502,186 (10,090,941,546) (6,675,214,432) 555,920,213,946 88,028,360,086 643,948,574,032
Cumulative effect of the changes in accounting policies 3.2 - - - - 287,320,310 (37,642,007) 2,042,927 - (408,823,678) (444,422,758) (157,102,448) (78,096,072) (235,198,520)
Balance after adjustment 28,562,996,250 29,211,131,966 2,857,245,725 1,034,861,938 501,216,512,809 (9,456,058,755) 3,402,684,603 9,433,502,186 (10,499,765,224) (7,119,637,190) 555,763,111,498 87,950,264,014 643,713,375,512
Other components of equity
Retained earnings Other comprehensive income (loss)
(UNOFFICIAL TRANSLATION)
PTT PUBLIC COMPANY LIMITED AND ITS SUBSIDIARIES
STATEMENTS OF CHANGES IN EQUITY
FOR THE YEAR ENDED DECEMBER 31, 2012
CONSOLIDATED FINANCIAL STATEMENTS
Total equity attributable to equity holders of the Company
9
j , , , , , , , , , , , , , , , ( , , , ) , , , , , , ( , , , ) ( , , , ) , , , , , , , , ,
Changes in equity for the year
Reserve for self-insurance fund - - - 40,535,062 (40,535,062) - - - - - - - -
Increase in share capital of subsidiary - - - - - - - - - - - 32,040,909,963 32,040,909,963
Costs associated with issuing share capital of subsidiary - - - - - - - - (423,936,298) (423,936,298) (423,936,298) (225,412,276) (649,348,574)
Increase in subordinated capital debentures 39 - - - - - - - - - - - 4,981,947,515 4,981,947,515
Interests for subordinated capital debentures - - - - - - - - - - - (146,621,437) (146,621,437)
Dividend paid 40 - - - - (34,261,495,156) - - - - - (34,261,495,156) - (34,261,495,156)
Dividend paid of subsidiaries - - - - - - - - - - - (8,232,165,797) (8,232,165,797)
Surplus (Deficit) from the change in the ownership
interests in subsidiaries - - - - - - - - (15,864,614,474) (15,864,614,474) (15,864,614,474) (9,784,618,380) (25,649,232,854)
Total comprehensive income (loss) for the year - - - - 104,665,812,946 (5,025,787,629) 1,051,487,392 (120,707,961) - (4,095,008,198) 100,570,804,748 19,295,878,209 119,866,682,957
Balance as at December 31, 2012 28,562,996,250 29,211,131,966 2,857,245,725 1,075,397,000 571,580,295,537 (14,481,846,384) 4,454,171,995 9,312,794,225 (26,788,315,996) (27,503,196,160) 605,783,870,318 125,880,181,811 731,664,052,129
Notes to the financial statements are an integral part of these financial statements.
9
Unit: Baht
Total other components of equity
Other comprehensive income (loss)
Reserve for
Issued and paid-up Premium on Legal self-insurance Available-for-sale Total
Notes share capital share capital reserve fund Unappropriated investments equity
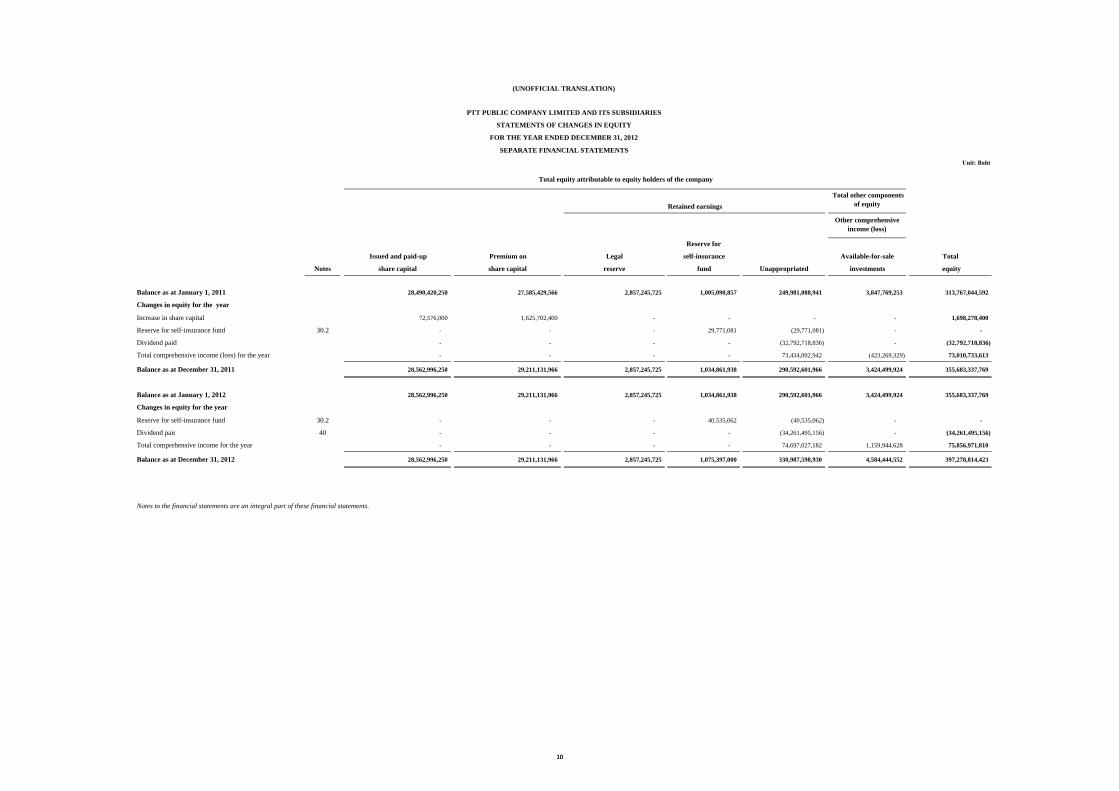
Balance as at January 1, 2011 28,490,420,250 27,585,429,566 2,857,245,725 1,005,090,857 249,981,088,941 3,847,769,253 313,767,044,592
Changes in equity for the year
Increase in share capital 72,576,000 1,625,702,400 - - - - 1,698,278,400
Reserve for self-insurance fund 30.2 - - - 29,771,081 (29,771,081) - -
Dividend paid - - - - (32,792,718,836) - (32,792,718,836)
Total comprehensive income (loss) for the year - - - - 73,434,002,942 (423,269,329) 73,010,733,613
Balance as at December 31, 2011 28,562,996,250 29,211,131,966 2,857,245,725 1,034,861,938 290,592,601,966 3,424,499,924 355,683,337,769
Balance as at January 1, 2012 28,562,996,250 29,211,131,966 2,857,245,725 1,034,861,938 290,592,601,966 3,424,499,924 355,683,337,769
Changes in equity for the year
Reserve for self-insurance fund 30.2 - - - 40,535,062 (40,535,062) - -
Retained earnings
(UNOFFICIAL TRANSLATION)
PTT PUBLIC COMPANY LIMITED AND ITS SUBSIDIARIES
STATEMENTS OF CHANGES IN EQUITY
FOR THE YEAR ENDED DECEMBER 31, 2012
SEPARATE FINANCIAL STATEMENTS
Total equity attributable to equity holders of the company
10
Dividend paid 40 - - - - (34,261,495,156) - (34,261,495,156)
Total comprehensive income for the year - - - - 74,697,027,182 1,159,944,628 75,856,971,810
Balance as at December 31, 2012 28,562,996,250 29,211,131,966 2,857,245,725 1,075,397,000 330,987,598,930 4,584,444,552 397,278,814,423
Notes to the financial statements are an integral part of these financial statements.
10
Unit: Baht
2012 2011 2012 2011
(Restated)
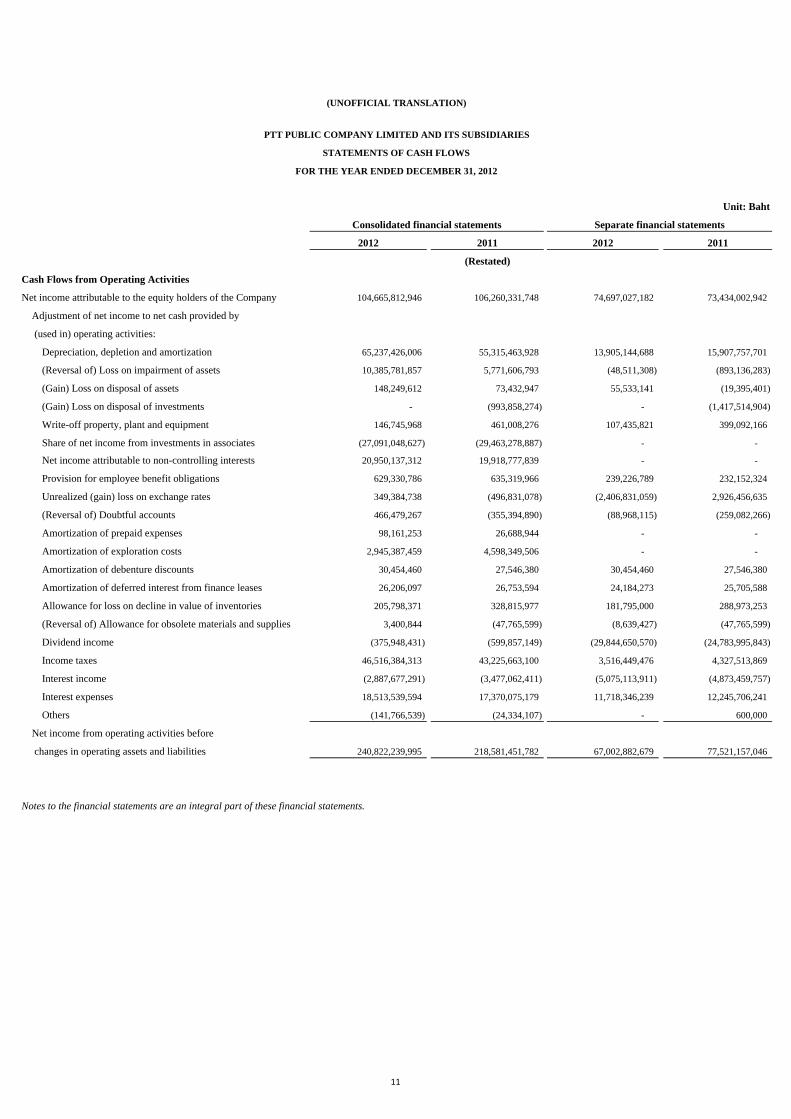
Cash Flows from Operating Activities
Net income attributable to the equity holders of the Company 104,665,812,946 106,260,331,748 74,697,027,182 73,434,002,942
Adjustment of net income to net cash provided by
(used in) operating activities:
Depreciation, depletion and amortization 65,237,426,006 55,315,463,928 13,905,144,688 15,907,757,701
(Reversal of) Loss on impairment of assets 10,385,781,857 5,771,606,793 (48,511,308) (893,136,283)
(Gain) Loss on disposal of assets 148,249,612 73,432,947 55,533,141 (19,395,401)
(Gain) Loss on disposal of investments - (993,858,274) - (1,417,514,904)
Write-off property, plant and equipment 146,745,968 461,008,276 107,435,821 399,092,166
Share of net income from investments in associates (27,091,048,627) (29,463,278,887) - -
Net income attributable to non-controlling interests 20,950,137,312 19,918,777,839 - -
Provision for employee benefit obligations 629,330,786 635,319,966 239,226,789 232,152,324
Unrealized (gain) loss on exchange rates 349,384,738 (496,831,078) (2,406,831,059) 2,926,456,635
(Reversal of) Doubtful accounts 466,479,267 (355,394,890) (88,968,115) (259,082,266)
Amortization of prepaid expenses 98,161,253 26,688,944 - -
Amortization of exploration costs 2,945,387,459 4,598,349,506 - -
Amortization of debenture discounts 30,454,460 27,546,380 30,454,460 27,546,380
Amortization of deferred interest from finance leases 26,206,097 26,753,594 24,184,273 25,705,588
Allowance for loss on decline in value of inventories 205,798,371 328,815,977 181,795,000 288,973,253
(Reversal of) Allowance for obsolete materials and supplies 3,400,844 (47,765,599) (8,639,427) (47,765,599)
Dividend income (375,948,431) (599,857,149) (29,844,650,570) (24,783,995,843)
Income taxes 46,516,384,313 43,225,663,100 3,516,449,476 4,327,513,869
Interest income (2,887,677,291) (3,477,062,411) (5,075,113,911) (4,873,459,757)
Interest expenses 18,513,539,594 17,370,075,179 11,718,346,239 12,245,706,241
Others (141,766,539) (24,334,107) - 600,000
Net income from operating activities before
changes in operating assets and liabilities 240,822,239,995 218,581,451,782 67,002,882,679 77,521,157,046
Notes to the financial statements are an integral part of these financial statements.
(UNOFFICIAL TRANSLATION)
PTT PUBLIC COMPANY LIMITED AND ITS SUBSIDIARIES
STATEMENTS OF CASH FLOWS
FOR THE YEAR ENDED DECEMBER 31, 2012
Consolidated financial statements Separate financial statements
11
Unit: Baht
2012 2011 2012 2011
(Restated)
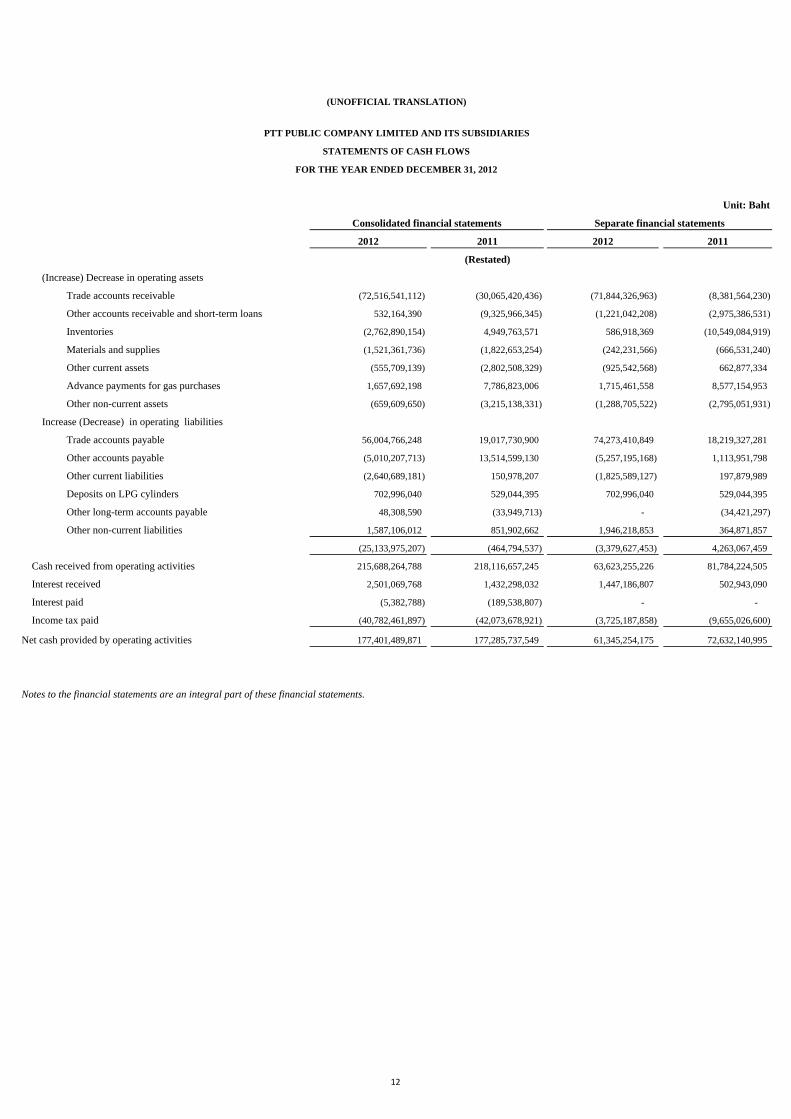
(Increase) Decrease in operating assets
Trade accounts receivable (72,516,541,112) (30,065,420,436) (71,844,326,963) (8,381,564,230)
Other accounts receivable and short-term loans 532,164,390 (9,325,966,345) (1,221,042,208) (2,975,386,531)
Inventories (2,762,890,154) 4,949,763,571 586,918,369 (10,549,084,919)
Materials and supplies (1,521,361,736) (1,822,653,254) (242,231,566) (666,531,240)
Other current assets (555,709,139) (2,802,508,329) (925,542,568) 662,877,334
Advance payments for gas purchases 1,657,692,198 7,786,823,006 1,715,461,558 8,577,154,953
Other non-current assets (659,609,650) (3,215,138,331) (1,288,705,522) (2,795,051,931)
Increase (Decrease) in operating liabilities
Trade accounts payable 56,004,766,248 19,017,730,900 74,273,410,849 18,219,327,281
Other accounts payable (5,010,207,713) 13,514,599,130 (5,257,195,168) 1,113,951,798
Other current liabilities (2,640,689,181) 150,978,207 (1,825,589,127) 197,879,989
Deposits on LPG cylinders 702,996,040 529,044,395 702,996,040 529,044,395
Other long-term accounts payable 48,308,590 (33,949,713) - (34,421,297)
Other non-current liabilities 1,587,106,012 851,902,662 1,946,218,853 364,871,857
(25,133,975,207) (464,794,537) (3,379,627,453) 4,263,067,459
Cash received from operating activities 215,688,264,788 218,116,657,245 63,623,255,226 81,784,224,505
Interest received 2,501,069,768 1,432,298,032 1,447,186,807 502,943,090
Interest paid (5,382,788) (189,538,807) - -
Income tax paid (40,782,461,897) (42,073,678,921) (3,725,187,858) (9,655,026,600)
Net cash provided by operating activities 177,401,489,871 177,285,737,549 61,345,254,175 72,632,140,995
(UNOFFICIAL TRANSLATION)
PTT PUBLIC COMPANY LIMITED AND ITS SUBSIDIARIES
STATEMENTS OF CASH FLOWS
FOR THE YEAR ENDED DECEMBER 31, 2012
Consolidated financial statements Separate financial statements
Notes to the financial statements are an integral part of these financial statements.
12
Unit: Baht
2012 2011 2012 2011
(Restated)
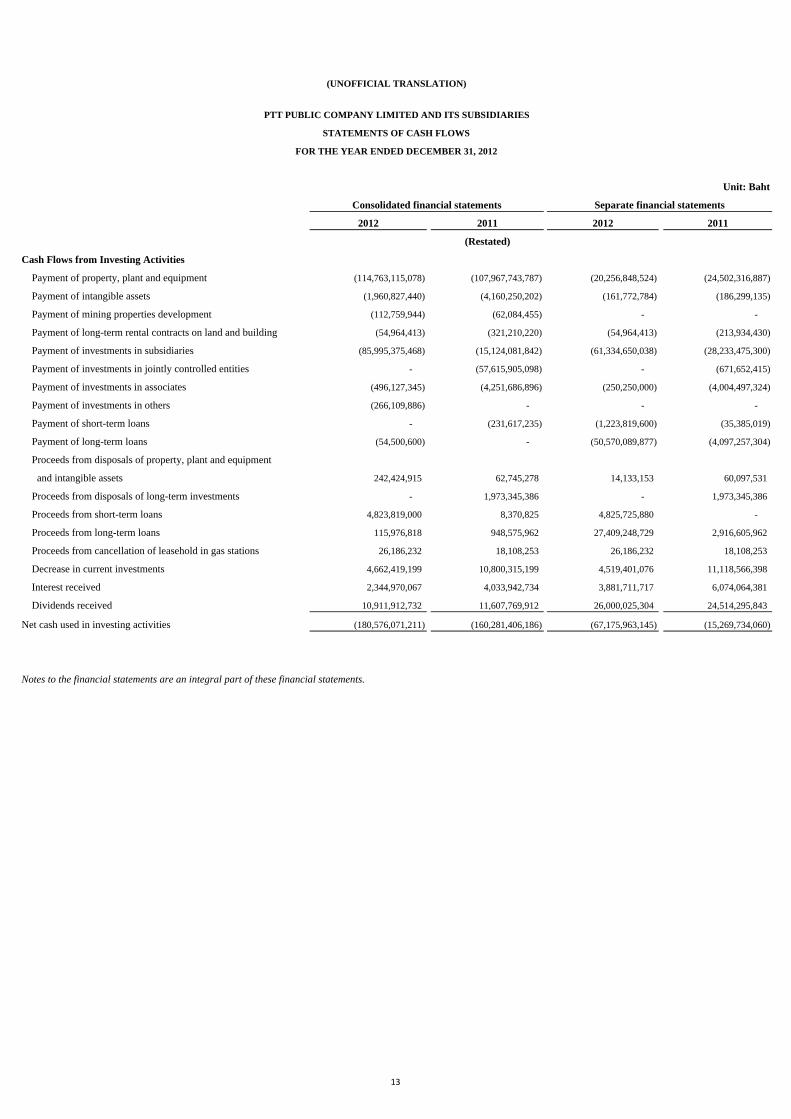
Cash Flows from Investing Activities
Payment of property, plant and equipment (114,763,115,078) (107,967,743,787) (20,256,848,524) (24,502,316,887)
Payment of intangible assets (1,960,827,440) (4,160,250,202) (161,772,784) (186,299,135)
Payment of mining properties development (112,759,944) (62,084,455) - -
Payment of long-term rental contracts on land and building (54,964,413) (321,210,220) (54,964,413) (213,934,430)
Payment of investments in subsidiaries (85,995,375,468) (15,124,081,842) (61,334,650,038) (28,233,475,300)
Payment of investments in jointly controlled entities - (57,615,905,098) - (671,652,415)
Payment of investments in associates (496,127,345) (4,251,686,896) (250,250,000) (4,004,497,324)
Payment of investments in others (266,109,886) - - -
Payment of short-term loans - (231,617,235) (1,223,819,600) (35,385,019)
Payment of long-term loans (54,500,600) - (50,570,089,877) (4,097,257,304)
Proceeds from disposals of property, plant and equipment
and intangible assets 242,424,915 62,745,278 14,133,153 60,097,531
Proceeds from disposals of long-term investments - 1,973,345,386 - 1,973,345,386
Proceeds from short-term loans 4,823,819,000 8,370,825 4,825,725,880 -
Proceeds from long-term loans 115,976,818 948,575,962 27,409,248,729 2,916,605,962
Proceeds from cancellation of leasehold in gas stations 26,186,232 18,108,253 26,186,232 18,108,253
Decrease in current investments 4,662,419,199 10,800,315,199 4,519,401,076 11,118,566,398
Interest received 2,344,970,067 4,033,942,734 3,881,711,717 6,074,064,381
Dividends received 10,911,912,732 11,607,769,912 26,000,025,304 24,514,295,843
Net cash used in investing activities (180,576,071,211) (160,281,406,186) (67,175,963,145) (15,269,734,060)
Separate financial statements
Notes to the financial statements are an integral part of these financial statements.
(UNOFFICIAL TRANSLATION)
PTT PUBLIC COMPANY LIMITED AND ITS SUBSIDIARIES
STATEMENTS OF CASH FLOWS
FOR THE YEAR ENDED DECEMBER 31, 2012
Consolidated financial statements
13
Unit: Baht
Notes 2012 2011 2012 2011
(Restated)
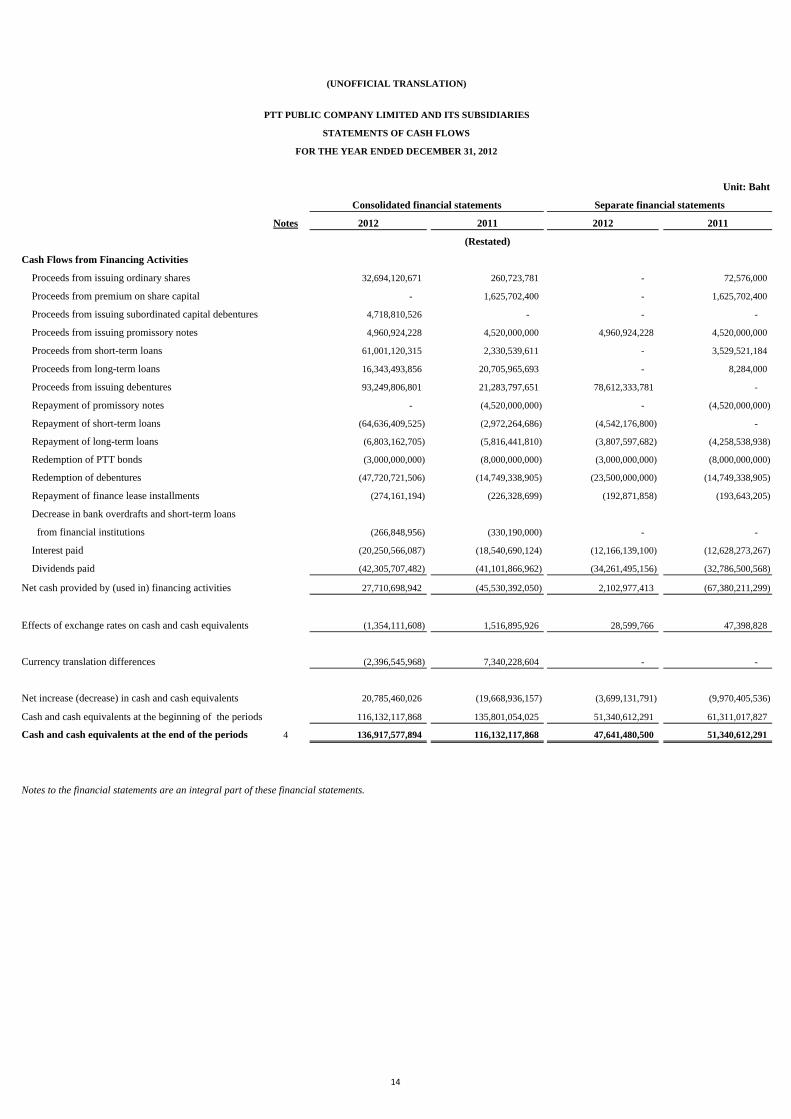
Cash Flows from Financing Activities
Proceeds from issuing ordinary shares 32,694,120,671 260,723,781 - 72,576,000
Proceeds from premium on share capital - 1,625,702,400 - 1,625,702,400
Proceeds from issuing subordinated capital debentures 4,718,810,526 - - -
Proceeds from issuing promissory notes 4,960,924,228 4,520,000,000 4,960,924,228 4,520,000,000
Proceeds from short-term loans 61,001,120,315 2,330,539,611 - 3,529,521,184
Proceeds from long-term loans 16,343,493,856 20,705,965,693 - 8,284,000
Proceeds from issuing debentures 93,249,806,801 21,283,797,651 78,612,333,781 -
Repayment of promissory notes - (4,520,000,000) - (4,520,000,000)
Repayment of short-term loans (64,636,409,525) (2,972,264,686) (4,542,176,800) -
Repayment of long-term loans (6,803,162,705) (5,816,441,810) (3,807,597,682) (4,258,538,938)
Redemption of PTT bonds (3,000,000,000) (8,000,000,000) (3,000,000,000) (8,000,000,000)
Redemption of debentures (47,720,721,506) (14,749,338,905) (23,500,000,000) (14,749,338,905)
Repayment of finance lease installments (274,161,194) (226,328,699) (192,871,858) (193,643,205)
Decrease in bank overdrafts and short-term loans
from financial institutions (266,848,956) (330,190,000) - -
Interest paid (20,250,566,087) (18,540,690,124) (12,166,139,100) (12,628,273,267)
Dividends paid (42,305,707,482) (41,101,866,962) (34,261,495,156) (32,786,500,568)
Net cash provided by (used in) financing activities 27,710,698,942 (45,530,392,050) 2,102,977,413 (67,380,211,299)
Effects of exchange rates on cash and cash equivalents (1,354,111,608) 1,516,895,926 28,599,766 47,398,828
Currency translation differences (2,396,545,968) 7,340,228,604 - -
Net increase (decrease) in cash and cash equivalents 20,785,460,026 (19,668,936,157) (3,699,131,791) (9,970,405,536)
Cash and cash equivalents at the beginning of the periods 116,132,117,868 135,801,054,025 51,340,612,291 61,311,017,827
Cash and cash equivalents at the end of the periods 4 136,917,577,894 116,132,117,868 47,641,480,500 51,340,612,291
(UNOFFICIAL TRANSLATION)
PTT PUBLIC COMPANY LIMITED AND ITS SUBSIDIARIES
STATEMENTS OF CASH FLOWS
FOR THE YEAR ENDED DECEMBER 31, 2012
Consolidated financial statements Separate financial statements
Notes to the financial statements are an integral part of these financial statements.
14
AUDITOR’S REPORT AND FINANCIAL STATEMENTS
OF
PTT PUBLIC COMPANY LIMITED AND ITS SUBSIDIARIES
FOR THE YEAR ENDED DECEMBER 31, 2012
(UNOFFICIAL TRANSLATION)
15
PTT PUBLIC COMPANY LIMITED AND ITS SUBSIDIARIES
NOTES TO FINANCIAL STATEMENTS FOR THE YEAR ENDED DECEMBER 31, 2012
NOTES CONTENTS
1 General Information
2 Basis of Financial Statements Preparation
3 Accounting Policies
4 Cash and Cash Equivalents
5 Current Investments
6 Trade Accounts Receivable
7 Other Accounts Receivable
8 Loans
9 Related Party Transactions
10 Inventories
11 Materials and Supplies
12 Investments in Subsidiaries, Jointly Controlled Entities and Associates
13 Available-for-sale Investments
14 Other Long-term Investments
15 Investment Properties
16 Property, Plant and Equipment
17 Intangible Assets
18 Mining Properties
19 Goodwill
20 Income Taxes and Deferred Taxes
21 Advance Payments for Gas Purchases
22 Other Non-current Assets
23 Bank Overdrafts and Short-term Loans from Financial Institutions
24 Other Current Liabilities
25 Long-term Loans
26 Employee Benefit Obligations
27 Provision for Decommissioning Costs
28 Other Non-current Liabilities
29 Share Capital
30 Reserves
31 Earnings per Share
32 Sales and Service Income
33 Other Income
34 Expenses by Nature
35 Petroleum Royalties and Remuneration
(UNOFFICIAL TRANSLATION)
16
PTT PUBLIC COMPANY LIMITED AND ITS SUBSIDIARIES
NOTES TO FINANCIAL STATEMENTS FOR THE YEAR ENDED DECEMBER 31, 2012
NOTES CONTENTS
36 Finance Costs
37 Segment Information
38 Disclosure of Financial Instruments
39 Subordinated Capital Debentures
40 Dividend Payment
41 Business Acquisition
42 Promotional Privileges
43 Proceeding regarding the Central Administrative Court’s Ordering
the Temporary Suspension of Projects in the Map Ta Phut Area
44 Proceeding regarding the Offshore Natural Gas Pipeline Leakage Incident
45 Commitments and Contingent Liabilities
46 Other Event
47 Events after the Reporting Period
(UNOFFICIAL TRANSLATION)
17
PTT PUBLIC COMPANY LIMITED AND ITS SUBSIDIARIES
NOTES TO FINANCIAL STATEMENTS FOR THE YEAR ENDED DECEMBER 31, 2012
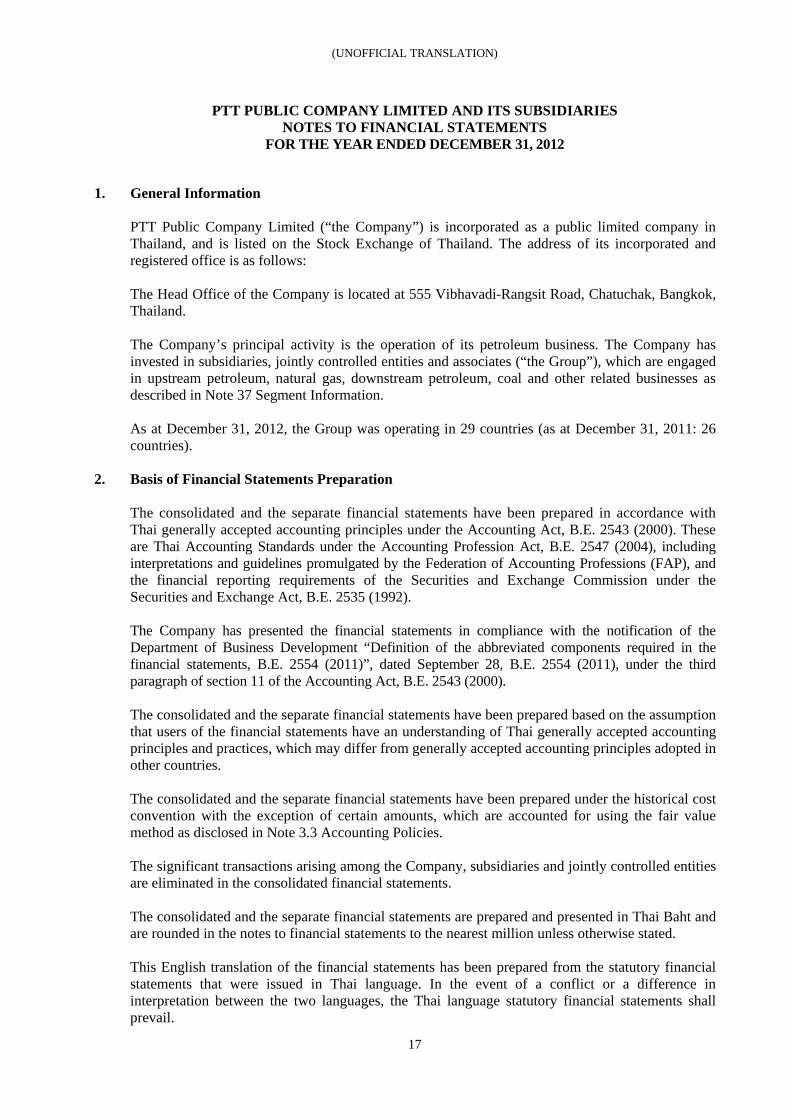
1. General Information PTT Public Company Limited (“the Company”) is incorporated as a public limited company in Thailand, and is listed on the Stock Exchange of Thailand. The address of its incorporated and registered office is as follows: The Head Office of the Company is located at 555 Vibhavadi-Rangsit Road, Chatuchak, Bangkok, Thailand. The Company’s principal activity is the operation of its petroleum business. The Company has invested in subsidiaries, jointly controlled entities and associates (“the Group”), which are engaged in upstream petroleum, natural gas, downstream petroleum, coal and other related businesses as described in Note 37 Segment Information. As at December 31, 2012, the Group was operating in 29 countries (as at December 31, 2011: 26 countries).
2. Basis of Financial Statements Preparation The consolidated and the separate financial statements have been prepared in accordance with Thai generally accepted accounting principles under the Accounting Act, B.E. 2543 (2000). These are Thai Accounting Standards under the Accounting Profession Act, B.E. 2547 (2004), including interpretations and guidelines promulgated by the Federation of Accounting Professions (FAP), and the financial reporting requirements of the Securities and Exchange Commission under the Securities and Exchange Act, B.E. 2535 (1992). The Company has presented the financial statements in compliance with the notification of the Department of Business Development “Definition of the abbreviated components required in the financial statements, B.E. 2554 (2011)”, dated September 28, B.E. 2554 (2011), under the third paragraph of section 11 of the Accounting Act, B.E. 2543 (2000). The consolidated and the separate financial statements have been prepared based on the assumption that users of the financial statements have an understanding of Thai generally accepted accounting principles and practices, which may differ from generally accepted accounting principles adopted in other countries. The consolidated and the separate financial statements have been prepared under the historical cost convention with the exception of certain amounts, which are accounted for using the fair value method as disclosed in Note 3.3 Accounting Policies. The significant transactions arising among the Company, subsidiaries and jointly controlled entities are eliminated in the consolidated financial statements. The consolidated and the separate financial statements are prepared and presented in Thai Baht and are rounded in the notes to financial statements to the nearest million unless otherwise stated. This English translation of the financial statements has been prepared from the statutory financial statements that were issued in Thai language. In the event of a conflict or a difference in interpretation between the two languages, the Thai language statutory financial statements shall prevail.
(UNOFFICIAL TRANSLATION)
18
3. Accounting
3.1 Thai Accounting Standards (TASs), Thai Financial Reporting Standards (TFRSs), Thai Accounting Standards Interpretations and Accounting Treatment Guidance by the Federation of Accounting Professions (FAP) Effective for accounting periods on or after January 1, 2013
Thai Accounting Standard No.12 Income Taxes Thai Accounting Standard No.20 Accounting for Government Grants
and Disclosure of Government Assistance Thai Accounting Standard No.21 (revised 2009) The Effects of Changes in Foreign
Exchange Rates Thai Financial Reporting Standard No.8 Operating Segments Thai Standing Interpretations No.10 Government Assistance – No Specific
Relation to Operating Activities Thai Standing Interpretations No.21 Income Taxes – Recovery of Revalued
Non – Depreciable Assets Thai Standing Interpretations No.25 Income Taxes – Changes in the Tax Status
of an Enterprise or its Shareholders Accounting Treatment Guidance Transfer of Financial Assets
Effective for accounting periods on or after January 1, 2014
Thai Financial Reporting Interpretation No.4 Determining Whether an Arrangement Contains a Lease
Thai Financial Reporting Interpretation No.12 Service Concession Arrangements Thai Financial Reporting Interpretation No.13 Customer Loyalty Programmes Thai Standing Interpretations No.29 Disclosure – Service Concession
Arrangements
The management of the Group has assessed and determined the potential impact of adopting these standards, interpretations and Accounting Treatment Guidance, which are effective for accounting periods beginning on or after January 1, 2013 and 2014 as mentioned above, except for the Thai Accounting Standard No.12 - Income and Taxes that was adopted and applied before the effective date, and concluded that they will have no material impact on the consolidated and the separate financial statements. Thai Accounting Standard No.21 (revised 2009) - The Effects of Changes in Foreign Exchange Rates - requires the Company to define functional currency as the currency of the primary economic environment in which the entity operates. Adopting this standard in 2013 will have no material impact on the consolidated and the separate financial statements. Nevertheless, two subsidiaries of the Group, which are PTT Exploration and Production Public Co., Ltd (PTTEP) and PTT International Co., Ltd (PTTI), adopted and applied this standard before the effective date since January 1, 2011 and January 1, 2012, respectively. Details are disclosed in Note 3.2.
(UNOFFICIAL TRANSLATION)
19
3. Accounting Policies (Continued) 3.2 Change in Functional Currency of a Domestic Subsidiary
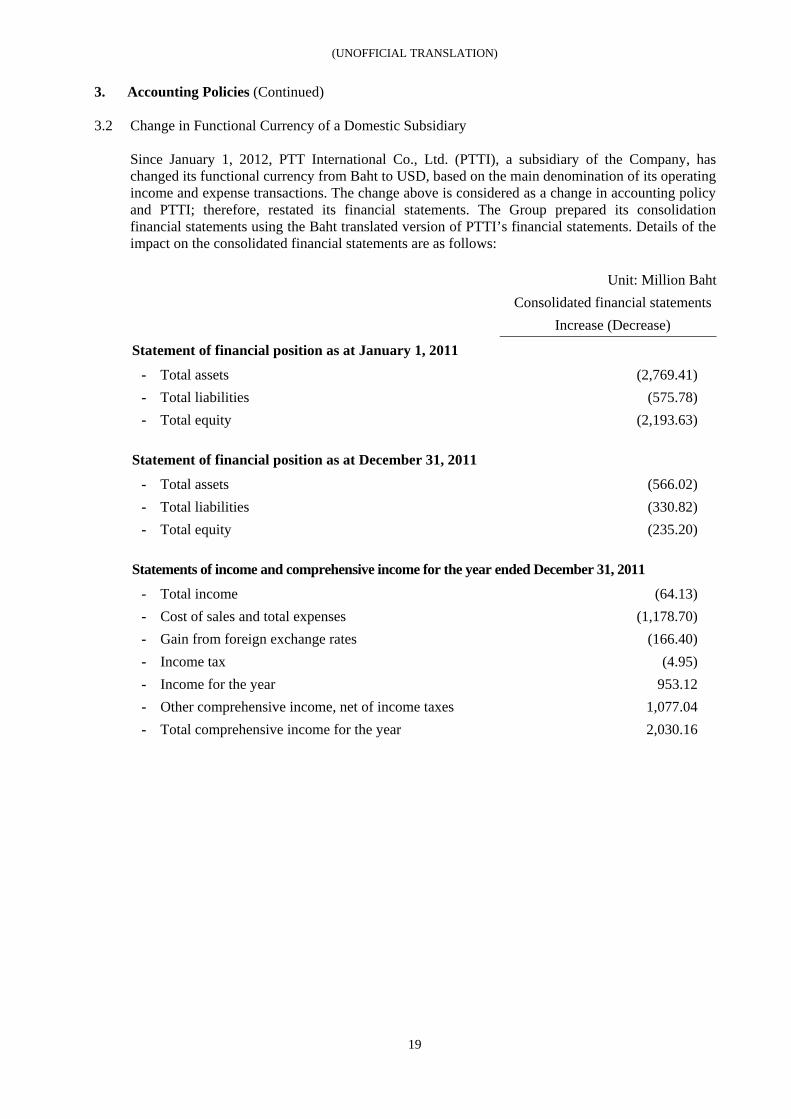
Since January 1, 2012, PTT International Co., Ltd. (PTTI), a subsidiary of the Company, has changed its functional currency from Baht to USD, based on the main denomination of its operating income and expense transactions. The change above is considered as a change in accounting policy and PTTI; therefore, restated its financial statements. The Group prepared its consolidation financial statements using the Baht translated version of PTTI’s financial statements. Details of the impact on the consolidated financial statements are as follows:
Unit: Million Baht Consolidated financial statements Increase (Decrease)
Statement of financial position as at January 1, 2011
- Total assets (2,769.41) - Total liabilities (575.78) - Total equity (2,193.63)
Statement of financial position as at December 31, 2011
- Total assets (566.02) - Total liabilities (330.82) - Total equity (235.20)
Statements of income and comprehensive income for the year ended December 31, 2011
- Total income (64.13) - Cost of sales and total expenses (1,178.70) - Gain from foreign exchange rates (166.40) - Income tax (4.95) - Income for the year 953.12 - Other comprehensive income, net of income taxes 1,077.04 - Total comprehensive income for the year 2,030.16
(UNOFFICIAL TRANSLATION)
20
3. Accounting Policies (Continued) 3.3 Significant Accounting Policies 3.3.1 Cash and Cash Equivalents
Cash and cash equivalents comprise cash on hand, deposits held at call with banks and other short-term highly liquid investments which have original maturities within three months. Bank overdrafts and short-term loans from financial institutions are included in current liabilities in the statement of financial position.
3.3.2 Trade Accounts and Other Accounts Receivable
Trade accounts and other accounts receivable are carried at net realizable value. Doubtful accounts receivable are estimated at percentages based on the aging of outstanding receivables at the statement of financial position date and expected non-collectible amounts are estimated based on the amount of outstanding receivables at the statement of financial position date, the receivables’ repayment history and their current financial status. Allowance for doubtful debt is recorded as selling and administrative expenses in the statements of income.
3.3.3 Inventories Inventories are stated at the lower of the cost of acquisition or net realizable value. Cost is determined using the weighted average cost method. The cost of inventory comprises total purchasing costs, payments related to purchasing, discounts, and quantity discounts as well as contributions to or compensation from the Oil Stabilization Fund. Net realizable value is the estimated selling price in the ordinary course of business, less the costs of completion and related selling expenses. When net realizable value of inventories is lower than cost of acquisition, it is presented under cost of goods sold in the statement of income. An allowance for impairment will be recognized for slow-moving, obsolete or defective inventories.
3.3.4 Materials and Supplies Materials and supplies are stated at cost determined by using the weighted average cost method, less allowance for obsolete, defective or unserviceable items.
3.3.5 Investments in subsidiaries Subsidiaries are those companies controlled by the parent company. Control exists when the parent company has the power, directly or indirectly, to govern the financial and operating policies of the subsidiaries so as to obtain benefits from their activities. The financial statements of subsidiaries are included in the consolidated financial statements from the date that control commences until the date that control ceases. The purchase method of accounting is used to account for the acquisition of subsidiaries. The cost of an acquisition is measured as the fair value of any consideration transferred, the recognized amount of any non-controlling interest in the acquiree, and the fair value of the existing equity interest as of the purchasing date (if the business combination is achieved in stages) • For each business combination, the Group measures the recognized amount of any non-controlling
interest in the acquiree at either the fair value or the non-controlling interest’s proportionate share of the net of identifiable assets of the acquiree.
• In the case of a business combination achieved in stages, the Group measures the acquisition-date fair value of the acquirer’s previously-held equity interest in the acquiree and recognized in the statement of income
• Costs related to the acquisition, other than those associated with the registration and issue of debt and equity securities, are recognized as expenses in the statement of income.
(UNOFFICIAL TRANSLATION)
21
3. Accounting Policies (Continued) 3.3 Significant Accounting Policies (Continued) 3.3.5 Investments in subsidiaries (Continued)
The Group measures the identifiable assets and liabilities acquired at fair value as of the acquisition date. Any changes in the equity interest in subsidiaries of the Group while control is retained are recorded under Others related to changes in the ownership interests in subsidiaries in equity. Investments in subsidiaries have been presented in the separate financial statements under the cost method. A list of subsidiaries of the Group is set out in Note 12.1 and 12.2.
3.3.6 Investments in Associates Associates are those companies in which the Group has significant influence, but not control, over the financial and operating policies. The Group uses the purchase method to record the acquisition of associates. Costs which are higher than the acquisition-date fair value of identifiable assets and liabilities of the acquirer’s equity interest in associates are recorded as goodwill and included in the investment in associates. The consolidated financial statements include the Group’s share of the total recognized gains and losses from associates on an equity accounting basis, from the date that significant influence commences until the date that significant influence ceases. Unrealized gains or losses on transactions between the Group and its associates are eliminated to the extent of the Group’s interest in the associates unless the transactions provide evidence of impairment of the transferred assets. The Group records share of gains or losses from associates in proportion to the Group’s equity interest in those gains and losses. Any dividends received from associates are deducted from the book value of the investments. When the Group’s share of losses in associates equals or exceeds its interest in the associates, the Group does not recognize further losses, unless the Group has incurred collateral or constructive obligations or made payments on behalf of the associates. Investments in associates have been presented in the separate financial statements under the cost method and in the consolidated financial statements under the equity method. A list of associates of the Group is set out in Note 12.1 and 12.2.
3.3.7 Investments in Jointly Controlled Entities Established by contractual agreement, jointly controlled entities are those entities over which the Group has joint control. Jointly controlled entities are accounted for by proportionate consolidation in the consolidated financial statements. Under this method, the Group includes its share of the jointly controlled entities’ revenues, expenses, assets, liabilities and cash flows on a line-by-line basis with similar items in the Group’s financial statements, from the date that joint control commences until the date that joint control ceases.
(UNOFFICIAL TRANSLATION)
22
3. Accounting Policies (Continued) 3.3 Significant Accounting Policies (Continued) 3.3.7 Investments in Jointly Controlled Entities (Continued)
The Group recognizes the portion of gains or losses on sales of assets by the Group to the jointly controlled entities that is attributable to other ventures. The Group does not recognize its share of gains or losses from the jointly controlled entities that results from the purchase of assets by the Group from the jointly controlled entities until it sells the assets to an independent party. However, when loss on the transaction evidences a reduction in the net realizable value of current assets or an impairment loss, the loss is recognized immediately. The Group’s interests in jointly controlled entities are presented in the separate financial statements under the cost method. A list of jointly controlled entities of the Group is set out in Note 12.1 and 12.2.
3.3.8 Other Investments Investments other than investments in subsidiaries, associates, and jointly controlled entities are classified as available-for-sale investments, and general investments. Investments in equity securities and mutual funds that are marketable securities are classified as available-for-sale investments and carried at fair value in the statements of financial position. Any changes in value are recognized as gain (loss) from fair value measurement of available-for-sale investments in the statement of other comprehensive income and accumulated amounts are recognized as available-for-sale investments in equity. Investments in non-marketable securities, which are classified as general investments, are carried at cost in the statement of financial position net of accumulated impairment losses if the value of the investments decreases substantially. Impairment testing is performed when there is a factor indicating that an investment might be impaired. If the carrying value of the investment is higher than its recoverable amount, impairment losses are recognized in the statements of income immediately. Upon the disposal of investments, the difference between the net disposal proceeds and the carrying amount is charged or credited to the statements of income. When disposing of part of the Group’s particular investment in debt or equity securities, the carrying amount of the part disposed is determined by reference to the weighted average carrying amount of the total holding of the investment.
3.3.9 Related Parties Related parties of the Company are those enterprises or individuals that control or are controlled by the Company, or are under common control with the Company, including holding companies, subsidiaries, and fellow Group subsidiaries, as well as those that have equity interests in the Company that result in significant influence or joint control over the Company. In addition, related parties include associates, jointly controlled entities, the management and directors of the Company, and entities which the management or directors of the Company, directly or indirectly, control, jointly control, or significantly influence. In considering each possible related party relationship, attention is directed more to the substance of the relationship than to the legal form.
(UNOFFICIAL TRANSLATION)
23
3. Accounting Policies (Continued) 3.3 Significant Accounting Policies (Continued) 3.3.10 Foreign Currency Translation
Foreign currency transactions are translated into Thai Baht at the exchange rates prevailing at the transaction date. Monetary assets and liabilities at the statements of income date denominated in foreign currencies are translated into Thai Baht at the exchange rate prevailing at that date. Gains and losses resulting from the settlement of such transactions and from the translation of monetary assets and liabilities denominated in foreign currencies are recognized in the statements of income. Assets and liabilities of integrated foreign operations are translated into Thai Baht using the closing rate at the statements of financial position date. Revenues and expenses are translated into Thai Baht using the average rate during the period. Differences arising from currency translation are included in the statement of other comprehensive income and accumulated differences are presented in other components of equity under equity. Upon the disposal of self-sustaining foreign entities, accumulated currency translation differences under shareholders’ equity are recognized as gains or losses on disposal.
3.3.11 Borrowing Costs Borrowing costs comprise interest and other costs associated with the borrowings. Borrowing costs incurred on qualifying assets included in property, plant and equipment are capitalized as a cost of the qualifying property until substantially all the activities necessary to prepare the property for its intended use are completed. When funds are specifically borrowed for the construction or the production of property, plant and equipment, the amount of borrowing costs capitalized is determined from the actual borrowing costs during the year less any income on the temporary investment of those borrowings. When funds are borrowed for general purpose, the Group multiplies the capitalization rate by the capital expenditure in allocating borrowing costs to costs of assets. All other borrowing costs are expensed in the period they incurred.
3.3.12 Property, Plant and Equipment Property, plant and equipment are initially recognized at cost less accumulated depreciation and allowance for impairment. The costs comprise any costs directly attributable to bringing the asset to the location and condition necessary for it to be capable of operating in the manner intended by the management. These include decommission costs, delivery and restoration costs, and any obligation associated with either its acquisition or a consequence of having used the items. Repair and maintenance costs are recognized as expenses in the statements of income during the financial period in which they are incurred. The costs of significant asset improvements, major turnarounds and inspections are included in the carrying amount of the asset. In case of replacement, the Group writes off carrying value of replaced items. The Group depreciates each significant component of property, plant and equipment separately.
(UNOFFICIAL TRANSLATION)
24
3. Accounting Policies (Continued) 3.3 Significant Accounting Policies (Continued) 3.3.12 Property, Plant and Equipment (Continued)
The Group estimates the carrying amount of the property, plant and equipment based on current assessment of the future economic benefits. The Group reviews the recoverable amounts, the useful lives and depreciation methods of assets at least once a year. Depreciation is accounted for as expenses in the statements of income and is calculated using the straight-line method over the estimated useful lives of the assets, which are as follows:
Buildings and building improvements 5 – 30 years Machinery and equipment 5 – 40 years Other assets 5 – 10 years
Land and construction in progress are not depreciated. Gains or losses on disposal of property, plant and equipment are determined by comparing the proceeds from sales with the carrying amounts on the disposal dates, and are included in operating income or loss. Oil and Gas Exploration and Production Properties The petroleum exploration and production business accounts for its oil and gas exploration and production properties in accordance with the successful efforts method for which the accounting policies are as follows: Cost of Properties The cost of properties comprises the total acquisition costs of concession rights or a portion thereof proportionate to the Company’s interest in the properties including decommissioning costs. Exploratory drilling costs are capitalized and are classified as assets of the projects if the exploratory wells have found proved reserves to be commercially produced. Otherwise, such drilling costs are expensed in the statements of income. Exploratory costs, comprising geological and geophysical costs as well as area reservation fees during the exploration stage, are charged as expenses when incurred in the statement of income. Development costs, whether relating to successful or unsuccessful development wells, are capitalized and classified as assets. Depreciation The capitalized acquisition costs of concession rights are depleted and amortized using the unit of production method based on estimated proved reserves. Depreciation, depletion and amortization of exploratory wells, development costs, equipment and the operating costs of support equipment as well as decommissioning costs, except unsuccessful projects, are calculated using the unit of production method based on estimated proved reserves or proved developed reserves. Changes in reserve estimates are recognized prospectively.
(UNOFFICIAL TRANSLATION)
25
3. Accounting Policies (Continued) 3.3 Significant Accounting Policies (Continued) 3.3.12 Property, Plant and Equipment (Continued)
Proved reserves and proved developed reserves are calculated by the Group’s own engineers and based on information from the jointly controlled entities. Carried Cost under Petroleum Sharing Contracts The petroleum exploration and production business records the carried costs under petroleum sharing contracts using the following accounting policies. Under some Petroleum Sharing Contracts in which the government has a participating interest require the contractor parties excluding the government to fund the costs of all exploration operations until determination of the first development area (carried cost). The carried costs are funded by the contractor parties at the proportion agreed among the parties. When the project commences production, the carried costs will be fully recouped without interest among the contractor parties under the agreed procedures, in the form of petroleum product sharing. The Group records the carried costs according to the type of petroleum operations, under the successful efforts method. Most of them are recorded as oil and gas properties in the statements of financial position while exploration expenses are recorded in the statements of income as detailed in Note 16.
3.3.13 Investment Properties Investment properties are initially recognized at cost, including expenses directly associated with the asset acquisition, less accumulated depreciation and amortization. The Group has selected the cost model for accounting for its investment properties. This model is in accordance with that described in the accounting policy for property, plant and equipment. Depreciation is accounted for as expenses in the statements of income and is calculated using the straight-line method over the estimated useful lives of the assets, which range from 5 to 30 years. Land and construction in progress are not depreciated.
3.3.14 Intangible assets Intangible assets are initially recognized at cost less accumulated amortization and impairment. Amortization is accounted for as expenses in the statements of income. The Group records the initial costs of intangible assets from business combination at the acquisition-date fair value of the assets. Intangible assets from other sources are initially recognized at their costs. Intangible assets include computer software licenses, asset rights such as gas transmission pipelines, resource exploration and valuation assets, and other intangible assets, such as other operating rights, patents, and customer contracts. Exploration and evaluation assets are intangible assets that are recognized at cost in a petroleum exploration and production business. If exploratory projects have found sufficient reserves to be commercially produced, assets under those projects will be transferred to assets under proved reserve project. Subsequently, their values are evaluated based on the method stated in Note 3.3.12 property, plant and equipment. Otherwise, assets under those projects will be fully expensed in the statements of income.
(UNOFFICIAL TRANSLATION)
26
3. Accounting Policies (Continued)
3.3 Significant Accounting Policies (Continued)
3.3.14 Intangible assets (Continued) Intangible assets are amortized and recorded as expenses in the statements of income using the straight-line method over the contract periods which range from 5 to 30 years, except customer contracts which are amortized based on estimated sales volume. The Group reviews the carrying amount and useful lives of intangible assets at least once a year.
3.3.15 Mining Properties The coal business applies the following accounting policy for coal exploration and production properties including coal mining property rights and deferred mining exploration and development expenditures. Coal Mining Property Rights Coal mining property rights comprise the total acquisition costs of concession rights in coal mining including both coal mining exploration and development expenditures. Deferred Mining Exploration and Development Expenditures Exploration expenditures relating to areas of interest are recorded at cost as deferred exploration expenditures, which comprise net direct costs, such as licenses, geological and geophysical exploration expenditures, excluding general overheads and administrative expenditures not directly attributable to a particular area of interest, where: a) Such costs are expected to be recovered when the areas are successfully developed and mining
operations commence, or from the sales of the areas of interest
b) Exploration activities in the areas of interest have not reached the stage which permits a reasonable assessment of the existence of commercial recoverable reserves, and active operations in the areas of interest are continuing.
The recoverable amount of exploration expenditures is thus dependent upon a successful development and receivable economic benefits. When the economic benefits are expected to be minimal or non-existent, deferred exploration expenditures are written off as expenses in the statements of income immediately. Development expenditures and costs of area development prior to commencement of operations are capitalized as deferred mining costs so long as they meet the above criteria and it is highly probable that they can create future economic benefits. Amortization Amortization of coal mining property rights is calculated using the units of production method over the production amount. The amortization of deferred mining exploration and development expenditures commences when commercial coal production activities commence, using the units of production method. The volume of proportional production and the useful lives of coal mining concessions are estimated and reviewed by the Group.
(UNOFFICIAL TRANSLATION)
27
3. Accounting Policies (Continued)
3.3 Significant Accounting Policies (Continued)
3.3.16 Goodwill The Group records the initial value of goodwill at cost, representing the excess of the acquisition costs over the fair value of the net assets acquired. Where the fair value of the net assets exceeds the cost of acquisition at the acquisition date, the difference is recognized as a gain in the statements of income immediately. The Group recognizes goodwill at cost less accumulated impairment losses. The Group will carry out a test for impairment of goodwill at least once a year or when there are factors indicating that an investment might be impaired. To test for impairment, the Group allocates goodwill from business combinations to each cash-generating unit (or group of cash-generating units) that is expected to benefit from the synergies of the combination. The Group evaluates the recoverable amount of each cash-generating unit (or group of cash-generating units) and if it is lower than the carrying amount of the unit, the Group recognizes impairment losses. Allowance for impairment of goodwill will not be reversed.
3.3.17 Finance Leases – Where the Group is the lessee Leases of property, plant and equipment, where the Group assumes substantially all the risks and rewards of ownership are classified as finance leases. The leased assets are capitalized at the lower of the estimated net present value of the underlying minimum lease payments or fair value. Each minimum lease payment is allocated between liabilities and finance charges in order to achieve a constant interest rate on the remaining balance of the liabilities. The finance leases’ liabilities less finance charges are presented as long-term loans. Interest expenses are charged to the statements of income over the lease period. Depreciation is charged over the shorter of the assets estimated useful life or the lease period.
3.3.18 Operating Leases – Where the Group is the lessee Leases of property, plant and equipment where the lessor assumes a significant portion of the risks and rewards of ownership are classified as operating leases. Payments made under operating leases are charged to the statements of income using the straight-line method over the period of the lease. The costs incurred upon termination of the operating lease agreements prior their maturity, such as panalty paid to the lessor for such termination, are recognized as expenses in the period in which the termination takes place.
3.3.19 Advance Payments for Gas Purchased under Take-or-Pay Agreements The Company has entered into gas purchase agreements with natural gas producers, under which the Company is required to take delivery of natural gas at annual minimum quantities. During each contract year, if the Company cannot accept natural gas according to the minimum quantities under the agreements, it is required to pay for the volume of natural gas which it cannot actually take (Take-or-Pay). After the end of each contract year, the Company and the natural gas producers have to agree on and accept the volume of gas that should be taken into the calculation of Take-or-Pay for that contract year, which is subject to the basis and conditions in the agreements. Under the agreements, the Company can take certain volumes of prepaid gas (Make-up) in subsequent years after taking delivery of natural gas at the minimum quantities for that given contract year. The Company recognizes its obligations under the agreements as advance payments for gas purchased.
(UNOFFICIAL TRANSLATION)
28
3. Accounting Policies (Continued)
3.3 Significant Accounting Policies (Continued)
3.3.20 Impairment of Assets The Group performs the following tests for impairment of assets: • Assessment of goodwill is annually performed. • Impairment of property, land and equipment or intangible assets will be made whenever there
is an indication that an asset may be impaired. The Group recognizes impairment loss when the recoverable amount of an asset is lower than its carrying amount, which is the higher of the asset’s fair value less cost to sell and its value in use. The Group determines value in use by estimating the present value of future cash flows generated by the asset, discounted using a pre-tax discount rate which reflects current market assessments of the time value of money and the risk specific to the asset. In determining fair value less costs to sell, an appropriate valuation model is used. The calculation reflects the amount that the Group could obtain from the disposal of the asset in an arm’s length transaction between knowledgeable, willing parties, after deducting the costs of disposal. The Group recognizes an impairment loss in the statement of income.
3.3.21 Provision for Decommissioning Costs The Group records a provision for decommissioning costs whenever it is highly probable that an obligation will arise as a result of a past event and the amount of the obligation can be reliably estimated. The Group recognizes a provision for decommissioning costs based on an estimate of the eventual costs that relate to the removal of the production facilities. These costs are included as part of the cost of the oil and gas properties and are amortized based on proved reserves using the unit of production method. The estimates of decommissioning costs are determined based on reviews and estimates by the Group’s engineers and management’s judgment.
3.3.22 Employee Benefit Obligations Employee benefit obligations of the Group are measured and recognized as follows: 1. Short-term employee benefits are recognized in the statement of income as expenses when incurred. 2. Post-employment benefits – defined contribution plans The Company and its employees have jointly established a provident fund. The fund is monthly
contributed by employees and by the Company. The fund’s assets are held in a separate trust fund and the Company’s contributions are recognized as expenses when incurred.
3. Post-employment benefits – defined benefit plans The obligation under the defined benefit plan is determined based on actuarial techniques,
using the projected unit credit method, in order to determine present value of the obligation, current service cost and past service cost. These are recognized as a liability in statements of financial position and expenses in the statement of income. Actuarial gains and losses arising from post-employment benefits are immediately recognized as expense in the statement of income.
(UNOFFICIAL TRANSLATION)
29
3. Accounting Policies (Continued) 3.3 Significant Accounting Policies (Continued) 3.3.22 Employee Benefit Obligations (Continued)
4. Other long-term employment benefits
The obligation under the defined benefit plan is determined based on actuarial techniques, using the projected unit credit method, in order to determine present value of the obligation, current service cost and past service cost. These are recognized as a liability in statements of financial position and expenses in the statement of income. Actuarial gains and losses arising from post-employment benefits are recognized immediately as expense in the statement of income.
5. Termination benefits are recognized as a liability or an expense when, and only when, the
Company is demonstrably committed to either:
• terminate the employment of an employee or a group of employees before the normal retirement date; or
• provide termination benefits as a result of an offer made in order to encourage voluntary redundancy.
3.3.23 Income tax
Current tax The Group is taxed on its non-promoted businesses pursuant to the Revenue Code of Thailand, the Petroleum Income Tax Act, B.E. 2514 (1971) and Amendment, B.E. 2532 (1989) and other applicable laws and regulations of other countries in which the Group has invested. Current tax is the expected tax payable on the taxable profit for the year, using tax rates enacted at the statements of financial position date in the taxable period, and any adjustment to tax payable in respect of previous years. Deferred tax Deferred tax is recognized in the statements of financial position using the liability method for temporary differences between the carrying amounts of tax bases of assets and liabilities and the carrying amounts in the financial statements. The principal temporary differences arise from the allowance for doubtful accounts, employee benefit obligations, brought forward accumulated deficit of subsidiaries, and available-for-sale investments, as well as differences between the fair value of acquired assets and liabilities and their tax bases. Deferred tax is measured using the tax rates enacted at the statements of financial position date. Deferred tax assets are recognized to the extent that it is highly probable that the future taxable profits of the Group will be available against which the temporary differences can be utilized. Deferred tax assets are reduced to the extent that it is no longer probable that the related tax benefits will be realized. The Group records deferred tax directly to shareholders’ equity if the tax relates to items that are recorded directly to shareholders’ equity. Deferred tax assets and liabilities are offset when there is the legal right to settle on a net basis and the deferred tax balances relate to the same taxation authority.
(UNOFFICIAL TRANSLATION)
30
3. Accounting Policies (Continued)
3.3 Significant Accounting Policies (Continued)
3.3.24 Revenue Recognition The Group recognizes revenue from sales upon the delivery of products or when the significant risks and rewards of ownership are transferred to the customers. Revenue from services is recognized over the period in which the services are rendered. These revenues are net of trade discounts. Other revenue is recognized on the following basis: Interest income - time proportion basis using the effective yields of interest bearing assets Royalty income - accrual basis in accordance with the substance of the relevant agreements Dividend income - when the right to receive the dividend is established. Revenue from sources other than those mentioned above is recognized using the accrual basis.
3.3.25 Earnings per share Basic earnings per share is calculated by dividing the net income attributable to ordinary shareholders by the weighted average number of ordinary shares held by third parties in issue during the year. In calculating diluted earnings per share, the Company assumes that all potential dilutive ordinary shares issued to its managements and employees will be converted. As a result, net income of the Group recognized in the financial statements of the Company is adjusted to reflect the dilution of its shareholding that would be caused by such conversion. The calculation of the weighted average number of ordinary shares is based on market price (average price of the Company’s ordinary shares during the period) and the exercise price of the warrants in order to determine the number of ordinary shares held by third parties in the diluted earnings per share calculation.
3.3.26 Share-based payments The Group recognizes equity-settled share-based payments at fair value of warrants at the grant date and expenses them over the vesting period of warrants, while presenting equity from share-based payments in shareholders’ equity. Measurement of the fair value of share-based payments requires the use of judgment and the selection of suitable assumptions regarding items such as the vesting period of the warrants, fluctuation in share price and dividend rate, etc.
3.3.27 Financial Instruments Financial assets in the statements of financial position include cash and cash equivalents, current investments, trade accounts receivable, other accounts receivable, short-term loans, available-for-sale investments, other long-term investments, and long-term loans. Financial liabilities in the statements of financial position include bank overdrafts and short-term loans from financial institutions, trade accounts payable, other accounts payable, short-term loans and long-term loans. The particular recognition methods adopted are disclosed in the individual policy statements associated with each item.
(UNOFFICIAL TRANSLATION)
31
3. Accounting Policies (Continued) 3.3 Significant Accounting Policies (Continued) 3.3.27 Financial Instruments (Continued)
The Group utilizes financial instruments to reduce its risk exposure associated with fluctuations in foreign currency exchange rates, interest rates as well as oil and gas market prices. These instruments primarily comprise: Forward Foreign Exchange Contracts Forward foreign exchange contracts protect the Group from fluctuations in exchange rates by establishing the rates at which foreign currency assets will be realized or foreign currency liabilities will be settled. Forward foreign exchange contracts are recognized in the financial statements on inception. The premium or discount on the establishment of each agreement is amortized over the contract period. Cross-currency and Interest Rate Swap Contracts Cross-currency and interest rate swap contracts protect the Group from fluctuations in exchange rates and interest rates. Foreign currency financial assets and liabilities as at the statements of financial position date are protected by cross-currency contracts and are translated to Thai Baht using the rates determined in the contracts. Gains or losses on early termination of such contracts or on early-repayment of the borrowings before maturity are taken to the statements of income. Futures Oil Contracts The Company has entered into futures contracts to hedge risks arising from fluctuations in oil prices in accordance with its oil purchase and sale agreements by determining future oil prices. Gains or losses arising from these contracts are recorded in the statements of income at the maturity of the futures contracts. The risk management policy is described in Note 38 Disclosure of Financial Instruments.
3.3.28 Use of Estimates and Significant Assumptions The preparation of financial statements in conformity with Thai Accounting Standards requires management to make estimates and assumptions that affect the reported amounts of assets, liabilities, income and expenses. Estimates and underlying assumptions used in the preparation of financial statements are reviewed on an ongoing basis. Revisions to accounting estimates are recognized in the period in which the estimates are revised and in any future periods affected. Information about significant assumptions and the sources of contingent estimates that might impact on the carrying amounts of assets and liabilities presented in the financial statements are as follows: Provisions The Group recognizes a provision in the statements of financial position if, as a result of a past event, the Group has a present obligation that can be estimated reliably and it is probable that an outflow of economic benefits will be required to settle the obligation.
(UNOFFICIAL TRANSLATION)
32
3. Accounting Policies (Continued) 3.3 Significant Accounting Policies (Continued) 3.3.28 Use of Estimates and Significant Assumptions (Continued)
Provisions (Continued) The Group records provisions for decommissioning costs when it is highly probable that a commitment will arise as a result of past circumstances and the amount can be estimated reliably. The Group recognizes the provisions for decommissioning costs based on estimated amount of decommissioning of completed construction that is ready for its intended use. These costs are included as part of oil and gas exploration and production properties and are amortized using the units of production method based on estimated proved reserves. The provision for decommissioning costs is determined based on reviews and estimates by the Group’s engineers together with the management’s judgment. Provisions for decommissioning costs depend on various current circumstances such as laws and regulations, technological changes and market prices. Therefore, the actual result is likely to be different from estimations and assumptions. Income Tax The Group is responsible for the payment of tax in various countries. When deferred tax liabilities are estimated, the Group uses significant judgment due to the numerous transactions and calculations arising from its operations. The Group recognizes deferred tax liabilities based on estimated incremental tax payments. The difference between the actual tax paid and the estimate will affect income tax and deferred tax in the period in which payment of the difference occurs.
A deferred tax asset will be recognized when it is highly probable that the Group will have sufficient net income against which to utilize the temporary difference. Assumptions related to future taxable income are uncertain and may change affecting the recognition of deferred tax assets. Estimation of Petroleum Reserves Petroleum reserves are of fundamental importance when assessing investments in various exploration projects and petroleum production businesses, including impairment testing. Changes in proved reserves will affect the present value based on net cash inflows and depreciation expenses which are calculated using the unit of production method. The proved reserves are the volume of commercial petroleum production as of a certain date with a high probability of achievement under current economic conditions and production methods, as well as government’s rules and regulations. The proved reserves will be checked and assessed annually by the Group’s geologists and reservoir engineers.
(UNOFFICIAL TRANSLATION)
33
3. Accounting Policies (Continued)
3.3 Significant Accounting Policies (Continued)
3.3.28 Use of Estimates and Significant Assumptions (Continued) Exploration Costs The petroleum exploration and production businesses capitalize drilling costs as assets. When they are over 12 months old, they are amortized as expenses in the statements of income except where there is (1) a discovery of proved reserves, or (2) a discovery of commercially adequate reserves whilst having future exploration and assessment plans. The decision to amortize drilling petroleum costs recorded as assets over 12 months should be made using the assumptions under current circumstances. In case those should such assumptions change in subsequent accounting periods, the petroleum drilling costs that are capitalized as assets will be written off as expenses in that accounting period. Impairment of Assets The Group considers recording an allowance for impairment of assets when an event or a circumstance indicates that the carrying amount of an asset is higher than its net realizable value, which is the higher of the anticipated discounted cash flows from the continuing use of the asset or the amount obtainable from the sale of the asset less any costs of disposal. As a result, the carrying amount of an asset is immediately written down to its net realizable value. The decrease is recorded in the statements of income. Thus, the loss on impairment of assets excluding goodwill recognized in the prior period will be reversed if the estimation for indicated net realizable value changes. The Group’s estimate of the expected amount of future petroleum production (exploration and production business) is a key factor in impairment tests. The Group believes these to be the most reasonable indicators for estimating future cash flows because future petroleum production comprises proved reserves, including expected proved reserves. The estimation of discounted future cash flows depends on various factors such as the expected amount of future production, future selling prices, demand and supply in the market, risks and gross margins. The discounted rates used in the calculation of present value of future cash flows depend on the cost of capital of the asset unit.
3.3.29 Capital Risk Management The capital management objective of the Group is to create returns for shareholders and other stakeholders whilst maintaining a reasonable capital structure to decrease the cost of capital.
3.3.30 Segment Information The Group has presented its financial information by business segments, not by geographical segments because geographical segments other than Thailand account for less than 10% of consolidated revenues, operating results and total assets.
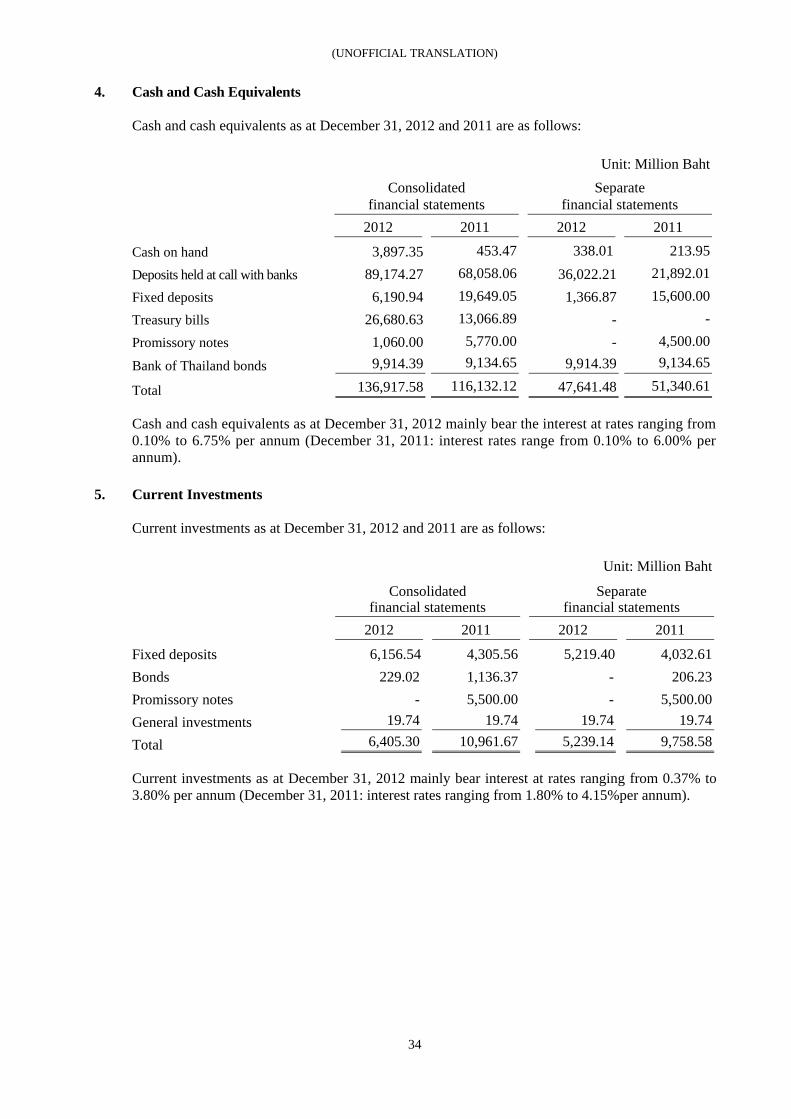
(UNOFFICIAL TRANSLATION)
34
4. Cash and Cash Equivalents Cash and cash equivalents as at December 31, 2012 and 2011 are as follows: Unit: Million Baht
Consolidated
financial statements Separate
financial statements 2012 2011 2012 2011 Cash on hand 3,897.35 453.47 338.01 213.95 Deposits held at call with banks 89,174.27 68,058.06 36,022.21 21,892.01 Fixed deposits 6,190.94 19,649.05 1,366.87 15,600.00 Treasury bills 26,680.63 13,066.89 - - Promissory notes 1,060.00 5,770.00 - 4,500.00
Bank of Thailand bonds 9,914.39 9,134.65 9,914.39 9,134.65
Total 136,917.58 116,132.12 47,641.48 51,340.61 Cash and cash equivalents as at December 31, 2012 mainly bear the interest at rates ranging from 0.10% to 6.75% per annum (December 31, 2011: interest rates range from 0.10% to 6.00% per annum).
5. Current Investments Current investments as at December 31, 2012 and 2011 are as follows:
Unit: Million Baht
Consolidated
financial statements Separate
financial statements
2012 2011 2012 2011 Fixed deposits 6,156.54 4,305.56 5,219.40 4,032.61 Bonds 229.02 1,136.37 - 206.23 Promissory notes - 5,500.00 - 5,500.00 General investments 19.74 19.74 19.74 19.74
Total 6,405.30 10,961.67 5,239.14 9,758.58 Current investments as at December 31, 2012 mainly bear interest at rates ranging from 0.37% to 3.80% per annum (December 31, 2011: interest rates ranging from 1.80% to 4.15%per annum).
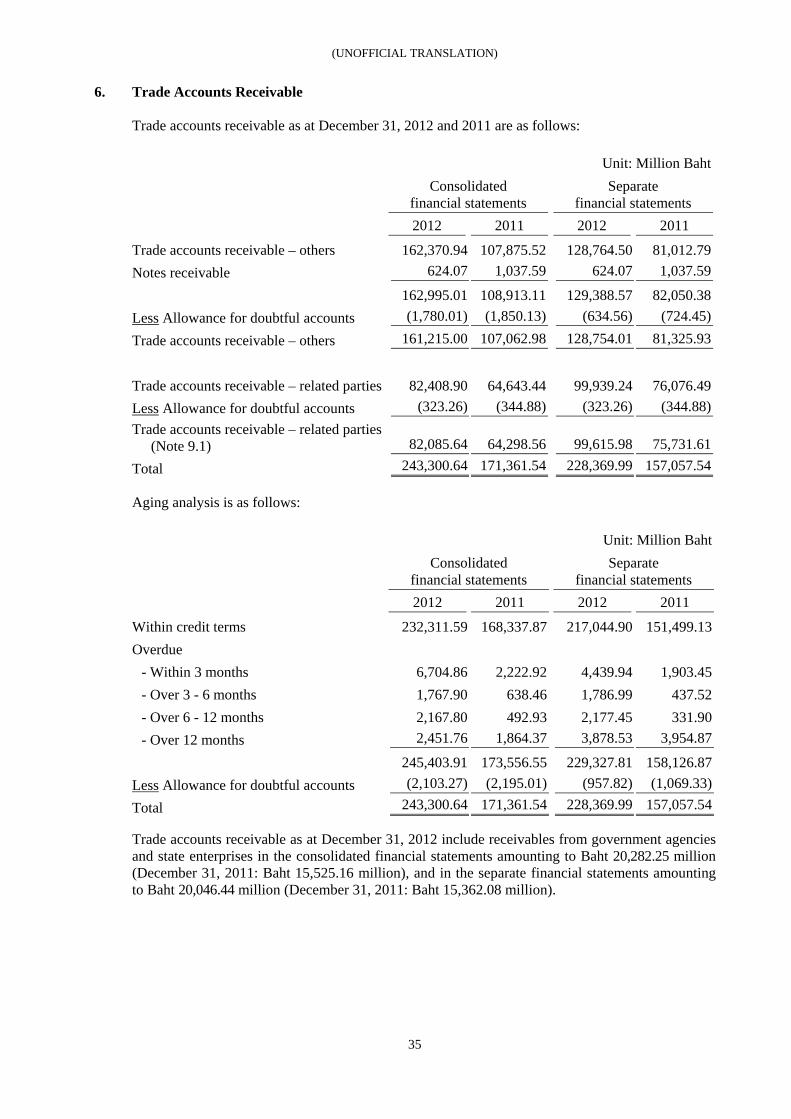
(UNOFFICIAL TRANSLATION)
35
6. Trade Accounts Receivable Trade accounts receivable as at December 31, 2012 and 2011 are as follows: Unit: Million Baht
Consolidated
financial statements Separate
financial statements
2012 2011 2012 2011
Trade accounts receivable – others 162,370.94 107,875.52 128,764.50 81,012.79 Notes receivable 624.07 1,037.59 624.07 1,037.59
162,995.01 108,913.11 129,388.57 82,050.38 Less Allowance for doubtful accounts (1,780.01) (1,850.13) (634.56) (724.45)
Trade accounts receivable – others 161,215.00 107,062.98 128,754.01 81,325.93
Trade accounts receivable – related parties 82,408.90 64,643.44 99,939.24 76,076.49 Less Allowance for doubtful accounts (323.26) (344.88) (323.26) (344.88) Trade accounts receivable – related parties
(Note 9.1) 82,085.64 64,298.56 99,615.98 75,731.61
Total 243,300.64 171,361.54 228,369.99 157,057.54 Aging analysis is as follows: Unit: Million Baht
Consolidated
financial statements Separate
financial statements
2012 2011 2012 2011
Within credit terms 232,311.59 168,337.87 217,044.90 151,499.13 Overdue
- Within 3 months 6,704.86 2,222.92 4,439.94 1,903.45 - Over 3 - 6 months 1,767.90 638.46 1,786.99 437.52 - Over 6 - 12 months 2,167.80 492.93 2,177.45 331.90 - Over 12 months 2,451.76 1,864.37 3,878.53 3,954.87
245,403.91 173,556.55 229,327.81 158,126.87 Less Allowance for doubtful accounts (2,103.27) (2,195.01) (957.82) (1,069.33)
Total 243,300.64 171,361.54 228,369.99 157,057.54 Trade accounts receivable as at December 31, 2012 include receivables from government agencies and state enterprises in the consolidated financial statements amounting to Baht 20,282.25 million (December 31, 2011: Baht 15,525.16 million), and in the separate financial statements amounting to Baht 20,046.44 million (December 31, 2011: Baht 15,362.08 million).
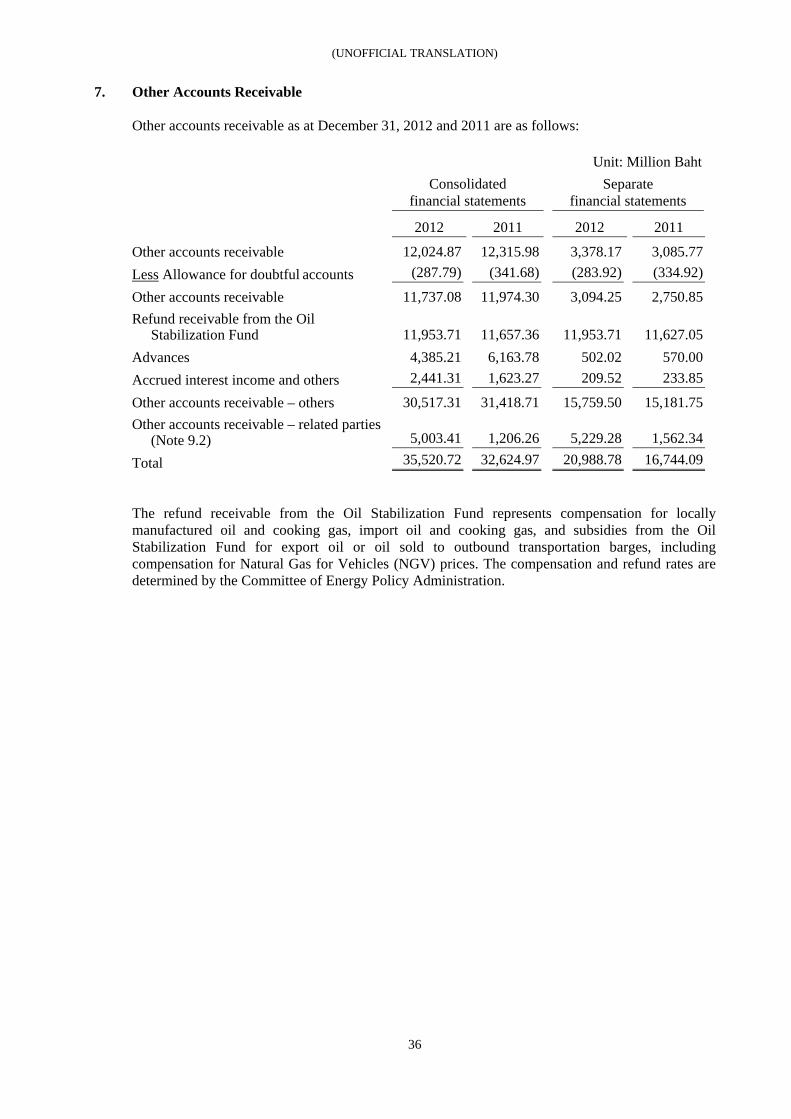
(UNOFFICIAL TRANSLATION)
36
7. Other Accounts Receivable Other accounts receivable as at December 31, 2012 and 2011 are as follows: Unit: Million Baht Consolidated
financial statements Separate
financial statements 2012 2011 2012 2011
Other accounts receivable 12,024.87 12,315.98 3,378.17 3,085.77 Less Allowance for doubtful accounts (287.79) (341.68) (283.92) (334.92)
Other accounts receivable 11,737.08 11,974.30 3,094.25 2,750.85 Refund receivable from the Oil
Stabilization Fund 11,953.71 11,657.36 11,953.71 11,627.05 Advances 4,385.21 6,163.78 502.02 570.00 Accrued interest income and others 2,441.31 1,623.27 209.52 233.85
Other accounts receivable – others 30,517.31 31,418.71 15,759.50 15,181.75 Other accounts receivable – related parties
(Note 9.2) 5,003.41 1,206.26 5,229.28 1,562.34
Total 35,520.72 32,624.97 20,988.78 16,744.09 The refund receivable from the Oil Stabilization Fund represents compensation for locally manufactured oil and cooking gas, import oil and cooking gas, and subsidies from the Oil Stabilization Fund for export oil or oil sold to outbound transportation barges, including compensation for Natural Gas for Vehicles (NGV) prices. The compensation and refund rates are determined by the Committee of Energy Policy Administration.
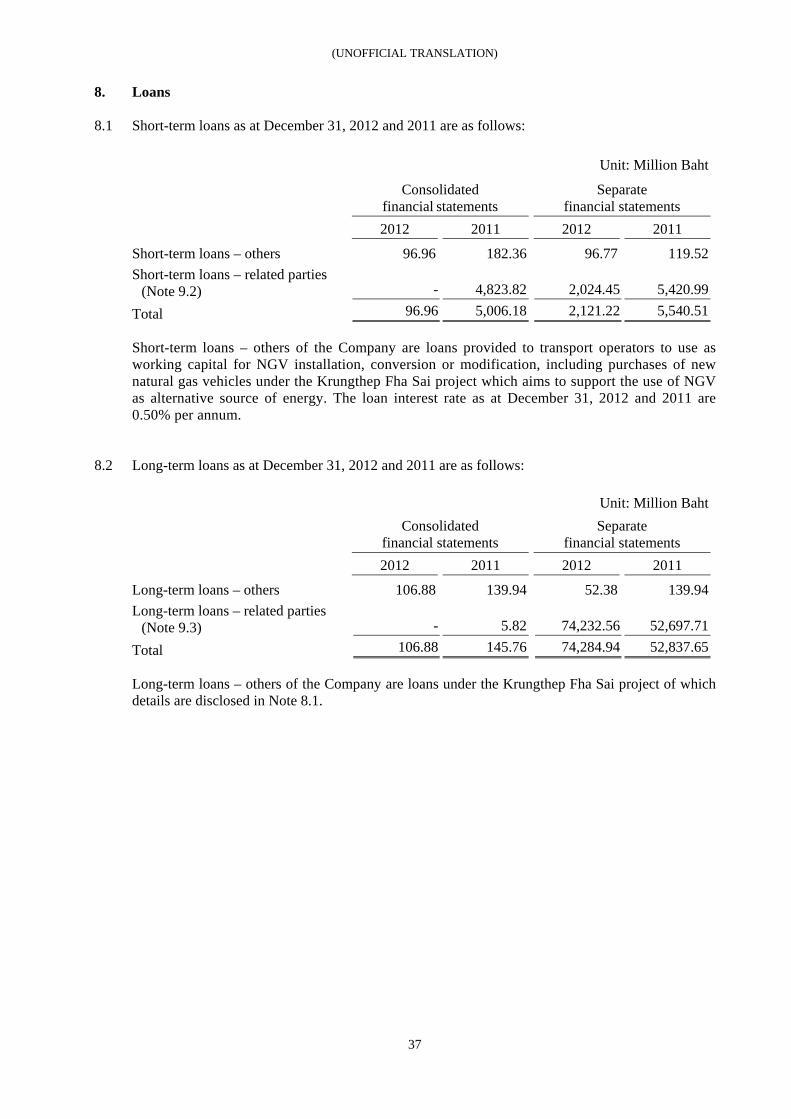
(UNOFFICIAL TRANSLATION)
37
8. Loans
8.1 Short-term loans as at December 31, 2012 and 2011 are as follows: Unit: Million Baht
Consolidated
financial statements Separate
financial statements 2012 2011 2012 2011
Short-term loans – others 96.96 182.36 96.77 119.52 Short-term loans – related parties
(Note 9.2) - 4,823.82 2,024.45 5,420.99
Total 96.96 5,006.18 2,121.22 5,540.51 Short-term loans – others of the Company are loans provided to transport operators to use as working capital for NGV installation, conversion or modification, including purchases of new natural gas vehicles under the Krungthep Fha Sai project which aims to support the use of NGV as alternative source of energy. The loan interest rate as at December 31, 2012 and 2011 are 0.50% per annum.
8.2 Long-term loans as at December 31, 2012 and 2011 are as follows: Unit: Million Baht
Consolidated
financial statements Separate
financial statements
2012 2011 2012 2011
Long-term loans – others 106.88 139.94 52.38 139.94 Long-term loans – related parties
(Note 9.3) - 5.82 74,232.56 52,697.71
Total 106.88 145.76 74,284.94 52,837.65 Long-term loans – others of the Company are loans under the Krungthep Fha Sai project of which details are disclosed in Note 8.1.
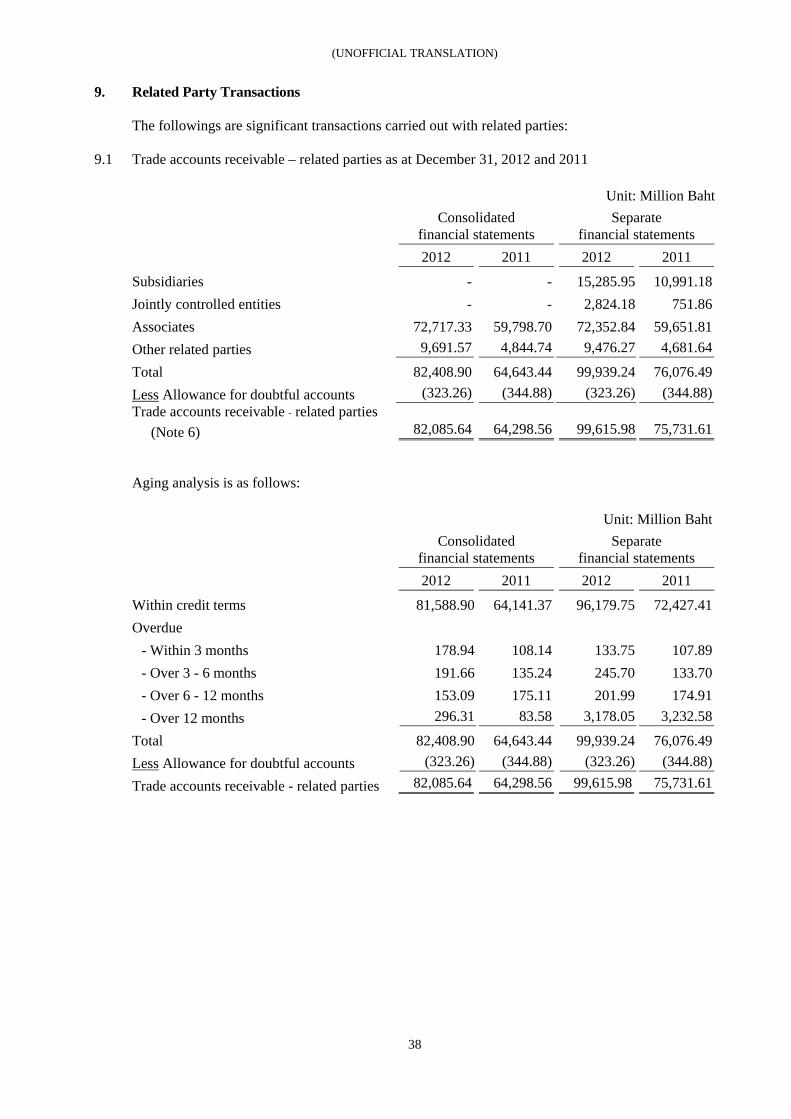
(UNOFFICIAL TRANSLATION)
38
9. Related Party Transactions The followings are significant transactions carried out with related parties:
9.1 Trade accounts receivable – related parties as at December 31, 2012 and 2011 Unit: Million Baht
Consolidated
financial statements Separate
financial statements
2012 2011 2012 2011
Subsidiaries - - 15,285.95 10,991.18 Jointly controlled entities - - 2,824.18 751.86 Associates 72,717.33 59,798.70 72,352.84 59,651.81 Other related parties 9,691.57 4,844.74 9,476.27 4,681.64
Total 82,408.90 64,643.44 99,939.24 76,076.49 Less Allowance for doubtful accounts (323.26) (344.88) (323.26) (344.88) Trade accounts receivable - related parties
(Note 6) 82,085.64 64,298.56 99,615.98 75,731.61 Aging analysis is as follows: Unit: Million Baht
Consolidated
financial statements Separate
financial statements
2012 2011 2012 2011
Within credit terms 81,588.90 64,141.37 96,179.75 72,427.41 Overdue
- Within 3 months 178.94 108.14 133.75 107.89 - Over 3 - 6 months 191.66 135.24 245.70 133.70 - Over 6 - 12 months 153.09 175.11 201.99 174.91 - Over 12 months 296.31 83.58 3,178.05 3,232.58
Total 82,408.90 64,643.44 99,939.24 76,076.49 Less Allowance for doubtful accounts (323.26) (344.88) (323.26) (344.88)
Trade accounts receivable - related parties 82,085.64 64,298.56 99,615.98 75,731.61

(UNOFFICIAL TRANSLATION)
39
9. Related Party Transactions (Continued)
9.2 Other accounts receivable, advances and short-term loans – related parties as at December 31, 2012 and 2011
Unit: Million Baht
Consolidated
financial statements Separate
financial statements
2012 2011 2012 2011
Other accounts receivable Subsidiaries - - 235.85 414.76 Jointly controlled entities - - 40.30 22.82 Associates 4,433.68 624.53 4,430.95 623.11 Other related parties 79.15 245.42 43.63 46.16
4,512.83 869.95 4,750.73 1,106.85 Less Allowance for doubtful accounts (16.09) (16.09) (16.09) (16.09)
Total receivable, net 4,496.74 853.86 4,734.64 1,090.76 Advances Subsidiaries - - 61.01 153.98 Associates 0.78 0.68 - - Other related parties 505.89 351.72 433.63 317.60
Total 506.67 352.40 494.64 471.58
Total other accounts receivable (Note 7) 5,003.41 1,206.26 5,229.28 1,562.34
Short-term loans Subsidiaries - - 2,024.45 597.17 Associates - 4,823.82 - 4,823.82
Total (Note 8.1) - 4,823.82 2,024.45 5,420.99 Movements in short-term loans – related parties are as follows:
Unit: Million Baht
Consolidated
financial statements Separate
financial statements
2012 2011 2012 2011
Balance as at January 1 4,823.82 - 5,420.99 500.00 - Payment for loans granted - - 1,223.82 71.79 - Receipt from loans granted (4,823.82) (226.23) (4,825.73) (2,220.85) - Gain (Loss) on exchange rate - - (5.63) - - Current portion of long-term loans
(Note 9.3) - 5,050.05 211.00 7,070.05
Balance as at December 31 - 4,823.82 2,024.45 5,420.99 Short-term loans to related parties are unsecured and the interest rates as at December 31, 2012 range from 3.05% to 6.13% per annum (December 31, 2011: the interest rates range from 4.00% to 7.25% per annum).
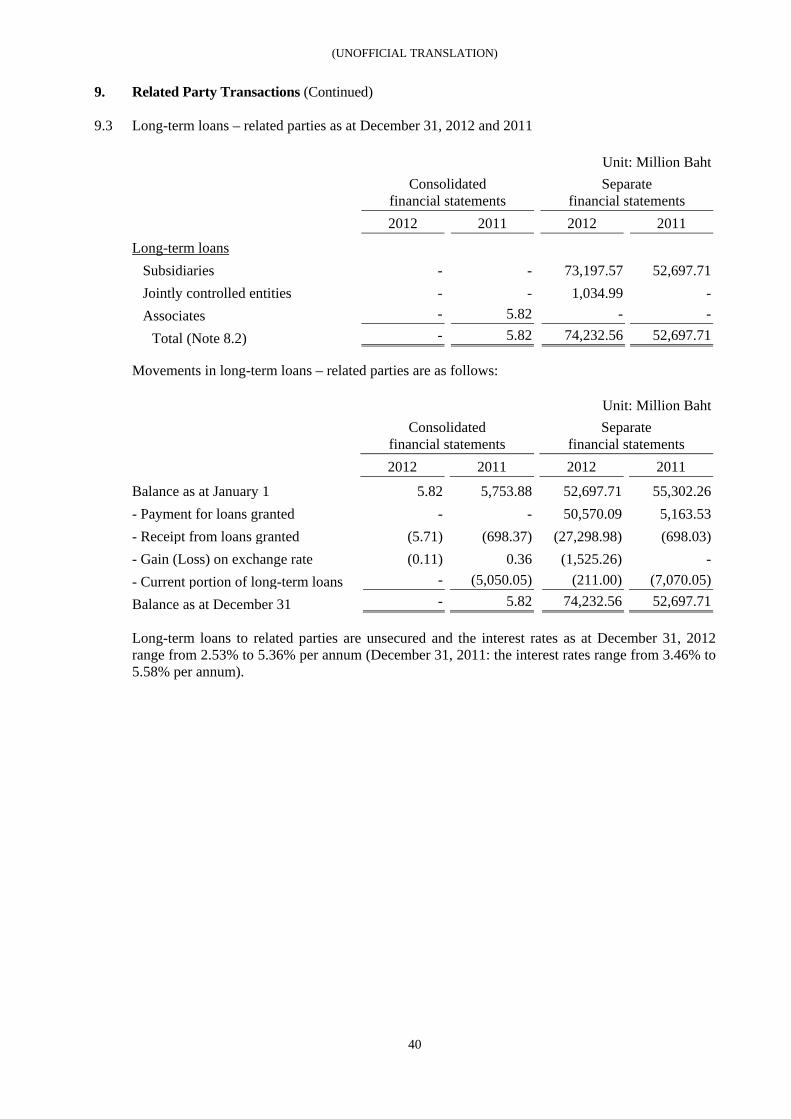
(UNOFFICIAL TRANSLATION)
40
9. Related Party Transactions (Continued)
9.3 Long-term loans – related parties as at December 31, 2012 and 2011
Unit: Million Baht
Consolidated
financial statements Separate
financial statements
2012 2011 2012 2011
Long-term loans Subsidiaries - - 73,197.57 52,697.71 Jointly controlled entities - - 1,034.99 - Associates - 5.82 - -
Total (Note 8.2) - 5.82 74,232.56 52,697.71 Movements in long-term loans – related parties are as follows:
Unit: Million Baht
Consolidated
financial statements Separate
financial statements
2012 2011 2012 2011
Balance as at January 1 5.82 5,753.88 52,697.71 55,302.26 - Payment for loans granted - - 50,570.09 5,163.53 - Receipt from loans granted (5.71) (698.37) (27,298.98) (698.03) - Gain (Loss) on exchange rate (0.11) 0.36 (1,525.26) - - Current portion of long-term loans - (5,050.05) (211.00) (7,070.05)
Balance as at December 31 - 5.82 74,232.56 52,697.71 Long-term loans to related parties are unsecured and the interest rates as at December 31, 2012 range from 2.53% to 5.36% per annum (December 31, 2011: the interest rates range from 3.46% to 5.58% per annum).
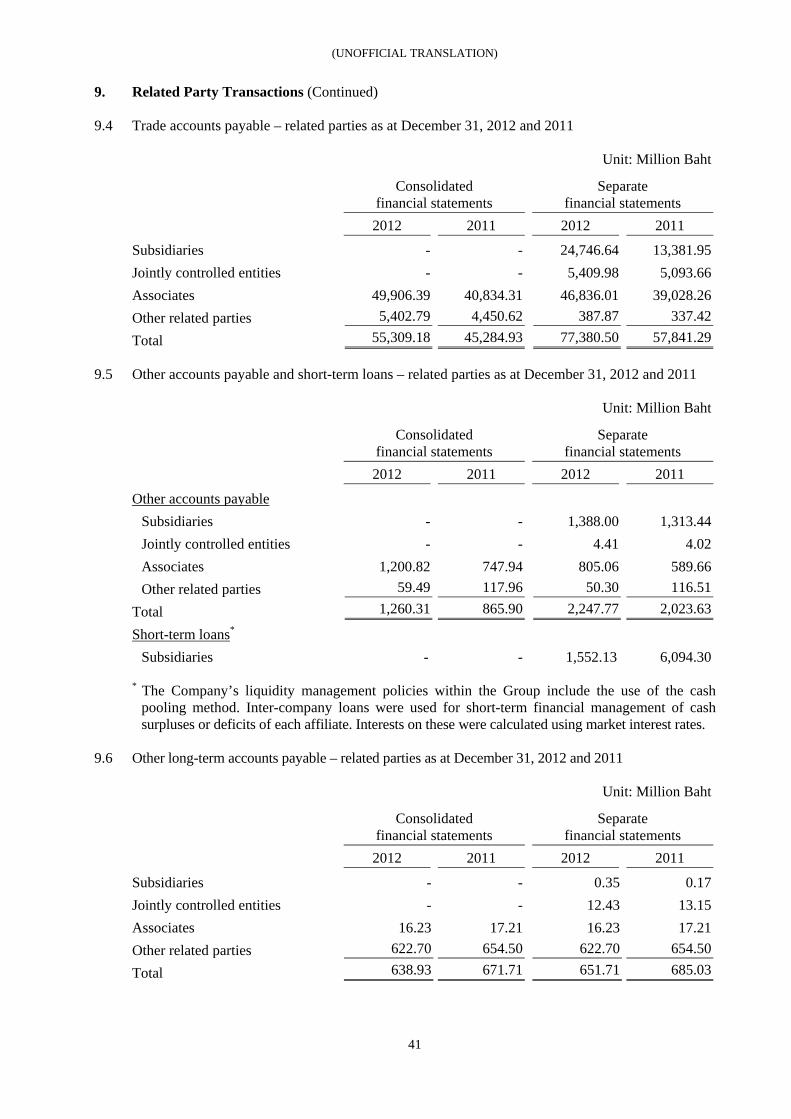
(UNOFFICIAL TRANSLATION)
41
9. Related Party Transactions (Continued)
9.4 Trade accounts payable – related parties as at December 31, 2012 and 2011 Unit: Million Baht
Consolidated
financial statements Separate
financial statements
2012 2011 2012 2011
Subsidiaries - - 24,746.64 13,381.95 Jointly controlled entities - - 5,409.98 5,093.66 Associates 49,906.39 40,834.31 46,836.01 39,028.26 Other related parties 5,402.79 4,450.62 387.87 337.42
Total 55,309.18 45,284.93 77,380.50 57,841.29
9.5 Other accounts payable and short-term loans – related parties as at December 31, 2012 and 2011 Unit: Million Baht
Consolidated
financial statements Separate
financial statements
2012 2011 2012 2011
Other accounts payable Subsidiaries - - 1,388.00 1,313.44 Jointly controlled entities - - 4.41 4.02 Associates 1,200.82 747.94 805.06 589.66 Other related parties 59.49 117.96 50.30 116.51
Total 1,260.31 865.90 2,247.77 2,023.63
Short-term loans* Subsidiaries - - 1,552.13 6,094.30 * The Company’s liquidity management policies within the Group include the use of the cash
pooling method. Inter-company loans were used for short-term financial management of cash surpluses or deficits of each affiliate. Interests on these were calculated using market interest rates.
9.6 Other long-term accounts payable – related parties as at December 31, 2012 and 2011
Unit: Million Baht
Consolidated
financial statements Separate
financial statements
2012 2011 2012 2011
Subsidiaries - - 0.35 0.17 Jointly controlled entities - - 12.43 13.15 Associates 16.23 17.21 16.23 17.21 Other related parties 622.70 654.50 622.70 654.50
Total 638.93 671.71 651.71 685.03
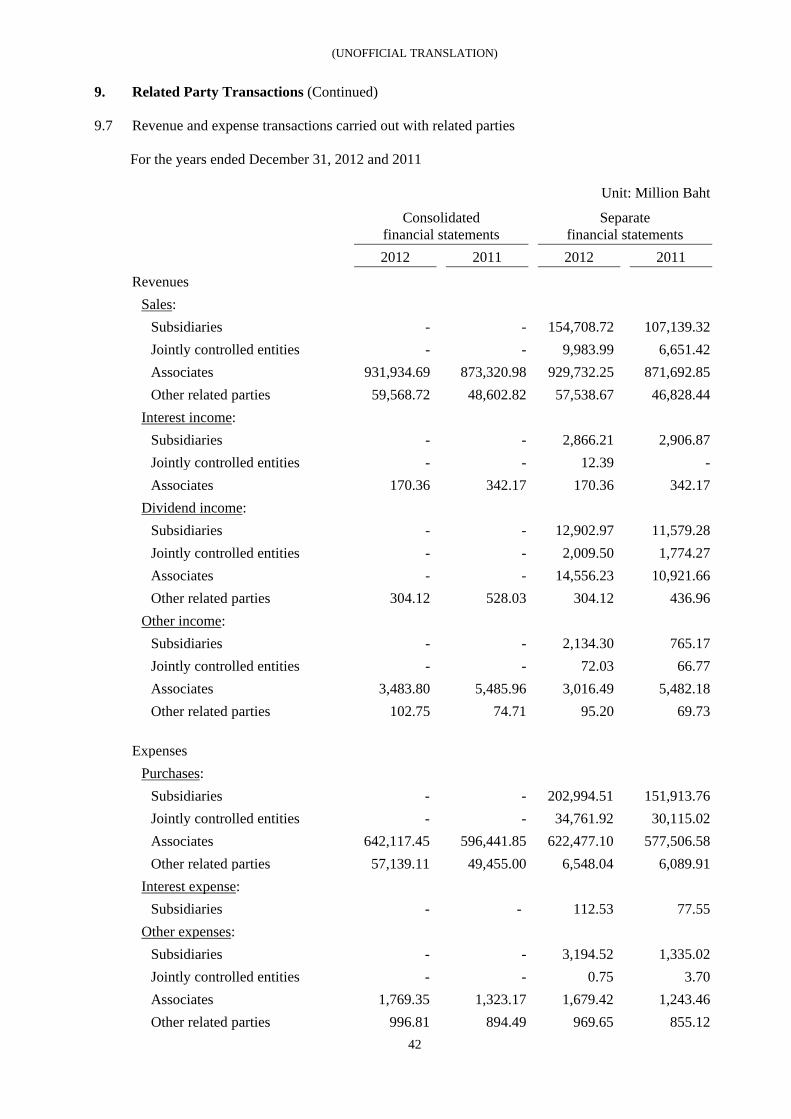
(UNOFFICIAL TRANSLATION)
42
9. Related Party Transactions (Continued)
9.7 Revenue and expense transactions carried out with related parties For the years ended December 31, 2012 and 2011 Unit: Million Baht
Consolidated
financial statements Separate
financial statements
2012 2011 2012 2011
Revenues Sales: Subsidiaries - - 154,708.72 107,139.32 Jointly controlled entities - - 9,983.99 6,651.42 Associates 931,934.69 873,320.98 929,732.25 871,692.85 Other related parties 59,568.72 48,602.82 57,538.67 46,828.44 Interest income: Subsidiaries - - 2,866.21 2,906.87 Jointly controlled entities - - 12.39 - Associates 170.36 342.17 170.36 342.17 Dividend income: Subsidiaries - - 12,902.97 11,579.28 Jointly controlled entities - - 2,009.50 1,774.27 Associates - - 14,556.23 10,921.66 Other related parties 304.12 528.03 304.12 436.96 Other income: Subsidiaries - - 2,134.30 765.17 Jointly controlled entities - - 72.03 66.77 Associates 3,483.80 5,485.96 3,016.49 5,482.18 Other related parties 102.75 74.71 95.20 69.73 Expenses Purchases: Subsidiaries - - 202,994.51 151,913.76 Jointly controlled entities - - 34,761.92 30,115.02 Associates 642,117.45 596,441.85 622,477.10 577,506.58 Other related parties 57,139.11 49,455.00 6,548.04 6,089.91 Interest expense: Subsidiaries - - 112.53 77.55 Other expenses: Subsidiaries - - 3,194.52 1,335.02 Jointly controlled entities - - 0.75 3.70 Associates 1,769.35 1,323.17 1,679.42 1,243.46 Other related parties 996.81 894.49 969.65 855.12
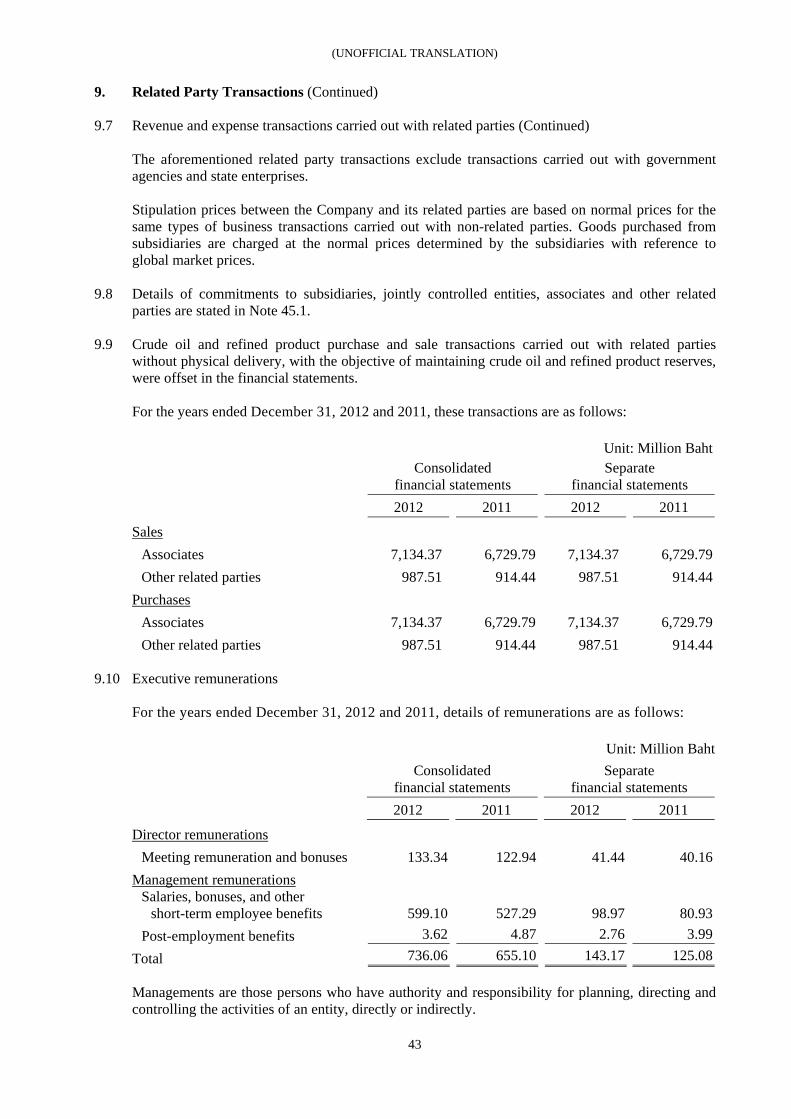
(UNOFFICIAL TRANSLATION)
43
9. Related Party Transactions (Continued)
9.7 Revenue and expense transactions carried out with related parties (Continued) The aforementioned related party transactions exclude transactions carried out with government agencies and state enterprises. Stipulation prices between the Company and its related parties are based on normal prices for the same types of business transactions carried out with non-related parties. Goods purchased from subsidiaries are charged at the normal prices determined by the subsidiaries with reference to global market prices.
9.8 Details of commitments to subsidiaries, jointly controlled entities, associates and other related parties are stated in Note 45.1.
9.9 Crude oil and refined product purchase and sale transactions carried out with related parties without physical delivery, with the objective of maintaining crude oil and refined product reserves, were offset in the financial statements. For the years ended December 31, 2012 and 2011, these transactions are as follows: Unit: Million Baht Consolidated
financial statements Separate
financial statements 2012 2011 2012 2011
Sales Associates 7,134.37 6,729.79 7,134.37 6,729.79 Other related parties 987.51 914.44 987.51 914.44 Purchases Associates 7,134.37 6,729.79 7,134.37 6,729.79 Other related parties 987.51 914.44 987.51 914.44
9.10 Executive remunerations For the years ended December 31, 2012 and 2011, details of remunerations are as follows:
Unit: Million Baht
Consolidated
financial statements Separate
financial statements
2012 2011 2012 2011
Director remunerations Meeting remuneration and bonuses 133.34 122.94 41.44 40.16 Management remunerations Salaries, bonuses, and other short-term employee benefits 599.10 527.29 98.97 80.93 Post-employment benefits 3.62 4.87 2.76 3.99
Total 736.06 655.10 143.17 125.08 Managements are those persons who have authority and responsibility for planning, directing and controlling the activities of an entity, directly or indirectly.
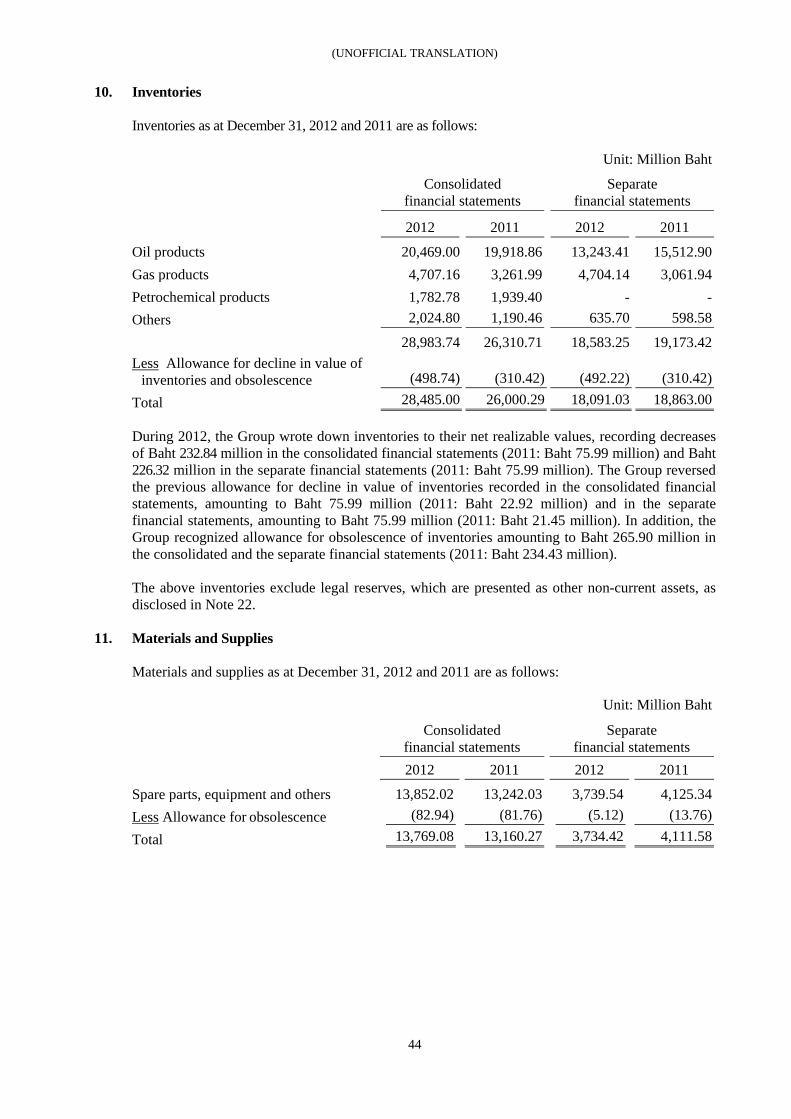
(UNOFFICIAL TRANSLATION)
44
10. Inventories Inventories as at December 31, 2012 and 2011 are as follows: Unit: Million Baht
Consolidated financial statements
Separate financial statements
2012 2011 2012 2011
Oil products 20,469.00 19,918.86 13,243.41 15,512.90 Gas products 4,707.16 3,261.99 4,704.14 3,061.94 Petrochemical products 1,782.78 1,939.40 - - Others 2,024.80 1,190.46 635.70 598.58
28,983.74 26,310.71 18,583.25 19,173.42 ULessU Allowance for decline in value of
inventories and obsolescence (498.74) (310.42) (492.22) (310.42)
Total 28,485.00 26,000.29 18,091.03 18,863.00 During 2012, the Group wrote down inventories to their net realizable values, recording decreases of Baht 232.84 million in the consolidated financial statements (2011: Baht 75.99 million) and Baht 226.32 million in the separate financial statements (2011: Baht 75.99 million). The Group reversed the previous allowance for decline in value of inventories recorded in the consolidated financial statements, amounting to Baht 75.99 million (2011: Baht 22.92 million) and in the separate financial statements, amounting to Baht 75.99 million (2011: Baht 21.45 million). In addition, the Group recognized allowance for obsolescence of inventories amounting to Baht 265.90 million in the consolidated and the separate financial statements (2011: Baht 234.43 million). The above inventories exclude legal reserves, which are presented as other non-current assets, as disclosed in Note 22.
11. Materials and Supplies Materials and supplies as at December 31, 2012 and 2011 are as follows: Unit: Million Baht Consolidated
financial statements Separate
financial statements 2012 2011 2012 2011
Spare parts, equipment and others 13,852.02 13,242.03 3,739.54 4,125.34 ULessU Allowance for obsolescence (82.94) (81.76) (5.12) (13.76)
Total 13,769.08 13,160.27 3,734.42 4,111.58
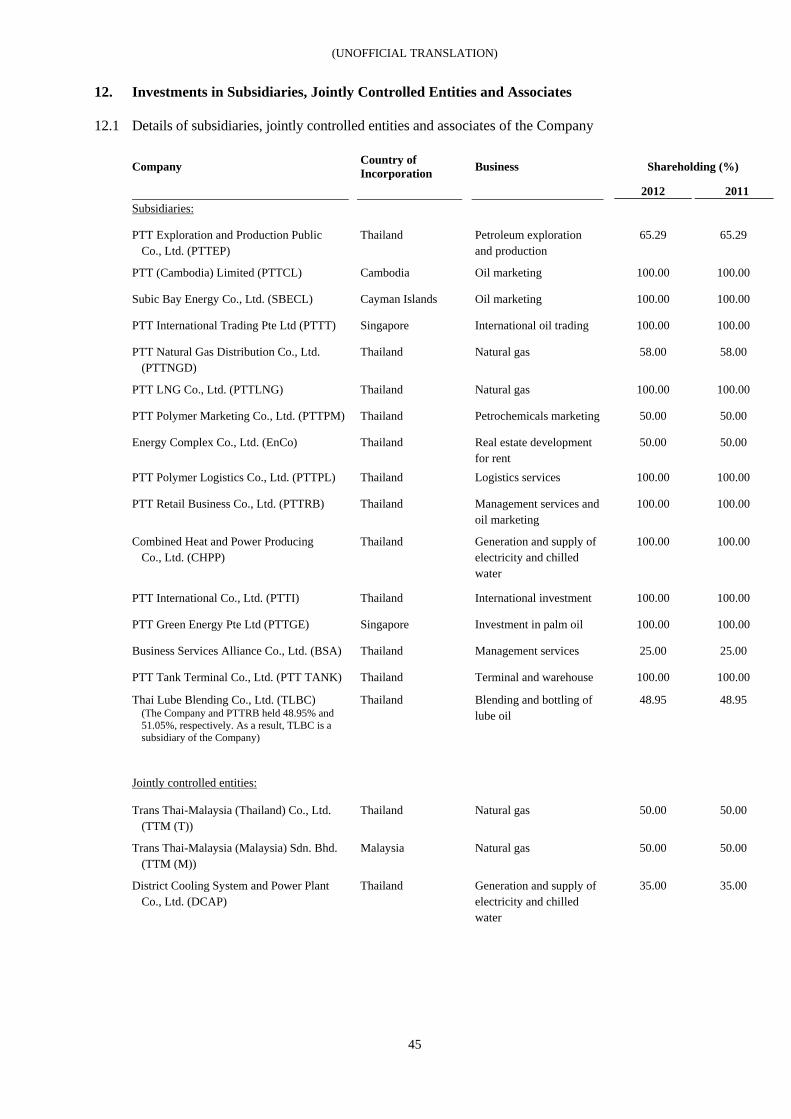
(UNOFFICIAL TRANSLATION)
45
12. Investments in Subsidiaries, Jointly Controlled Entities and Associates
12.1 Details of subsidiaries, jointly controlled entities and associates of the Company
Company Country of
Incorporation Business Shareholding (%)
2012 2011 Subsidiaries:
PTT Exploration and Production Public Co., Ltd. (PTTEP)
Thailand Petroleum exploration and production
65.29 65.29
PTT (Cambodia) Limited (PTTCL) Cambodia Oil marketing 100.00 100.00
Subic Bay Energy Co., Ltd. (SBECL) Cayman Islands Oil marketing 100.00 100.00
PTT International Trading Pte Ltd (PTTT) Singapore International oil trading 100.00 100.00
PTT Natural Gas Distribution Co., Ltd. (PTTNGD)
Thailand Natural gas 58.00 58.00
PTT LNG Co., Ltd. (PTTLNG) Thailand Natural gas 100.00 100.00
PTT Polymer Marketing Co., Ltd. (PTTPM) Thailand Petrochemicals marketing 50.00 50.00
Energy Complex Co., Ltd. (EnCo) Thailand Real estate development for rent
50.00 50.00
PTT Polymer Logistics Co., Ltd. (PTTPL) Thailand Logistics services 100.00 100.00
PTT Retail Business Co., Ltd. (PTTRB) Thailand Management services and oil marketing
100.00 100.00
Combined Heat and Power Producing Co., Ltd. (CHPP)
Thailand Generation and supply of electricity and chilled water
100.00 100.00
PTT International Co., Ltd. (PTTI) Thailand International investment 100.00 100.00
PTT Green Energy Pte Ltd (PTTGE) Singapore Investment in palm oil 100.00 100.00
Business Services Alliance Co., Ltd. (BSA) Thailand Management services 25.00 25.00
PTT Tank Terminal Co., Ltd. (PTT TANK) Thailand Terminal and warehouse 100.00 100.00
Thai Lube Blending Co., Ltd. (TLBC) (The Company and PTTRB held 48.95% and 51.05%, respectively. As a result, TLBC is a subsidiary of the Company)
Thailand Blending and bottling of lube oil
48.95 48.95
Jointly controlled entities:
Trans Thai-Malaysia (Thailand) Co., Ltd. (TTM (T))
Thailand Natural gas 50.00 50.00
Trans Thai-Malaysia (Malaysia) Sdn. Bhd. (TTM (M))
Malaysia Natural gas 50.00 50.00
District Cooling System and Power Plant Co., Ltd. (DCAP)
Thailand Generation and supply of electricity and chilled water
35.00 35.00
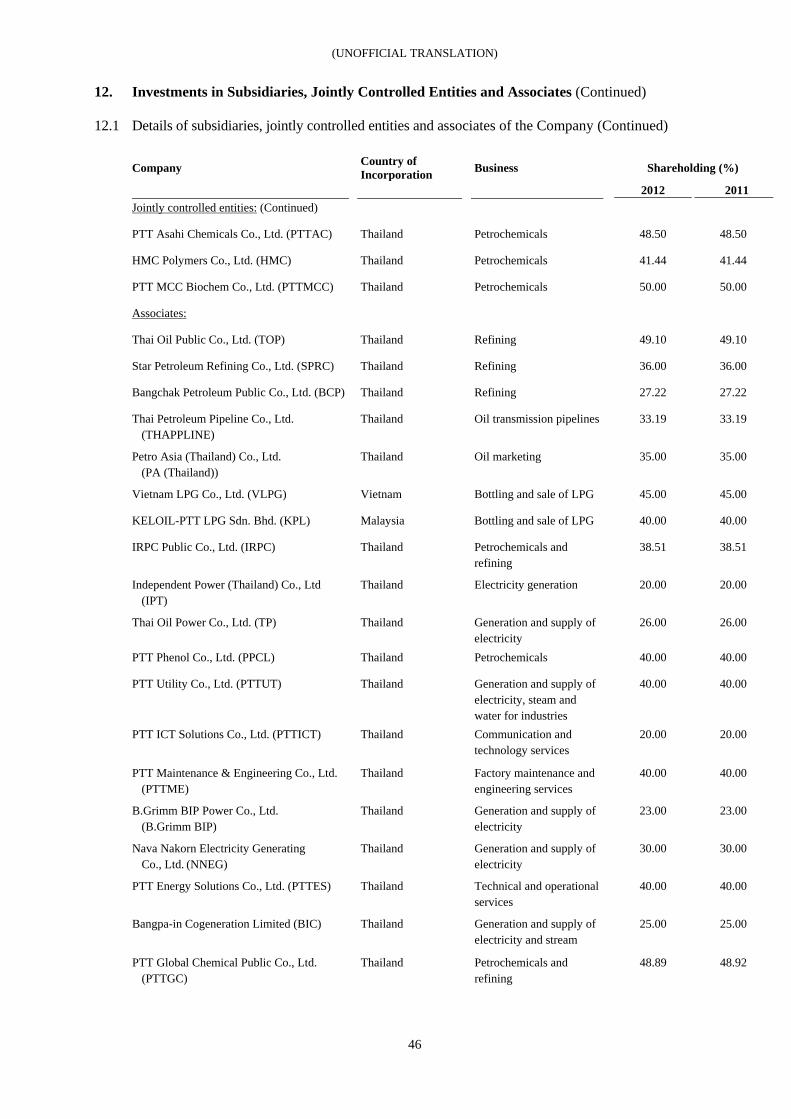
(UNOFFICIAL TRANSLATION)
46
12. Investments in Subsidiaries, Jointly Controlled Entities and Associates (Continued)
12.1 Details of subsidiaries, jointly controlled entities and associates of the Company (Continued)
Company Country of Incorporation Business Shareholding (%)
2012 2011 Jointly controlled entities: (Continued)
PTT Asahi Chemicals Co., Ltd. (PTTAC) Thailand Petrochemicals 48.50 48.50
HMC Polymers Co., Ltd. (HMC) Thailand Petrochemicals 41.44 41.44
PTT MCC Biochem Co., Ltd. (PTTMCC) Thailand Petrochemicals 50.00 50.00
Associates:
Thai Oil Public Co., Ltd. (TOP) Thailand Refining 49.10 49.10
Star Petroleum Refining Co., Ltd. (SPRC) Thailand Refining 36.00 36.00
Bangchak Petroleum Public Co., Ltd. (BCP) Thailand Refining 27.22 27.22
Thai Petroleum Pipeline Co., Ltd. (THAPPLINE)
Thailand Oil transmission pipelines 33.19 33.19
Petro Asia (Thailand) Co., Ltd. (PA (Thailand))
Thailand Oil marketing 35.00 35.00
Vietnam LPG Co., Ltd. (VLPG)
Vietnam Bottling and sale of LPG 45.00 45.00
KELOIL-PTT LPG Sdn. Bhd. (KPL) Malaysia Bottling and sale of LPG 40.00 40.00
IRPC Public Co., Ltd. (IRPC) Thailand Petrochemicals and refining
38.51 38.51
Independent Power (Thailand) Co., Ltd (IPT)
Thailand Electricity generation 20.00 20.00
Thai Oil Power Co., Ltd. (TP) Thailand Generation and supply of electricity
26.00 26.00
PTT Phenol Co., Ltd. (PPCL) Thailand Petrochemicals 40.00 40.00
PTT Utility Co., Ltd. (PTTUT) Thailand
Generation and supply of electricity, steam and water for industries
40.00 40.00
PTT ICT Solutions Co., Ltd. (PTTICT) Thailand
Communication and technology services
20.00 20.00
PTT Maintenance & Engineering Co., Ltd. (PTTME)
Thailand Factory maintenance and engineering services
40.00 40.00
B.Grimm BIP Power Co., Ltd. (B.Grimm BIP)
Thailand Generation and supply of electricity
23.00 23.00
Nava Nakorn Electricity Generating Co., Ltd. (NNEG)
Thailand Generation and supply of electricity
30.00 30.00
PTT Energy Solutions Co., Ltd. (PTTES) Thailand Technical and operational services
40.00 40.00
Bangpa-in Cogeneration Limited (BIC) Thailand Generation and supply of electricity and stream
25.00 25.00
PTT Global Chemical Public Co., Ltd. (PTTGC)
Thailand Petrochemicals and refining
48.89 48.92
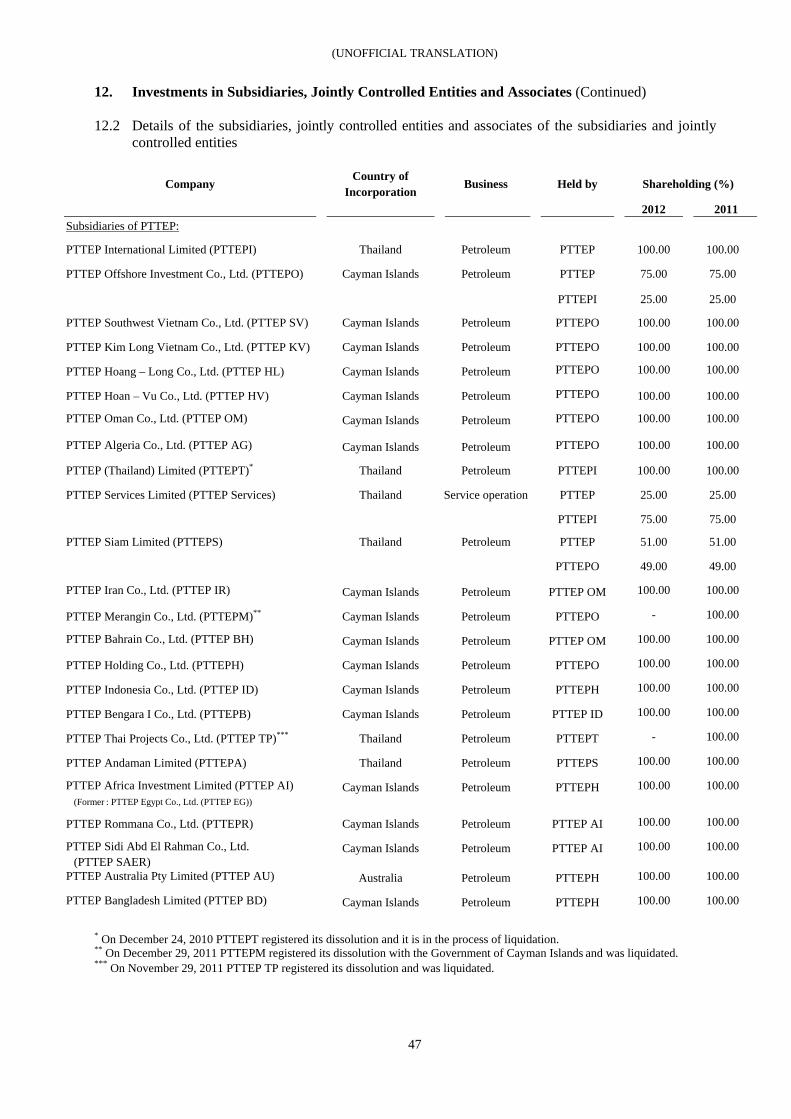
(UNOFFICIAL TRANSLATION)
47
12. Investments in Subsidiaries, Jointly Controlled Entities and Associates (Continued)
12.2 Details of the subsidiaries, jointly controlled entities and associates of the subsidiaries and jointly controlled entities
Company Country of
Incorporation Business Held by Shareholding (%)
2012 2011 Subsidiaries of PTTEP:
PTTEP International Limited (PTTEPI) Thailand Petroleum PTTEP 100.00 100.00
PTTEP Offshore Investment Co., Ltd. (PTTEPO) Cayman Islands Petroleum PTTEP 75.00 75.00
PTTEPI 25.00 25.00
PTTEP Southwest Vietnam Co., Ltd. (PTTEP SV) Cayman Islands Petroleum PTTEPO 100.00 100.00
PTTEP Kim Long Vietnam Co., Ltd. (PTTEP KV) Cayman Islands Petroleum PTTEPO 100.00 100.00
PTTEP Hoang – Long Co., Ltd. (PTTEP HL) Cayman Islands Petroleum PTTEPO 100.00 100.00
PTTEP Hoan – Vu Co., Ltd. (PTTEP HV) Cayman Islands Petroleum PTTEPO 100.00 100.00
PTTEP Oman Co., Ltd. (PTTEP OM) Cayman Islands Petroleum PTTEPO 100.00 100.00
PTTEP Algeria Co., Ltd. (PTTEP AG) Cayman Islands Petroleum PTTEPO 100.00 100.00
PTTEP (Thailand) Limited (PTTEPT)* Thailand Petroleum PTTEPI 100.00 100.00
PTTEP Services Limited (PTTEP Services) Thailand Service operation PTTEP 25.00 25.00
PTTEPI 75.00 75.00
PTTEP Siam Limited (PTTEPS) Thailand Petroleum PTTEP 51.00 51.00
PTTEPO 49.00 49.00
PTTEP Iran Co., Ltd. (PTTEP IR) Cayman Islands Petroleum PTTEP OM 100.00 100.00
PTTEP Merangin Co., Ltd. (PTTEPM)** Cayman Islands Petroleum PTTEPO - 100.00
PTTEP Bahrain Co., Ltd. (PTTEP BH) Cayman Islands Petroleum PTTEP OM 100.00 100.00
PTTEP Holding Co., Ltd. (PTTEPH) Cayman Islands Petroleum PTTEPO 100.00 100.00
PTTEP Indonesia Co., Ltd. (PTTEP ID) Cayman Islands Petroleum PTTEPH 100.00 100.00
PTTEP Bengara I Co., Ltd. (PTTEPB) Cayman Islands Petroleum PTTEP ID 100.00 100.00
PTTEP Thai Projects Co., Ltd. (PTTEP TP)*** Thailand Petroleum PTTEPT - 100.00
PTTEP Andaman Limited (PTTEPA) Thailand Petroleum PTTEPS 100.00 100.00
PTTEP Africa Investment Limited (PTTEP AI) (Former : PTTEP Egypt Co., Ltd. (PTTEP EG))
Cayman Islands Petroleum PTTEPH 100.00 100.00
PTTEP Rommana Co., Ltd. (PTTEPR) Cayman Islands Petroleum PTTEP AI 100.00 100.00
PTTEP Sidi Abd El Rahman Co., Ltd. (PTTEP SAER)
Cayman Islands Petroleum PTTEP AI 100.00 100.00
PTTEP Australia Pty Limited (PTTEP AU) Australia Petroleum PTTEPH 100.00 100.00
PTTEP Bangladesh Limited (PTTEP BD) Cayman Islands Petroleum PTTEPH 100.00 100.00
* On December 24, 2010 PTTEPT registered its dissolution and it is in the process of liquidation. ** On December 29, 2011 PTTEPM registered its dissolution with the Government of Cayman Islands and was liquidated. *** On November 29, 2011 PTTEP TP registered its dissolution and was liquidated.
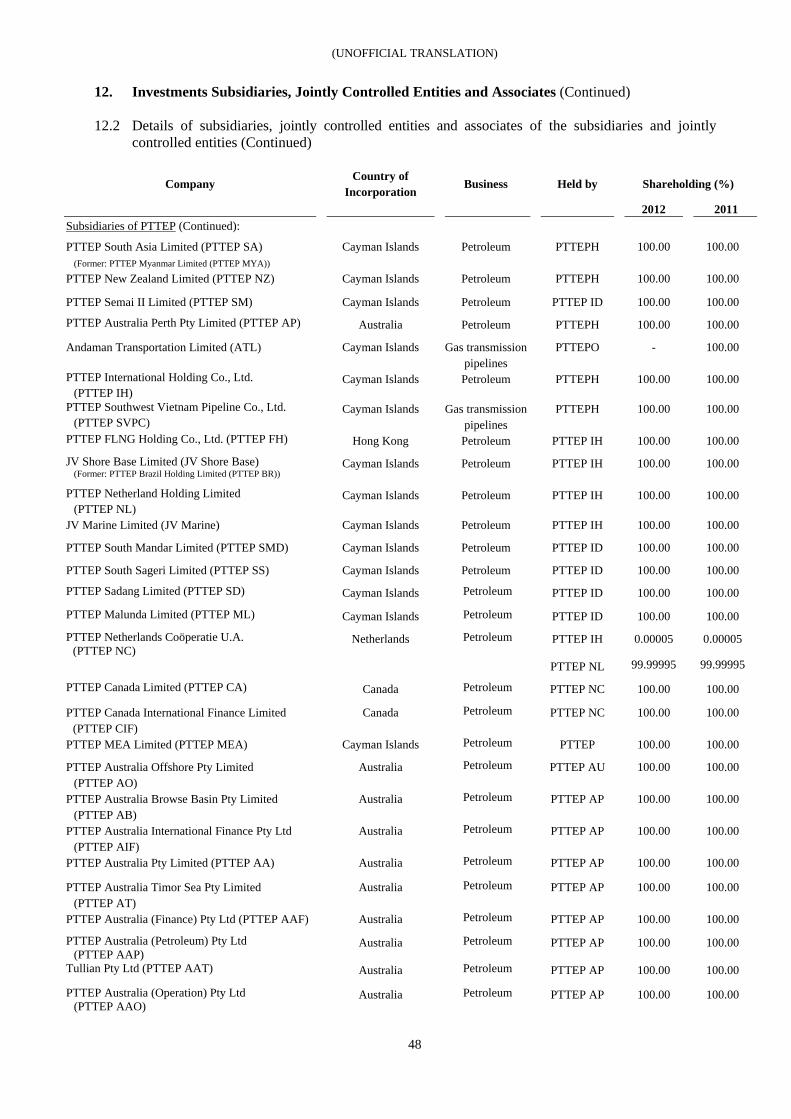
(UNOFFICIAL TRANSLATION)
48
12. Investments Subsidiaries, Jointly Controlled Entities and Associates (Continued)
12.2 Details of subsidiaries, jointly controlled entities and associates of the subsidiaries and jointly
controlled entities (Continued)
Company Country of
Incorporation Business Held by Shareholding (%)
2012 2011 Subsidiaries of PTTEP (Continued):
PTTEP South Asia Limited (PTTEP SA) (Former: PTTEP Myanmar Limited (PTTEP MYA))
Cayman Islands Petroleum PTTEPH 100.00 100.00
PTTEP New Zealand Limited (PTTEP NZ) Cayman Islands Petroleum PTTEPH 100.00 100.00
PTTEP Semai II Limited (PTTEP SM) Cayman Islands Petroleum PTTEP ID 100.00 100.00
PTTEP Australia Perth Pty Limited (PTTEP AP) Australia Petroleum PTTEPH 100.00 100.00
Andaman Transportation Limited (ATL) Cayman Islands Gas transmission pipelines
PTTEPO - 100.00
PTTEP International Holding Co., Ltd. (PTTEP IH)
Cayman Islands Petroleum PTTEPH 100.00 100.00
PTTEP Southwest Vietnam Pipeline Co., Ltd. (PTTEP SVPC)
Cayman Islands Gas transmission pipelines
PTTEPH 100.00 100.00
PTTEP FLNG Holding Co., Ltd. (PTTEP FH) Hong Kong Petroleum PTTEP IH 100.00 100.00
JV Shore Base Limited (JV Shore Base) (Former: PTTEP Brazil Holding Limited (PTTEP BR))
Cayman Islands Petroleum PTTEP IH 100.00 100.00
PTTEP Netherland Holding Limited (PTTEP NL)
Cayman Islands Petroleum PTTEP IH 100.00 100.00
JV Marine Limited (JV Marine) Cayman Islands Petroleum PTTEP IH 100.00 100.00
PTTEP South Mandar Limited (PTTEP SMD) Cayman Islands Petroleum PTTEP ID 100.00 100.00
PTTEP South Sageri Limited (PTTEP SS) Cayman Islands Petroleum PTTEP ID 100.00 100.00
PTTEP Sadang Limited (PTTEP SD) Cayman Islands Petroleum PTTEP ID 100.00 100.00
PTTEP Malunda Limited (PTTEP ML) Cayman Islands Petroleum PTTEP ID 100.00 100.00
PTTEP Netherlands Coöperatie U.A. (PTTEP NC)
Netherlands Petroleum PTTEP IH 0.00005 0.00005
PTTEP NL 99.99995 99.99995
PTTEP Canada Limited (PTTEP CA) Canada Petroleum PTTEP NC 100.00 100.00
PTTEP Canada International Finance Limited (PTTEP CIF)
Canada Petroleum PTTEP NC 100.00 100.00
PTTEP MEA Limited (PTTEP MEA) Cayman Islands Petroleum PTTEP 100.00 100.00
PTTEP Australia Offshore Pty Limited (PTTEP AO)
Australia Petroleum PTTEP AU 100.00 100.00
PTTEP Australia Browse Basin Pty Limited (PTTEP AB)
Australia Petroleum PTTEP AP 100.00 100.00
PTTEP Australia International Finance Pty Ltd (PTTEP AIF)
Australia Petroleum PTTEP AP 100.00 100.00
PTTEP Australia Pty Limited (PTTEP AA) Australia Petroleum PTTEP AP 100.00 100.00
PTTEP Australia Timor Sea Pty Limited (PTTEP AT)
Australia Petroleum PTTEP AP 100.00 100.00
PTTEP Australia (Finance) Pty Ltd (PTTEP AAF) Australia Petroleum PTTEP AP 100.00 100.00
PTTEP Australia (Petroleum) Pty Ltd (PTTEP AAP)
Australia Petroleum PTTEP AP 100.00 100.00
Tullian Pty Ltd (PTTEP AAT) Australia Petroleum PTTEP AP 100.00 100.00
PTTEP Australia (Operation) Pty Ltd (PTTEP AAO)
Australia Petroleum PTTEP AP 100.00 100.00
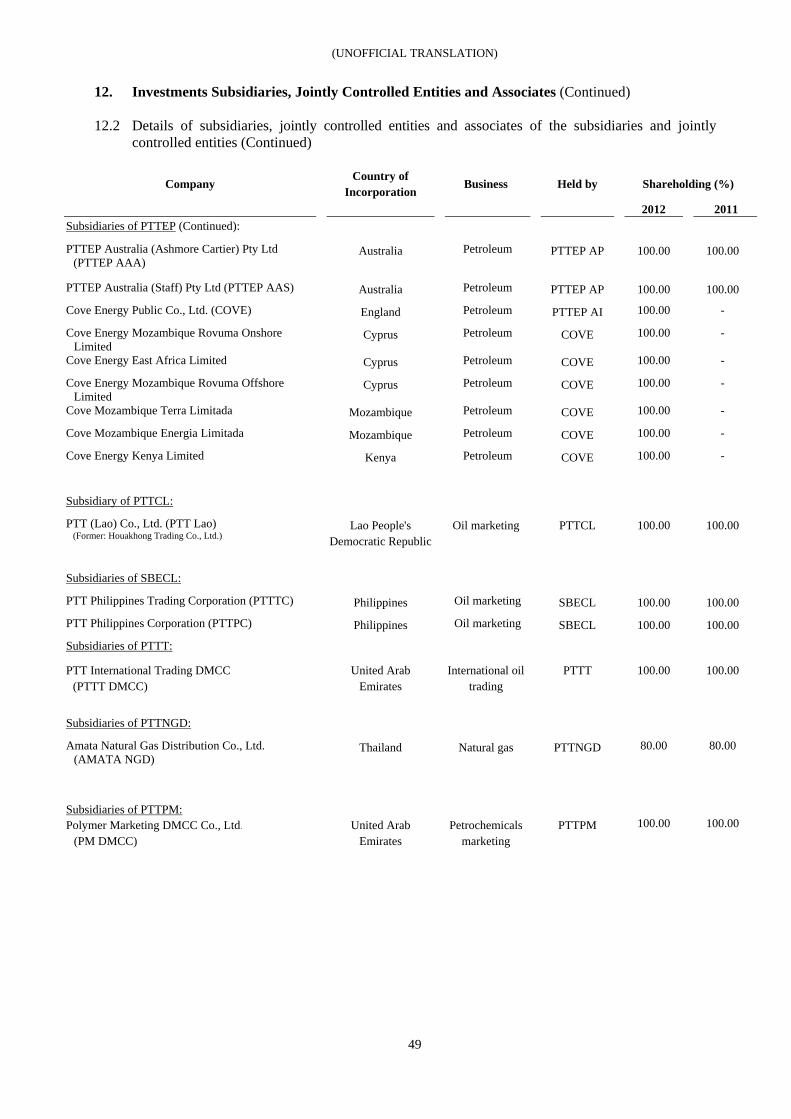
(UNOFFICIAL TRANSLATION)
49
12. Investments Subsidiaries, Jointly Controlled Entities and Associates (Continued)
12.2 Details of subsidiaries, jointly controlled entities and associates of the subsidiaries and jointly
controlled entities (Continued)
Company Country of
Incorporation Business Held by Shareholding (%)
2012 2011 Subsidiaries of PTTEP (Continued):
PTTEP Australia (Ashmore Cartier) Pty Ltd (PTTEP AAA)
Australia Petroleum PTTEP AP 100.00 100.00
PTTEP Australia (Staff) Pty Ltd (PTTEP AAS) Australia Petroleum PTTEP AP 100.00 100.00
Cove Energy Public Co., Ltd. (COVE) England Petroleum PTTEP AI 100.00 -
Cove Energy Mozambique Rovuma Onshore Limited
Cyprus Petroleum COVE 100.00 -
Cove Energy East Africa Limited Cyprus Petroleum COVE 100.00 -
Cove Energy Mozambique Rovuma Offshore Limited
Cyprus Petroleum COVE 100.00 -
Cove Mozambique Terra Limitada Mozambique Petroleum COVE 100.00 -
Cove Mozambique Energia Limitada Mozambique Petroleum COVE 100.00 -
Cove Energy Kenya Limited Kenya Petroleum COVE 100.00 -
Subsidiary of PTTCL:
PTT (Lao) Co., Ltd. (PTT Lao) (Former: Houakhong Trading Co., Ltd.)
Lao People's Democratic Republic
Oil marketing PTTCL 100.00 100.00
Subsidiaries of SBECL:
PTT Philippines Trading Corporation (PTTTC) Philippines Oil marketing SBECL 100.00 100.00
PTT Philippines Corporation (PTTPC) Philippines Oil marketing SBECL 100.00 100.00
Subsidiaries of PTTT:
PTT International Trading DMCC (PTTT DMCC)
United Arab Emirates
International oil trading
PTTT
100.00 100.00
Subsidiaries of PTTNGD:
Amata Natural Gas Distribution Co., Ltd. (AMATA NGD)
Thailand Natural gas PTTNGD 80.00 80.00
Subsidiaries of PTTPM:
Polymer Marketing DMCC Co., Ltd. (PM DMCC)
United Arab Emirates
Petrochemicals marketing
PTTPM 100.00 100.00
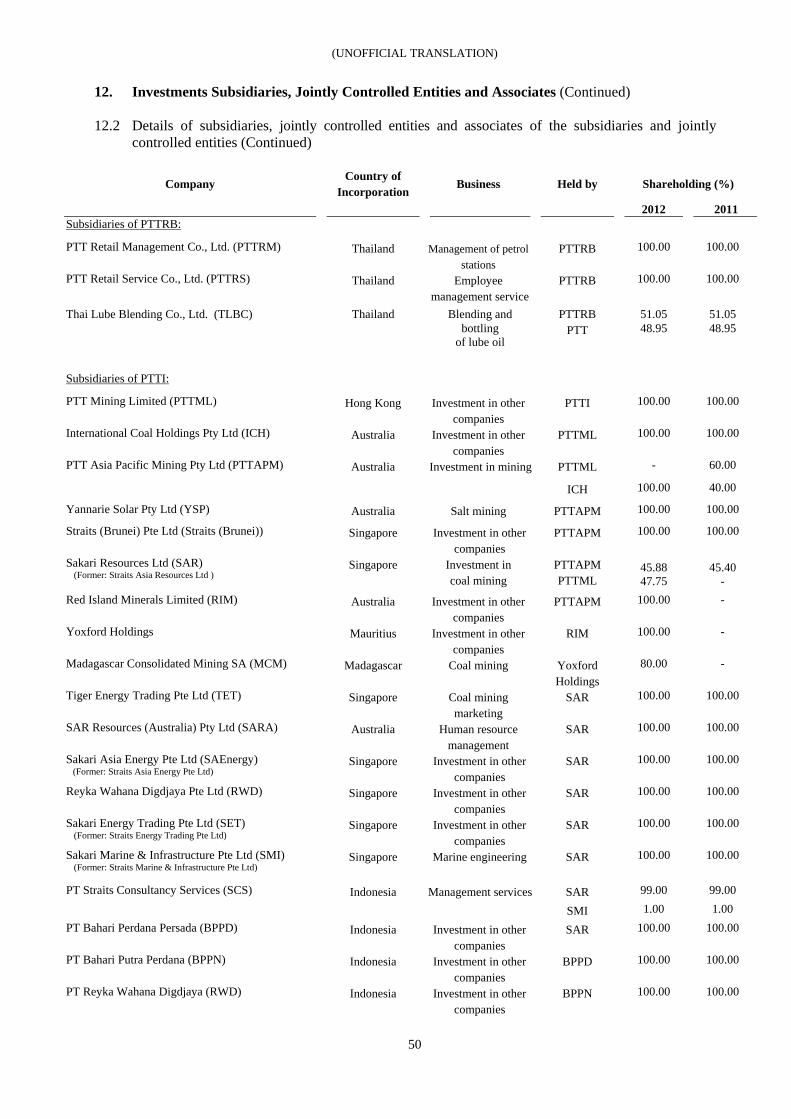
(UNOFFICIAL TRANSLATION)
50
12. Investments Subsidiaries, Jointly Controlled Entities and Associates (Continued)
12.2 Details of subsidiaries, jointly controlled entities and associates of the subsidiaries and jointly
controlled entities (Continued)
Company Country of
Incorporation Business Held by Shareholding (%)
2012 2011 Subsidiaries of PTTRB:
PTT Retail Management Co., Ltd. (PTTRM) Thailand Management of petrol stations
PTTRB 100.00 100.00
PTT Retail Service Co., Ltd. (PTTRS) Thailand Employee management service
PTTRB 100.00 100.00
Thai Lube Blending Co., Ltd. (TLBC) Thailand Blending and PTTRB 51.05 51.05
bottling of lube oil
PTT 48.95 48.95
Subsidiaries of PTTI:
PTT Mining Limited (PTTML) Hong Kong Investment in other companies
PTTI 100.00 100.00
International Coal Holdings Pty Ltd (ICH) Australia Investment in other companies
PTTML 100.00 100.00
PTT Asia Pacific Mining Pty Ltd (PTTAPM) Australia Investment in mining PTTML - 60.00
ICH 100.00 40.00
Yannarie Solar Pty Ltd (YSP) Australia Salt mining PTTAPM 100.00 100.00
Straits (Brunei) Pte Ltd (Straits (Brunei)) Singapore Investment in other companies
PTTAPM 100.00 100.00
Sakari Resources Ltd (SAR) (Former: Straits Asia Resources Ltd )
Singapore Investment in coal mining
PTTAPM PTTML
45.88 47.75
45.40 -
Red Island Minerals Limited (RIM) Australia Investment in other companies
PTTAPM 100.00 -
Yoxford Holdings Mauritius Investment in other companies
RIM 100.00 -
Madagascar Consolidated Mining SA (MCM) Madagascar Coal mining Yoxford Holdings
80.00 -
Tiger Energy Trading Pte Ltd (TET) Singapore Coal mining marketing
SAR 100.00 100.00
SAR Resources (Australia) Pty Ltd (SARA) Australia Human resource management
SAR 100.00 100.00
Sakari Asia Energy Pte Ltd (SAEnergy) (Former: Straits Asia Energy Pte Ltd)
Singapore Investment in other companies
SAR 100.00 100.00
Reyka Wahana Digdjaya Pte Ltd (RWD) Singapore Investment in other companies
SAR 100.00 100.00
Sakari Energy Trading Pte Ltd (SET) (Former: Straits Energy Trading Pte Ltd)
Singapore Investment in other companies
SAR 100.00 100.00
Sakari Marine & Infrastructure Pte Ltd (SMI) (Former: Straits Marine & Infrastructure Pte Ltd)
Singapore Marine engineering SAR 100.00 100.00
PT Straits Consultancy Services (SCS) Indonesia Management services SAR 99.00 99.00 SMI 1.00 1.00 PT Bahari Perdana Persada (BPPD) Indonesia Investment in other
companies SAR 100.00 100.00
PT Bahari Putra Perdana (BPPN) Indonesia Investment in other companies
BPPD 100.00 100.00
PT Reyka Wahana Digdjaya (RWD) Indonesia Investment in other companies
BPPN 100.00 100.00
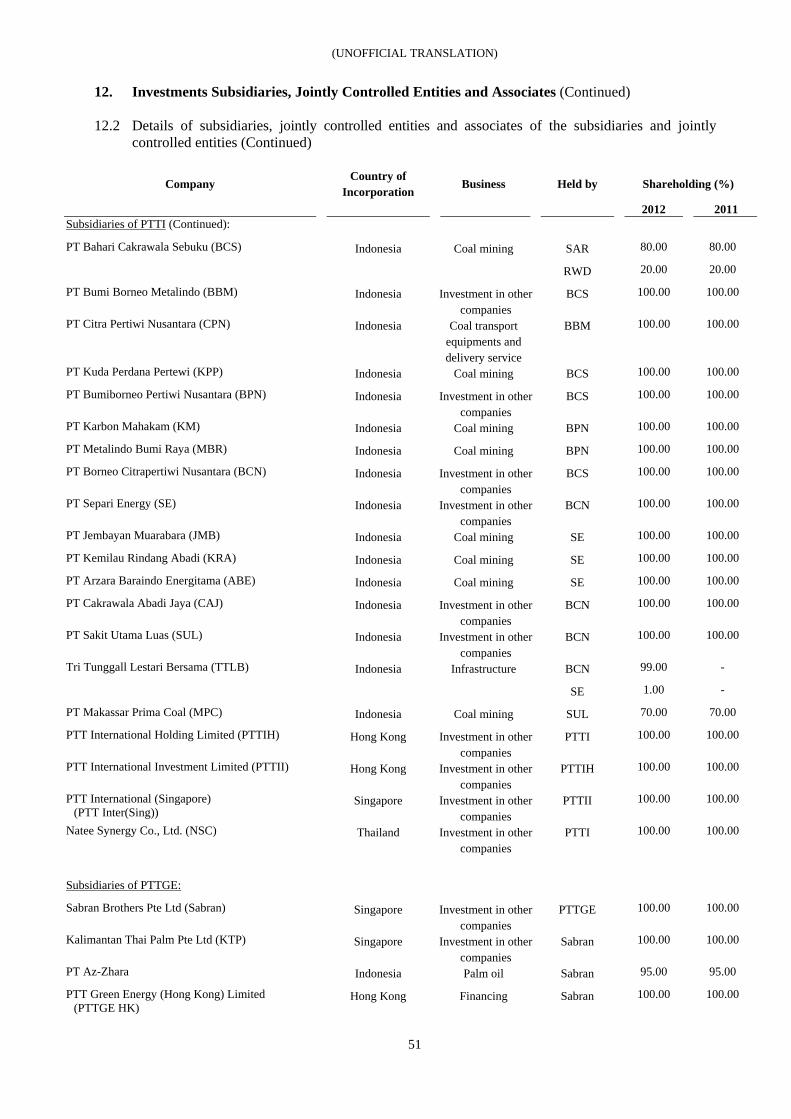
(UNOFFICIAL TRANSLATION)
51
12. Investments Subsidiaries, Jointly Controlled Entities and Associates (Continued)
12.2 Details of subsidiaries, jointly controlled entities and associates of the subsidiaries and jointly
controlled entities (Continued)
Company Country of
Incorporation Business Held by Shareholding (%)
2012 2011 Subsidiaries of PTTI (Continued):
PT Bahari Cakrawala Sebuku (BCS) Indonesia Coal mining SAR 80.00 80.00
RWD 20.00 20.00
PT Bumi Borneo Metalindo (BBM) Indonesia Investment in other companies
BCS 100.00 100.00
PT Citra Pertiwi Nusantara (CPN) Indonesia Coal transport equipments and delivery service
BBM 100.00 100.00
PT Kuda Perdana Pertewi (KPP) Indonesia Coal mining BCS 100.00 100.00
PT Bumiborneo Pertiwi Nusantara (BPN) Indonesia Investment in other companies
BCS 100.00 100.00
PT Karbon Mahakam (KM) Indonesia Coal mining BPN 100.00 100.00
PT Metalindo Bumi Raya (MBR) Indonesia Coal mining BPN 100.00 100.00
PT Borneo Citrapertiwi Nusantara (BCN) Indonesia Investment in other companies
BCS 100.00 100.00
PT Separi Energy (SE) Indonesia Investment in other companies
BCN 100.00 100.00
PT Jembayan Muarabara (JMB) Indonesia Coal mining SE 100.00 100.00
PT Kemilau Rindang Abadi (KRA) Indonesia Coal mining SE 100.00 100.00
PT Arzara Baraindo Energitama (ABE) Indonesia Coal mining SE 100.00 100.00
PT Cakrawala Abadi Jaya (CAJ) Indonesia Investment in other companies
BCN 100.00 100.00
PT Sakit Utama Luas (SUL) Indonesia Investment in other companies
BCN 100.00 100.00
Tri Tunggall Lestari Bersama (TTLB) Indonesia Infrastructure BCN 99.00 -
SE 1.00 -
PT Makassar Prima Coal (MPC) Indonesia Coal mining SUL 70.00 70.00
PTT International Holding Limited (PTTIH) Hong Kong Investment in other companies
PTTI 100.00 100.00
PTT International Investment Limited (PTTII) Hong Kong Investment in other companies
PTTIH 100.00 100.00
PTT International (Singapore) (PTT Inter(Sing))
Singapore Investment in other companies
PTTII 100.00 100.00
Natee Synergy Co., Ltd. (NSC) Thailand Investment in other companies
PTTI 100.00 100.00
Subsidiaries of PTTGE:
Sabran Brothers Pte Ltd (Sabran) Singapore Investment in other companies
PTTGE 100.00 100.00
Kalimantan Thai Palm Pte Ltd (KTP) Singapore Investment in other companies
Sabran 100.00 100.00
PT Az-Zhara Indonesia Palm oil Sabran 95.00 95.00
PTT Green Energy (Hong Kong) Limited (PTTGE HK)
Hong Kong Financing Sabran 100.00 100.00
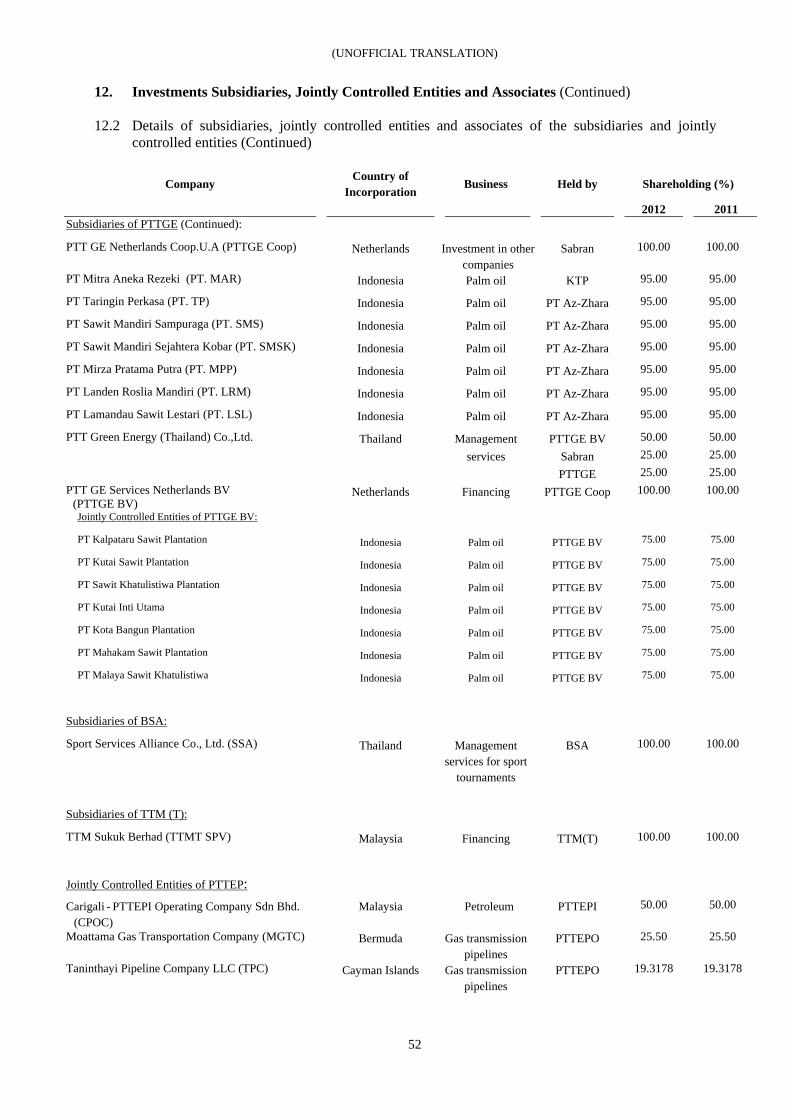
(UNOFFICIAL TRANSLATION)
52
12. Investments Subsidiaries, Jointly Controlled Entities and Associates (Continued)
12.2 Details of subsidiaries, jointly controlled entities and associates of the subsidiaries and jointly
controlled entities (Continued)
Company Country of
Incorporation Business Held by Shareholding (%)
2012 2011 Subsidiaries of PTTGE (Continued):
PTT GE Netherlands Coop.U.A (PTTGE Coop) Netherlands Investment in other companies
Sabran 100.00 100.00
PT Mitra Aneka Rezeki (PT. MAR) Indonesia Palm oil KTP 95.00 95.00
PT Taringin Perkasa (PT. TP) Indonesia Palm oil PT Az-Zhara 95.00 95.00
PT Sawit Mandiri Sampuraga (PT. SMS) Indonesia Palm oil PT Az-Zhara 95.00 95.00
PT Sawit Mandiri Sejahtera Kobar (PT. SMSK) Indonesia Palm oil PT Az-Zhara 95.00 95.00
PT Mirza Pratama Putra (PT. MPP) Indonesia Palm oil PT Az-Zhara 95.00 95.00
PT Landen Roslia Mandiri (PT. LRM) Indonesia Palm oil PT Az-Zhara 95.00 95.00
PT Lamandau Sawit Lestari (PT. LSL) Indonesia Palm oil PT Az-Zhara 95.00 95.00
PTT Green Energy (Thailand) Co.,Ltd. Thailand Management PTTGE BV 50.00 50.00 services Sabran 25.00 25.00 PTTGE 25.00 25.00 PTT GE Services Netherlands BV
(PTTGE BV) Netherlands Financing PTTGE Coop 100.00 100.00
Jointly Controlled Entities of PTTGE BV:
PT Kalpataru Sawit Plantation Indonesia Palm oil PTTGE BV 75.00 75.00
PT Kutai Sawit Plantation Indonesia Palm oil PTTGE BV 75.00 75.00
PT Sawit Khatulistiwa Plantation Indonesia Palm oil PTTGE BV 75.00 75.00
PT Kutai Inti Utama Indonesia Palm oil PTTGE BV 75.00 75.00
PT Kota Bangun Plantation Indonesia Palm oil PTTGE BV 75.00 75.00
PT Mahakam Sawit Plantation Indonesia Palm oil PTTGE BV 75.00 75.00
PT Malaya Sawit Khatulistiwa Indonesia Palm oil PTTGE BV 75.00 75.00
Subsidiaries of BSA:
Sport Services Alliance Co., Ltd. (SSA) Thailand Management services for sport
tournaments
BSA 100.00 100.00
Subsidiaries of TTM (T):
TTM Sukuk Berhad (TTMT SPV) Malaysia Financing TTM(T) 100.00 100.00
Jointly Controlled Entities of PTTEP:
Carigali - PTTEPI Operating Company Sdn Bhd. (CPOC)
Malaysia Petroleum
PTTEPI
50.00 50.00
Moattama Gas Transportation Company (MGTC) Bermuda Gas transmission pipelines
PTTEPO 25.50 25.50
Taninthayi Pipeline Company LLC (TPC) Cayman Islands Gas transmission pipelines
PTTEPO 19.3178
19.3178
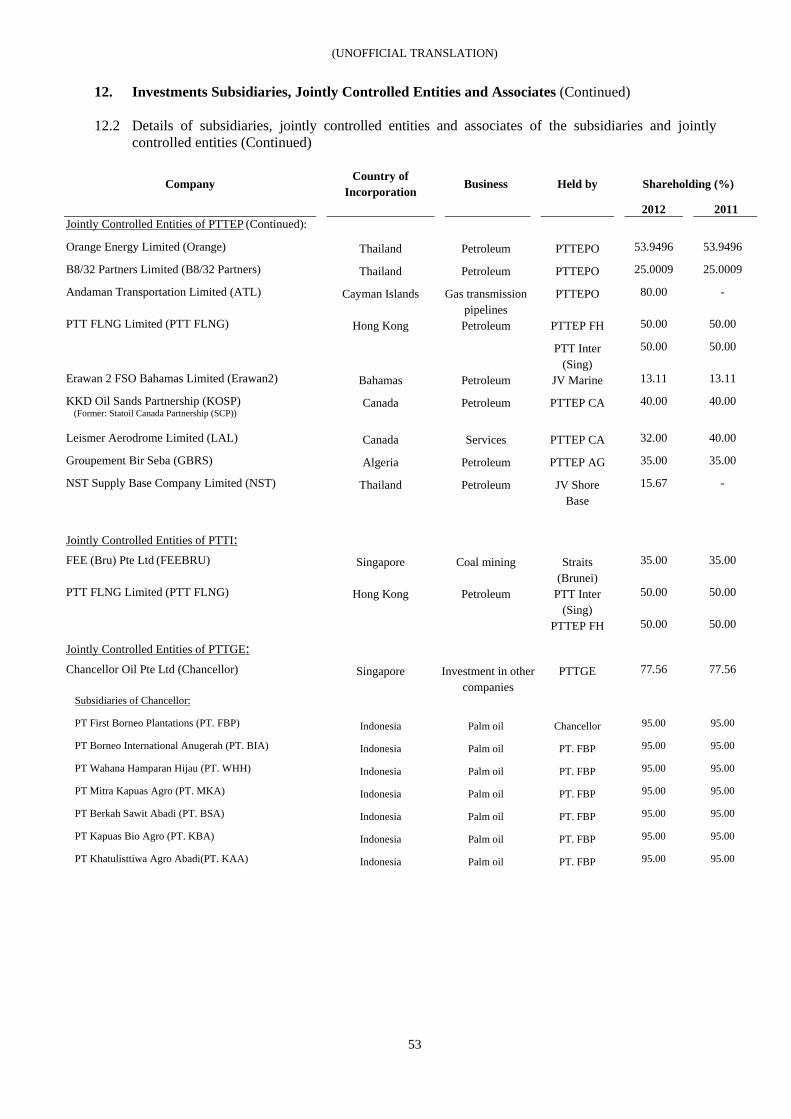
(UNOFFICIAL TRANSLATION)
53
12. Investments Subsidiaries, Jointly Controlled Entities and Associates (Continued)
12.2 Details of subsidiaries, jointly controlled entities and associates of the subsidiaries and jointly
controlled entities (Continued)
Company Country of
Incorporation Business Held by Shareholding (%)
2012 2011 Jointly Controlled Entities of PTTEP (Continued):
Orange Energy Limited (Orange) Thailand Petroleum PTTEPO 53.9496 53.9496
B8/32 Partners Limited (B8/32 Partners) Thailand Petroleum PTTEPO 25.0009 25.0009
Andaman Transportation Limited (ATL) Cayman Islands Gas transmission pipelines
PTTEPO 80.00 -
PTT FLNG Limited (PTT FLNG) Hong Kong Petroleum PTTEP FH 50.00 50.00
PTT Inter (Sing)
50.00 50.00
Erawan 2 FSO Bahamas Limited (Erawan2) Bahamas Petroleum JV Marine 13.11 13.11
KKD Oil Sands Partnership (KOSP) (Former: Statoil Canada Partnership (SCP))
Canada Petroleum PTTEP CA 40.00 40.00
Leismer Aerodrome Limited (LAL) Canada Services PTTEP CA 32.00 40.00
Groupement Bir Seba (GBRS) Algeria Petroleum PTTEP AG 35.00 35.00
NST Supply Base Company Limited (NST) Thailand Petroleum JV Shore Base
15.67 -
Jointly Controlled Entities of PTTI:
FEE (Bru) Pte Ltd (FEEBRU) Singapore Coal mining Straits (Brunei)
35.00 35.00
PTT FLNG Limited (PTT FLNG) Hong Kong Petroleum PTT Inter (Sing)
50.00 50.00
PTTEP FH 50.00 50.00
Jointly Controlled Entities of PTTGE:
Chancellor Oil Pte Ltd (Chancellor) Singapore Investment in other companies
PTTGE 77.56 77.56
Subsidiaries of Chancellor:
PT First Borneo Plantations (PT. FBP) Indonesia Palm oil Chancellor 95.00 95.00
PT Borneo International Anugerah (PT. BIA) Indonesia Palm oil PT. FBP 95.00 95.00
PT Wahana Hamparan Hijau (PT. WHH) Indonesia Palm oil PT. FBP 95.00 95.00
PT Mitra Kapuas Agro (PT. MKA) Indonesia Palm oil PT. FBP 95.00 95.00
PT Berkah Sawit Abadi (PT. BSA) Indonesia Palm oil PT. FBP 95.00 95.00
PT Kapuas Bio Agro (PT. KBA) Indonesia Palm oil PT. FBP 95.00 95.00
PT Khatulisttiwa Agro Abadi(PT. KAA) Indonesia Palm oil PT. FBP 95.00 95.00
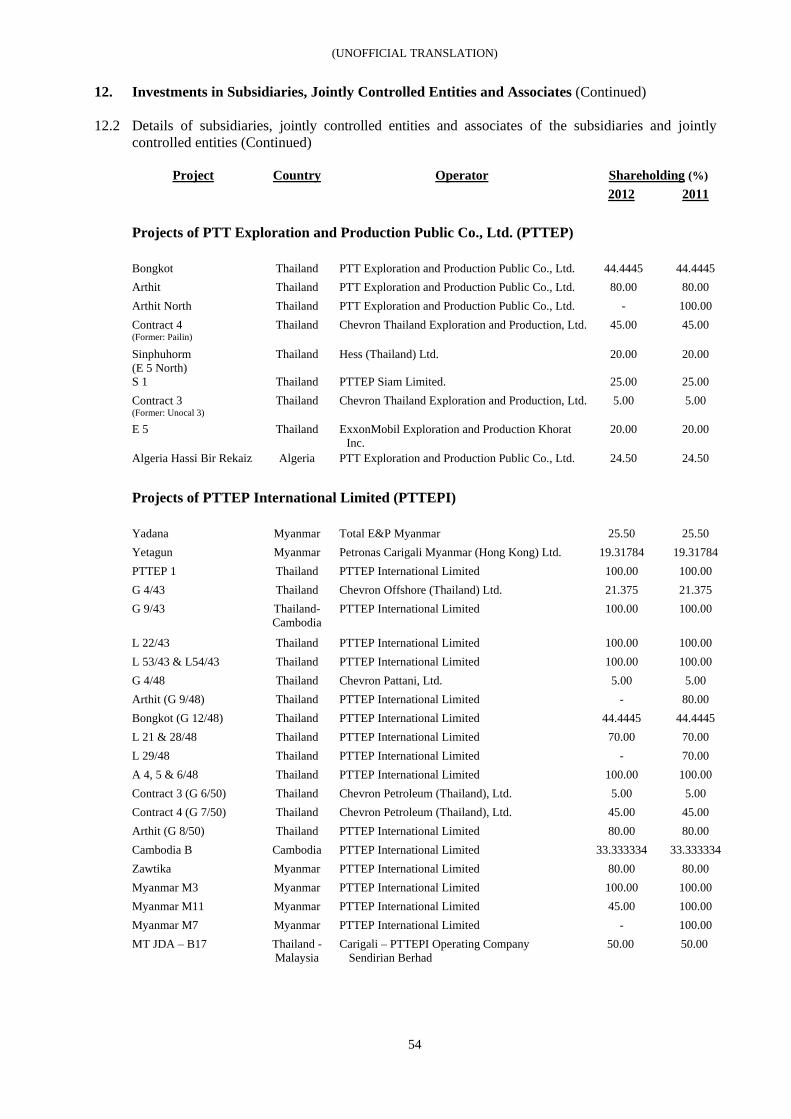
(UNOFFICIAL TRANSLATION)
54
12. Investments in Subsidiaries, Jointly Controlled Entities and Associates (Continued)
12.2 Details of subsidiaries, jointly controlled entities and associates of the subsidiaries and jointly controlled entities (Continued)
Project Country Operator Shareholding (%)
2012 2011
Projects of PTT Exploration and Production Public Co., Ltd. (PTTEP)
Bongkot Thailand PTT Exploration and Production Public Co., Ltd. 44.4445 44.4445 Arthit Thailand PTT Exploration and Production Public Co., Ltd. 80.00 80.00 Arthit North Thailand PTT Exploration and Production Public Co., Ltd. - 100.00 Contract 4 (Former: Pailin)
Thailand Chevron Thailand Exploration and Production, Ltd. 45.00 45.00
Sinphuhorm (E 5 North)
Thailand Hess (Thailand) Ltd. 20.00 20.00
S 1 Thailand PTTEP Siam Limited. 25.00 25.00 Contract 3 (Former: Unocal 3)
Thailand Chevron Thailand Exploration and Production, Ltd. 5.00 5.00
E 5 Thailand ExxonMobil Exploration and Production Khorat Inc.
20.00 20.00
Algeria Hassi Bir Rekaiz Algeria PTT Exploration and Production Public Co., Ltd. 24.50 24.50
Projects of PTTEP International Limited (PTTEPI) Yadana Myanmar Total E&P Myanmar 25.50 25.50 Yetagun Myanmar Petronas Carigali Myanmar (Hong Kong) Ltd. 19.31784 19.31784 PTTEP 1 Thailand PTTEP International Limited 100.00 100.00 G 4/43 Thailand Chevron Offshore (Thailand) Ltd. 21.375 21.375 G 9/43 Thailand-
Cambodia PTTEP International Limited 100.00 100.00
L 22/43 Thailand PTTEP International Limited 100.00 100.00 L 53/43 & L54/43 Thailand PTTEP International Limited 100.00 100.00 G 4/48 Thailand Chevron Pattani, Ltd. 5.00 5.00 Arthit (G 9/48) Thailand PTTEP International Limited - 80.00 Bongkot (G 12/48) Thailand PTTEP International Limited 44.4445 44.4445 L 21 & 28/48 Thailand PTTEP International Limited 70.00 70.00 L 29/48 Thailand PTTEP International Limited - 70.00 A 4, 5 & 6/48 Thailand PTTEP International Limited 100.00 100.00 Contract 3 (G 6/50) Thailand Chevron Petroleum (Thailand), Ltd. 5.00 5.00 Contract 4 (G 7/50) Thailand Chevron Petroleum (Thailand), Ltd. 45.00 45.00 Arthit (G 8/50) Thailand PTTEP International Limited 80.00 80.00 Cambodia B Cambodia PTTEP International Limited 33.333334 33.333334 Zawtika Myanmar PTTEP International Limited 80.00 80.00 Myanmar M3 Myanmar PTTEP International Limited 100.00 100.00 Myanmar M11 Myanmar PTTEP International Limited 45.00 100.00 Myanmar M7 Myanmar PTTEP International Limited - 100.00 MT JDA – B17 Thailand -
Malaysia Carigali – PTTEPI Operating Company
Sendirian Berhad 50.00 50.00
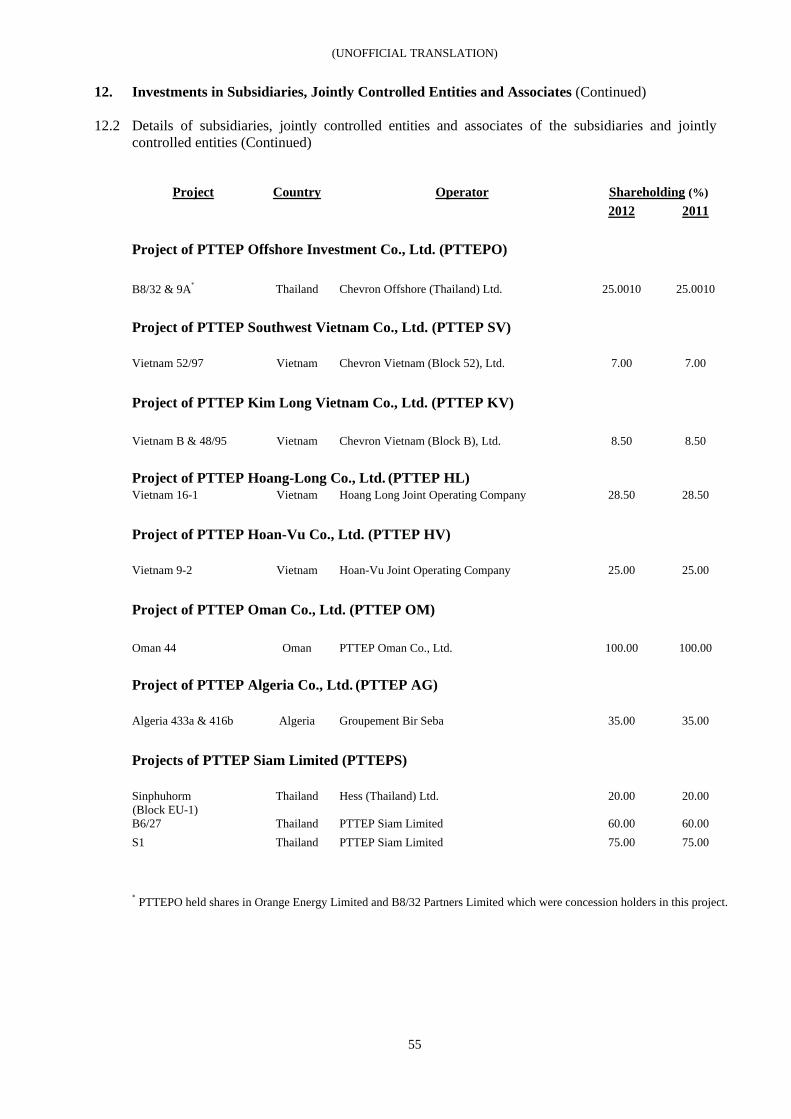
(UNOFFICIAL TRANSLATION)
55
12. Investments in Subsidiaries, Jointly Controlled Entities and Associates (Continued)
12.2 Details of subsidiaries, jointly controlled entities and associates of the subsidiaries and jointly controlled entities (Continued)
Project Country Operator Shareholding (%) 2012 2011
Project of PTTEP Offshore Investment Co., Ltd. (PTTEPO)
B8/32 & 9A* Thailand Chevron Offshore (Thailand) Ltd. 25.0010 25.0010
Project of PTTEP Southwest Vietnam Co., Ltd. (PTTEP SV) Vietnam 52/97 Vietnam Chevron Vietnam (Block 52), Ltd. 7.00 7.00
Project of PTTEP Kim Long Vietnam Co., Ltd. (PTTEP KV)
Vietnam B & 48/95 Vietnam Chevron Vietnam (Block B), Ltd. 8.50 8.50
Project of PTTEP Hoang-Long Co., Ltd. (PTTEP HL) Vietnam 16-1 Vietnam Hoang Long Joint Operating Company 28.50 28.50
Project of PTTEP Hoan-Vu Co., Ltd. (PTTEP HV) Vietnam 9-2 Vietnam Hoan-Vu Joint Operating Company 25.00 25.00
Project of PTTEP Oman Co., Ltd. (PTTEP OM)
Oman 44 Oman PTTEP Oman Co., Ltd. 100.00 100.00
Project of PTTEP Algeria Co., Ltd. (PTTEP AG) Algeria 433a & 416b Algeria Groupement Bir Seba 35.00 35.00
Projects of PTTEP Siam Limited (PTTEPS)
Sinphuhorm (Block EU-1)
Thailand Hess (Thailand) Ltd. 20.00 20.00
B6/27 Thailand PTTEP Siam Limited 60.00 60.00 S1 Thailand PTTEP Siam Limited 75.00 75.00
* PTTEPO held shares in Orange Energy Limited and B8/32 Partners Limited which were concession holders in this project.
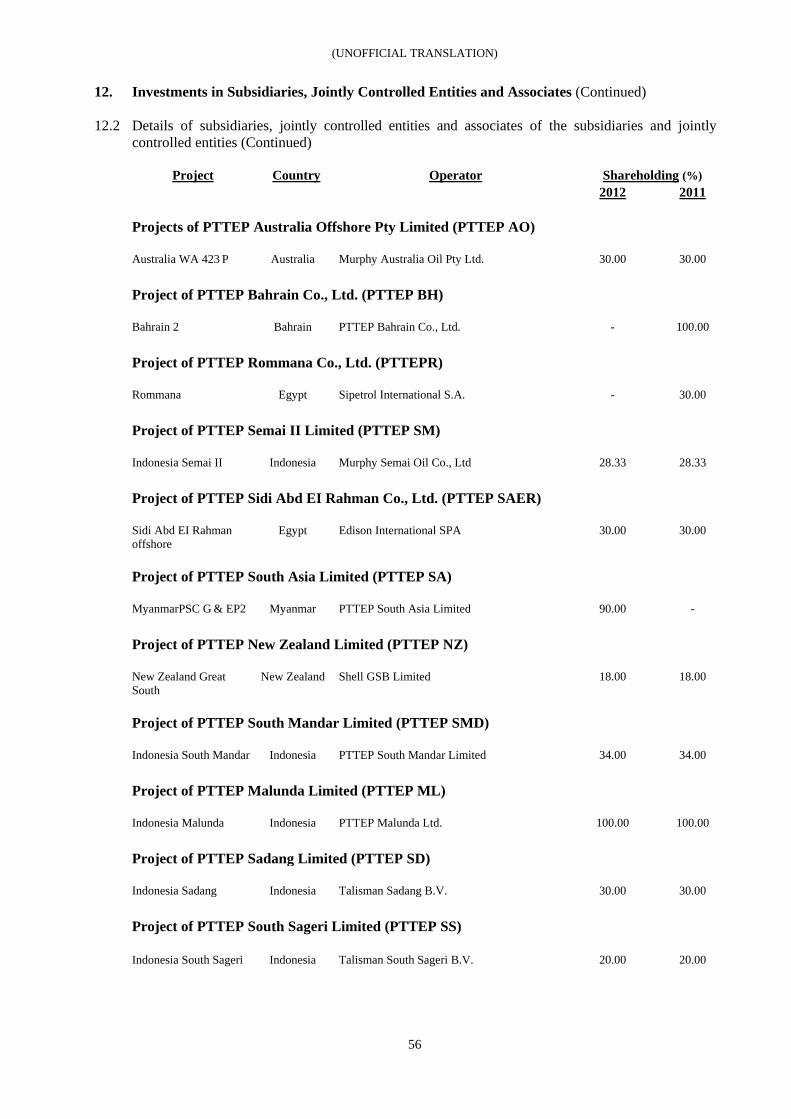
(UNOFFICIAL TRANSLATION)
56
12. Investments in Subsidiaries, Jointly Controlled Entities and Associates (Continued)
12.2 Details of subsidiaries, jointly controlled entities and associates of the subsidiaries and jointly controlled entities (Continued)
Project Country Operator Shareholding (%) 2012 2011
Projects of PTTEP Australia Offshore Pty Limited (PTTEP AO) Australia WA 423 P Australia Murphy Australia Oil Pty Ltd. 30.00 30.00
Project of PTTEP Bahrain Co., Ltd. (PTTEP BH) Bahrain 2 Bahrain PTTEP Bahrain Co., Ltd. - 100.00 Project of PTTEP Rommana Co., Ltd. (PTTEPR) Rommana Egypt Sipetrol International S.A. - 30.00 Project of PTTEP Semai II Limited (PTTEP SM) Indonesia Semai II Indonesia Murphy Semai Oil Co., Ltd 28.33 28.33 Project of PTTEP Sidi Abd EI Rahman Co., Ltd. (PTTEP SAER) Sidi Abd EI Rahman offshore
Egypt Edison International SPA 30.00 30.00
Project of PTTEP South Asia Limited (PTTEP SA) MyanmarPSC G & EP2 Myanmar PTTEP South Asia Limited 90.00 - Project of PTTEP New Zealand Limited (PTTEP NZ) New Zealand Great South
New Zealand Shell GSB Limited 18.00 18.00
Project of PTTEP South Mandar Limited (PTTEP SMD) Indonesia South Mandar Indonesia PTTEP South Mandar Limited 34.00 34.00 Project of PTTEP Malunda Limited (PTTEP ML)
Indonesia Malunda Indonesia PTTEP Malunda Ltd. 100.00 100.00 Project of PTTEP Sadang Limited (PTTEP SD) Indonesia Sadang Indonesia Talisman Sadang B.V. 30.00 30.00 Project of PTTEP South Sageri Limited (PTTEP SS) Indonesia South Sageri Indonesia Talisman South Sageri B.V. 20.00 20.00
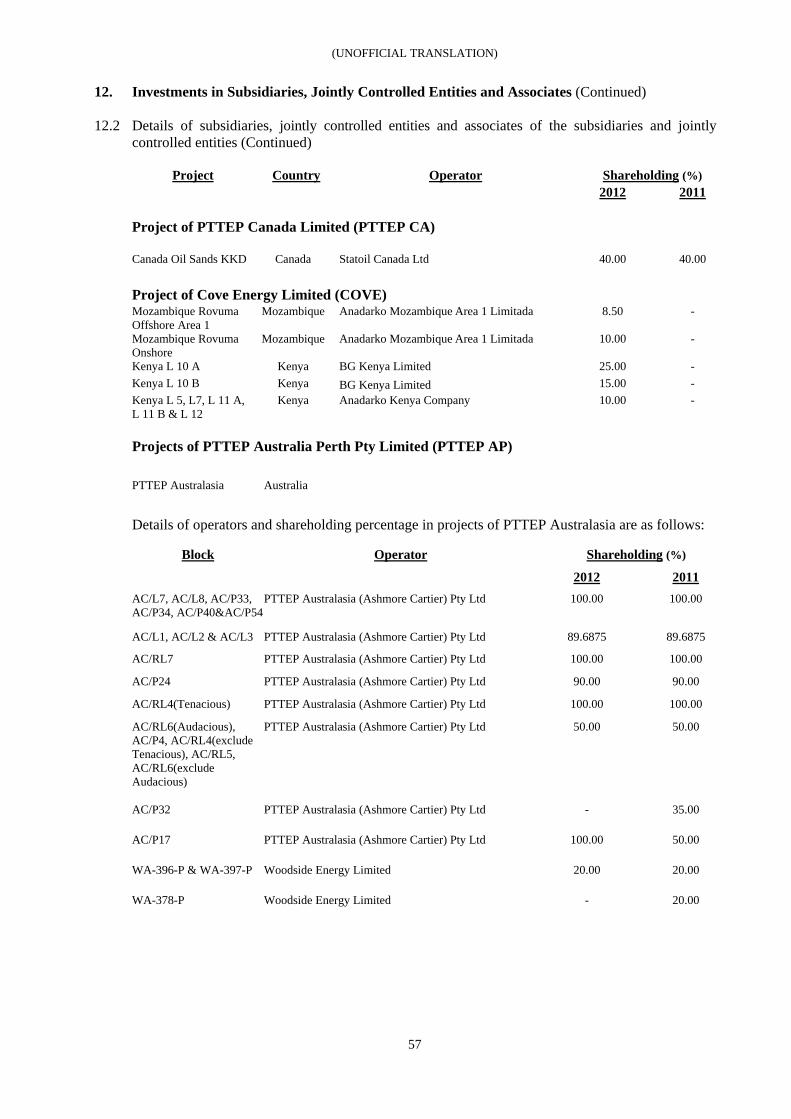
(UNOFFICIAL TRANSLATION)
57
12. Investments in Subsidiaries, Jointly Controlled Entities and Associates (Continued)
12.2 Details of subsidiaries, jointly controlled entities and associates of the subsidiaries and jointly controlled entities (Continued)
Project Country Operator Shareholding (%)
2012 2011
Project of PTTEP Canada Limited (PTTEP CA) Canada Oil Sands KKD Canada Statoil Canada Ltd 40.00 40.00 Project of Cove Energy Limited (COVE) Mozambique Rovuma Offshore Area 1
Mozambique Anadarko Mozambique Area 1 Limitada 8.50 -
Mozambique Rovuma Onshore
Mozambique Anadarko Mozambique Area 1 Limitada 10.00 -
Kenya L 10 A Kenya BG Kenya Limited 25.00 - Kenya L 10 B Kenya BG Kenya Limited 15.00 - Kenya L 5, L7, L 11 A, L 11 B & L 12
Kenya Anadarko Kenya Company 10.00 -
Projects of PTTEP Australia Perth Pty Limited (PTTEP AP) PTTEP Australasia Australia
Details of operators and shareholding percentage in projects of PTTEP Australasia are as follows:
Block Operator Shareholding (%)
2012 2011 AC/L7, AC/L8, AC/P33, AC/P34, AC/P40&AC/P54
PTTEP Australasia (Ashmore Cartier) Pty Ltd 100.00 100.00
AC/L1, AC/L2 & AC/L3 PTTEP Australasia (Ashmore Cartier) Pty Ltd 89.6875 89.6875
AC/RL7 PTTEP Australasia (Ashmore Cartier) Pty Ltd 100.00 100.00
AC/P24 PTTEP Australasia (Ashmore Cartier) Pty Ltd 90.00 90.00
AC/RL4(Tenacious) PTTEP Australasia (Ashmore Cartier) Pty Ltd 100.00 100.00
AC/RL6(Audacious), AC/P4, AC/RL4(exclude Tenacious), AC/RL5, AC/RL6(exclude Audacious)
PTTEP Australasia (Ashmore Cartier) Pty Ltd 50.00 50.00
AC/P32 PTTEP Australasia (Ashmore Cartier) Pty Ltd - 35.00
AC/P17 PTTEP Australasia (Ashmore Cartier) Pty Ltd 100.00 50.00
WA-396-P & WA-397-P Woodside Energy Limited 20.00 20.00
WA-378-P Woodside Energy Limited - 20.00
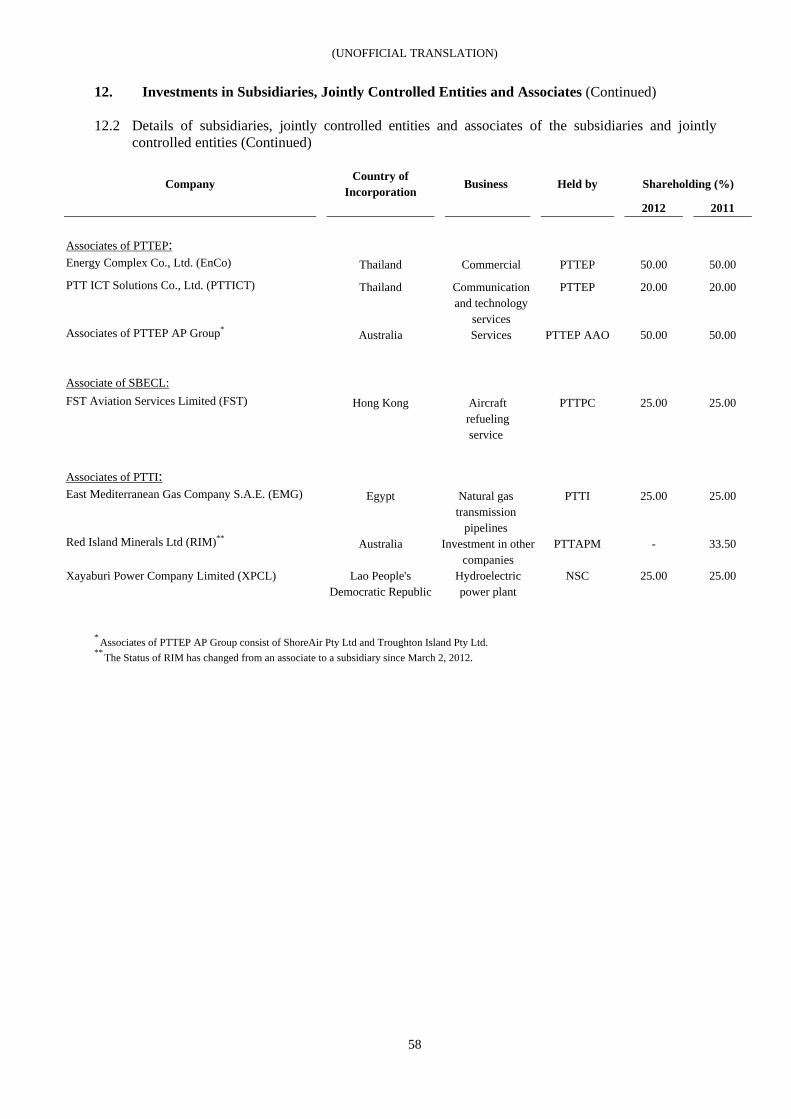
(UNOFFICIAL TRANSLATION)
58
12. Investments in Subsidiaries, Jointly Controlled Entities and Associates (Continued)
12.2 Details of subsidiaries, jointly controlled entities and associates of the subsidiaries and jointly controlled entities (Continued)
Company
Country of Incorporation
Business Held by Shareholding (%)
2012 2011 Associates of PTTEP:
Energy Complex Co., Ltd. (EnCo) Thailand Commercial PTTEP 50.00 50.00
PTT ICT Solutions Co., Ltd. (PTTICT) Thailand Communication and technology
services
PTTEP 20.00 20.00
Associates of PTTEP AP Group* Australia Services PTTEP AAO 50.00 50.00
Associate of SBECL:
FST Aviation Services Limited (FST) Hong Kong Aircraft refueling service
PTTPC 25.00 25.00
Associates of PTTI:
East Mediterranean Gas Company S.A.E. (EMG) Egypt Natural gas transmission
pipelines
PTTI 25.00 25.00
Red Island Minerals Ltd (RIM)** Australia Investment in other companies
PTTAPM - 33.50
Xayaburi Power Company Limited (XPCL) Lao People's Democratic Republic
Hydroelectric power plant
NSC 25.00 25.00
* Associates of PTTEP AP Group consist of ShoreAir Pty Ltd and Troughton Island Pty Ltd. ** The Status of RIM has changed from an associate to a subsidiary since March 2, 2012.
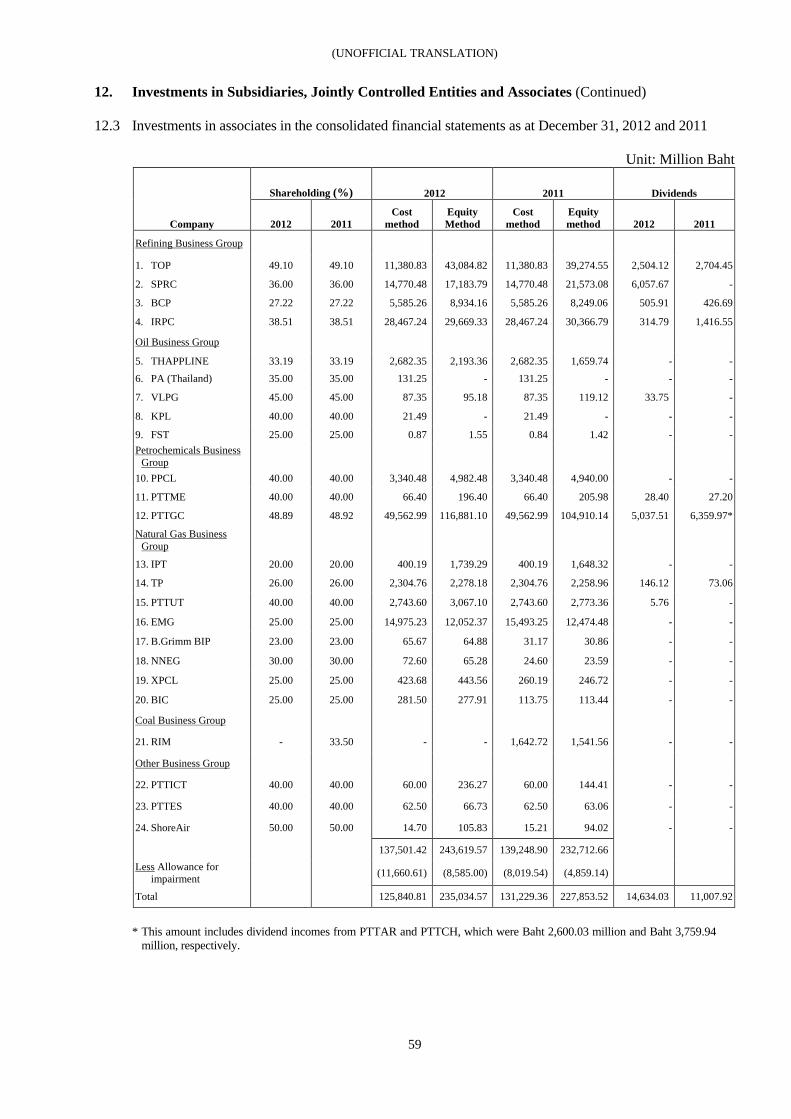
(UNOFFICIAL TRANSLATION)
59
12. Investments in Subsidiaries, Jointly Controlled Entities and Associates (Continued)
12.3 Investments in associates in the consolidated financial statements as at December 31, 2012 and 2011
Unit: Million Baht
Shareholding (%) 2012 2011 Dividends
Company 2012 2011 Cost
method Equity Method
Cost method
Equity method 2012 2011
Refining Business Group
1. TOP 49.10 49.10 11,380.83 43,084.82 11,380.83 39,274.55 2,504.12 2,704.45
2. SPRC 36.00 36.00 14,770.48 17,183.79 14,770.48 21,573.08 6,057.67 -
3. BCP 27.22 27.22 5,585.26 8,934.16 5,585.26 8,249.06 505.91 426.69
4. IRPC 38.51 38.51 28,467.24 29,669.33 28,467.24 30,366.79 314.79 1,416.55
Oil Business Group
5. THAPPLINE 33.19 33.19 2,682.35 2,193.36 2,682.35 1,659.74 - - 6. PA (Thailand) 35.00 35.00 131.25 - 131.25 - - -
7. VLPG 45.00 45.00 87.35 95.18 87.35 119.12 33.75 -
8. KPL 40.00 40.00 21.49 - 21.49 - - -
9. FST 25.00 25.00 0.87 1.55 0.84 1.42 - - Petrochemicals Business
Group
10. PPCL 40.00 40.00 3,340.48 4,982.48 3,340.48 4,940.00 - -
11. PTTME 40.00 40.00 66.40 196.40 66.40 205.98 28.40 27.20
12. PTTGC 48.89 48.92 49,562.99 116,881.10 49,562.99 104,910.14 5,037.51 6,359.97*
Natural Gas Business Group
13. IPT 20.00 20.00 400.19 1,739.29 400.19 1,648.32 - -
14. TP 26.00 26.00 2,304.76 2,278.18 2,304.76 2,258.96 146.12 73.06
15. PTTUT 40.00 40.00 2,743.60 3,067.10 2,743.60 2,773.36 5.76 -
16. EMG 25.00 25.00 14,975.23 12,052.37 15,493.25 12,474.48 - -
17. B.Grimm BIP 23.00 23.00 65.67 64.88 31.17 30.86 - -
18. NNEG 30.00 30.00 72.60 65.28 24.60 23.59 - -
19. XPCL 25.00 25.00 423.68 443.56 260.19 246.72 - -
20. BIC 25.00 25.00 281.50 277.91 113.75 113.44 - -
Coal Business Group
21. RIM - 33.50 - - 1,642.72 1,541.56 - -
Other Business Group
22. PTTICT 40.00 40.00 60.00 236.27 60.00 144.41 - -
23. PTTES 40.00 40.00 62.50 66.73 62.50 63.06 - -
24. ShoreAir 50.00 50.00 14.70 105.83 15.21 94.02 - -
137,501.42 243,619.57 139,248.90 232,712.66 Less Allowance for
impairment (11,660.61) (8,585.00) (8,019.54) (4,859.14)
Total 125,840.81 235,034.57 131,229.36 227,853.52 14,634.03 11,007.92
* This amount includes dividend incomes from PTTAR and PTTCH, which were Baht 2,600.03 million and Baht 3,759.94
million, respectively.
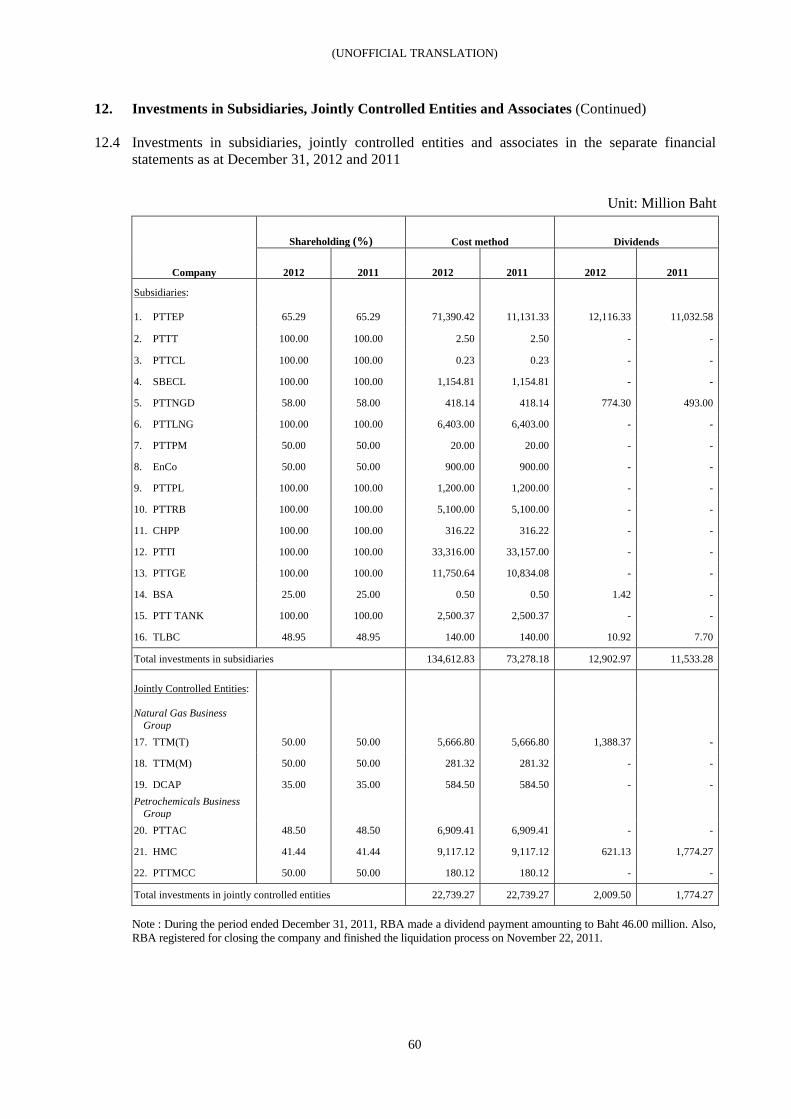
(UNOFFICIAL TRANSLATION)
60
12. Investments in Subsidiaries, Jointly Controlled Entities and Associates (Continued)
12.4 Investments in subsidiaries, jointly controlled entities and associates in the separate financial
statements as at December 31, 2012 and 2011
Note : During the period ended December 31, 2011, RBA made a dividend payment amounting to Baht 46.00 million. Also, RBA registered for closing the company and finished the liquidation process on November 22, 2011.
Unit: Million Baht
Shareholding (%) Cost method Dividends
Company 2012 2011 2012 2011 2012 2011
Subsidiaries:
1. PTTEP 65.29 65.29 71,390.42 11,131.33 12,116.33 11,032.58
2. PTTT 100.00 100.00 2.50 2.50 - -
3. PTTCL 100.00 100.00 0.23 0.23 - -
4. SBECL 100.00 100.00 1,154.81 1,154.81 - -
5. PTTNGD 58.00 58.00 418.14 418.14 774.30 493.00
6. PTTLNG 100.00 100.00 6,403.00 6,403.00 - -
7. PTTPM 50.00 50.00 20.00 20.00 - -
8. EnCo 50.00 50.00 900.00 900.00 - -
9. PTTPL 100.00 100.00 1,200.00 1,200.00 - -
10. PTTRB 100.00 100.00 5,100.00 5,100.00 - -
11. CHPP 100.00 100.00 316.22 316.22 - -
12. PTTI 100.00 100.00 33,316.00 33,157.00 - -
13. PTTGE 100.00 100.00 11,750.64 10,834.08 - -
14. BSA 25.00 25.00 0.50 0.50 1.42 -
15. PTT TANK 100.00 100.00 2,500.37 2,500.37 - -
16. TLBC 48.95 48.95 140.00 140.00 10.92 7.70
Total investments in subsidiaries 134,612.83 73,278.18 12,902.97 11,533.28 Jointly Controlled Entities:
Natural Gas Business
Group
17. TTM(T) 50.00 50.00 5,666.80 5,666.80 1,388.37 -
18. TTM(M) 50.00 50.00 281.32 281.32 - -
19. DCAP 35.00 35.00 584.50 584.50 - - Petrochemicals Business
Group
20. PTTAC 48.50 48.50 6,909.41 6,909.41 - -
21. HMC 41.44 41.44 9,117.12 9,117.12 621.13 1,774.27
22. PTTMCC 50.00 50.00 180.12 180.12 - -
Total investments in jointly controlled entities 22,739.27 22,739.27 2,009.50 1,774.27
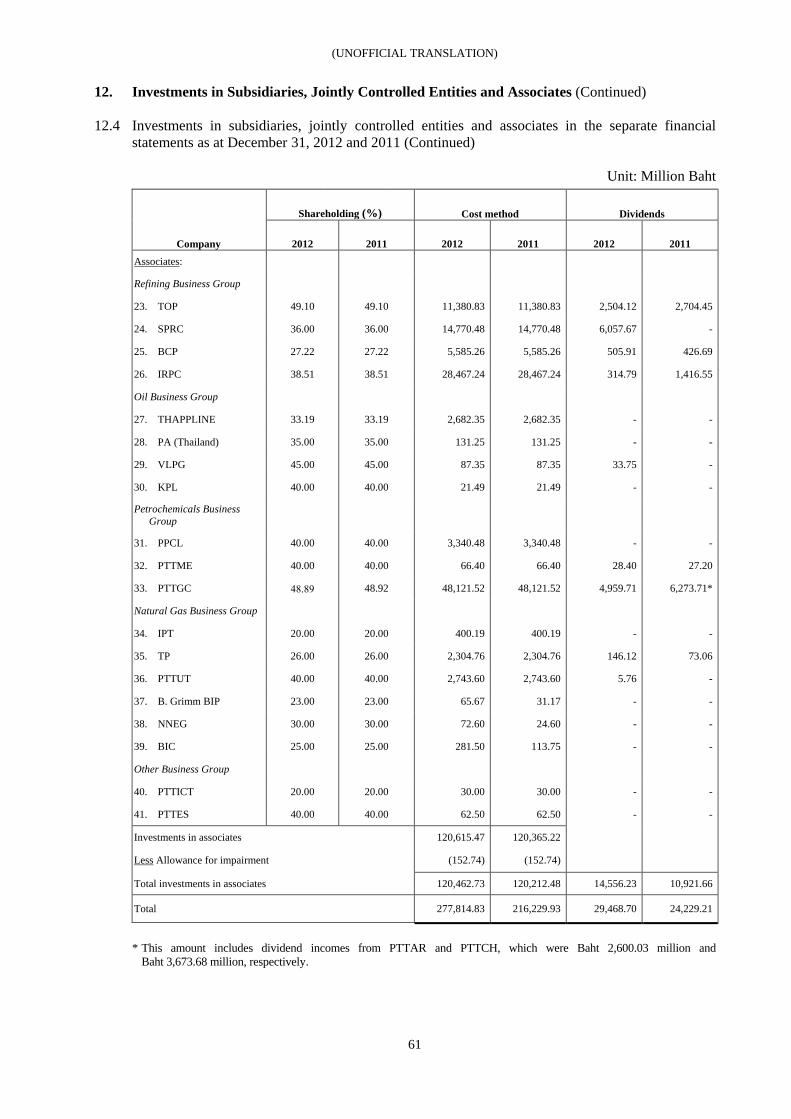
(UNOFFICIAL TRANSLATION)
61
12. Investments in Subsidiaries, Jointly Controlled Entities and Associates (Continued)
12.4 Investments in subsidiaries, jointly controlled entities and associates in the separate financial
statements as at December 31, 2012 and 2011 (Continued) Unit: Million Baht
Shareholding (%) Cost method Dividends
Company 2012 2011 2012 2011 2012 2011 Associates:
Refining Business Group
23. TOP 49.10 49.10 11,380.83 11,380.83 2,504.12 2,704.45
24. SPRC 36.00 36.00 14,770.48 14,770.48 6,057.67 -
25. BCP 27.22 27.22 5,585.26 5,585.26 505.91 426.69
26. IRPC 38.51 38.51 28,467.24 28,467.24 314.79 1,416.55
Oil Business Group
27. THAPPLINE 33.19 33.19 2,682.35 2,682.35 - -
28. PA (Thailand) 35.00 35.00 131.25 131.25 - -
29. VLPG 45.00 45.00 87.35 87.35 33.75 -
30. KPL 40.00 40.00 21.49 21.49 - -
Petrochemicals Business Group
31. PPCL 40.00 40.00 3,340.48 3,340.48 - -
32. PTTME 40.00 40.00 66.40 66.40 28.40 27.20
33. PTTGC 48.89 48.92 48,121.52 48,121.52 4,959.71 6,273.71*
Natural Gas Business Group
34. IPT 20.00 20.00 400.19 400.19 - -
35. TP 26.00 26.00 2,304.76 2,304.76 146.12 73.06
36. PTTUT 40.00 40.00 2,743.60 2,743.60 5.76 -
37. B. Grimm BIP 23.00 23.00 65.67 31.17 - -
38. NNEG 30.00 30.00 72.60 24.60 - -
39. BIC 25.00 25.00 281.50 113.75 - -
Other Business Group
40. PTTICT 20.00 20.00 30.00 30.00 - -
41. PTTES 40.00 40.00 62.50 62.50 - -
Investments in associates 120,615.47 120,365.22
Less Allowance for impairment (152.74) (152.74)
Total investments in associates 120,462.73 120,212.48 14,556.23 10,921.66
Total 277,814.83 216,229.93 29,468.70 24,229.21
* This amount includes dividend incomes from PTTAR and PTTCH, which were Baht 2,600.03 million and
Baht 3,673.68 million, respectively.
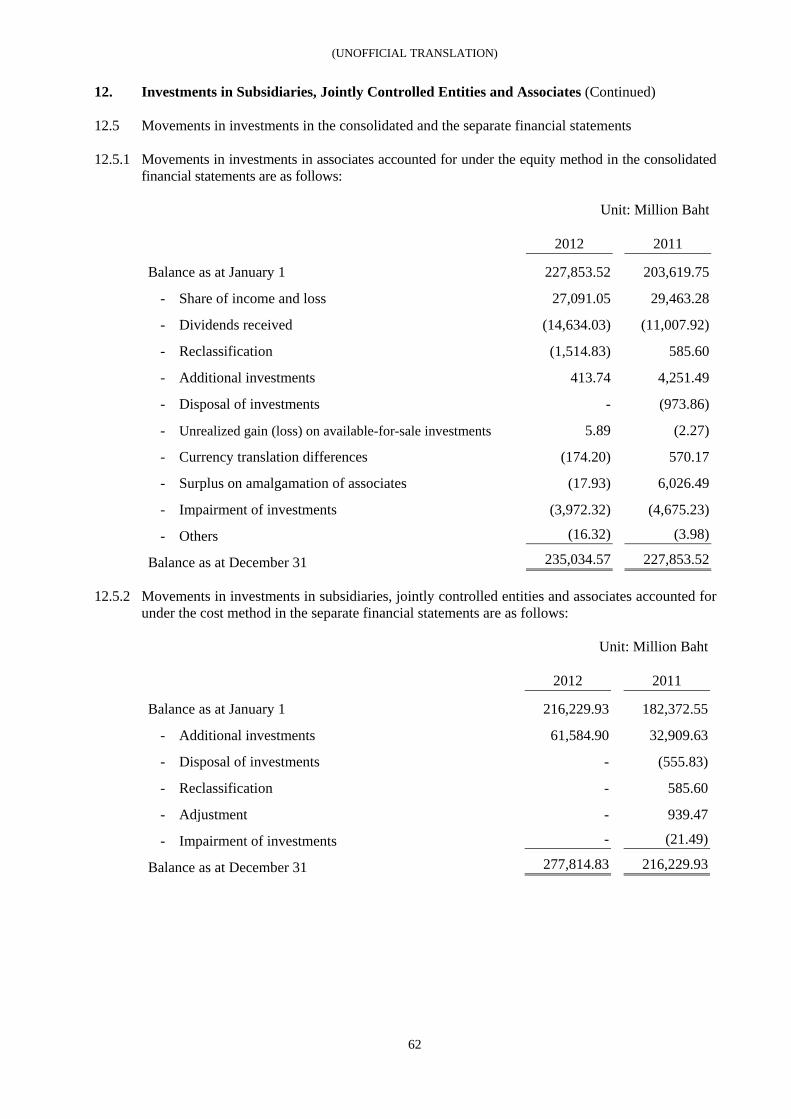
(UNOFFICIAL TRANSLATION)
62
12. Investments in Subsidiaries, Jointly Controlled Entities and Associates (Continued)
12.5 Movements in investments in the consolidated and the separate financial statements
12.5.1 Movements in investments in associates accounted for under the equity method in the consolidated
financial statements are as follows:
Unit: Million Baht
2012 2011
Balance as at January 1 227,853.52 203,619.75
- Share of income and loss 27,091.05 29,463.28
- Dividends received (14,634.03) (11,007.92)
- Reclassification (1,514.83) 585.60
- Additional investments 413.74 4,251.49
- Disposal of investments - (973.86)
- Unrealized gain (loss) on available-for-sale investments 5.89 (2.27)
- Currency translation differences (174.20) 570.17
- Surplus on amalgamation of associates (17.93) 6,026.49
- Impairment of investments (3,972.32) (4,675.23)
- Others (16.32) (3.98)
Balance as at December 31 235,034.57 227,853.52
12.5.2 Movements in investments in subsidiaries, jointly controlled entities and associates accounted for under the cost method in the separate financial statements are as follows:
Unit: Million Baht
2012 2011
Balance as at January 1 216,229.93 182,372.55
- Additional investments 61,584.90 32,909.63
- Disposal of investments - (555.83)
- Reclassification - 585.60
- Adjustment - 939.47
- Impairment of investments - (21.49)
Balance as at December 31 277,814.83 216,229.93
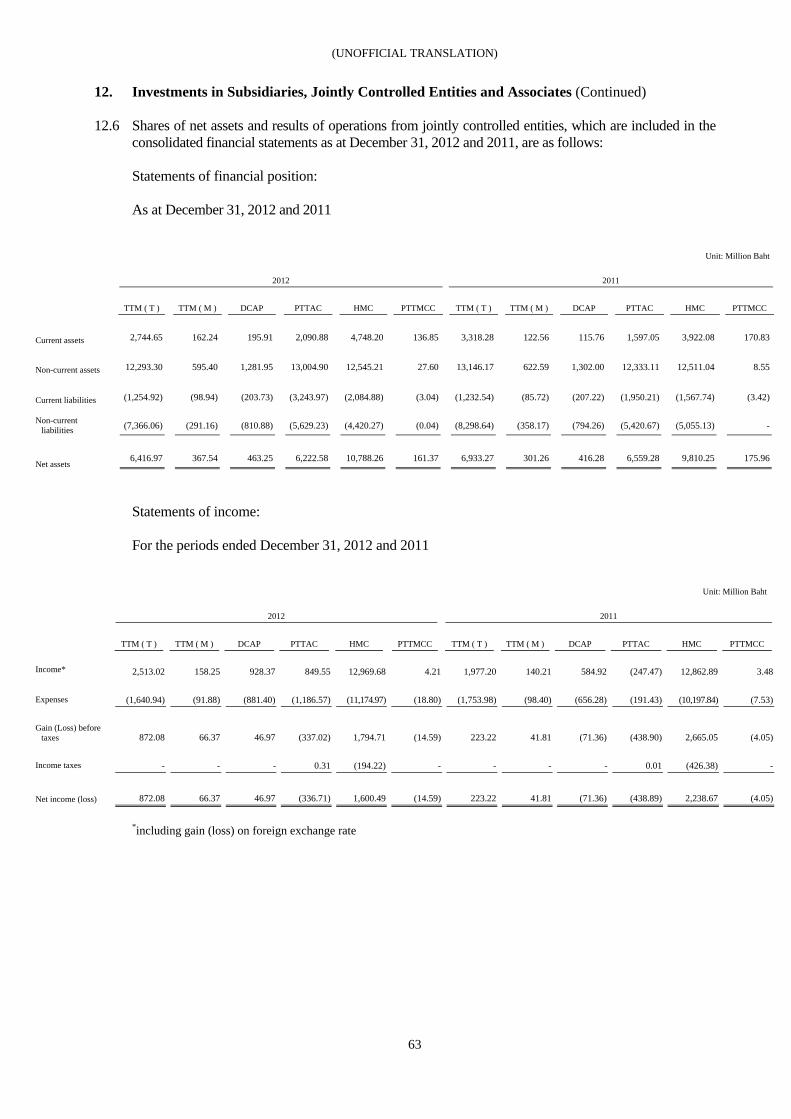
(UNOFFICIAL TRANSLATION)
63
12. Investments in Subsidiaries, Jointly Controlled Entities and Associates (Continued)
12.6 Shares of net assets and results of operations from jointly controlled entities, which are included in the
consolidated financial statements as at December 31, 2012 and 2011, are as follows: Statements of financial position: As at December 31, 2012 and 2011
Unit: Million Baht
2012 2011
TTM ( T ) TTM ( M ) DCAP PTTAC HMC PTTMCC TTM ( T ) TTM ( M ) DCAP PTTAC HMC PTTMCC
Current assets 2,744.65 162.24 195.91 2,090.88 4,748.20 136.85 3,318.28 122.56 115.76 1,597.05 3,922.08 170.83
Non-current assets 12,293.30 595.40 1,281.95 13,004.90 12,545.21 27.60 13,146.17 622.59 1,302.00 12,333.11 12,511.04 8.55
Current liabilities (1,254.92) (98.94) (203.73) (3,243.97) (2,084.88) (3.04) (1,232.54) (85.72) (207.22) (1,950.21) (1,567.74) (3.42)
Non-current liabilities (7,366.06) (291.16) (810.88) (5,629.23) (4,420.27) (0.04) (8,298.64) (358.17) (794.26) (5,420.67) (5,055.13) -
Net assets 6,416.97 367.54 463.25 6,222.58 10,788.26 161.37 6,933.27 301.26 416.28 6,559.28 9,810.25 175.96
Statements of income: For the periods ended December 31, 2012 and 2011
Unit: Million Baht
2012 2011
TTM ( T ) TTM ( M ) DCAP PTTAC HMC PTTMCC TTM ( T ) TTM ( M ) DCAP PTTAC HMC PTTMCC
Income* 2,513.02 158.25 928.37 849.55 12,969.68 4.21 1,977.20 140.21 584.92 (247.47) 12,862.89 3.48
Expenses (1,640.94) (91.88) (881.40) (1,186.57) (11,174.97) (18.80) (1,753.98) (98.40) (656.28) (191.43) (10,197.84) (7.53)
Gain (Loss) before taxes 872.08 66.37 46.97 (337.02) 1,794.71 (14.59) 223.22 41.81 (71.36) (438.90) 2,665.05 (4.05)
Income taxes - - - 0.31 (194.22) - - - - 0.01 (426.38) -
Net income (loss) 872.08 66.37 46.97 (336.71) 1,600.49 (14.59) 223.22 41.81 (71.36) (438.89) 2,238.67 (4.05)
*including gain (loss) on foreign exchange rate
(UNOFFICIAL TRANSLATION)
64
12. Investments in Subsidiaries, Jointly Controlled Entities and Associates (Continued)
12.7 Significant events during the period ended December 31, 2012 BIC In 2012, BIC called up payment of additional share capital on six occasions, together amounting to Baht 167.75 million. The Company has already paid the full amounts. PTTGE On February 27, 2012, PTTGE called for payment of additional authorized share capital of USD 30 million or approximately Baht 916.56 million. The Company made the share payment on February 29, 2012. RIM On March 2, 2012, PTT Asia Pacific Mining Pty Ltd (PTTAPM), a subsidiary of PTTI, increased its shareholding in Red Island Minerals Limited (RIM) by 66.50% from 33.50% to 100%. As a result, the status of RIM changed from an associate to a subsidiary. Details are disclosed in Note 41 “Business acquisition”. B.Grimm BIP
On March 27, 2012, at the B.Grimm BIP’s Shareholder Meeting No.1/2012, the shareholders passed a resolution to increase its authorized share capital by Baht 150 million, from Baht 135.50 million to Baht 285.50 million, by issuing 1.50 million additional shares with a par value of Baht 100 each. Furthermore, B.Grimm BIP called for the full payment of the additional authorized share capital. The Company paid Baht 34.50 million for these additional shares on March 28, 2012, in proportion to its shareholding. PTTGC During the period, PTTGC’s employees exercised their rights to purchase ordinary shares under the Employee Stock Ownership Plan (ESOP) project as detailed in Note 31. This resulted in a gain of Baht 19.28 million, which was recorded in the statement of income, and decreased the Company’s shareholding in PTTGC to 48.89% as at December 31, 2012. NNEG On March 14, 2012, at the NNEG’s Board of Directors Meeting No. 1/2012, the Board passed a resolution to increase its authorized share capital by Baht 80 million, from Baht 82 million to Baht 162 million, by issuing 8 million additional shares with a par value of Baht 10 each. Furthermore, NNEG called for the full payment of the additional authorized share capital. The Company paid Baht 24 million for these additional shares on April 30, 2012, in proportion to its shareholding. On October 3, 2012, at the NNEG’s Board of Directors Meeting No. 4/2012, the Board passed a resolution to increase its authorized share capital by Baht 80 million, from Baht 162 million to Baht 242 million, by issuing 8 million additional shares with a par value of Baht 10 each. Furthermore, NNEG called for the full payment of the additional authorized share capital. The Company paid Baht 24 million for these additional shares on October 31, 2012, in proportion to its shareholding.
(UNOFFICIAL TRANSLATION)
65
12. Investments in Subsidiaries, Jointly Controlled Entities and Associates (Continued)
12.7 Significant events during the period ended December 31, 2012 (Continued) PTTI On April 30, 2012, PTTI made an additional assessment of impairment loss on an investment in East Mediterranean Gas Company (EMG) because Egyptian General Petroleum Corporation (EGPC) and Egyptian Natural Gas Holding Company (EGAS), which are exporters of natural gas from Egypt to Israel, notified EMG that they were terminating the Gas Supply and Purchase Agreement. As a result, EMG is unable to deliver gas to its customers. PTTI reviewed impairment and accounted for the impairment loss on the investment of Baht 3,972.32 million in the second quarter of 2012. As a result, the allowance for impairment loss on the investment in EMG as at December 31, 2012 in the consolidated financial statements amounted to Baht 8,585.00 million. On May 14, 2012, PT Separi Energy (SE), a subsidiary of Sakari Resources Ltd. (SAR) which is a subsidiary of PTTI, acquired a 100% shareholding in Tri Tunggall Lestari Bersama (TTLB). Details are disclosed in Note 41 “Business acquisition”. On June 13, 2012, PTTI called for payment of additional authorized share capital of Baht 159 million. The Company made the share payment on June 20, 2012. On June 14, 2012, at the PTTI’s Board of Directors Meeting No. 8/2012, the Board passed a resolution to merge its two of subsidiaries, International Coal Holdings Pty Ltd (ICH) and PTT Asia Pacific Mining Pty Ltd (PTTAPM), by having PTT Mining Limited (PTTML) sell its 60% shareholding in PTTAPM to ICH. On October 1, 2012, PTTML sold its 60% shareholding in PTTAPM to ICH for AUD 571.82 million or approximately Baht 18,327.60 million. On August 23, 2012, at the PTTI’s Board of Directors Meeting No. 11/2012, the Board passed a resolution to approve a tender offer by PTT Mining Limited (PTTML), a subsidiary of PTTI, for the ordinary shares of Sakari Resources Limited (SAR) in order to increase its shareholding in SAR. PTTML made a tender offer for all the ordinary shares of SAR through the Singapore Exchange and reported these to The Stock Exchange of Thailand on August 27, 2012. On October 22, 2012, the closing date for the tender offer for ordinary shares of Sakari Resources Limited (SAR), a subsidiary of PTTML which is a subsidiary of PTTI, PTTML received valid acceptance from the tender offer and from stock exchange trading. As a result, PTTML directly and indirectly held an aggregate total of 1,025,053,511 shares of SAR, representing a 90.15% shareholding. PTTML reserved the right to delist SAR from the Singapore Stock Exchange. On December 12, 2012, the Board of SAR announced its intention to delist SAR from the Singapore Stock Exchange and reported this to The Stock Exchange of Thailand on December 13, 2012. On December 3, 2012, PTT Asia Pacific Mining Pty Ltd. (PTTAPM), a subsidiary of International Coal Holdings Pty Ltd. (ICH), a subsidiary of PTT Mining Limited (PTTML) which is a subsidiary of PTTI, acquired SAR shares from PTTML, in accordance with a resolution passed by Shareholders Meeting of PTTAPM held on November 30, 2012. Between December 3, 2012 and December 21, 2012, PTTAPM acquired 7,076,763 shares of SAR, representing a shareholding of 0.62%. As a result, at December 31, 2012, PTTML’s direct and indirect shareholding in SAR consists of 1,064,632,540 shares, or 93.63% as.
(UNOFFICIAL TRANSLATION)
66
12. Investments in Subsidiaries, Jointly Controlled Entities and Associates (Continued)
12.7 Significant events during the period ended December 31, 2012 (Continued) XPCL On June 27, 2011, at the XPCL’s Extraordinary General Meeting of the shareholders No.1/2011, the shareholders passed a resolution to increase authorized share capital by Baht 5,750 million, from Baht 1,000 million to Baht 6,750 million, by issuing 575 million additional shares with a par value of Baht 10 each. In 2012, XPCL called additional authorized share capital on five occasions, totaling Baht 1.68 each, at a total of Baht 241.50 million. NSC has paid the full amount of these shares. SPRC On June 5, 2012, at the SPRC’s Extraordinary General Meeting of the shareholders No.3/2012, the shareholders passed a resolution to change SPRC’s status from Star Petroleum Refining Company Limited to Star Petroleum Refining Public Company Limited, under the Public Limited Companies Act, B.E. 2535 (1992). SPRC registered to change its status to a public company on June 7, 2012. PTTEP On August 17, 2012, PTTEP Africa Investment Limited (PTTEP AI), a subsidiary of PTTEP, acquired Cove Energy Plc. (COVE) in the Republic of Mozambique. Details are disclosed in Note 41 “Business acquisition”. On October 29, 2012, at the PTTEP’s Extraordinary General Meeting of the shareholders No. 1/2012, the shareholders passed resolutions to increase authorized share capital by issuing 650 million additional ordinary shares with a par value of Baht 1.00 each. PTTEP sold the shares through a preferential public offering to all eligible existing shareholders at Baht 142 each. On December 3, 2012, PTTEP allocated 424,359,789 new issued ordinary shares amounting to Baht 60,259,090,038 to the Company. Consequently, the Company maintained its existing shareholding in PTTEP at approximately 65.29%. The Company paid the full amount for these shares on December 6, 2012.
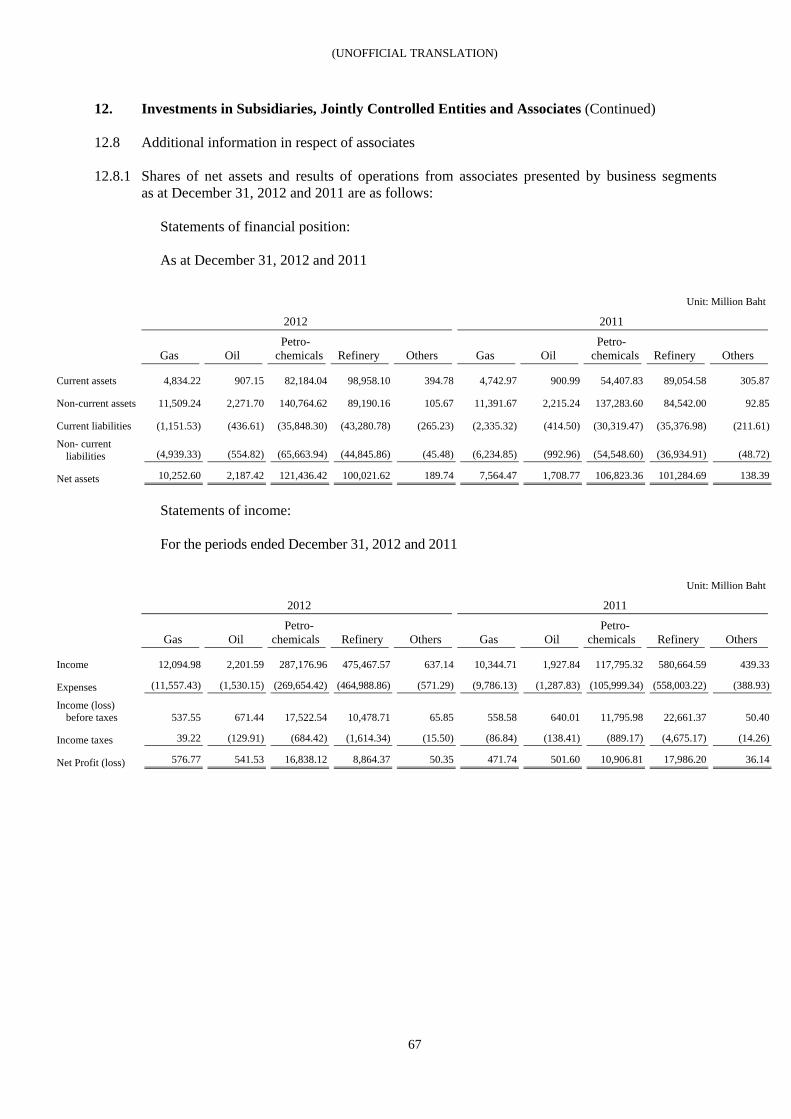
(UNOFFICIAL TRANSLATION)
67
12. Investments in Subsidiaries, Jointly Controlled Entities and Associates (Continued)
12.8 Additional information in respect of associates
12.8.1 Shares of net assets and results of operations from associates presented by business segments
as at December 31, 2012 and 2011 are as follows:
Statements of financial position:
As at December 31, 2012 and 2011
Unit: Million Baht
2012 2011
Gas Oil Petro-
chemicals Refinery Others Gas Oil Petro-
chemicals Refinery Others
Current assets 4,834.22 907.15 82,184.04 98,958.10 394.78 4,742.97 900.99 54,407.83 89,054.58 305.87
Non-current assets 11,509.24 2,271.70 140,764.62 89,190.16 105.67 11,391.67 2,215.24 137,283.60 84,542.00 92.85
Current liabilities (1,151.53) (436.61) (35,848.30) (43,280.78) (265.23) (2,335.32) (414.50) (30,319.47) (35,376.98) (211.61)
Non- current liabilities (4,939.33) (554.82) (65,663.94) (44,845.86) (45.48) (6,234.85) (992.96) (54,548.60) (36,934.91) (48.72)
Net assets 10,252.60 2,187.42 121,436.42 100,021.62 189.74 7,564.47 1,708.77 106,823.36 101,284.69 138.39
Statements of income:
For the periods ended December 31, 2012 and 2011
Unit: Million Baht
2012 2011
Gas Oil Petro-
chemicals Refinery Others Gas Oil Petro-
chemicals Refinery Others
Income 12,094.98 2,201.59 287,176.96 475,467.57 637.14 10,344.71 1,927.84 117,795.32 580,664.59 439.33
Expenses (11,557.43) (1,530.15) (269,654.42) (464,988.86) (571.29) (9,786.13) (1,287.83) (105,999.34) (558,003.22) (388.93)
Income (loss) before taxes 537.55 671.44 17,522.54 10,478.71 65.85 558.58 640.01 11,795.98 22,661.37 50.40
Income taxes 39.22 (129.91) (684.42) (1,614.34) (15.50) (86.84) (138.41) (889.17) (4,675.17) (14.26)
Net Profit (loss) 576.77 541.53 16,838.12 8,864.37 50.35 471.74 501.60 10,906.81 17,986.20 36.14
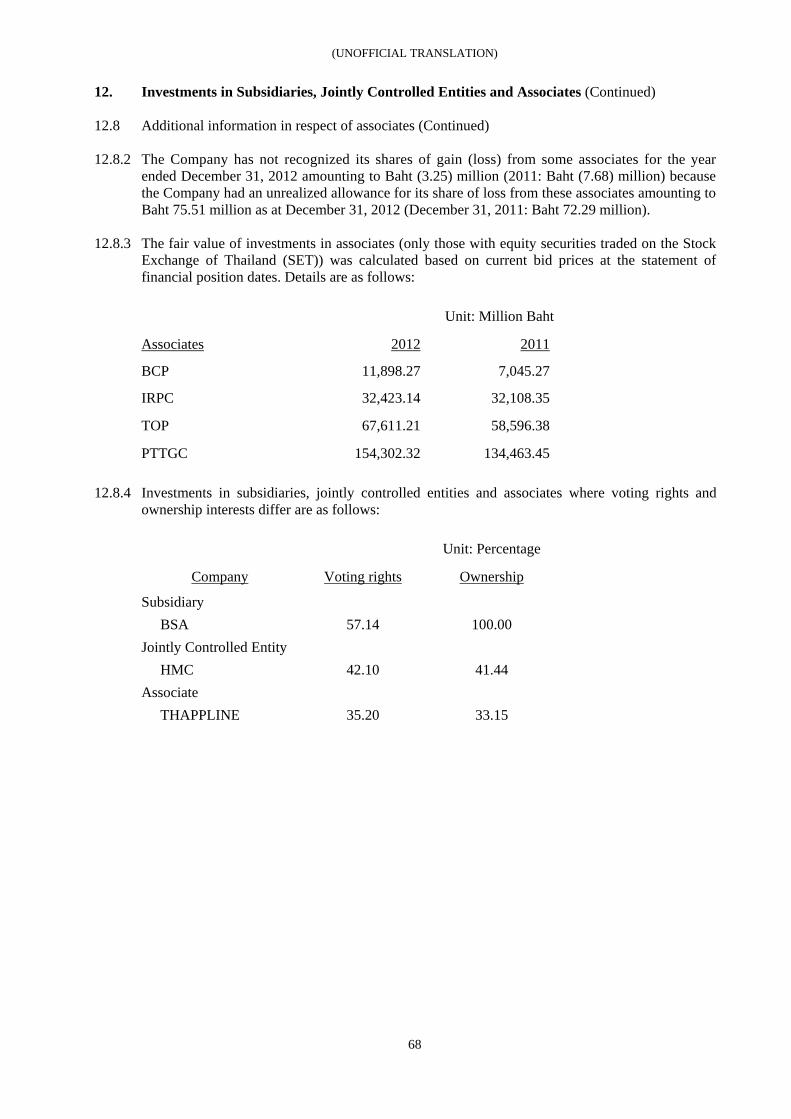
(UNOFFICIAL TRANSLATION)
68
12. Investments in Subsidiaries, Jointly Controlled Entities and Associates (Continued) 12.8 Additional information in respect of associates (Continued) 12.8.2 The Company has not recognized its shares of gain (loss) from some associates for the year
ended December 31, 2012 amounting to Baht (3.25) million (2011: Baht (7.68) million) because the Company had an unrealized allowance for its share of loss from these associates amounting to Baht 75.51 million as at December 31, 2012 (December 31, 2011: Baht 72.29 million).
12.8.3 The fair value of investments in associates (only those with equity securities traded on the Stock
Exchange of Thailand (SET)) was calculated based on current bid prices at the statement of financial position dates. Details are as follows:
Unit: Million Baht
Associates 2012 2011
BCP 11,898.27 7,045.27
IRPC 32,423.14 32,108.35
TOP 67,611.21 58,596.38
PTTGC 154,302.32 134,463.45
12.8.4 Investments in subsidiaries, jointly controlled entities and associates where voting rights and ownership interests differ are as follows:
Unit: Percentage
Company Voting rights Ownership Subsidiary
BSA 57.14 100.00 Jointly Controlled Entity
HMC 42.10 41.44 Associate
THAPPLINE 35.20 33.15
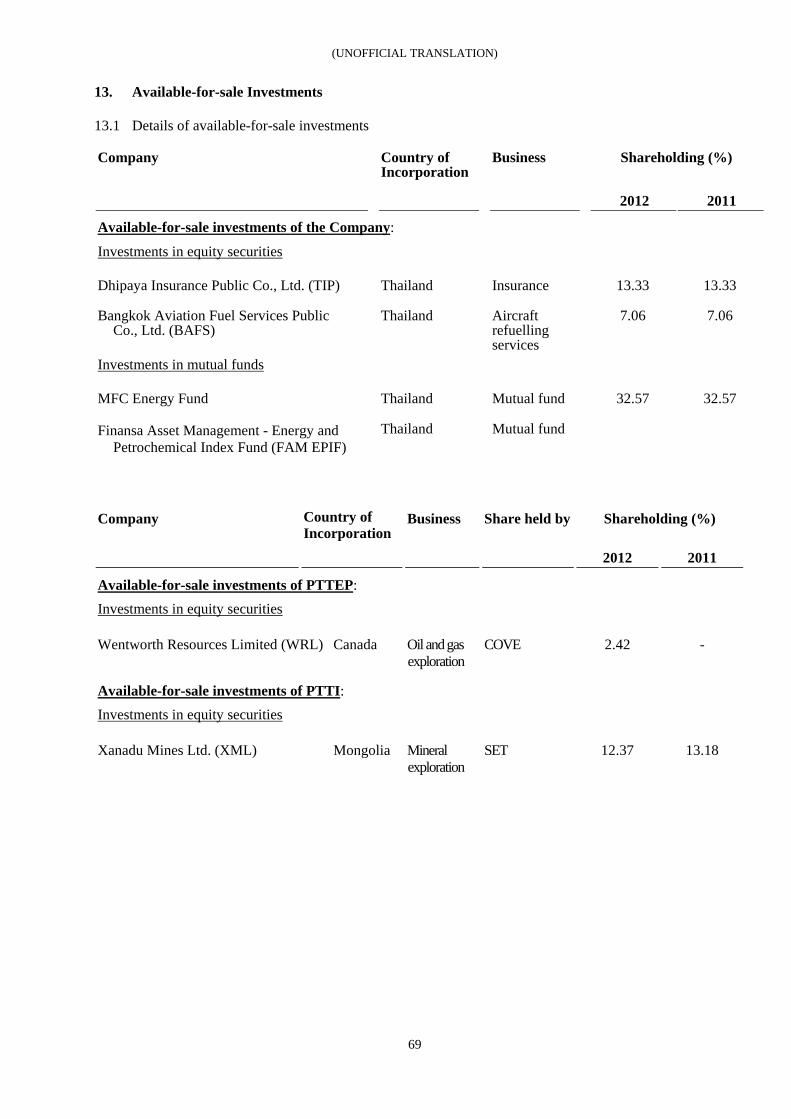
(UNOFFICIAL TRANSLATION)
69
13. Available-for-sale Investments
13.1 Details of available-for-sale investments
Company Country of Incorporation
Business Shareholding (%)
2012 2011
Available-for-sale investments of the Company:
Investments in equity securities
Dhipaya Insurance Public Co., Ltd. (TIP) Thailand Insurance 13.33 13.33
Bangkok Aviation Fuel Services Public Co., Ltd. (BAFS)
Thailand Aircraft refuelling services
7.06 7.06
Investments in mutual funds
MFC Energy Fund Thailand Mutual fund 32.57 32.57
Finansa Asset Management - Energy and Petrochemical Index Fund (FAM EPIF)
Thailand Mutual fund
Company Country of Incorporation
Business Share held by Shareholding (%)
2012 2011
Available-for-sale investments of PTTEP:
Investments in equity securities
Wentworth Resources Limited (WRL) Canada
Oil and gas exploration
COVE 2.42 -
Available-for-sale investments of PTTI:
Investments in equity securities
Xanadu Mines Ltd. (XML) Mongolia
Mineral exploration
SET 12.37 13.18
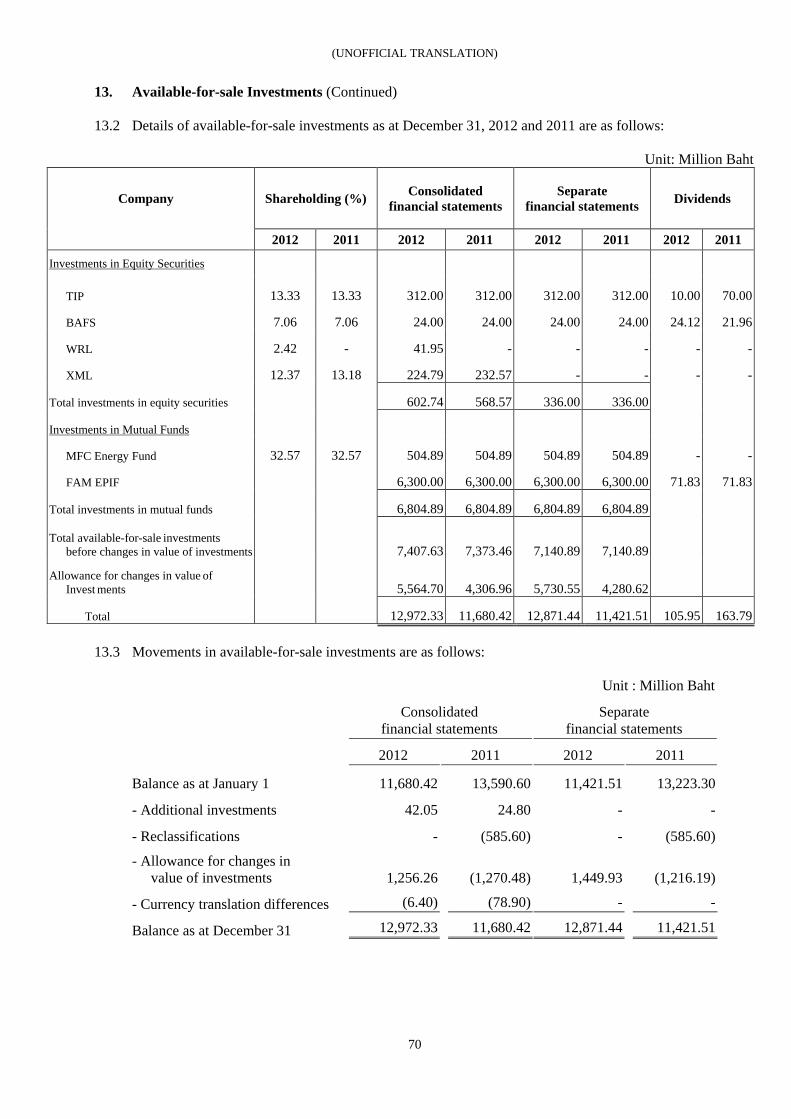
(UNOFFICIAL TRANSLATION)
70
13. Available-for-sale Investments (Continued)
13.2 Details of available-for-sale investments as at December 31, 2012 and 2011 are as follows:
Unit: Million Baht
Company Shareholding (%) Consolidated financial statements
Separate financial statements Dividends
2012 2011 2012 2011 2012 2011 2012 2011
Investments in Equity Securities
TIP 13.33 13.33 312.00 312.00 312.00 312.00 10.00 70.00
BAFS 7.06 7.06 24.00 24.00 24.00 24.00 24.12 21.96
WRL 2.42 - 41.95 - - - - -
XML 12.37 13.18 224.79 232.57 - - - -
Total investments in equity securities 602.74 568.57 336.00 336.00
Investments in Mutual Funds
MFC Energy Fund 32.57 32.57 504.89 504.89 504.89 504.89 - -
FAM EPIF 6,300.00 6,300.00 6,300.00 6,300.00 71.83 71.83
Total investments in mutual funds 6,804.89 6,804.89 6,804.89 6,804.89
Total available-for-sale investments before changes in value of investments
7,407.63 7,373.46 7,140.89 7,140.89
Allowance for changes in value of Invest ments 5,564.70 4,306.96 5,730.55 4,280.62
Total 12,972.33 11,680.42 12,871.44 11,421.51 105.95 163.79
13.3 Movements in available-for-sale investments are as follows:
Unit : Million Baht
Consolidated
financial statements Separate
financial statements
2012 2011 2012 2011
Balance as at January 1 11,680.42 13,590.60 11,421.51 13,223.30
- Additional investments 42.05 24.80 - -
- Reclassifications - (585.60) - (585.60)
- Allowance for changes in value of investments 1,256.26 (1,270.48) 1,449.93 (1,216.19)
- Currency translation differences (6.40) (78.90) - -
Balance as at December 31 12,972.33 11,680.42 12,871.44 11,421.51
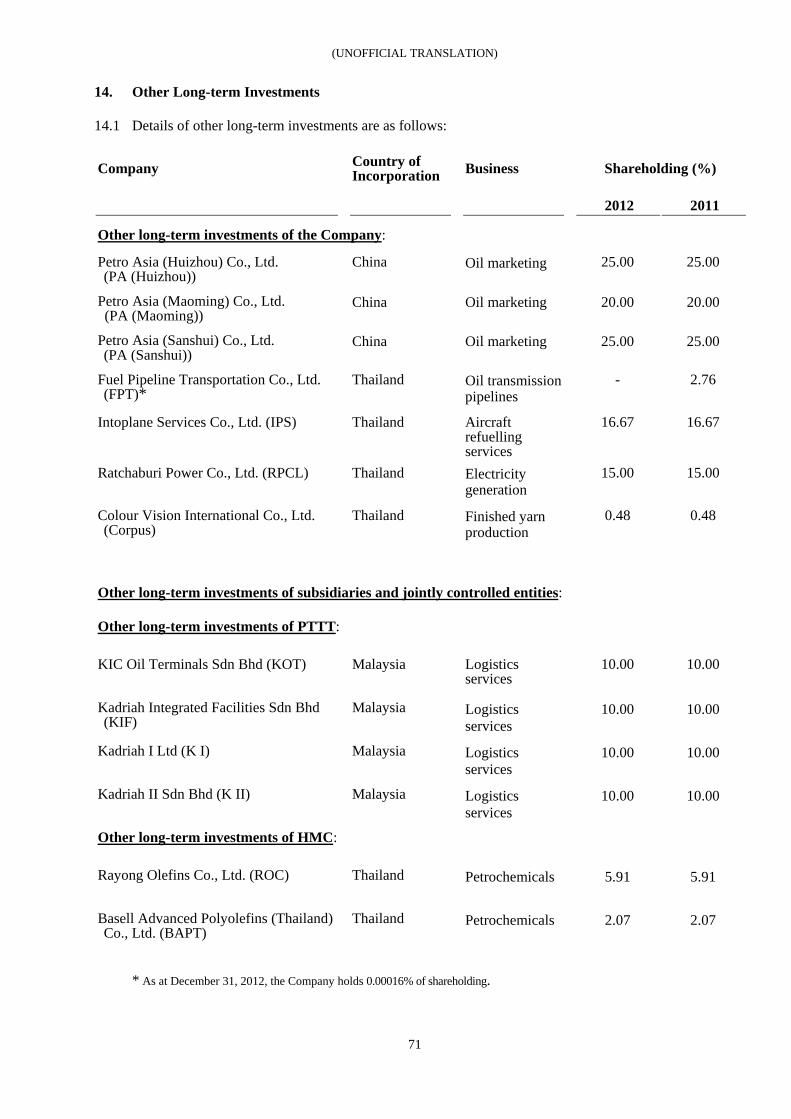
(UNOFFICIAL TRANSLATION)
71
14. Other Long-term Investments
14.1 Details of other long-term investments are as follows:
Company Country of Incorporation Business Shareholding (%)
2012 2011
Other long-term investments of the Company:
Petro Asia (Huizhou) Co., Ltd. (PA (Huizhou))
China Oil marketing
25.00 25.00
Petro Asia (Maoming) Co., Ltd. (PA (Maoming))
9TChina 9TOil marketing 9T20.00 9T20.00
Petro Asia (Sanshui) Co., Ltd. (PA (Sanshui))
9TChina 9TOil marketing 9T25.00 9T25.00
Fuel Pipeline Transportation Co., Ltd. (FPT)*
9TThailand 9TOil transmission pipelines
9T- 9T2.76
Intoplane Services Co., Ltd. (IPS) 9TThailand 9TAircraft refuelling services
9T16.67 9T16.67
Ratchaburi Power Co., Ltd. (RPCL) 9TThailand 9TElectricity generation
9T15.00 9T15.00
Colour Vision International Co., Ltd. (Corpus)
9TThailand 9TFinished yarn production
9T0.48 9T0.48
UOther long-term investments of subsidiaries and jointly controlled entities U:
UOther long-term investments of PTTT U:
KIC Oil Terminals Sdn Bhd (KOT) 9TMalaysia 9TLogistics services
9T10.00 9T10.00
Kadriah Integrated Facilities Sdn Bhd (KIF)
9TMalaysia 9TLogistics services
9T10.00 9T10.00
Kadriah I Ltd (K I) 9TMalaysia 9TLogistics services
9T10.00 9T10.00
Kadriah II Sdn Bhd (K II) 9TMalaysia 9TLogistics services
9T10.00 9T10.00
UOther long-term investments of HMC U:
Rayong Olefins Co., Ltd. (ROC) 9TThailand 9TPetrochemicals
9T5.91 9T5.91
Basell Advanced Polyolefins (Thailand) Co., Ltd. (BAPT)
9TThailand 9TPetrochemicals
9T2.07 9T2.07
* As at December 31, 2012, the Company holds 0.00016% of shareholding.
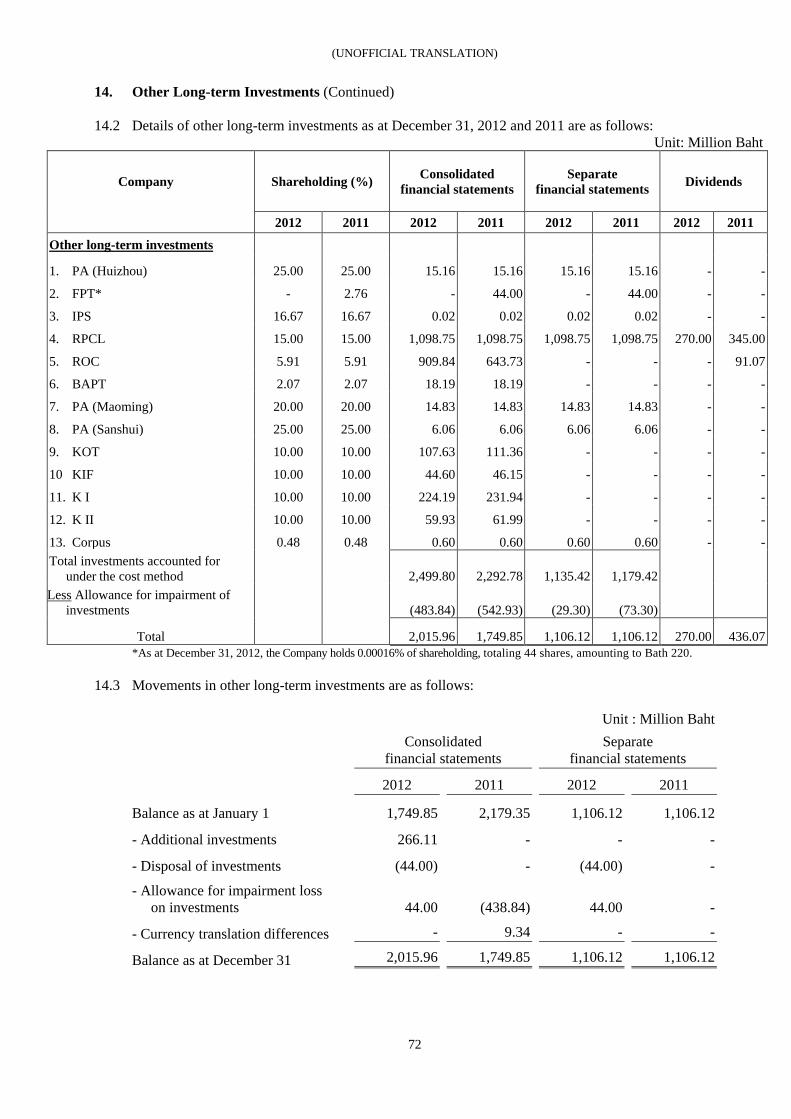
(UNOFFICIAL TRANSLATION)
72
14. Other Long-term Investments (Continued)
14.2 Details of other long-term investments as at December 31, 2012 and 2011 are as follows: Unit: Million Baht
Company Shareholding (%) Consolidated financial statements
Separate financial statements Dividends
2012 2011 2012 2011 2012 2011 2012 2011
Other long-term investments
1. PA (Huizhou) 25.00 25.00 15.16 15.16 15.16 15.16 - -
2. FPT* - 2.76 - 44.00 - 44.00 - -
3. IPS 16.67 16.67 0.02 0.02 0.02 0.02 - -
4. RPCL 15.00 15.00 1,098.75 1,098.75 1,098.75 1,098.75 270.00 345.00
5. ROC 5.91 5.91 909.84 643.73 - - - 91.07
6. BAPT 2.07 2.07 18.19 18.19 - - - -
7. PA (Maoming) 20.00 20.00 14.83 14.83 14.83 14.83 - -
8. PA (Sanshui) 25.00 25.00 6.06 6.06 6.06 6.06 - -
9. KOT 10.00 10.00 107.63 111.36 - - - -
10 KIF 10.00 10.00 44.60 46.15 - - - -
11. K I 10.00 10.00 224.19 231.94 - - - -
12. K II 10.00 10.00 59.93 61.99 - - - -
13. Corpus 0.48 0.48 0.60 0.60 0.60 0.60 - - Total investments accounted for
under the cost method
2,499.80 2,292.78 1,135.42 1,179.42
Less Allowance for impairment of investments
(483.84) (542.93) (29.30) (73.30)
Total 2,015.96 1,749.85 1,106.12 1,106.12 270.00 436.07 *As at December 31, 2012, the Company holds 0.00016% of shareholding, totaling 44 shares, amounting to Bath 220.
14.3 Movements in other long-term investments are as follows:
Unit : Million Baht
Consolidated
financial statements Separate
financial statements
2012 2011 2012 2011
Balance as at January 1 1,749.85 2,179.35 1,106.12 1,106.12
- Additional investments 266.11 - - -
- Disposal of investments (44.00) - (44.00) -
- Allowance for impairment loss on investments 44.00 (438.84) 44.00 -
- Currency translation differences - 9.34 - -
Balance as at December 31 2,015.96 1,749.85 1,106.12 1,106.12
(UNOFFICIAL TRANSLATION)
73
14. Other Long-term Investments (Continued) 14.4 Significant events during the period ended December 31, 2012
ROC
On April 3, 2012, HMC acquired 6,421,156 new issued ordinary shares of Baht 100 each in ROC, in proportion to its shareholding, totaling Baht 642 million. In 2012, HMC paid the full amount for these shares. The Company recognized the investments of Baht 266.11 million according to its percentage of the investment. FPT On September 21, 2012, the Central Bankruptcy Court issued an order approving the rehabilitation plan of FPT, and the plan administer implemented that plan. As a result, the Company holds 44 shares of FPT shares, totaling Baht 220, representing a shareholding of 0.00016%. However, the Company recorded for the impairment loss for the full amount of the investment.
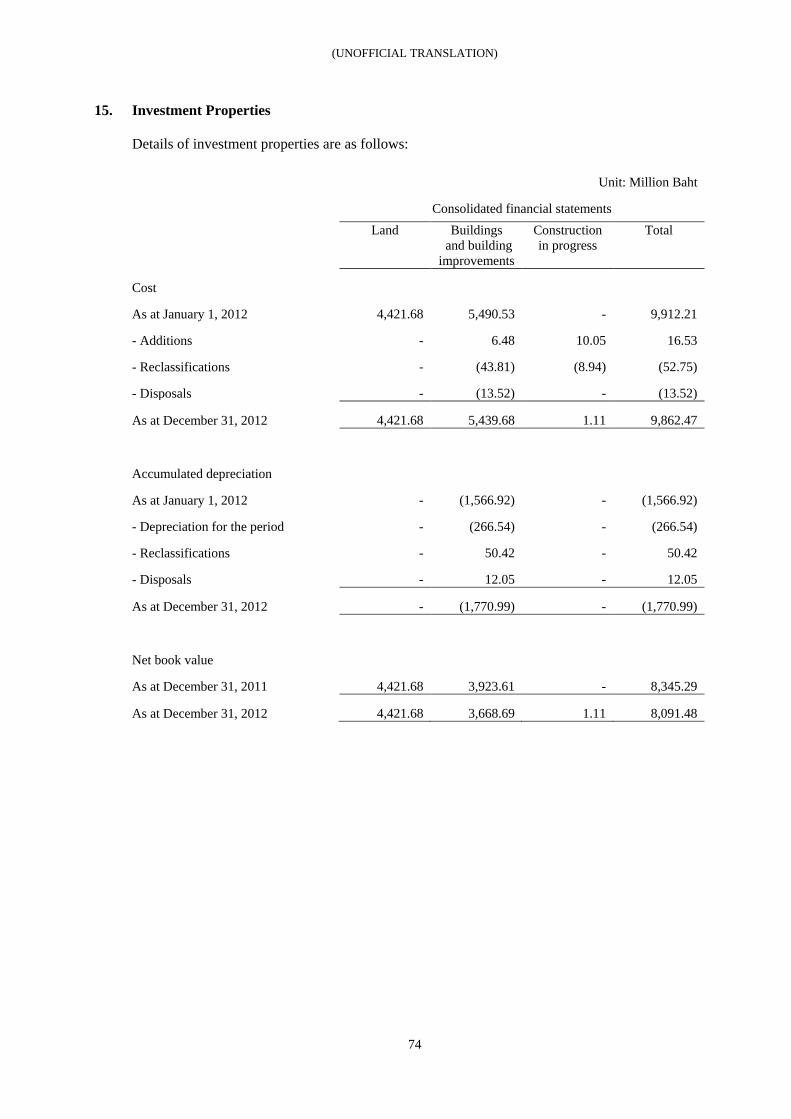
(UNOFFICIAL TRANSLATION)
74
15. Investment Properties Details of investment properties are as follows:
Unit: Million Baht
Consolidated financial statements
Land Buildings ‘and building improvements
Construction in progress
Total
Cost
As at January 1, 2012 4,421.68 5,490.53 - 9,912.21
- Additions - 6.48 10.05 16.53
- Reclassifications - (43.81) (8.94) (52.75)
- Disposals - (13.52) - (13.52)
As at December 31, 2012 4,421.68 5,439.68 1.11 9,862.47
Accumulated depreciation
As at January 1, 2012 - (1,566.92) - (1,566.92)
- Depreciation for the period - (266.54) - (266.54)
- Reclassifications - 50.42 - 50.42
- Disposals - 12.05 - 12.05
As at December 31, 2012 - (1,770.99) - (1,770.99)
Net book value
As at December 31, 2011 4,421.68 3,923.61 - 8,345.29
As at December 31, 2012 4,421.68 3,668.69 1.11 8,091.48
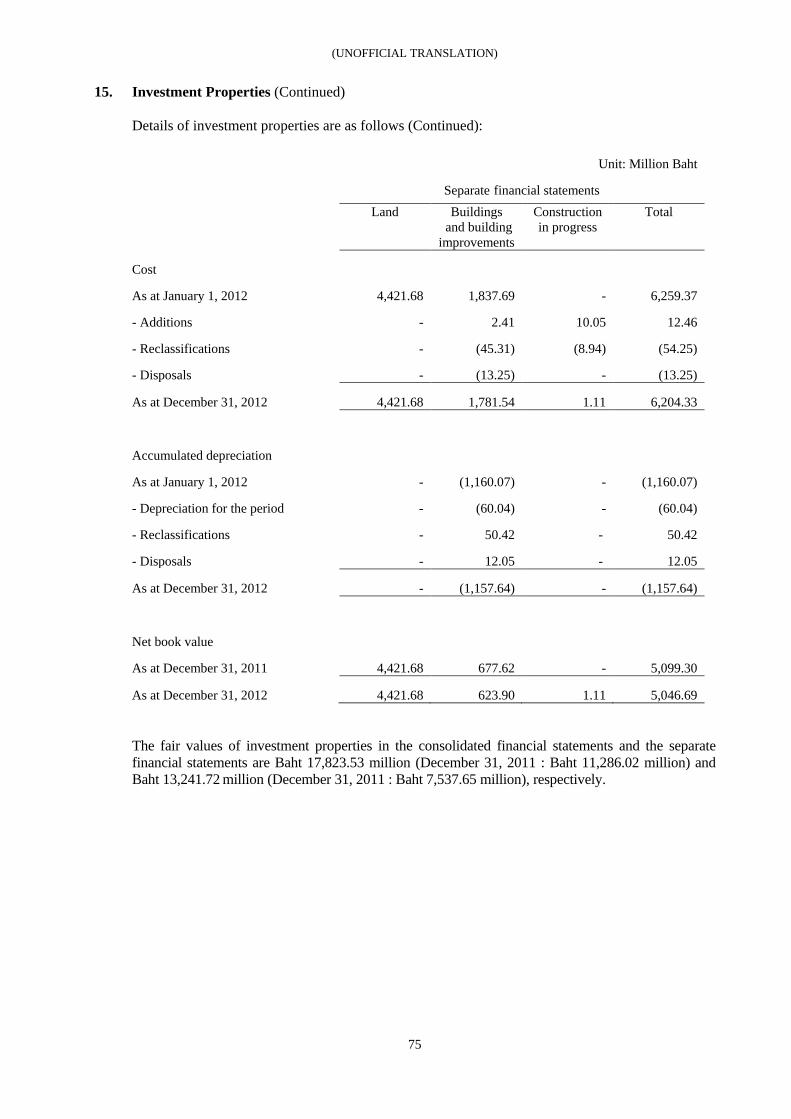
(UNOFFICIAL TRANSLATION)
75
15. Investment Properties (Continued) Details of investment properties are as follows (Continued):
Unit: Million Baht Separate financial statements Land Buildings
‘and building improvements
Construction in progress
Total
Cost
As at January 1, 2012 4,421.68 1,837.69 - 6,259.37
- Additions - 2.41 10.05 12.46
- Reclassifications - (45.31) (8.94) (54.25)
- Disposals - (13.25) - (13.25)
As at December 31, 2012 4,421.68 1,781.54 1.11 6,204.33
Accumulated depreciation
As at January 1, 2012 - (1,160.07) - (1,160.07)
- Depreciation for the period - (60.04) - (60.04)
- Reclassifications - 50.42 - 50.42
- Disposals - 12.05 - 12.05
As at December 31, 2012 - (1,157.64) - (1,157.64)
Net book value
As at December 31, 2011 4,421.68 677.62 - 5,099.30
As at December 31, 2012 4,421.68 623.90 1.11 5,046.69 The fair values of investment properties in the consolidated financial statements and the separate financial statements are Baht 17,823.53 million (December 31, 2011 : Baht 11,286.02 million) and Baht 13,241.72 million (December 31, 2011 : Baht 7,537.65 million), respectively.
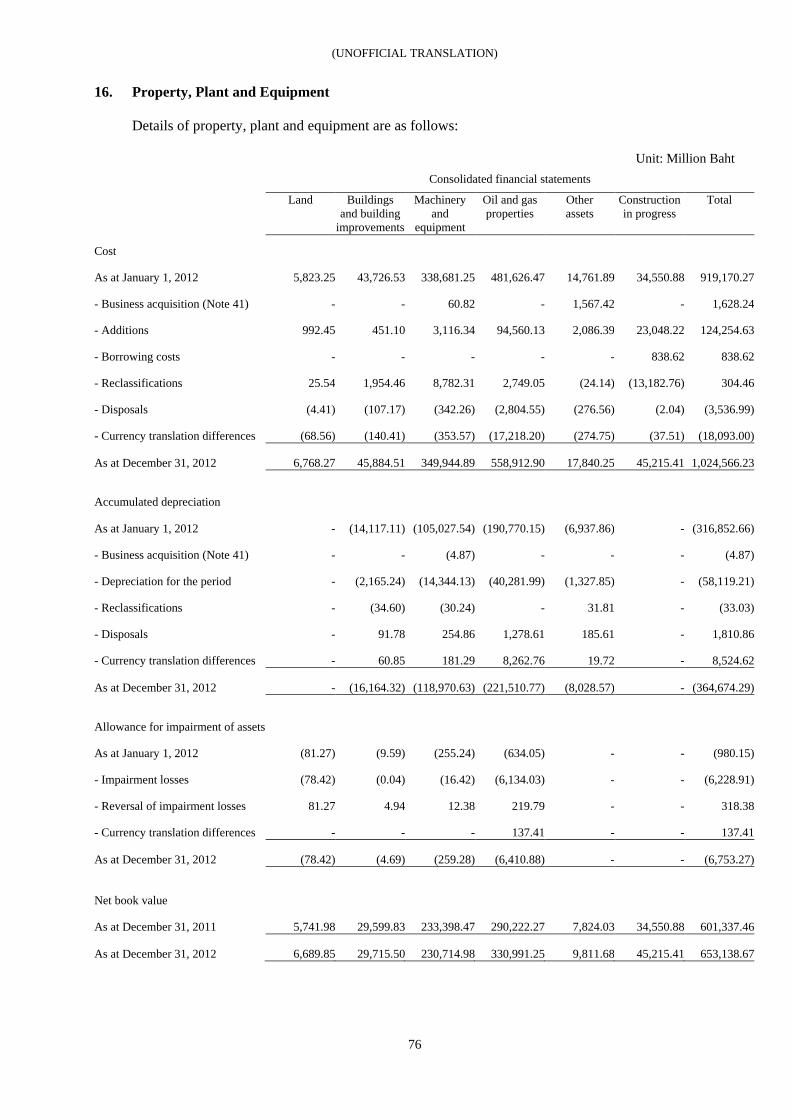
(UNOFFICIAL TRANSLATION)
76
16. Property, Plant and Equipment Details of property, plant and equipment are as follows:
Unit: Million Baht Consolidated financial statements
Land Buildings and building
improvements
Machinery and
equipment
Oil and gas properties
Other assets
Construction in progress
Total
Cost
As at January 1, 2012 5,823.25 43,726.53 338,681.25 481,626.47 14,761.89 34,550.88 919,170.27
- Business acquisition (Note 41) - - 60.82 - 1,567.42 - 1,628.24
- Additions 992.45 451.10 3,116.34 94,560.13 2,086.39 23,048.22 124,254.63
- Borrowing costs - - - - - 838.62 838.62
- Reclassifications 25.54 1,954.46 8,782.31 2,749.05 (24.14) (13,182.76) 304.46
- Disposals (4.41) (107.17) (342.26) (2,804.55) (276.56) (2.04) (3,536.99)
- Currency translation differences (68.56) (140.41) (353.57) (17,218.20) (274.75) (37.51) (18,093.00)
As at December 31, 2012 6,768.27 45,884.51 349,944.89 558,912.90 17,840.25 45,215.41 1,024,566.23
Accumulated depreciation
As at January 1, 2012 - (14,117.11) (105,027.54) (190,770.15) (6,937.86) - (316,852.66)
- Business acquisition (Note 41) - - (4.87) - - - (4.87)
- Depreciation for the period - (2,165.24) (14,344.13) (40,281.99) (1,327.85) - (58,119.21)
- Reclassifications - (34.60) (30.24) - 31.81 - (33.03)
- Disposals - 91.78 254.86 1,278.61 185.61 - 1,810.86
- Currency translation differences - 60.85 181.29 8,262.76 19.72 - 8,524.62
As at December 31, 2012 - (16,164.32) (118,970.63) (221,510.77) (8,028.57) - (364,674.29)
Allowance for impairment of assets
As at January 1, 2012 (81.27) (9.59) (255.24) (634.05) - - (980.15)
- Impairment losses (78.42) (0.04) (16.42) (6,134.03) - - (6,228.91)
- Reversal of impairment losses 81.27 4.94 12.38 219.79 - - 318.38
- Currency translation differences - - - 137.41 - - 137.41
As at December 31, 2012 (78.42) (4.69) (259.28) (6,410.88) - - (6,753.27)
Net book value
As at December 31, 2011 5,741.98 29,599.83 233,398.47 290,222.27 7,824.03 34,550.88 601,337.46
As at December 31, 2012 6,689.85 29,715.50 230,714.98 330,991.25 9,811.68 45,215.41 653,138.67
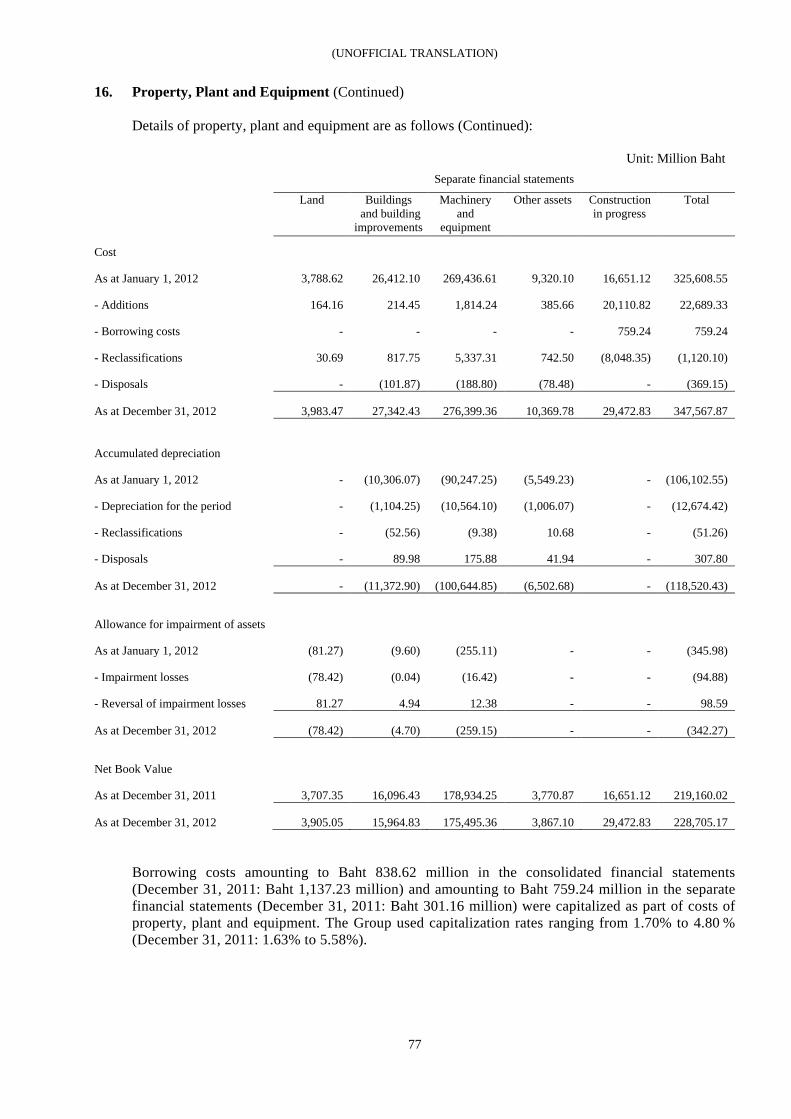
(UNOFFICIAL TRANSLATION)
77
16. Property, Plant and Equipment (Continued) Details of property, plant and equipment are as follows (Continued):
Unit: Million Baht Separate financial statements
Land Buildings ‘and building improvements
Machinery and
equipment
Other assets Construction in progress
Total
Cost
As at January 1, 2012 3,788.62 26,412.10 269,436.61 9,320.10 16,651.12 325,608.55
- Additions 164.16 214.45 1,814.24 385.66 20,110.82 22,689.33
- Borrowing costs - - - - 759.24 759.24
- Reclassifications 30.69 817.75 5,337.31 742.50 (8,048.35) (1,120.10)
- Disposals - (101.87) (188.80) (78.48) - (369.15)
As at December 31, 2012 3,983.47 27,342.43 276,399.36 10,369.78 29,472.83 347,567.87
Accumulated depreciation
As at January 1, 2012 - (10,306.07) (90,247.25) (5,549.23) - (106,102.55)
- Depreciation for the period - (1,104.25) (10,564.10) (1,006.07) - (12,674.42)
- Reclassifications - (52.56) (9.38) 10.68 - (51.26)
- Disposals - 89.98 175.88 41.94 - 307.80
As at December 31, 2012 - (11,372.90) (100,644.85) (6,502.68) - (118,520.43)
Allowance for impairment of assets
As at January 1, 2012 (81.27) (9.60) (255.11) - - (345.98)
- Impairment losses (78.42) (0.04) (16.42) - - (94.88)
- Reversal of impairment losses 81.27 4.94 12.38 - - 98.59
As at December 31, 2012 (78.42) (4.70) (259.15) - - (342.27)
Net Book Value
As at December 31, 2011 3,707.35 16,096.43 178,934.25 3,770.87 16,651.12 219,160.02
As at December 31, 2012 3,905.05 15,964.83 175,495.36 3,867.10 29,472.83 228,705.17 Borrowing costs amounting to Baht 838.62 million in the consolidated financial statements (December 31, 2011: Baht 1,137.23 million) and amounting to Baht 759.24 million in the separate financial statements (December 31, 2011: Baht 301.16 million) were capitalized as part of costs of property, plant and equipment. The Group used capitalization rates ranging from 1.70% to 4.80 % (December 31, 2011: 1.63% to 5.58%).
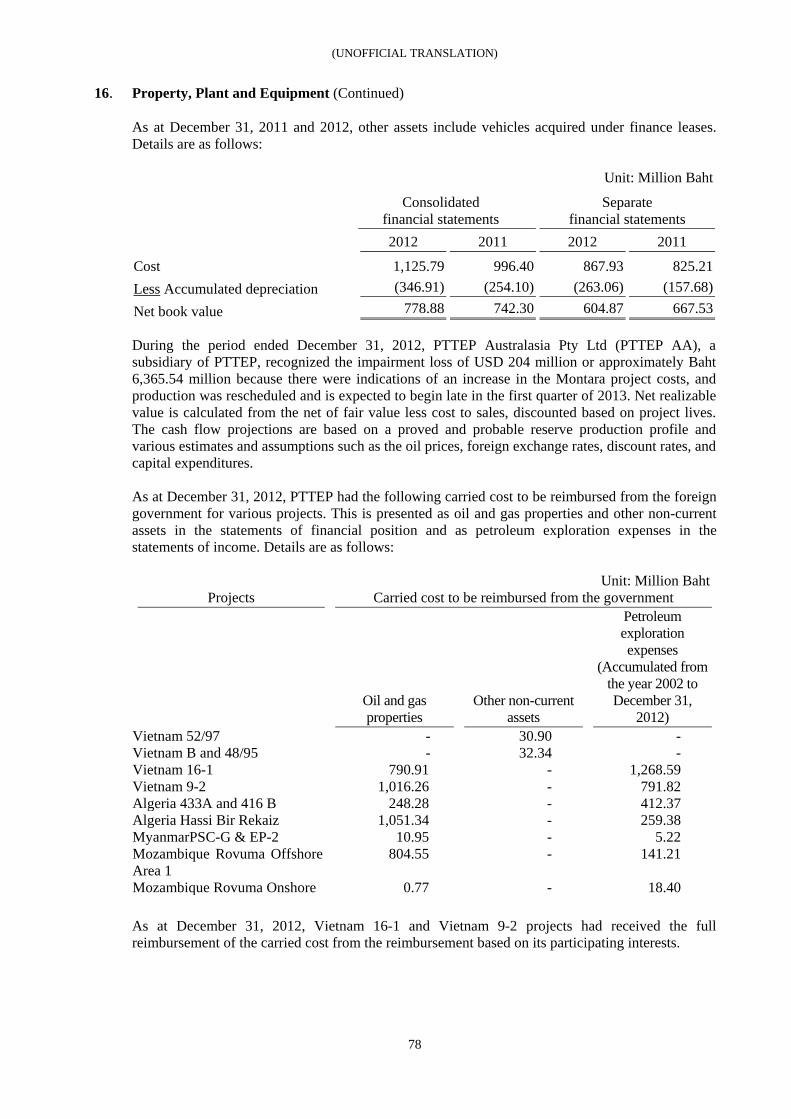
(UNOFFICIAL TRANSLATION)
78
16. Property, Plant and Equipment (Continued) As at December 31, 2011 and 2012, other assets include vehicles acquired under finance leases. Details are as follows: Unit: Million Baht
Consolidated financial statements
Separate financial statements
2012 2011 2012 2011 Cost 1,125.79 996.40 867.93 825.21 Less Accumulated depreciation (346.91) (254.10) (263.06) (157.68)
Net book value 778.88 742.30 604.87 667.53 During the period ended December 31, 2012, PTTEP Australasia Pty Ltd (PTTEP AA), a subsidiary of PTTEP, recognized the impairment loss of USD 204 million or approximately Baht 6,365.54 million because there were indications of an increase in the Montara project costs, and production was rescheduled and is expected to begin late in the first quarter of 2013. Net realizable value is calculated from the net of fair value less cost to sales, discounted based on project lives. The cash flow projections are based on a proved and probable reserve production profile and various estimates and assumptions such as the oil prices, foreign exchange rates, discount rates, and capital expenditures. As at December 31, 2012, PTTEP had the following carried cost to be reimbursed from the foreign government for various projects. This is presented as oil and gas properties and other non-current assets in the statements of financial position and as petroleum exploration expenses in the statements of income. Details are as follows:
Unit: Million Baht Projects Carried cost to be reimbursed from the government
Oil and gas properties
Other non-current assets
Petroleum exploration expenses
(Accumulated from the year 2002 to December 31,
2012)
Vietnam 52/97 - 30.90 - Vietnam B and 48/95 - 32.34 - Vietnam 16-1 790.91 - 1,268.59 Vietnam 9-2 1,016.26 - 791.82 Algeria 433A and 416 B 248.28 - 412.37 Algeria Hassi Bir Rekaiz 1,051.34 - 259.38 MyanmarPSC-G & EP-2 10.95 - 5.22 Mozambique Rovuma Offshore Area 1
804.55 - 141.21
Mozambique Rovuma Onshore 0.77 - 18.40
As at December 31, 2012, Vietnam 16-1 and Vietnam 9-2 projects had received the full reimbursement of the carried cost from the reimbursement based on its participating interests.
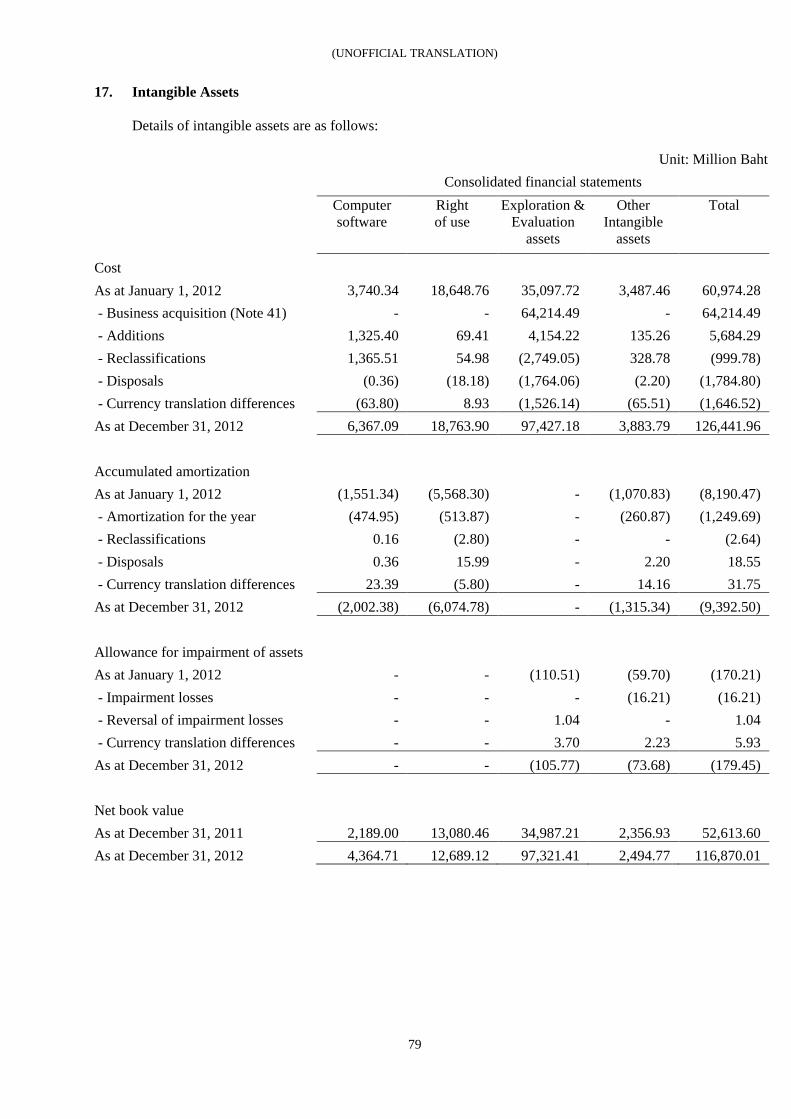
(UNOFFICIAL TRANSLATION)
79
17. Intangible Assets Details of intangible assets are as follows:
Unit: Million Baht Consolidated financial statements Computer
software Right of use
Exploration & Evaluation
assets
Other Intangible
assets
Total
Cost As at January 1, 2012 3,740.34 18,648.76 35,097.72 3,487.46 60,974.28 - Business acquisition (Note 41) - - 64,214.49 - 64,214.49 - Additions 1,325.40 69.41 4,154.22 135.26 5,684.29 - Reclassifications 1,365.51 54.98 (2,749.05) 328.78 (999.78) - Disposals (0.36) (18.18) (1,764.06) (2.20) (1,784.80) - Currency translation differences (63.80) 8.93 (1,526.14) (65.51) (1,646.52) As at December 31, 2012 6,367.09 18,763.90 97,427.18 3,883.79 126,441.96 Accumulated amortization As at January 1, 2012 (1,551.34) (5,568.30) - (1,070.83) (8,190.47) - Amortization for the year (474.95) (513.87) - (260.87) (1,249.69) - Reclassifications 0.16 (2.80) - - (2.64) - Disposals 0.36 15.99 - 2.20 18.55 - Currency translation differences 23.39 (5.80) - 14.16 31.75 As at December 31, 2012 (2,002.38) (6,074.78) - (1,315.34) (9,392.50) Allowance for impairment of assets As at January 1, 2012 - - (110.51) (59.70) (170.21) - Impairment losses - - - (16.21) (16.21) - Reversal of impairment losses - - 1.04 - 1.04 - Currency translation differences - - 3.70 2.23 5.93 As at December 31, 2012 - - (105.77) (73.68) (179.45)
Net book value As at December 31, 2011 2,189.00 13,080.46 34,987.21 2,356.93 52,613.60 As at December 31, 2012 4,364.71 12,689.12 97,321.41 2,494.77 116,870.01
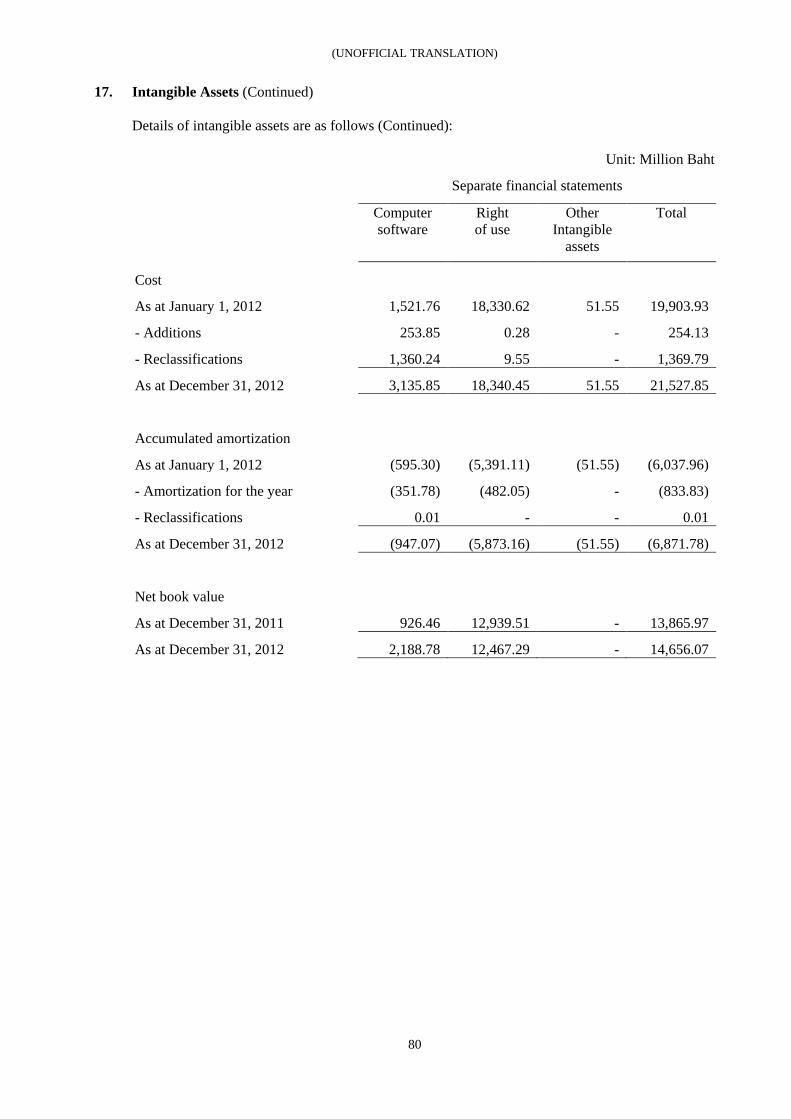
(UNOFFICIAL TRANSLATION)
80
17. Intangible Assets (Continued) Details of intangible assets are as follows (Continued):
Unit: Million Baht
Separate financial statements
Computer software
Right of use
Other Intangible
assets
Total
Cost
As at January 1, 2012 1,521.76 18,330.62 51.55 19,903.93
- Additions 253.85 0.28 - 254.13
- Reclassifications 1,360.24 9.55 - 1,369.79
As at December 31, 2012 3,135.85 18,340.45 51.55 21,527.85
Accumulated amortization
As at January 1, 2012 (595.30) (5,391.11) (51.55) (6,037.96)
- Amortization for the year (351.78) (482.05) - (833.83)
- Reclassifications 0.01 - - 0.01
As at December 31, 2012 (947.07) (5,873.16) (51.55) (6,871.78)
Net book value
As at December 31, 2011 926.46 12,939.51 - 13,865.97
As at December 31, 2012 2,188.78 12,467.29 - 14,656.07
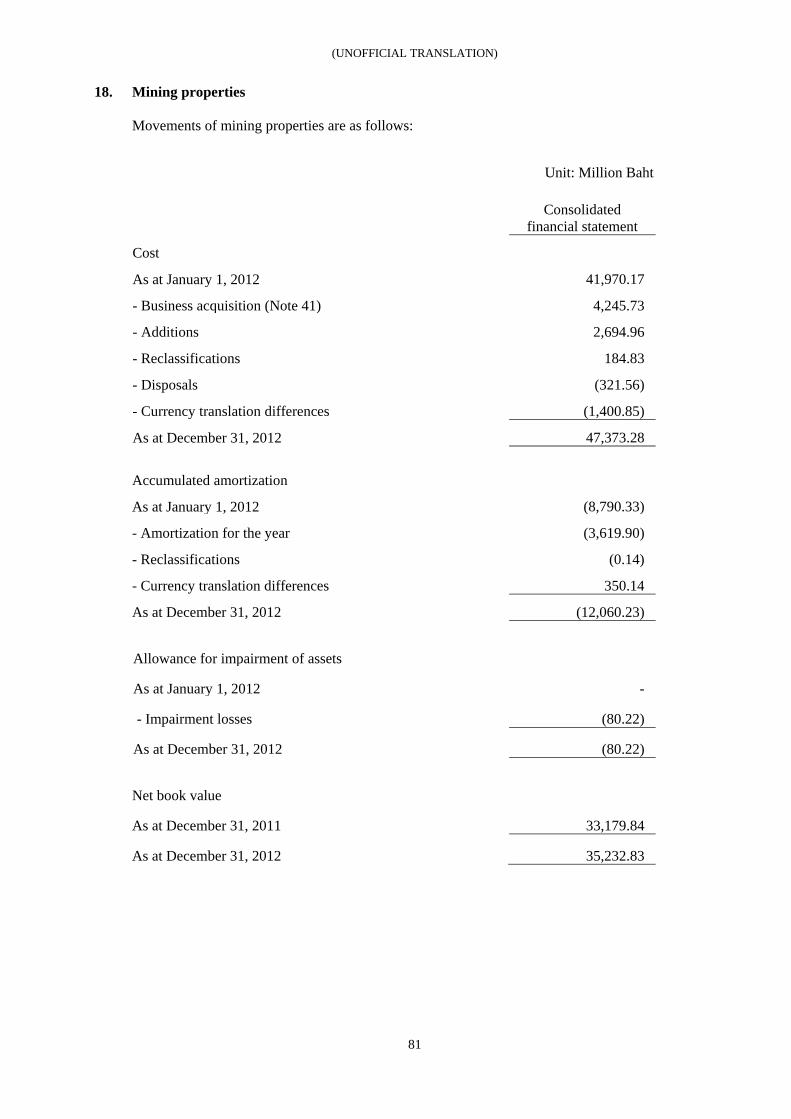
(UNOFFICIAL TRANSLATION)
81
18. Mining properties Movements of mining properties are as follows:
Unit: Million Baht
Consolidated
financial statement
Cost
As at January 1, 2012 41,970.17
- Business acquisition (Note 41) 4,245.73
- Additions 2,694.96
- Reclassifications 184.83
- Disposals (321.56)
- Currency translation differences (1,400.85)
As at December 31, 2012 47,373.28
Accumulated amortization
As at January 1, 2012 (8,790.33)
- Amortization for the year (3,619.90)
- Reclassifications (0.14)
- Currency translation differences 350.14
As at December 31, 2012 (12,060.23)
Allowance for impairment of assets
As at January 1, 2012 -
- Impairment losses (80.22)
As at December 31, 2012 (80.22)
Net book value
As at December 31, 2011 33,179.84
As at December 31, 2012 35,232.83
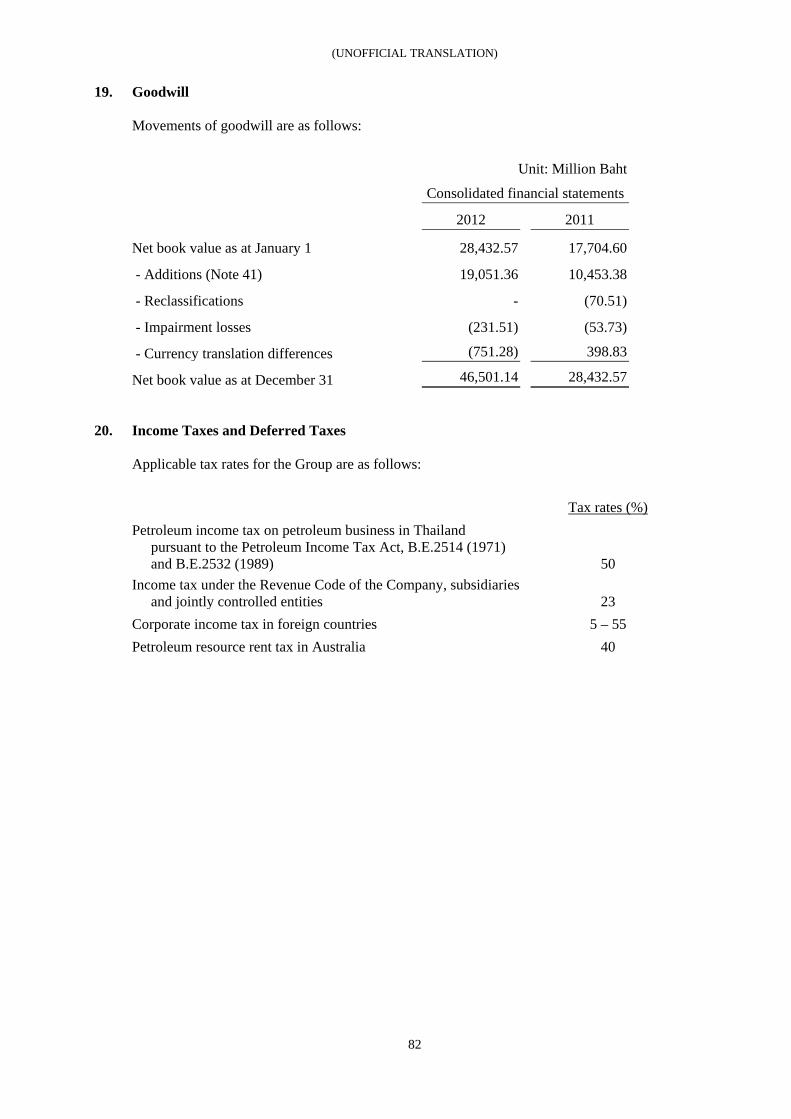
(UNOFFICIAL TRANSLATION)
82
19. Goodwill Movements of goodwill are as follows:
Unit: Million Baht Consolidated financial statements
2012 2011
Net book value as at January 1 28,432.57 17,704.60
- Additions (Note 41) 19,051.36 10,453.38
- Reclassifications - (70.51)
- Impairment losses (231.51) (53.73)
- Currency translation differences (751.28) 398.83
Net book value as at December 31 46,501.14 28,432.57
20. Income Taxes and Deferred Taxes Applicable tax rates for the Group are as follows: Tax rates (%) Petroleum income tax on petroleum business in Thailand pursuant to the Petroleum Income Tax Act, B.E.2514 (1971)
and B.E.2532 (1989) 50 Income tax under the Revenue Code of the Company, subsidiaries
and jointly controlled entities 23 Corporate income tax in foreign countries 5 – 55 Petroleum resource rent tax in Australia 40
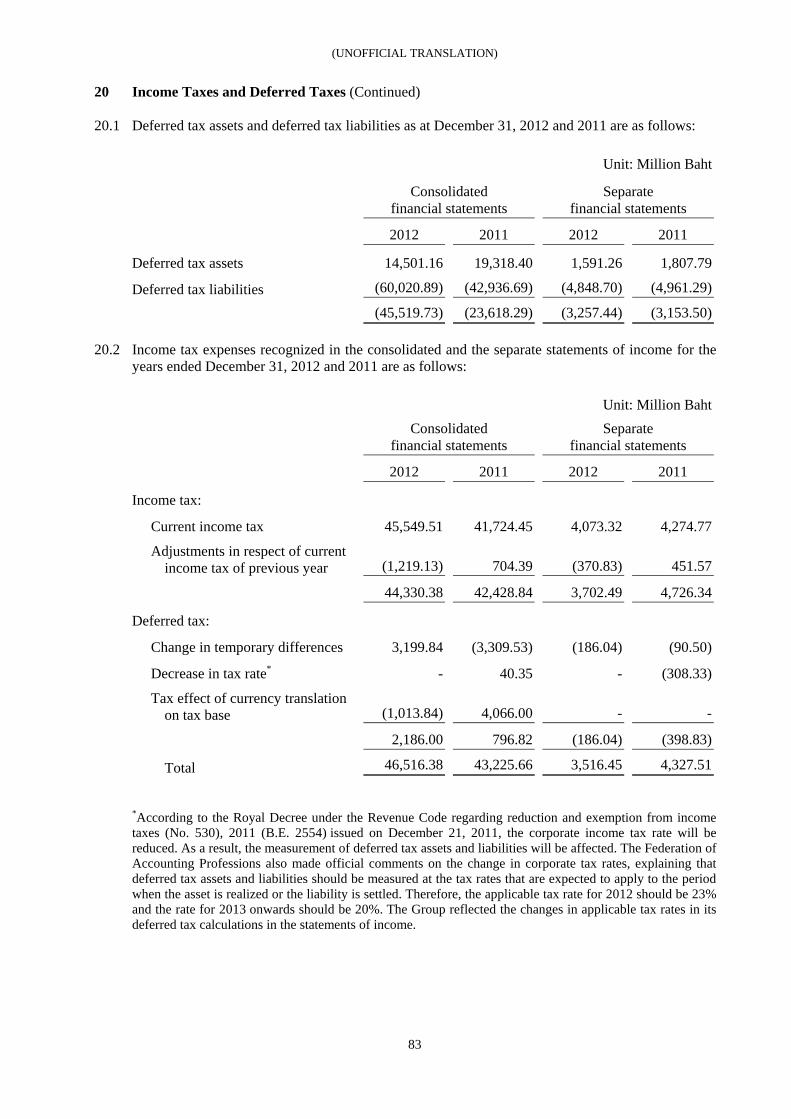
(UNOFFICIAL TRANSLATION)
83
20 Income Taxes and Deferred Taxes (Continued)
20.1 Deferred tax assets and deferred tax liabilities as at December 31, 2012 and 2011 are as follows:
Unit: Million Baht
Consolidated
financial statements Separate
financial statements
2012 2011 2012 2011
Deferred tax assets 14,501.16 19,318.40 1,591.26 1,807.79
Deferred tax liabilities (60,020.89) (42,936.69) (4,848.70) (4,961.29)
(45,519.73) (23,618.29) (3,257.44) (3,153.50) 20.2 Income tax expenses recognized in the consolidated and the separate statements of income for the
years ended December 31, 2012 and 2011 are as follows:
Unit: Million Baht
Consolidated
financial statements Separate
financial statements
2012 2011 2012 2011
Income tax:
Current income tax 45,549.51 41,724.45 4,073.32 4,274.77
Adjustments in respect of current income tax of previous year (1,219.13) 704.39 (370.83) 451.57
44,330.38 42,428.84 3,702.49 4,726.34
Deferred tax:
Change in temporary differences 3,199.84 (3,309.53) (186.04) (90.50)
Decrease in tax rate* - 40.35 - (308.33)
Tax effect of currency translation on tax base (1,013.84) 4,066.00 - -
2,186.00 796.82 (186.04) (398.83)
Total 46,516.38 43,225.66 3,516.45 4,327.51
*According to the Royal Decree under the Revenue Code regarding reduction and exemption from income taxes (No. 530), 2011 (B.E. 2554) issued on December 21, 2011, the corporate income tax rate will be reduced. As a result, the measurement of deferred tax assets and liabilities will be affected. The Federation of Accounting Professions also made official comments on the change in corporate tax rates, explaining that deferred tax assets and liabilities should be measured at the tax rates that are expected to apply to the period when the asset is realized or the liability is settled. Therefore, the applicable tax rate for 2012 should be 23% and the rate for 2013 onwards should be 20%. The Group reflected the changes in applicable tax rates in its deferred tax calculations in the statements of income.
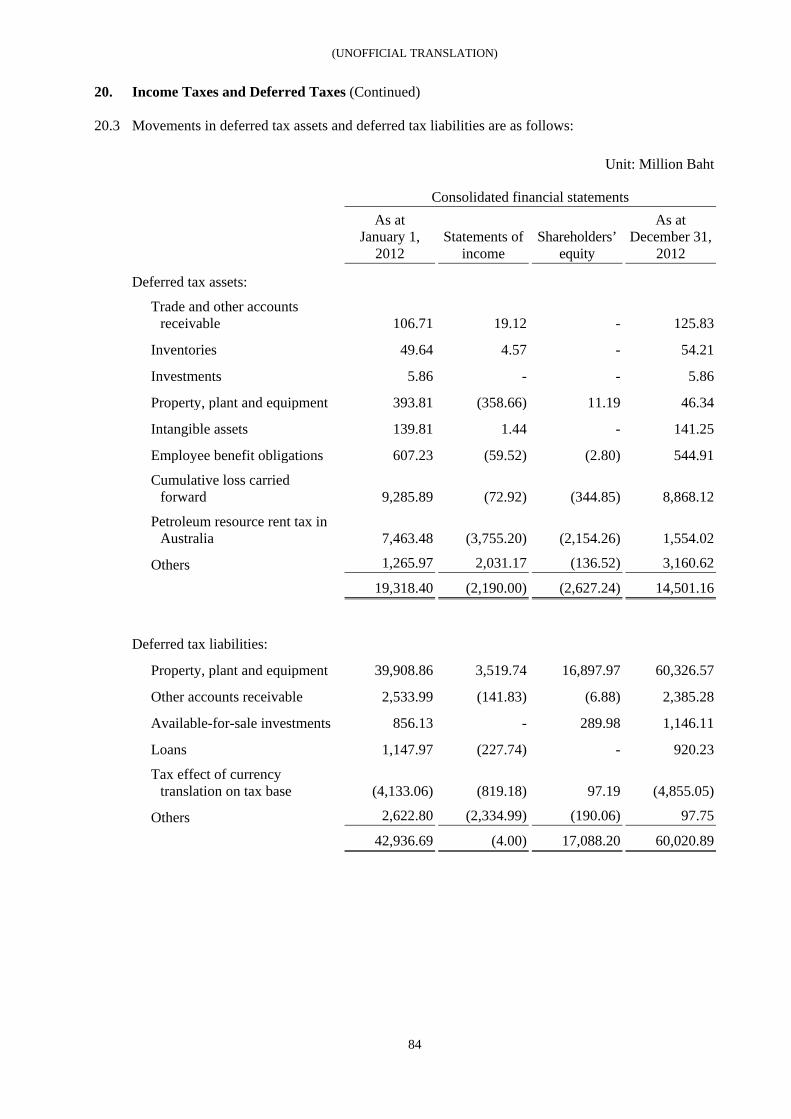
(UNOFFICIAL TRANSLATION)
84
20. Income Taxes and Deferred Taxes (Continued)
20.3 Movements in deferred tax assets and deferred tax liabilities are as follows:
Unit: Million Baht
Consolidated financial statements
As at January 1,
2012 Statements of
income Shareholders’
equity
As at December 31,
2012
Deferred tax assets:
Trade and other accounts receivable 106.71 19.12 - 125.83
Inventories 49.64 4.57 - 54.21
Investments 5.86 - - 5.86
Property, plant and equipment 393.81 (358.66) 11.19 46.34
Intangible assets 139.81 1.44 - 141.25
Employee benefit obligations 607.23 (59.52) (2.80) 544.91
Cumulative loss carried forward 9,285.89 (72.92) (344.85) 8,868.12
Petroleum resource rent tax in Australia 7,463.48 (3,755.20) (2,154.26) 1,554.02
Others 1,265.97 2,031.17 (136.52) 3,160.62
19,318.40 (2,190.00) (2,627.24) 14,501.16
Deferred tax liabilities:
Property, plant and equipment 39,908.86 3,519.74 16,897.97 60,326.57
Other accounts receivable 2,533.99 (141.83) (6.88) 2,385.28
Available-for-sale investments 856.13 - 289.98 1,146.11
Loans 1,147.97 (227.74) - 920.23
Tax effect of currency translation on tax base (4,133.06) (819.18) 97.19 (4,855.05)
Others 2,622.80 (2,334.99) (190.06) 97.75
42,936.69 (4.00) 17,088.20 60,020.89
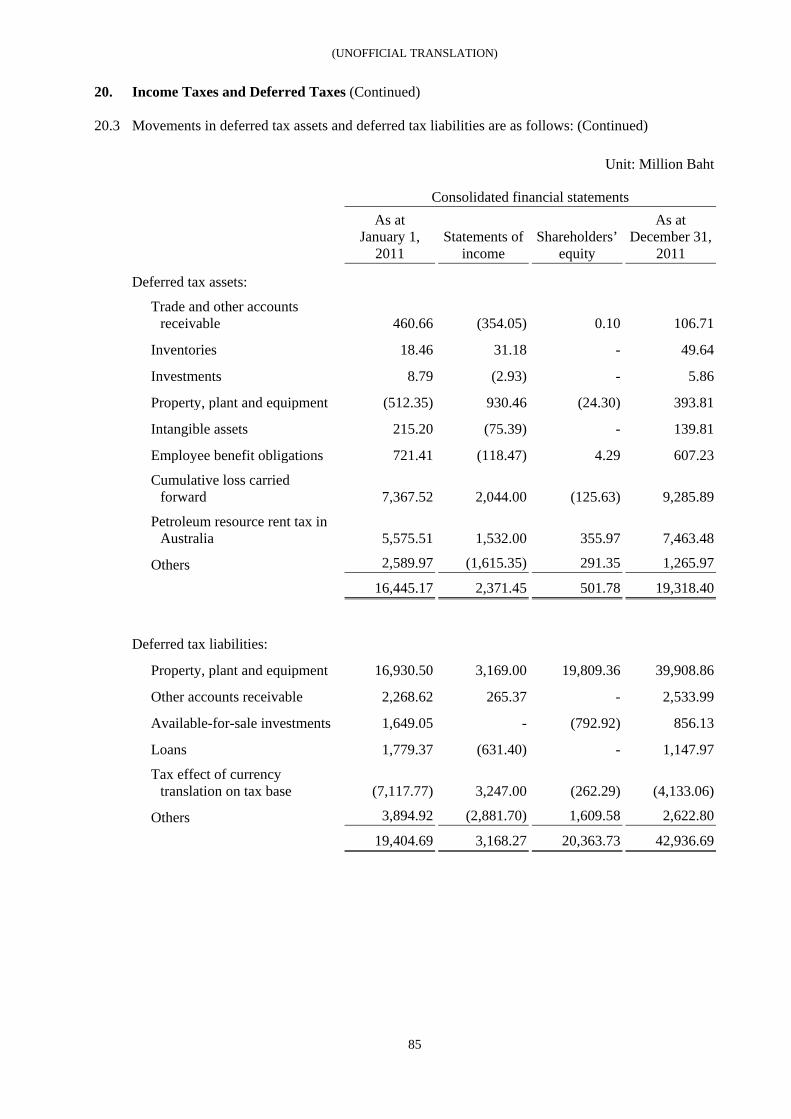
(UNOFFICIAL TRANSLATION)
85
20. Income Taxes and Deferred Taxes (Continued)
20.3 Movements in deferred tax assets and deferred tax liabilities are as follows: (Continued)
Unit: Million Baht
Consolidated financial statements
As at January 1,
2011 Statements of
income Shareholders’
equity
As at December 31,
2011
Deferred tax assets:
Trade and other accounts receivable 460.66 (354.05) 0.10 106.71
Inventories 18.46 31.18 - 49.64
Investments 8.79 (2.93) - 5.86
Property, plant and equipment (512.35) 930.46 (24.30) 393.81
Intangible assets 215.20 (75.39) - 139.81
Employee benefit obligations 721.41 (118.47) 4.29 607.23
Cumulative loss carried forward 7,367.52 2,044.00 (125.63) 9,285.89
Petroleum resource rent tax in Australia 5,575.51 1,532.00 355.97 7,463.48
Others 2,589.97 (1,615.35) 291.35 1,265.97
16,445.17 2,371.45 501.78 19,318.40
Deferred tax liabilities:
Property, plant and equipment 16,930.50 3,169.00 19,809.36 39,908.86
Other accounts receivable 2,268.62 265.37 - 2,533.99
Available-for-sale investments 1,649.05 - (792.92) 856.13
Loans 1,779.37 (631.40) - 1,147.97
Tax effect of currency translation on tax base (7,117.77) 3,247.00 (262.29) (4,133.06)
Others 3,894.92 (2,881.70) 1,609.58 2,622.80
19,404.69 3,168.27 20,363.73 42,936.69
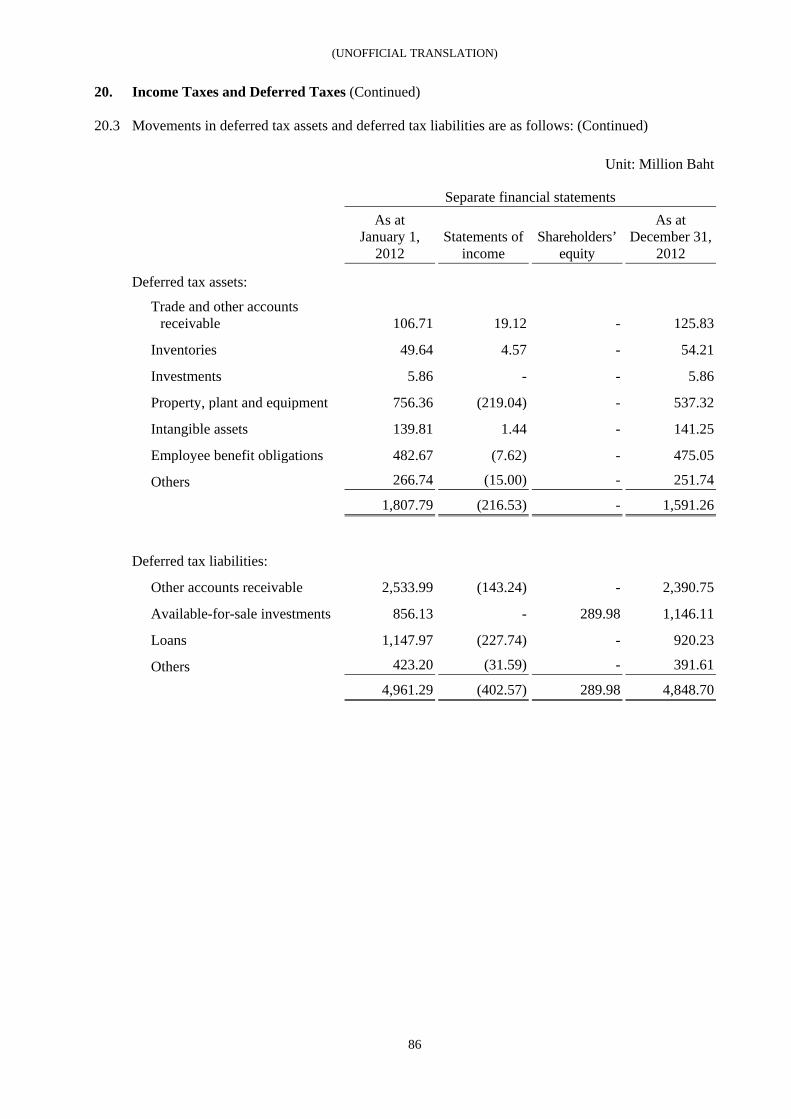
(UNOFFICIAL TRANSLATION)
86
20. Income Taxes and Deferred Taxes (Continued)
20.3 Movements in deferred tax assets and deferred tax liabilities are as follows: (Continued)
Unit: Million Baht
Separate financial statements
As at January 1,
2012 Statements of
income Shareholders’
equity
As at December 31,
2012
Deferred tax assets:
Trade and other accounts receivable 106.71 19.12 - 125.83
Inventories 49.64 4.57 - 54.21
Investments 5.86 - - 5.86
Property, plant and equipment 756.36 (219.04) - 537.32
Intangible assets 139.81 1.44 - 141.25
Employee benefit obligations 482.67 (7.62) - 475.05
Others 266.74 (15.00) - 251.74
1,807.79 (216.53) - 1,591.26
Deferred tax liabilities:
Other accounts receivable 2,533.99 (143.24) - 2,390.75
Available-for-sale investments 856.13 - 289.98 1,146.11
Loans 1,147.97 (227.74) - 920.23
Others 423.20 (31.59) - 391.61
4,961.29 (402.57) 289.98 4,848.70
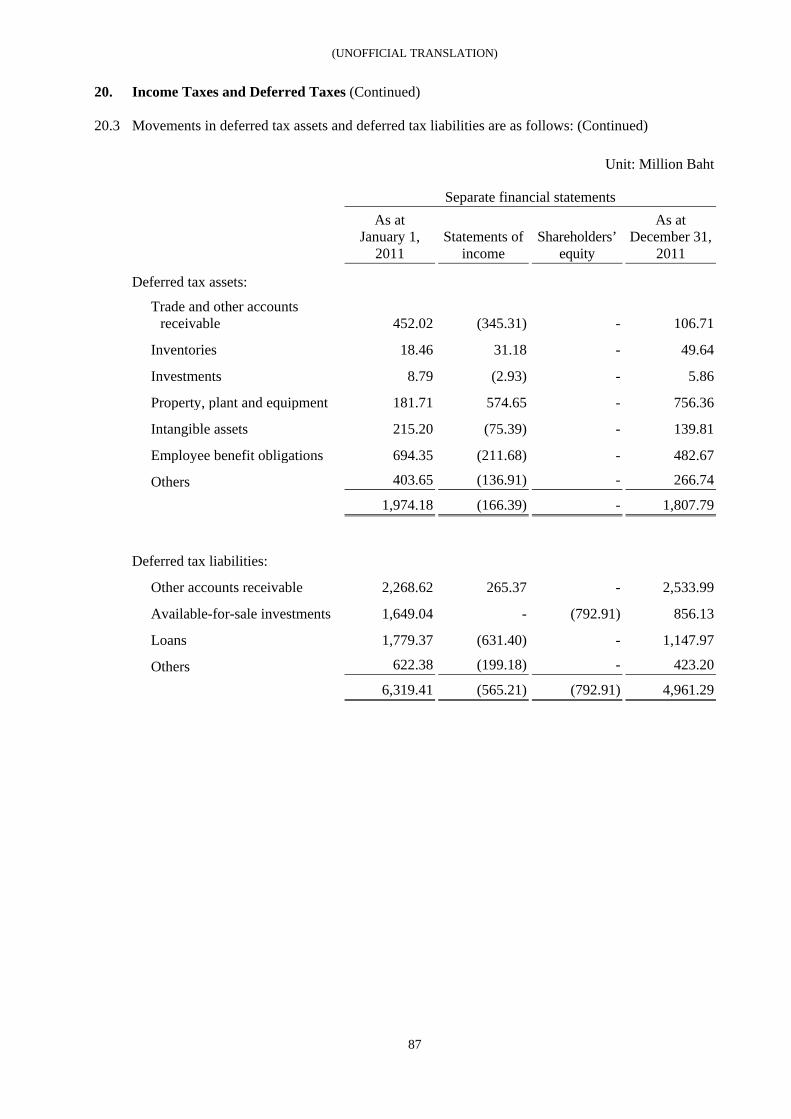
(UNOFFICIAL TRANSLATION)
87
20. Income Taxes and Deferred Taxes (Continued)
20.3 Movements in deferred tax assets and deferred tax liabilities are as follows: (Continued)
Unit: Million Baht
Separate financial statements
As at January 1,
2011 Statements of
income Shareholders’
equity
As at December 31,
2011
Deferred tax assets:
Trade and other accounts receivable 452.02 (345.31) - 106.71
Inventories 18.46 31.18 - 49.64
Investments 8.79 (2.93) - 5.86
Property, plant and equipment 181.71 574.65 - 756.36
Intangible assets 215.20 (75.39) - 139.81
Employee benefit obligations 694.35 (211.68) - 482.67
Others 403.65 (136.91) - 266.74
1,974.18 (166.39) - 1,807.79
Deferred tax liabilities:
Other accounts receivable 2,268.62 265.37 - 2,533.99
Available-for-sale investments 1,649.04 - (792.91) 856.13
Loans 1,779.37 (631.40) - 1,147.97
Others 622.38 (199.18) - 423.20
6,319.41 (565.21) (792.91) 4,961.29
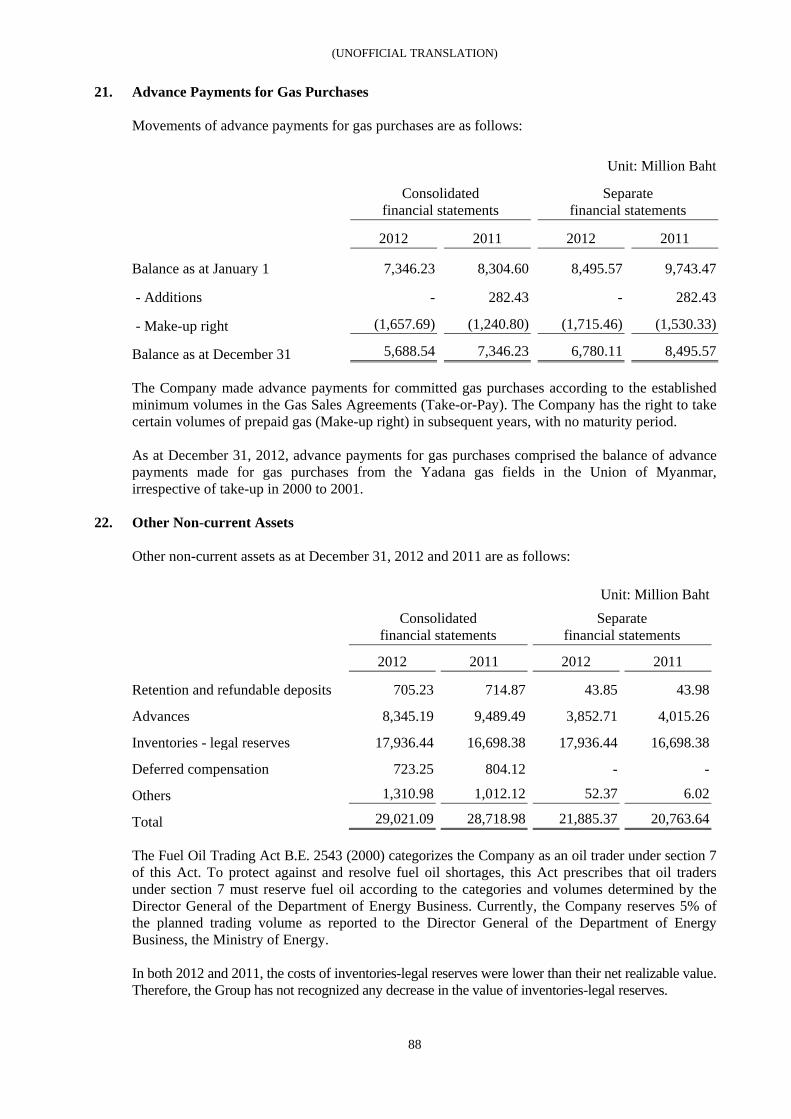
(UNOFFICIAL TRANSLATION)
88
21. Advance Payments for Gas Purchases Movements of advance payments for gas purchases are as follows: Unit: Million Baht Consolidated
financial statements
Separate financial statements
2012 2011 2012 2011
Balance as at January 1 7,346.23 8,304.60 8,495.57 9,743.47
- Additions - 282.43 - 282.43
- Make-up right (1,657.69) (1,240.80) (1,715.46) (1,530.33)
Balance as at December 31 5,688.54 7,346.23 6,780.11 8,495.57 The Company made advance payments for committed gas purchases according to the established minimum volumes in the Gas Sales Agreements (Take-or-Pay). The Company has the right to take certain volumes of prepaid gas (Make-up right) in subsequent years, with no maturity period. As at December 31, 2012, advance payments for gas purchases comprised the balance of advance payments made for gas purchases from the Yadana gas fields in the Union of Myanmar, irrespective of take-up in 2000 to 2001.
22. Other Non-current Assets Other non-current assets as at December 31, 2012 and 2011 are as follows: Unit: Million Baht
Consolidated
financial statements Separate
financial statements
2012 2011 2012 2011
Retention and refundable deposits 705.23 714.87 43.85 43.98
Advances 8,345.19 9,489.49 3,852.71 4,015.26
Inventories - legal reserves 17,936.44 16,698.38 17,936.44 16,698.38
Deferred compensation 723.25 804.12 - -
Others 1,310.98 1,012.12 52.37 6.02
Total 29,021.09 28,718.98 21,885.37 20,763.64 The Fuel Oil Trading Act B.E. 2543 (2000) categorizes the Company as an oil trader under section 7 of this Act. To protect against and resolve fuel oil shortages, this Act prescribes that oil traders under section 7 must reserve fuel oil according to the categories and volumes determined by the Director General of the Department of Energy Business. Currently, the Company reserves 5% of the planned trading volume as reported to the Director General of the Department of Energy Business, the Ministry of Energy. In both 2012 and 2011, the costs of inventories-legal reserves were lower than their net realizable value. Therefore, the Group has not recognized any decrease in the value of inventories-legal reserves.
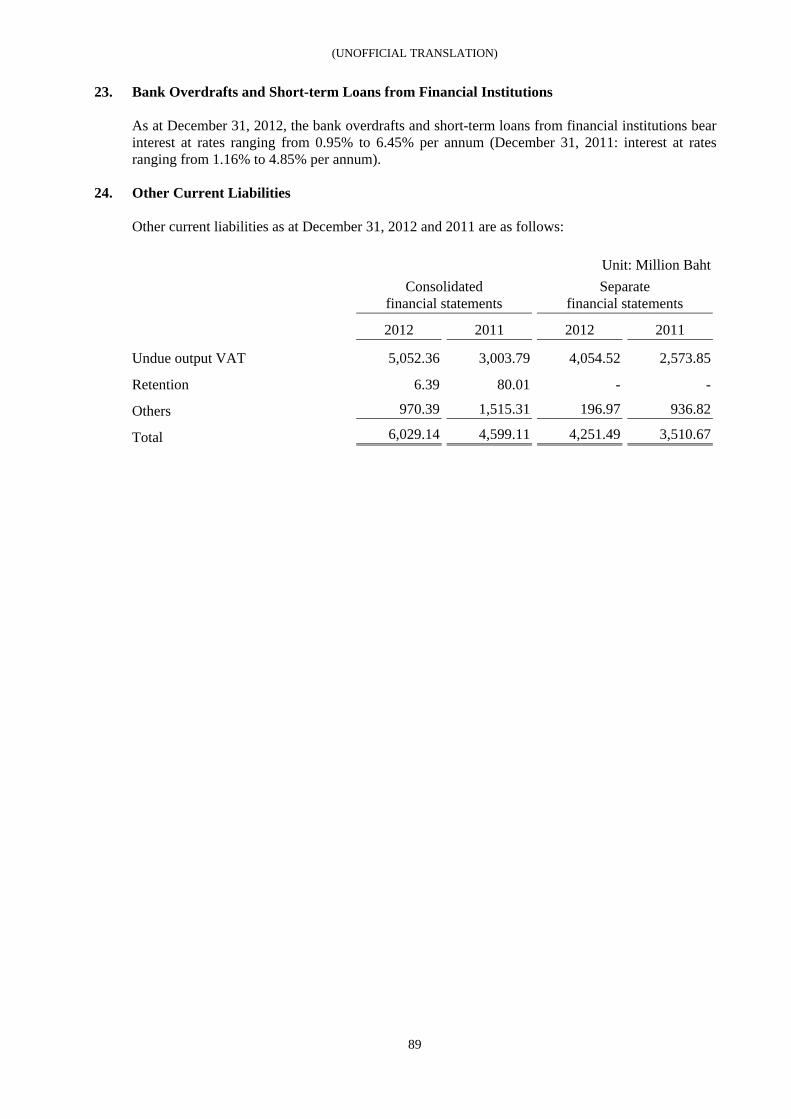
(UNOFFICIAL TRANSLATION)
89
23. Bank Overdrafts and Short-term Loans from Financial Institutions As at December 31, 2012, the bank overdrafts and short-term loans from financial institutions bear interest at rates ranging from 0.95% to 6.45% per annum (December 31, 2011: interest at rates ranging from 1.16% to 4.85% per annum).
24. Other Current Liabilities Other current liabilities as at December 31, 2012 and 2011 are as follows: Unit: Million Baht
Consolidated financial statements
Separate financial statements
2012 2011 2012 2011
Undue output VAT 5,052.36 3,003.79 4,054.52 2,573.85
Retention 6.39 80.01 - -
Others 970.39 1,515.31 196.97 936.82
Total 6,029.14 4,599.11 4,251.49 3,510.67
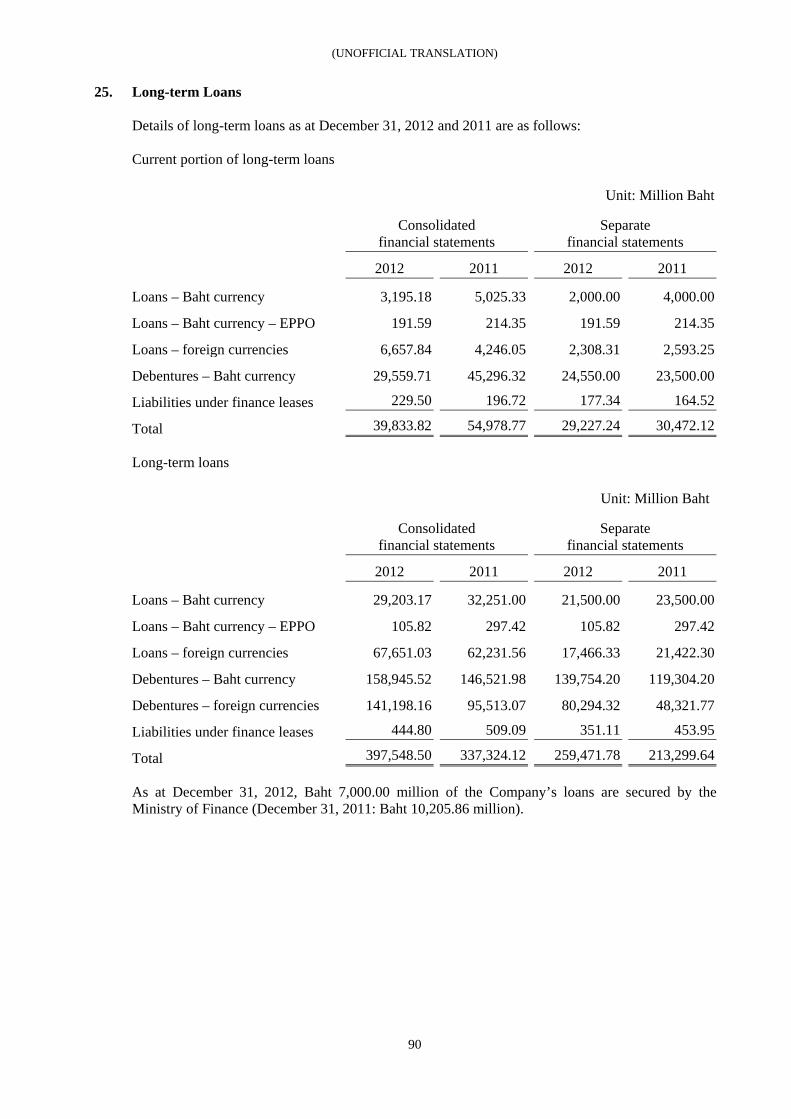
(UNOFFICIAL TRANSLATION)
90
25. Long-term Loans Details of long-term loans as at December 31, 2012 and 2011 are as follows: Current portion of long-term loans
Unit: Million Baht
Consolidated
financial statements Separate
financial statements
2012 2011 2012 2011
Loans – Baht currency 3,195.18 5,025.33 2,000.00 4,000.00
Loans – Baht currency – EPPO 191.59 214.35 191.59 214.35
Loans – foreign currencies 6,657.84 4,246.05 2,308.31 2,593.25
Debentures – Baht currency 29,559.71 45,296.32 24,550.00 23,500.00
Liabilities under finance leases 229.50 196.72 177.34 164.52
Total 39,833.82 54,978.77 29,227.24 30,472.12 Long-term loans
Unit: Million Baht
Consolidated
financial statements Separate
financial statements
2012 2011 2012 2011
Loans – Baht currency 29,203.17 32,251.00 21,500.00 23,500.00
Loans – Baht currency – EPPO 105.82 297.42 105.82 297.42
Loans – foreign currencies 67,651.03 62,231.56 17,466.33 21,422.30
Debentures – Baht currency 158,945.52 146,521.98 139,754.20 119,304.20
Debentures – foreign currencies 141,198.16 95,513.07 80,294.32 48,321.77
Liabilities under finance leases 444.80 509.09 351.11 453.95
Total 397,548.50 337,324.12 259,471.78 213,299.64 As at December 31, 2012, Baht 7,000.00 million of the Company’s loans are secured by the Ministry of Finance (December 31, 2011: Baht 10,205.86 million).
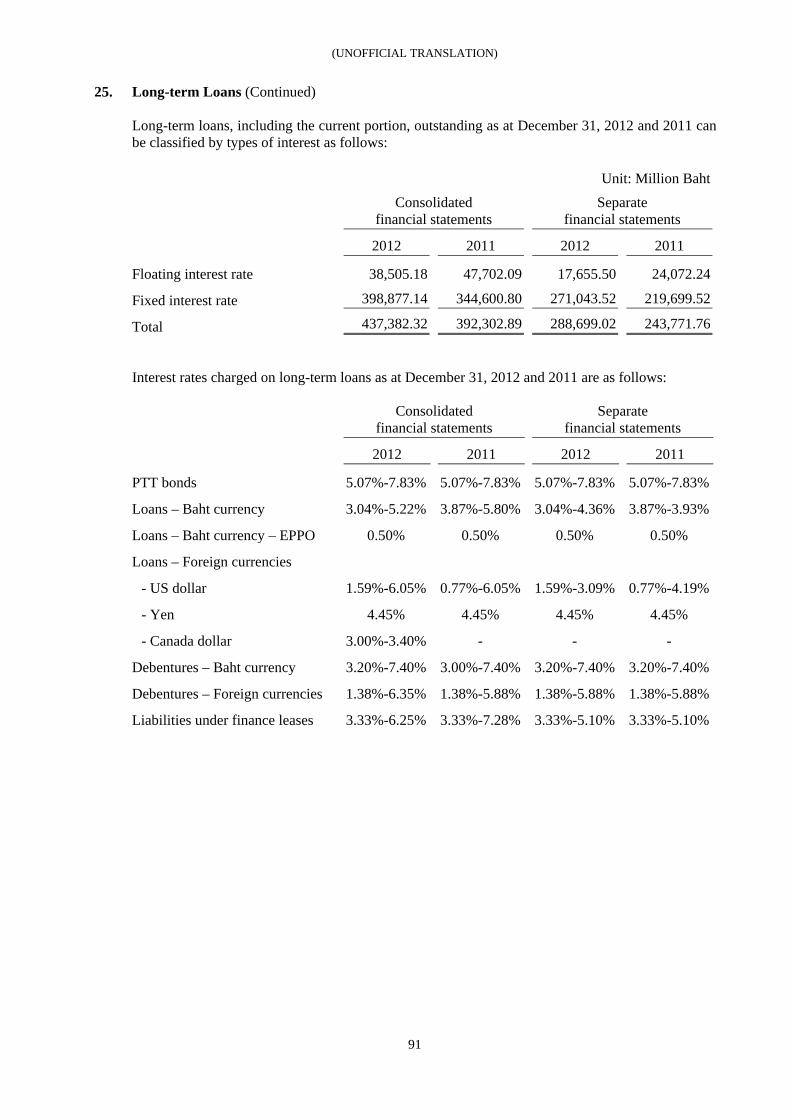
(UNOFFICIAL TRANSLATION)
91
25. Long-term Loans (Continued) Long-term loans, including the current portion, outstanding as at December 31, 2012 and 2011 can be classified by types of interest as follows: Unit: Million Baht
Consolidated financial statements
Separate financial statements
2012 2011 2012 2011
Floating interest rate 38,505.18 47,702.09 17,655.50 24,072.24
Fixed interest rate 398,877.14 344,600.80 271,043.52 219,699.52
Total 437,382.32 392,302.89 288,699.02 243,771.76 Interest rates charged on long-term loans as at December 31, 2012 and 2011 are as follows:
Consolidated financial statements
Separate financial statements
2012 2011 2012 2011
PTT bonds 5.07%-7.83% 5.07%-7.83% 5.07%-7.83% 5.07%-7.83%
Loans – Baht currency 3.04%-5.22% 3.87%-5.80% 3.04%-4.36% 3.87%-3.93%
Loans – Baht currency – EPPO 0.50% 0.50% 0.50% 0.50%
Loans – Foreign currencies
- US dollar 1.59%-6.05% 0.77%-6.05% 1.59%-3.09% 0.77%-4.19%
- Yen 4.45% 4.45% 4.45% 4.45%
- Canada dollar 3.00%-3.40% - - -
Debentures – Baht currency 3.20%-7.40% 3.00%-7.40% 3.20%-7.40% 3.20%-7.40%
Debentures – Foreign currencies 1.38%-6.35% 1.38%-5.88% 1.38%-5.88% 1.38%-5.88%
Liabilities under finance leases 3.33%-6.25% 3.33%-7.28% 3.33%-5.10% 3.33%-5.10%
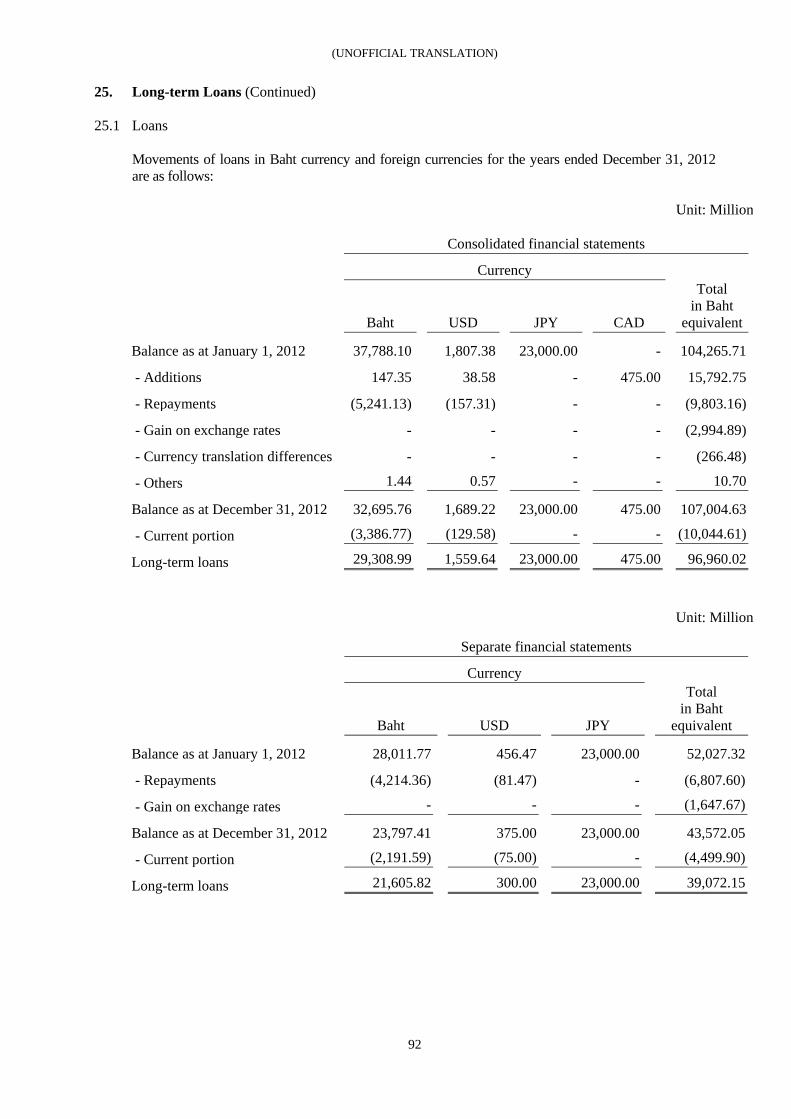
(UNOFFICIAL TRANSLATION)
92
25. Long-term Loans (Continued)
25.1 Loans Movements of loans in Baht currency and foreign currencies for the years ended December 31, 2012 are as follows: Unit: Million
Consolidated financial statements Currency
Baht USD JPY CAD
Total in Baht
equivalent
Balance as at January 1, 2012 37,788.10 1,807.38 23,000.00 - 104,265.71
- Additions 147.35 38.58 - 475.00 15,792.75
- Repayments (5,241.13) (157.31) - - (9,803.16)
- Gain on exchange rates - - - - (2,994.89)
- Currency translation differences - - - - (266.48)
- Others 1.44 0.57 - - 10.70
Balance as at December 31, 2012 32,695.76 1,689.22 23,000.00 475.00 107,004.63
- Current portion (3,386.77) (129.58) - - (10,044.61)
Long-term loans 29,308.99 1,559.64 23,000.00 475.00 96,960.02
Unit: Million Separate financial statements Currency
Baht USD JPY
Total in Baht
equivalent
Balance as at January 1, 2012 28,011.77 456.47 23,000.00 52,027.32
- Repayments (4,214.36) (81.47) - (6,807.60)
- Gain on exchange rates - - - (1,647.67)
Balance as at December 31, 2012 23,797.41 375.00 23,000.00 43,572.05
- Current portion (2,191.59) (75.00) - (4,499.90)
Long-term loans 21,605.82 300.00 23,000.00 39,072.15
(UNOFFICIAL TRANSLATION)
93
25. Long-term Loans (Continued)
25.1 Loans (Continued) Loans – Baht currency During the year, a jointly control entity drew down a loan from a financial institution amounting to Baht 421 million. The Company recognized the loan of Baht 147.35 million according to its percentage of the investment. The loan has a maturity of ten years and bears an interest rate of 6-month fixed deposit plus premium. Loans – foreign currency In March and April 2012, PTTEP Canada International Finance Limited (PTTEP CIF) entered into five-year unsecured loan agreements with financial institutions, granting facilities totaling CAD 300 million and CAD 75 million, respectively. The loans are fully guaranteed by PTTEP. PTTEP CIF fully utilized these loans in May 2012. In addition, in August 2012, PTTEP CIF entered into seven-year unsecured loan agreement with a financial institution, granting facilities totaling CAD 100 million. The loan is fully guaranteed by PTTEP. PTTEP CIF fully utilized this loan in September 2012. On March 30, 2012, a jointly controlled entity entered into the Shareholder Loan Agreement with its shareholders, granting loan facilities of USD 70 million carrying interest at a rate of LIBOR plus a fixed rate per annum. The loan is to be fully repaid within November, 2020. The jointly controlled entity drew down USD 35 million of the loan on May 21, 2012, and the remaining USD 35 million on September 25, 2012. The Company recognized USD 33.95 million of the loan, in proportion to its shareholding. On August 7, 2012, a subsidiary of PTTI entered into a loan agreement with an international financial institution amounting to USD 25 million or approximately Baht 784.03 million. The loan has a maturity of three years and bears an interest rate of LIBOR plus a fixed rate per annum.
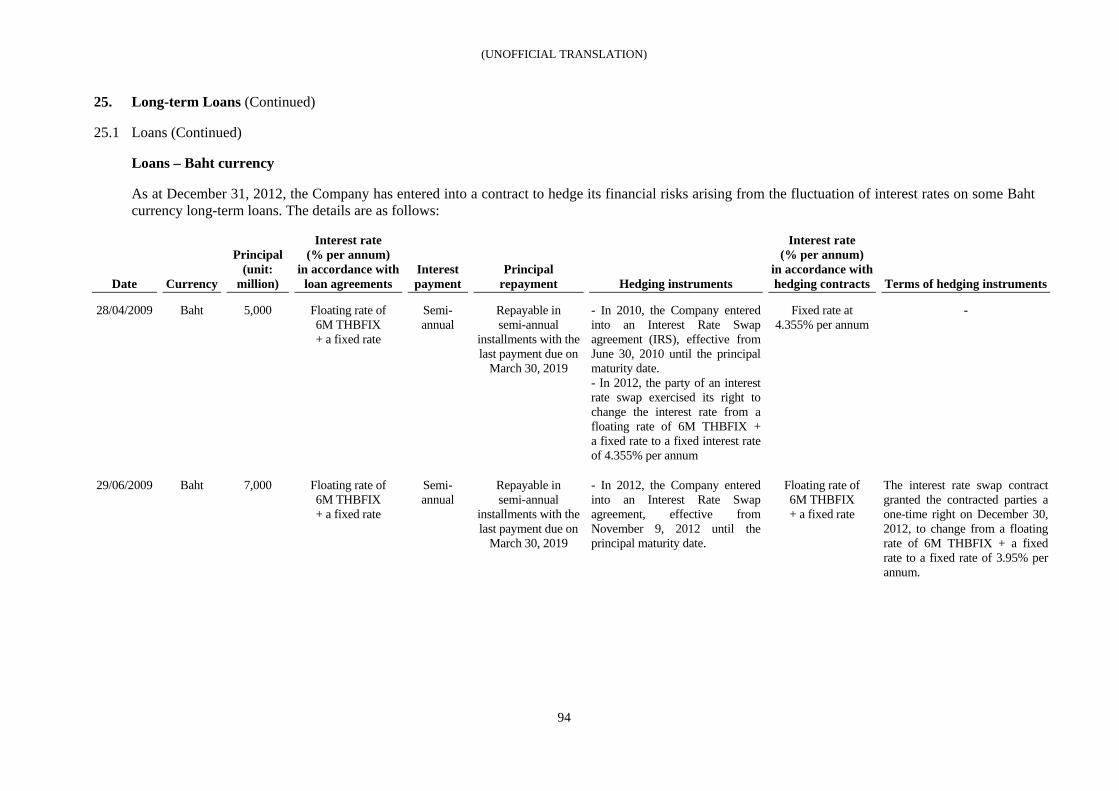
(UNOFFICIAL TRANSLATION)
94
25. Long-term Loans (Continued)
25.1 Loans (Continued) Loans – Baht currency As at December 31, 2012, the Company has entered into a contract to hedge its financial risks arising from the fluctuation of interest rates on some Baht currency long-term loans. The details are as follows:
Date Currency
Principal (unit:
million)
Interest rate (% per annum)
in accordance with loan agreements
Interest payment
Principal repayment Hedging instruments
Interest rate (% per annum)
in accordance with hedging contracts Terms of hedging instruments
28/04/2009 Baht 5,000 Floating rate of 6M THBFIX + a fixed rate
Semi-annual
Repayable in semi-annual
installments with the last payment due on
March 30, 2019
- In 2010, the Company entered into an Interest Rate Swap agreement (IRS), effective from June 30, 2010 until the principal maturity date. - In 2012, the party of an interest rate swap exercised its right to change the interest rate from a floating rate of 6M THBFIX + a fixed rate to a fixed interest rate of 4.355% per annum
Fixed rate at 4.355% per annum
-
29/06/2009 Baht 7,000 Floating rate of 6M THBFIX + a fixed rate
Semi-annual
Repayable in semi-annual
installments with the last payment due on
March 30, 2019
- In 2012, the Company entered into an Interest Rate Swap agreement, effective from November 9, 2012 until the principal maturity date.
Floating rate of 6M THBFIX + a fixed rate
The interest rate swap contract granted the contracted parties a one-time right on December 30, 2012, to change from a floating rate of 6M THBFIX + a fixed rate to a fixed rate of 3.95% per annum.
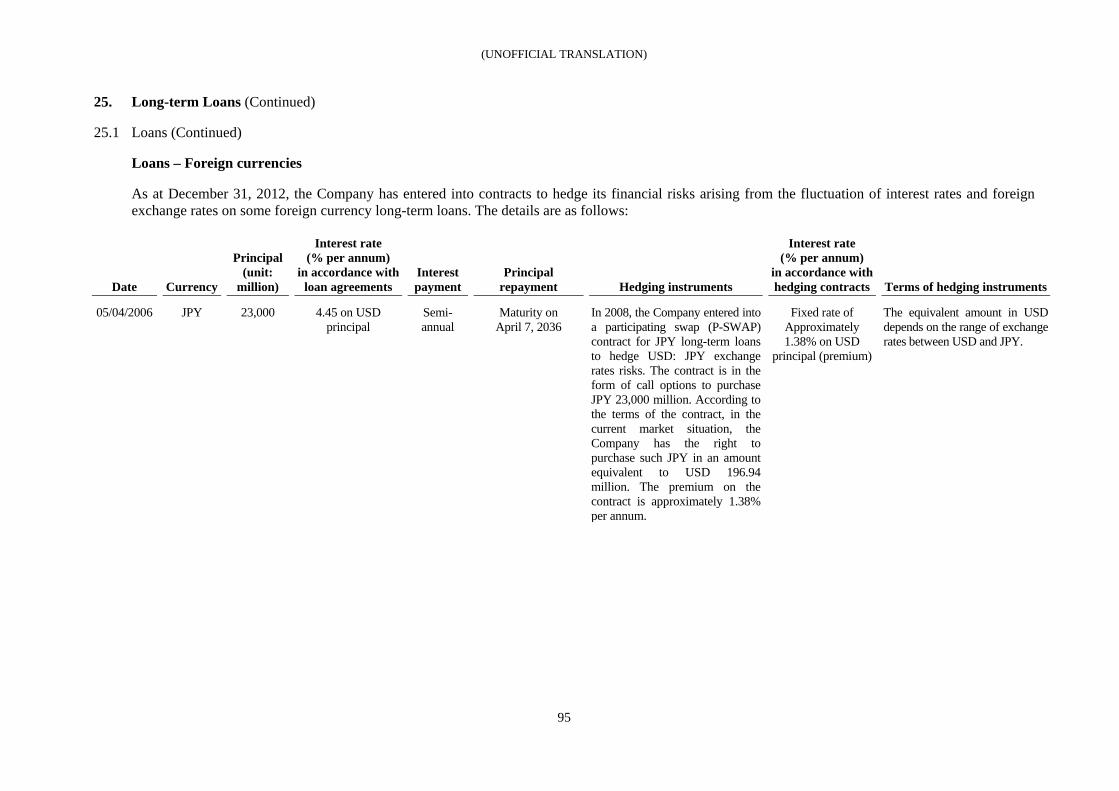
(UNOFFICIAL TRANSLATION)
95
25. Long-term Loans (Continued)
25.1 Loans (Continued) Loans – Foreign currencies As at December 31, 2012, the Company has entered into contracts to hedge its financial risks arising from the fluctuation of interest rates and foreign exchange rates on some foreign currency long-term loans. The details are as follows:
Date Currency
Principal (unit:
million)
Interest rate (% per annum)
in accordance with loan agreements
Interest payment
Principal repayment Hedging instruments
Interest rate (% per annum)
in accordance with hedging contracts Terms of hedging instruments
05/04/2006 JPY 23,000 4.45 on USD principal
Semi-annual
Maturity on April 7, 2036
In 2008, the Company entered into a participating swap (P-SWAP) contract for JPY long-term loans to hedge USD: JPY exchange rates risks. The contract is in the form of call options to purchase JPY 23,000 million. According to the terms of the contract, in the current market situation, the Company has the right to purchase such JPY in an amount equivalent to USD 196.94 million. The premium on the contract is approximately 1.38% per annum.
Fixed rate of Approximately 1.38% on USD
principal (premium)
The equivalent amount in USD depends on the range of exchange rates between USD and JPY.
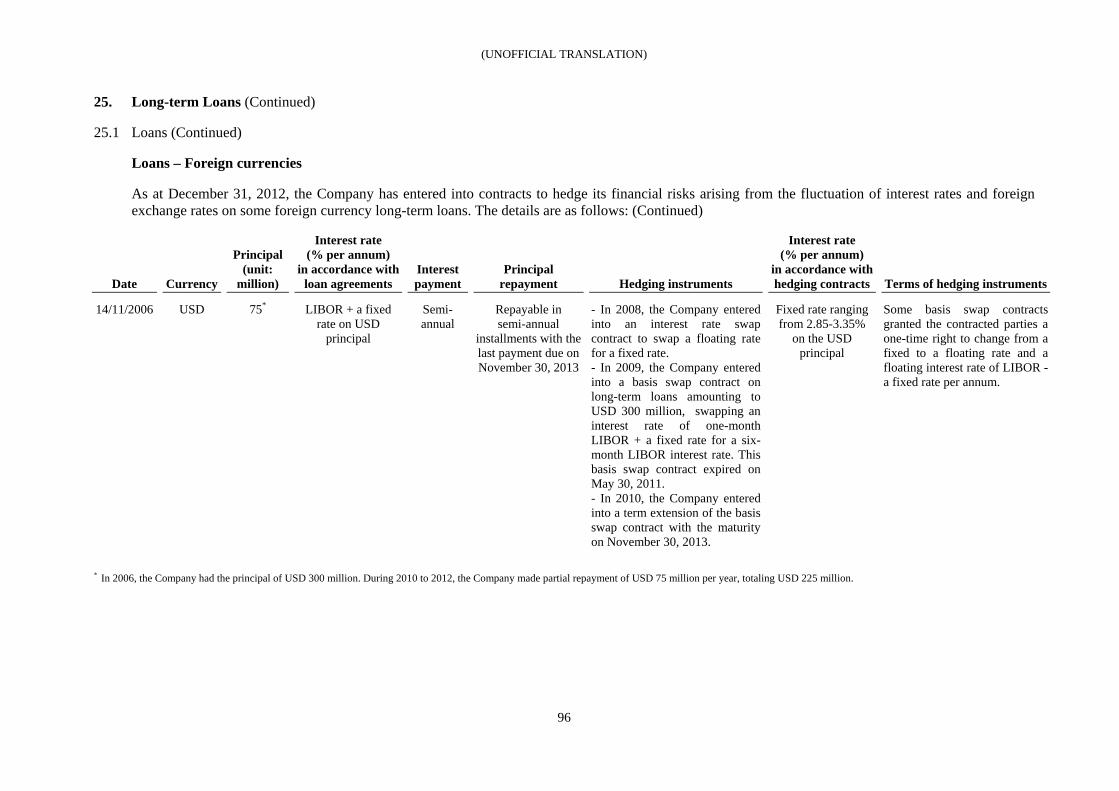
(UNOFFICIAL TRANSLATION)
96
25. Long-term Loans (Continued)
25.1 Loans (Continued) Loans – Foreign currencies As at December 31, 2012, the Company has entered into contracts to hedge its financial risks arising from the fluctuation of interest rates and foreign exchange rates on some foreign currency long-term loans. The details are as follows: (Continued)
Date Currency
Principal (unit:
million)
Interest rate (% per annum)
in accordance with loan agreements
Interest payment
Principal repayment Hedging instruments
Interest rate (% per annum)
in accordance with hedging contracts Terms of hedging instruments
14/11/2006 USD 75* LIBOR + a fixed rate on USD
principal
Semi-annual
Repayable in semi-annual
installments with the last payment due on November 30, 2013
- In 2008, the Company entered into an interest rate swap contract to swap a floating rate for a fixed rate. - In 2009, the Company entered into a basis swap contract on long-term loans amounting to USD 300 million, swapping an interest rate of one-month LIBOR + a fixed rate for a six-month LIBOR interest rate. This basis swap contract expired on May 30, 2011. - In 2010, the Company entered into a term extension of the basis swap contract with the maturity on November 30, 2013.
Fixed rate ranging from 2.85-3.35%
on the USD principal
Some basis swap contracts granted the contracted parties a one-time right to change from a fixed to a floating rate and a floating interest rate of LIBOR - a fixed rate per annum.
* In 2006, the Company had the principal of USD 300 million. During 2010 to 2012, the Company made partial repayment of USD 75 million per year, totaling USD 225 million.
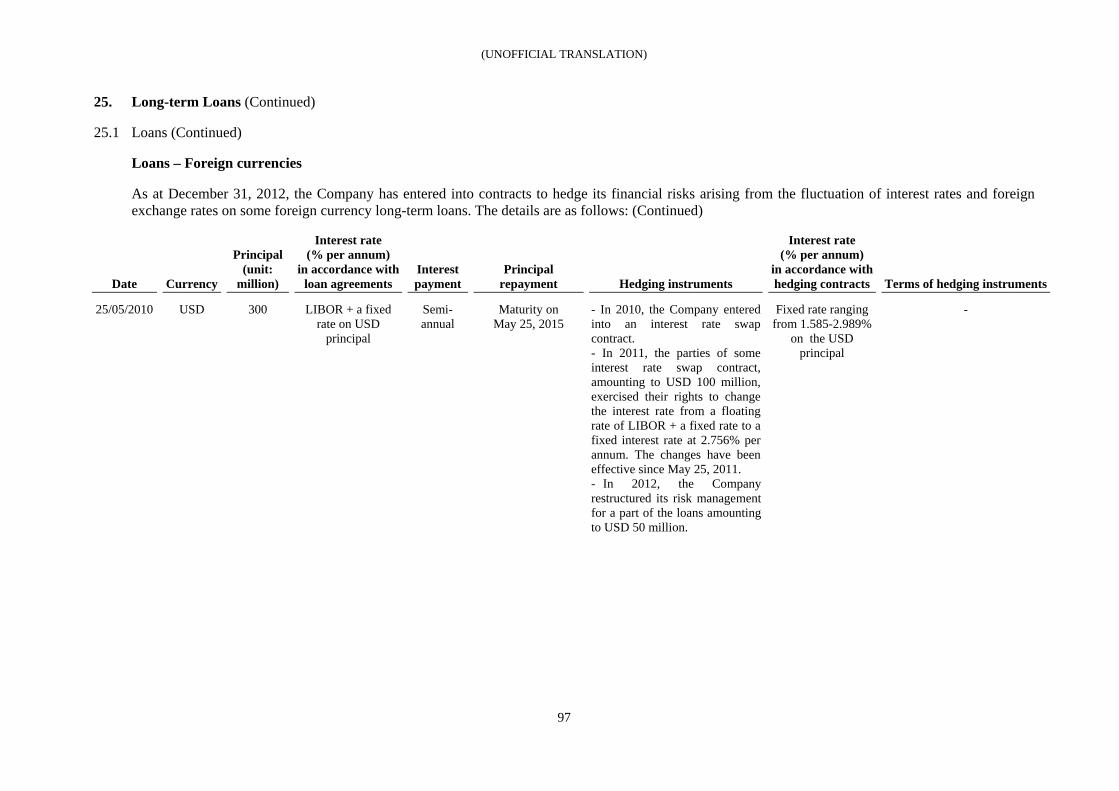
(UNOFFICIAL TRANSLATION)
97
25. Long-term Loans (Continued)
25.1 Loans (Continued) Loans – Foreign currencies As at December 31, 2012, the Company has entered into contracts to hedge its financial risks arising from the fluctuation of interest rates and foreign exchange rates on some foreign currency long-term loans. The details are as follows: (Continued)
Date Currency
Principal (unit:
million)
Interest rate (% per annum)
in accordance with loan agreements
Interest payment
Principal repayment Hedging instruments
Interest rate (% per annum)
in accordance with hedging contracts Terms of hedging instruments
25/05/2010 USD 300 LIBOR + a fixed rate on USD
principal
Semi-annual
Maturity on May 25, 2015
- In 2010, the Company entered into an interest rate swap contract. - In 2011, the parties of some interest rate swap contract, amounting to USD 100 million, exercised their rights to change the interest rate from a floating rate of LIBOR + a fixed rate to a fixed interest rate at 2.756% per annum. The changes have been effective since May 25, 2011. - In 2012, the Company restructured its risk management for a part of the loans amounting to USD 50 million.
Fixed rate ranging from 1.585-2.989%
on the USD principal
-
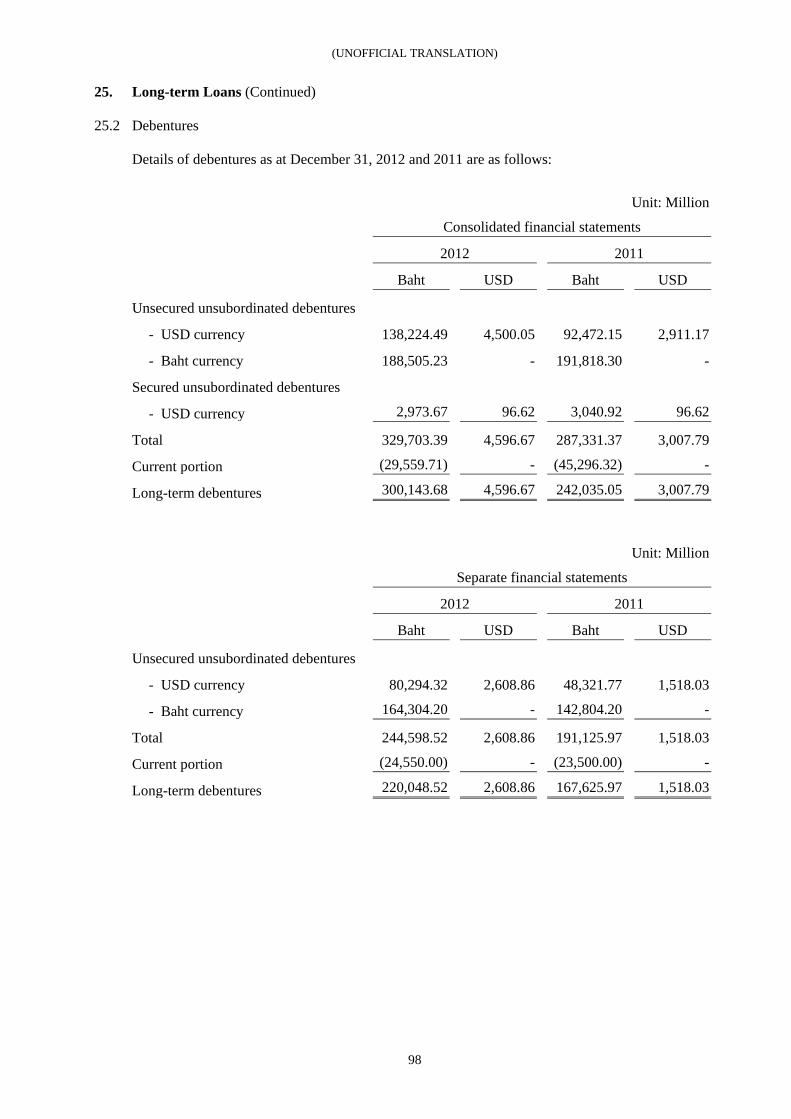
(UNOFFICIAL TRANSLATION)
98
25. Long-term Loans (Continued)
25.2 Debentures Details of debentures as at December 31, 2012 and 2011 are as follows:
Unit: Million Consolidated financial statements
2012 2011 Baht USD Baht USD
Unsecured unsubordinated debentures
- USD currency 138,224.49 4,500.05 92,472.15 2,911.17
- Baht currency 188,505.23 - 191,818.30 -
Secured unsubordinated debentures
- USD currency 2,973.67 96.62 3,040.92 96.62
Total 329,703.39 4,596.67 287,331.37 3,007.79
Current portion (29,559.71) - (45,296.32) -
Long-term debentures 300,143.68 4,596.67 242,035.05 3,007.79
Unit: Million Separate financial statements
2012 2011 Baht USD Baht USD
Unsecured unsubordinated debentures
- USD currency 80,294.32 2,608.86 48,321.77 1,518.03
- Baht currency 164,304.20 - 142,804.20 -
Total 244,598.52 2,608.86 191,125.97 1,518.03
Current portion (24,550.00) - (23,500.00) -
Long-term debentures 220,048.52 2,608.86 167,625.97 1,518.03
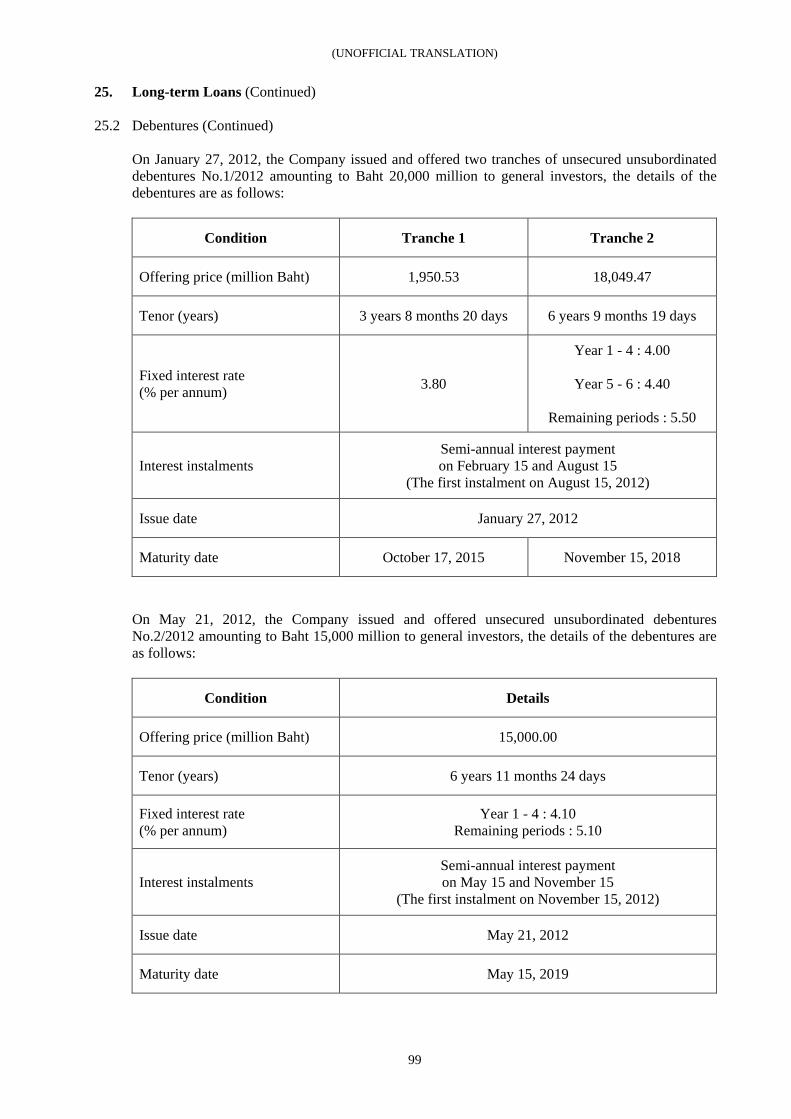
(UNOFFICIAL TRANSLATION)
99
25. Long-term Loans (Continued)
25.2 Debentures (Continued) On January 27, 2012, the Company issued and offered two tranches of unsecured unsubordinated debentures No.1/2012 amounting to Baht 20,000 million to general investors, the details of the debentures are as follows:
Condition Tranche 1 Tranche 2
Offering price (million Baht) 1,950.53 18,049.47
Tenor (years) 3 years 8 months 20 days 6 years 9 months 19 days
Fixed interest rate (% per annum) 3.80
Year 1 - 4 : 4.00
Year 5 - 6 : 4.40
Remaining periods : 5.50
Interest instalments Semi-annual interest payment on February 15 and August 15
(The first instalment on August 15, 2012)
Issue date January 27, 2012
Maturity date October 17, 2015 November 15, 2018
On May 21, 2012, the Company issued and offered unsecured unsubordinated debentures No.2/2012 amounting to Baht 15,000 million to general investors, the details of the debentures are as follows:
Condition Details
Offering price (million Baht) 15,000.00
Tenor (years) 6 years 11 months 24 days
Fixed interest rate (% per annum)
Year 1 - 4 : 4.10 Remaining periods : 5.10
Interest instalments Semi-annual interest payment on May 15 and November 15
(The first instalment on November 15, 2012)
Issue date May 21, 2012
Maturity date May 15, 2019
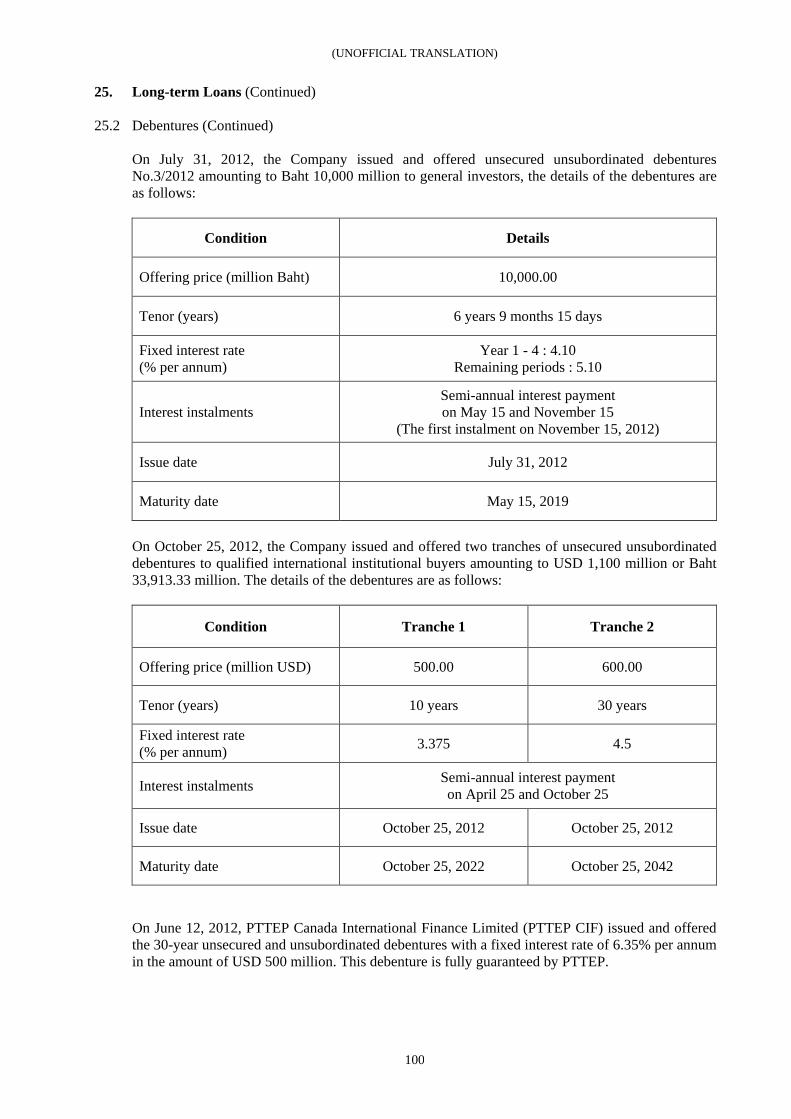
(UNOFFICIAL TRANSLATION)
100
25. Long-term Loans (Continued)
25.2 Debentures (Continued) On July 31, 2012, the Company issued and offered unsecured unsubordinated debentures No.3/2012 amounting to Baht 10,000 million to general investors, the details of the debentures are as follows:
Condition Details
Offering price (million Baht) 10,000.00
Tenor (years) 6 years 9 months 15 days
Fixed interest rate (% per annum)
Year 1 - 4 : 4.10 Remaining periods : 5.10
Interest instalments Semi-annual interest payment on May 15 and November 15
(The first instalment on November 15, 2012)
Issue date July 31, 2012
Maturity date May 15, 2019
On October 25, 2012, the Company issued and offered two tranches of unsecured unsubordinated debentures to qualified international institutional buyers amounting to USD 1,100 million or Baht 33,913.33 million. The details of the debentures are as follows:
Condition Tranche 1 Tranche 2
Offering price (million USD) 500.00 600.00
Tenor (years) 10 years 30 years
Fixed interest rate (% per annum) 3.375 4.5
Interest instalments Semi-annual interest payment on April 25 and October 25
Issue date October 25, 2012 October 25, 2012
Maturity date October 25, 2022 October 25, 2042
On June 12, 2012, PTTEP Canada International Finance Limited (PTTEP CIF) issued and offered the 30-year unsecured and unsubordinated debentures with a fixed interest rate of 6.35% per annum in the amount of USD 500 million. This debenture is fully guaranteed by PTTEP.
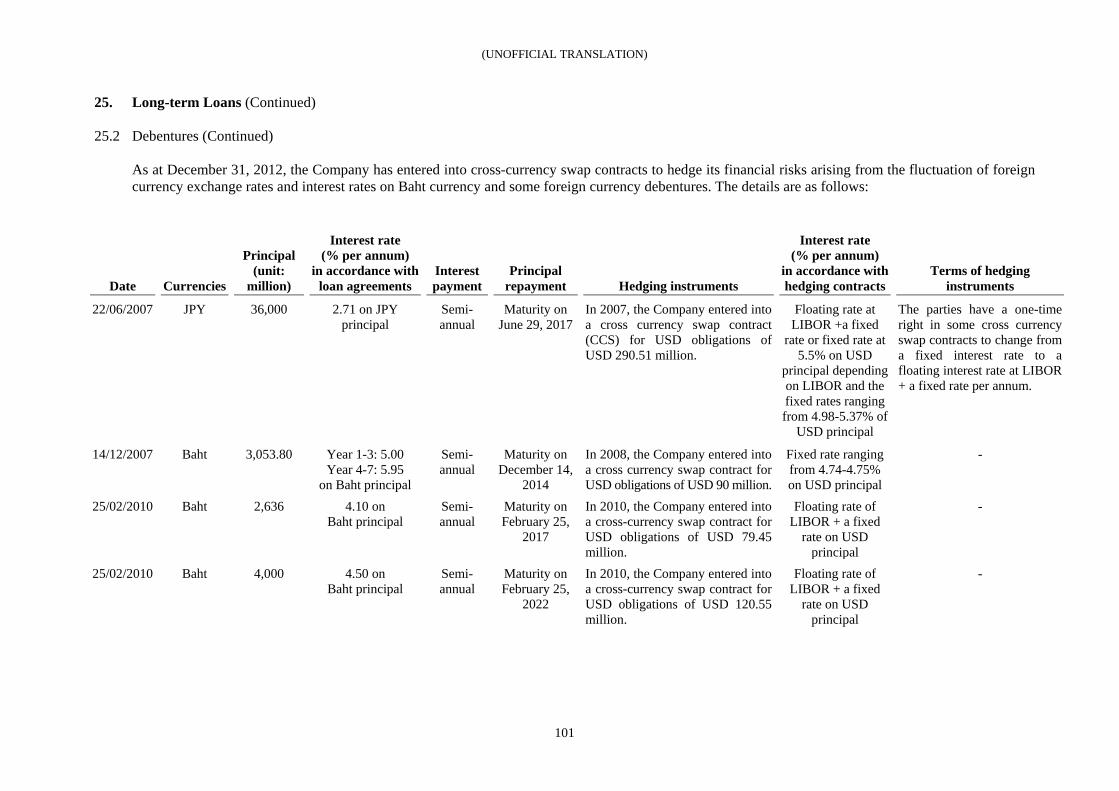
(UNOFFICIAL TRANSLATION)
101
25. Long-term Loans (Continued)
25.2 Debentures (Continued) As at December 31, 2012, the Company has entered into cross-currency swap contracts to hedge its financial risks arising from the fluctuation of foreign currency exchange rates and interest rates on Baht currency and some foreign currency debentures. The details are as follows:
Date Currencies
Principal (unit:
million)
Interest rate (% per annum)
in accordance with loan agreements
Interest payment
Principal repayment Hedging instruments
Interest rate (% per annum)
in accordance with hedging contracts
Terms of hedging instruments
22/06/2007 JPY 36,000 2.71 on JPY principal
Semi-annual
Maturity on June 29, 2017
In 2007, the Company entered into a cross currency swap contract (CCS) for USD obligations of USD 290.51 million.
Floating rate at LIBOR +a fixed
rate or fixed rate at 5.5% on USD
principal depending on LIBOR and the fixed rates ranging from 4.98-5.37% of
USD principal
The parties have a one-time right in some cross currency swap contracts to change from a fixed interest rate to a floating interest rate at LIBOR + a fixed rate per annum.
14/12/2007 Baht 3,053.80 Year 1-3: 5.00 Year 4-7: 5.95
on Baht principal
Semi-annual
Maturity on December 14,
2014
In 2008, the Company entered into a cross currency swap contract for USD obligations of USD 90 million.
Fixed rate ranging from 4.74-4.75% on USD principal
-
25/02/2010 Baht 2,636 4.10 on Baht principal
Semi-annual
Maturity on February 25,
2017
In 2010, the Company entered into a cross-currency swap contract for USD obligations of USD 79.45 million.
Floating rate of LIBOR + a fixed
rate on USD principal
-
25/02/2010 Baht 4,000 4.50 on Baht principal
Semi-annual
Maturity on February 25,
2022
In 2010, the Company entered into a cross-currency swap contract for USD obligations of USD 120.55 million.
Floating rate of LIBOR + a fixed
rate on USD principal
-
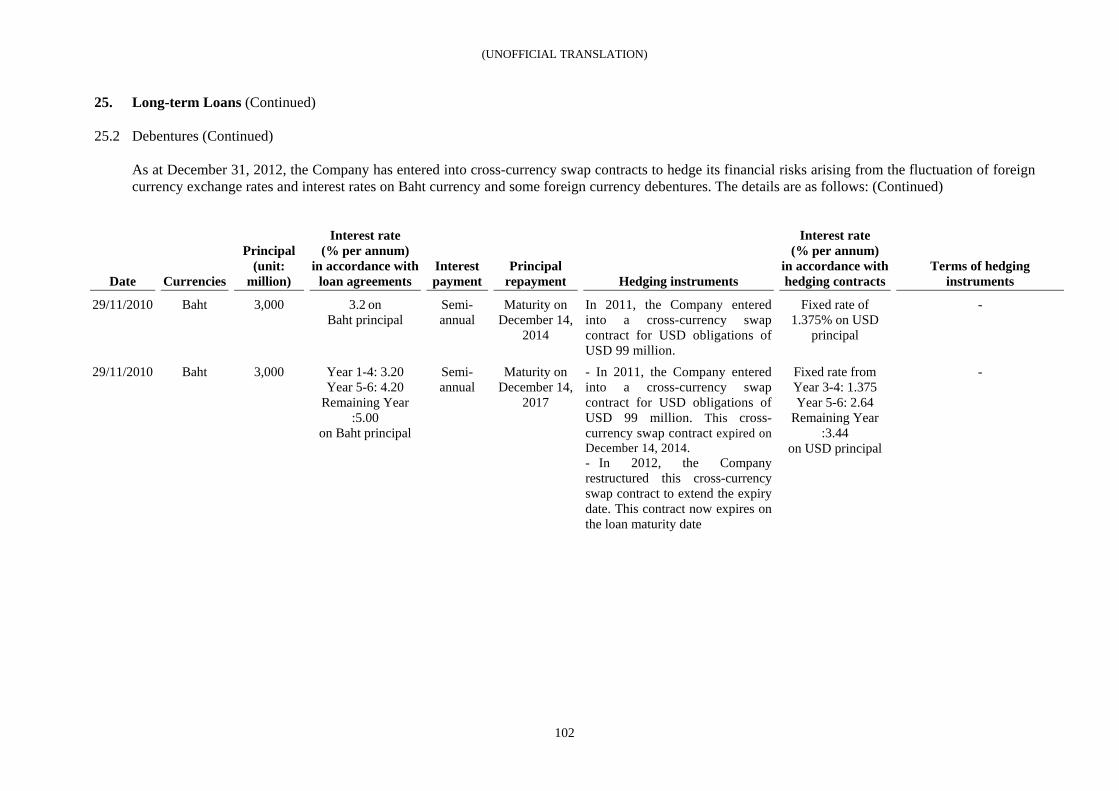
(UNOFFICIAL TRANSLATION)
102
25. Long-term Loans (Continued)
25.2 Debentures (Continued) As at December 31, 2012, the Company has entered into cross-currency swap contracts to hedge its financial risks arising from the fluctuation of foreign currency exchange rates and interest rates on Baht currency and some foreign currency debentures. The details are as follows: (Continued)
Date Currencies
Principal (unit:
million)
Interest rate (% per annum)
in accordance with loan agreements
Interest payment
Principal repayment Hedging instruments
Interest rate (% per annum)
in accordance with hedging contracts
Terms of hedging instruments
29/11/2010 Baht 3,000 3.2 on Baht principal
Semi-annual
Maturity on December 14,
2014
In 2011, the Company entered into a cross-currency swap contract for USD obligations of USD 99 million.
Fixed rate of 1.375% on USD
principal
-
29/11/2010 Baht 3,000 Year 1-4: 3.20 Year 5-6: 4.20
Remaining Year :5.00
on Baht principal
Semi-annual
Maturity on December 14,
2017
- In 2011, the Company entered into a cross-currency swap contract for USD obligations of USD 99 million. This cross-currency swap contract expired on December 14, 2014. - In 2012, the Company restructured this cross-currency swap contract to extend the expiry date. This contract now expires on the loan maturity date
Fixed rate from Year 3-4: 1.375 Year 5-6: 2.64
Remaining Year :3.44
on USD principal
-
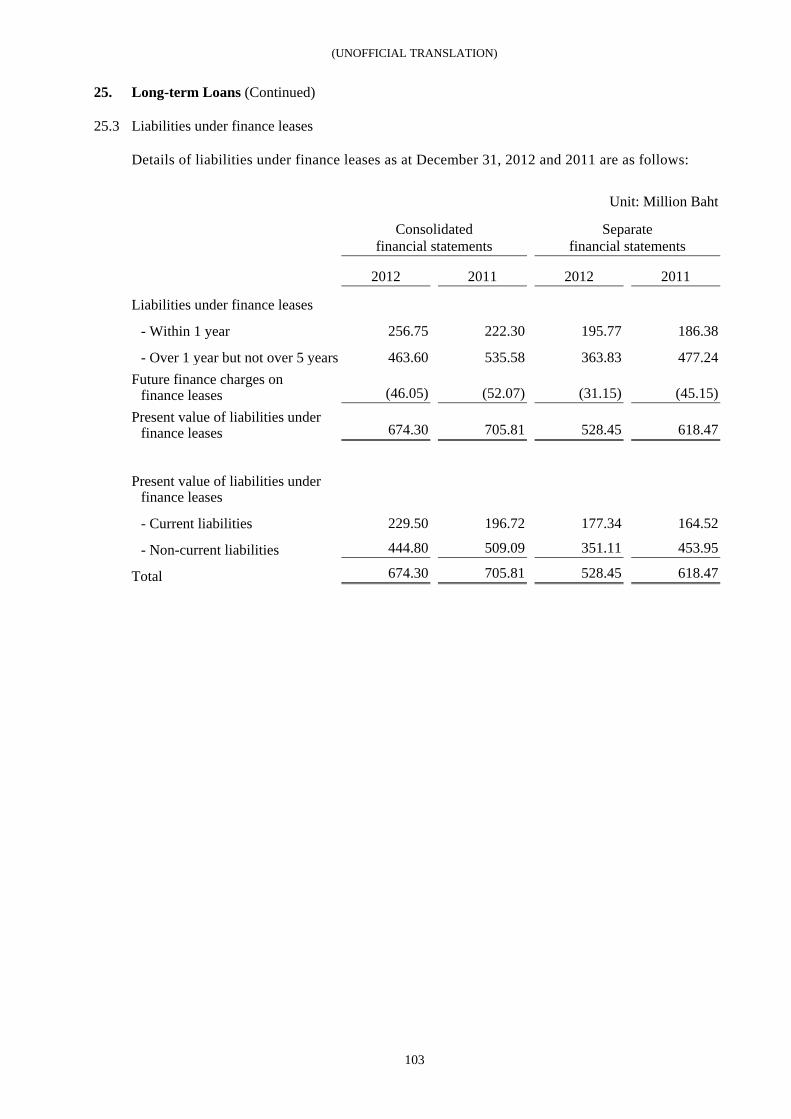
(UNOFFICIAL TRANSLATION)
103
25. Long-term Loans (Continued)
25.3 Liabilities under finance leases Details of liabilities under finance leases as at December 31, 2012 and 2011 are as follows: Unit: Million Baht Consolidated
financial statements Separate
financial statements
2012 2011 2012 2011
Liabilities under finance leases
- Within 1 year 256.75 222.30 195.77 186.38
- Over 1 year but not over 5 years 463.60 535.58 363.83 477.24 Future finance charges on finance leases (46.05) (52.07) (31.15) (45.15) Present value of liabilities under finance leases 674.30 705.81 528.45 618.47
Present value of liabilities under
finance leases
- Current liabilities 229.50 196.72 177.34 164.52
- Non-current liabilities 444.80 509.09 351.11 453.95
Total 674.30 705.81 528.45 618.47
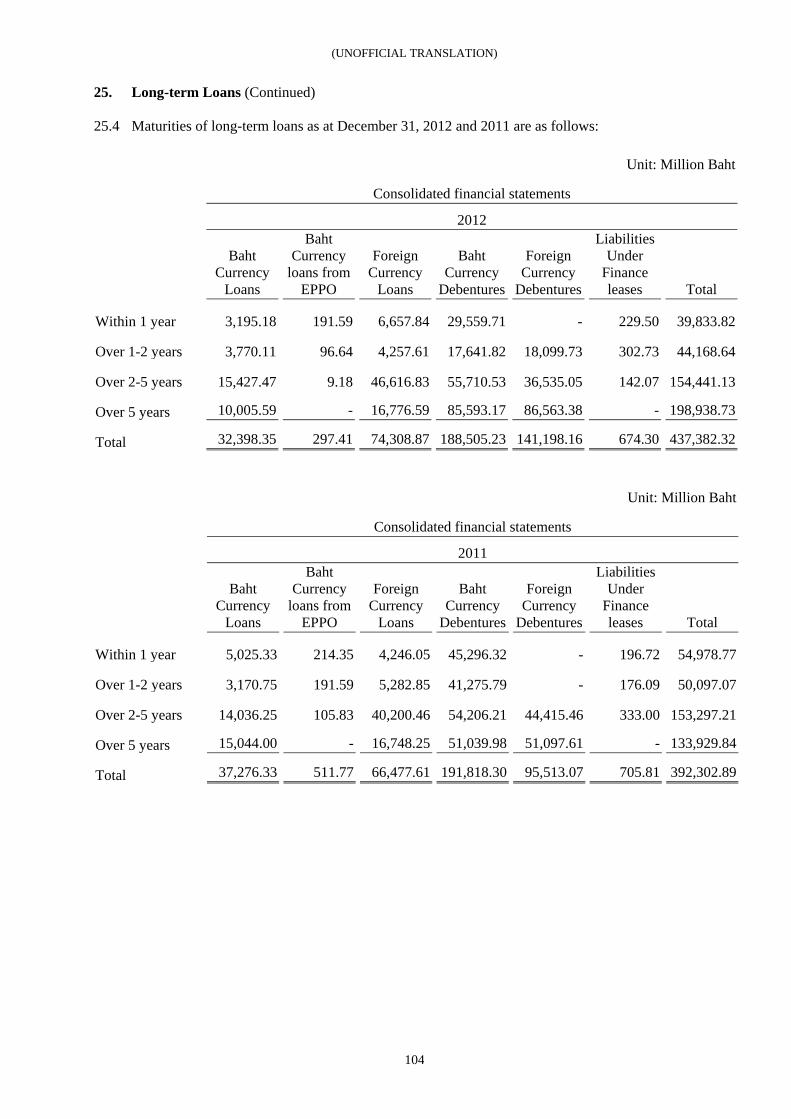
(UNOFFICIAL TRANSLATION)
104
25. Long-term Loans (Continued) 25.4 Maturities of long-term loans as at December 31, 2012 and 2011 are as follows:
Unit: Million Baht Consolidated financial statements 2012
Baht Currency
Loans
Baht Currency
loans from EPPO
Foreign Currency
Loans
Baht Currency
Debentures
Foreign Currency
Debentures
Liabilities Under
Finance leases Total
Within 1 year 3,195.18 191.59 6,657.84 29,559.71 - 229.50 39,833.82
Over 1-2 years 3,770.11 96.64 4,257.61 17,641.82 18,099.73 302.73 44,168.64
Over 2-5 years 15,427.47 9.18 46,616.83 55,710.53 36,535.05 142.07 154,441.13
Over 5 years 10,005.59 - 16,776.59 85,593.17 86,563.38 - 198,938.73
Total 32,398.35 297.41 74,308.87 188,505.23 141,198.16 674.30 437,382.32
Unit: Million Baht Consolidated financial statements 2011
Baht Currency
Loans
Baht Currency
loans from EPPO
Foreign Currency
Loans
Baht Currency
Debentures
Foreign Currency
Debentures
Liabilities Under
Finance leases Total
Within 1 year 5,025.33 214.35 4,246.05 45,296.32 - 196.72 54,978.77
Over 1-2 years 3,170.75 191.59 5,282.85 41,275.79 - 176.09 50,097.07
Over 2-5 years 14,036.25 105.83 40,200.46 54,206.21 44,415.46 333.00 153,297.21
Over 5 years 15,044.00 - 16,748.25 51,039.98 51,097.61 - 133,929.84
Total 37,276.33 511.77 66,477.61 191,818.30 95,513.07 705.81 392,302.89
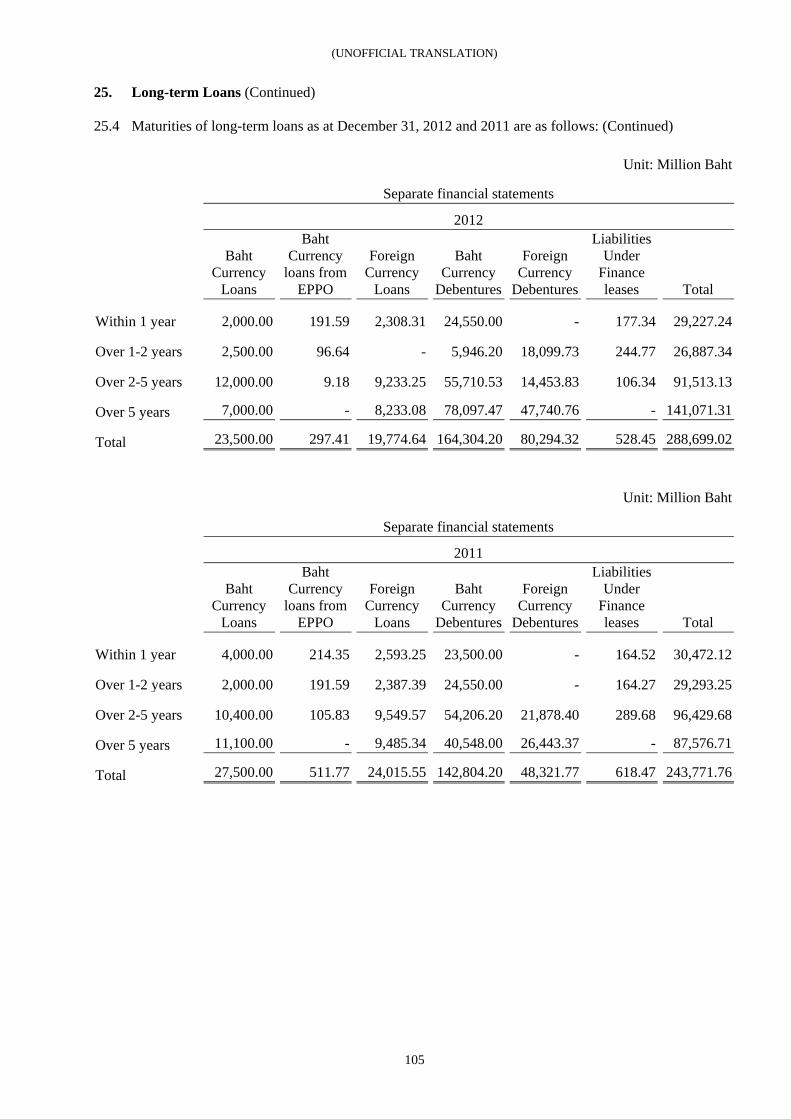
(UNOFFICIAL TRANSLATION)
105
25. Long-term Loans (Continued) 25.4 Maturities of long-term loans as at December 31, 2012 and 2011 are as follows: (Continued)
Unit: Million Baht Separate financial statements 2012
Baht Currency
Loans
Baht Currency
loans from EPPO
Foreign Currency
Loans
Baht Currency
Debentures
Foreign Currency
Debentures
Liabilities Under
Finance leases Total
Within 1 year 2,000.00 191.59 2,308.31 24,550.00 - 177.34 29,227.24
Over 1-2 years 2,500.00 96.64 - 5,946.20 18,099.73 244.77 26,887.34
Over 2-5 years 12,000.00 9.18 9,233.25 55,710.53 14,453.83 106.34 91,513.13
Over 5 years 7,000.00 - 8,233.08 78,097.47 47,740.76 - 141,071.31
Total 23,500.00 297.41 19,774.64 164,304.20 80,294.32 528.45 288,699.02
Unit: Million Baht Separate financial statements 2011
Baht Currency
Loans
Baht Currency
loans from EPPO
Foreign Currency
Loans
Baht Currency
Debentures
Foreign Currency
Debentures
Liabilities Under
Finance leases Total
Within 1 year 4,000.00 214.35 2,593.25 23,500.00 - 164.52 30,472.12
Over 1-2 years 2,000.00 191.59 2,387.39 24,550.00 - 164.27 29,293.25
Over 2-5 years 10,400.00 105.83 9,549.57 54,206.20 21,878.40 289.68 96,429.68
Over 5 years 11,100.00 - 9,485.34 40,548.00 26,443.37 - 87,576.71
Total 27,500.00 511.77 24,015.55 142,804.20 48,321.77 618.47 243,771.76
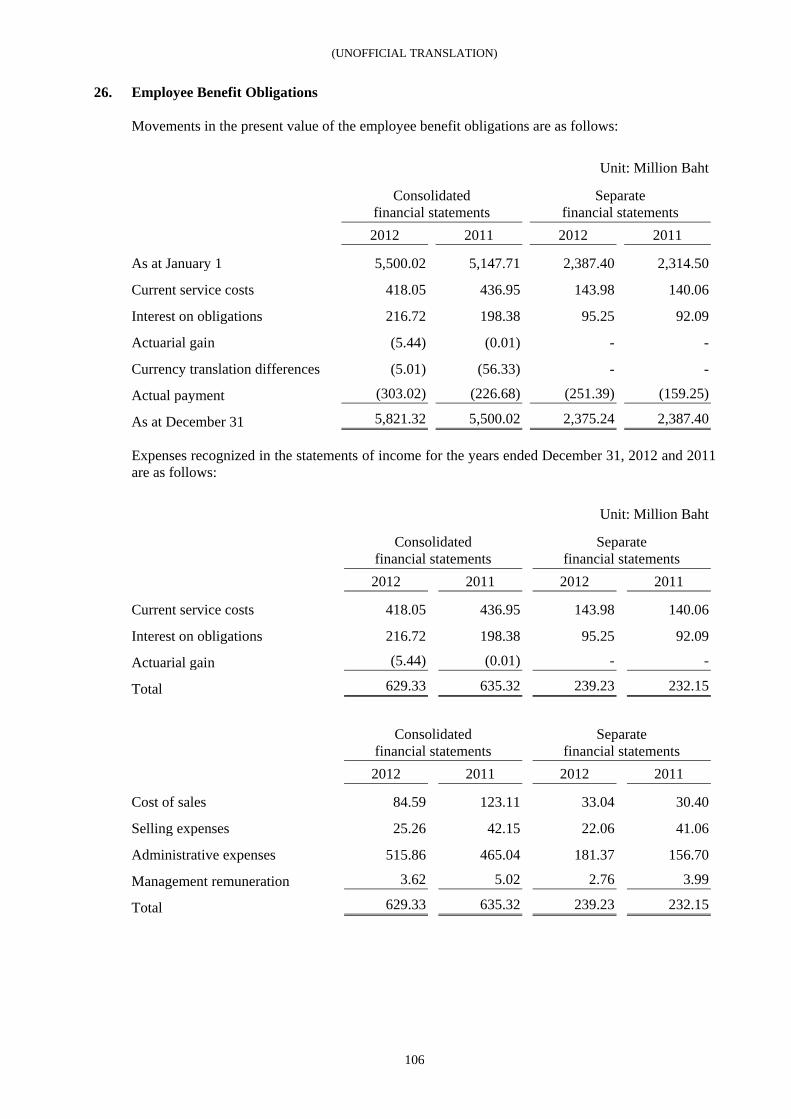
(UNOFFICIAL TRANSLATION)
106
26. Employee Benefit Obligations Movements in the present value of the employee benefit obligations are as follows:
Unit: Million Baht Consolidated
financial statements Separate
financial statements 2012 2011 2012 2011
As at January 1 5,500.02 5,147.71 2,387.40 2,314.50
Current service costs 418.05 436.95 143.98 140.06
Interest on obligations 216.72 198.38 95.25 92.09
Actuarial gain (5.44) (0.01) - -
Currency translation differences (5.01) (56.33) - -
Actual payment (303.02) (226.68) (251.39) (159.25)
As at December 31 5,821.32 5,500.02 2,375.24 2,387.40 Expenses recognized in the statements of income for the years ended December 31, 2012 and 2011 are as follows: Unit: Million Baht Consolidated
financial statements Separate
financial statements 2012 2011 2012 2011
Current service costs 418.05 436.95 143.98 140.06
Interest on obligations 216.72 198.38 95.25 92.09
Actuarial gain (5.44) (0.01) - -
Total 629.33 635.32 239.23 232.15
Consolidated
financial statements Separate
financial statements 2012 2011 2012 2011
Cost of sales 84.59 123.11 33.04 30.40
Selling expenses 25.26 42.15 22.06 41.06
Administrative expenses 515.86 465.04 181.37 156.70
Management remuneration 3.62 5.02 2.76 3.99
Total 629.33 635.32 239.23 232.15
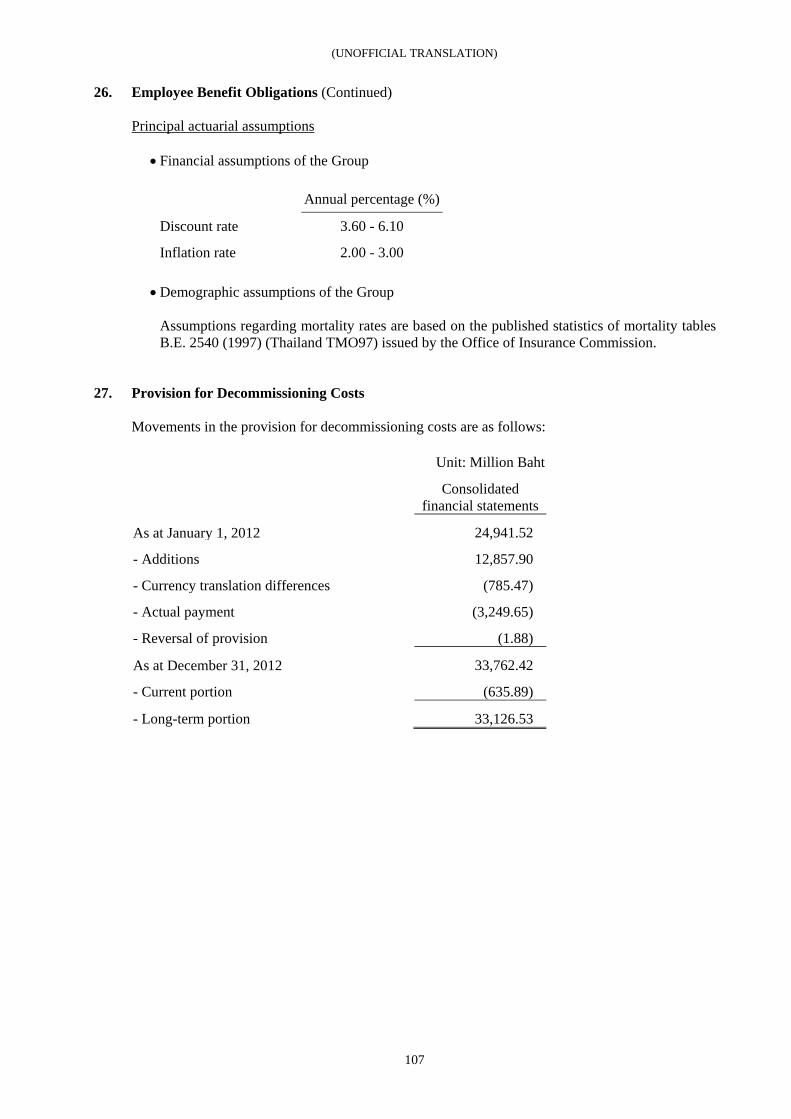
(UNOFFICIAL TRANSLATION)
107
26. Employee Benefit Obligations (Continued) Principal actuarial assumptions
• Financial assumptions of the Group
Annual percentage (%)
Discount rate 3.60 - 6.10
Inflation rate 2.00 - 3.00 • Demographic assumptions of the Group
Assumptions regarding mortality rates are based on the published statistics of mortality tables B.E. 2540 (1997) (Thailand TMO97) issued by the Office of Insurance Commission.
27. Provision for Decommissioning Costs Movements in the provision for decommissioning costs are as follows:
Unit: Million Baht Consolidated
financial statements
As at January 1, 2012 24,941.52
- Additions 12,857.90
- Currency translation differences (785.47)
- Actual payment (3,249.65)
- Reversal of provision (1.88)
As at December 31, 2012 33,762.42
- Current portion (635.89)
- Long-term portion 33,126.53
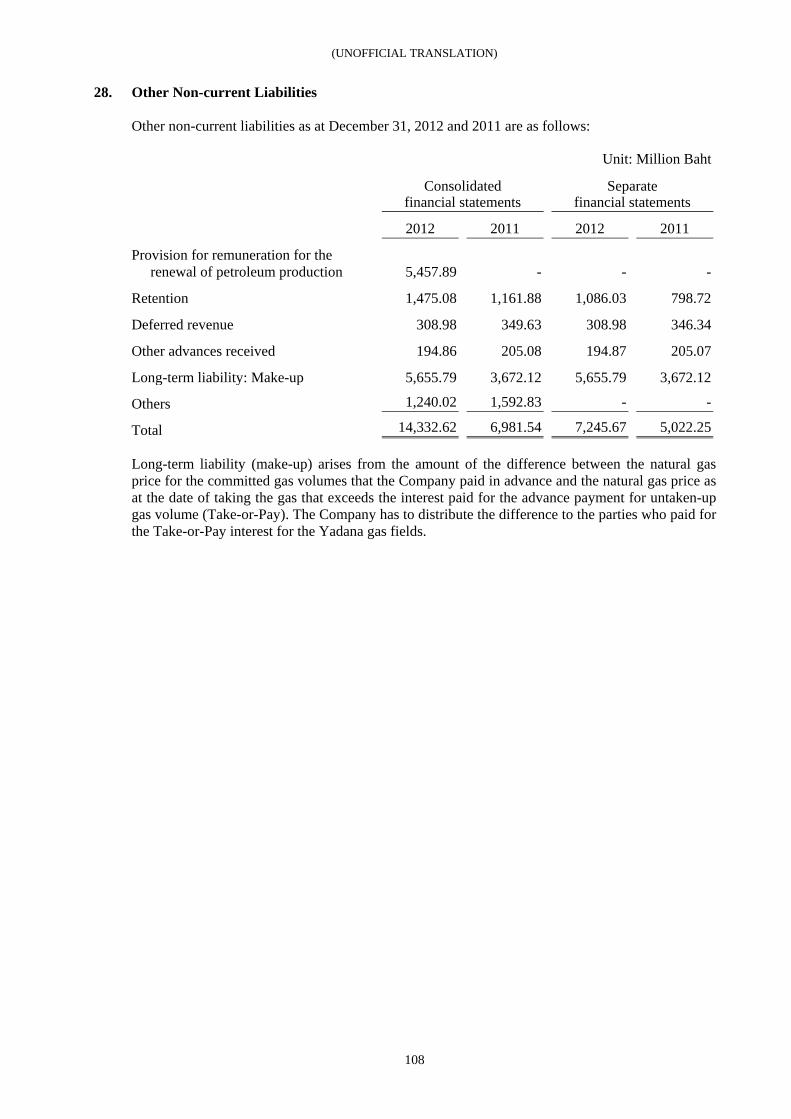
(UNOFFICIAL TRANSLATION)
108
28. Other Non-current Liabilities Other non-current liabilities as at December 31, 2012 and 2011 are as follows: Unit: Million Baht Consolidated
financial statements Separate
financial statements 2012 2011 2012 2011 Provision for remuneration for the renewal of petroleum production 5,457.89 - - -
Retention 1,475.08 1,161.88 1,086.03 798.72
Deferred revenue 308.98 349.63 308.98 346.34
Other advances received 194.86 205.08 194.87 205.07
Long-term liability: Make-up 5,655.79 3,672.12 5,655.79 3,672.12
Others 1,240.02 1,592.83 - -
Total 14,332.62 6,981.54 7,245.67 5,022.25 Long-term liability (make-up) arises from the amount of the difference between the natural gas price for the committed gas volumes that the Company paid in advance and the natural gas price as at the date of taking the gas that exceeds the interest paid for the advance payment for untaken-up gas volume (Take-or-Pay). The Company has to distribute the difference to the parties who paid for the Take-or-Pay interest for the Yadana gas fields.
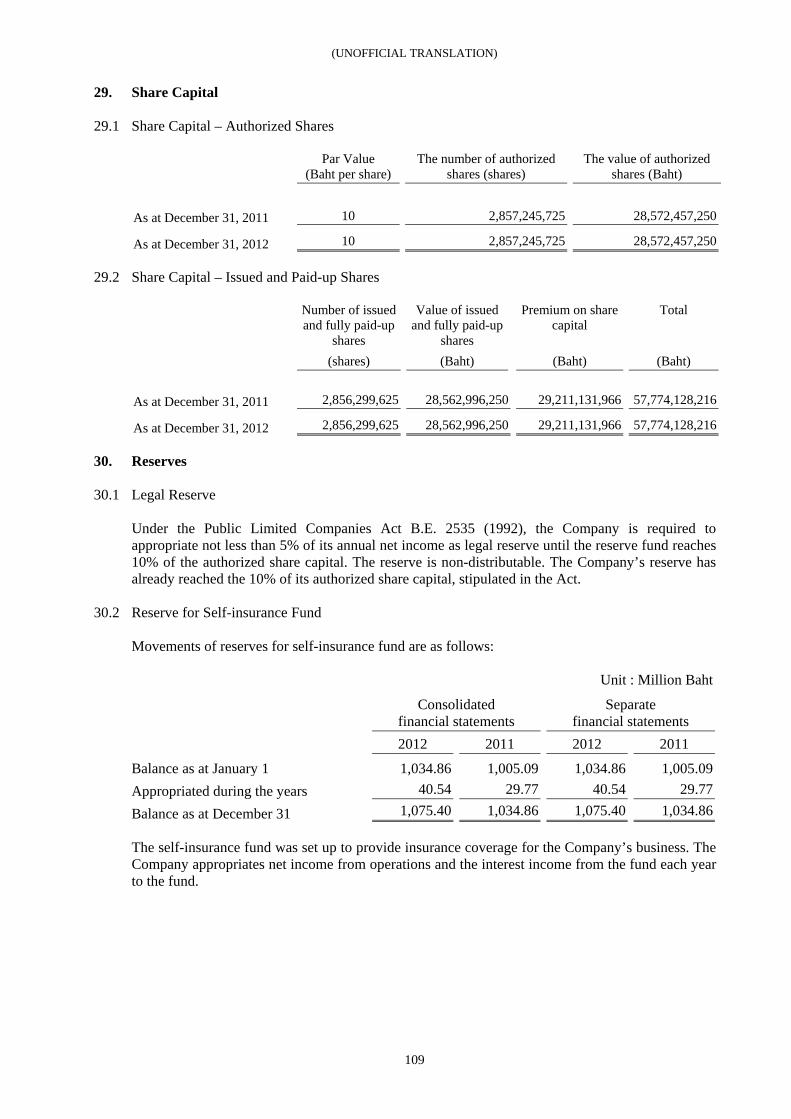
(UNOFFICIAL TRANSLATION)
109
29. Share Capital
29.1 Share Capital – Authorized Shares Par Value The number of authorized The value of authorized (Baht per share) shares (shares) shares (Baht)
As at December 31, 2011 10 2,857,245,725 28,572,457,250
As at December 31, 2012 10 2,857,245,725 28,572,457,250
29.2 Share Capital – Issued and Paid-up Shares
Number of issued and fully paid-up
shares
Value of issued and fully paid-up
shares
Premium on share capital
Total
(shares) (Baht) (Baht) (Baht)
As at December 31, 2011 2,856,299,625 28,562,996,250 29,211,131,966 57,774,128,216
As at December 31, 2012 2,856,299,625 28,562,996,250 29,211,131,966 57,774,128,216
30. Reserves
30.1 Legal Reserve Under the Public Limited Companies Act B.E. 2535 (1992), the Company is required to appropriate not less than 5% of its annual net income as legal reserve until the reserve fund reaches 10% of the authorized share capital. The reserve is non-distributable. The Company’s reserve has already reached the 10% of its authorized share capital, stipulated in the Act.
30.2 Reserve for Self-insurance Fund Movements of reserves for self-insurance fund are as follows:
Unit : Million Baht Consolidated
financial statements Separate
financial statements
2012 2011 2012 2011
Balance as at January 1 1,034.86 1,005.09 1,034.86 1,005.09 Appropriated during the years 40.54 29.77 40.54 29.77
Balance as at December 31 1,075.40 1,034.86 1,075.40 1,034.86 The self-insurance fund was set up to provide insurance coverage for the Company’s business. The Company appropriates net income from operations and the interest income from the fund each year to the fund.
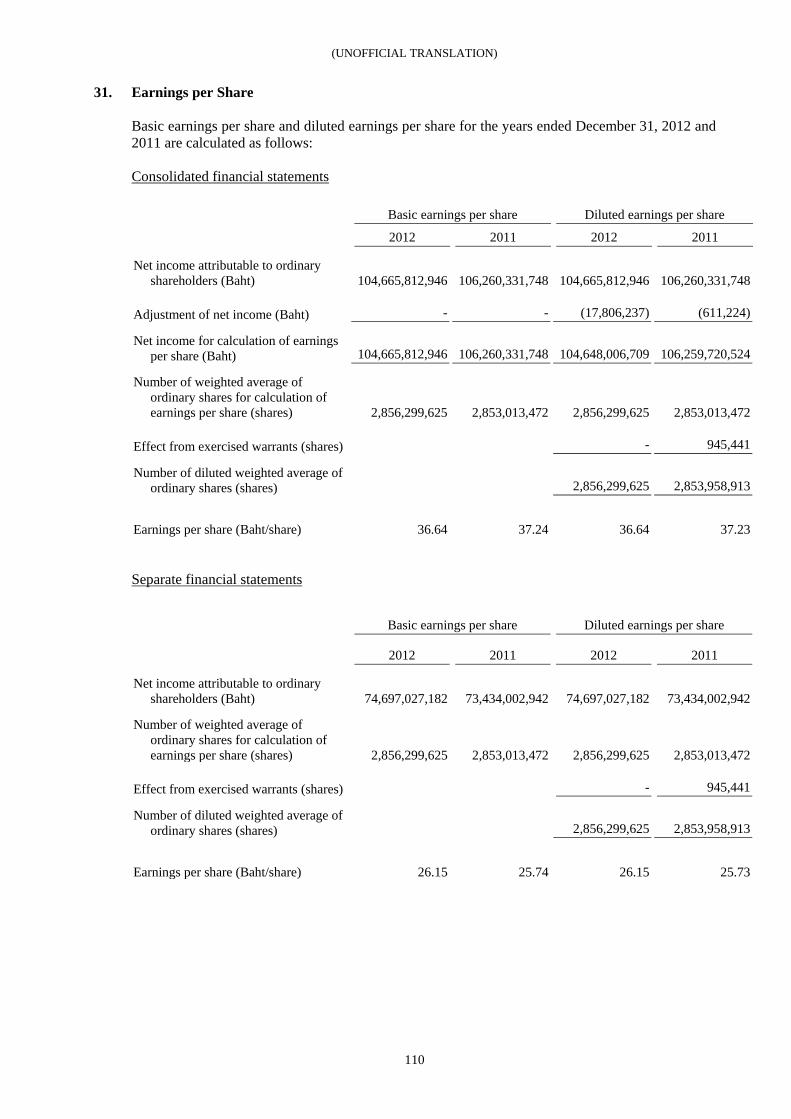
(UNOFFICIAL TRANSLATION)
110
31. Earnings per Share Basic earnings per share and diluted earnings per share for the years ended December 31, 2012 and 2011 are calculated as follows: Consolidated financial statements Basic earnings per share Diluted earnings per share
2012 2011 2012 2011
Net income attributable to ordinary shareholders (Baht) 104,665,812,946 106,260,331,748 104,665,812,946 106,260,331,748
Adjustment of net income (Baht) - - (17,806,237) (611,224)
Net income for calculation of earnings per share (Baht) 104,665,812,946 106,260,331,748 104,648,006,709 106,259,720,524
Number of weighted average of ordinary shares for calculation of earnings per share (shares) 2,856,299,625 2,853,013,472 2,856,299,625 2,853,013,472
Effect from exercised warrants (shares) - 945,441
Number of diluted weighted average of ordinary shares (shares) 2,856,299,625 2,853,958,913
Earnings per share (Baht/share) 36.64 37.24 36.64 37.23 Separate financial statements
Basic earnings per share Diluted earnings per share
2012 2011 2012 2011
Net income attributable to ordinary shareholders (Baht) 74,697,027,182 73,434,002,942 74,697,027,182 73,434,002,942
Number of weighted average of ordinary shares for calculation of earnings per share (shares) 2,856,299,625 2,853,013,472 2,856,299,625 2,853,013,472
Effect from exercised warrants (shares) - 945,441
Number of diluted weighted average of ordinary shares (shares) 2,856,299,625 2,853,958,913
Earnings per share (Baht/share) 26.15 25.74 26.15 25.73
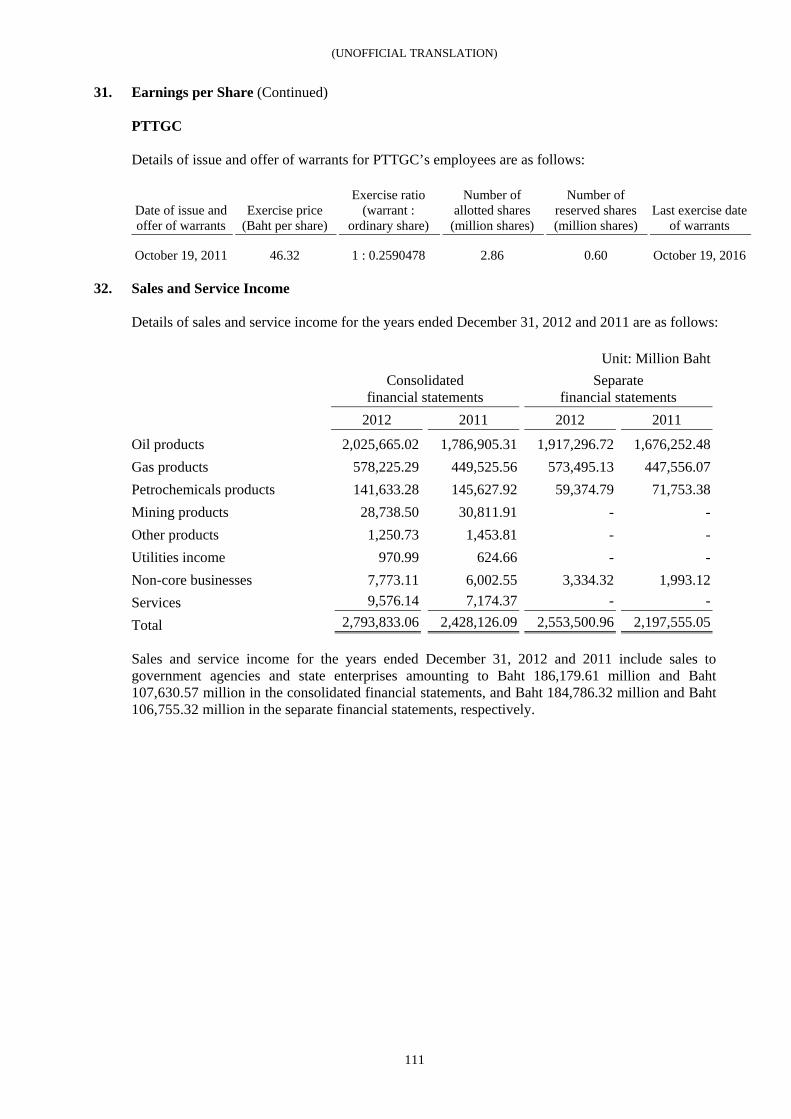
(UNOFFICIAL TRANSLATION)
111
31. Earnings per Share (Continued) PTTGC Details of issue and offer of warrants for PTTGC’s employees are as follows:
Date of issue and offer of warrants
Exercise price (Baht per share)
Exercise ratio (warrant :
ordinary share)
Number of allotted shares
(million shares)
Number of reserved shares (million shares)
Last exercise date of warrants
October 19, 2011 46.32 1 : 0.2590478 2.86 0.60 October 19, 2016
32. Sales and Service Income Details of sales and service income for the years ended December 31, 2012 and 2011 are as follows: Unit: Million Baht Consolidated
financial statements Separate
financial statements 2012 2011 2012 2011
Oil products 2,025,665.02 1,786,905.31 1,917,296.72 1,676,252.48 Gas products 578,225.29 449,525.56 573,495.13 447,556.07 Petrochemicals products 141,633.28 145,627.92 59,374.79 71,753.38 Mining products 28,738.50 30,811.91 - - Other products 1,250.73 1,453.81 - - Utilities income 970.99 624.66 - - Non-core businesses 7,773.11 6,002.55 3,334.32 1,993.12 Services 9,576.14 7,174.37 - -
Total 2,793,833.06 2,428,126.09 2,553,500.96 2,197,555.05 Sales and service income for the years ended December 31, 2012 and 2011 include sales to government agencies and state enterprises amounting to Baht 186,179.61 million and Baht 107,630.57 million in the consolidated financial statements, and Baht 184,786.32 million and Baht 106,755.32 million in the separate financial statements, respectively.
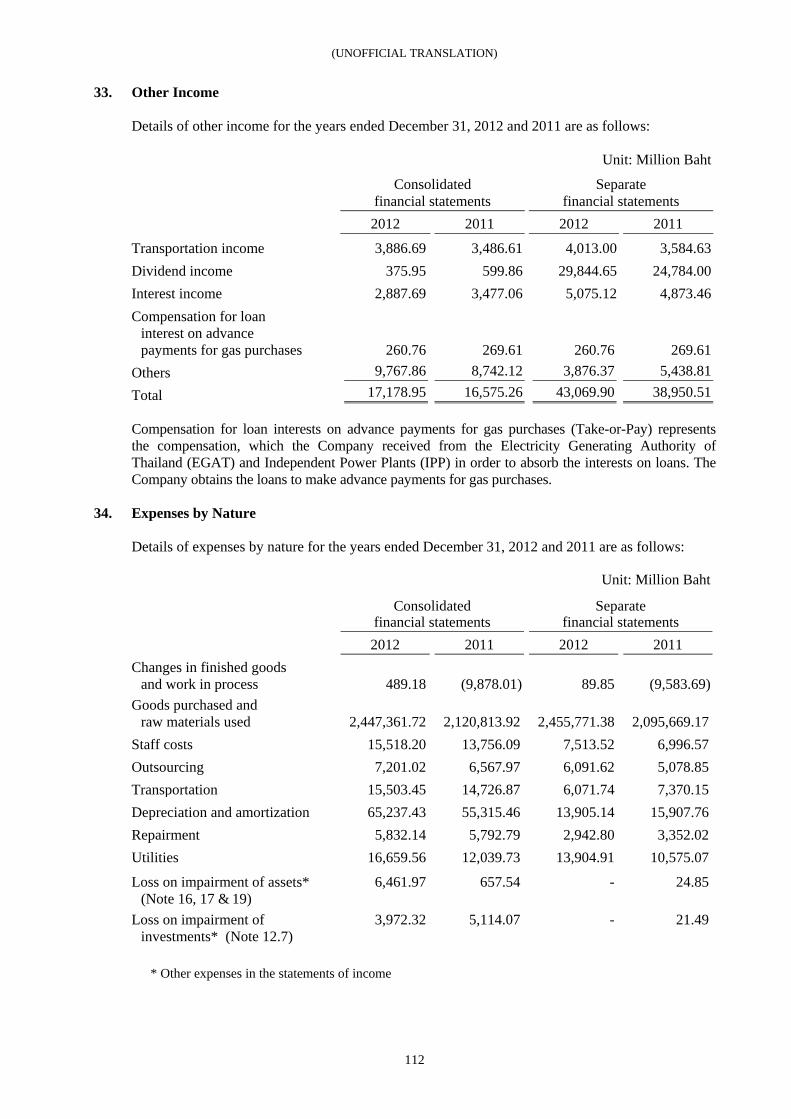
(UNOFFICIAL TRANSLATION)
112
33. Other Income Details of other income for the years ended December 31, 2012 and 2011 are as follows: Unit: Million Baht Consolidated
financial statements Separate
financial statements 2012 2011 2012 2011
Transportation income 3,886.69 3,486.61 4,013.00 3,584.63 Dividend income 375.95 599.86 29,844.65 24,784.00 Interest income 2,887.69 3,477.06 5,075.12 4,873.46 Compensation for loan
interest on advance payments for gas purchases 260.76 269.61 260.76 269.61
Others 9,767.86 8,742.12 3,876.37 5,438.81
Total 17,178.95 16,575.26 43,069.90 38,950.51 Compensation for loan interests on advance payments for gas purchases (Take-or-Pay) represents the compensation, which the Company received from the Electricity Generating Authority of Thailand (EGAT) and Independent Power Plants (IPP) in order to absorb the interests on loans. The Company obtains the loans to make advance payments for gas purchases.
34. Expenses by Nature Details of expenses by nature for the years ended December 31, 2012 and 2011 are as follows: Unit: Million Baht Consolidated
financial statements Separate
financial statements 2012 2011 2012 2011 Changes in finished goods
and work in process 489.18 (9,878.01) 89.85 (9,583.69) Goods purchased and
raw materials used 2,447,361.72 2,120,813.92 2,455,771.38 2,095,669.17 Staff costs 15,518.20 13,756.09 7,513.52 6,996.57 Outsourcing 7,201.02 6,567.97 6,091.62 5,078.85 Transportation 15,503.45 14,726.87 6,071.74 7,370.15 Depreciation and amortization 65,237.43 55,315.46 13,905.14 15,907.76 Repairment 5,832.14 5,792.79 2,942.80 3,352.02 Utilities 16,659.56 12,039.73 13,904.91 10,575.07
Loss on impairment of assets* (Note 16, 17 & 19)
6,461.97 657.54 - 24.85
Loss on impairment of investments* (Note 12.7)
3,972.32 5,114.07 - 21.49
* Other expenses in the statements of income
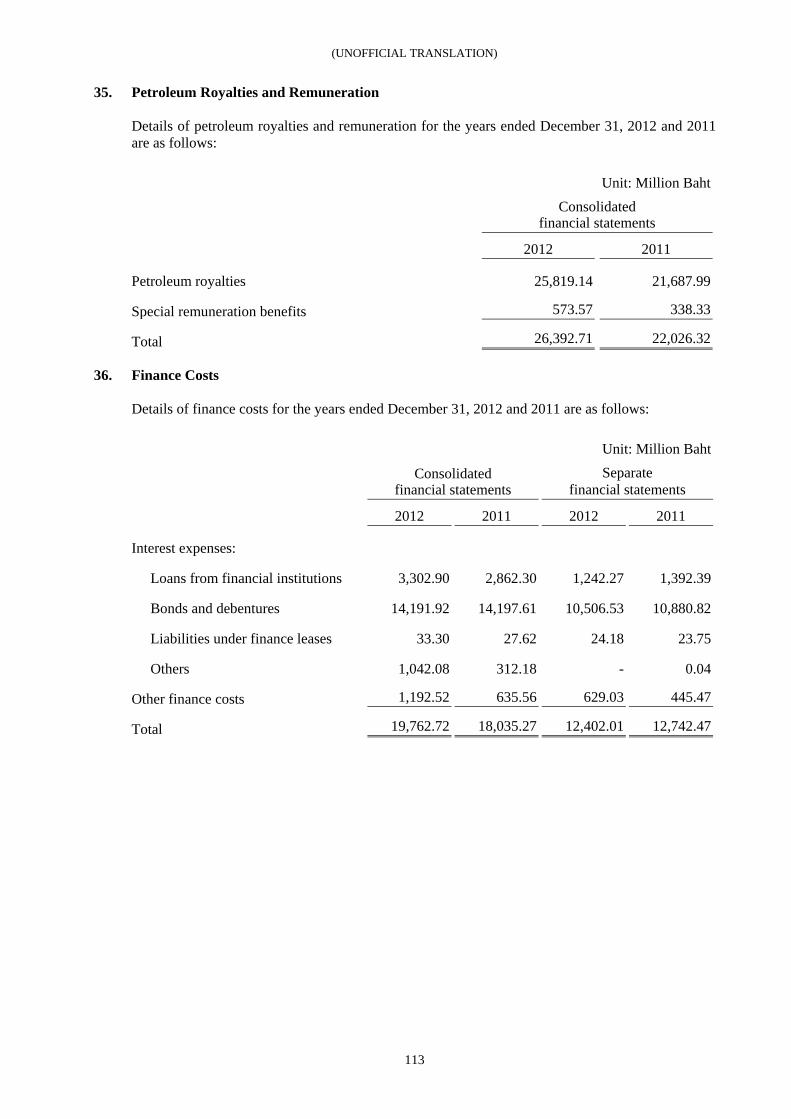
(UNOFFICIAL TRANSLATION)
113
35. Petroleum Royalties and Remuneration Details of petroleum royalties and remuneration for the years ended December 31, 2012 and 2011 are as follows: Unit: Million Baht Consolidated
financial statements 2012 2011
Petroleum royalties 25,819.14 21,687.99
Special remuneration benefits 573.57 338.33
Total 26,392.71 22,026.32
36. Finance Costs Details of finance costs for the years ended December 31, 2012 and 2011 are as follows: Unit: Million Baht Consolidated
financial statements Separate
financial statements 2012 2011 2012 2011
Interest expenses:
Loans from financial institutions 3,302.90 2,862.30 1,242.27 1,392.39
Bonds and debentures 14,191.92 14,197.61 10,506.53 10,880.82
Liabilities under finance leases 33.30 27.62 24.18 23.75
Others 1,042.08 312.18 - 0.04
Other finance costs 1,192.52 635.56 629.03 445.47
Total 19,762.72 18,035.27 12,402.01 12,742.47
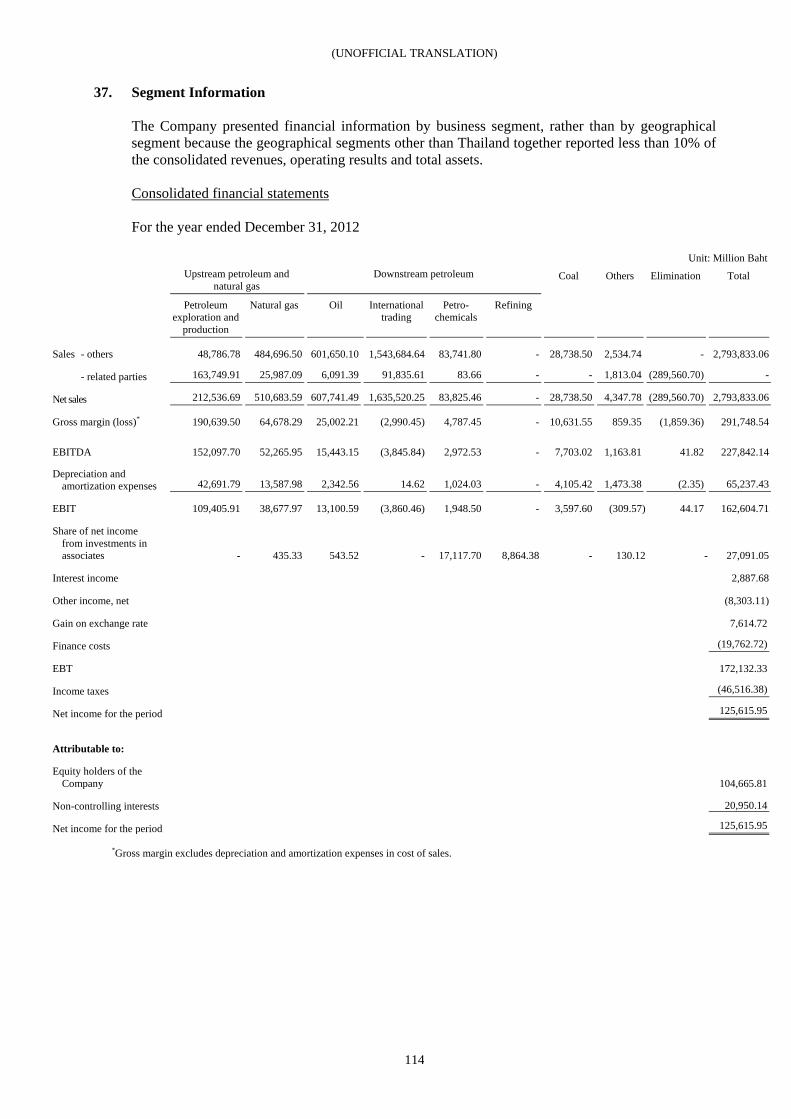
(UNOFFICIAL TRANSLATION)
114
37. Segment Information The Company presented financial information by business segment, rather than by geographical segment because the geographical segments other than Thailand together reported less than 10% of the consolidated revenues, operating results and total assets. Consolidated financial statements For the year ended December 31, 2012
Unit: Million Baht Upstream petroleum and
natural gas Downstream petroleum
Coal
Others
Elimination
Total
Petroleum
exploration and production
Natural gas
Oil
International trading
Petro-chemicals
Refining
Sales - others 48,786.78 484,696.50 601,650.10 1,543,684.64 83,741.80 - 28,738.50 2,534.74 - 2,793,833.06
- related parties 163,749.91 25,987.09 6,091.39 91,835.61 83.66 - - 1,813.04 (289,560.70) -
Net sales 212,536.69 510,683.59 607,741.49 1,635,520.25 83,825.46 - 28,738.50 4,347.78 (289,560.70) 2,793,833.06
Gross margin (loss)* 190,639.50 64,678.29 25,002.21 (2,990.45) 4,787.45 - 10,631.55 859.35 (1,859.36) 291,748.54
EBITDA 152,097.70 52,265.95 15,443.15 (3,845.84) 2,972.53 - 7,703.02 1,163.81 41.82 227,842.14
Depreciation and amortization expenses 42,691.79 13,587.98 2,342.56 14.62 1,024.03 - 4,105.42 1,473.38 (2.35) 65,237.43
EBIT 109,405.91 38,677.97 13,100.59 (3,860.46) 1,948.50 - 3,597.60 (309.57) 44.17 162,604.71
Share of net income from investments in
associates - 435.33 543.52 - 17,117.70 8,864.38 - 130.12 - 27,091.05
Interest income 2,887.68
Other income, net (8,303.11)
Gain on exchange rate 7,614.72
Finance costs (19,762.72)
EBT 172,132.33
Income taxes (46,516.38)
Net income for the period 125,615.95
Attributable to:
Equity holders of the
Company 104,665.81
Non-controlling interests 20,950.14
Net income for the period 125,615.95
*Gross margin excludes depreciation and amortization expenses in cost of sales.
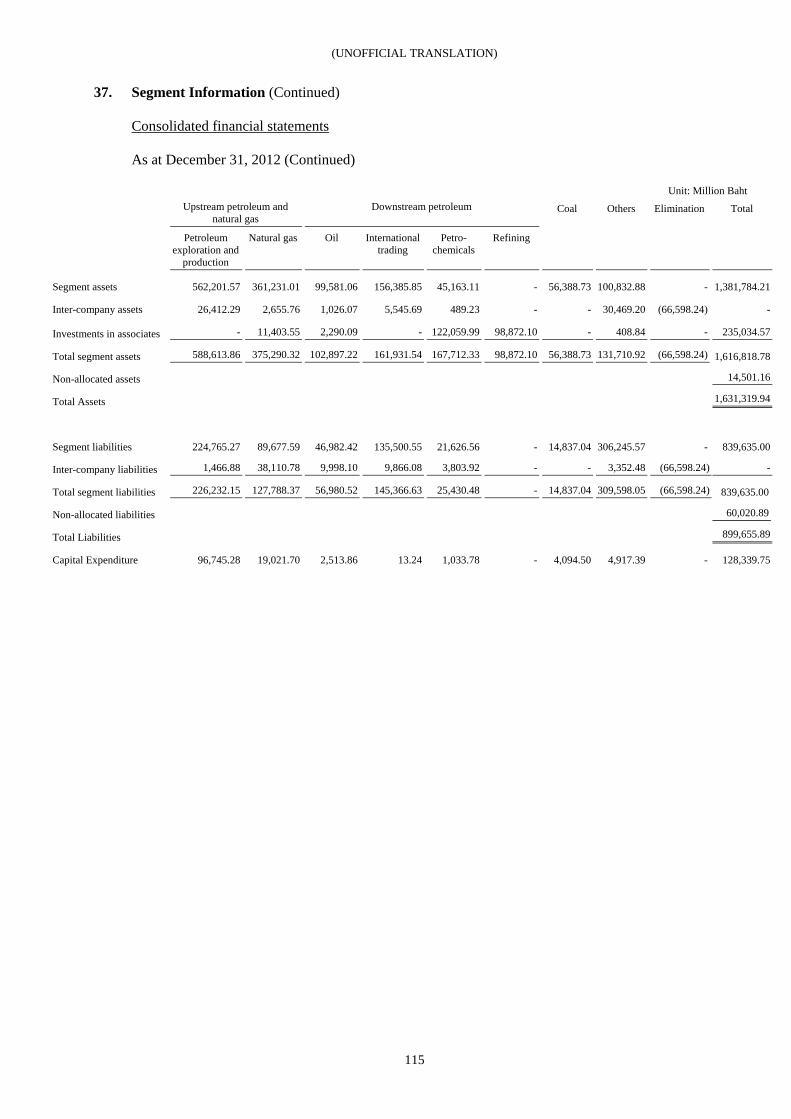
(UNOFFICIAL TRANSLATION)
115
37. Segment Information (Continued) Consolidated financial statements As at December 31, 2012 (Continued)
Unit: Million Baht Upstream petroleum and
natural gas Downstream petroleum
Coal
Others
Elimination
Total
Petroleum
exploration and production
Natural gas
Oil
International trading
Petro-chemicals
Refining
Segment assets 562,201.57 361,231.01 99,581.06 156,385.85 45,163.11 - 56,388.73 100,832.88 - 1,381,784.21
Inter-company assets 26,412.29 2,655.76 1,026.07 5,545.69 489.23 - - 30,469.20 (66,598.24) - Investments in associates - 11,403.55 2,290.09 - 122,059.99 98,872.10 - 408.84 - 235,034.57
Total segment assets 588,613.86 375,290.32 102,897.22 161,931.54 167,712.33 98,872.10 56,388.73 131,710.92 (66,598.24) 1,616,818.78
Non-allocated assets 14,501.16
Total Assets 1,631,319.94
Segment liabilities 224,765.27 89,677.59 46,982.42 135,500.55 21,626.56 - 14,837.04 306,245.57 - 839,635.00
Inter-company liabilities 1,466.88 38,110.78 9,998.10 9,866.08 3,803.92 - - 3,352.48 (66,598.24) -
Total segment liabilities 226,232.15 127,788.37 56,980.52 145,366.63 25,430.48 - 14,837.04 309,598.05 (66,598.24) 839,635.00
Non-allocated liabilities 60,020.89
Total Liabilities 899,655.89
Capital Expenditure 96,745.28 19,021.70 2,513.86 13.24 1,033.78 - 4,094.50 4,917.39 - 128,339.75
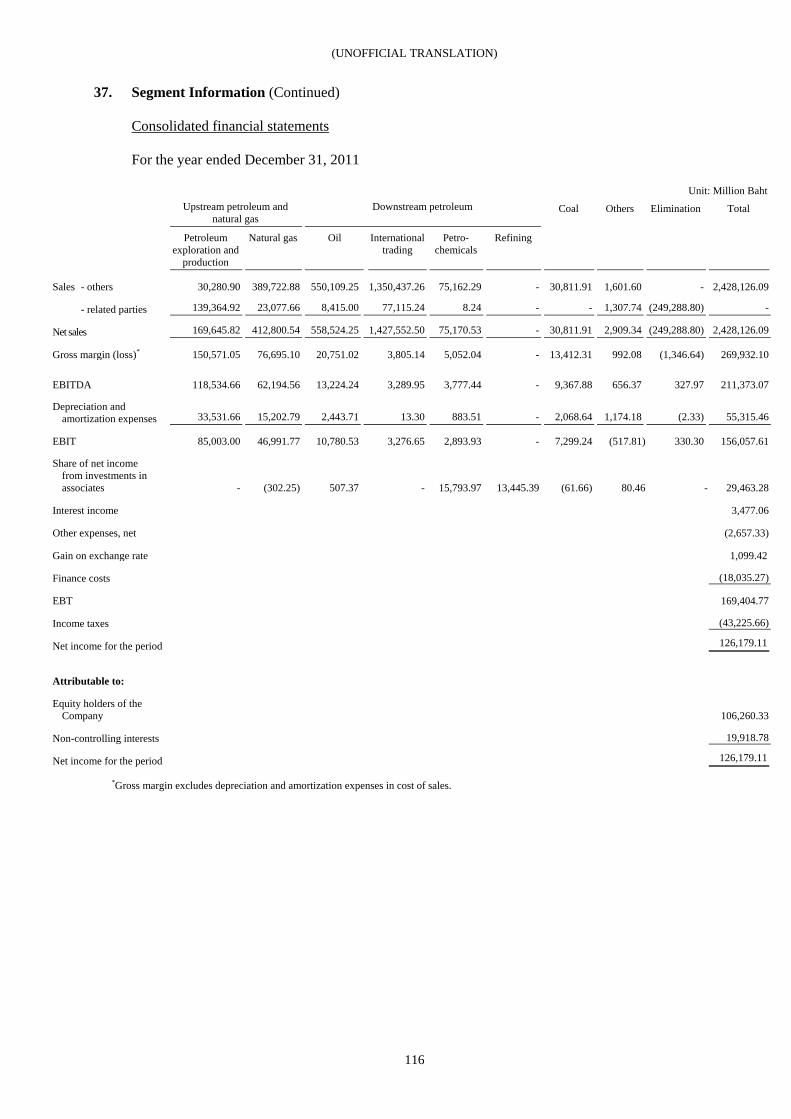
(UNOFFICIAL TRANSLATION)
116
37. Segment Information (Continued) Consolidated financial statements For the year ended December 31, 2011
Unit: Million Baht Upstream petroleum and
natural gas Downstream petroleum
Coal
Others
Elimination
Total
Petroleum
exploration and production
Natural gas
Oil
International trading
Petro-chemicals
Refining
Sales - others 30,280.90 389,722.88 550,109.25 1,350,437.26 75,162.29 - 30,811.91 1,601.60 - 2,428,126.09
- related parties 139,364.92 23,077.66 8,415.00 77,115.24 8.24 - - 1,307.74 (249,288.80) -
Net sales 169,645.82 412,800.54 558,524.25 1,427,552.50 75,170.53 - 30,811.91 2,909.34 (249,288.80) 2,428,126.09
Gross margin (loss)* 150,571.05 76,695.10 20,751.02 3,805.14 5,052.04 - 13,412.31 992.08 (1,346.64) 269,932.10
EBITDA 118,534.66 62,194.56 13,224.24 3,289.95 3,777.44 - 9,367.88 656.37 327.97 211,373.07
Depreciation and amortization expenses 33,531.66 15,202.79 2,443.71 13.30 883.51 - 2,068.64 1,174.18 (2.33) 55,315.46
EBIT 85,003.00 46,991.77 10,780.53 3,276.65 2,893.93 - 7,299.24 (517.81) 330.30 156,057.61
Share of net income from investments in
associates - (302.25) 507.37 - 15,793.97 13,445.39 (61.66) 80.46 - 29,463.28
Interest income 3,477.06
Other expenses, net (2,657.33)
Gain on exchange rate 1,099.42
Finance costs (18,035.27)
EBT 169,404.77
Income taxes (43,225.66)
Net income for the period 126,179.11
Attributable to:
Equity holders of the
Company 106,260.33
Non-controlling interests 19,918.78
Net income for the period 126,179.11
*Gross margin excludes depreciation and amortization expenses in cost of sales.
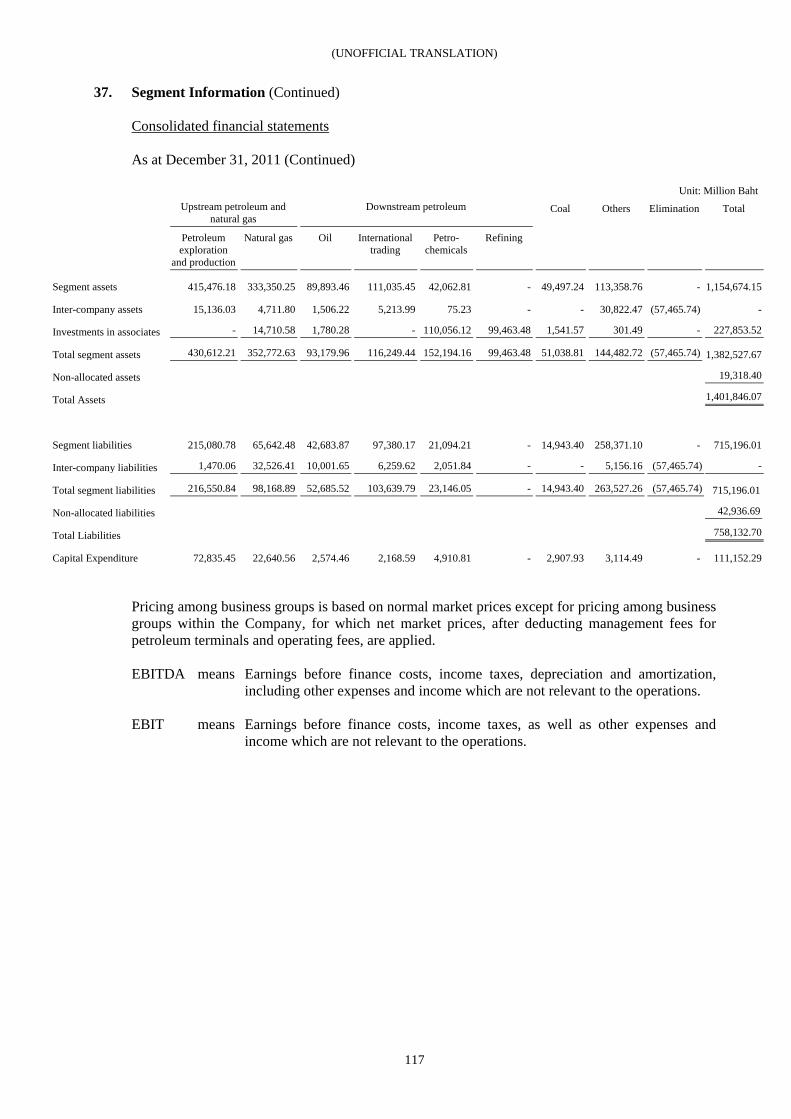
(UNOFFICIAL TRANSLATION)
117
37. Segment Information (Continued) Consolidated financial statements As at December 31, 2011 (Continued)
Pricing among business groups is based on normal market prices except for pricing among business groups within the Company, for which net market prices, after deducting management fees for petroleum terminals and operating fees, are applied. EBITDA means Earnings before finance costs, income taxes, depreciation and amortization,
including other expenses and income which are not relevant to the operations. EBIT means Earnings before finance costs, income taxes, as well as other expenses and
income which are not relevant to the operations.
Unit: Million Baht Upstream petroleum and
natural gas Downstream petroleum
Coal
Others
Elimination
Total
Petroleum
exploration and production
Natural gas
Oil
International trading
Petro-chemicals
Refining
Segment assets 415,476.18 333,350.25 89,893.46 111,035.45 42,062.81 - 49,497.24 113,358.76 - 1,154,674.15
Inter-company assets 15,136.03 4,711.80 1,506.22 5,213.99 75.23 - - 30,822.47 (57,465.74) -
Investments in associates - 14,710.58 1,780.28 - 110,056.12 99,463.48 1,541.57 301.49 - 227,853.52
Total segment assets 430,612.21 352,772.63 93,179.96 116,249.44 152,194.16 99,463.48 51,038.81 144,482.72 (57,465.74) 1,382,527.67
Non-allocated assets 19,318.40
Total Assets 1,401,846.07
Segment liabilities 215,080.78 65,642.48 42,683.87 97,380.17 21,094.21 - 14,943.40 258,371.10 - 715,196.01
Inter-company liabilities 1,470.06 32,526.41 10,001.65 6,259.62 2,051.84 - - 5,156.16 (57,465.74) -
Total segment liabilities 216,550.84 98,168.89 52,685.52 103,639.79 23,146.05 - 14,943.40 263,527.26 (57,465.74) 715,196.01
Non-allocated liabilities 42,936.69
Total Liabilities 758,132.70
Capital Expenditure 72,835.45 22,640.56 2,574.46 2,168.59 4,910.81 - 2,907.93 3,114.49 - 111,152.29
(UNOFFICIAL TRANSLATION)
118
37. Segment Information (Continued) The major business segments of the Group are as follows: Upstream Petroleum and Natural Gas Business Group
1. Petroleum exploration and production business: The Group conducts petroleum exploration and production business both domestically and overseas. The Group is the operator and jointly invests with leading petroleum exploration and production companies. Most domestic projects are located in the Gulf of Thailand. Overseas projects cover the Asia Pacific and Middle East regions.
2. Natural gas business: The Group conducts natural gas business including procurement, natural gas pipeline transmission, distribution, and natural gas separation. Products from the natural gas separation plants are used as feedstock for the petrochemical industry and as fuel in the household, transportation and other industry sectors.
Downstream Petroleum Business Group
1. Oil business: The Group conducts marketing of petroleum and lube oil in both domestic and overseas markets under an efficient operating system of procurement, storage, and distribution of products as well as the retail business at service stations.
2. International trading business: The Group conducts international trading business including the import and export of petroleum and petrochemical products as well as other related products. The business also covers the management of possible risks arising from oil trading as well as from the procurement and distribution of petroleum and petrochemical products in international markets.
3. Petrochemical business: The Group conducts petrochemical business including the production and distribution of the main petrochemical products and by-products for both domestic and overseas markets to serve the demands of industry and consumer groups.
4. Refining business: The Group conducts refining business, involving the processing and distribution of finished oil products to serve both domestic and overseas customers. In addition, the Group conducts petrochemical business, which utilizes refinery products as raw materials.
Coal Business Group
The Group conducts coal mining business, involving overseas exploration, production and distribution.
Other operations of the Group are included in other segments, none of which constitute separately reportable segments.
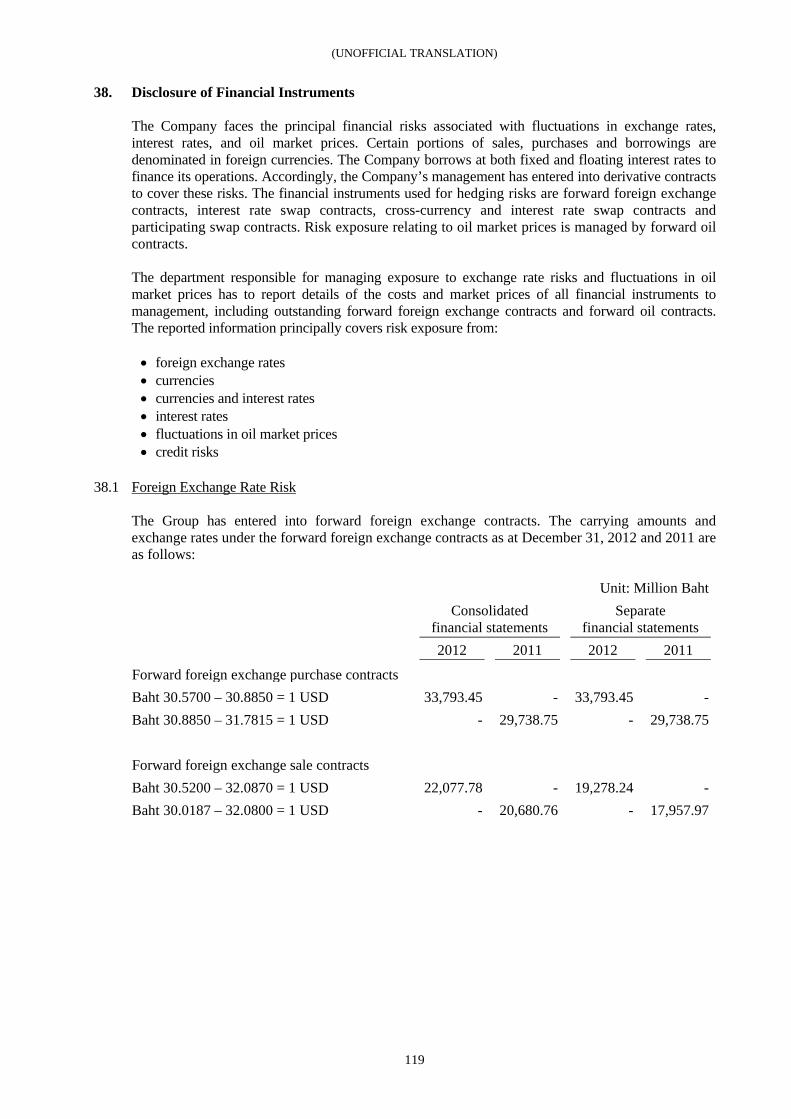
(UNOFFICIAL TRANSLATION)
119
38. Disclosure of Financial Instruments
The Company faces the principal financial risks associated with fluctuations in exchange rates, interest rates, and oil market prices. Certain portions of sales, purchases and borrowings are denominated in foreign currencies. The Company borrows at both fixed and floating interest rates to finance its operations. Accordingly, the Company’s management has entered into derivative contracts to cover these risks. The financial instruments used for hedging risks are forward foreign exchange contracts, interest rate swap contracts, cross-currency and interest rate swap contracts and participating swap contracts. Risk exposure relating to oil market prices is managed by forward oil contracts. The department responsible for managing exposure to exchange rate risks and fluctuations in oil market prices has to report details of the costs and market prices of all financial instruments to management, including outstanding forward foreign exchange contracts and forward oil contracts. The reported information principally covers risk exposure from: • foreign exchange rates • currencies • currencies and interest rates • interest rates • fluctuations in oil market prices • credit risks
38.1 Foreign Exchange Rate Risk
The Group has entered into forward foreign exchange contracts. The carrying amounts and exchange rates under the forward foreign exchange contracts as at December 31, 2012 and 2011 are as follows:
Unit: Million Baht Consolidated
financial statements Separate
financial statements 2012 2011 2012 2011
Forward foreign exchange purchase contracts Baht 30.5700 – 30.8850 = 1 USD 33,793.45 - 33,793.45 - Baht 30.8850 – 31.7815 = 1 USD - 29,738.75 - 29,738.75 Forward foreign exchange sale contracts Baht 30.5200 – 32.0870 = 1 USD 22,077.78 - 19,278.24 - Baht 30.0187 – 32.0800 = 1 USD - 20,680.76 - 17,957.97
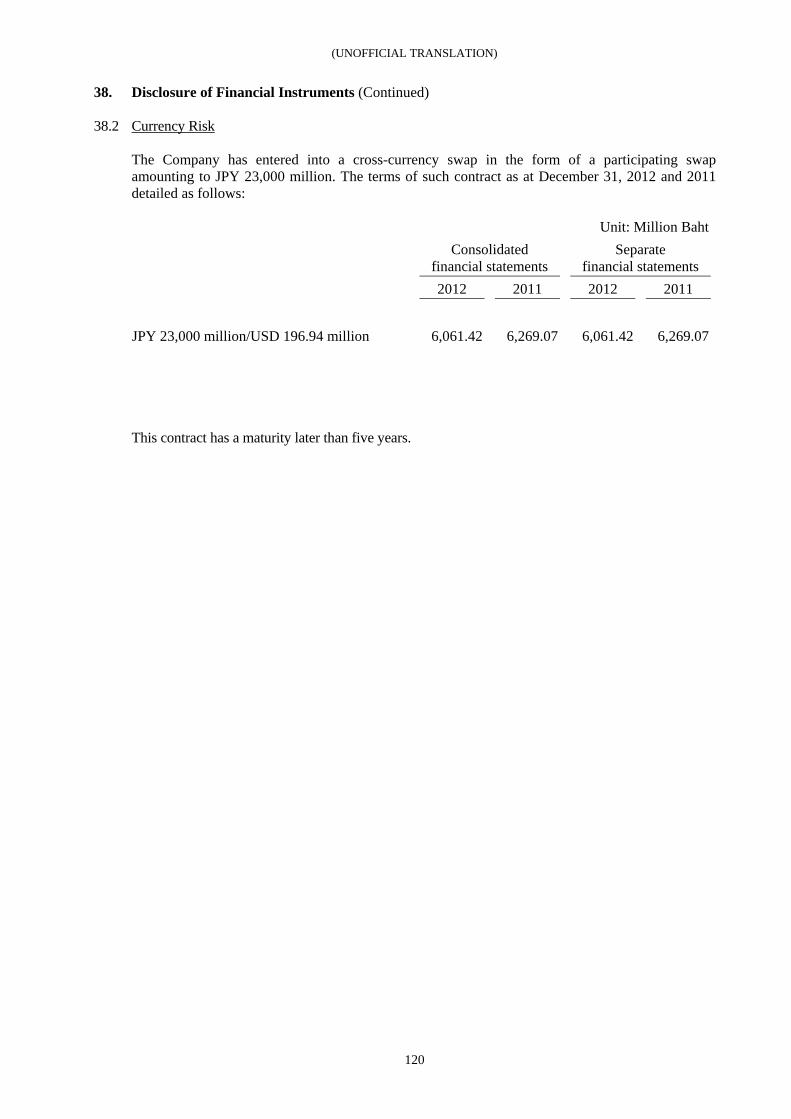
(UNOFFICIAL TRANSLATION)
120
38. Disclosure of Financial Instruments (Continued)
38.2 Currency Risk
The Company has entered into a cross-currency swap in the form of a participating swap amounting to JPY 23,000 million. The terms of such contract as at December 31, 2012 and 2011 detailed as follows:
Unit: Million Baht Consolidated
financial statements Separate
financial statements 2012 2011 2012 2011
JPY 23,000 million/USD 196.94 million 6,061.42 6,269.07 6,061.42 6,269.07
This contract has a maturity later than five years.
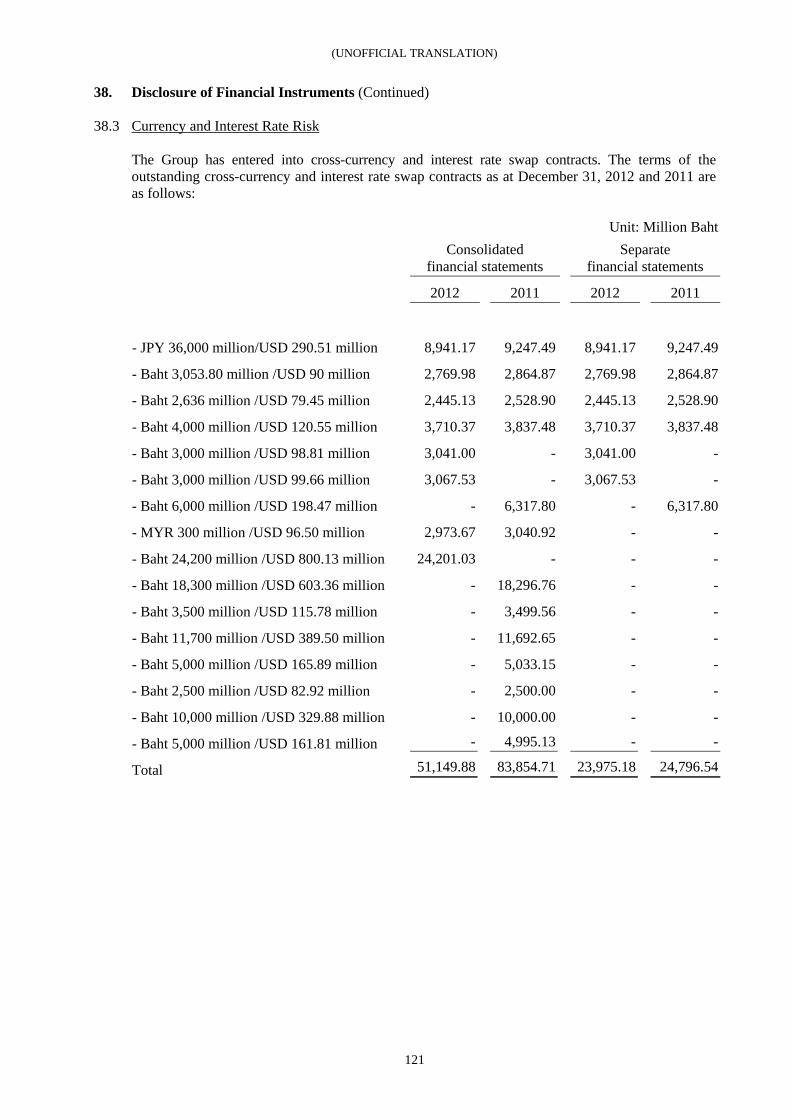
(UNOFFICIAL TRANSLATION)
121
38. Disclosure of Financial Instruments (Continued) 38.3 Currency and Interest Rate Risk
The Group has entered into cross-currency and interest rate swap contracts. The terms of the outstanding cross-currency and interest rate swap contracts as at December 31, 2012 and 2011 are as follows:
Unit: Million Baht
Consolidated
financial statements Separate
financial statements
2012 2011 2012 2011
- JPY 36,000 million/USD 290.51 million 8,941.17 9,247.49 8,941.17 9,247.49
- Baht 3,053.80 million /USD 90 million 2,769.98 2,864.87 2,769.98 2,864.87
- Baht 2,636 million /USD 79.45 million 2,445.13 2,528.90 2,445.13 2,528.90
- Baht 4,000 million /USD 120.55 million 3,710.37 3,837.48 3,710.37 3,837.48
- Baht 3,000 million /USD 98.81 million 3,041.00 - 3,041.00 -
- Baht 3,000 million /USD 99.66 million 3,067.53 - 3,067.53 -
- Baht 6,000 million /USD 198.47 million - 6,317.80 - 6,317.80
- MYR 300 million /USD 96.50 million 2,973.67 3,040.92 - -
- Baht 24,200 million /USD 800.13 million 24,201.03 - - -
- Baht 18,300 million /USD 603.36 million - 18,296.76 - -
- Baht 3,500 million /USD 115.78 million - 3,499.56 - -
- Baht 11,700 million /USD 389.50 million - 11,692.65 - -
- Baht 5,000 million /USD 165.89 million - 5,033.15 - -
- Baht 2,500 million /USD 82.92 million - 2,500.00 - -
- Baht 10,000 million /USD 329.88 million - 10,000.00 - -
- Baht 5,000 million /USD 161.81 million - 4,995.13 - -
Total 51,149.88 83,854.71 23,975.18 24,796.54
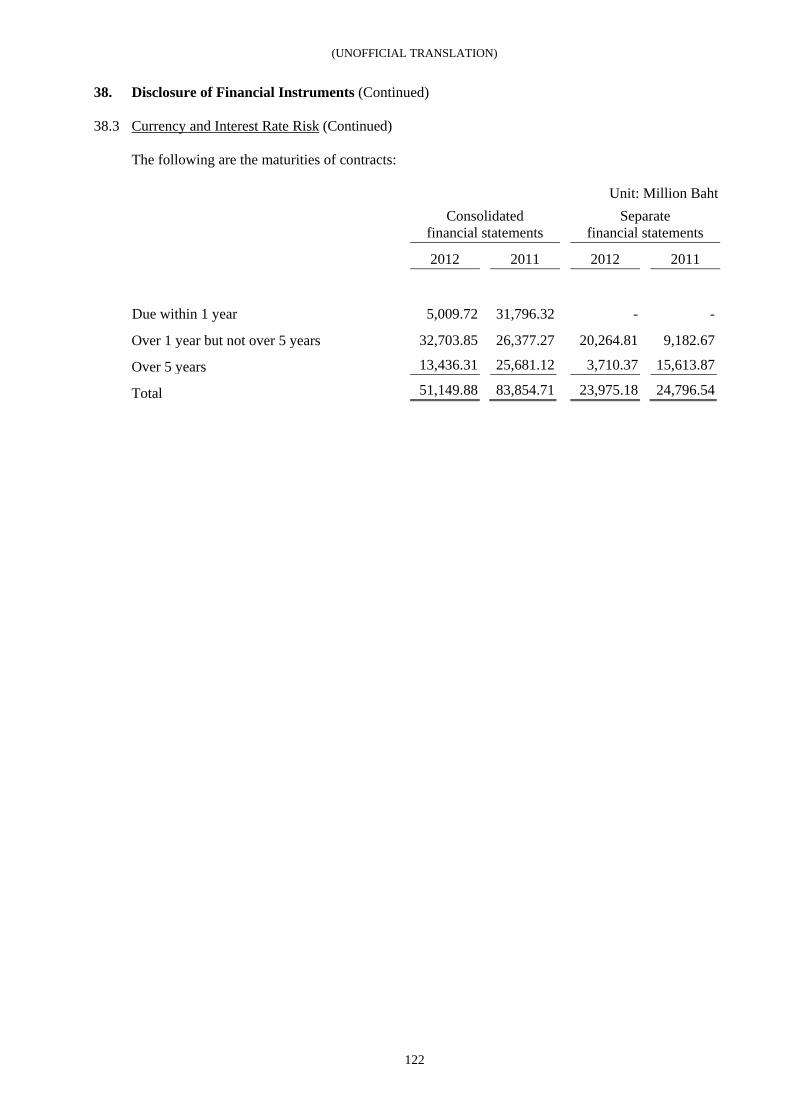
(UNOFFICIAL TRANSLATION)
122
38. Disclosure of Financial Instruments (Continued) 38.3 Currency and Interest Rate Risk (Continued)
The following are the maturities of contracts: Unit: Million Baht
Consolidated
financial statements Separate
financial statements
2012 2011 2012 2011
Due within 1 year 5,009.72 31,796.32 - -
Over 1 year but not over 5 years 32,703.85 26,377.27 20,264.81 9,182.67
Over 5 years 13,436.31 25,681.12 3,710.37 15,613.87
Total 51,149.88 83,854.71 23,975.18 24,796.54
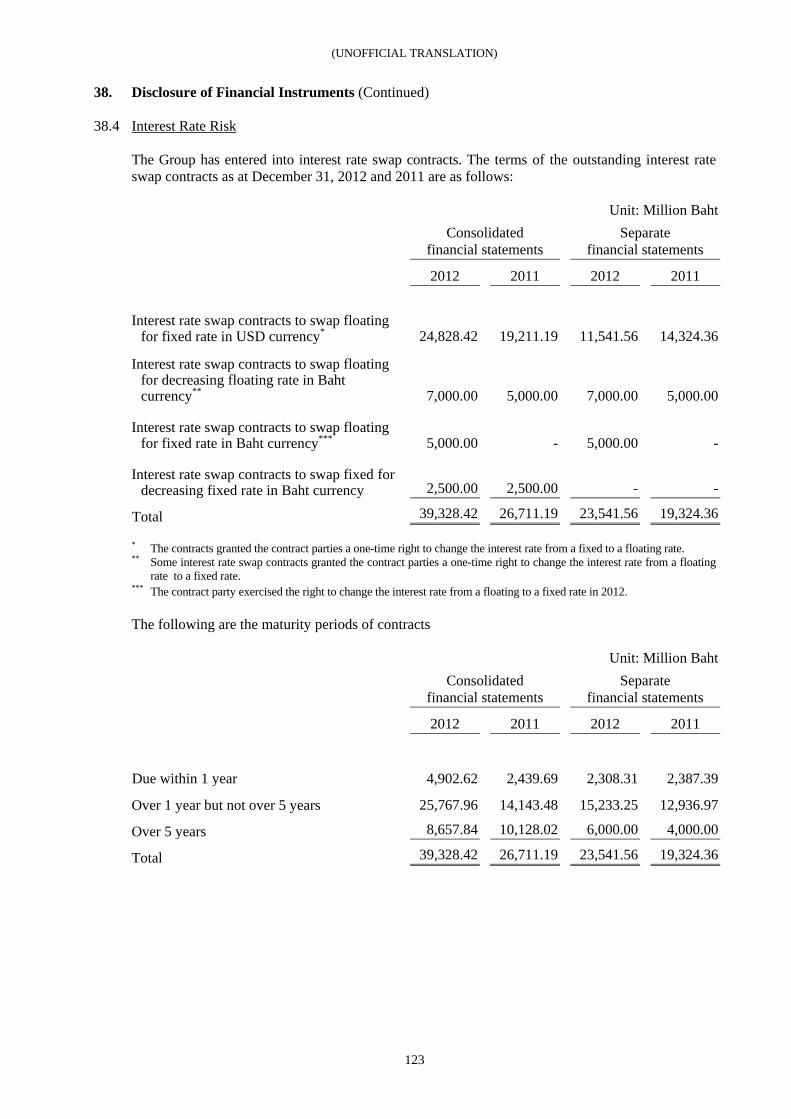
(UNOFFICIAL TRANSLATION)
123
38. Disclosure of Financial Instruments (Continued)
38.4 Interest Rate Risk The Group has entered into interest rate swap contracts. The terms of the outstanding interest rate swap contracts as at December 31, 2012 and 2011 are as follows: Unit: Million Baht
Consolidated
financial statements Separate
financial statements
2012 2011 2012 2011
Interest rate swap contracts to swap floating
for fixed rate in USD currency* 24,828.42 19,211.19 11,541.56 14,324.36
Interest rate swap contracts to swap floating for decreasing floating rate in Baht currency** 7,000.00 5,000.00 7,000.00 5,000.00
Interest rate swap contracts to swap floating for fixed rate in Baht currency*** 5,000.00 - 5,000.00 -
Interest rate swap contracts to swap fixed for decreasing fixed rate in Baht currency 2,500.00 2,500.00 - -
Total 39,328.42 26,711.19 23,541.56 19,324.36 * The contracts granted the contract parties a one-time right to change the interest rate from a fixed to a floating rate. ** Some interest rate swap contracts granted the contract parties a one-time right to change the interest rate from a floating
rate to a fixed rate. *** The contract party exercised the right to change the interest rate from a floating to a fixed rate in 2012.
The following are the maturity periods of contracts Unit: Million Baht
Consolidated
financial statements Separate
financial statements
2012 2011 2012 2011
Due within 1 year 4,902.62 2,439.69 2,308.31 2,387.39
Over 1 year but not over 5 years 25,767.96 14,143.48 15,233.25 12,936.97
Over 5 years 8,657.84 10,128.02 6,000.00 4,000.00
Total 39,328.42 26,711.19 23,541.56 19,324.36
(UNOFFICIAL TRANSLATION)
124
38. Disclosure of Financial Instruments (Continued)
38.5 Fluctuations in Oil Market Price Risk The Group has entered into forward oil price contracts. As at December 31, 2012, the volume of the oil according to such contracts that will mature in December 2013 is 10.32 million barrels in both the consolidated financial statements and the separate financial statements (December 31, 2011: 117.13 million barrels in the consolidated financial statements and the separate financial statements).
38.6 Credit Risk Credit risk arises when customers do not comply with the terms and conditions of credit agreements, causing financial losses to the Company. However, the Company has managed risk by adjusting its credit policies according to the current economic situation, focusing on developing financial instruments by cooperating with financial institutions to support credit facilities provided to customers, such as the Dealer Financing project, the trade credit insurance, and the Payment card and Fleet card project. The Company also reduces credit risk by determining procedures for risk prevention and mitigation, including credit rating for all trading partners of the Company.
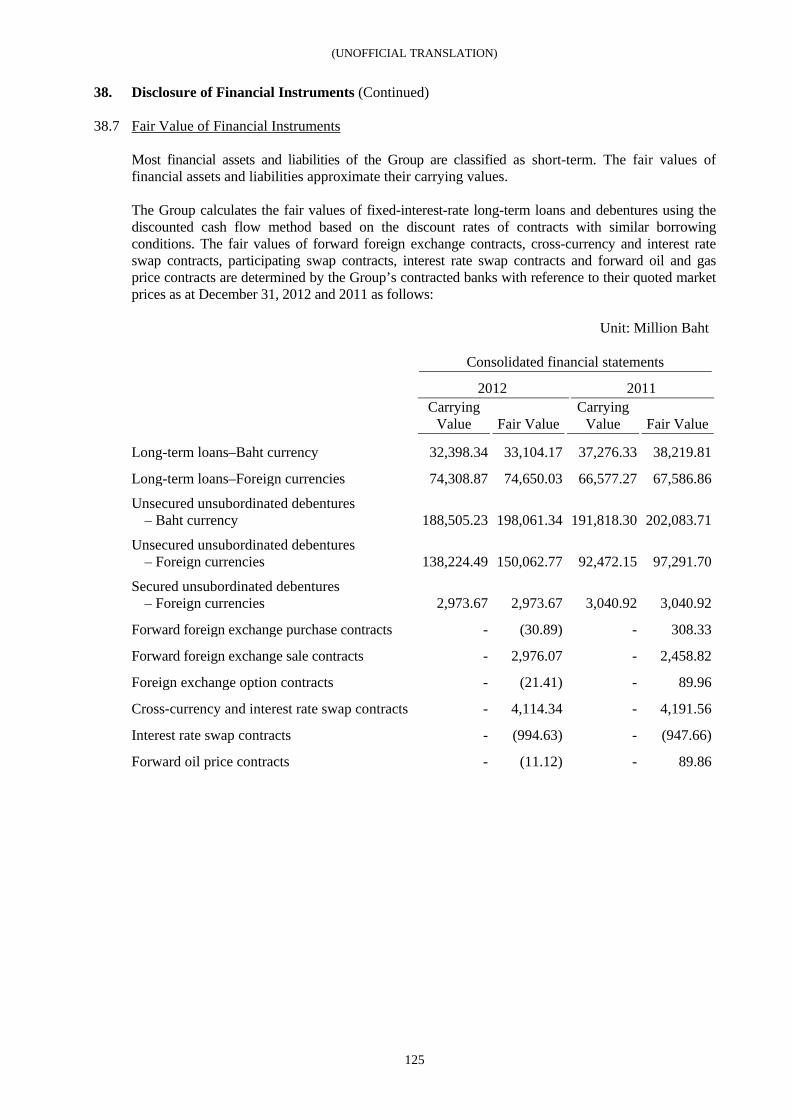
(UNOFFICIAL TRANSLATION)
125
38. Disclosure of Financial Instruments (Continued)
38.7 Fair Value of Financial Instruments Most financial assets and liabilities of the Group are classified as short-term. The fair values of financial assets and liabilities approximate their carrying values. The Group calculates the fair values of fixed-interest-rate long-term loans and debentures using the discounted cash flow method based on the discount rates of contracts with similar borrowing conditions. The fair values of forward foreign exchange contracts, cross-currency and interest rate swap contracts, participating swap contracts, interest rate swap contracts and forward oil and gas price contracts are determined by the Group’s contracted banks with reference to their quoted market prices as at December 31, 2012 and 2011 as follows: Unit: Million Baht
Consolidated financial statements
2012 2011
Carrying
Value Fair Value Carrying
Value Fair Value
Long-term loans–Baht currency 32,398.34 33,104.17 37,276.33 38,219.81
Long-term loans–Foreign currencies 74,308.87 74,650.03 66,577.27 67,586.86
Unsecured unsubordinated debentures – Baht currency 188,505.23 198,061.34 191,818.30 202,083.71
Unsecured unsubordinated debentures – Foreign currencies 138,224.49 150,062.77 92,472.15 97,291.70
Secured unsubordinated debentures – Foreign currencies 2,973.67 2,973.67 3,040.92 3,040.92
Forward foreign exchange purchase contracts - (30.89) - 308.33
Forward foreign exchange sale contracts - 2,976.07 - 2,458.82
Foreign exchange option contracts - (21.41) - 89.96
Cross-currency and interest rate swap contracts - 4,114.34 - 4,191.56
Interest rate swap contracts - (994.63) - (947.66)
Forward oil price contracts - (11.12) - 89.86
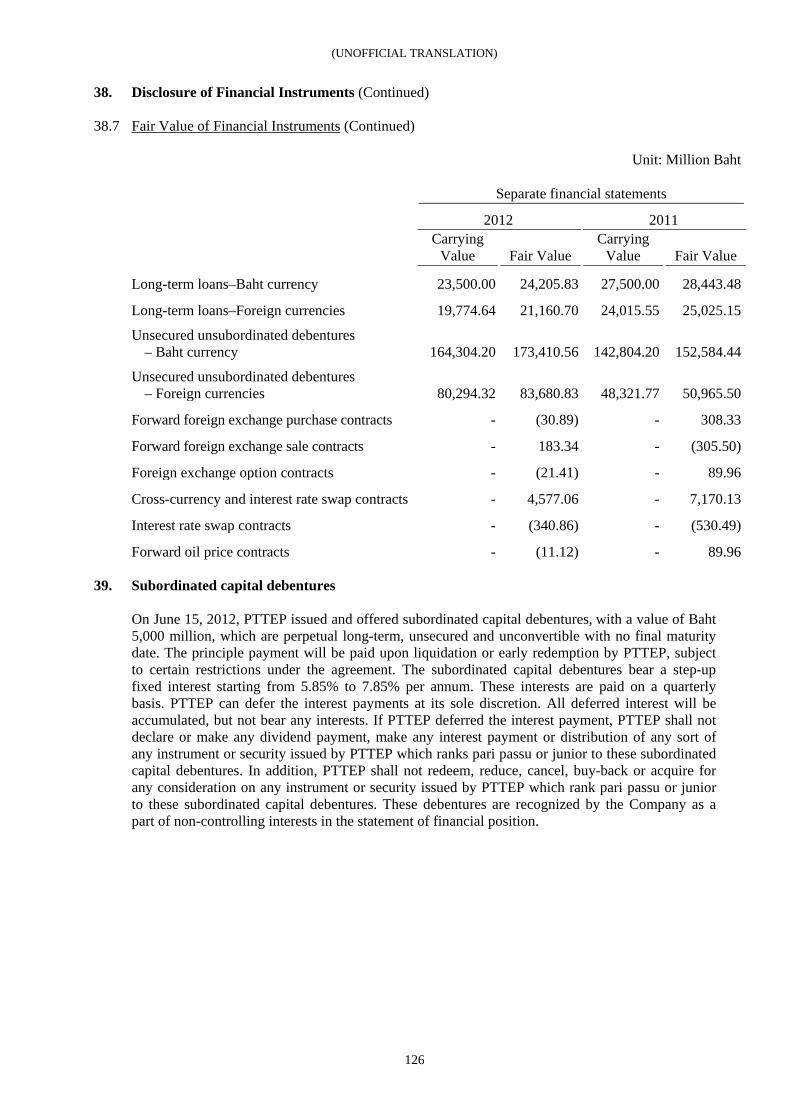
(UNOFFICIAL TRANSLATION)
126
38. Disclosure of Financial Instruments (Continued)
38.7 Fair Value of Financial Instruments (Continued) Unit: Million Baht
Separate financial statements
2012 2011
Carrying
Value Fair Value Carrying
Value Fair Value
Long-term loans–Baht currency 23,500.00 24,205.83 27,500.00 28,443.48
Long-term loans–Foreign currencies 19,774.64 21,160.70 24,015.55 25,025.15
Unsecured unsubordinated debentures – Baht currency 164,304.20 173,410.56 142,804.20 152,584.44
Unsecured unsubordinated debentures – Foreign currencies 80,294.32 83,680.83 48,321.77 50,965.50
Forward foreign exchange purchase contracts - (30.89) - 308.33
Forward foreign exchange sale contracts - 183.34 - (305.50)
Foreign exchange option contracts - (21.41) - 89.96
Cross-currency and interest rate swap contracts - 4,577.06 - 7,170.13
Interest rate swap contracts - (340.86) - (530.49)
Forward oil price contracts - (11.12) - 89.96
39. Subordinated capital debentures On June 15, 2012, PTTEP issued and offered subordinated capital debentures, with a value of Baht 5,000 million, which are perpetual long-term, unsecured and unconvertible with no final maturity date. The principle payment will be paid upon liquidation or early redemption by PTTEP, subject to certain restrictions under the agreement. The subordinated capital debentures bear a step-up fixed interest starting from 5.85% to 7.85% per annum. These interests are paid on a quarterly basis. PTTEP can defer the interest payments at its sole discretion. All deferred interest will be accumulated, but not bear any interests. If PTTEP deferred the interest payment, PTTEP shall not declare or make any dividend payment, make any interest payment or distribution of any sort of any instrument or security issued by PTTEP which ranks pari passu or junior to these subordinated capital debentures. In addition, PTTEP shall not redeem, reduce, cancel, buy-back or acquire for any consideration on any instrument or security issued by PTTEP which rank pari passu or junior to these subordinated capital debentures. These debentures are recognized by the Company as a part of non-controlling interests in the statement of financial position.
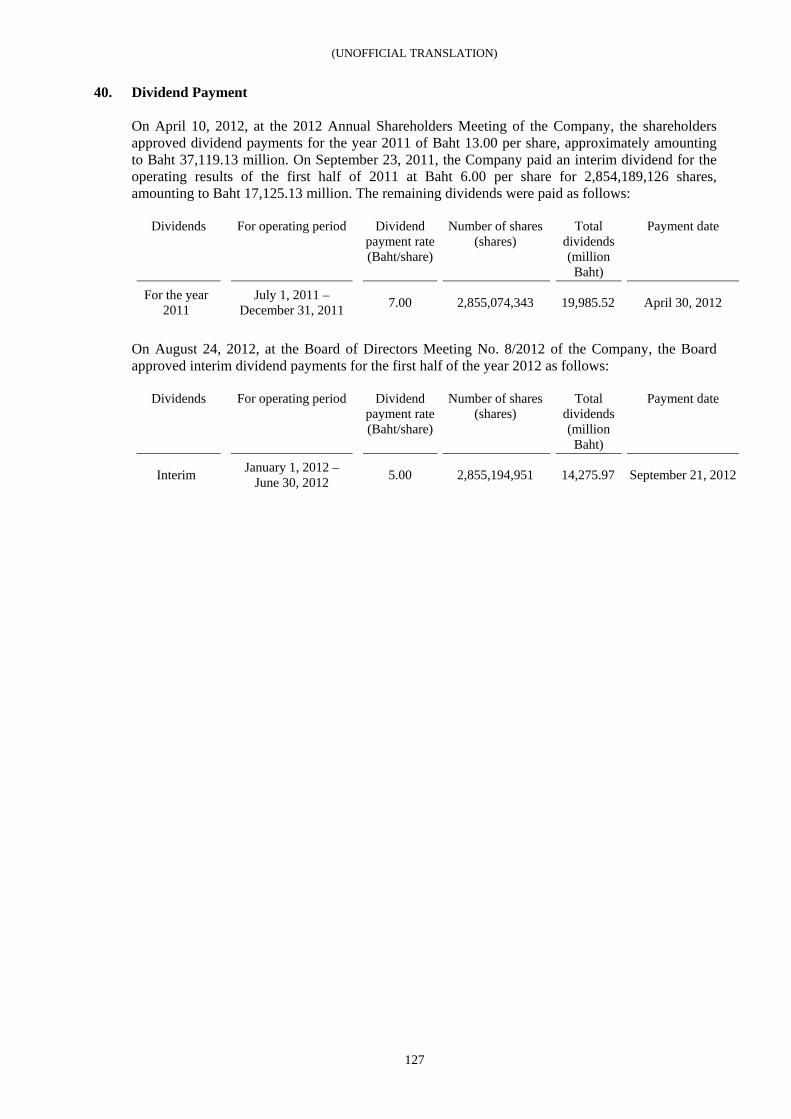
(UNOFFICIAL TRANSLATION)
127
40. Dividend Payment On April 10, 2012, at the 2012 Annual Shareholders Meeting of the Company, the shareholders approved dividend payments for the year 2011 of Baht 13.00 per share, approximately amounting to Baht 37,119.13 million. On September 23, 2011, the Company paid an interim dividend for the operating results of the first half of 2011 at Baht 6.00 per share for 2,854,189,126 shares, amounting to Baht 17,125.13 million. The remaining dividends were paid as follows:
Dividends
For operating period
Dividend payment rate (Baht/share)
Number of shares (shares)
Total dividends (million Baht)
Payment date
For the year 2011
July 1, 2011 – December 31, 2011 7.00 2,855,074,343 19,985.52 April 30, 2012
On August 24, 2012, at the Board of Directors Meeting No. 8/2012 of the Company, the Board approved interim dividend payments for the first half of the year 2012 as follows:
Dividends
For operating period
Dividend payment rate (Baht/share)
Number of shares (shares)
Total dividends (million Baht)
Payment date
Interim January 1, 2012 – June 30, 2012 5.00 2,855,194,951 14,275.97 September 21, 2012
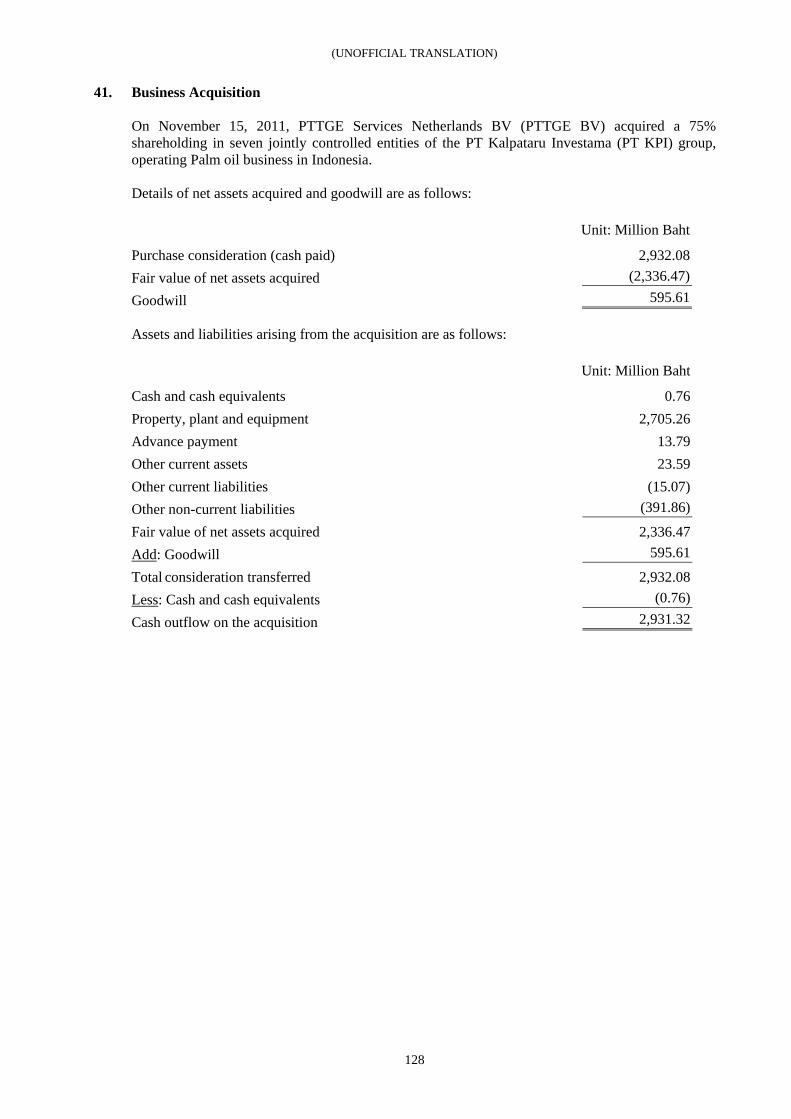
(UNOFFICIAL TRANSLATION)
128
41. Business Acquisition On November 15, 2011, PTTGE Services Netherlands BV (PTTGE BV) acquired a 75% shareholding in seven jointly controlled entities of the PT Kalpataru Investama (PT KPI) group, operating Palm oil business in Indonesia. Details of net assets acquired and goodwill are as follows: Unit: Million Baht Purchase consideration (cash paid) 2,932.08 Fair value of net assets acquired (2,336.47)
Goodwill 595.61 Assets and liabilities arising from the acquisition are as follows: Unit: Million Baht
Cash and cash equivalents 0.76 Property, plant and equipment 2,705.26 Advance payment 13.79 Other current assets 23.59 Other current liabilities (15.07)
Other non-current liabilities (391.86)
Fair value of net assets acquired 2,336.47 Add: Goodwill 595.61
Total consideration transferred 2,932.08 Less: Cash and cash equivalents (0.76)
Cash outflow on the acquisition 2,931.32
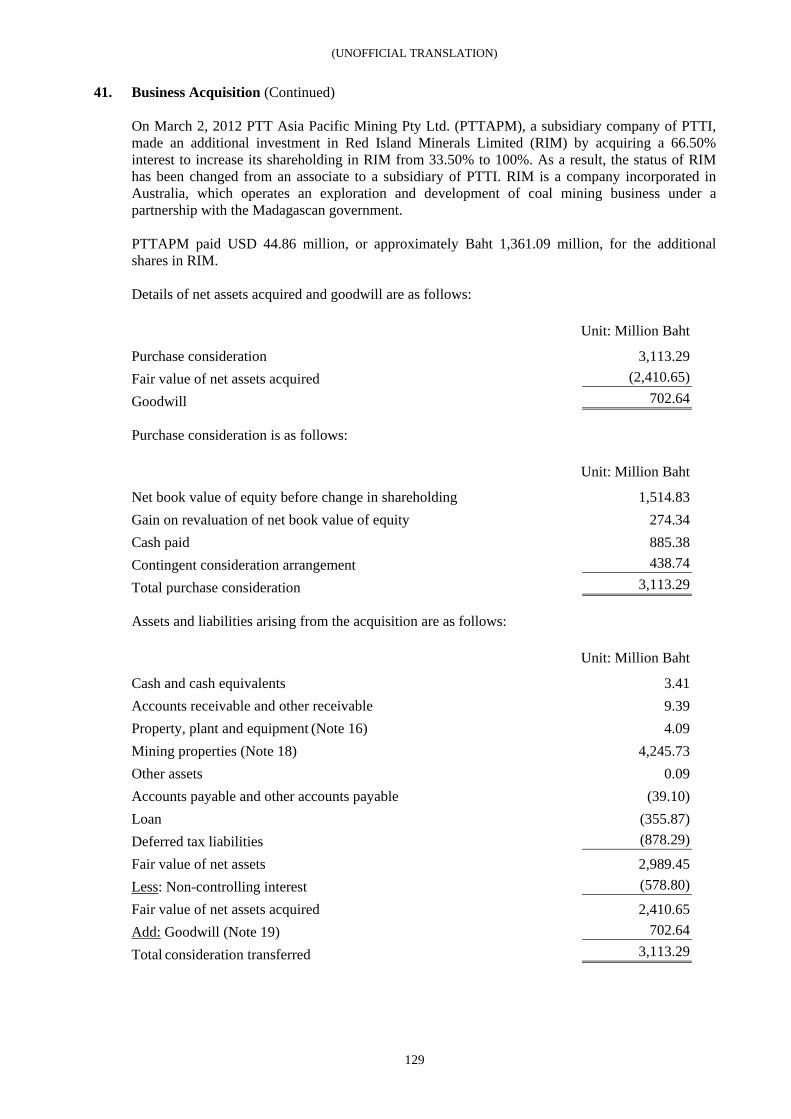
(UNOFFICIAL TRANSLATION)
129
41. Business Acquisition (Continued) On March 2, 2012 PTT Asia Pacific Mining Pty Ltd. (PTTAPM), a subsidiary company of PTTI, made an additional investment in Red Island Minerals Limited (RIM) by acquiring a 66.50% interest to increase its shareholding in RIM from 33.50% to 100%. As a result, the status of RIM has been changed from an associate to a subsidiary of PTTI. RIM is a company incorporated in Australia, which operates an exploration and development of coal mining business under a partnership with the Madagascan government. PTTAPM paid USD 44.86 million, or approximately Baht 1,361.09 million, for the additional shares in RIM. Details of net assets acquired and goodwill are as follows: Unit: Million Baht
Purchase consideration 3,113.29 Fair value of net assets acquired (2,410.65)
Goodwill 702.64 Purchase consideration is as follows: Unit: Million Baht
Net book value of equity before change in shareholding 1,514.83 Gain on revaluation of net book value of equity 274.34 Cash paid 885.38
Contingent consideration arrangement 438.74
Total purchase consideration 3,113.29 Assets and liabilities arising from the acquisition are as follows: Unit: Million Baht
Cash and cash equivalents 3.41 Accounts receivable and other receivable 9.39 Property, plant and equipment (Note 16) 4.09 Mining properties (Note 18) 4,245.73
Other assets 0.09 Accounts payable and other accounts payable (39.10) Loan (355.87) Deferred tax liabilities (878.29)
Fair value of net assets 2,989.45 Less: Non-controlling interest (578.80)
Fair value of net assets acquired 2,410.65 Add: Goodwill (Note 19) 702.64
Total consideration transferred 3,113.29
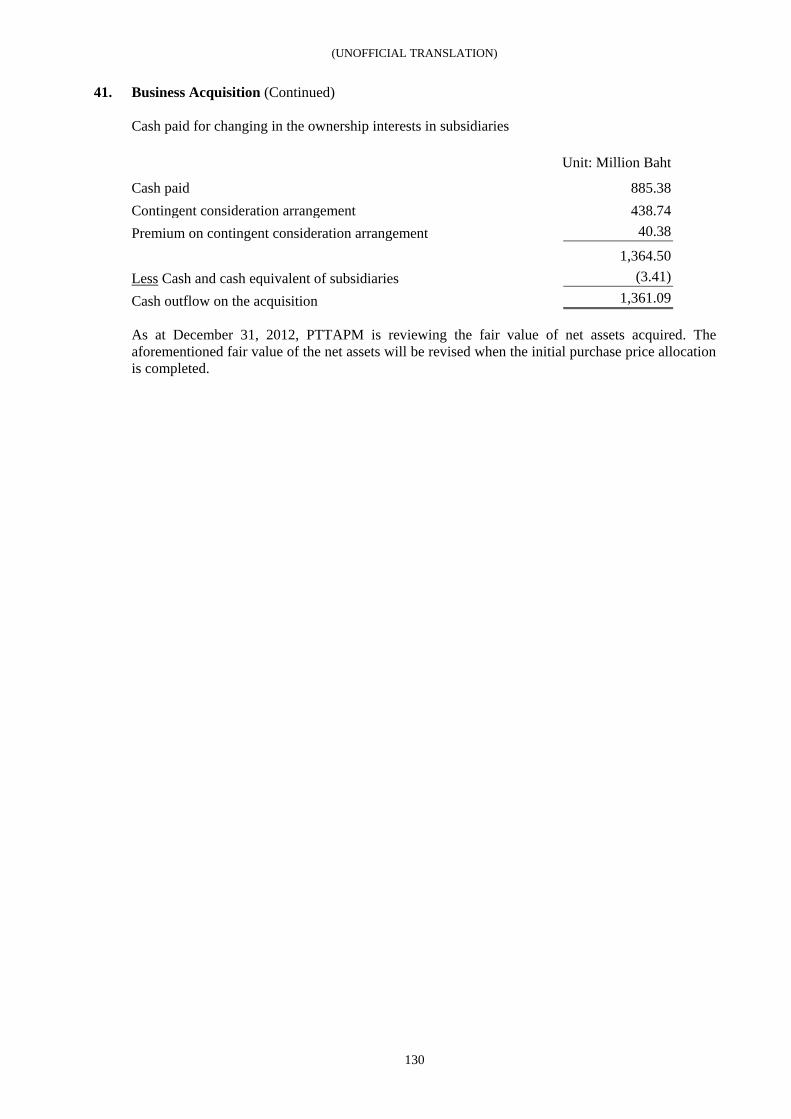
(UNOFFICIAL TRANSLATION)
130
41. Business Acquisition (Continued) Cash paid for changing in the ownership interests in subsidiaries Unit: Million Baht
Cash paid 885.38 Contingent consideration arrangement 438.74 Premium on contingent consideration arrangement 40.38
1,364.50 Less Cash and cash equivalent of subsidiaries (3.41)
Cash outflow on the acquisition 1,361.09 As at December 31, 2012, PTTAPM is reviewing the fair value of net assets acquired. The aforementioned fair value of the net assets will be revised when the initial purchase price allocation is completed.
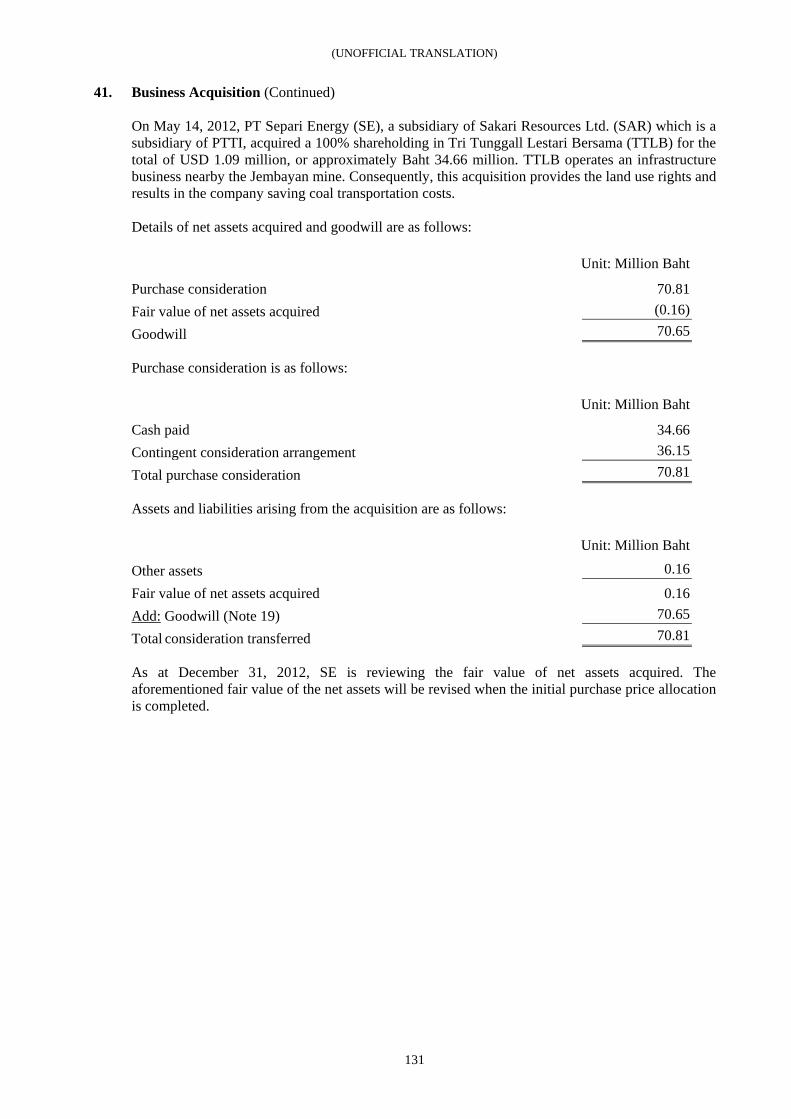
(UNOFFICIAL TRANSLATION)
131
41. Business Acquisition (Continued) On May 14, 2012, PT Separi Energy (SE), a subsidiary of Sakari Resources Ltd. (SAR) which is a subsidiary of PTTI, acquired a 100% shareholding in Tri Tunggall Lestari Bersama (TTLB) for the total of USD 1.09 million, or approximately Baht 34.66 million. TTLB operates an infrastructure business nearby the Jembayan mine. Consequently, this acquisition provides the land use rights and results in the company saving coal transportation costs. Details of net assets acquired and goodwill are as follows: Unit: Million Baht
Purchase consideration 70.81 Fair value of net assets acquired (0.16)
Goodwill 70.65 Purchase consideration is as follows: Unit: Million Baht
Cash paid 34.66 Contingent consideration arrangement 36.15
Total purchase consideration 70.81 Assets and liabilities arising from the acquisition are as follows: Unit: Million Baht
Other assets 0.16
Fair value of net assets acquired 0.16 Add: Goodwill (Note 19) 70.65
Total consideration transferred 70.81 As at December 31, 2012, SE is reviewing the fair value of net assets acquired. The aforementioned fair value of the net assets will be revised when the initial purchase price allocation is completed.
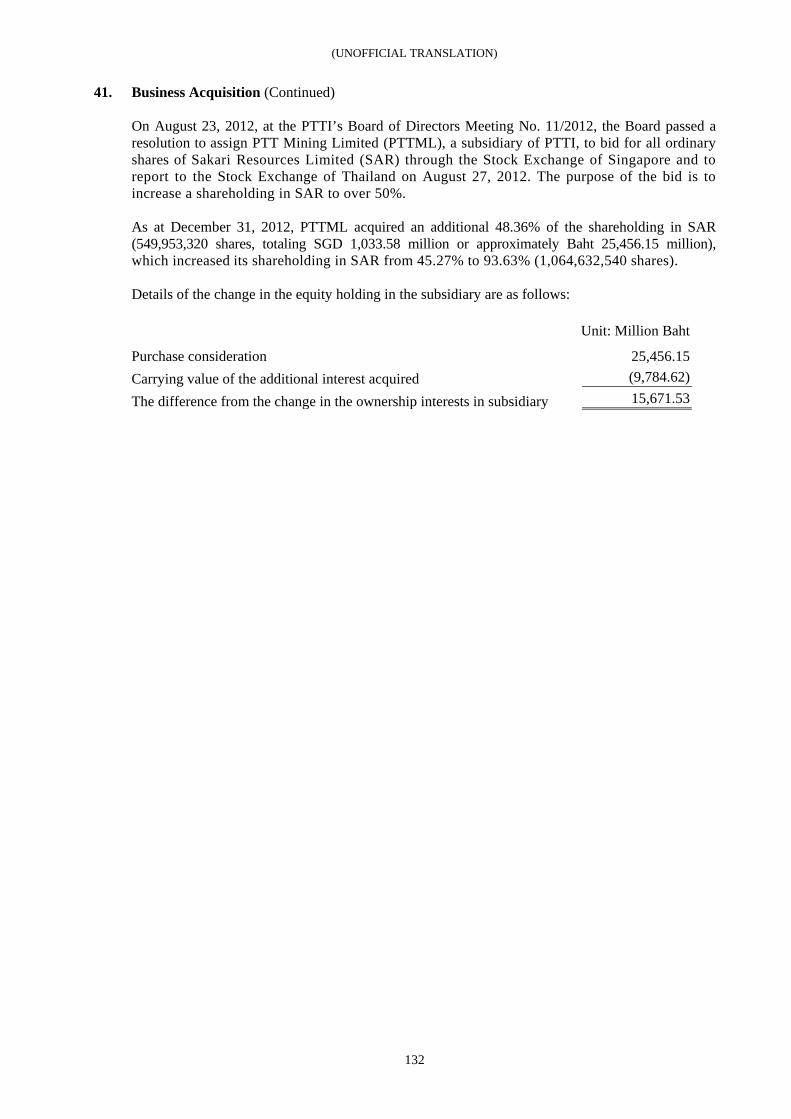
(UNOFFICIAL TRANSLATION)
132
41. Business Acquisition (Continued) On August 23, 2012, at the PTTI’s Board of Directors Meeting No. 11/2012, the Board passed a resolution to assign PTT Mining Limited (PTTML), a subsidiary of PTTI, to bid for all ordinary shares of Sakari Resources Limited (SAR) through the Stock Exchange of Singapore and to report to the Stock Exchange of Thailand on August 27, 2012. The purpose of the bid is to increase a shareholding in SAR to over 50%. As at December 31, 2012, PTTML acquired an additional 48.36% of the shareholding in SAR (549,953,320 shares, totaling SGD 1,033.58 million or approximately Baht 25,456.15 million), which increased its shareholding in SAR from 45.27% to 93.63% (1,064,632,540 shares). Details of the change in the equity holding in the subsidiary are as follows: Unit: Million Baht
Purchase consideration 25,456.15 Carrying value of the additional interest acquired (9,784.62)
The difference from the change in the ownership interests in subsidiary 15,671.53
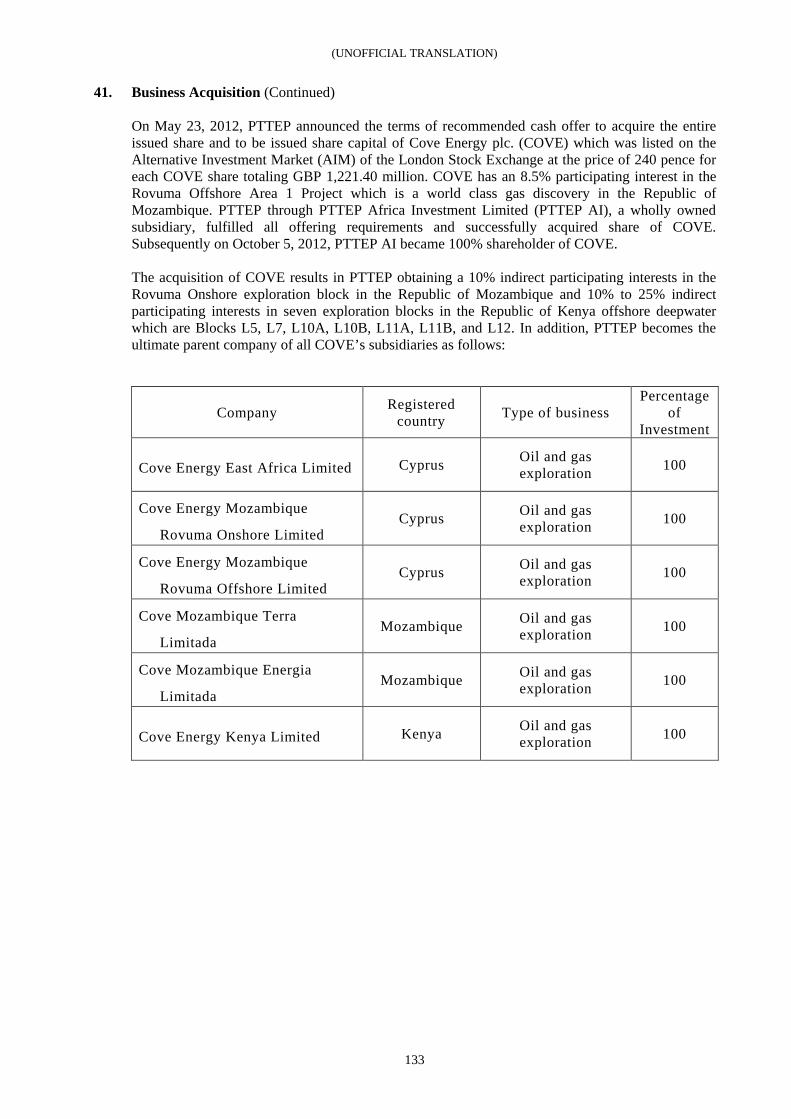
(UNOFFICIAL TRANSLATION)
133
41. Business Acquisition (Continued) On May 23, 2012, PTTEP announced the terms of recommended cash offer to acquire the entire issued share and to be issued share capital of Cove Energy plc. (COVE) which was listed on the Alternative Investment Market (AIM) of the London Stock Exchange at the price of 240 pence for each COVE share totaling GBP 1,221.40 million. COVE has an 8.5% participating interest in the Rovuma Offshore Area 1 Project which is a world class gas discovery in the Republic of Mozambique. PTTEP through PTTEP Africa Investment Limited (PTTEP AI), a wholly owned subsidiary, fulfilled all offering requirements and successfully acquired share of COVE. Subsequently on October 5, 2012, PTTEP AI became 100% shareholder of COVE. The acquisition of COVE results in PTTEP obtaining a 10% indirect participating interests in the Rovuma Onshore exploration block in the Republic of Mozambique and 10% to 25% indirect participating interests in seven exploration blocks in the Republic of Kenya offshore deepwater which are Blocks L5, L7, L10A, L10B, L11A, L11B, and L12. In addition, PTTEP becomes the ultimate parent company of all COVE’s subsidiaries as follows:
Company Registered country Type of business
Percentage of
Investment
Cove Energy East Africa Limited Cyprus Oil and gas exploration 100
Cove Energy Mozambique
Rovuma Onshore Limited Cyprus Oil and gas
exploration 100
Cove Energy Mozambique
Rovuma Offshore Limited Cyprus Oil and gas
exploration 100
Cove Mozambique Terra
Limitada Mozambique Oil and gas
exploration 100
Cove Mozambique Energia
Limitada Mozambique Oil and gas
exploration 100
Cove Energy Kenya Limited Kenya Oil and gas exploration 100
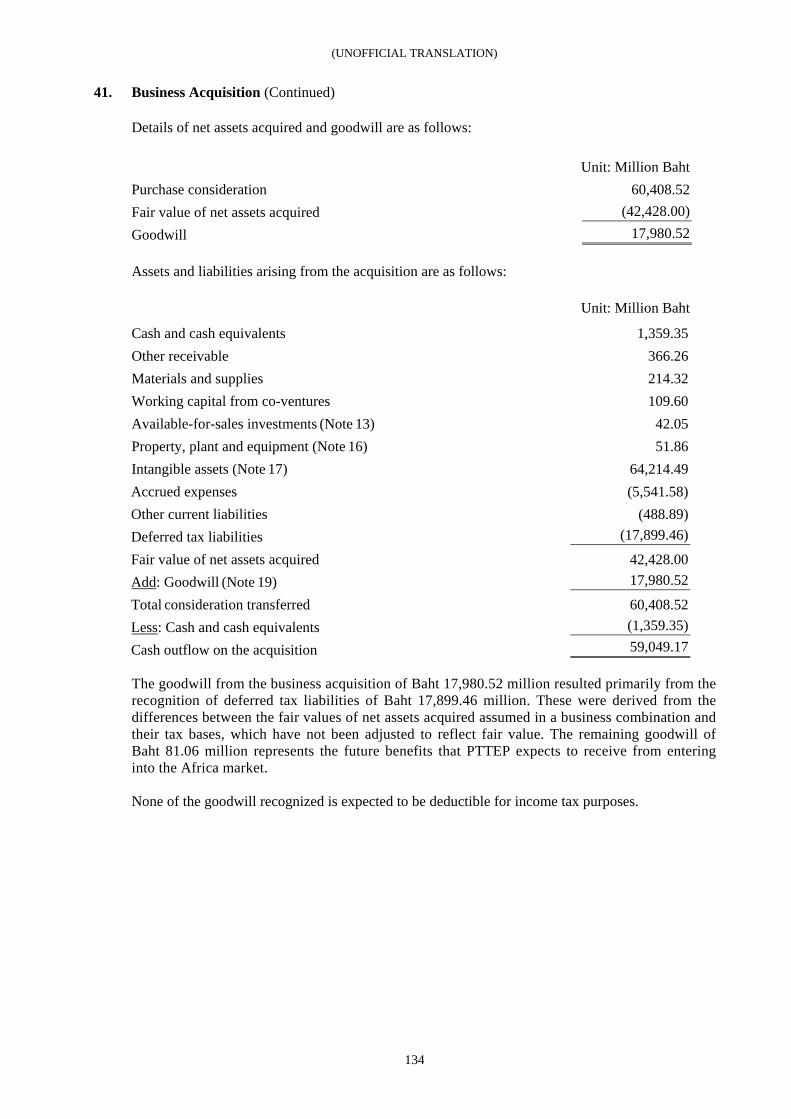
(UNOFFICIAL TRANSLATION)
134
41. Business Acquisition (Continued) Details of net assets acquired and goodwill are as follows:
Unit: Million Baht Purchase consideration 60,408.52 Fair value of net assets acquired (42,428.00) Goodwill 17,980.52 Assets and liabilities arising from the acquisition are as follows: Unit: Million Baht
Cash and cash equivalents 1,359.35 Other receivable 366.26 Materials and supplies 214.32 Working capital from co-ventures 109.60 Available-for-sales investments (Note 13) 42.05 Property, plant and equipment (Note 16) 51.86 Intangible assets (Note 17) 64,214.49 Accrued expenses (5,541.58) Other current liabilities (488.89) Deferred tax liabilities (17,899.46)
Fair value of net assets acquired 42,428.00 Add: Goodwill (Note 19) 17,980.52
Total consideration transferred 60,408.52 Less: Cash and cash equivalents (1,359.35)
Cash outflow on the acquisition 59,049.17 The goodwill from the business acquisition of Baht 17,980.52 million resulted primarily from the recognition of deferred tax liabilities of Baht 17,899.46 million. These were derived from the differences between the fair values of net assets acquired assumed in a business combination and their tax bases, which have not been adjusted to reflect fair value. The remaining goodwill of Baht 81.06 million represents the future benefits that PTTEP expects to receive from entering into the Africa market. None of the goodwill recognized is expected to be deductible for income tax purposes.
(UNOFFICIAL TRANSLATION)
135
42. Promotional Privileges The Company has received promotional privileges for the following activities from the Board of Investment (BOI) under the Investment Act, B.E. 2520 (1977). the Gas Separation Plant Unit#5 project the third gas offshore and onshore pipeline project the Sai Noi-South Bangkok Power Plant gas pipeline project the Songkhla Power Plant gas pipeline project the Ethane Separation Plant project the Gas Separation Plant Unit#6 project the gas distribution pipelines to the Rojana Industrial Park project the Power and Steam Production for Bangchak Refinery project the North Bangkok Power Plant gas pipeline project the Rayong-Kangkoi gas pipeline project the improvement of production efficiency in energy and environmental aspect project the plastic product and production process research and development project The promotional privileges include: exemption from import duties on machinery approved by the BOI exemption from corporate income tax on net income from the promoted business for periods of
three years and eight years starting from the date on which the income is first derived from such operations.
During the year 2012, the Company utilizes the privileges for the Ethane Separation Plant project, the Gas Separation Plant Unit#6 project and the Power and Steam Production for Bangchak Refinery project. The sales from the promoted and non-promoted businesses for the years ended December 31, 2012 and 2011 are as follows: Unit : Million Baht Separate
financial statements 2012 2011
Promoted businesses 144,982.16 139,690.29
Non-promoted businesses 2,408,518.80 2,057,864.76
Total 2,553,500.96 2,197,555.05 Some subsidiaries and jointly controlled entities received the following promotional privileges from the BOI under the Investment Act, B.E. 2520 (1977). PTTPL received Category 7.7 promotional privileges for its international merchandise distribution centre with modern system. The promotional privileges include exemption from import duties on the machinery approved by the BOI and corporate income tax exemption on the net income from the promoted business for five years starting from the date on which income is first derived from such operations.
CHPP received Category 7.1 promotional privileges for its electricity and cool water production. The promotional privileges include exemption from import duties on the machinery approved by the BOI and corporate income tax exemption on the net income from the promoted business for eight years starting from the date on which income is first derived from such operations.
(UNOFFICIAL TRANSLATION)
136
42. Promotional Privileges (Continued) LNG received Category 7.1 promotional privileges for its liquefied natural gas transfer business. The promotional privileges include exemption from import duties on the machinery approved by the BOI, exemption from corporate income tax on the net income from the promoted business for eight years starting from the date on which income is first derived from such operations, and exemption from 50% corporate income tax on the net income from the promoted business for five years starting from the expiry date of the corporate income tax exemption. HMC received promotional privileges for its business with respect to the production of chemicals from petroleum. The promotional privileges include exemption from various taxes and duties and corporate income tax exemption on the net income from promoted business for eight years starting from the date on which the income is first derived from such operations, and 50% corporate income tax exemption on the net income from the promoted business for five years starting from the expiry date of the corporate income tax exemption period. TTM-T received Category 7.1 promotional privileges for its public utility and basic services business, Category 7.2 privileges for its mass transit systems and transportation of bulk products and Category 7.7 privileges for its natural gas transmission pipeline business. The promotional privileges include exemption from various taxes and duties and corporate income tax exemption. DCAP received Category 7.1 promotional privileges for its public utility and basic services business. The promotional privileges include exemption from various taxes and duties and corporate income tax exemption on the net income from promoted business for eight years starting from the date on which income is first derived from such operations. PTTAC received promotional privileges for its Acrylonitrile, Ammonium Sulfure and Methyl Methacrylate production business. The promotional privileges include exemption from various taxes and duties and corporate income tax exemption on the net income from the promoted business for eight years starting from the date on which income is first derived from such operations. TANK received Category 7.1 promotional privileges for its overseas logistics business. The promotional privileges include exemption from various taxes and duties and corporate income tax exemption on up to 100% of the net income from the promoted business for eight years starting from the date on which income is first derived from such operations, and 50% corporate income tax exemption on the net income from the promoted business for five years starting from the expiry date of the corporate income tax exemption period. PTTPM received Category 7.8 promotional privileges for its international procurement business. The promotional privileges include exemption of import duty from machinery, material and supplies but exclude corporate income tax exemption. As the Group has received promotional privileges from the BOI, it has to comply with all conditions and regulations as stipulated in the promotional certificates.
(UNOFFICIAL TRANSLATION)
137
43. Proceeding regarding the Central Administrative Court’s Ordering Temporary Suspension of Projects in Map Ta Phut Area On June 19, 2009, the 43 petitioners leading by the Stop Global Warming Association filed a complaint with the Central Administrative Court (the Court) as the black case no. 908/2552, against eight government agencies, together with a motion seeking the Court injunction to temporarily suspend all operations and activities of 76 industrial projects in the Map Ta Phut area in Rayong province. On September 29, 2009, the Court ordered the temporary injunction by requiring the eight accused government agencies to issue the order to temporarily suspend all 76 projects pending the Court’s judgment or order otherwise, except for those projects or activities which received the permits before the effective date of the Constitution of Kingdom of Thailand B.E. 2550 (2007) or which were not required to prepare the Environmental Impact Assessment (EIA) reports pursuant to the Ministerial Announcement of Ministry of Natural Resources and Environment dated June 16, 2009. 25 projects of the Group were under the suspension order, and three of those 25 projects belonged to the Company. On October 16, 2009, the Group, as an interested person, submitted a motion to appeal the Court’s order to the Supreme Administrative Court. On December 2, 2009, the Supreme Administrative Court issued an order No.592/2552 amending the Court’s injunction by requiring the eight accused government agencies to order the temporary suspension of all projects or activities listed in the complaint except for 11 projects, which clearly, according to the Supreme Administrative Court, did not severely affect the community with respect to the quality if the environment, natural resources, and health but were projects intended to mitigate pollution or only additional installation to the existing projects. Among those 11 projects, seven of them belonged to the Group, comprising one project of the Company and six projects of the other companies in the Group. Two projects of the Company were still under the Court’s order to suspend. On December 18, 2009, the public prosecutor submitted the answer rejecting all allegations in the complaint. On September 2, 2010, the Court rendered a judgment revoking the permit of the projects listed in the complaint which, according to the law, were categorized as project that might severely affect the community with respect to the quality of environment, natural resources, and health and did not complied with the procedures set forth in Section 67 paragraph 2 of the Constitution. The revocation was effective as of the date of the judgment. 1 project of the Group is within the scope of the judgment. On October 1, 2010, the 43 prosecutors appealed the Court’s judgment to the Supreme Administrative Court. On December 7, 2010, the eight accused government agencies by the public prosecutors submitted a reply to the appeal. The appeal is currently under the consideration of the Supreme Administrative Court.
44. Proceeding regarding the Offshore Natural Gas Pipeline Leakage Incident The company hired a pipeline construction contractor for the construction of offshore pipeline project situated in the Gulf of Thailand. During the construction, the contractor committed wrongful act and breach of contract causing damage to the Company. Subsequently, the Company forwarded relevant evidence to the Office of the Attorney General to consider filing lawsuit with the court seeking damages from the contractor. After considering the evidence, the public prosecutor assigned to the case submitted the complaint with the Civil Court. At present, the case is in the Civil Court’s proceedings.
(UNOFFICIAL TRANSLATION)
138
45. Commitments and Contingent Liabilities Significant changes in commitments and contingent liabilities are as follows:
45.1 Commitments to subsidiaries, jointly controlled entities, associates and other related companies are as follows: 45.1.1 The Group has provided loans to its subsidiaries and associates with credit limits totaling
Baht 84,464.52 million. As at December 31, 2012, the Group made payments in respect of these loans totaling Baht 76,858.68 million. The remaining credit limits were Baht 7,605.84 million.
45.1.2 The Company has obligations under a commercial credit agreement with an overseas
subsidiary that provide an extended credit term for purchases of raw materials under a credit limit of USD 100 million. As at December 31, 2012, the subsidiary has drawn down USD 94.53 million of the commercial credit. The remaining commercial credit line was USD 5.47 million or approximately Baht 168.35 million.
45.1.3 The Company entered into the Sponsor Support Agreements with three jointly controlled
entities with credit limits equal to the sum of the loan obligations to financial institutions of the three jointly controlled entities. Under these agreements, as at December 31, 2012, the Company had commitments of USD 367.29 million or approximately Baht 11,304.27 million.
45.1.4 The Company entered into the Sponsor Support Agreement with an associate, with a credit
limit equal to the sum of the loan obligations of the associate to financial institutions. Under the agreement, as at December 31, 2012, the Company had a commitment of Baht 1,028 million.
45.1.5 The Company had obligations under the Shareholder Agreements to pay for ordinary
shares in proportion to its shareholding. As at December 31, 2012, the Company had remaining obligations amounting to Baht 3,379.31 million.
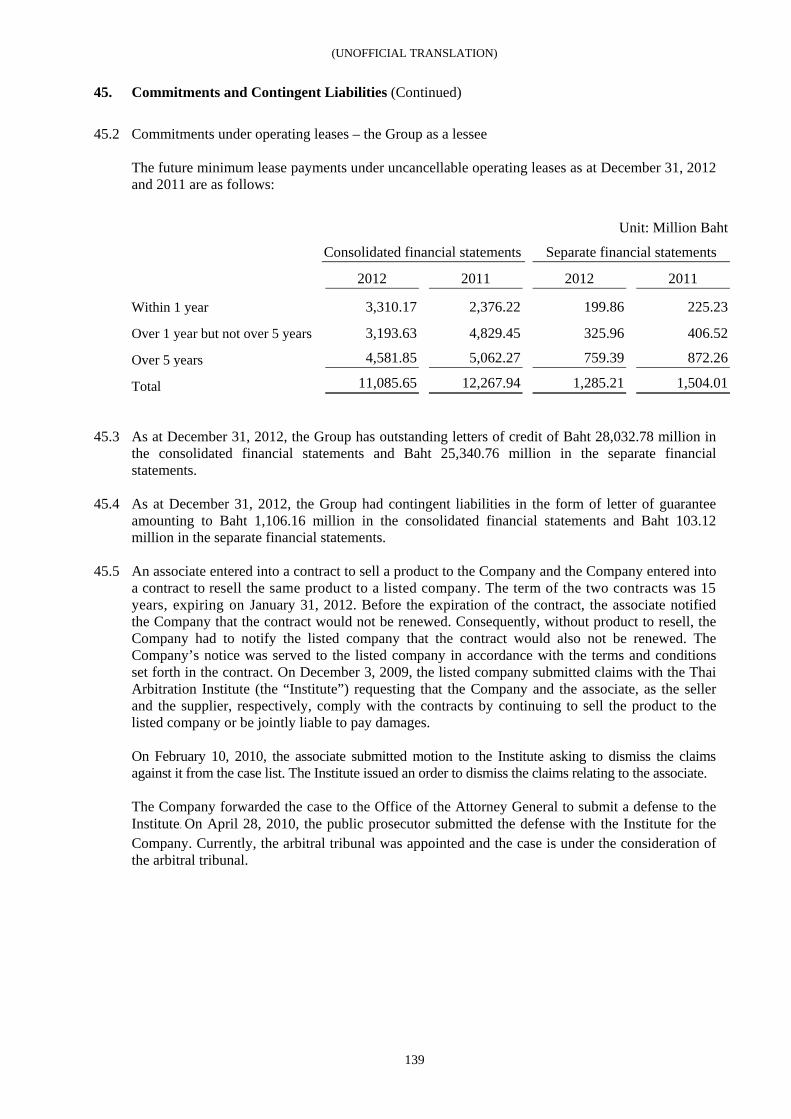
(UNOFFICIAL TRANSLATION)
139
45. Commitments and Contingent Liabilities (Continued)
45.2 Commitments under operating leases – the Group as a lessee The future minimum lease payments under uncancellable operating leases as at December 31, 2012 and 2011 are as follows:
Unit: Million Baht
Consolidated financial statements Separate financial statements
2012 2011 2012 2011
Within 1 year 3,310.17 2,376.22 199.86 225.23
Over 1 year but not over 5 years 3,193.63 4,829.45 325.96 406.52
Over 5 years 4,581.85 5,062.27 759.39 872.26
Total 11,085.65 12,267.94 1,285.21 1,504.01
45.3 As at December 31, 2012, the Group has outstanding letters of credit of Baht 28,032.78 million in the consolidated financial statements and Baht 25,340.76 million in the separate financial statements.
45.4 As at December 31, 2012, the Group had contingent liabilities in the form of letter of guarantee amounting to Baht 1,106.16 million in the consolidated financial statements and Baht 103.12 million in the separate financial statements.
45.5 An associate entered into a contract to sell a product to the Company and the Company entered into a contract to resell the same product to a listed company. The term of the two contracts was 15 years, expiring on January 31, 2012. Before the expiration of the contract, the associate notified the Company that the contract would not be renewed. Consequently, without product to resell, the Company had to notify the listed company that the contract would also not be renewed. The Company’s notice was served to the listed company in accordance with the terms and conditions set forth in the contract. On December 3, 2009, the listed company submitted claims with the Thai Arbitration Institute (the “Institute”) requesting that the Company and the associate, as the seller and the supplier, respectively, comply with the contracts by continuing to sell the product to the listed company or be jointly liable to pay damages.
On February 10, 2010, the associate submitted motion to the Institute asking to dismiss the claims against it from the case list. The Institute issued an order to dismiss the claims relating to the associate. The Company forwarded the case to the Office of the Attorney General to submit a defense to the Institute. On April 28, 2010, the public prosecutor submitted the defense with the Institute for the Company. Currently, the arbitral tribunal was appointed and the case is under the consideration of the arbitral tribunal.
(UNOFFICIAL TRANSLATION)
140
45. Commitments and Contingent Liabilities (Continued)
45.6 On May 26, 2010 the contractor for an on-shore natural gas pipeline construction project (the “Contractor”) submitted claims to the Thai Arbitration Institute (the “Institute”) seeking overdue payment and damages from the Company for the work performed in connection with the project. The Company, however, considered that the submission of the claims was incompliant with the dispute resolution procedure agreed upon under the contract. Therefore, the Company filed an opposition to the Contractor’s claim submission with the Institute and reserved right to protest such contractually incompliant claim submission in the arbitration procedure. After the claim submission, the Central Bankruptcy Court ordered the Contractor be under an absolute receivership which rendered the official receiver to have sole power in any litigation pertaining to the Contractor’s assets. Subsequently, the Contractor’s official receiver has petitioned the Institute to substitute the Contractor in the dispute against the Company. In contention against the alleged claims, the Company submitted the defense together with counterclaims seeking damages from the Contractor. Currently, the arbitral tribunal has been appointed and the case is now under the consideration of the tribunal. Regarding the Contractor’s bankruptcy case, the Company submitted, as a creditor, a motion for receiving a debt payment in accordance with the law.
On September 8, 2010, the Contractor by the its official receiver submitted the claims to the Institute seeking overdue payment and damages from the Company for the work performed in connection with another pipeline construction project. The Company, however, considered that the submission of the claims was incompliant with the dispute resolution procedure agreed upon under the contract. Therefore, the Company filed an opposition to the Contractor’s claim submission with the Institute and reserved the right to protest such contractually incompliant claim submission in the arbitration procedure. In contention against the alleged claims, the Company submitted the defense together with counterclaims seeking damages from the Contractor. Currently, the arbitral tribunal has been appointed and the case is now under the consideration of the tribunal.
45.7 On September 22, 2011, six petitioners leading by the Thailand Watch Foundation filed a lawsuit against the Company and the Ministry of Finance with the Central Administrative Court (the Court) alleging that the Company’s privatization, the share distribution and the asset evaluation were in violation of law, and therefore, asked for the Court’s judgment that the sale of the Company’s shares be null and void and the shares be resold. The petitioners also asked that the shares in oil refinery plants owned by the Company be returned to state ownership or be sold to the public in order to cease the Company’s monopoly in the oil refinery industry. In addition, the petitioners sought the Court’s order of the confiscation of the Company’s properties, which had been obtained by operation of public law or the force-sale of the Company’s gas separation plants to discontinue the monopoly. In response, the Company rejected all allegations and the Company by the public prosecutor submitted the answer and additional answer with the Court. Currently, the case is under the consideration of the Court.
45.8 On August 26, 2010, PTTEP Australasia Pty Ltd (PTTEP AA) received a letter from the
Government of Indonesia claiming for compensation in relation to the oil and gas leak incident in the Montara area under the PTTEP Australasia’s project. Subsequently, on September 1, 2010, PTTEP AA submitted a letter rejecting the claim for compensation from the Indonesian Government because no verifiable scientific evidence provided by the Indonesian Government to support the claim. Currently, the discussion with the Indonesian Government is on-going and the compensation regarding this matter has not been finalized.
(UNOFFICIAL TRANSLATION)
141
46. Other Event
On July 4, 2012, a fire broke out at the Kerosene Stripper in Crude Distillation Unit 3, at the Bangchak refinery on Sukhumvit 64 Rd. The stripper had a production capacity of 80,000 barrels per day. As at December 31, 2012, the insurance company already paid some compensation. The management of Bangchak Petroleum Public Co.,Ltd (BCP) believes that the losses are fully compensable.
47. Events after the Reporting Period 47.1 The amalgamation of PTT Utility Company Limited and Independent Power (Thailand) Company
Limited was completed on January 10, 2013. The name of the merged company is Global Power Synergy Company Limited and PTT holds 30.10% of shares in the merged company.
47.2 On January 31, 2013, PTT International Company Limited (PTTI, a wholly-owned subsidiary of
PTT) via its wholly-owned subsidiary PTT International Company Limited (PTTIH) agreed to jointly invest in Nam Lik 1 Power Company Limited (NL1PC) for the development of Nam Lik 1 Power project in Lao People’s Democratic Republic. The initial registered capital of the company is USD 200,000 comprising 20,000 shares at USD 10 each. PTTIH holds 8,000 shares, equivalent to 40% investment proportion.
47.3 On February 22, 2013, the Company’s Board of Directors passed a resolution to propose to the
Annual General Meeting of the Company’s shareholders for approval a dividend payment of Baht 13.00 per share for 2012. On September 21, 2012 the Company paid an interim dividend of Baht 5.00 per share as described in Note 40. Accordingly, the remaining dividend of Baht 8.00 per share or approximately Baht 22,850 million will be proposed for approval by the Annual General Meeting of the Company’s shareholders for the year 2013.
47.4 The board of directors of the Company approved these financial statements for public issuance on
February 22, 2013.