provision of technical support/services for an … 8: forecasts of crude prices to 2030 (doe/iea)...
TRANSCRIPT

A project financed by the Ministry of Foreign Affairs of Denmark
Provision of Technical Support/Services for an Economical, Technological and Environmental Impact Assessment of National Regulations and Incentives for
Renewable Energy and Energy Efficiency
Country Report Egypt
September 2009, revised April 2004
Norsk-Data-Str. 1
61352 Bad Homburg, Germany
Tel: +49-6172-9460-103, Fax. +49-6172-9460-20
eMail: [email protected]
http://www.mvv-decon.com
Döppersberg 19
42103 Wuppertal, Germany
Tel: +49-202-2492-0, Fax: +49-202-2492-108
eMail: [email protected]
http://www.wupperinst.org

Economical, Technological and Environmental Impact Assessment of National
Regulations and Incentives for RE and EE: Country Report Egypt
Egypt.doc
Table of Contents Page
1. Project Synopsis 1
2. Summary of Energy Situation in Egypt 2
3. The Energy Policy Process in Egypt 3
3.1 Law 3
3.2 Presidential decree 4
3.3 Prime Minister decree 4
3.4 Ministerial decree 4
3.5 Egypt's Need and Motivation for Energy and Environment related Legislation 4
3.6 Towards Energy Legislation in Egypt 5
4. Comparison of Egyptian Practice with International Practice in Energy Efficiency 7
4.1 Strategy 7
4.2 Legal Reform 7
4.3 Price Reform 8
4.4 An Agency 9
4.5 Standards and/or Labels 10
4.6 Financial Incentives 11
4.7 Obligations 12
4.8 Audits and the Promotion of ESCOs 13
4.9 Transport and Spatial Planning 13
4.10 Information 14
5. Comparison of Egyptian Practice with International Practice in Renewable Energy 15
5.1 Targets and Strategy 15
5.2 Legal Reform 15
5.3 An Agency 16
5.4 Standards and /or Labels 17
5.5 Financial Incentives (Capital Support) 17
5.6 Feed-in Tariffs and Obligations 18
5.7 Information 19
5.8 Industrial Policy 19
6. Case Studies 20
6.1 Case Study on Energy Efficiency Obligation 20
6.1.1 Background 20
6.1.1.1 Description of Policy 20
6.1.1.2 Assumptions 20
6.1.2 Cost-Benefit Analysis 24
6.1.2.1 Scope of the Analysis 24
6.1.2.2 Cost for Energy Efficiency Technologies 24
6.1.2.3 Perspective of the Country 26
6.1.2.4 Perspective of the Utility 27
6.1.2.5 Perspective of the Electricity User 28
6.1.3 Conclusion - 32 -
6.2 Case Study on Competitive Bidding for Wind Energy - 33 -

Economical, Technological and Environmental Impact Assessment of National
Regulations and Incentives for RE and EE: Country Report Egypt
Egypt.doc
Table of Contents Page
6.2.1 Background and Context - 33 -
6.2.1.1 Promotion of Private Investment in Wind Energy in Egypt - 33 -
6.2.1.2 Scope of the Case Study - 33 -
6.2.2 Comparison of Policy Instruments for the Promotion of Wind Power - 34 -
6.2.2.1 General Context - 34 -
6.2.2.2 Competitive Bidding - 35 -
6.2.2.3 Feed-in Tariff - 36 -
6.2.2.4 Evidence Based Policy - 36 -
6.2.2.5 Result of the Comparison 46
6.2.3 Economic Cost-Benefit Assessment 50
6.2.3.1 Methodology Applied 50
6.2.3.2 Assumptions and Data Base 50
6.2.3.3 Result of the Assessment 55
6.2.3.4 Variation Gas Prices and Return on Equity Expectations 56
6.2.3.5 Carbon Credits 57
6.2.4 Conclusion 59
6.2.4.1 The Methodology 59
6.2.4.2 Policy instruments for wind 59
7. Institutional Reform - Some Possibilities 61
List of Annexes
Annex 1: Mission Report
Annex 2: List of Stakeholders
Annex 3: Seminar Programme
Annex 4: Data Matrix
Annex 5: Presentation on Methodology
Annex 6: Preview on Training
Annex 7: Energy Situation in Egypt
List of Tables
Table 1: Behavioural Model of Energy Efficiency Obligation and Associated Indicators, Risks and
Assumptions
Table 2: Cost Data for Energy Efficiency Measures
Table 3: Cost Benefit Analysis
Table 4: Behavioural Model of Competitive Bidding for Wind IPP and Associated Indicators, Risks
and Assumptions
Table 5: Behavioural Model of Feed-In Tariff for Wind IPP
Table 6: Criteria for Choice among Options
Table 7: Data for Wind Energy
Table 8: Data for Combined Cycle Gas Turbine (CCGT)
Economical, Technological and Environmental Impact Assessment of National
Regulations and Incentives for RE and EE: Country Report Egypt
Egypt.doc
Table 9: Wind Energy - Economic Assessment Criteria
Table 10: Wind Energy - Impact of Gas Prices and IPP Wind Return Requirements
Table 11: Wind Energy - Economic Assessment Criteria with Carbon Credits (Base Case)
Table 12: Wind Energy - Economic Assessment Criteria with Carbon Credits
Table 13: Categories of Customers
Table 14: The Kryamat Solar Thermal Project
List of Figures
Figure 1: The legislative Process
Figure 2: Energy Outlook
Figure 3: Country - Comparison of Total Unit Cost for EE Measures and Marginal Cost of Electricity
Supply
Figure 4: Utility - Comparison of Total Unit Cost for EE Measures and Marginal Cost of Electricity
Supply
Figure 5: Electricity - Comparison of Total Unit Cost for EE Measures and Marginal Cost of
Electricity Supply
Figure 7: US LNG Prices
Figure 8: Forecasts of Crude Prices to 2030 (DOE/IEA)
Figure 9: Derived Forecast of International LNG Prices
Figure 10: Forecast of Unit Costs for Wind Energy and CCGT-Natural Gas
Figure 11: Wind Energy Option - Net Cash-flow with Carbon Credits
Figure 12: Policy Cycle
Figure 13: Egypt's Future Energy Needs (Conservative Scenario)
Figure 14: Egypt's Future Energy Needs (Optimistic Scenario)
Figure 15: Oil Production in Egypt, 1990-2007
Figure 16: Natural Gas Production in Egypt, 1990-2007
Figure 17: The Current Electricity Market.
Figure 18: NREA and Private Sector up to 2020 Plan
List of Acronyms
RCREEE Regional Centre for Renewable Energy and Energy Efficiency
BRT Bus Rapid Transit
CCGT Combined Cycle Gas Turbine
CDM Clean Development Mechanism
CER Certified Emission Reduction
CFL Compact Fluorescent Lamp

Economical, Technological and Environmental Impact Assessment of National
Regulations and Incentives for RE and EE: Country Report Egypt
Egypt.doc
CNG Compressed Natural Gas
CTF Clean Technology Fund
DOE Department of Energy
DSM Demand Side Management
EBPM Evidence Based Policy Making
EE Energy Efficiency
EEHC Egyptian Electricity Holding Company
EETC Egyptian Electricity Transmission Company
EEUCPRA Egyptian Electricity Utility and Consumer Protection Regulatory
Agency
EHV Extra high voltage
EIA Energy Information Agency
EPC Energy Performance Contract
ESCO Energy Service Company
EU European Union
g gram
GCEEE Egyptian German High Level Joint Committee for Renewable Energy,
Energy Efficiency and Environmental Protection
GCMA Greater Cairo Metropolitan Area
GEF Global Environment Fund
GHG Green House Gas
GJ Giga Joule
GWh Giga Watt hours
HBRC Housing and Building Research Centre
HV High Voltage
IBRD International Bank for Reconstruction and Development (World Bank)
IDA International Development Agency

Economical, Technological and Environmental Impact Assessment of National
Regulations and Incentives for RE and EE: Country Report Egypt
Egypt.doc
IEA International Energy Agency
IISD International Institute for Sustainable Development
IPP Independent Power Producer
JICA Japanese International Cooperation Agency
kWh kilo Watt hours
LE Egyptian Pound
LNG Liquefied Natural Gas
LPG Liquefied Petroleum Gas
LRT Light Rail Transit
LV Low Voltage
MED-EMIP Euro-Mediterranean Energy Market Integration Project
MED-ENEC Euro-Med Project on Energy Efficiency in the Construction Sector
MENA Middle East and North Africa
MMBTU Million British Thermal Units
MOEE Ministry of Electricity and Energy
MV Medium Voltage
MW Megawatt
NET PV Net Present Value
NREA New and Renewable Energy Authority
OECD Organisation for Economic Cooperation and Development
OEP Organisation for Energy Planning
PPA Power Purchase Agreement
PSA Production Sharing Agreement
PURPA Public Utility Regulatory Policies Act
RE Renewable Energy
TBE Theory Based Evaluation

Economical, Technological and Environmental Impact Assessment of National
Regulations and Incentives for RE and EE: Country Report Egypt
Egypt.doc
toe tons of oil equivalent
UNDP United Nation Development Program
USAID United States Agency for International Development

- 1 -
Economical, Technological and Environmental Impact Assessment of National
Regulations and Incentives for RE and EE: Country Report Egypt
Egypt.doc
1. Project Synopsis
The "Regional Centre for Renewable Energies and Energy Efficiency (RCREEE)" was formally estab-
lished June 25, 2008 through the signing of the "Cairo Declaration of Intentions on Establishment of a
Regional Centre for Renewable Energies and Energy Efficiency (RCREEE)" by representatives of its
member states: Algeria, Egypt, Jordan, Lebanon, Libya, Morocco, Palestine, Syria, Tunisia and
Yemen. The overall objective of RCREEE is, through its interventions, to achieve:
a) rapid implementation of cost-effective policies and instruments for the increased penetration of re-
newable energy (RE) and energy efficiency (EE) technologies and practices in member countries;
and
b) increased market shares of companies and plants located in MENA-countries on the markets for
technologies and services related to RE and EE in the MENA and EU regions.
For the first five years of operation, RCREEE receives financial support from the Governments of
Egypt, Germany and Denmark. The European Commission (EC) supports RCREEE through two re-
gional programs: "MED-EMIP" and Phase II of "MED-ENEC". Member countries will contribute finan-
cially by increasingly co-financing the costs of the participation of national officials in RCREEE semi-
nars and workshops.
The present project is the first project support to RCREEE from the Danish Government. It is part of
RCREEE's overall effort of providing member state administrations with better information and new
planning tools and processes. It supports RECREEE in the development of a website which offers ac-
cess to a complete subject-ordered list of member state RE&EE laws and regulations, reviewed policy
documents, selected background and evaluation reports deemed to represent state-of-the art high
quality analytical work as well as discussion blogs on topics deemed to be of general interest for
RCREEE governments.
In parallel and supporting the above activities, the project has gathered the pertinent information on
EE and RE in each member country and made them available through the RCREEE website in an or-
ganised manner. Likewise the methodology on evidence based policy development and theory based
policy evaluation was discussed and extended in each country and their relevance and applicability il-
lustrated through case studies. On the basis of the country reports, a regional report was prepared to
allow policy makers and decision makers in all RCREEE member countries to see the status of their
EE and RE policies in a comprehensive regional context.
The activities were carried out by the project core team of four international experts assisted in each
country by a national specialist. Workshops were held by the national specialists at the end of the pro-
ject using the material and the methodological case studies developed throughout the project. The
national and regional reports were revised to take into account the comments received.
The following sections in this report reflect the impressions gained by the project team through the
discussions held during the course of the mission and all the information that has been available to the
team. The main purpose of this country paper is to stimulate new thought on EE and RE policy devel-
opment in Egypt.

- 2 -
Economical, Technological and Environmental Impact Assessment of National
Regulations and Incentives for RE and EE: Country Report Egypt
Egypt.doc
2. Summary of Energy Situation in Egypt
Over the past decade, Egypt has been moving away from being a net exporter of energy. The signifi-
cant reductions of net export in crude oil and petroleum products could only partly be offset by the in-
creasing exports of natural gas. Even under optimistic assumptions it is expected that by the year
2020, Egypt will need to import some 16% of the energy requirements.
The production of crude oil has declined from about 900,000 barrels per day in 1990 to some 750,000
barrels per day in 2007 and at the same time domestic consumption increased from 500,000 barrels
per day to 700,000 barrels per day. The production of natural gas increased to 45 billion cubic meters
in 2007, one third of this quantity was exported.
Electricity production is increasingly based on natural gas (CCGT-technology), while refineries are be-
ing upgraded to produce higher grades of fuel for transport purposes. 90% of generation capacity is
owned by the Egyptian Electricity Holding Company (EEHC), 9% by Independent Power Producers
and 1% is wind power generators owned by the New and Renewable Energy Authority (NREA). The
transmission system operator (EETC) acts as single buyer.
Energy Efficiency and the use of Renewable Energy Sources are regarded as important means to
stabilise the energy balance. NREA was established already in 1986 to promote renewable energy in
Egypt. Recognising the great wind power potential, NREA launched several wind power projects and
now has more than 430 MW installed capacity of wind power. Based on this experience the Supreme
Council of Energy in February 2008 approved a plan to satisfy 20% of the generated electricity from
renewable energy by 2020, including a 12% contribution from wind energy. This figure translates into
about 7200 MW of grid-connected wind farms and 8% contribution from other sources, mainly hydro
and solar energy.
The conditions for solar energy are excellent in Egypt with a radiation at most places well above 2,000
kWh per square meter and year. A first CSP project (140 MW) is under construction. The potential for
hydropower is fully utilised. Chapter 5 further discusses Egyptian practice in Renewable Energy in the
light of international experience.
The targets for energy efficiency which the government has adopted to be achieved by the year 2022
correspond to 20% of the final consumption in 2008. Industry has the highest efficiency potential,
which is about twice that of the transportation and the residential/commercial sectors each. The follow-
ing chapter 4 further discusses Egyptian practices in Energy Efficiency in the light of international ex-
perience.

- 3 -
Economical, Technological and Environmental Impact Assessment of National
Regulations and Incentives for RE and EE: Country Report Egypt
Egypt.doc
3. The Energy Policy Process in Egypt
Issuing legislation in Egypt follows defined processes; it is motivated by needs and that clearly the
case in energy related issues. The highest legislation level is the constitution, followed by laws, then
Presidential, Prime Minister and Ministerial decrees.
A draft for legislation is usually initiated/prepared by one or more stakeholders (government or non
government entities) in cooperation with other stakeholders; one of them, a governmental entity usu-
ally (lead/host), will be the formal umbrella for that draft legislation. Depending on the target of the
proposed legislation and its scope the required level of legislation is determined to be either a law or a
Presidential, Prime Minister or Ministerial decree.
3.1 Law
A law is issued after being discussed and ratified by the parliament; then a presidential decree is is-
sued to start the enforcement of the law. The following chart represents an outline for the procedure of
issuing a law; starting from possible stakeholders and ending up by issuing the law (a bottom up ap-
proach):
Figure 1: The Legislative Process
Stakeholders (NGOs, ministries, specialized committees, agencies, ..etc)
Process to issue a legislation in Egypt (Law)
a draft law
Ministry None ministerial Gov. entity
Shoura Assembly (discussions and ratification by members and specialized committees)
Mem
bers
of
Parl
iam
ent
Parliament (discussions and ratification by members and specialized committees)
President
A presidential decree issuing the law
Cabinet of ministers (internal discussions)
State Council(not a must)
• Different stakeholders work on preparing a draft for the law. Stakeholders can be one or more of the following, but not limited to: NGOs, ministries, specialized committees, none ministerial gov-ernment entities, agencies and similar.

- 4 -
Economical, Technological and Environmental Impact Assessment of National
Regulations and Incentives for RE and EE: Country Report Egypt
Egypt.doc
• The draft law is then presented possibly by a ministry or a none-ministerial governmental entity to the cabinet of ministers. It can be (but not necessarily will be) reviewed by the state council.
• Presentation of the draft law through the cabinet of ministers or directly from the president to the Shoura Assembly; were it is discussed by specialized committees; (Energy and industry commit-tee in case of an energy related law), the legislative committee as well as between the assembly members at large before it is ratified and sent to parliament (peoples assembly).
• The draft law in its approved form from the Shoura Assembly is forwarded to the parliament. A draft law can also be presented to the parliament by a group of its members, with a certain minimum number of parliament members required. In both cases the draft law is then discussed by specialized committees (Energy and industry committee in case of an energy related law), the legislative committee as well as by parliament members at large before it is ratified and sent for issuance through a presidential decree.
3.2 Presidential decree
A presidential decree is usually issued to address one or more of the following: • Issue of a law. • Formation of a governmental entity • Other issues.
An example of an energy related presidential decree was the establishment of the Egyptian Electric
Regulatory Agency and stating its mission. The presidential decree, usually addresses a large number
of stakeholders and target broad issues rather than details.
3.3 Prime Minister decree
A Prime Minster decree usually involves executive actions and addresses specific issues. An example
of that: is the appointment of the managing director of the Electric Regulatory Agency, another exam-
ple is the issuance of energy tariffs for end users supplied from state owned energy utilities.
3.4 Ministerial decree
A ministerial decree is usually the fastest regarding its issuance; after it is discussed by the different
stakeholders involved and after it has been reviewed by the legal department of the ministry. For a
ministerial decree, the scope of implementation, the group of activities and stakeholders it addresses
is usually very much focused. An example of that is the Ministerial decree for the enforcement of the
code of practice for energy labelling related matters.
3.5 Egypt's Need and Motivation for Energy and Environment related Legislation
Egypt's energy situation; past, current and future both on the supply and demand levels imply the
need to resort to renewable energies and energy efficiency, among a number of other resources, as a
first priority, to fulfil Egypt's energy needs over the next 15 years1. Figure 2 shows the ambitious aims
as of the time of the mission; they have since been further enhanced.
1 An energy strategy paper, prepared by the energy committee within the ruling party (National Democratic Party)
www.ndp.org.eg November 12007, NDP 9th general assembly.

- 5 -
Economical, Technological and Environmental Impact Assessment of National
Regulations and Incentives for RE and EE: Country Report Egypt
Egypt.doc
Figure 2: Energy Outlook
5 66 0
6 36 7
7 17 5
8 08 5
9 09 5
10 110 7
113
12 0
12 7
13 5
0
20
40
60
80
100
120
140
160
2006/ 07 2007/ 08 2008/ 09 2009/ 10 2010/ 11 2011/ 12 2012/ 13 2013/ 14 2014/ 15 2015/ 16 2016/ 17 2017/ 18 2018/ 19 2019/ 20 2020/ 21 2021/ 22
Fr om f uel pr oducts Fr om N.G. Fr om Hydr o Fr om Wind
Fr om Nuclear Local ener gy needs Local ener gy needs with ener gy ef f . Additional needed ener gy
Expected / Targeted Future Energy Status up 2022 (conservative)
Renewable - current 3000 MW and target 13500 MW (energy up 20%)
Nuclear up 4000-5000 MW
Reduce energy consumption by 8,3%
Retain Oil and NG levels of production
Additional energy needed to get from else
where (solar , bio-fuels,
interconnection & others)
3.6 Towards Energy Legislation in Egypt
Over the last three decades, a number of energy related activities towards resorting to the use of re-
newable energies and energy efficiency have taken place. These activities were manifested in some
of the following: • Carrying on a number of energy efficiency demonstration projects, leading to recommended en-
ergy strategies. • Proposed energy efficiency law. • Issuing few energy efficiency related codes. • Formulating a number of Ad Hoc Energy committees at ministerial levels as well as at NGO lev-
els. An example of that is the formation of: o The energy committee at the Federation of Egyptian Industries. o The Egyptian Energy Saving Council for Industry.
• Establishment of an energy planning organization which had great difficulties to full fill its mis-sion and eventually did not survive.
• Establishment of the New and Renewable Development Energy Authority. • Establishment of an electric regulatory Agency. • Formulation of a national energy committee. • Freeze and unfreeze energy prices. • Studies by national and international entities on Energy pricing and subsidies.
All of the aforementioned activities can be classified as stakeholders activities leading to the issuance
of a legislative document/action related to energy.
Most recently two distinct major activities evolved as follows:

- 6 -
Economical, Technological and Environmental Impact Assessment of National
Regulations and Incentives for RE and EE: Country Report Egypt
Egypt.doc
• The formulation of an energy efficiency unit at the cabinet of ministers; with the aim of coor-
dinating and stream lining national energy efficiency activities towards fulfilling the 8.3% re-duction in energy use by year 2022. That might evolve into the energy efficiency law and/or the establishment of an energy efficiency agency.
• Issuance of the proposed electricity law; (currently almost in front of the cabinet of ministers), which addresses a number of electricity related issues among which are efficient use of en-ergy and renewable energies.

- 7 -
Economical, Technological and Environmental Impact Assessment of National
Regulations and Incentives for RE and EE: Country Report Egypt
Egypt.doc
4. Comparison of Egyptian Practice with International Practice in Energy Ef-ficiency
Public policy intervenes to correct market failures, in the case of energy efficiency the most common
failures are: distorted energy prices, external costs, poor access to technical information, agent-
principal problems, budgetary constraints and excessive risk aversion, poor skills of investment ap-
praisal. Policy instruments are intended to correct or compensate for these distortions. The most
common among these instruments can be categorised as:
Corrective Measures
Price Reform
Institutional and legal reform
Labelling
Dissemination of information
Research, development and demonstration
Financial incentives
Support for energy service companies (ESCOs)
Compensating Measures
Standards
Mandatory measures (e.g. compulsory audits and management obligations)
Corporate agreements
Efficiency obligations
Transport and spatial planning
The following discussion of Egyptian practice as compared to international practice reflects this taxon-
omy.
4.1 Strategy
Strategy sets out objectives and targets and defines the combinations of policy instruments that are
expected to achieve the targets.
An 8.3% national energy savings target by the year 2022 has been set, corresponding to 20% of the
2007/2008 energy consumption. An energy efficiency unit in the cabinet of ministers has been estab-
lished to coordinate energy efficiency activities.
4.2 Legal Reform
The proper implementation of energy efficiency requires an energy efficiency law that justifies the pur-
pose of the activity, establishes a clear focus in government, assigns the responsibilities of actors, and
makes provision for an agency and specific instruments.
The following list contains the most frequently occurring provisions in such laws:
• Recognising energy efficiency as an appropriate subject of legislation and regulation
• Identifying and communicating in a policy document or national plan the principles of energy effi-
ciency policy
• Identifying through technical analysis the potential for saving and prioritizing the sectors with high-
est potential
• Defining policy interventions to promote energy efficiency e.g. fiscal and financial incentives, trad-

- 8 -
Economical, Technological and Environmental Impact Assessment of National
Regulations and Incentives for RE and EE: Country Report Egypt
Egypt.doc
able certificates, and regulations
• Drafting of legislation to implement policy interventions
• Setting penalties for default
• Creating institutional structures to promote energy efficiency
• Assigning staff in proper numbers and with proper qualifications to the institutions and ensuring
adequate finance for the institutions
• Drafting national programmes for short and long-term management of energy efficiency
• Assigning responsibility to promote energy efficiency at national, regional and municipal levels
• Monitoring and evaluating progress
There is no Energy Efficiency Law in Egypt at present. The UNDP / GEF project has proposed a draft
law, but it does not appear to have gained acceptance.
The draft Electricity Law contains a Chapter on Renewable Energy and Energy Utilization Efficiency
Improvement with some significant Articles that address cogeneration, DSM options including an obli-
gation on network licensees, standards and labelling. The provisions of the law are elaborated more
fully in the relevant sections below.
4.3 Price Reform
It is well established that energy demand is price sensitive, especially demand for electricity. The most
reliable results come from industrialised countries. Price reform will save large quantities of energy,
especially in the long-run and can make a substantial reduction in GHG emissions from countries with
distorted prices. Subsidies put a large strain on public accounts and weaken foreign trade balances.
They also tend to devastate the state-owned enterprises that are normally a victim of the practice.
Subsidies in Egypt are very large. They are made up of two main components; one is direct budgetary
subsidies made to compensate state enterprises for forced sales at low prices; the other is the prac-
tice of rolling up low cost own production with high cost supplies from foreign joint venture partners to
sell at low prices on the domestic market. The government sells its part of domestic production at be-
low-market prices to domestic consumers and purchases some of the share of the joint venture part-
ner at a much higher price specified in the production sharing contract price, again to sell at artificially
low prices in the domestic market. Only the second transaction appears in the budget and this is the
only recorded subsidy. The opportunity cost of the government's share in the PSA is an implicit sub-
sidy that is not recorded. Direct budgetary transfers for subsidies were 64.5bn LE in the 2007-2008
budget, up from 51bn LE in the previous year. In 2008-2009 the total fell to some 40 bn LE, because
of the fall in international prices. Indirect subsidies are probably comparable.
For several years, the government has planned to phase out energy subsidies, starting in 2004, when
electricity tariffs were increased for the first time since 1992. A number of Prime Ministerial Decrees
that have been issued between 2004 and February 2009 gradually increased energy prices for all
types of end users in an attempt to reach energy cost effective values. In February 2009 further in-
creases were frozen as an attempt to face the international economical crises, but it is expected that
by early 2010 the energy price increases will be resumed.
Petroleum product prices were also increased, including a 30-40 percent rise for high-octane gasoline
and a 46 percent rise for kerosene and diesel. To help compensate energy subsidies to transport, the
vehicle license fee was increased from a flat fee of LE 500 to 2 percent of the value of the vehicle. The
reforms were badly received by industry, and prompted concerns that the poor would be most affected
and that inflation would grow beyond the 14.4 percent mark recorded in 2008.

- 9 -
Economical, Technological and Environmental Impact Assessment of National
Regulations and Incentives for RE and EE: Country Report Egypt
Egypt.doc
In February 2009, this decision was largely reversed by Presidential Decree No. 446 on energy prices.
4.4 An Agency
Many countries have found it useful to establish a specialised institution to prepare initiatives, draft
regulations, monitor progress, ensure compliance, administer funds and perform other administrative
activities. It will not necessarily be the only institution with powers in the area. If fiscal incentives are
adopted then these will be managed through the office responsible for taxation, but there will still be a
need to confirm the technical acceptability of the investment. Compliance with standards for equip-
ment and boilers will normally be performed by special corps of inspectors already engaged in stan-
dards work. The regulator would normally enforce any specific obligation on electricity networks.
Despite the need to involve existing institutions, it is often considered useful to create a specialised
agency. This agency would typically have the following responsibilities.
• Developing and disseminating targeted information to specific categories of users
• Organising training; liaison with universities and professional bodies
• Developing energy efficiency standards
• Conduct of surveys; analysis of data and maintenance of database
• Conducting or managing programmes of certification and labelling
• Liaising with other state institutions (e.g. Taxation offices and inspectorates)
• Administering energy efficiency funds
• Specifying mandatory audits; certifying and/or licensing energy auditors
• Designing short-term and long-term energy efficiency programmes
• Monitoring, evaluating and reporting on the implementation state activities and private initiatives
• Designing and proposing new interventions as opportunities are identified
Legislation would probably be needed to establish such an agency and to specify its duties.
There is no energy efficiency agency in Egypt. Previously the Organisation for Energy Planning (OEP)
had some umbrella functions in the sector and was involved in the early work on appliance standards,
but it has been disbanded.
Government appears to favour the concept of a disbursed responsibility for energy efficiency within
relevant Departments guided by the Supreme Council of Energy supported by a small secretariat in
the Cabinet Office known as the National Council for Energy Efficiency. The Supreme Energy Council
was established in 1979, but was hardly ever convened. It has recently been revived and will take over
the strategic functions of energy policy. The members include all Departments with substantial inter-
ests in the energy sector.
This procedure reflects a common approach within the Egyptian administration to start with a small ac-
tivity and then subsequently to build up and strengthen the legal basis as experience is gained. A
somewhat similar process was adopted with the Regulatory Agency and with the New and Renewable
Energy Agency. It is possible, but by no means certain, that the National Council for Energy Efficiency
will evolve into a substantial agency with strong legal powers.
The Ministry of Industry has established by Decree a Committee on Energy Efficiency in Industry that
will exist for two years with the duty to assess the potential for energy efficiency and to review mecha-
nisms to realise that potential. The committee includes members from industry, academia and officials,

- 10 -
Economical, Technological and Environmental Impact Assessment of National
Regulations and Incentives for RE and EE: Country Report Egypt
Egypt.doc
which composition is rather novel in Egypt. This work will also inform the National Council.
4.5 Standards and/or Labels
The obligation on manufacturers and importers of equipment to label goods or to meet specified stan-
dards is a policy measure introduced to overcome the market failure caused by asymmetric informa-
tion. Potential users of equipment, faced with a choice of designs, may not have the skills and informa-
tion to understand the consequences of their choice. They may be tempted to choose low-cost equip-
ment with high energy consumption in preference to higher price options that perform better. Manufac-
turers may not have an incentive to provide this information if they think that their comparative market
advantages do not include greater efficiency than competitors. Labelling and standards are not exclu-
sive; goods can be obliged to meet a certain minimum standards and then labelled according to their
performance when it exceeds the standard. Labelling and standards both require testing facilities and
protocols; both require rigorous and competent enforcement.
Standards for refrigerators, washing machines, air-conditioners and water heaters have been devel-
oped by OEP under the UNDP / GEF projects and labels have been designed to indicate to which
class any appliance belongs. Testing laboratories for these appliances and for efficient lighting equip-
ment CFLs and electronic ballasts have been built with the support of the UNDP Energy Thematic
Trust Fund. A Ministerial Decree has been promulgated to implement the standards and labels. The
ownership of the testing laboratories, the testing of appliances and the issue of labels to models ac-
cording to their performance has now been assigned to NREA. Compliance at present is voluntary;
there is no systematic procedure to ensure compliance with labels and to detect fraud, but this will be
necessary when the scheme is made mandatory.
Article 55 of the draft electricity law obliges the competent Ministry to design policies aimed at expand-
ing the application of efficiency equipment and replacing low-efficiency appliance and equipment. Arti-
cle 56 of the draft electricity law also addresses this matter; it does not appear to add new regulation,
but simply confirms the application of the Ministerial Decree.
Standards for buildings are an important special case because:
• The rate of new building in developing countries is far higher than anywhere else in the world
• Buildings are large consumers of energy
• Buildings last for decades and will determine energy use for a very long time
• Large improvements in the energy efficiency of buildings can be achieved at low cost
• Developers will not normally make those improvements because of various chronic market failures
• The principal-agent dilemma is especially acute
In Egypt, the Housing and Building Research Centre (HBRC) of the Ministry of Housing has developed
energy efficiency building codes for residential and commercial buildings, in part with the assistance of
UNDP / GEF. It has also developed an energy efficiency building code for the administrative buildings
to improve energy efficiency in Egyptian governmental buildings.
The residential energy code specifies the minimum requirements to improve both thermal and visual
comfort in non-conditioned buildings as well as minimum energy efficiency requirements in condi-
tioned buildings. The codes specify separately the minimum energy performance standards for energy
using equipment and for the envelope.
The Residential Building Energy Efficiency Code is implemented by a Ministerial Decree issued in

- 11 -
Economical, Technological and Environmental Impact Assessment of National
Regulations and Incentives for RE and EE: Country Report Egypt
Egypt.doc
2006 by the Minister of Housing. The final draft of the Commercial and Administrative Buildings has
been presented for public review in 2008 and awaits implementation.
It is not clear whether the capacity of the Ministry to achieve regulatory compliance is sufficient and
this may be an area where further support is required.
4.6 Financial Incentives
Financial incentives can be separated into economic and fiscal incentives. Economic incentives are
aimed at encouraging investment in energy efficient equipment and processes by reducing the in-
vestment cost directly and fiscal incentives are those actions that reduce the cost indirectly through
the taxation system. Economic incentives can be further divided into investment subsidies and con-
cessional finance. Investment subsidies change the perceived cost of an investment and concessional
finance changes the financing conditions. Fiscal incentives differ from other financial incentives in
several ways. They do not need to be funded directly; they are funded indirectly in that they represent
a loss of revenue to the state budget. Generally they are available to all who qualify according to the
terms of the exemption; there is no application and award process. For this reason they are some-
times preferred as being less susceptible to corruption and to political manipulation. They can be
managed through the normal tax compliance regime. In middle income countries this approach is
generally only practical with companies.
A last instrument that might be included under this heading is feed-in tariffs for cogeneration. If the
feed-in tariff is above the opportunity cost of electricity then the instrument does really constitute an in-
centive. The incentive is funded by other consumers of electricity unless a special compensation is
paid from the state budget to the network. If the feed-in tariff is above the marginal cost of electricity at
subsidised fuel prices, but below the opportunity cost then it is simply a regulation to correct the mo-
nopoly purchasing power of the network and the distorted fuel prices. If the cogenerator is burning
subsidised fuel and also receiving an incentive through the feed-in tariff then the consequences de-
pend on the relative values of subsidies.
There does not appear to be any specific fund for energy efficiency in Egypt. The Committee on En-
ergy Efficiency in Industry has proposed the establishment of a Fund to provide financial incentives to
investment in energy efficiency. No decision has been taken. The logic of such a fund is that low en-
ergy prices prevent industry from making investments that would be cost-effective if prices were set at
opportunity cost. The state would also gain from such investments because it would reduce the vol-
umes of energy that the state must presently purchase at international prices to meet the demand for
fuel at subsidised prices. If a portion of the benefits to the state from each investment were returned to
the Fund it could maintain activities and even expand them. The idea is interesting, but it is a second-
best solution, because one subsidy is being compensated by another. The logic however is sound if
low prices persist.
The World Bank Group has recently created the Clean Technology Fund (CTF); this seeks to promote
scaled-up financing for demonstration, deployment and transfer of low carbon programs and projects
with a significant potential to reduce Green House Gas (GHGs) emissions. Egypt was an early appli-
cant to this fund and secured $300 million of financing (CTF Trust Fund Committee, 2009). None of
this seems to be allocated to energy efficiency, but to renewable energy and transport. The objectives
of these two programmes are described elsewhere in this report (Section 3.8).
The draft electricity law provides that holders of transmission and distribution licenses shall purchase
or pay the value of the surplus power from third-party cogeneration units and power from units running

- 12 -
Economical, Technological and Environmental Impact Assessment of National
Regulations and Incentives for RE and EE: Country Report Egypt
Egypt.doc
on recovered fuel energy with a capacity of less than 50 MW. The price to be paid for this power is to
be established by the Egyptian Electric Utility and Consumer Protection Regulatory Agency
(EEUCPRA ) established under the law.
4.7 Obligations
Another approach, which may be combined with incentives, is to oblige companies to undertake en-
ergy efficiency by mandatory measures. These can be multiple and include obligations to:
• To carry out audits at regular intervals
• To report to central government database and possibly to communicate audit results to the public
• To report energy consumption, saving measures and implemented measures
• To propose action plans to implement the energy savings measures identified in audits
• To carry out certain specified measures
• To appoint an energy manager
• Mandatory certification of auditors
• Mandatory comparison of operation and investment to reference values (norms, benchmarking)
Some, or all, of these requirements may be confined to large users and made conditional on crossing
a defined threshold of energy use.
Obligations can be voluntary. Two main sets of voluntary agreements have been introduced. The first
set comprises agreements between government and representative bodies of appliance manufactur-
ers to reach specified improvements in the performance of appliances; the approach has also been
extended to vehicles. The second set comprises agreements with individual industries to improve their
own on-site energy performance. Industry can have various motivations to participate in these agree-
ments. Appliance manufacturers may expect to persuade government to supplement their efforts with
instruments aimed at stimulating purchases by consumers. It may in some instances be a mechanism
to forestall regulation. This latter reason may also encourage participation in agreements to reduce
energy use in industrial processes. Such agreements, although voluntary, may also be a condition for
financial incentives.
We are unaware of any such measures in Egypt other than the voluntary labelling of appliances de-
scribed earlier.
In liberalised markets an alternative to promoting energy efficiency through state financial incentives
and funds is to place an obligations placed on suppliers. In this scheme a supplier or distribution net-
work manager scheme is placed under an obligation to demonstrate programs that save specified
amounts of energy related to their total supply volume. The supplier or network operator then builds
the costs into his cost-base; he then has the usual interest of a commercial company in keeping his
cost-base as small as possible. The requirement is enforced by the regulator; failure to comply may be
penalized in proportion to the deficit between the target savings for the supplier and the amount
achieved. Savings do not have to be made within the supplier's own area; they can be in fuel oil, coal
or transport fuels. Such schemes can be complemented by "white certificates". In this arrangement,
suppliers are obliged to demonstrate they either accomplished energy savings directly or have bought
certificates from others who can show they have made savings.
The draft electricity law in Article 55 makes provision for some such arrangement. The draft requires
owners of transmission and distribution licenses to prepare and conform to annual plan which has
been approved by the regulator to carry out projects or programmes in energy efficiency, especially in:

- 13 -
Economical, Technological and Environmental Impact Assessment of National
Regulations and Incentives for RE and EE: Country Report Egypt
Egypt.doc
• Management of demand for electric power
• Improvement of the electric power utilization efficiency
• Promotion of equipments used for renewable energy
• Raising consumer awareness with respect to power utilization efficiency
Under the law, the Agency shall ascertain to what extent the above have been achieved upon renewal
of the licence. This is a rather weak provision as it is only reviewed it appears on renewal of the li-
cence.
4.8 Audits and the Promotion of ESCOs
The original idea of an Energy Service Company or ESCO is that an entity other than the energy sup-
plier should identify, design, finance, supervise and commission energy efficiency projects for a client,
to be compensated by a share of the energy savings achieved over a defined period. The partition of
savings is determined by a special contract known as an energy performance contract (EPC). Actual
practice varies widely; some ESCOs will finance the project, others will organise finance. Implementa-
tion is not easy and there are relatively few successful examples. The name ESCO is sometimes also
given to companies that just provide consulting services, but do not enter into an EPC. It is important
to be clear what is meant, as the latter is a much easier exercise than the former.
Both USAID and UNDP in their energy efficiency projects have tried to promote ESCOs in Egypt. The
aim in both projects was to establish and demonstrate a business model where ESCOs helped clients
secure financing from commercial banks and eventually to create a self-sustaining market for ESCO
activity. The results were a little disappointing. Some ESCOs were established and a national associa-
tion for ESCOs was formed. Most of the ESCOs were small and under-resourced.
The prevailing large subsidies to energy reduce the benefits from investment and make it hard to find
projects that are attractive to both the ESCO and the client. Banks generally lend to companies on the
strength of their balance sheet not on a project basis and they have better connections with compa-
nies than do the ESCOs. Privatization of industry may encourage more interest in energy efficiency
because managers will be more strongly incentivised to improve the efficiency of the production proc-
ess and minimize cost of production than they would be under public ownership.
4.9 Transport and Spatial Planning
More than half of the global population now live in cities and according to UN Habitat, by 2030, it will
be 60 percent, (UN Habitat, 2008). Cities consume enormous amounts of energy and they have great
inertia; road systems and land-use decided now will influence energy use for a hundred years. In ur-
ban metropolitan areas, transport creates a third at least of total greenhouse gas emissions. Promo-
tion of public transport options and careful design of cities is critical for reducing emissions in cities.
The Greater Cairo Metropolitan Area (GCMA) has the largest share of population, economy, industry,
and human resources in Egypt. The population was 17 million in 2006 and given the rapid rate of ur-
banization is expected to reach 24 million in 2027. About 2/3 of all motorized trips in Egypt are made
by public transport; there are therefore significant opportunities to improve energy efficiency by shifting
from buses to a mass transit system. The government's vision for transforming the transport sector is
reflected in the Greater Cairo Urban Transport Master Plan developed by JICA and completed in
2003. The Master Plan aims to provide:

- 14 -
Economical, Technological and Environmental Impact Assessment of National
Regulations and Incentives for RE and EE: Country Report Egypt
Egypt.doc
• a safe and environment-friendly transport system that would significantly reduce carbon emissions
• an economically effective urban transport system
• equitable mobility.
The Government of Egypt is committed to low carbon transport strategy and has implemented several
measures to achieve this. Among them are:
• the preparation with the assistance of the World Bank of an Urban Transport Strategy for the
Greater Cairo Region that included short and medium-term investment plans;
• scaling-up the provision of incentives for the replacement of old public buses and private taxis with
a new fleet operating on compressed natural gas (CNG);
• completion of line 1 and 2 of the underground Metro and a commitment to complete line 3 by 2012
and line 4 by 2017;
• the identification and preparation for implementation of specific clean technology projects, including
implementation of a Light Rail Transit (LRT) and Bus Rapid Transit (BRT) systems as well acceler-
ated conversion of public buses and private taxis to CNG/hybrid technologies.
As noted earlier Egypt has been successful in its applications to the CTF and will use a part of the
funds assigned to continue with the work on transport and planning. The CTF resources ($100m) will
be complemented by IBRD ($150m), the private sector ($330m) and the Government's own resources,
(CTF Trust Fund Committee, 2009).
4.10 Information
Access to knowledge is costly and may impede an individual or company from undertaking activities in
energy efficiency. It is a legitimate role of government to generate and disseminate knowledge as a
public good. We interpret the term knowledge in this context very widely to include data, technical
guidance, research and demonstration.
Sporadic efforts have been made in the past along these lines, but have not been sustained. The en-
ergy efficiency project implemented by USAID in the 1980s and 90s produced many useful case stud-
ies and a wealth of excellent technical guidance notes, which seem no longer to be widely available.
This may be a consequence of the rather fluid nature of the institutional responsibilities for energy effi-
ciency in Egypt that have not allowed a single permanent centre of competence to emerge, to accu-
mulate knowledge and to deploy it effectively and in a sustained manner.
We are not aware of any research and demonstration projects in energy efficiency that have been
publically funded.
We understand that the Committee on Energy Efficiency in Industry plans to develop a data base on
industrial energy use including estimates of potential savings. The location of this data base is uncer-
tain, but the preference is for the Industrial Development Agency. The choice of the IDA is determined
by the fact that it has an existing interface with industry and can start rapidly. This is a sensible meas-
ure that should be encouraged.

- 15 -
Economical, Technological and Environmental Impact Assessment of National
Regulations and Incentives for RE and EE: Country Report Egypt
Egypt.doc
5. Comparison of Egyptian Practice with International Practice in Renewable Energy
This section attempts to compare the present status of renewable energy policy in Egypt with interna-
tional practice.
Public policy intervenes to correct market failures. In the case of renewable energy, the most common
failures are somewhat similar to those identified below for energy efficiency, but with a different em-
phasis. Distorted energy prices, unrecognised external costs, poor access to technical information all
play a part. There is however a significant difference. Many measures of energy efficiency are cost ef-
fective, but prevented by distortions of the conventional market. This is also true of some renewable
options, such as solar water heating. Many technologies are not cost-effective even if the distortions of
the conventional market are removed. They are justified by the external costs that they avoid, espe-
cially the external costs of GHG emissions. This means that they must be financially subsidised to fi-
nancial incentives of one sort or another are critical to renewable policy.
In addition to these general market failures there can be specific market failures for electricity gener-
ated from renewable energy that is fed into a national grid as electricity. Excessive and unjustified
costs of connection to the grid, inability to connect, disputes over responsibility for payment - these
can impede renewable deployment. They are not necessarily malign obstacles; the relationship be-
tween a national network with its own concepts of growth and independent generators of all sorts can
be difficult. It may affect renewable energy more because generation from renewable energy is fre-
quently site specific, i.e. it is located where the source is and when renewable energy is disbursed the
issues arise more frequently.
Policy instruments are intended to correct or compensate for these various distortions.
5.1 Targets and Strategy
Strategy sets out objectives and targets and defines the combinations of policy instruments that are
expected to achieve the targets.
The Supreme Council of Energy in February 2008 approved a plan to satisfy 20% of the generated
electricity from renewable energy by 2020, including a 12% contribution from wind energy. This figure
translates into about 7200 MW of grid-connected wind farms and 8% contribution from other sources,
mainly hydro and solar energy.
5.2 Legal Reform
The main legal elements in a policy to promote renewable technologies are a clear targeted strategy
or road map, a specialised agency to implement public activities and a support system specifically
aimed at allocating the extra costs of the technology.
There is no renewable energy law for Egypt as such, but there are some important provisions of the
draft electricity law that will determine how the next phase of renewable development proceeds. The
Law sets out the procedures for the construction of grid-connected renewable generators and the
compensation of EETC for purchase of power at higher prices than alternatives.
Article 45 of the Law sets out the process for the procurement of electricity generation plants using re-
newable energies. It provides for several options combining a competitive bidding system and a feed-
in tariff. Under the competitive bidding system NREA may call for tenders for the construction and op-

- 16 -
Economical, Technological and Environmental Impact Assessment of National
Regulations and Incentives for RE and EE: Country Report Egypt
Egypt.doc
eration of plant to sell electric power to the Egyptian Electricity Transmission at a rate proposed by the
regulatory Agency and approved by the cabinet. Alternatively EETC, in coordinate with NREA can call
for public tenders to build, own and operate plant under which arrangement the successful tenderer
will agree a power purchase agreement with EETC. It is intended, but not specified in the Law, that the
domestic content will be a part of the criteria for selection. It is also foreseen that investors may of their
own volition build plant and sell to EETC on the basis of a standard PPA of a take-or-pay character
valid for 15 years, approved and announced by the Cabinet. Article (46) requires the holders of li-
cences for transmission and distribution licenses to connect renewable generators to its own network
and to cover the corresponding investment needed for strengthening their networks.
Articles 47 - 50 provide for a fund, to be named the "Fund for Development of Power Generation from
Renewable Energies", established by and affiliated to the cabinet of ministers. The purpose of the
Fund is to compensate EETC for the purchase of electric power from the renewable generators. The
Fund will be financed mainly from allocations of the public budget of the State. The Fund's statutes
and governance are to be set by Decree.
5.3 An Agency A specialised institution to make research, prepare initiatives, draft regulations, monitor progress, en-
sure compliance, administer funds and perform other administrative activities can be useful in promot-
ing renewable technologies.
The Government of Egypt was quick to establish a specialised agency for renewable energy and this
has certainly helped in the creation of strong interest in commercial development.
The New and Renewable Energy Authority (NREA) was founded in 1986 to act as the national focal
point to introduce and promote renewable energy technologies for potential applications, particularly
generating electricity on a commercial scale together with the implementation of related energy con-
servation measures.
According to Law No. 102 of the year 1986 establishing NREA (Article 2), it practices its competence
in coordination with the entities concerned in the State, and whose activity is connected with the field
of the new and renewable energy, as follows:
• The assessment and evaluation of the new and renewable energy resources potential to plan for its
development and utilization within the framework of the general policy of the State in the field of
energy.
• To undertake and conduct the technical, economical and environmental studies and research nec-
essary to develop new and renewable energy resources utilization whether by itself or in coop-
eration with the scientific entities both locally and abroad.
• To determine the fields wherein it shall be a must to use the new and renewable energy resources
instead of the conventional sources, in coordination and in liaison with the State entities concerned.
The Authority shall be solely and exclusively entitled to ratify the alternatives of the engineering
systems for the said usage's, in such a way as to secure the achievement of their technical guaran-
tees.
• To undertake the implementation and execution of the projects related to the production and utiliza-
tion of the new and renewable energy as indicated under the previous item, whether by itself or in
participation with third parties, or to entrust the implementation and execution thereof, wholly or
partly, to third parties, whether for its own account, or for the account of third parties.
• To propose the Egyptian standard specifications for the new and renewable energy equipment and
systems, and to conduct the scientific tests to evaluate the performance of the equipment and sys-

- 17 -
Economical, Technological and Environmental Impact Assessment of National
Regulations and Incentives for RE and EE: Country Report Egypt
Egypt.doc
tems, both local and foreign, under the Egyptian prevailing conditions and to issue respective li-
censing certificates to that effect.
• To undertake and conduct the applied and practical experiments related to the new and renewable
energy technologies.
• The laying down and implement the training and promotional programmes that are necessary for
spreading and expanding the new and renewable energy utilization and application.
• The rendering of consultative services in the field of the new and renewable energy, and to provide
the technical know-how and expertise for the development of the national industries related to the
equipment thereof, and the respective programs.
• The implement ion all the agreements and protocols concluded by the State and the Public Au-
thorities with the foreign governments and international authorities in relation to the compe-
tence of the Authority, as well as to conclude agreements in the field of its own activity with similar
and analogous entities both locally and abroad.
Research on renewable energy has mainly been directed at wind and solar power. NREA also acts as
a developer; it owns and operates all existing wind farms in Egypt and is planning several more.
NREA is also effectively a regulator; it establishes rules and procedures for allocating land for wind
farms to developers and it acts as a national planning agency for renewable.
Clearly there are conflicts of interest in the discharge of these various functions. There are advantages
of having everything under one roof in the early days of development, but now, given the expected
rapid rate of commercialisation, it is no longer effective. There are many possible ways of restructuring
NREA; a sensible partition of duties would be to assign the regulatory role to the electricity regular and
to separate the rest of NREA into a commercial developer and an agency for research and promotion.
The latter function might well be combined with the duty of promoting energy efficiency. The commer-
cial arm might be kept in state ownership, though it would probably be better privatised.
5.4 Standards and /or Labels
Standards would be inappropriate for large developments in renewable energy. Commercial develop-
ers are well equipped to decide for themselves on efficient and effective specifications. There is a
good case for standards for small appliances such as solar heaters.
Egyptian Standards for solar water heating systems had been issued since 1987 in successive parts.
New standards have been issued in 2007 covering test methods for solar collectors and outdoor test
methods for solar heating systems performance characterization and yearly prediction of solar-only
systems.
5.5 Financial Incentives (Capital Support)
Many financial incentives have been used in different countries to promote renewable energy. Support
can either be offered to investment or to operation. Investment support for renewables is general de-
livered through the same type of instruments that are used to support investment in energy efficiency,
e.g. capital grants, tax exemptions, soft loans and loan guarantees. In the case of grid connected re-
newables it is possible also to offer support to operation either by allowing the electricity to be sold at
inflated tariffs or by obliging certain parties to purchase specified volumes. These instruments are to
some extent exclusive and are discussed together in the next section.
Existing wind projects in Egypt were financed with grants and low cost loans. Funds and technical as-sistance were provided by assistance were provided through mutual Governmental agreements by

- 18 -
Economical, Technological and Environmental Impact Assessment of National
Regulations and Incentives for RE and EE: Country Report Egypt
Egypt.doc
Denmark (180 MW); Germany (160 MW); Spain (85 MW) and Japan (120 MW). Meanwhile, several new wind farm projects are in various phases of preparation in cooperation with development partners.
NREA is qualifying the following wind farm projects as CDM projects:
• Zafarana 120 MW wind power plant project in cooperation with Japan.
• Zafarana 120MW wind power plant project in cooperation with Denmark.
• Zafarana 80MW wind power plant project in cooperation with Germany.
• Zafarana 85 MW wind power plant Project in cooperation with Spain.
• Gulf of El-Zayt 220 MW wind power plant Project in cooperation with Japan.
• Gulf of El-Zayt 200 MW wind power plant Project in cooperation with Germany, EC and EIB.
Within this context, the 120 MW wind farm project in cooperation with Japan was the first project regis-
tered in the field of wind power. The project was registered in 2007.
We note also that, NREA works as a facilitator and a supporting body for the private sector to invest in
renewable energy projects in Egypt. NREA aims to foster increasing private sector participation
through removing some of the main risks that can delay the investment decisions:
• Earmarking the most suitable locations for future development. More than 7600 square kilometers
of desert lands have been earmarked for future wind projects.
• All permits for land allocation are already obtained by NREA (such procedures are lengthy and
costly worldwide.)
• A Usufruct Agreements for project sites will be signed with the investor, where only the costs of al-
locating the lands and mines clearing preparing, will be paid back to NREA on installments after
operating the project, which will not affect the project's economics.
• Environmental Impact Assessment – EIA, including bird migration study will be prepared by NREA
in cooperation with international consultant.
Other advantages include:
• The ministry of finance has reduced customs duties from 5% to 2% for all renewable energy
equipment and spare parts, which would impact positively on the projects.
• The project company shall get license for power generation from Egyptian Electricity Regulatory
Agency.
• Signing long-term PPAs of 20-25 years.
• Central Bank of Egypt will guarantee all financial obligations of EETC under the PPA.
5.6 Feed-in Tariffs and Obligations
Grid connected renewable energy is rarely cost-effective in its own right. It must be subsidised if it is to
be developed by private industry. There are two main ways of delivering the subsidy. One is by offer-
ing higher prices than those available commercially; the other is by creating a second valuable good
that represents the value of the fact that the energy is generated from renewables. The second
scheme is operated by issuing certificates that certify the renewable origin and then obliging an identi-
fied group (normally suppliers) to buy them. This creates a market and therefore a price.
The offer of higher tariffs may be created by tendering a concession, it being understood that the con-
cession will be granted however the price achieved compares to market prices for electricity. This
stands in continuity with traditional processes of tendering large plants to IPPs; it allows secondary cri-
teria, such as percentage domestic content, to be added to the evaluation criteria. It has recently been
adopted by Denmark for large developments. Higher tariffs made also be operated by a feed-in tariff

- 19 -
Economical, Technological and Environmental Impact Assessment of National
Regulations and Incentives for RE and EE: Country Report Egypt
Egypt.doc
that is made available to any generator.
Certificate based schemes define a quantity of renewable electricity to be produced and market forces
identify a price that is unknown at the outset; feed-in tariffs fix a price to be paid for renewable electric-
ity, but it is unknown what volume will be offered.
In Egypt the intention at present is initially to use competitive bidding for large resources on land
owned by the state. The requirement for high domestic content will help support and develop the na-
tional wind industry. The competitive bidding should help reveal prices that developers will accept and
can inform the feed-in tariff that is proposed later for smaller projects.
5.7 Information
It is a legitimate role of government to generate and disseminate knowledge as a public good. The
main need in this respect is for data on the renewable resource. It makes no sense for every devel-
oper to make their own measurements of solar and wind data. The need is especially acute for wind
as the extent of the resource varies locally.
The wind resource in Egypt has been well studied. The New and Renewable Energy Authority (NREA)
has compiled a wind atlas for Egypt with the support of the Risoe National Laboratory. A Wind Atlas
for the Gulf of Suez was published in 1996 and updated in 2003. A Wind Atlas for the whole country
was complied in 2005. Developers would probably wish to make their own measurements before
committing capital and it is in the interests of NREA that they should do this in order to ensure that the
technical risk in this respect lies with the developer. The Atlas though represents an excellent source
of basic information for potential investors.
The Egypt Solar Radiation Atlas was issued in 1992; it comprises a typical meteorological year data
and maps showing that Egypt enjoys high rates of solar radiations. The annual global radiation from
north to south is between 1900 -2600 kWh/m2/year and the direct solar radiation ranges between
2000-3200 kWh/m2/year.
5.8 Industrial Policy
It is important that countries develop their own capacity to manufacture and / or assemble renewable
technologies in parallel with the investment process. This can be done by targeted research, by grants
to appropriate industries and by local manufacturing obligations in tendering.
It is intended, but not specified in the Electricity Law, that the domestic content will be a part of the cri-
teria for selection among competing bids for power plant concessions.

- 20 -
Economical, Technological and Environmental Impact Assessment of National
Regulations and Incentives for RE and EE: Country Report Egypt
Egypt.doc
6. Case Studies
6.1 Case Study on Energy Efficiency Obligation
6.1.1 Background
6.1.1.1 Description of Policy
The draft electricity law in Article 55 makes provision for the holders of transmission and distribution
networks to implement energy efficiency as a condition of their licence. The draft law requires owners
of transmission and distribution licenses to prepare and conform to an annual plan, which has been
approved by the regulator, to carry out projects or programmes in energy efficiency, especially in:
• Management of demand for electric power
• Improvement of the electric power utilization efficiency
• Promotion of equipment used for renewable energy
• Raising consumer awareness with respect to power utilization efficiency
Under the law, the Regulatory Agency shall ascertain to what extent the above have been achieved
upon renewal of the licence. This is a weak provision as it is only reviewed it applies only on renewal
of the licence. A closer regulation of compliance is desirable.
6.1.1.2 Assumptions
Given the tentative nature of the existing draft law, we have made, for the sake of this example, some
assumptions regarding the precise conditions that might be imposed by the regulator.
We assume:
• That network operators are obliged to demonstrate cumulative annual energy savings equal to
(say) 160 GWh per year in the first instance through the implementation of rolling plans of their de-
sign to be evaluated annually,
• That they have to demonstrate compliance with this obligation annually (not apparently foreseen in
present draft),
• That the energy saved will be imputed by the regulator from the activities that they have conducted
and adequately documented,
• Penalties will be imposed annually on deficient licence holders (not apparently foreseen in present
draft).
The behavioural model that underlies the expectations of this instrument is then as shown in the fol-
lowing matrix.

- 21 -
Economical, Technological and Environmental Impact Assessment of National Regulations and Incentives for RE and EE: Country Report Egypt
Egypt.doc
Table 1: Behavioural Model of Energy Efficiency Obligation and Associated Indicators, Risks and Assumptions
Behavioural model
Indicators
Risks Assumptions Input Output Outcome Impact
Regulator prepares and
publishes consultation
paper with licence
holders and other
stakeholders.
• Time to prepare
documentation and
technical advice ($).
• Responses from li-
cence holders and
other stakeholders
(#).
• Sensitisation of
stakeholders (?).
• Improved instru-
ment (?).
• Sensitisation of
stakeholders (?).
Regulator refines and
publishes final provi-
sions. Requests plans.
• Time to prepare
documentation and
technical advice ($).
• Licence holders
prepare plans
(Y/N).
Regulator reviews
plans.
• Official time and
technical advice ($).
• Decision on ac-
ceptability (Y/N).
• Accepted plans in-
corporated into
business plan (Y/N).
• Regulator is less in-
formed than licence
holders and allows
weak plans to pass.
Rejected plans revised
and eventually ac-
cepted.
• Official time and
technical advice ($).
• Decision on ac-
ceptability (Y/N).
• Accepted plans in-
corporated into
business plan (Y/N).
• Licence holders
obliged to incorpo-
rate efficiency tar-
gets into thinking
(?).
Plans implemented and
reported at end of year.
• Official time and
technical advice to
monitor and evalu-
ate ($).
• View on compliance
of results (Y/N).
• Investments and
other activities im-
plemented ($).
• Efforts made,
costed and docu-
mented (?).
• Cost-effective sav-
ings in energy and
CO2 emissions (GJ
and mt).
• Imputed relation-
ships do not hold in
practice.
• Regulator has the
capacity to analyse
long complex and
detailed compliance
reports.
Efficiency and effec-
tiveness of regulation
analysed by regulator.
• Official time and
technical advice to
monitor and evalu-
ate ($).
• Revised rules (Y/N). • Regulated subjects
adjust programmes
(?).
• Better compliance
and more cost-
effective savings
(GJ and mt).

- 22 -
Economical, Technological and Environmental Impact Assessment of National Regulations and Incentives for RE and EE: Country Report Egypt
Egypt.doc
Behavioural model
Indicators
Risks Assumptions Input Output Outcome Impact
Penalties applied
where appropriate.
• Revenue received
($).
• Stringency of pro-
gramme empha-
sised among all
regulated subjects
(?).
Cycle repeated to end
of licence period.
• Official time and
technical advice to
monitor and evalu-
ate ($).
• Annual plans more
rigorous and con-
trols more func-
tional (?).
• Investments and
other activities im-
plemented.
• Regulated subjects
comply more effec-
tively (?).
• Savings in energy
and CO2 emissions
(GJ and mt).
• Imputed relation-
ships do not hold in
practice.
• Regulated subjects
identify and exploit
weaknesses.
• Regulator has the
capacity to analyse
long complex and
detailed compliance
reports.
Final evaluation at end
of licence period.
• Official time and
technical advice to
monitor and evalu-
ate ($).
• Opinions on com-
pliance that are in-
troduced into nego-
tiations on licence
renewal (Y/N).
• Poorly performing
licence holders dis-
advantaged in li-
cence renewal (?).
• Compliance re-
quirements taken
sufficiently seriously
to affect licence re-
newal.
Report by regulator on
the effectiveness of the
obligation.
• Official time and
technical advice to
monitor and evalu-
ate ($).
• Better understand-
ing of the costs,
benefits and poten-
tial of the instru-
ment (Y/N).
• Well documented,
cost-effective sav-
ings in energy and
CO2 emissions (GJ
and mt).
• Improved manage-
ment of networks
(?).
Note on indicators: • inputs, i.e. the financial, human, technical or organizational resources used in the endeavour • outputs are objectively verifiable indicators that demonstrate the progress made in implementing the measures • outcomes are the immediate effects on the regulated subject • impacts are direct measurements of the improvements that the programme is designed to bring about

- 23 -
Economical, Technological and Environmental Impact Assessment of National Regulations and Incentives for RE and EE: Country Report Egypt
Egypt.doc
Note on symbols: • $ indicates indicator is measured in financial terms • # indicates indicator is measured in numbers • Y/N indicates indicators is a yes or no observation • ? Indicates an indicator that is intrinsically hard to quantify and measure, but upon which a qualitative judgement may be formed

- 24 -
Economical, Technological and Environmental Impact Assessment of National
Regulations and Incentives for RE and EE: Country Report Egypt
Egypt.doc
6.1.2 Cost-Benefit Analysis
6.1.2.1 Scope of the Analysis
The cost-benefit analysis that is described in this section draws upon the indicators identified in the
preceding analysis. It is a very simplified indication of how such an exercise should be conducted, the
data required and its treatment; it is based loosely on the evaluation of the UK energy efficiency obli-
gation, (Lees, 2008)2.
In order to make a complete evaluation of the economic benefits of an energy efficiency obligation, it is
necessary to estimate the total cost of the measures and how they are allocated among suppliers,
customers and possibly other parties (e.g. government, municipalities). The total cost reflects the ac-
tual cost of the energy efficiency measure including installation as well as the indirect costs of the en-
ergy supplier such as marketing, monitoring, reporting and administration.
6.1.2.2 Cost for Energy Efficiency Technologies
The UK experience indicates that innovative ways of supporting energy efficient products, especially
appliances, by subsidising energy efficiency components during the manufacture of the product has
greatly reduced the overall subsidy levels required to stimulate the purchase of the energy efficient
product. The traditional DSM methodology of identifying separate contributions of suppliers and cus-
tomers to the cost of the measure at the point of sale is no longer sufficient.
Table 2 below is an indication of the kind of measures that the utility might undertake to meet its obli-
gation, of the cost and impact of the individual measures and the accumulated consequences. By cost
in this context we mean the cost to the utility of the promotional effort required to create the specified
level of activity. This can be delivered through publicity, grants, loans or whatever instrument the utility
thinks favourable.
The costs and performance indicators have been proposed by comparison with experience elsewhere.
They are not expected to be accurate, but are believed to be sufficiently close to give some idea about
the cost-effectiveness of the instrument in the Egyptian context. The costs are extremely hard to as-
sess, for example with cold appliances the cost to be estimated is the cost of upgrading from a less ef-
ficient appliance to a more efficient appliance averaged over a likely set of appliances in use by the
target group. This analysis needs to take into account the great leverage that can be obtained by sup-
pliers working with manufacturers and accepting part of their costs/risks. As noted, we have based our
assessments on the figures used in the UK evaluation, very roughly adjusted for Egyptian circum-
stances, e.g. smaller and less efficient appliances. As a start we have assumed that the utility pays
one half of the total project costs, so the costs to the customer would be identical. It is recommended
that an appropriate national agency repeat and expand this exercise in more detail in order to give
some guidance to utilities as to what is expected from the obligation.
The entry "deadweight" in the Table indicates the percentage of customers taking up options who
would anyway have invested. The impacts from this group cannot be assigned to the programme, but
the costs are costs to the programme. It is always a difficult figure to assess. The value of 20% is
characteristic of US DSM programmes and also of UK experience in the implementation of its obliga-
tion. It is logical that a utility should focus its efforts under an obligation on low income customers, be-
2 Lees, E. (2008). Evaluation of the Energy Efficiency Commitment 2005-08. London: Report to the Department of Energy
and Climate Change.

- 25 -
Economical, Technological and Environmental Impact Assessment of National
Regulations and Incentives for RE and EE: Country Report Egypt
Egypt.doc
cause these customers will normally pay concessionary tariffs and therefore the loss of income to the
utility is minimised. The danger of "deadweight losses" or "free-riders" is also reduced because this of
class of consumer is least likely to make the investments on their own account.
Table 2: Cost Data for Energy Efficiency Measures
General Data for the Analysis
The general data used for the analysis are:
For the residential users the tariff scheme considers 6 classes, based on the average monthly con-
sumption. For the lowest tariff class (up to 50 kWh per month) the tariff is 0.05 LE / kWh), and for the
highest tariff class the tariff is 342 LE / MWh (for consumptions of more then 1000 kWh / month).
The analysis assumes that the utility will be responsible for 50 % of the total cost for the EE measures.
This means, the utility implements a grant programme to induce the consumers to use certain types of
equipment.
The analysis should be considered as an economic analysis, because no taxes are included. Another
important aspect is not explicitly taken into account is the commercial electricity supply cost for the util-
ity.
The analysis considers the following perspectives:
• Perspective of the whole country:
In this case the alternatives to be compared are
- Cost for a new gas fired power station (CCGT unit)
- Total cost for the energy efficiency measure

- 26 -
Economical, Technological and Environmental Impact Assessment of National
Regulations and Incentives for RE and EE: Country Report Egypt
Egypt.doc
• Perspective of the utility:
In this case the alternatives to be compared are
- Cost for a new gas fired power station (CCGT unit)
- Total 50% cost for the energy efficiency measure, which have to paid by the utility
• Perspective of the electricity user (residential sector):
In this case the alternatives to be compared are
- Tariff according to the consumption class
- Total 50% cost for the energy efficiency measure, which have to paid by the utility
For the three perspectives the assessments are given in Table 3, (a) - (c)
6.1.2.3 Perspective of the Country
The perspective for the country is illustrated in Figure 3, the respective data are given in Table 3 (a). It
can be easily seen that the considered energy efficiency measures are cost effective because the unit
costs are lower than the marginal cost of electricity supply. Under the national perspective (consider-
ing 100% of the costs for the EE measures, the average cost is 0.024 Euro/kWh, while the marginal
cost of electricity supply is 0.0502 Euro/kWh. This means, that all measures are cost efficient.
Figure 3: Country - Comparison of Total Unit Cost for EE Measures and Marginal Cost of
Electricity Supply
0.00
0.01
0.02
0.03
0.04
0.05
0.06
Insula
tion o
f
hot w
ate
r
tanks
Com
pact
fluore
scent
lam
ps
Refr
igera
tors
Fridge
freezers
Fre
ezers
Washin
g
machin
es
Sola
r w
ate
r
heatin
g
Energy efficiency measure
Eu
ro-c
en
t / kW
h
EE measure
Supply cost
The economic internal rate of return for the considered EE programme amounts to 17%, and the eco-
nomic NPV amounts to 3.3 million Euro.

- 27 -
Economical, Technological and Environmental Impact Assessment of National
Regulations and Incentives for RE and EE: Country Report Egypt
Egypt.doc
6.1.2.4 Perspective of the Utility
The average cost to the utility of electricity saved (50% of the total cost for the respective EE meas-
ure), in our indicative example, is 0.012 Euro/kWh. The gain to the utility from the programme is calcu-
lated as follows:
Gain = Supply Cost - Lost Revenues - Cost of Measure
As we do not know the financial supply cost of the utility we cannot judge the return to the company. If
the supply cost were the marginal economic cost of supply (shown in the Figure) then it is fairly clear
from inspection that the quantity "Supply Cost - Lost Revenue" is large for the consumers on low tariffs
and generally exceeds by a comfortable margin the cost of the measures. This is not true in the case
of the consumers on higher tariffs.
We know that the financial supply cost of the utility is well below the marginal economic cost so the
quantity "Supply Cost - Lost Revenue" is less than appears from the diagram. We can deduce that the
utility probably has little or no interest in applying its obligation to consumers on high tariffs, but may
(we cannot be sure) gain financially from targeting consumers on low tariffs.
In a certain sense this analysis is academic, because the utility has an obligation and is required to
perform it, but it is useful nevertheless to know how the implementation of that obligation impacts on
its own finances and that the utility might not have a financial benefit from actions which are fully justi-
fied under an economic perspective.
Figure 4: Utility - Comparison of Total Unit Cost for EE Measures and Marginal Cost of Elec-
tricity Supply
0.00
0.01
0.02
0.03
0.04
0.05
0.06
Insula
tion o
f
hot w
ate
r
tanks
Com
pact
fluore
scent
lam
ps
Refr
igera
tors
Fridge
freezers
Fre
ezers
Washin
g
machin
es
Sola
r w
ate
r
heatin
g
Energy efficiency measure
Eu
ro-c
en
t / kW
h
EE measure
Supply cost
Tariff-low
Tariff-high

- 28 -
Economical, Technological and Environmental Impact Assessment of National
Regulations and Incentives for RE and EE: Country Report Egypt
Egypt.doc
6.1.2.5 Perspective of the Electricity User
For this case study it is assumed that the electricity user pays 50% of the cost for the different EE
measures, the electricity utility will pay a subsidy to cover the remaining costs. The electricity con-
sumer compares these costs with the electricity tariff, applicable for the respective consumption levels.
The situation is illustrated in Figure 5.
Figure 5: Electricity - Comparison of Total Unit Cost for EE Measures and Marginal Cost of
Electricity Supply
0.00
0.01
0.01
0.02
0.02
0.03
0.03
0.04
0.04
0.05
0.05
Insula
tion o
f
hot w
ate
r
tanks
Com
pact
fluore
scent
lam
ps
Refr
igera
tors
Fridge
freezers
Fre
ezers
Washin
g
machin
es
Sola
r w
ate
r
heatin
g
Energy efficiency measure
Eu
ro-c
en
t / kW
h
EE measure
Tariff-high
Tariff low
From this Figure 5 it can be seen that nearly all of the EE measures are cost efficient for the electricity
user for the two tariff levels considered. Only the solar water heater is not cost efficient for the lower
tariff.
The decision situation for the electricity user depends on the tariff level:
• Low tariff: Considering the low tariff, the whole EE programme would be of interest, the IRR would
be negative and the NPV would be -3.47 million Euros. If the solar water heater would be excluded
the IRR would amount to 6%.
• High tariff: Considering the high tariff, the whole EE programme would be of high interest for the
electricity consumer, the IRR for the user side amounts to 61% and the NPV would amount to
14.23 million Euros.

- 29 -
Economical, Technological and Environmental Impact Assessment of National Regulations
and Incentives for RE and EE: Country Report Egypt
Egypt.doc
Table 3: Cost Benefit Analysis
a) National Perspective

- 30 -
Economical, Technological and Environmental Impact Assessment of National Regulations
and Incentives for RE and EE: Country Report Egypt
Egypt.doc
b) Utility Perspective
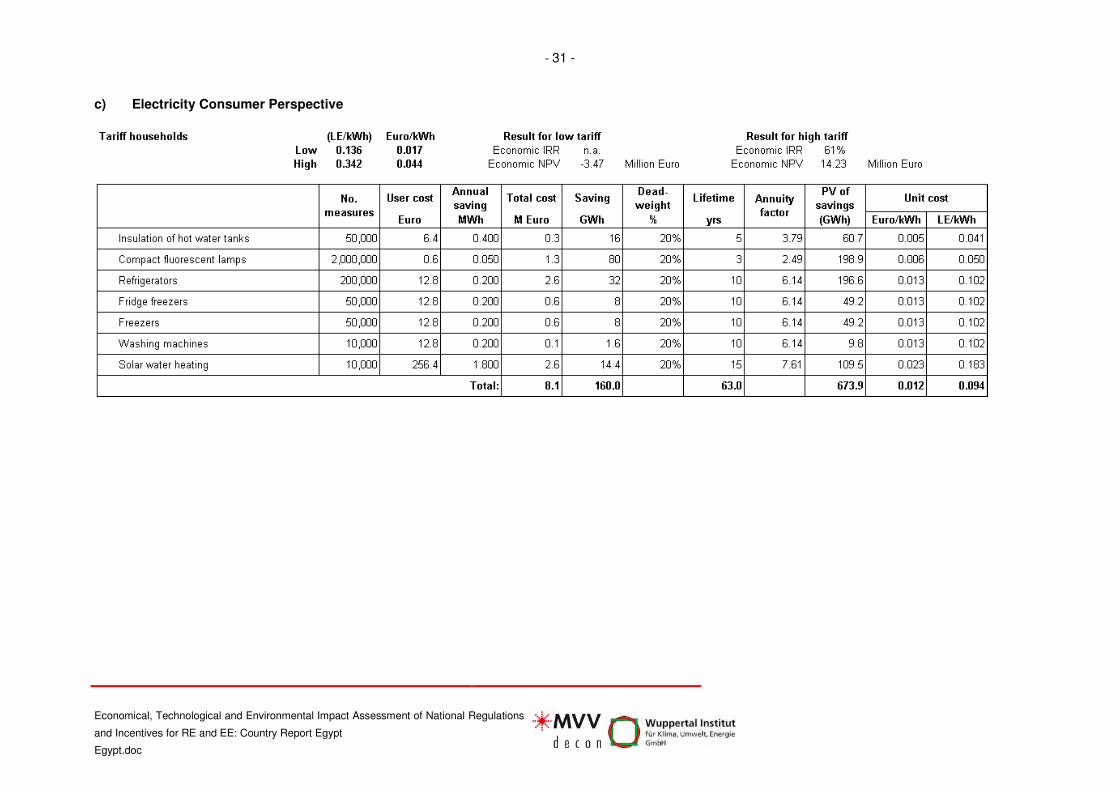
- 31 -
Economical, Technological and Environmental Impact Assessment of National Regulations
and Incentives for RE and EE: Country Report Egypt
Egypt.doc
c) Electricity Consumer Perspective

- 32 -
Economical, Technological and Environmental Impact Assessment of National
Regulations and Incentives for RE and EE: Country Report Egypt
Egypt.doc
6.1.3 Conclusion
The conclusions from this case study are:
Methodology
The case study demonstrates the advantages of developing deconstructed versions of policy prescrip-
tions as an aid to analysis and to stimulate focused debate among stakeholders.
In the case of the energy efficiency obligation the deconstruction reveals the complexity of the interac-
tions among different tariff groups and the interest of the state, the user and the utility. This under-
standing helps to frame the definition of the policy instrument and the cost-benefit analysis.
Economic Assessment
The economic assessment shows that under our assumptions, the results of an efficiency obligation
are likely to be positive for the country (economic analysis).
The utility may or may not benefit in commercial terms; the outcome depends on a subtle balance be-
tween the costs of supply and the lost revenues from the users that it manages to target. If the utility
benefits from a subsidised supply of fuel then its financial gain may be small or negative. Strictly, this
does not matter as the regulation imposes an obligation on the utility that it must meet.
What is clear is that the utility should focus its efforts as far as practical on consumers enjoying con-
cessionary tariffs, where its lost revenue is least.
The practical limit on this focus is that there must be a financial incentive for the user. Most of the effi-
ciency measures studied provide, with our assumptions, some gains to consumers, but not solar heat-
ing. If the utility is required to include some solar heating in its portfolio then it needs to target high in-
come consumers.
Overall the analysis illustrates neatly the advantages of the obligation at a national level and the stra-
tegic interest of the utility in balancing its programmes against user groups according to the lost reve-
nue and the residual incentive. Once the economic feasibility of EE measures is proven, it is neces-
sary to develop and appropriate incentive scheme (tariffs and grants) so that for each party (user &
utility) there will be a gain in implementing the EE programme.

- - 33 - -
Economical, Technological and Environmental Impact Assessment of National Regulations
and Incentives for RE and EE: Country Report Egypt
Egypt.doc
6.2 Case Study on Competitive Bidding for Wind Energy
6.2.1 Background and Context
The purpose of this note is to demonstrate the processes of evidence-based policy making (EBPM)
and theory-based evaluation (TBE). These techniques are well-known in the literature and have been
widely applied, but not generally to technical areas of policy such as energy efficiency and renewable
energy. There is potential for application in these areas because the methodologies provide a system-
atic basis for analysis and debate among stakeholders around a common and clear statement of the
policy intervention that can be maintained and improved throughout the project cycle from formulation,
through implementation, monitoring and evaluation.
The basic expression of this methodology is the behavioural model that underlies our understanding of
the reaction of stakeholders to the policy instrument.
The example that we choose in this case for illustration is the analysis of competing instruments for
the promotion of wind energy in Egypt.
6.2.1.1 Promotion of Private Investment in Wind Energy in Egypt
Egypt has a very fine wind potential, especially around certain areas of the Red Sea. Much of this land
is in government hands so the possibility exists to develop the resource through the deployment of
large, contiguous wind arrays.
There are also somewhat less favourable sites elsewhere in Egypt where smaller developments would
be possible and where the land is presently in private ownership.
Two policy instruments for developing private investments in wind energy are considered in our analy-
sis:
• Competitive Bidding for concessions based on power-purchase agreements negotiated through
tender,
• Standard power-purchase agreements based on a feed-in tariff.
6.2.1.2 Scope of the Case Study
This Case Study considers two policy instruments to promote wind power. One is a system of com-
petitive bidding of specific favourable sites. The other is the adoption of a feed-in tariff at a predeter-
mined rate.
The case study applies the concepts of evidence based policy formulation and theory based evalua-
tion with the intention to demonstrate how these techniques can clarify analysis. The study covers the
following three aspects:
• Evidence based policy preparation: For both policy instruments behavioural models are developed
and the respective expected impacts are analysed.
• Economic assessment of the wind energy option: An economic assessment of wind energy for
Egypt is presented indicating the main factors determining the economic viability of this option.
• Conclusions regarding the utility and application of the methodology and to some extent the sub-

- - 34 - -
Economical, Technological and Environmental Impact Assessment of National Regulations
and Incentives for RE and EE: Country Report Egypt
Egypt.doc
stance of the policy instruments analysed.
6.2.2 Comparison of Policy Instruments for the Promotion of Wind Power
6.2.2.1 General Context
6.2.2.1.1 Specification of the Alternative Policy Instruments
For the following analysis the following simplifying assumptions are made:
• The objective of the Egyptian Government is to develop the wind power use of a well specified
geographical area with an estimated wind power potential of 250 MW.
• For this area wind data are available and are made available to interested wind developers, but the
Egyptian Government does not assume responsibilities.
• The two options are:
- Competitive bidding for the whole area offering 250 MW. The Egyptian Government would se-
lect the most attractive bid with the lowest tariff requirement.
- The geographical area is separated into 10 similar lots offering a wind energy potential of about
25 MW with a predetermined feed-in tariff
For these two policy option the policy instrument and the concession awarding procedure are elabo-
rated below.
6.2.2.1.2 Wind Policy Objectives
The objectives of the Egypt Government in developing the wind power potential of the country are:
• Optimal development of the resource,
• Lowest cost and most manageable grid extension,
• Minimal administrative costs,
• Surprise-free procedures,
• Strong competitive pressures for cost reduction on manufacturers,
• Maximisation of local content and development of local manufacturing capability,
• Lowest project price,
• Predictability of generation.
In achieving these objectives the government would need to consider how stakeholders will adapt to
specific instruments. These concerns can be expressed through subsidiary objectives:
• Transparent and non-discriminatory allocation of sites,
• Clear criteria for choice among offers,
• How developers will manage risks in the electricity market,
• How developers will manage risks in the certificate market.

- - 35 - -
Economical, Technological and Environmental Impact Assessment of National Regulations
and Incentives for RE and EE: Country Report Egypt
Egypt.doc
6.2.2.1.3 Assumptions
We assume in both cases that the certificates of emission reductions (CERs) issued under any CDM
certification process are assigned to the developer. It does not significantly affect the analysis if they
are assigned to other parties. The overall economic advantage of wind power is unaffected by the al-
location of costs and benefits to different parties. The allocation will determine whether the different
parties will see a benefit for them as individual entities. The developer will be rewarded by a combina-
tion of the PPA and carbon credits. If he receives the carbon credits then the PPA will be lower.
The assignment of the carbon credits should be to the party that perceives the highest value and/or
lowest risk. The optimal allocation of CERs will depend on circumstances. It might be best to attribute
them to the developer if it is a large scale plant done by major players on the world scale who would
be better able to market the certificates than the state. For smaller projects, the state may be able to
consolidate the CERs and manage things better.
6.2.2.2 Competitive Bidding
6.2.2.2.1 Specification of the Option
For the forthcoming discussion of the two options, it is necessary to specify the competitive bidding
option (even to simplify the option certain extent for the transparency of the discussion):
• Egypt will make available government owned land as the basis for a concession (for example 250
MW) for wind energy supply,
• The concession will be auctioned in a two-stage procedure (pre-qualification and competitive bid-
ding),
- Pre-qualification: The admission criteria will be proven experience and financial capacity,
- Competitive bidding: Selection of the most attractive bid.
• For the bid-evaluation there will be:
- Bid acceptance criteria: The qualification of the bidder is acceptable
- Ranking criteria: A set of ranking criteria based on the electricity sector policy options will be
applied.
• Concession negotiation with the first ranked bidders: With the winner the conditions of the conces-
sion contract, the tariff and other technical conditions will be negotiated (concession contract and
long-term PPA).
• Project implementation and monitoring: The Egyptian Government will carefully monitor the project
implementation.
• In parallel the next competitive bidding round can be launched.
6.2.2.2.2 Advantages
This option has the following advantages:
• Low bid preparation effort: The basis for the tender is are the delimitations of the concession
area and the available data regarding the wind potential
• Site development: The burden and responsibility of the site development remains with the inves-
tor.
• Market response: The Government receives and immediate response from potential investors.
• Integration into the national electricity system: The feed-in point is defined.

- - 36 - -
Economical, Technological and Environmental Impact Assessment of National Regulations
and Incentives for RE and EE: Country Report Egypt
Egypt.doc
6.2.2.3 Feed-in Tariff
6.2.2.3.1 Specification of the Option
• The Government determines the feed-in tariff, which offer attractive development potentials and
should provide incentives for the development of pilot projects.
• The Government develops a comprehensive legal and contractual framework of feed-in tariffs and
the technical and contractual conditions to be applied.
• The feed-in tariff will be guaranteed in form of long-term power purchase agreements (PPA).
• Investors will evaluate the available information and will develop their sites. In the general case,
sufficient sites are available so no competition for specific sites is expected. In the specific case of
the 10 x 25 MW blocks, the concessions will be auctioned.
• The investment proposals will be evaluated according to well specified criteria, which are known to
all interested parties.
• Preparation of the following generation of wind projects: Based on the gained experience the Gov-
ernment will revise the feed-in tariff and conditions for the next-generation wind projects.
6.2.2.3.2 Advantages of this Option
The advantages of this options are:
• Programme administration: Once the general conditions and the feed-in tariff are defined the
programme management and transaction costs are low.
• Entrepreneurial freedom: The investors know the conditions and have the maximum freedom to
invite partners and to develop projects.
• Market response: The attractive feed-in tariff and the legal and contractual framework facilitate the
development of the project.
• Participation of national investors: The feed-in tariff offers also for national investors good busi-
ness opportunities because all sizes of wind parks can be developed.
6.2.2.4 Evidence Based Policy
We specify the behavioural models for these two policy instruments as a form of logical framework in
which the successive steps of policy implementation are shown in the first column and then in subse-
quent columns are listed various indicators, risks and assumptions. The successive steps of the policy
may or may not specify recognisable behavioural assumptions; it depends very much on the type of
policy investigated.
The indicators that we adopt are measures of input, output, outcome and impact. By these terms we
mean the following:
• Inputs are the financial, human, technical or organizational resources used in the endeavour,
• outputs are objectively verifiable indicators that demonstrate the progress made in implementing
the measures,
• outcomes are the immediate effects on the regulated subject,
• impacts are direct measurements of the improvements that the programme is designed to bring
about.
- - 37 - -
Economical, Technological and Environmental Impact Assessment of National Regulations
and Incentives for RE and EE: Country Report Egypt
Egypt.doc
The behavioural model is a formal description of the process of implementation, the concerns to be
raised at each stage and the measures that are to be adopted to make everything is working as ex-
pected. It provides a structure for the analytical steps and indicates the evidence that should be
sought at each stage to support assertions or on which to found analysis. It allows the issues that
might affect implementation to be identified and it allows different stakeholders to debate around a
clear and concrete representation of the policy. In later stages it serves as the basis for monitoring and
evaluation.
Behavioural models for the two policy instruments considered here are shown in Tables 4 and 5.
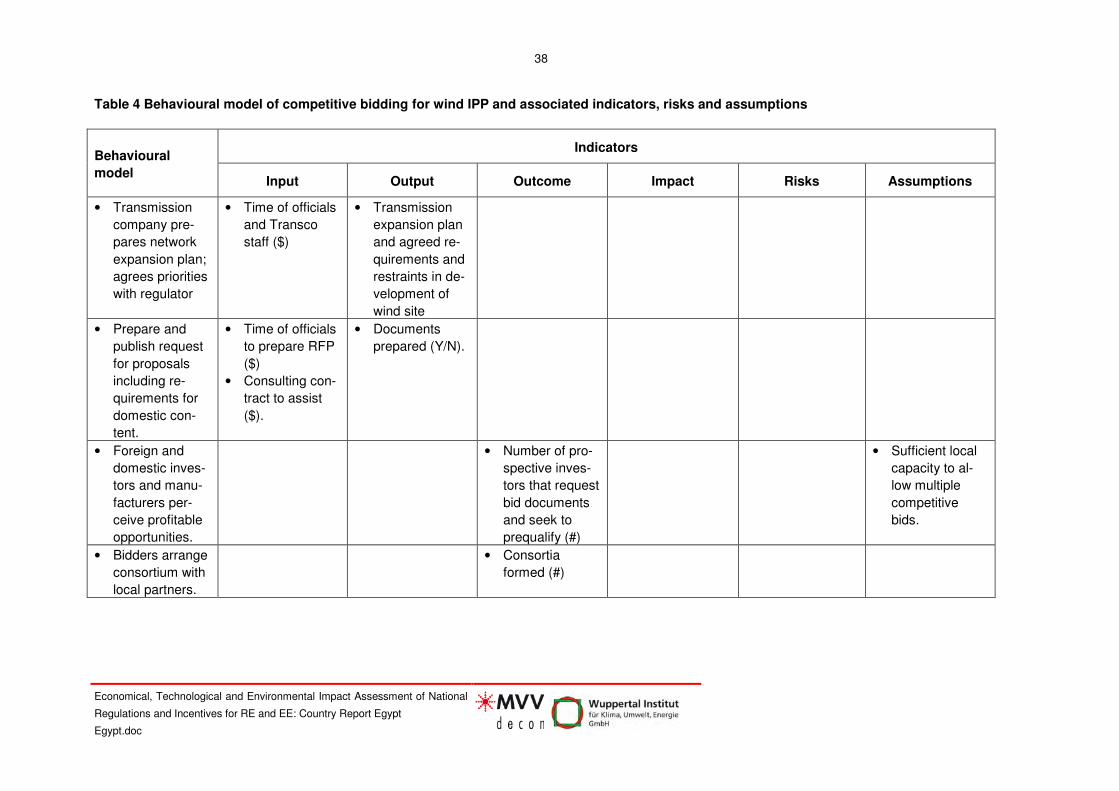
38
Economical, Technological and Environmental Impact Assessment of National
Regulations and Incentives for RE and EE: Country Report Egypt
Egypt.doc
Table 4 Behavioural model of competitive bidding for wind IPP and associated indicators, risks and assumptions
Behavioural
model
Indicators
Input Output Outcome Impact Risks Assumptions
• Transmission
company pre-
pares network
expansion plan;
agrees priorities
with regulator
• Time of officials
and Transco
staff ($)
• Transmission
expansion plan
and agreed re-
quirements and
restraints in de-
velopment of
wind site
• Prepare and
publish request
for proposals
including re-
quirements for
domestic con-
tent.
• Time of officials
to prepare RFP
($)
• Consulting con-
tract to assist
($).
• Documents
prepared (Y/N).
• Foreign and
domestic inves-
tors and manu-
facturers per-
ceive profitable
opportunities.
• Number of pro-
spective inves-
tors that request
bid documents
and seek to
prequalify (#)
• Sufficient local
capacity to al-
low multiple
competitive
bids.
• Bidders arrange
consortium with
local partners.
• Consortia
formed (#)

- 39 -
Economical, Technological and Environmental Impact Assessment of National Regulations
and Incentives for RE and EE: Country Report Egypt
Egypt.doc
Behavioural
model
Indicators
Input Output Outcome Impact Risks Assumptions
• Prepare and
submit prequali-
fication
• Time of officials
to assess sub-
missions ($).
• Possibly con-
sulting advice
($).
• Number of bids
submitted: value
of domestic
content ($).
• Some exposure
of a range of
domestic inves-
tors (?).
• Sensitisation of
some foreign in-
vestors to pros-
pects (?).
• Qualified bid-
ders appoint
agent for meas-
urement
• Agent ap-
pointed. Meas-
urements com-
pleted on
schedule (Y/N).
• Bidders will co-
operate on
measurement
• Bids prepared
submitted and
evaluated.
• Competitive
bidding pro-
motes low cost.
• Time of officials
to assess sub-
missions and
prepare con-
tract ($).
• Possibly con-
sulting advice
($).
• Winning bid se-
lected (Y/N).
• Number of bids
submitted.
• Terms of pro-
posed PPA (#).
• Value of domes-
tic content ($).
• Some exposure
of a range of
domestic inves-
tors (?)
• Sensitisation of
some foreign in-
vestors to pros-
pects ($).
• Bids are higher
than expected.
• Bidders dis-
count value of
CERs.
• Risk assessed
as moderate.
• Winner deposits
commitment fee
/ performance
bond.
• Winner with-
draws. Risk as-
sessed as low.

- 40 -
Economical, Technological and Environmental Impact Assessment of National Regulations
and Incentives for RE and EE: Country Report Egypt
Egypt.doc
Behavioural
model
Indicators
Input Output Outcome Impact Risks Assumptions
• Selected bid is
constructed and
commissioned.
• Construction
schedule is ob-
served because
of contract pen-
alties.
• Power plant
commissioned
(Y/N).
• Winner with-
draws. Risk as-
sessed as low.
• Time overruns.
Risk assessed
as moderate.
• Plant operates
with high avail-
ability because
of contract pen-
alties.
• Nominal cost of
balancing
power ($)
• Time to monitor
and evaluate
plant perform-
ance ($).
• Volume of elec-
tricity generated
(GWh).
• Volume of fuel
purchased for
power plant
(GJ).
• Financial cost of
power acquired
by Transco un-
der PPA ($).
• Value of gas
saved at oppor-
tunity cost ($).
• CO2 emissions
are reduced
from baseline;
gas burn is;
domestic manu-
facture is
strengthened;
net cost to
country is ac-
ceptable.
• Time to monitor
and evaluate
plant perform-
ance ($).
• Value of domes-
tic content ($).
• Volume of CO2
emission reduc-
tion (mt).
• Value of carbon
emission reduc-
tions ($).
• Net cost of pro-
ject ($).
Note on symbols: • $ indicates indicator is measured in financial terms • # indicates indicator is measured in numbers

- 41 -
Economical, Technological and Environmental Impact Assessment of National Regulations
and Incentives for RE and EE: Country Report Egypt
Egypt.doc
• Y/N indicates indicators is a yes or no observation

- 42 -
Economical, Technological and Environmental Impact Assessment of National Regulations
and Incentives for RE and EE: Country Report Egypt
Egypt.doc
Table 5 Behavioural model of feed-in tariff for wind IPP
Behavioural
model
Indicators
Input Output Outcome Impact Risks Assumptions
• Prepare legisla-
tion and regula-
tions necessary
to implement
FIT
• Time of officials
and legislature
($)
• Published law
and regulations
(Y/N)
• Possible delays
in finding legis-
lative time
• Transco and
Regulator col-
laborate to de-
fine terms and
conditions to
ensure optimal
development of
sites
• Time of officials
and Transco
staff ($)
• Conditions de-
fined (Y/N)
• Supplementary
conditions
added to appli-
cations for FIT
• Control of de-
velopment will
be difficult
• Regulator and
Ministry col-
laborate to
specify re-
quirements for
local content
• Time of officials
in Ministry and
Regulator ($)
• Requirements
defined (Y/N)
• Supplementary
conditions
added to appli-
cations for FIT
• Status of local
manufacturers
in negotiations
enhanced
• Insufficient local
capacity; may
be a restraint
on competition
• Monitoring local
content may be
problematic

- 43 -
Economical, Technological and Environmental Impact Assessment of National Regulations
and Incentives for RE and EE: Country Report Egypt
Egypt.doc
Behavioural
model
Indicators
Input Output Outcome Impact Risks Assumptions
• Explain and
promote con-
cept; foster
stakeholder
groupings - ex-
perts, landown-
ers, municipali-
ties, etc
• Time of officials
in Ministry and
Regulator ($)
• Promotional ma-
terials, meetings
(#)
• Sensitised
stakeholders;
awareness of
opportunities (?)
• Stakeholder
bodies (#)
• Local and for-
eign investors
develop pro-
jects and made
preliminary ap-
proach to regu-
lator
• Time to prepare
feasibility stud-
ies ($)
• Consulting
support ($)
• Feasibility stud-
ies (#)
• Consortia
formed (#)
• Tariff set at lev-
els that pro-
mote too much
or too little in-
terest
• Local investors
feel comfortable
with technical
commercial and
financial issues
and with operat-
ing on the car-
bon market
• Detailed meas-
urements of
wind resource
performed
• Time of special-
ised consult-
ants ($)
• Wind regime de-
fined (Y/N)
• Costs of acquir-
ing data seen
as prohibitive
• Final project
form defined; fi-
nance ar-
ranged; land
rights acquired.
Submitted to
regulator
• Time of consor-
tia and consult-
ants ($)
• Final project
specification
and implemen-
tation arrange-
ments (#)
• Projects author-
ised (#)

- 44 -
Economical, Technological and Environmental Impact Assessment of National Regulations
and Incentives for RE and EE: Country Report Egypt
Egypt.doc
Behavioural
model
Indicators
Input Output Outcome Impact Risks Assumptions
• Auction of con-
cession where
there are com-
petitive bids
• Time of officials
in Ministry and
Regulator ($)
• Winning bid se-
lected (Y/N)
• Projects author-
ised (#)
• Transco adapts
network expan-
sion plan to
cope with timing
and nature of
developments
• Time of officials
in Ministry and
Regulator ($)
• Expansion plan
revised (Y/N)
• Authorised pro-
jects con-
structed and
commissioned
• Construction
schedule ob-
served because
of commercial
interest of
owner
• Equipment,
construction
costs, supervi-
sory costs ($)
• Completed plant
(Y/N)
• Power plant
commissioned
(Y/N).
• Developers
may delay or
withdraw for fi-
nancial or tech-
nical reasons –
little means of
control
• Plant operates
with high avail-
ability because
of commercial
interest of
owner
• Nominal cost of
balancing
power ($)
• Electricity gen-
eration (GWh)
• Fuel displaced
(GJ)
• Volume of elec-
tricity generated
(GWh).
• Volume of fuel
purchased for
power plant
(GJ).
• Financial cost
of power ac-
quired by
Transco on
terms of FIT ($).
• Value of gas
saved at oppor-
tunity cost ($).

- 45 -
Economical, Technological and Environmental Impact Assessment of National Regulations
and Incentives for RE and EE: Country Report Egypt
Egypt.doc
Behavioural
model
Indicators
Input Output Outcome Impact Risks Assumptions
• CO2 emissions
are reduced
from baseline;
gas burn is re-
duced from
baseline; do-
mestic manu-
facture is
strengthened;
net cost to
country is ac-
ceptable.
• Time to monitor
and evaluate
plant perform-
ance ($).
• Value of do-
mestic content
($).
• Volume of CO2
emission reduc-
tion (mt).
• Value of carbon
emission reduc-
tions ($).
• Net cost of pro-
ject ($).
• CO2 emissions
are reduced
from baseline;
gas burn is re-
duced from
baseline; do-
mestic manu-
facture is
strengthened;
net cost to
country is ac-
ceptable.
Note on symbols: • $ indicates indicator is measured in financial terms • # indicates indicator is measured in numbers • Y/N indicates indicators is a yes or no observation

46
Economical, Technological and Environmental Impact Assessment of National
Regulations and Incentives for RE and EE: Country Report Egypt
Egypt.doc
6.2.2.5 Result of the Comparison
Through consideration of this deconstructed specification of the policy instrument we can begin to as-
sess the merits of each instrument according to the objectives of the policy. The results of this com-
parison are shown in Table 2-3.
This case study is intended purely as an indication of the policy process and its relationship to evi-
dence and analysis. It is not intended to provide a definitive answer to the question of what policy in-
strument is desirable.
It does show that either instrument can be elaborated to provide a convincing option for implementa-
tion; it identifies some of the issues that need further exploration and some of the risks that need to be
managed before implementation is initiated.

47
Economical, Technological and Environmental Impact Assessment of National
Regulations and Incentives for RE and EE: Country Report Egypt
Egypt.doc
Table 6: Criteria for Choice among Options
Criterion Competitive Bidding Feed-in Tariff
Key objectives
Optimal development of the re-
source
Letting a large concession as a whole should reduce the dan-
gers of interference from sub-optimal location of turbines.
Uncoordinated development of sites could limit production from
the combined area. Might be avoided by detailed monitoring by
regulator, but at considerable effort.
Lowest cost and most manage-
able grid extension
A large concession in common ownership should ease the
problems over locating, sizing and timing grid interconnections.
Feed-in tariffs create a high degree of unpredictability in de-
mand for network reinforcement. Where projects are small, as
is the case with most existing feed-in systems, this may not be
a problem, but in the development of a large resource in
piecemeal fashion it might be difficult to manage.
Minimal administrative costs
These are significant in terms of preparing tender documents
and evaluating bids. Small in comparison to the project size.
There is a substantial effort required to provide the legislation
and regulation required to implement the policy. Subsequently
costs are low as tariff is for a standardised product.
Surprise-free procedures
There is the danger of withdrawal of the preferred bidder at a
late stage. The likelihood can be reduced by clear specification
of objectives and conditions and by consistency in negotiation.
In the event of such a withdrawal the bidder should forfeit
commitment fees and negotiations begun with the bidder next
in line.
Surprises can originate from unexpected responses to tariff
levels especially at early stages (see above).
Strong competitive pressures
for cost reduction on manufac-
turers
A concession implies a quota of output fixed within a narrow
range. There is some evidence that in quota systems because
the volume of turbine sales is fixed manufacturers are not moti-
vated to cut prices to extend sales. The value of this argument
in Egypt is debatable, because manufacturing technology is de-
termined by international costs and markets.
A feed-in tariff is alleged to encourage price cutting to encour-
age higher volumes of sales at lower costs in turn leading to
lower costs through higher volumes. There is some evidence
that this has happened on European markets, but the rele-
vance of this to the Egyptian case is low.

- 48 -
Economical, Technological and Environmental Impact Assessment of National Regulations
and Incentives for RE and EE: Country Report Egypt
Egypt.doc
Criterion Competitive Bidding Feed-in Tariff
Maximisation of local content
and development of local manu-
facturing capability
This is easily incorporated into the concession bidding. A lower
limit can be set and a clear weighting applied to content above
that limit. Monitoring of compliance is relatively straightforward
because there is just the single project to monitor. Penalties for
non-compliance can be exacted.
A lower limit of local content can be set as part of the regula-
tion. It would be more difficult to provide incentives to exceed
the limit. Compliance would be more cumbersome because of
the larger number of projects, but not impossible.
Lowest project price
Tender of a concession should ensure that the lowest cost and
most efficient operator wins the project and offers the lowest
price electricity.
There is a significant problem in determining the level of feed-in
tariffs. Feed-in tariffs if set too low will mean that no projects
are offered and if set too high will mean that many are offered
and the output is costly. Over time, by trial and error this can be
corrected.
Predictability of generation
Saving major failings of the bidding system the predictability of
the timing of generation additions should be good. The worst
scenario is that no bids are received, which is unlikely. If the
preferred bidder withdraws, there will be the next best candi-
date. Large commitment fees should be paid on contract set-
tlement and penalties for delays.
The development is less predictable; it depends upon how at-
tractive the feed-in tariff is.
Subsidiary Objectives
Transparent and non-
discriminatory allocation of sites
This is not an issue for the competitive tender, because the site
is allocated to the preferred bidder.
It is not obvious how to offer sites under a feed-in tariff. First-
come first served would be very hard to administer objectively
and transparently in conjunction with necessary technical quali-
fications. Offering a site to the best technical proposal would
equally be difficult; it would require penalties linked to deficient
performance to avoid spurious technical claims. Auctioning the
sites would seem to be the best option. That would entrain
considerable administrative costs, but would bring with it some
of the advantages of the competitive bidding process.
Minimise data acquisition costs Competitive tender allows bidders to appoint a joint agent for
measurement.
Under FIT a joint agent is less feasible. Data costs may be
higher.
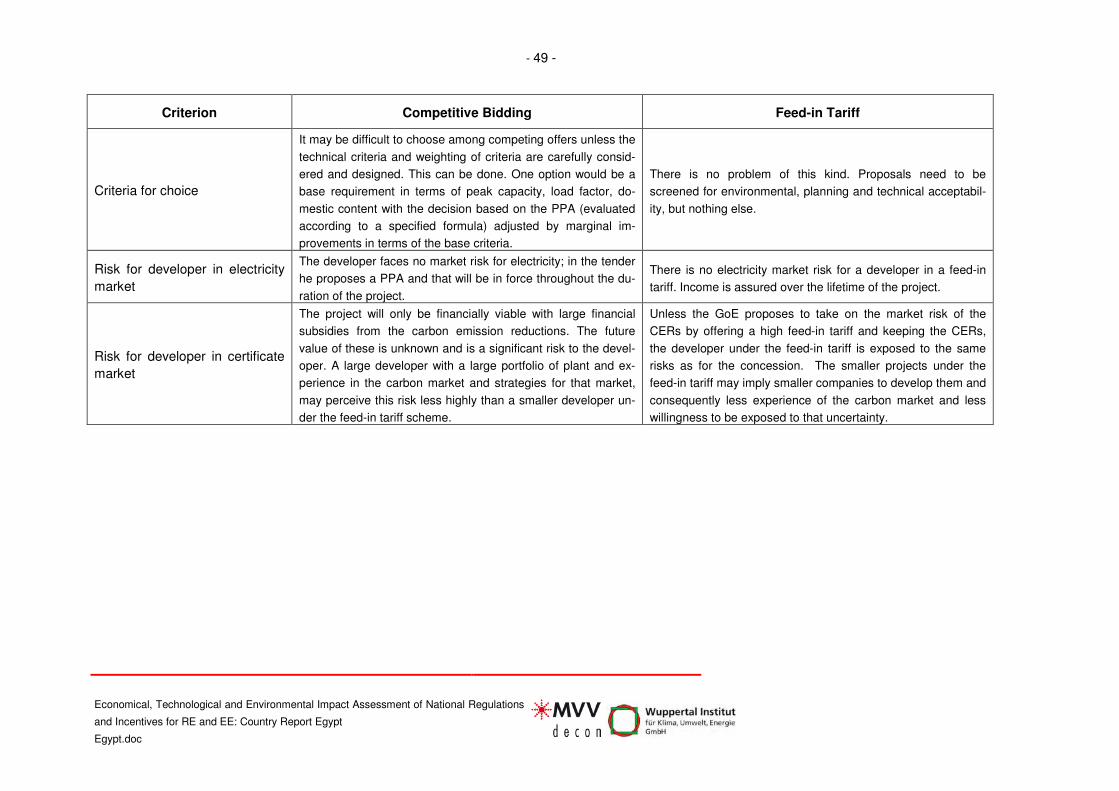
- 49 -
Economical, Technological and Environmental Impact Assessment of National Regulations
and Incentives for RE and EE: Country Report Egypt
Egypt.doc
Criterion Competitive Bidding Feed-in Tariff
Criteria for choice
It may be difficult to choose among competing offers unless the
technical criteria and weighting of criteria are carefully consid-
ered and designed. This can be done. One option would be a
base requirement in terms of peak capacity, load factor, do-
mestic content with the decision based on the PPA (evaluated
according to a specified formula) adjusted by marginal im-
provements in terms of the base criteria.
There is no problem of this kind. Proposals need to be
screened for environmental, planning and technical acceptabil-
ity, but nothing else.
Risk for developer in electricity
market
The developer faces no market risk for electricity; in the tender
he proposes a PPA and that will be in force throughout the du-
ration of the project.
There is no electricity market risk for a developer in a feed-in
tariff. Income is assured over the lifetime of the project.
Risk for developer in certificate
market
The project will only be financially viable with large financial
subsidies from the carbon emission reductions. The future
value of these is unknown and is a significant risk to the devel-
oper. A large developer with a large portfolio of plant and ex-
perience in the carbon market and strategies for that market,
may perceive this risk less highly than a smaller developer un-
der the feed-in tariff scheme.
Unless the GoE proposes to take on the market risk of the
CERs by offering a high feed-in tariff and keeping the CERs,
the developer under the feed-in tariff is exposed to the same
risks as for the concession. The smaller projects under the
feed-in tariff may imply smaller companies to develop them and
consequently less experience of the carbon market and less
willingness to be exposed to that uncertainty.

- 50 -
Economical, Technological and Environmental Impact Assessment of National
Regulations and Incentives for RE and EE: Country Report Egypt
Egypt.doc
6.2.3 Economic Cost-Benefit Assessment
6.2.3.1 Methodology Applied
To illustrate the importance of a reliable and transparent regulatory framework upon the decision of
private wind developers and upon the Egypt economy, an economic assessment of the wind energy
option will be presented.
The economic assessment of the wind energy option compares two alternatives to produce electric-
ity in Egypt:
• Combined Cycle Gas Turbines (CCGT) using natural gas,
• Wind energy.
The key parameters for the assessment are:
• Wind energy investment costs and potential wind energy production
• Investment costs for CCGT and performance data,
• Cost for natural gas,
• Return on equity requirements of independent power producers (IPP) for wind energy and CCGT
developers,
• Opportunity costs for capital in Egypt.
In the following sections the data base and the results of this comparison are presented. The presen-
tation makes reference to a similar study, which are recently executed by the International Institute for
Sustainable Development (IISD)3.
The considered planning period is 2010 till 2030. The general parameters are:
For the required return on equity the following assumptions were made:
• Wind energy developers: Considering the uncertainties related to wind energy in Egypt the devel-
opers will require a return on investment of 20%,
• CCGT developers: The investment in new CCGT units in Egypt is considered as a reliable busi-
ness, therefore a return on investment of 10% is considered as satisfactory.
Opportunity costs of capital in Egypt: 10%.
It has to be taken into consideration that the assessment is done in constant prices; this implies that
the stated interest rates are real values. Only for natural gas a price increase is considered over the
planning period.
6.2.3.2 Assumptions and Data Base
3 International Institute for Sustainable Development (IISD): Clean Energy Investment in Developing Countries - Wind Power
in Egypt / Draft for discussion (April 2009).

- 51 -
Economical, Technological and Environmental Impact Assessment of National
Regulations and Incentives for RE and EE: Country Report Egypt
Egypt.doc
6.2.3.2.1 Wind Energy
The data used for the assessment of the wind energy option are shown in Table 7. In this table a dif-
ference is made between the cost of the wind energy supply to be under the responsibility of the wind
energy IPP and the cost for stand-by capacity to be covered by the Egyptian electricity sector (or
CCGT IPPs).
Table 7: Data for Wind Energy
These assumptions are in accordance with the IISD Study:
• Investment costs: 1500 USD/kW,
• Cost for back-up: 600 USD/kWh and 330 USD/kW,
• Capacity factor: 45%, which corresponds to the expected operation condition of new wind energy
parks in Egypt,
6.2.3.2.2 Opportunity Costs for Natural Gas
Recent Price Development for Natural Gas
There is a surplus of natural gas in Egypt. The opportunity costs is thus the net value of export, more
specifically, as there is limited gas pipeline capacity for export, it is the net value of export as liquefied
natural gas (LNG). The prices do change quite significantly, as can be seen in Figure 6.
The cost for liquefaction has to be taken into account to determine the opportunity cost of Egypt's
natural gas. The resulting opportunity costs for Egypt's natural gas are in the range of 2.5
USD/MMBTU to 11.5 USD/MMBTU.

- 52 -
Economical, Technological and Environmental Impact Assessment of National
Regulations and Incentives for RE and EE: Country Report Egypt
Egypt.doc
Figure 6: US LNG Prices
Source WTRG Economics
Price Forecast Based on Crude Oil Prices
The US Department of Energy/Energy Information Agency has produced long-term forecasts of crude
and petroleum product prices to 2030 (EIA, 2009). This is an authoritative source; it may not be right,
but a great deal of effort and analysis has gone into its creation and it is a reasonable source to adopt.
The Figure 7 shows the forecasts of crude prices in real and nominal terms to 2030.
It is statistically clear that fuel prices are strongly correlated over the medium term. We use a formula
to describe a plausible relationship between LNG prices and crude oil prices. This formula is derived
from regression studies of the price of LNG in the Mediterranean basin. We recognise its limitations
and we accept that the nature of the long-term correlation between gas and crude is not clear, but it
offers a starting point to forecast LNG prices.
The formula we use is: y = 0.0805 x + 2.852
Where, y = LNG price in $/MMBTU and x = price of crude in $/tonne
This procedure gives a central case for LNG as shown in Figure 4-2. (Note: 1 MMBTU = 1.05 GJ).

- 53 -
Economical, Technological and Environmental Impact Assessment of National
Regulations and Incentives for RE and EE: Country Report Egypt
Egypt.doc
Figure 7: Forecasts of crude prices to 2030 (DOE/IEA)
0
20
40
60
80
100
120
140
160
180
200
2010 2015 2020 2025 2030
$/bbl Crude Oil (weighted
average) 2007 US$/bbl
" nominal prices
We propose to use real 2007 prices for the cost benefit analysis to avoid having to link the power pur-
chase agreement to inflation.
For the economic assessment the following prices are used:
• 2010: 8.5 USD/MMBTU
• 2020: 18.0 USD/MMBTU
The price development 2010 to 2030 was determined by linear interpolation.
Figure 8: Derived forecast of international LNG prices
0
2
4
6
8
10
12
14
16
18
20
2010 2015 2020 2025 2030
$/MMBTU
LNG 2007 US$ /
MMBTU
" nominal $/MMBTU

- 54 -
Economical, Technological and Environmental Impact Assessment of National
Regulations and Incentives for RE and EE: Country Report Egypt
Egypt.doc
Netbacks
The financing of LNG trains is complex. We make a very simple calculation here as a basis for further
reflection.
According to the IEA in 2003, a single LNG chain involves investment of around $5 billion for a typical
6.6 million tonne two-train project, (IEA, 2003). Assuming price escalation to 2009, this indicates a
value of about $6.5 billion, or roughly $1000 per 1 t/yr. Discounting at 15% over 20 years gives an an-
nual payment of $160 / t / yr, or a contribution of $200 / tonne to the price of LNG.
The calorific value of natural gas is about 44 MMBTU / tonne, so the contribution of capital to the long
run marginal cost of LNG is around $3.6 / MMBTU.
Losses of gas in processing (as fuel) are about 8%, say $0.3/MMBTU (this is based on the opportunity
cost of gas so implies iteration). The cost of transport to a European market and the cost of transport
of natural gas to the burner tip in the power station we have not estimated and we consider that the
net sum of these will be small compared to the uncertainties elsewhere in the calculation.
On this basis, if Egypt were faced with the choice of building a new LNG export train or burning the
gas in a power station, the opportunity cost of gas would be the international market price less about
$4 / MMBTU, ~= $3.6 + $0.3.
But domestic demand for gas in Egypt is growing and it s not certain that Egypt will build more LNG
trains. At present Egypt is obliged to buy natural gas from its joint venture companies at a price that
reflects international market prices. The is no reason why the JV partners should net out the liquefac-
tion costs, because the opportunity cost to them is the sales price fob and this is the basis on which
they presumably sell to Egypt. In this case the opportunity cost of gas to Egypt is related to the inter-
national fob price.
If domestic demand were to fall below the Egyptian share of production (which maybe unlikely) then a
similar argument would hold. As no new capital is involved, the opportunity cost of gas to Egypt is
again related to the fob international price.
We can conclude that the opportunity cost of gas to Egypt is between the international fob price and
that price less $4 / MMBTU and that probably it is closer to the international price. This therefore is the
value that we adopt.

- 55 -
Economical, Technological and Environmental Impact Assessment of National
Regulations and Incentives for RE and EE: Country Report Egypt
Egypt.doc
6.2.3.2.3 Combined Cycle Gas Turbine (CCGT)
The key-data for the CCGT alternative are given in Table 8. For the gas prices between 201 and 2030
a linear interpolation is used.
Table 8: Data for Combined Cycle Gas Turbine (CCGT)
6.2.3.3 Result of the Assessment
Figure 9 shows the projection of units cost for the two energy supply alternative. The increase in
CCGT unit costs is due to the assumed price increase (in real terms) for natural gas.
In addition to the base case, two price variations are considered:
• 30% higher gas prices
• 30% lower gas prices
With these projections of the unit costs it is possible to determine economic assessment criteria (the
cost of the CCGT-Natural gas alternative is the benefit of the wind power alternative). The results are
given in Table 9.
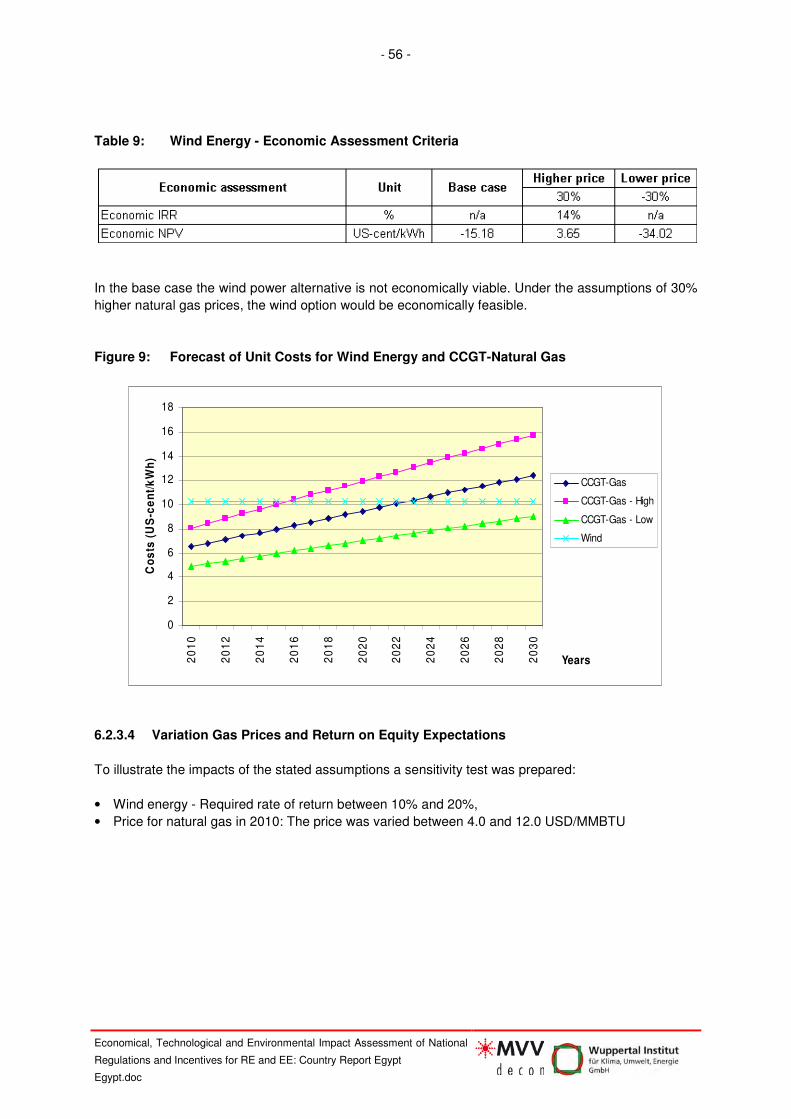
- 56 -
Economical, Technological and Environmental Impact Assessment of National
Regulations and Incentives for RE and EE: Country Report Egypt
Egypt.doc
Table 9: Wind Energy - Economic Assessment Criteria
In the base case the wind power alternative is not economically viable. Under the assumptions of 30%
higher natural gas prices, the wind option would be economically feasible.
Figure 9: Forecast of Unit Costs for Wind Energy and CCGT-Natural Gas
0
2
4
6
8
10
12
14
16
18
20
10
20
12
20
14
20
16
20
18
20
20
20
22
20
24
20
26
20
28
20
30
Years
Co
sts
(U
S-c
en
t/k
Wh
)
CCGT-Gas
CCGT-Gas - High
CCGT-Gas - Low
Wind
6.2.3.4 Variation Gas Prices and Return on Equity Expectations
To illustrate the impacts of the stated assumptions a sensitivity test was prepared:
• Wind energy - Required rate of return between 10% and 20%,
• Price for natural gas in 2010: The price was varied between 4.0 and 12.0 USD/MMBTU

- 57 -
Economical, Technological and Environmental Impact Assessment of National
Regulations and Incentives for RE and EE: Country Report Egypt
Egypt.doc
Table 10: Wind Energy - Impact of Gas Prices and IPP Wind Return Requirements
(NPV in USD per installed kW wind capacity)
The conclusion of this assessment is:
• Under the assumed long-term projection of the Natural Gas in 2030 of 18.0 USD/MMBTU the wind
energy option could be a very attractive for Egypt. The open issue is the level of gas prices in 2010.
• The key-issue is the return in investment expectation for wind energy. By developing an appropri-
ate and reliable legal and institutional framework for Wind Energy (reducing the return require-
ments from 20% down to 14% or 12% the economic viability of the wind energy option is secured
over a wide range of possible 2010 gas prices.
6.2.3.5 Carbon Credits
The economic rate of return on the investment is increased when we account for the economic bene-
fits of generating less greenhouse gases and in particular less carbon dioxide. This can be put in eco-
nomic terms by assuming a value for the reductions in carbon monetised by selling the certificates that
certify the reduction (CERs) on the appropriate exchange.
The certificates may be assigned to the developer or to the state. If they are assigned to the developer
then the PPA would be adjusted accordingly to bring the expected rate of return on capital back to the
required level. The CERs carry a risk, as their future value is not known. The optimal assignment of
CERs will depend on which partner can best manage that risk. This will vary from development to de-
velopment. If the developer is large and has a big portfolio of credits it may be best to add them to that
portfolio. In other circumstances the developer may be unwilling to accept the risk and would therefore
demand a disproportionately higher PPA and a better result might be obtained if the state took the
CERs.
The assignment does not affect the economic assessment of the project as a whole. The Table 11
shows the situation for two price levels for the carbon credits (20 and 50 USD/t CO2) and Figure 10
shows the economic net cash-flow for the wind option (based on one kW installed wind capacity.
The price level of 20 USD/ t CO2 would not be sufficient to achieve an economic feasibility of the wind
energy option for Egypt.
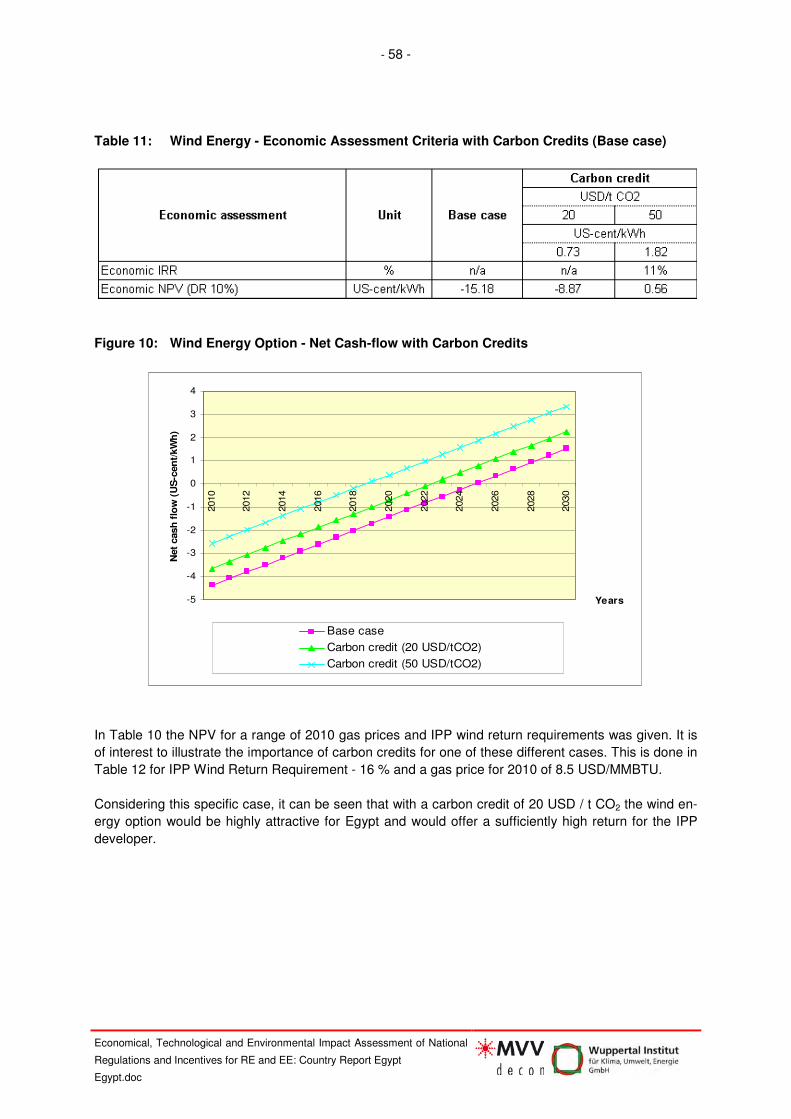
- 58 -
Economical, Technological and Environmental Impact Assessment of National
Regulations and Incentives for RE and EE: Country Report Egypt
Egypt.doc
Table 11: Wind Energy - Economic Assessment Criteria with Carbon Credits (Base case)
Figure 10: Wind Energy Option - Net Cash-flow with Carbon Credits
-5
-4
-3
-2
-1
0
1
2
3
4
2010
2012
2014
2016
2018
2020
2022
2024
2026
2028
2030
Years
Net
cash
flo
w (
US
-cen
t/kW
h)
Base case
Carbon credit (20 USD/tCO2)
Carbon credit (50 USD/tCO2)
In Table 10 the NPV for a range of 2010 gas prices and IPP wind return requirements was given. It is
of interest to illustrate the importance of carbon credits for one of these different cases. This is done in
Table 12 for IPP Wind Return Requirement - 16 % and a gas price for 2010 of 8.5 USD/MMBTU.
Considering this specific case, it can be seen that with a carbon credit of 20 USD / t CO2 the wind en-
ergy option would be highly attractive for Egypt and would offer a sufficiently high return for the IPP
developer.

- 59 -
Economical, Technological and Environmental Impact Assessment of National
Regulations and Incentives for RE and EE: Country Report Egypt
Egypt.doc
Table 12: Wind Energy - Economic Assessment Criteria with Carbon Credits
(IPP Wind Return Requirement - 16 % / gas price 2010 - 8.5 USD/MMBTU)
6.2.4 Conclusion
6.2.4.1 The Methodology
The case study demonstrates the advantages of developing deconstructed versions of policy prescrip-
tions as an aid to analysis and to stimulate focused debate among stakeholders.
It demonstrates the approach for the case of two policy options for wind and shows how the options
can then be analysed in the light of the policy objectives to form the basis for decision.
The study then demonstrates the linkage between this deconstructed specification and detailed eco-
nomic analysis.
6.2.4.2 Policy instruments for wind
It is beyond the purpose of this illustrative case study to draw definitive conclusions regarding the wind
energy option for Egypt and the involvement of private wind IPPs.
Some interesting aspects of the study are:
• Competitive bidding: The start of the tendering and bidding process might not require an elabo-
rated legal and contractual framework and business negotiations might be initiated very fast.
This policy option is appropriate for big wind parks on land that can be legally tendered as a single
concession.
Without a reliable sector strategy (development of the transmission network and required back-up
capacities) and stated sector policy objectives and legal / contractual framework, the negotiations
can be at risk.
• Feed-in tariff: The up-front efforts of this policy option are high because the appropriate feed-in
tariff has to be determined and the legal and contractual framework has to be developed.
There is some risk in the early stages that tariffs may be set too high or too low as there is little ba-
sis on which to proceed.
The standardised nature of the transaction makes it appropriate for small sites spontaneously of-
fered by developers.

- 60 -
Economical, Technological and Environmental Impact Assessment of National
Regulations and Incentives for RE and EE: Country Report Egypt
Egypt.doc
• Economic and commercial viability:
- The wind energy option can be economically justified, but the assessment shows that the main
issues are the opportunity cost of fuel and the return on equity requirements of the wind IPPs.
The wind energy option is only an economic viable option (considering the national perspective)
under quite restrictive conditions, namely:
- A power purchase agreement that is based on the opportunity costs of alternative supplies of
electricity,
- Sufficiently low perception of risk by the developer to bring discount rates down to say 16%
- Quite large credits for the carbon emissions that are avoided (higher than $20 / tonne)
- The commercial viability depends very much upon the offered / permitted return on investment
for the wind IPP. By establishing a reliable regulatory framework the perceived risk can be sig-
nificantly reduced so that a return requirement of 16% will be acceptable for wind IPPs.
- If the Government decides to hand over the certificates of CO2 emission reductions to the wind
IPP they will be part of the equity remuneration.

- 61 -
Economical, Technological and Environmental Impact Assessment of National
Regulations and Incentives for RE and EE: Country Report Egypt
Egypt.doc
7. Institutional Reform - Some Possibilities
The policy cycle is shown in the following figure.
Figure 11: Policy Cycle
formulate
Implement
monitorevaluate
reformulate Theory
Model
Indicators
Foresight Evidence
There are institutional needs at all stages of this cycle.
Decision making proceeds through the general processes available in the executive and legislative
branches of government. Normally policy briefs will originate from the executive and be elaborated by
Ministerial departments often with analytical support from agencies of government and paid consult-
ants and in consultation with other stakeholders. Primary legislation is debated and finally sanctioned
by the legislature. In many countries Ministerial Decrees are used to elaborate on primary legislation.
This structure needs to be properly serviced with evidence and analysis if it is to work well. There is a
need for an institution, or perhaps several, to gather and maintain evidence and to carry out analytical
work that feeds into the formulation of policy and later guides the monitoring and evaluation and re-
formulation of policy. Foresight studies are a part of the evidence that should be considered in policy
formulation and these should take into account the evolution of global trends and policies in energy
and the environment, but also of trends beyond these disciplinary frontiers.
Implementation of policy may be conducted by Ministerial departments or nominated agencies. In de-
veloped countries, implementation is often assigned to specialist agencies. In developing countries it
is more common that policy is implemented by the Ministry. Implementation will often be demanding of
resources, this may be the case for some market based instruments as well as the majority of regula-
tions.
In Egypt the decision-making structure for energy policy has been strengthened by the revitalisation of
the Supreme Council of Energy. The Supreme Energy Council was established in 1979, but was never
convened. It has recently been revived and will take over the strategic functions of energy policy. The

- 62 -
Economical, Technological and Environmental Impact Assessment of National
Regulations and Incentives for RE and EE: Country Report Egypt
Egypt.doc
members include all Departments with substantial interests in the energy sector.
It is less clear that Egypt possesses a stable structure for accumulating a reliable basis of evidence,
analysis and foresight on which to base policy and upon which to test a range of policy instruments.
This function was originally to be performed by the Organisation for Energy Planning (OEP) which was
intended to service the Supreme Council. As the Council never functioned the OEP was left without a
role; it was passed around among Ministries and eventually disbanded. Much good work is carried out
within particular agencies and institutions at the regulatory and operating levels, but a coordinating
view at policy level appears to be lacking.
The Supreme Council will now be supported by a small secretariat in the Cabinet Office known as the
National Council for Energy Efficiency. There could be a case for strengthening this body and making
it the analytical centre for energy policy. The access to all relevant Ministries and to a forum for inter-
Ministerial conflict resolution offers a unique opportunity for developing cohesive and sustainable pol-
icy.
An important priority of such a centre should be to examine possible redistributive mechanisms to ac-
company price reform. The Supreme Council, uniting all relevant Ministries, is the proper forum to
elaborate a practical and operational policy for domestic price reform. This would constitute the single
most effective instrument to promote both renewable energy and energy efficiency. All other instru-
ments of intervention will be only partly effective when introduced into a regime of persistent subsidy.
There is a great deal of analysis that suggests energy tariffs are largely regressive and benefit the rich
more than the poor. The key to price reform is to ensure that monies saved by reducing subsidies are
redistributed in ways that benefit the poor and there is now considerable experience of how this can
be done.
There is a gap regarding the institutional capacities for renewable energy and energy efficiency poli-
cies in Egypt. Whereas capacities for renewable energies are well developed, there is a lack of suffi-
cient administrative structures for energy efficiency policies.
The New & Renewable Energy Authority (NREA) was already established in 1986. NREA's mission is
to promote renewable energies and to assist in the development of a national plan for renewables.
With its 996 staff (data according to NREA annual report 2007/2008) it is well equipped. NREA will be
a key player for the implementation of the ambitious government target of 20 % of electricity from re-
newable energy by 2020 including 12 % grid-connected wind power (7200 MW). NREA will also de-
velop its own projects. Until 2020, it is anticipated that about 400 MW per year will be undertaken by
the private sector and NREA will carry out about 200 MW per year.
NREA has done a very good job in setting renewable energies on the political agenda in Egypt, raising
awareness and implementing first projects. It is also a developer; it owns and operates all existing
wind farms in Egypt and is planning several more. It is also effectively a regulator; it establishes rules
and procedures for allocating land for wind farms to developers and it acts as a national planning
agency for renewable. There are conflicts of interest in the discharge of these various functions. There
are many possible ways of restructuring NREA; a sensible partition of duties would be to assign the
regulatory role to the electricity regular and to separate the rest of NREA into a commercial developer
and an agency for research and promotion. The latter function might well be combined with the duty of
promoting energy efficiency. The commercial arm might be kept in state ownership, though it could
also be privatised.
With its testing certification activities NREA is also of importance for energy efficiency and improved
efficiency of energy use in Egypt. NREA operates the testing laboratories for standards for refrigera-

- 63 -
Economical, Technological and Environmental Impact Assessment of National
Regulations and Incentives for RE and EE: Country Report Egypt
Egypt.doc
tors, washing machines, air conditioners and electric water heaters. But unlike in the field of renewable
energies NREA is not responsible for developing policies for energy efficiency and carrying out pro-
jects to contribute to fulfil the 8,3 % reduction target of the predicted energy consumption for 2020.
There is no energy efficiency agency in Egypt. Previously the Organisation for Energy Planning had
some functions in the sector and was involved in the early work on appliance standards, but it has
been disbanded. Government appears to favour the concept of a disbursed responsibility for energy
efficiency within relevant Departments guided by the Supreme Council of Energy supported by the Na-
tional Council for Energy Efficiency. This seems to be a weak solution, but it reflects a common ap-
proach within the Egyptian administration to start with a small activity and then subsequently to build
up and strengthen the legal basis as experience is gained. It is possible that the National Council for
Energy Efficiency will evolve into a substantial agency with strong legal powers. In our view a strong
agency is justified, combining the analytical functions of the National Council with the operating func-
tions of NREA in energy efficiency and holding responsibility for implementing other instruments.
Among the instruments that might merit consideration is a revolving Fund to provide incentives for en-
ergy efficiency. The subsidies to energy are so large that the government budget benefits considerably
when a user invests in efficiency. Part of the gain to the budget can be used to replenish the Energy
Efficiency Fund as it is disbursed. This idea is being studied by the Committee on Energy Efficiency in
Industry established by Decree of the Ministry of Industry. The administration of such a Fund would fall
naturally within the purview of the agency that we propose.
Implementation of regulations on energy efficiency is not an easy task and developing countries as a
class experience difficulties in this respect. Standards and labels for appliances are especially de-
manding of resources to monitor compliance. Compliance with the appliance standards in Egypt at
present is voluntary and there is no systematic procedure to ensure compliance with labels and to de-
tect fraud. This will be necessary when the scheme is made mandatory. The regulations for buildings
are mandatory, but it is not clear whether the capacity of the Ministry of Housing to achieve regulatory
compliance is sufficient. There has been much work done in industrialised countries on methods of ob-
taining acceptable regulatory compliance at reasonable cost and this may be an area where technical
cooperation would be useful.

- 64 -
Economical, Technological and Environmental Impact Assessment of National
Regulations and Incentives for RE and EE: Country Report Egypt
Egypt.doc
Annex 1
Mission Report

- 65 -
Economical, Technological and Environmental Impact Assessment of National
Regulations and Incentives for RE and EE: Country Report Egypt
Egypt.doc
The country mission was successfully completed in the time span of 2 to 8 June 2009. Because it was
the first country mission and because the mission included the project kick-off meeting with RCREEE,
it was scheduled slightly longer than the average duration of five days per country mission.
The mission programme was as follows:
Date Programme Item
2 June Travel day
2 June internal team meeting, briefing by national specialist
3 June Meeting with GCEEE
3 June Project kick off meeting at RCREEE
3 June Meeting at New and Renewable Energy Authority (NREA)
3 June Meeting at World Bank office Cairo
4 June Meeting with Electricity Regulatory Agency
4 June Meeting with UNDP GEF
4 June Meeting with Egyptian Environmental Affairs Agency
5/6 June internal project team meetings and preparation of seminar presentations
7 June Seminar
7 June Meeting with Committee on Energy Efficiency in Industry
8 June internal team meeting discussion of report inputs
8 June return travel
A list with the names and the coordinates of the interlocutors is attached in Annex 2. It also indicates
the participants in the half-day seminar.
The seminar had some thirty participants. It was very gracefully hosted by RCREEE, which gave the
workshop a proper standing. The participants were mainly the persons that had been visited in the
previous days, plus some whose schedule had not allowed meeting us separately. The seminar pro-
gramme is attached in Annex 3. The main objectives of the seminar were to discuss methodologies of
policy development and evaluation and to discuss the findings on Egypt as developed during the
course of the project mission.
The information collected in preparation of the mission and during its implementation had been organ-
ised in a Matrix system that had been prepared beforehand. The resulting tables were distributed to all
participants and the seminar offered the opportunity to provide clarifications. In this context it was es-
pecially important to note that the main thrust of the project is towards the development of EE and RE
policies and that the project will not engage in the comprehensive collection of energy data like for in-
stance energy balances. The Tables giving the overview of available information is attached in Annex
4.
The main presentation of the seminar was on evidence based policy development and theory based
policy evaluation. The presentation is attached in Annex 5. These notions of policy development obvi-
ously were quite new to the participants, who took them up attentively, but only engaged into a discus-
sion, after the theoretical concepts were translated into some policy issues that are presently relevant
in Egypt, like for instance the policy for developing a massive wind power programme. The importance
of case studies became evident and they therefore take a significant space in this country report.
Finally the seminar was used to give a preview on the three day workshop on EE and RE policy de-
velopment. The presentation is attached in Annex 6.

- 66 -
Economical, Technological and Environmental Impact Assessment of National
Regulations and Incentives for RE and EE: Country Report Egypt
Egypt.doc
Annex 2
List of Stakeholders

- 67 -
Economical, Technological and Environmental Impact Assessment of National
Regulations and Incentives for RE and EE: Country Report Egypt
Egypt.doc
Entity Person name Position Phone, Fax & e-mail Notes
attended the WS or
some one attended on
their behalf
Regional Centre for Renewable Dr. Kilian Baelz Acting Director - Head of Interim T +2 02 241 54 691 Host / attendedF +2 02 241 54 661
M +2 017 33 44 365
w www.rcreee.org
Eng. Samir Hassan Deputy Head of Interim Secretariat
RCREE Technical StaffProf. Adel Khalail RCREE Board member M +2 012 35 55 523
Egyptian German High Level Joint
Committee for Renewable Energy, Dr. Paul Suding Program Director Email: [email protected] attended
Mob: +2 018 9888795
Tel: +2 2 22702793 ext. 111
Fax: +2 2 22702699 ext 104
Eng. Sayed Emam Program Co-director Email: [email protected]
Mob: +2 012 7920241
Tel: +2 2 22702793 ext.106
Fax: +2 2 22702699 ext 104
Econ. Maryame Georgis Communication Coordinator Email: [email protected]
Mob: +2 018 9888150
Tel: +2 2 22702793 ext. 102
Fax: +2 2 22702699 ext 104
NREA Eng. AbdelRhman Salah Executive Director T +202 2271 8505 two attended on this T +202 2271 3176M +2 010 168 0222
World Bank Dr. Mohab Hallouda Senior Energy Specialist M +2010 660 0676 was not able to attend
UNDP/GIF national project- EEIGGR Dr. Ibrahim Yassin Project Technical Director 012-349 0541 attended
Electricity Regulatory Agency Dr. Hafez ElSalamawy Managing Director 012-318 6900 attended
UNDP Dr. Mohamed BayoumiAssistant Resident Representative
UNDP012- 3294510
KFW Dr. Andreas Holtkotte Director T +20 22 736 9525 / -7496 attended
F +20 22 736 [email protected]
Ministry of Petroleum M. Sc. Ahmed Abdrabo Environmental Affairs A. General Office: + 202 22766543 attendedFax: + 20226706419Email: [email protected]
Eng. Osama Nour EL Din Petroleum Affairs General Manager Office 202 22766328Fax: + 20226706419Email: [email protected]
Ministry of Environment Dr. Alsayed Sabry Mansour Coordinator, Climate change Unit, EEAA Email: [email protected] attended
Office: +202 252466162-
fax: +202 25246162
Email: [email protected]
UNIDO Dr. Paul Makin UNIDO Representative & Head Regional [email protected] was not able to attend
office +202 2794 3477
fax: +202 2792 1199
MOEE Dr. Khalil yasso First under Secretary office: +202 22616321 Dr. Ibrahim Yassin
Fax: +202 22616234
Email: [email protected]
MOEE Eng. Mohamed Moussa First under secretary for planning and office: +202 24051162
Fax: +202 22616302
Email: [email protected]
WEC Dr. Emad El-Sharkawy Chairman of WEC/ Egypt Office: +202 24012368
Fax: +202 24011630
Email: [email protected]
Transmission Company Eng. Abdel Hady Sedeek Head of Project &Studies Sector office: +202 22616517
Fax: +202 22616517
Email: [email protected]
Egyptian Holding Company Dr. Mohamed Awad EEHC Chairman office: +202 22616306

- 68 -
Economical, Technological and Environmental Impact Assessment of National
Regulations and Incentives for RE and EE: Country Report Egypt
Egypt.doc
Annex 3
Seminar Programme
- 69 -
Economical, Technological and Environmental Impact Assessment of National
Regulations and Incentives for RE and EE: Country Report Egypt
Egypt.doc
Methodology and Policy for Energy Efficiency and Renewable Energies Half-day Seminar - Egypt, 7 June 2009, 10:00 - 13:00
1. Welcome, by RCREEE
2. Introduction to the Project and to the Seminar, by the project team leader, Florian Sauter-
Servaes
3. Methodology: Evidence based Policy Making and Theory based Evaluation, by Nigel Lucas
4. Status of EE and RE Policies and their Development in Egypt, by Mohammed ElSobki (Jr.)
and Danyel Reiche
5. Preview on Three-day Training Workshop, November 2009, by Martin Ehrlich
6. General Discussion

- 70 -
Economical, Technological and Environmental Impact Assessment of National
Regulations and Incentives for RE and EE: Country Report Egypt
Egypt.doc
Annex 4
Data Matrix

- 71 -
Economical, Technological and Environmental Impact Assessment of National
Regulations and Incentives for RE and EE: Country Report Egypt
Egypt.doc
Part I Regulations / incentive schemes
Primary Legisla-tion
Laws, Directives (e.g. Algerian Law on Electricity and Gas Distribution which
contains a general strategy and incentives for the promotion of renewable en-
ergy).
Secondary Legis-lation
Decrees or implementing regulations which regulate the implementation of pri-
mary legislation (e.g. Algerian Decree on the Diversification of Power Generat-
ing Costs which specifies incentives of the Law on Electricity and Gas Distribu-
tion by introducing feed-in tariffs).
Policy Statements Official statements of relevant political decision-makers (e.g. minister for en-
ergy).
Under Discussion Law is being discussed by legislative institutions and/or is in draft phase al-
ready.
Adopted Law has been adopted by legislative institutions.
Implemented Law is in the process of implementation.
Targets/Aims Both specific targets (e.g. 10% of electricity from renewable sources by 2010)
and general aims (e.g. promotion of renewable energy) formulated in regula-
tions.
Instruments “Tools” or mechanisms selected to achieve targets/aims of a regulation (e.g.
feed-in tariffs, standards).
Duration Timeframe of regulations (e.g. a law is effective until 2011 or shall be amended
by 2011).
Governmental En-tities
E.g. ministries (Ministry for Environment) or agencies (e.g. national energy
agency).
Industry E.g. utilities, state companies
Non-governmental or-ganisations
E.g. renewable energy associations, industry associations, environmental or-
ganisations

- 72 -
Economical, Technological and Environmental Impact Assessment of National
Regulations and Incentives for RE and EE: Country Report Egypt
Egypt.doc
Renewable Energy and Energy Efficiency: Regulations / incentive schemes
Basic Information Content Impact Analysis (if available)
Type of
Law
Title
of
Law
Year Responsible
Institution
Status* Source Targets/
Aims
Instruments Dura-
tion
Title of
Analysis
Ye-
ar
Author Source
UD A I 1)
2)
3)
1)
2)
3)
Primary
Legislation
Elec-
tricity
Law
2009
MOEE (Ministry
of Electricity
and Energy)
X X
Regulatory
Agency and
MOEE
Regulate the
electricity market
and move to a
liberalized mar-
ket
Licensing
Not available
Promote renew-
able energy
Competitive
Bidding and
feed-in tariffs
as wells as bi-
lateral agree-
ments
20-25
years
(com-
petitive
bidding)
15
years
(feed-in
tariffs)
Promote energy
efficiency
Guaranteed
purchase of
CHP
Secondary
Legislation
De-
cree
102 of
estab-
1986 MOEE X NREA Promote renew-
able energies
Developing
own projects.
Assisting in the
development of
unlim-
ited
n.a.

- 73 -
Economical, Technological and Environmental Impact Assessment of National
Regulations and Incentives for RE and EE: Country Report Egypt
Egypt.doc
lish-
ment
of
NREA
a national plan
for renewable.
Testing certifi-
cation activi-
ties.
De-
cree
of es-
tablis
hment
of
Regu-
latory
au-
thority
2000 MOEE X Egyptian
Electric
Utility and
Consumer
Protection
Regulatory
Agency
Moderating and
liberalizing the
electricity market
Licensing, set-
ting market
rules and
benchmarking
unlim-
ited
n.a.
En-
ergy
effi-
ciency
for
com-
mer-
cial
build-
ings
To be
is-
sued
end
of
2009
Ministry of
Housing (MOH)
En-
ergy
effi-
ciency
for
resi-
den-
tial
build-
2006 MOH

- 74 -
Economical, Technological and Environmental Impact Assessment of National
Regulations and Incentives for RE and EE: Country Report Egypt
Egypt.doc
ings
En-
ergy
effi-
ciency
for
gov-
ern-
men-
tal
build-
ings
To be
is-
sued
end
of
2009
MOH
Test-
ing
stan-
dards
for
Refrig
frigera
era-
tors
2006 NREA X NREA An-
nual report
Improved Effi-
ciency of energy
use
Obligatory test-
ing and certifi-
cation for both
local manufac-
tured and im-
ported prod-
ucts
unlim-
ited
n.a.
Test-
ing
stan-
dards
for
Wash-
ing
ma-
chines
2006 NREA X NREA An-
nual report
Improved Effi-
ciency of energy
use
Obligatory test-
ing and certifi-
cation for both
local manufac-
tured and im-
ported prod-
ucts
unlim-
ited
n.a.
Test-
ing
stan-
dards
2008 NREA X NREA An-
nual report
Improved Effi-
ciency of energy
use
Obligatory test-
ing and certifi-
cation for both
local manufac-
Unlim-
ited
n.a.

- 75 -
Economical, Technological and Environmental Impact Assessment of National
Regulations and Incentives for RE and EE: Country Report Egypt
Egypt.doc
for Air
Condi-
tion-
ers
tured and im-
ported prod-
ucts
Test-
ing
stan-
dards
for
Elec-
tric
Water
Heat-
ers
2007 NREA X NREA An-
nual report
Improved Effi-
ciency of energy
use
Obligatory test-
ing and certifi-
cation for both
local manufac-
tured and im-
ported prod-
ucts
unlim-
ited
n.a.
Policy
statements
Na-
tional
Strat-
egy
for
wind
en-
ergy
up to
2020
2008 Supreme
Council of En-
ergy
X X NREA an-
nual report
20 % of electric-
ity by renewable
energy until 2020
including 12 %
grid-connected
wind power (7200
MW).
n.a. 2020 n.a.
Na-
tional
Strat-
egy
for en-
en-
ergy
effi-
ciency
up to
2008 Supreme
Council of En-
ergy
X X National
Energy
committee
by the rul-
ing party (in
Arabic)
8,3 % reduction
of the predicted
energy consump-
tion.
n.a. 2020 n.a.

- 76 -
Economical, Technological and Environmental Impact Assessment of National
Regulations and Incentives for RE and EE: Country Report Egypt
Egypt.doc
2020
UD: Under Discussion and/or in draft phase; A: Adopted; I: Implemented
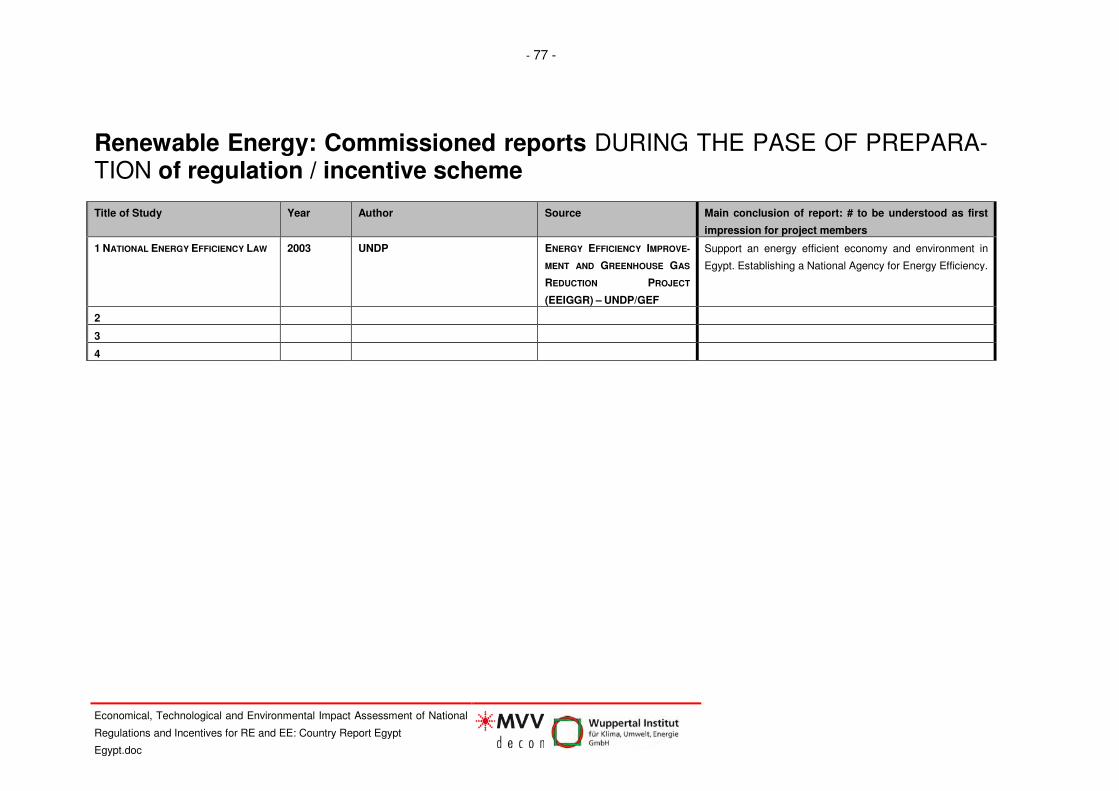
- 77 -
Economical, Technological and Environmental Impact Assessment of National
Regulations and Incentives for RE and EE: Country Report Egypt
Egypt.doc
Renewable Energy: Commissioned reports DURING THE PASE OF PREPARA-TION of regulation / incentive scheme
Title of Study Year Author Source Main conclusion of report: # to be understood as first
impression for project members
1 NATIONAL ENERGY EFFICIENCY LAW
2003 UNDP ENERGY EFFICIENCY IMPROVE-
MENT AND GREENHOUSE GAS
REDUCTION PROJECT
(EEIGGR) – UNDP/GEF
Support an energy efficient economy and environment in
Egypt. Establishing a National Agency for Energy Efficiency.
2
3
4

- 78 -
Economical, Technological and Environmental Impact Assessment of National
Regulations and Incentives for RE and EE: Country Report Egypt
Egypt.doc
Renewable Energy: Evaluation reports on IMPACT of regulation / incentive scheme
Title of Study Year Author Source Main conclusion of report: # to be understood as first
impression for project members
n.a.
2
3
4
Current Status of Renewables
Total electricity generated by the utility per year GWh 62336,3 67981,086 73310 77956 83003 88951 94913 100996 108368 115407 125129
electricity generated – Gas non coalfired GWh 50114,7 52694,299 58628 64006 67578 75811 81449 87760 95136 101487 108424
electricity generated – Coal GWh 0 0 0 0 0 0 0 0 0 0 0
electricity generated - Solar, Wind GWh 0 0 23 137 221 204 368 523 552 616 831
electricity generated - Combustible renewables and waste GWh 0 0 0 0 0 0 0 0 0 0 0
electricity generated – Nuclear GWh 0 0 0 0 0 0 0 0 0 0 0
electricity generated – Hydro GWh 12221,6 15287 14659 13697 15130 12859 13019 12644 12644 12925 15510
Installed capacity for generation of electricity MW 13308 13935 14582 15286 16648,5 17671 18119 18544 20452,2 21944 22583
Installed capacity for generation – Nuclear MW 0 0 0 0 0 0 0 0 0 0 0
Installed capacity for generation – Hydro MW 2810 2810 2745 2745 2745 2745 2745 2745 2783,4 2783 2842
Installed capacity for generation – Solar, Wind MW 0 0 19 63 63 63 140 140 183 225 305
Installed capacity for generation – Combustible renewables and waste MW 0 0 0 0 0 0 0 0 0 0 0
Installed capacity for generation – Thermal MW 10498 11125 11818 12478 13840,5 14863 15234 17706,5 17485,8 18936,5 19436,5

- 79 -
Economical, Technological and Environmental Impact Assessment of National
Regulations and Incentives for RE and EE: Country Report Egypt
Egypt.doc
Renewable Energy: Institutions
Institution General Responsibilities of In-
stitution
Number of
Staff
Budget
(Mill. $ per
year)
Link/Contact Involvement
in legislation
process?
Y/N
Governmental entities
NREA Development of renewable en-
ergy projects and policies.
996 n.a. www.nrea.gov.eg/ Yes
Energy council of the minis-
try for trade and industry
Policy Development and advice
of the ministry for energy effi-
ciency
9 (not full-
time)
n.a. n.a. Yes
Egyptian Electricity Trans-
mission Company (EETC)
Dispatching and transmitting
electricity between generation
and distribution utilities/large
customers
About
31,000
n.a. Yes
Egyptian Electricity Regula-
tory Agency
Regulate the electricity market
and move to a liberalized mar-
ket
60 n.a. www.egyptera.org Yes
Industry (e.g. utilities, state
companies)
Industrial Modernisation
Centre
Assist the industrial sector to
be competitive and to promote
energy efficiency and renew-
able energy industries and ap-
plications.
About 200 n.a. www.imc-egypt.org Yes
Non-Governmental Organi-
sations (including industry

- 80 -
Economical, Technological and Environmental Impact Assessment of National
Regulations and Incentives for RE and EE: Country Report Egypt
Egypt.doc
associations etc.)
Energy Committee of the
ruling party (National De-
mocratic Party)
Policy Development and advice
of the government for energy
related issues
35 (not full-
time)
none n.a. yes
Energy Committee of the
Federation of Egyptian In-
dustries
Promote energy efficiency and
renewable energy industries
and applications.
5 About
15,000
n.a. yes
Egyptian Junior Business-
men Association
Promote energy efficiency and
renewable energy industries
and applications.
500 (not full-
time)
n.a. www.ejb.eg.org no
Egyptian German Joint
Committee (JCEE)
Support of services for energy
efficiency and renewable en-
ergy issues
3 3 million
2009-2011
http://www.jcee-
eg.net/
yes
Arab-German Business As-
sociation
Support of services for energy
efficiency and renewable en-
ergy issues
n.a. www.ahk-mena.com/ no
Regional Center for
Renewable Energy &
Energy Efficiency (RECREE)
Promote energy efficiency and
renewable energy in the MENA
countries
n.a. http://www.rcreee.org/ no
Energy Committee of the
American Chamber in Egypt Participate in and provide effec-
tive support to ongoing gov-
ernment efforts to restructure
the Oil & Gas Sector and the
Power Sector (including Re-
newables); enhance the Energy
Sector's economic performance
and sustainability; Support re-
form efforts to gradually elimi-
nate energy subsidies.
n.a. www.amcham.org.eg/ no
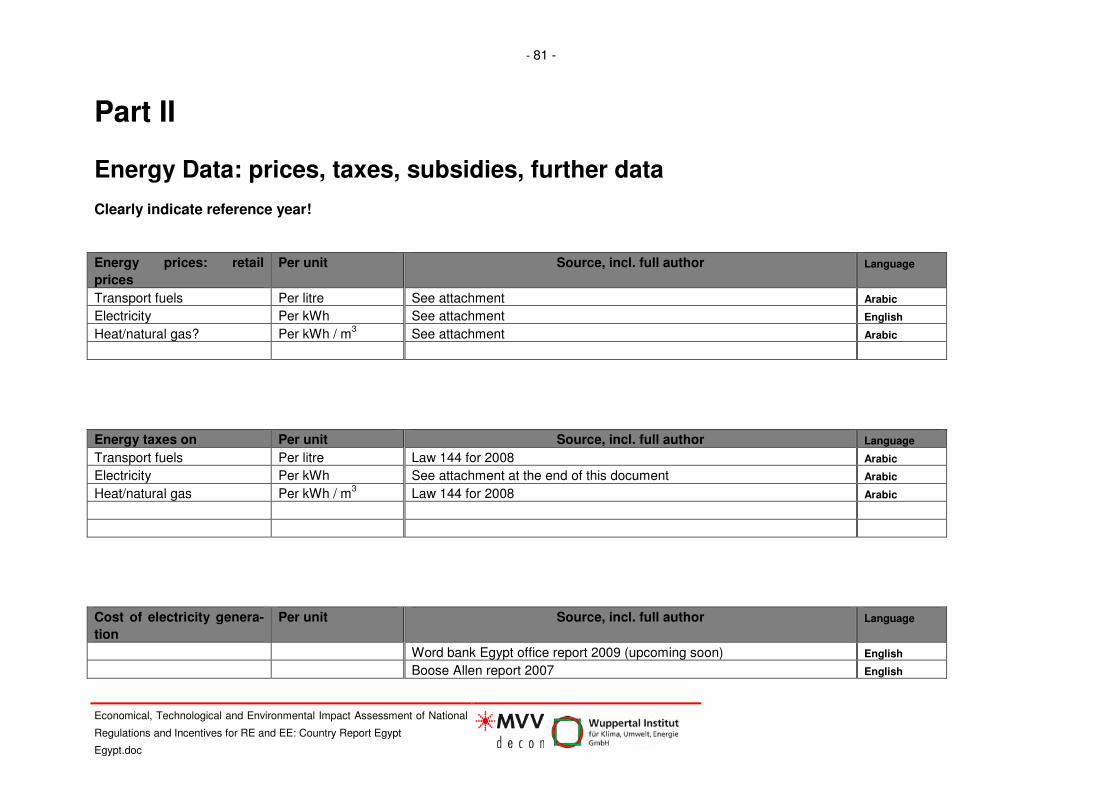
- 81 -
Economical, Technological and Environmental Impact Assessment of National
Regulations and Incentives for RE and EE: Country Report Egypt
Egypt.doc
Part II Energy Data: prices, taxes, subsidies, further data Clearly indicate reference year!
Energy prices: retail
prices
Per unit Source, incl. full author Language
Transport fuels Per litre See attachment Arabic
Electricity Per kWh See attachment English
Heat/natural gas? Per kWh / m3 See attachment Arabic
Energy taxes on Per unit Source, incl. full author Language
Transport fuels Per litre Law 144 for 2008 Arabic
Electricity Per kWh See attachment at the end of this document Arabic
Heat/natural gas Per kWh / m3 Law 144 for 2008 Arabic
Cost of electricity genera-
tion
Per unit Source, incl. full author Language
Word bank Egypt office report 2009 (upcoming soon) English
Boose Allen report 2007 English

- 82 -
Economical, Technological and Environmental Impact Assessment of National
Regulations and Incentives for RE and EE: Country Report Egypt
Egypt.doc

- 83 -
Economical, Technological and Environmental Impact Assessment of National
Regulations and Incentives for RE and EE: Country Report Egypt
Egypt.doc
Subsidies Per unit Total (bn US$/a) Source, incl. full author
Transport fuels Per litre
n.a.
e.g. National energy subsidies report,
NEEA 2009
Electricity Per kWh
n.a. (are abolished
until 2014)
Heat/natural gas Per kWh / m3
n.a.

- 84 -
Economical, Technological and Environmental Impact Assessment of National
Regulations and Incentives for RE and EE: Country Report Egypt
Egypt.doc
Further Energy Statistics If you find reports and studies on the following topics during your investigations, please list these here. Topic Title of Report Yea
r
Author #
for cita-
tion in ref-
erence list
Full author Lan-
guage
Energy statistics: primary energy de-
mand, final energy demand
National paper on energy and development by the Na-
tional Democratic Party
(Expected / Targeted Future Energy Status up 2022)
2007 NDP Arabic
(transla-
tion in
presen-
tations)
Potentials of renewable energies
Wind atlas
De-
cem-
ber2
005
NREA English
Solar atlas 1991 NREA English
Energy efficiency potentials
National paper on energy and development by the Na-
tional Democratic Party
(Expected / Targeted Future Energy Status up 2022)
2007 NDP Arabic
(transla-
tion in
presen-
tations)
Energy efficiency and environment protection project
(ECEP)
1989/
1997
USAID English
- 85 -
Economical, Technological and Environmental Impact Assessment of National
Regulations and Incentives for RE and EE: Country Report Egypt
Egypt.doc
Part III
List of References United Nations Department of Economic and Social Affairs (2003): ENERGY CONSERVATION PROGRAM FOR ELECTRIC MOTOR-DRIVEN SYS-
TEMS
Internet links
www.nrea.gov.eg/
http://www.jcee-eg.net/
http://www.rcreee.org/

- 86 -
Economical, Technological and Environmental Impact Assessment of National
Regulations and Incentives for RE and EE: Country Report Egypt
Egypt.doc
ا�������� م وا����������ت
ــ�م و ــ ا���ـ ــ�ت ��ـ ا����ــ
ــ ــ���� ا���ـــ�/ا����ــ ــ ا���ـــ ��ـــــ ا����ـــ
��ـــــــ����� ــ ا�!ـــــ� � ــ�ار/ا��ـــــ�#�ن ��ـــ ا��ـ
3 +��ــــــ* ا���ــــــ���(�) *&��ـــ &�ر ـــ%
ــ- ــ% و�ـ ــ% ا��.� ـ �ـ/
�ـــ� � 2ـــ) آـــ0 /ـــ�م
( �� (�ــــ
ــ� ���ــــــ�دة 796��ــــ
ــ�ة 2) ) أ(��ــــــــ
111.ق���80ــــــــــ
.وا��.ـــــ%ل ��ـــــ�#�ن
104 �ــ 224 ، ��87ــ
�ــ 2 ، ��89ــــــ
�ــ ��93ــ
*&��ـــ إ�ــــ��Fك
+��ــ* • ا���ـــــــــ���(�)
����/ــــ%ا ا���ــــ�زل(��/�� وا�Iـــــــــ
ا���ـــــــــ���(�) •(��/�� ا�Iـــــــــ
0.03
0.006
س.و./ـــــ) آـــــ0 ك
ــ�اض �LMـ
ــ�اض ــ وأLــ ا����ر ــ
ــ�رة اN#ـ
ــ0 ــ) آ س.و. ك10/
ــ�اض ــ�� أLــــــ ��ــــــ
ــ�رة اN#ـ
ــ� ���ــــــ�دة 796��ــــ
ــ�ة 2) ) ج(، ) ب( ��ــ
111.ق���80ــــــــــ
ــ�#�نوا��.ــــــ%ل ب ـ.
104 �ــ 224 ، ��87ــ
�ــ 2 ، ��89ــــــ
�ــ ��93ــ

- 87 -
Economical, Technological and Environmental Impact Assessment of National
Regulations and Incentives for RE and EE: Country Report Egypt
Egypt.doc
ر�� إذا/
ــ� ــ���(�) ���ـــ ــ* ا���ـــ +��ـــ
ــ واLRــ�اض ــ�ى ا���Sآ /ــ%ا ا��
�/�� ا�Iــــــ
0.002
0.001
س 2) .و./�U آ0 ك
%S�إ���Fك اN#�رة
UI س .و.ك 45أ
��زل ���� �ً ��X
-�Yــ�� ��Sـــ
ــ�ه�ة ا��
وا�Nـــــــ(�%ر
و%2 �ـــــــ ا��ـــــــ�]ة
س.و./�ــــU آــــ0 ك
إ�ـــــ��Fك 2)
ــ% ــ�رة �Sـــــــ اN#ـــــــ
UــــI س.و. ك45أ
��زل����ــ�� � Xــــــ
���ــــ* �
ــ� ــ�ت ���ـــ ا��Y��Sـــ
ــ�ه�ة ــ%ا ا��ــــــ /ــــــ
وا�Nـــــــ(�%ر
و%2 �ــــ ا��ــــ�]ة
1(7��ـــ� ���ـــ�دة )
77.ق�ــ 68 ��ــ
ــ Y��S�ــ� ا� ــ�&�رة 0.01 +��ــــــ* ا���ــــــ���(�) ر� /ــ) آــ0 �
ــ\ ــ�ار 2��ـ ــ� ��ـ 7��ـ
�_�ــــــ^ي Y��S2ــــــ&
ــ� ــ�ه�ة ر ـــ 116ا��ـــ
�ــ ــــــ�ار��72ــــ ،
ــ- ــ\ �S2ـــــ 2��ـــــ
ــ�]ة ــ ا��ــــ Y��S2ــــ
�71/8/25ــ-
ــ�ري ــ�]�- وا���ـــ ــ��Fك ا��ـــ ــ� ��Fـــ ��ـــ��� ــ ــ�م اNدار ـــ ا���ـــ
ــ���� ا���ـــ� ــ ا���ـــ ��ـــــ ا����ـــ
��ـــــــ����� ــ ا�_�ـــ
ــ ــ�]�- ر�ــ�م إدار ــ��Fك ا��ـــ س.و. ك50أول 0.00 ا`�ـــ

- 88 -
Economical, Technological and Environmental Impact Assessment of National
Regulations and Incentives for RE and EE: Country Report Egypt
Egypt.doc
1 � � س.و. ك200 و �ــ�� 50أ�
1.75 � � س.و. ك350 و �ــ�� 200أ�
2.5 � � س.و. ك�650ــ�� و350أ�
3 � � س.و. ك1000 و �ــ�� 650أ�
3.5 س.و. ك1000أآــ�� �ــ
ا`�ـــــ��Fك ا���ـــــ�ري ر�ــ�م إدار ــ
س.و. ك100أول 0.00
2.50 � � س.و. ك250 و �ــ�� 100أ�
4.00 � � س.و. ك600 و �ــ�� 250أ�
6.00 � � س.و. ك1000 و �ــ�� 600أ�
9.00 ك1000أآــ�� �ــ . س.و
اN/_ـــ�ءات *
111. 2) ق 98دور ا�.�ــــ�دة 7��ــــ� ���ــــ�دة -1�ــ 80 ��ــ .
ــ�دة -2 ــ� ���ــ ــ��c 7��ــ ــ ��ــ ــ�� ا���د�ــ ــ_��ت Lــ ــe وا����dــ 111. 2) ق 98ا��F+ــ�80 ��ــــ .
ــ�#�ن -3 ــ� ���ـــ ــ 7��ـــ ــfت ا����2ـــ 32ا���dـــ�ــ ــ� 64 ��ـــ ــ 7��ــ ــ�ت ا�g�hــ ــ�ت وا����iــ ــjن ا���.�ــ �dــ
ــ�دة 111. 2) ق��98�ـ�ــ 80 ��ــ .
ا -4 ــ�دة ــ� ���ــ ــ���� 7��ــ �����ــ ــ ــ g�kــ ــ%ات آ����l�ــ ــ) ��2ــ ــ^ا&- 2ــ ــ��Fك ا�ــ 111. 2) ق �N98ــ�ــ ��ــ
80.
ا���ـــ�ت ا�S(�2�ـــ واXRـــ�hص اN/���ر ـــ ا�.�2ـــ ووnـــ%ات ا�S(ـــ� ا���Sـــ- واN#ـــ�رة ا�.�2ـــ ��dـــ�ارع -5
ــ�#�ن ــ� ���ـــ 795��ـــ�ــ 86 ��ــ .

- 89 -
Economical, Technological and Environmental Impact Assessment of National
Regulations and Incentives for RE and EE: Country Report Egypt
Egypt.doc
ــ� -6 ــ� ���ــ ــ- 7��ــ ــ�]راع اRراpــ ــFح وإ�ــ ــ�اض إ��Iــ ــ��Fك LRــ ا�Nــ 92#ــ�ن�ــ 96 ��ــ .
r�S�2 : ( ــ ــ�ب k��ـ ــU أ ـ ــ�&�رة إ�ـ ــ��- ا�_ـ ــ- إ+�ـ ــ�وش �ـ ـ ــ ــ� ا�h��ـ ــ�� آ�ـ ــ�ال �ـ ــ* اnRـ �ـــ- +��ـ
ــ�وش) .

- 90 -
Economical, Technological and Environmental Impact Assessment of National
Regulations and Incentives for RE and EE: Country Report Egypt
Egypt.doc
ا���������� ������������ �4 ,2009 ���������� ا�������� ق 2002-2008©
�������������� +���������� إ���������( ������������ز '&%����������$ #����������"! ا �������������ء و ,�#
ا�/������������.-

- 91 -
Economical, Technological and Environmental Impact Assessment of National
Regulations and Incentives for RE and EE: Country Report Egypt
Egypt.doc

- 92 -
Economical, Technological and Environmental Impact Assessment of National
Regulations and Incentives for RE and EE: Country Report Egypt
Egypt.doc

- 93 -
Economical, Technological and Environmental Impact Assessment of National
Regulations and Incentives for RE and EE: Country Report Egypt
Egypt.doc
Annual rate of increase for energy use = 0,06
year
Local
energy
needs
Committed
exports
Local
energy
needs
with ex-
ports
Energy
needs with
Energy Ef-
ficiency
Potential
available
fuel prod-
ucts
Potential
available
N.G.
Energy
available
form Hy-
dro re-
sources
Energy
available
form
Wind re-
sources
Nuclear Energy
gap
1 2006/07 56,39 23,4 79,79 56,39 26,7 26,5 2,99 0,20 0,00 0
2 2007/08 59,77 23,4 83,17 59,42 26,7 26,50 2,99 0,20 0,00 3,0
3 2008/09 63,35 23,4 86,75 62,62 26,7 26,50 2,99 0,89 0,00 5,5
4 2009/10 67,16 23,4 90,56 66,00 26,7 26,50 2,99 1,58 0,00 8,2
5 2010/11 71,19 23,4 94,59 69,55 26,7 26,50 2,99 2,27 0,00 11,1
6 2011/12 75,46 23,4 98,86 73,30 26,7 26,50 2,99 2,96 0,00 14,2
7 2012/13 79,98 23,4 103,38 77,24 26,7 26,50 2,99 3,65 0,00 17,4
8 2013/14 84,78 23,4 108,18 81,40 26,7 26,50 2,99 4,34 0,00 20,9
9 2014/15 89,87 23,4 113,27 85,79 26,7 26,50 2,99 5,03 0,00 24,6
10 2015/16 95,26 23,4 118,66 90,41 26,7 26,50 2,99 5,72 1,38 27,1
11 2016/17 100,98 23,4 124,38 95,28 26,7 26,50 2,99 6,41 2,76 29,9
12 2017/18 107,04 23,4 130,44 100,41 26,7 26,50 2,99 7,10 2,76 34,4
13 2018/19 113,46 23,4 136,86 105,82 26,7 26,50 2,99 7,79 5,52 36,3
14 2019/20 120,27 23,4 143,67 111,52 26,7 26,50 2,99 8,48 5,52 41,3
15 2020/21 127,48 23,4 150,88 117,52 26,7 26,50 2,99 9,17 8,28 43,9
16 2021/22 135,13 23,4 158,53 123,85 26,7 26,50 2,99 9,86 8,28 49,5

- 94 -
Economical, Technological and Environmental Impact Assessment of National
Regulations and Incentives for RE and EE: Country Report Egypt
Egypt.doc
( طن / جنيــه )
����ز ��زوت � �ر ��� *� �ر آ�و��� ����� � ������ **ا���ز ا
1982//81 182 37,8 36 30,42 7,5 52 9
1992/91 1013 252 240 210,6 80 200 75
1993/92 1301 378 360 315,9 100 200 99
1994/93 1305 504 480 421,2 130 200 149
1995/94 1305 504 480 421,2 130 200 152
1996/95 1305 504 480 480 130 200 156
1997/96 1305 504 480 480 130 200 156
1998/97 1305 504 480 480 182 200 156
1999/98 1305 504 480 480 182 200 156
2000/99 1305 504 480 480 182 200 179
2001/2000 1305 504 480 480 182 200 179
2002/2001 1305 504 480 480 182 200 179
2003/2002 1305 504 480 480 182 200 179
2004/2003 1305 504 480 480 300 200 244
2005/2004 1305 504 720 720 300 200 275

- 95 -
Economical, Technological and Environmental Impact Assessment of National
Regulations and Incentives for RE and EE: Country Report Egypt
Egypt.doc
2005/2006 1768 964 900 900 300 200 279
2006/2007 1768 964 900 900 500 200 327
2007/2008 1320 1320 1320 1000 200

- 96 -
Economical, Technological and Environmental Impact Assessment of National
Regulations and Incentives for RE and EE: Country Report Egypt
Egypt.doc
(LE/ton)
Gasoline Kerosine Solar Trans Solar Mazot LPG N.Gas**
1981/82 182 37,8 36 30,42 7,5 52 9
1982/83 210 37,8 36 30,42 7,5 52 9
1983/84 210 37,8 36 30,42 7,5 52 9
1984/85 211 37,8 36 30,42 7,5 52 9
1985/86 284 37,8 36 30,42 7,5 52 9
1986/87 355 37,8 36 30,42 7,5 52 9
1987/88 357 63 60 52,65 28 52 34
1988/89 499 63 60 52,65 28 52 34
1989/90 502 88,2 84 76 35 52 43
1990/91 786 126 120 105,3 50 120 61
1991/92 1013 252 240 210,6 80 200 75
1992/93 1301 378 360 315,9 100 200 99
1993/94 1305 504 480 421,2 130 200 149
1994/95 1305 504 480 421,2 130 200 152
1995/96 1305 504 480 480 130 200 156
1996/97 1305 504 480 480 130 200 156
1997/98 1305 504 480 480 182 200 156
1998/99 1305 504 480 480 182 200 156
1999/2000 1305 504 480 480 182 200 179

- 97 -
Economical, Technological and Environmental Impact Assessment of National
Regulations and Incentives for RE and EE: Country Report Egypt
Egypt.doc
2000/01 1305 504 480 480 182 200 179
2001/02 1305 504 480 480 182 200 179
2002/03 1305 504 480 480 182 200 179
2003/04 1305 504 480 480 300 200 244
2004/05 1305 504 720 720 300 200 275
2005/06 1836 964 900 900 500 200 345

- 98 -
Economical, Technological and Environmental Impact Assessment of National
Regulations and Incentives for RE and EE: Country Report Egypt
Egypt.doc
- 99 -
Economical, Technological and Environmental Impact Assessment of National
Regulations and Incentives for RE and EE: Country Report Egypt
Egypt.doc

- 100 -
Economical, Technological and Environmental Impact Assessment of National
Regulations and Incentives for RE and EE: Country Report Egypt
Egypt.doc

- 101 -
Economical, Technological and Environmental Impact Assessment of National
Regulations and Incentives for RE and EE: Country Report Egypt
Egypt.doc

- 102 -
Economical, Technological and Environmental Impact Assessment of National
Regulations and Incentives for RE and EE: Country Report Egypt
Egypt.doc

- 103 -
Economical, Technological and Environmental Impact Assessment of National
Regulations and Incentives for RE and EE: Country Report Egypt
Egypt.doc
Annex 5
Presentation on Methodology

A project financed by the Ministry of Foreign Affairs of Denmark
Economical, Technological and Environmental Impact Assessment of National Regulations and Incentives for Renewable Energy and Energy Efficiency
Evidence based policy making and theory based evaluation
Egypt – Half-day Seminar on Methodology and Policy, Cairo, 7/6/2009Page 1
and theory based evaluation
Nigel Lucas

A project financed by the Ministry of Foreign Affairs of Denmark
Economical, Technological and Environmental Impact Assessment of National Regulations and Incentives for Renewable Energy and Energy Efficiency
• Evidence based policy making
• Theory based evaluation
• The linkages
– Theory
– Indicators
Contents
Egypt – Half-day Seminar on Methodology and Policy, Cairo, 7/6/2009
– Indicators
• Hesitant thoughts on Egypt
Page 2

A project financed by the Ministry of Foreign Affairs of Denmark
Economical, Technological and Environmental Impact Assessment of National Regulations and Incentives for Renewable Energy and Energy Efficiency
• What is Evidence Based Policy Making?
• Why do we need it? What have we been doing before -
making it up?
Evidence Based Policy Making?
Egypt – Half-day Seminar on Methodology and Policy, Cairo, 7/6/2009Page 3
• What is evidence?
• It is all very well, but I do not have the time or resources.

A project financed by the Ministry of Foreign Affairs of Denmark
Economical, Technological and Environmental Impact Assessment of National Regulations and Incentives for Renewable Energy and Energy Efficiency
Many different definitions, but what it really means is just:
“An approach to policy development and implementation which uses rigorous techniques to develop and maintain a robust evidence base
What is Evidence Based Policy Making?
Egypt – Half-day Seminar on Methodology and Policy, Cairo, 7/6/2009Page 4
rigorous techniques to develop and maintain a robust evidence base from which to develop policy options”.
All policies are based on evidence - the questions are:
•Is the evidence reliable?
•Are the processes by which evidence is turned into policy fit for their purpose?

A project financed by the Ministry of Foreign Affairs of Denmark
Economical, Technological and Environmental Impact Assessment of National Regulations and Incentives for Renewable Energy and Energy Efficiency
•The key benefit of evidence-based policy making is better policy
•Policy may be driven by prejudice or short-term political pressure
•There is often a range of instruments to achieve identified policy objectives and choice can be very difficult
•Foreign consultants and agencies may not understand entirely the constraints and practices in a specific country; they often prescribe
Why do we need it?
Egypt – Half-day Seminar on Methodology and Policy, Cairo, 7/6/2009Page 5
constraints and practices in a specific country; they often prescribe remedies from home with little thought whether they are appropriate
•Countries need to develop in-house capabilities to analyse and evaluate policy so that they can properly choose options that fit into economic, cultural, legal and political life and can be realistically enforced and better use inputs from international experts
•Really just better, better resourced and more systematic policy making

A project financed by the Ministry of Foreign Affairs of Denmark
Economical, Technological and Environmental Impact Assessment of National Regulations and Incentives for Renewable Energy and Energy Efficiency
Good evidence is necessary, but not sufficient
Egypt – Half-day Seminar on Methodology and Policy, Cairo, 7/6/2009
Need evidence and process
Page 6

A project financed by the Ministry of Foreign Affairs of Denmark
Economical, Technological and Environmental Impact Assessment of National Regulations and Incentives for Renewable Energy and Energy Efficiency
• The evidence base must be both broad enough to develop a wide range of policy
options, and detailed enough for those options to stand up to intense scrutiny.
• An evidence-based approach should show continuity between foresight, strategy, policy,
and implementation
• Evidence does not necessarily mean hard facts like scientific data, although the
objectively verifiable evidence is important
• Evidence is any information that can be used to turn policy objectives into feasible and
What is evidence?
Egypt – Half-day Seminar on Methodology and Policy, Cairo, 7/6/2009Page 7
• Evidence is any information that can be used to turn policy objectives into feasible and
effective policy instruments
• Can distinguish three main components:
• hard data (facts, trends, survey information)
• analytical reasoning that processes data to illuminate problems
• stakeholder opinion on an issue or set of issues.
• Research, analysis of stakeholder opinion, public perceptions and beliefs, cost/benefit
analyses, economic and statistical modelling are important sources of evidence
• Judgement of the quality of the methods that are used to gather and synthesise the
information is vital

A project financed by the Ministry of Foreign Affairs of Denmark
Economical, Technological and Environmental Impact Assessment of National Regulations and Incentives for Renewable Energy and Energy Efficiency
• Often we work under pressure. Can only do what
is reasonable
• Four options for research
– Review existing research
Evidence and time horizons
Egypt – Half-day Seminar on Methodology and Policy, Cairo, 7/6/2009
– Review existing research
– Commission new research
– Consult experts
– Consider a wide range of fully costed and
appraised options
• Operate on different time scales
Page 8

A project financed by the Ministry of Foreign Affairs of Denmark
Economical, Technological and Environmental Impact Assessment of National Regulations and Incentives for Renewable Energy and Energy Efficiency
Reconciling evidence and time
Egypt – Half-day Seminar on Methodology and Policy, Cairo, 7/6/2009Page 9
A project financed by the Ministry of Foreign Affairs of Denmark
Economical, Technological and Environmental Impact Assessment of National Regulations and Incentives for Renewable Energy and Energy Efficiency
• LOOK FORWARD
• LOOK OUTWARD
• INNOVATE
• SEEK EVIDENCE later
Nine features of better policy making
Egypt – Half-day Seminar on Methodology and Policy, Cairo, 7/6/2009Page 10
• SEEK EVIDENCE later
• BE INCLUSIVE
• BE JOINED UP
• MONITOR later
• EVALUATE later
• LEARN later

A project financed by the Ministry of Foreign Affairs of Denmark
Economical, Technological and Environmental Impact Assessment of National Regulations and Incentives for Renewable Energy and Energy Efficiency
The policy-making process takes a long-term view of the likely effect and impact of the policy based on established trends and informed by predictions of social, political, economic and cultural trends, for at least five years into the future.
Look Forward
Egypt – Half-day Seminar on Methodology and Policy, Cairo, 7/6/2009Page 11
A forward looking policy will probably contain:
• A statement of intended outcomes is prepared at an early stage
• Contingency or scenario planning is included
• Taking into account the Government's long term strategy
• Use available foresight and forecasting work (Mediterranean Foresight Programme)

A project financed by the Ministry of Foreign Affairs of Denmark
Economical, Technological and Environmental Impact Assessment of National Regulations and Incentives for Renewable Energy and Energy Efficiency
Take account of influencing factors in the national, Mediterranean and
international situation;
Draw on experience in other countries;
Considers how policy will be communicated with the public.
Look outwards
Egypt – Half-day Seminar on Methodology and Policy, Cairo, 7/6/2009Page 12
Considers how policy will be communicated with the public.
Outward looking policies will probably:
• Make use of regional mechanisms where appropriate e.g. MEDREG, RCREEE, MEDA programmes
• Look at experience of how other countries dealt with the issue
• Prepare and use a communications/presentation strategy

A project financed by the Ministry of Foreign Affairs of Denmark
Economical, Technological and Environmental Impact Assessment of National Regulations and Incentives for Renewable Energy and Energy Efficiency
The policy-making process should question established procedures, encourage new and creative ideas; and make established ways work better.
Failure is not good, but occasionally is inevitable. Learn from failure.
Risks are identified and actively managed.
An innovative, flexible and creative approach:
Be Innovative
Egypt – Half-day Seminar on Methodology and Policy, Cairo, 7/6/2009Page 13
An innovative, flexible and creative approach:
• Uses alternatives to the usual ways of working (brainstorming sessions etc)
• Takes steps to create management structures which promote new ideas and effective team working
• Brings in people from outside into policy team; other departments, industry, NGOs

A project financed by the Ministry of Foreign Affairs of Denmark
Economical, Technological and Environmental Impact Assessment of National Regulations and Incentives for Renewable Energy and Energy Efficiency
The policy-making process takes account of the impact on and/or meets the needs of all people directly or indirectly affected by the policy; and consults widely.
Be Inclusive
Egypt – Half-day Seminar on Methodology and Policy, Cairo, 7/6/2009Page 14
An inclusive approach may include the following aspects:
• Consults those responsible for service delivery/implementation
• Consults those at the receiving end or otherwise affected by the policy
• Seeks feedback on policy from recipients and front line deliverers
A project financed by the Ministry of Foreign Affairs of Denmark
Economical, Technological and Environmental Impact Assessment of National Regulations and Incentives for Renewable Energy and Energy Efficiency
The process takes a holistic view; looking beyond institutional boundaries to the government's strategic objectives.
There is consideration of the appropriate management and organisational structures needed to deliver cross-cutting objectives.
Avoids conflict with other policies.
Be joined-up
Egypt – Half-day Seminar on Methodology and Policy, Cairo, 7/6/2009Page 15
A joined-up approach to policy-making:
• Clearly defines cross cutting objectives at the outset
• Working arrangements with other departments clearly defined and well observed
• Barriers to effective joined up policy are clearly identified with a strategy to overcome them
• Implementation is considered part of the policy making process

A project financed by the Ministry of Foreign Affairs of Denmark
Economical, Technological and Environmental Impact Assessment of National Regulations and Incentives for Renewable Energy and Energy Efficiency
•Alternative forms of intervention need to be reviewed and short-listed. Evidence of the success or failure of similar instruments in developed and developing countries needs to be studied with special emphasis on the conditions that created success and failure
•There must always be a base-case against which alternatives are
The process of evidence-based policy making (I)
Egypt – Half-day Seminar on Methodology and Policy, Cairo, 7/6/2009Page 16
•There must always be a base-case against which alternatives are screened. Alternatives should include all available instruments.
•All the relevant potential impacts need to be identified and where possible, quantified
•Indicators need to be established of what is expected from the policy measures. These indicators should cover outputs, outcomes and impacts
•Intermediate indicators are important in helping understand how policies work, how measures interact and how they can be improved

A project financed by the Ministry of Foreign Affairs of Denmark
Economical, Technological and Environmental Impact Assessment of National Regulations and Incentives for Renewable Energy and Energy Efficiency
•Impacts should be assessed in consultation with the subjects of policy
•The cost of compliance needs to be assessed. Consideration should be given to how these costs can be minimized.
•It is necessary to consider who pays the compliance costs; there are generally alternatives with different implications for equity.
•The procedures for compliance need to be worked out and for monitoring
The process of evidence-based policy making (II)
Egypt – Half-day Seminar on Methodology and Policy, Cairo, 7/6/2009Page 17
•The procedures for compliance need to be worked out and for monitoring impacts.
•Quantitative analysis of impacts is essential. The analytical method most commonly used is economic cost-benefit analysis.
•Cost-benefit analysis should take into account opportunity costs of energy and external environmental costs.
•Multi-criteria analysis can also be a useful support to decision making

A project financed by the Ministry of Foreign Affairs of Denmark
Economical, Technological and Environmental Impact Assessment of National Regulations and Incentives for Renewable Energy and Energy Efficiency
What is Theory-Based Evaluation?
• Theory-Based evaluation focuses on analysis of the theoretical or logical sequence
by which a policy intervention is expected to bring about its desired effects.
• For instance, a theory-based evaluation might ask about the steps that are implicit
between a policy initiative (e.g. introduction of minimum energy performance
standards for electrical appliances) and the policy outcome (reducing energy and
GHGs). The Figure represents the implicit theory of policy makers:
Introduction Consumer is Manufacturers Market is Energy use
Egypt – Half-day Seminar on Methodology and Policy, Cairo, 7/6/2009Page 18
Introduction
of MEPS
Consumer is
empowered to
make a better
judgement and
change
behaviour
Manufacturers
are
incentivised to
make more
efficient
models
Market is
transformed
and inefficient
devices
become
obsolete
Energy use
and CO2
emissions
fall;
Domestic
manufacture
strengthened
• The concept is similar to the logical framework for project evaluation, but because it
depends on an explicit behavioural model it can handle not linear logical structures

A project financed by the Ministry of Foreign Affairs of Denmark
Economical, Technological and Environmental Impact Assessment of National Regulations and Incentives for Renewable Energy and Energy Efficiency
Theory and the policy cycle
formulate
Implementreformulate Theory
Foresight Evidence
Egypt – Half-day Seminar on Methodology and Policy, Cairo, 7/6/2009Page 19
Implement
monitorevaluate
reformulate Theory
Model
Indicators
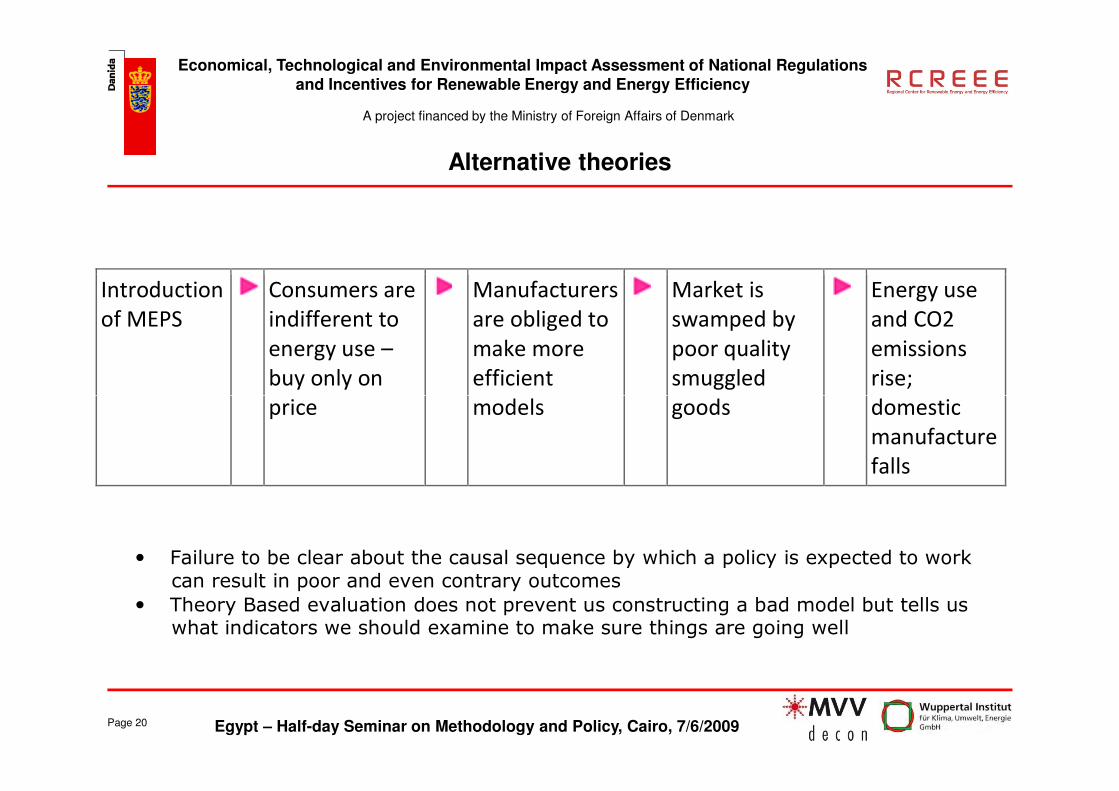
A project financed by the Ministry of Foreign Affairs of Denmark
Economical, Technological and Environmental Impact Assessment of National Regulations and Incentives for Renewable Energy and Energy Efficiency
Alternative theories
Introduction
of MEPS
Consumers are
indifferent to
energy use –
buy only on
price
Manufacturers
are obliged to
make more
efficient
models
Market is
swamped by
poor quality
smuggled
goods
Energy use
and CO2
emissions
rise;
domestic
Egypt – Half-day Seminar on Methodology and Policy, Cairo, 7/6/2009Page 20
price models goods domestic
manufacture
falls
• Failure to be clear about the causal sequence by which a policy is expected to work
can result in poor and even contrary outcomes
• Theory Based evaluation does not prevent us constructing a bad model but tells us what indicators we should examine to make sure things are going well

A project financed by the Ministry of Foreign Affairs of Denmark
Economical, Technological and Environmental Impact Assessment of National Regulations and Incentives for Renewable Energy and Energy Efficiency
Indicators need to be established of what is expected from the policy measures. This is vital for evaluation.
Indicators should cover:
•inputs, i.e. the financial, human, technical or organizational resources used in the endeavour
Indicators
Egypt – Half-day Seminar on Methodology and Policy, Cairo, 7/6/2009Page 21
used in the endeavour
•outputs, (objectively verifiable indicators that demonstrate the progress made in implementing the measures, e.g. the creation of a minimum energy performance standard),
•outcomes (immediate effects on the regulated subject, e.g. the offer of new products and retooling of production lines) and
•impacts (direct measurements of the improvements that the programme is designed to bring about, e.g. more efficient products and lower energy use).

A project financed by the Ministry of Foreign Affairs of Denmark
Economical, Technological and Environmental Impact Assessment of National Regulations and Incentives for Renewable Energy and Energy Efficiency
Some indicators
Outputs Outcomes Impacts
Policy Intervention Price Reform Policy commitment to defined schedule for
raise prices to economic costs
Creation of free competitive energy markets,
or
Clear administered link to international prices
with specified frequency of review
Prices that reflect opportunity costs
Overall reduction in energy use or CO2
emissions per unit of GDP
Institutional and legal
reform
Primary energy efficiency law approved by
legislature
Provisions for energy agency
Provisions for standards and labelling
Provisions for audits
Provisions for financial incentives
Obstacles to private energy service
companies removed
Energy agency established with adequate
budget, staff and powers
Regulations for labelling of specified
products
Regulations for financial incentives
Funds and resources assigned to pilot ESCO
activities
Regulations for minimum energy
performance standards for specified products
No direct impacts
Labelling Regulations for labelling of specified Certified testing sites established or identified Numbers of high performance appliances
Egypt – Half-day Seminar on Methodology and Policy, Cairo, 7/6/2009Page 22
Labelling
Regulations for labelling of specified
products
Certified testing sites established or identified
Protocols for testing agreed
Manufacturers invest to produce new designs
Labels approved
Appliances labelled
Compliance systems introduced
Procedure for periodic review
Numbers of high performance appliances
bought
Average energy use per group of
appliances decreases
Financial
incentives for audits
Regulations for financial incentives,
including defined funding mechanism and
responsibilities for implementation
Funding mechanism implemented
Transparent, non-discriminatory system of
access published and in operation
Loans made
Number of audits made
Quality of audits evaluated
Energy use per unit of output in target
group
Financial
incentives for investments
Legal provisions for financial incentives,
including defined funding mechanism and
responsibilities for implementation
Funding mechanism implemented
Transparent, non-discriminatory system of
access published and in operation
Volume of loans made
Volume of funding from private banks
Effectiveness of loans evaluated
Investment in energy efficiency
Energy use per unit of output in target
group
Energy service companies Obstacles to ESCO participation removed
Funds and resources assigned to pilot
ESCO activities
Pilot ESCO activities implemented
Number of contracts written
Energy savings from contracted activities

A project financed by the Ministry of Foreign Affairs of Denmark
Economical, Technological and Environmental Impact Assessment of National Regulations and Incentives for Renewable Energy and Energy Efficiency
Some more indicators
Standards
Regulations for minimum energy
performance standards for specified
products
Legal provision to remove sub-standard
products from market
Building standards introduced
Certified testing sites established or identified
Protocols for testing agreed
Manufacturers invest to produce new designs
Compliance systems introduced
Procedure for periodic review
Percentage of non-compliant appliances
Average energy use per group of
appliances decreases
Average use per square metre of floor
area improves
Mandatory measures
Regulations for mandatory audits,
appointment of qualified energy managers,
compliance with performance targets,
reporting.
Number of audits accomplished
Quality of audits evaluated
Investment in energy efficiency
Number of managers appointed
Procedures for setting targets established
Number of targets set
Number of targets met
Energy use per unit of output in target
group
Egypt – Half-day Seminar on Methodology and Policy, Cairo, 7/6/2009Page 23
Number of targets met
Number of reports delivered
Corporate agreements
Regulations if compulsory scheme Numbers of corporate agreements in place
Volume of commitments agreed
Post hoc evaluation
Energy use per unit of output in target
group
Efficiency obligations
Regulation
Rules for source and allocation of funds
Volume of funds disbursed
Number of customers affected
Behavioural changes noted
Investments leveraged/financed
Energy use per unit of output in target
group
Transport and spatial
planning
Restrictions on import/assembly of vehicles
to improve fleet efficiency
Regulations to permit incentives to public
transport
Planning guidance
Improved efficiency of stock
Higher use of public transport
Better planning
Less energy use per vehicle-km
Improved public-private modal split
Lower energy use for transport per capita

A project financed by the Ministry of Foreign Affairs of Denmark
Economical, Technological and Environmental Impact Assessment of National Regulations and Incentives for Renewable Energy and Energy Efficiency
• Impact indicators tell you if you are getting the results that you wanted
• Generally thought they are not sufficient in themselves
• Intermediate indicators are useful and indeed necessary to verify the underlying theory
Intermediate indicators
Egypt – Half-day Seminar on Methodology and Policy, Cairo, 7/6/2009Page 24
underlying theory

A project financed by the Ministry of Foreign Affairs of Denmark
Economical, Technological and Environmental Impact Assessment of National Regulations and Incentives for Renewable Energy and Energy Efficiency
• Wind power: strong sense of good evidence based policy making –doesn’t mean it can’t be better; worried about a lack of power system analysis and possibly a more detailed and fuller economic analysis. But shows good review of options; looks forward and outward and is innovative; need to establish indicators
• Other renewables – less far advanced: difficult to comment
Hesitant thoughts on Egypt
Egypt – Half-day Seminar on Methodology and Policy, Cairo, 7/6/2009Page 25
• Other renewables – less far advanced: difficult to comment
• Energy efficiency: possibly less systematic. Analytical capacity is lacking. Needs technical support to a dedicated agency or unit.
• New UNDP project very important in this context and it should be a priority to support this local capacity for policy analysis
• Comments would be helpful: what would you like from this project?
• We consult: we are outward looking and flexible!

A project financed by the Ministry of Foreign Affairs of Denmark
Economical, Technological and Environmental Impact Assessment of National Regulations and Incentives for Renewable Energy and Energy Efficiency
Many thanks for
Egypt – Half-day Seminar on Methodology and Policy, Cairo, 7/6/2009
your patience
Page 26

- 104 -
Economical, Technological and Environmental Impact Assessment of National
Regulations and Incentives for RE and EE: Country Report Egypt
Egypt.doc
Annex 6
Preview on Training
A project financed by the Ministry of Foreign Affairs of Denmark
Egypt – Half-day Seminar on Methodology and Policy, Cairo, 7/6/2009
Economical, Technological and Environmental Impact Assessment of National Regulationsand Incentives for Renewable Energy and Energy Efficiency
Page 1
Preview of the Three-day TrainingWorkshop
- November 2009 -
Martin Ehrlich

A project financed by the Ministry of Foreign Affairs of Denmark
Egypt – Half-day Seminar on Methodology and Policy, Cairo, 7/6/2009
Economical, Technological and Environmental Impact Assessment of National Regulationsand Incentives for Renewable Energy and Energy Efficiency
Page 2
• Objective of the Impact Assessment Project
• Objective of the Training Component
• Audience for the Training Event
• Modules of the Training Event
• Programme for Senior Policy Decision Makers
• Programme for Policy Analysts and Consultants
Contents of the Presentation

A project financed by the Ministry of Foreign Affairs of Denmark
Egypt – Half-day Seminar on Methodology and Policy, Cairo, 7/6/2009
Economical, Technological and Environmental Impact Assessment of National Regulationsand Incentives for Renewable Energy and Energy Efficiency
Page 3
Objective of the Impact Assessment Project
• To achieve:
– Rapid implementation of cost-effective policies and instruments
– Accelerated deployment of cost effective RE & EE technologies
– Through:
• Increased penetration of „evidence based“ policy formulationand „theory based“ policy evaluation
• Specific objectives of the project:
– Comparative analysis of EE & RE policies
– Provision of impact assessments of EE & RE policy and promotioninstruments in RCREEE countries
– Strengthening of the methodological basis for policy formulation
– Provision of recommendations for adjustments of the policy makingprocess

A project financed by the Ministry of Foreign Affairs of Denmark
Egypt – Half-day Seminar on Methodology and Policy, Cairo, 7/6/2009
Economical, Technological and Environmental Impact Assessment of National Regulationsand Incentives for Renewable Energy and Energy Efficiency
Page 4
• Presentation of the methodological basis:
– Evidence based policy making and planning procedures
– Theory based evaluation and procedures for applicationin practice
• Country specific conclusions
• Recommendations regarding the policy making process
• Presentation of Case Studies
– Case Study on EE promotion
– Case Study on RE promotion
Objective of the Training Component
A project financed by the Ministry of Foreign Affairs of Denmark
Egypt – Half-day Seminar on Methodology and Policy, Cairo, 7/6/2009
Economical, Technological and Environmental Impact Assessment of National Regulationsand Incentives for Renewable Energy and Energy Efficiency
Page 5
• 1st day: Senior decision makers
• Presentation of the Impact Assessment Project
• Key elements of the methodology
• Recommendation of the country assessment
• 2nd & 3rd day: Policy analysts and RE & EE experts
• Detailed presentation of the synthesis report and countryassessments
• Discussion of case studies with presentation of the methodologicalbasis
Audience for the Training Event

A project financed by the Ministry of Foreign Affairs of Denmark
Egypt – Half-day Seminar on Methodology and Policy, Cairo, 7/6/2009
Economical, Technological and Environmental Impact Assessment of National Regulationsand Incentives for Renewable Energy and Energy Efficiency
Page 6
Modules of the Training Event
Morning Session Afternoon Session
1st
day
Presentation of the National
Regulations and Incentives Project
Key principles of evidenced based
policy making and theory based
evaluation
Presentation of International Practice
Result of the Country Review
2nd
day
Presentation of International
Practice in the Synthesis Report
– International practice
– Assessment of RCREEE practices
– Energy planning and political
consultation process
Presentation of the Country Report
– Methodological basis for policy
preparation
– Assessment of the policy making
process
Country specific conclusions and
recommendations
3rd
day
Case study on Energy Efficiency
Selected EE policy instrument
Theoretical framework
Results of the case study
Country specific conditions
Case study on Energy Efficiency
Selected EE policy instrument
Theoretical framework
Results of the case study
Country specific conditions

A project financed by the Ministry of Foreign Affairs of Denmark
Egypt – Half-day Seminar on Methodology and Policy, Cairo, 7/6/2009
Economical, Technological and Environmental Impact Assessment of National Regulationsand Incentives for Renewable Energy and Energy Efficiency
Page 7
• Presentation of the Impact Assessment Project• Scope of the project and organisation• Value of international comparative analysis
• Key elements of the methodological basis for policy preparation andassessment
• Need for a methodological basis• Benefits of a sound methodological basis• Short and long term requirements
• Presentation of international practice• Policy making process• Policy implementation and impact assessment
• Result of the country review• EE and RE policy making process• Policy implementation• Observations and recommendations
Programme for Senior Policy Decision Makers

A project financed by the Ministry of Foreign Affairs of Denmark
Egypt – Half-day Seminar on Methodology and Policy, Cairo, 7/6/2009
Economical, Technological and Environmental Impact Assessment of National Regulationsand Incentives for Renewable Energy and Energy Efficiency
Page 8
• Presentation on methodological basis (international practice andpractice in RCREEE countries)
• Evidence based policy formulation
• Theory policy evaluation
Including: Economic evaluation of policy instruments / Integration ofclimate policy benefits in RE & EE policy analysis
• Presentation of case studies (including the discussion of casestudies prepared by participants)
• Presentation of selected policy instrument
• Required theoretical framework and selected approach
• Result of the case study
• Comment on country-specific conditions and challenges
Programme for Policy Analysts and Consultants

A project financed by the Ministry of Foreign Affairs of Denmark
Egypt – Half-day Seminar on Methodology and Policy, Cairo, 7/6/2009
Economical, Technological and Environmental Impact Assessment of National Regulationsand Incentives for Renewable Energy and Energy Efficiency
Page 9
• Key-documents for RCREEE countries
• Country Reports with the assessment of EE & RE policies andinstruments
• Synthesis Report
• Contacts within the RCREEE countries for networking andprofessional contacts
• Case Studies on evidence based policy preparation and andtheory based policy evaluation
Information Regarding the Available Project Results

- 105 -
Economical, Technological and Environmental Impact Assessment of National
Regulations and Incentives for RE and EE: Country Report Egypt
Egypt.doc
Annex 7
Energy Situation in Egypt

- 106 -
Economical, Technological and Environmental Impact Assessment of National
Regulations and Incentives for RE and EE: Country Report Egypt
Egypt.doc
Energy Situation in Egypt
Until the late 1990s, Egypt was a net exporter of energy. Currently, oil production almost matches the
Egyptian national consumption. On the other hand the discovery/development of large reserves of
natural gas established Egypt as an exporter of gas, both by pipeline and as LNG4. Electricity genera-
tion is the major user of fossil fuels (around 90% of electricity is from thermal power stations). Energy
forecasts5 include two scenarios covering the expected energy needs in Egypt and the potential na-
tional resources up to year 2022: a conservative one (figure 13), and a non-conservative one (fig-
ure14). The conservative scenario considers that Egypt will keep a steady level of production for both
oil and natural gas; while the optimistic scenario considers a 5% average annual increase in the pro-
duction of natural gas. Demand would reach 136 million TOE by year 2022 (the most upper line), the
average growth rate is about 7% annually, which corresponds to an overall development plan of over
7% annual development. The country will still primarily depend on liquid fossil fuels and natural gas by
the year 2022 (43% for the conservative scenario and 66% for the optimistic one); these percentages
are calculated after considering that the overall energy demand will be reduced by more than 8.3% in
the course of energy efficiency applications. The hydro resources for the production of electricity will
remain constant as Egypt has already fully utilised all possible national potentials at around 2.4%,
while wind is planned to cover around 8% and energy from nuclear resources would cover around
7.6%. The remaining 16% of energy needs would be supplied through other optional national/regional
resources such as solar energy in addition to interconnection with neighbouring countries and regions
such as the Mediterranean basin, the Nile basin as well as connecting to Saudi Arabia and the Per-
sian/Arab Gulf area. Out of these aforementioned future resources wind (8% of the overall needs cor-
responding to about 12% of the electricity to be generated) has real potential in Egypt as it also en-
counters the least technological limitations (cost, risk, etc) as compared to solar and nuclear.
Figure 12: Egypt's Future Energy Needs (Conservative Scenario)
5 66 0
6 36 7
7 17 5
8 08 5
9 09 5
10 1
10 7
113
12 0
12 7
13 5
0
20
40
60
80
100
120
140
160
2006/ 07 2007/ 08 2008/ 09 2009/ 10 2010/ 11 2011/ 12 2012/ 13 2013/ 14 2014/ 15 2015/ 16 2016/ 17 2017/ 18 2018/ 19 2019/ 20 2020/ 21 2021/ 22
Fr om f uel pr oducts Fr om N.G. Fr om Hydr o Fr om Wind
Fr om Nuclear Local ener gy needs Local ener gy needs with ener gy ef f . Additional needed ener gy
4 Liquefied Natural Gas - the form used for the transport of gas by ship.
5 Energy and National Security; an energy committee paper, national democratic party -Nov 2007- This paper is currently be-
ing adopted by the government.

- 107 -
Economical, Technological and Environmental Impact Assessment of National
Regulations and Incentives for RE and EE: Country Report Egypt
Egypt.doc
Figure 13: Egypt's Future Energy Needs (Optimistic Scenario)
Egypt's Oil6
Egypt was traditionally a net exporter of oil; Figure 147 shows that production declined at an average
of 3% per year over the period 1995-2005, whilst domestic demand has continued to grow. Net ex-
ports in 2007 were 60 thousand barrels per day, down from a peak of 500 in 1993. Whilst Egypt con-
tinues to be a small net exporter in physical terms, its balance of trade in oil has been negative since
19998. Eight of Egypt's nine refineries are relatively old and simple. They produce large quantities of
low value products (particularly heavy fuel oil and naphtha) and insufficient quantities of high value
products (notably diesel and LPG)9. Furthermore, many of the products are not of international stan-
dard - gasoline tends to be of relatively low octane number and high sulphur content10
. The move from
positive to negative balance of trade is often associated with a change in energy policy, notably in tar-
iffs charged. When the balance of trade becomes negative, countries have more incentives to charge
prices which reflect their full costs.
6 International Institute for Sustainable Development (IISD), draft final, April 2009, "Wind Power in Egypt: An Investment Case
Study for the Trade & Climate Change Programme". 7 BP Statistical Review of World Energy 2008,
http://www.bp.com/multipleimagesection.do?categoryId=9023755&contentId=7044552 8 ERM and Environics Analysis for World Bank Egypt: Energy-Environment Review 2003. Based on EGPC Statistical Publica-
tions and interviews 9 A number of hydrocracking/desulphurization facilities are currently being established in Egypt, including one in Northern
Cairo, producing lighter products from Heavy Fuel Oil (HFO) produced by the Cairo Oil Refining Company, and another as
an independent refinery in the Suez Area using crude oil inputs and HFO from National Petroleum Company of Suez 10
Diesel sulphur content averages around 0.4% from the eight older refineries - ERM and Environics (Ibid)

- 108 -
Economical, Technological and Environmental Impact Assessment of National
Regulations and Incentives for RE and EE: Country Report Egypt
Egypt.doc
Figure 14: Oil Production in Egypt, 1990-2007
0
200
400
600
800
1000
1990 1995 2000 2005
Th
ou
san
d B
arr
els
per
Day Oil Production Consumption Net Exports
Natural Gas11
Natural gas has been produced offshore in Egypt since 1970 (from Abu Qir, east of Alexandria; and
Abu Madi in the Nile Delta). Production levels became significant, when associated gas from the Suez
Gulf came on line in 1983. Figure 15 shows that production more than quadrupled over the period
1995-2007. Exports require the development of infrastructure: they started with the completion of a
pipeline to Aqaba, Jordan in 2003 but became significant only in 2005, when the LNG plants at Dami-
etta ("SEGAS") and Idku ("Egyptian LNG") came on line. Exports are now 15 bcm, one-third of Egypt's
production. Egypt's proven gas reserves continue to grow; the IEA projects that both production and
exports of natural gas will double between 2005 and 203012
.
Gas was first used in Egypt for power generation, via the conversion of oil-fired thermal cycle plants to
use gas as an alternative fuel. A relatively small quantity of open cycle gas turbine plant was added in
the early 1980s and a number of larger plants (including CCGT) have been constructed more recently;
these plants were specifically built to burn gas. Over 90% of thermal Egyptian generation currently
uses natural gas13
. Power plants are major consumers of gas and can use new supplies of gas quickly
(in that they need only single lines to be constructed).
The wider gas network is being progressively built up. Large customers were the first connected: in
many cases, energy-intensive plants such as fertiliser and cement plants were located in Egypt to take
advantage of the availability of gas. Concessions to construct the network were granted and the num-
ber of customers with smaller demands continues to increase. Power plants continue to dominate
Egypt's domestic gas demand. They were responsible for 63% of demand in 2006, with Industry (14%)
and the energy sector's own consumption (11%) making up the majority of the remainder14
.
11
International Institute for Sustainable Development (IISD), draft final, April 2009, "Wind Power in Egypt: An Investment Case
Study for the Trade & Climate Change Programme". 12
IEA World Energy Outlook 2005 - Special Issue on Middle East and North Africa Insights. Production is projected to in-
crease to 82 bcm in 2030 and exports to 36 bcm. The study notes Egyptian government estimates of probable or possible
reserves to be as high as 2800-3400 bcm 13
All figures taken from Egyptian Electricity Holding Company (EEHC) Annual Reports - http://www.egelec.com/ 14
IEA Energy Statistics for 2006, http://www.iea.org/Textbase/stats/gasdata.asp?COUNTRY_CODE=EG
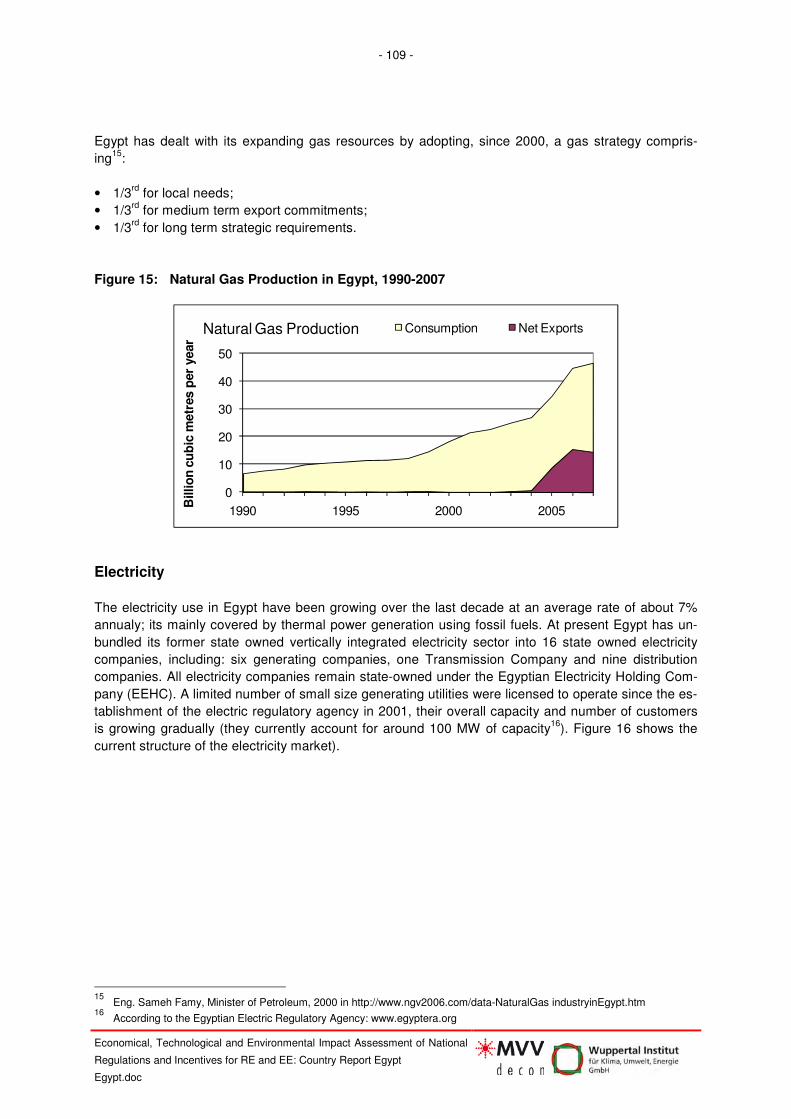
- 109 -
Economical, Technological and Environmental Impact Assessment of National
Regulations and Incentives for RE and EE: Country Report Egypt
Egypt.doc
Egypt has dealt with its expanding gas resources by adopting, since 2000, a gas strategy compris-
ing15
:
• 1/3rd
for local needs;
• 1/3rd
for medium term export commitments;
• 1/3rd
for long term strategic requirements.
Figure 15: Natural Gas Production in Egypt, 1990-2007
0
10
20
30
40
50
1990 1995 2000 2005
Billio
n c
ub
ic m
etr
es p
er
year
Natural Gas Production Consumption Net Exports
Electricity
The electricity use in Egypt have been growing over the last decade at an average rate of about 7%
annualy; its mainly covered by thermal power generation using fossil fuels. At present Egypt has un-
bundled its former state owned vertically integrated electricity sector into 16 state owned electricity
companies, including: six generating companies, one Transmission Company and nine distribution
companies. All electricity companies remain state-owned under the Egyptian Electricity Holding Com-
pany (EEHC). A limited number of small size generating utilities were licensed to operate since the es-
tablishment of the electric regulatory agency in 2001, their overall capacity and number of customers
is growing gradually (they currently account for around 100 MW of capacity16
). Figure 16 shows the
current structure of the electricity market).
15
Eng. Sameh Famy, Minister of Petroleum, 2000 in http://www.ngv2006.com/data-NaturalGas industryinEgypt.htm 16
According to the Egyptian Electric Regulatory Agency: www.egyptera.org

- 110 -
Economical, Technological and Environmental Impact Assessment of National
Regulations and Incentives for RE and EE: Country Report Egypt
Egypt.doc
Figure 16: The Current Electricity Market.
Private Distributor
MV & LVCustomers
Exports& Imports
Gov. PP
BOOT(s)
Generation Co.(s)
Trans Co(s)
HVCustomers
MVCustomers
UHVCustomers
LVcustomers
ISP
ISP
Target MarketCurrent phase 2009
MOEE/EEHC
Dis Co(s)Trans Co(s)
At present, the Egyptian Electricity Holding Company "EEHC" owns 90% of the installed generation capacity (6 Generation Companies). Three private BOOT projects contribute with 9% of the installed generation capacity. The last 1% is made of the present wind farms and small isolated units. The present government owned electricity market is organized in the Single Buyer form. The Egyptian Electricity Transmission Company "EETC", which is the only company licensed for EHV and HV elec-tricity transmission, purchases electrical energy from all generation companies. EETC in turn sells the electrical energy to:
• the present nine distribution companies (around 24 million consumers),
• the present 85 EHV and HV consumers, and
• Some of the 12 private distribution companies (less than1% of the market). Furthermore, EETC is exchanging energy with neighbouring countries over the present interconnec-tions.
Table 13: Categories of Customers
Categories kV Numbers Energy Share
EHV 220, 132 kV 11 20%
HV 66, 33 kV 74 10%
MV 22, 11, 6.6 kV 4100 20%
LV commercial <6.6kV 22 millions 13%
LV residential <6.6kV 37%
Physical Status of EE and RE
The Egyptian energy strategy is targeting 8.3% potential reduction in the energy consumption by year
2022 through energy efficiency applications collectively at both the supply and the demand side. Fur-
thermore, the target contribution of renewable energies would be around 9% (2% from hydro and 7%
from wind; there is no clear assessment so far for the solar energy contribution).

- 111 -
Economical, Technological and Environmental Impact Assessment of National
Regulations and Incentives for RE and EE: Country Report Egypt
Egypt.doc
RE Use in the Country
In 1986 the new and Renewable Energy Authority (NREA) was established to act as the national focal
point for expanding efforts to develop and introduces renewable energy technologies to Egypt on a
commercial scale together with implementation of related energy conservation programmes. NREA is
entrusted to plan and implement renewable energy programs in coordination with other concerned na-
tional and international institutions within the framework of its mandate which includes:
• Renewable energy resource assessment.
• Research, development, demonstration, testing and evaluation of the different RE technologies fo-
cusing on solar, wind and biomass.
• Implementation of renewable energy projects.
• Proposing the Egyptian standard specifications for renewable energy equipment & systems, and
conducting tests to evaluate their performance, under the Egyptian prevailing conditions, hence is-
suing respective licensing certificates to that effect.
• Rendering of consultancy services in the field of renewable energy.
• Technology transfer and development of local manufacturing of Renewable Energy equipment.
• Education, training and information dissemination.
In February 2008 the Supreme Council of Energy, headed by the prime Minister, approved an ambi-
tious plan of having 20% of the generated electric energy from renewable energies by the year 2020.
This target includes 12% contribution from electric wind energy (around 7,200 MW) and 8% from Hy-
dro electric energy. In order to achieve this ambitious target, the Egyptian Electricity Transmission
company is currently inviting private developers through international competitive bidding to design, fi-
nance, own and operate private wind projects to be developed in successive phases in the Gulf of
Suez area as well as in areas east and west of the river Nile And near Kharga Oasis, starting with a
project of 250 MW installed capacity at the Gulf of Suez to be commissioned by December 2013. The
long term plan is to get the private sector to build around 5,000 MW by year 2020 and the rest (around
2,200) by NREA also by 2020. The underlying policy is subject of a case study in Section 5 of this re-
port.
The Egyptian electricity sector has recently drafted a new electricity act to encourage renewable en-
ergy utilization and private sector involvement. In addition to guaranteeing third party access, power
generation from renewables will enjoy priority in dispatching whenever they are available.
NREA has taken the decision to further support wind energy business through providing resource as-
sessment, necessary data for feasibility studies and technical support for potential project developers.
Besides the already earmarked areas, work is underway to identify other promising areas, which will
also be availed for future wind projects carried out by the private sector. The following figure shows
the wind energy situation up to year 2020.

- 112 -
Economical, Technological and Environmental Impact Assessment of National
Regulations and Incentives for RE and EE: Country Report Egypt
Egypt.doc
Figure 17: NREA and Private Sector up to 2020 Plan
35
0
100
200
300
400
500
600
700
2010 \
2009
2011 \
2010
2012 \
2011
2013 \
2012
2014/2
013
2015/2
014
2016/2
015
2017/2
016
2018/2
017
2019/2
018
2020/2
019
2021/2
020
Year
MW
Renewable Energy Authority
Private Sector
/4,0,, 0,,
.,,
., ,
. ,, .,, .,, .,, ., , .,,
/,,/, ,
.,,
.,,
. ,, . ,,
0,,
., ,
0, , 0, , 0, , 0, , 0, ,
With total share about 63 %
The Solar Atlas was issued in 1991, indicating that Egypt, one of the sun belt countries, is endowed
with high intensity of direct solar radiation ranging between 1970 - 2600 kWh/m2/year from North to
South. The sunshine duration ranges from 9 - 11 hours with few cloudy days all over the year. The first
Hybrid thermal Solar power plant is under construction is the Kuraymat Solar Thermal Power Plant
(140 MW). The project site at Kuraymat nearly 90km South Cairo, has been selected due to
1. an uninhabited flat desert land
2. high intensity direct solar radiation reaches to 2400 kWh/m2/year
3. an extended unified power grid and expanded natural gas pipelines
4. proximity to the sources of water (the River Nile).
Figure 18: The Kryamat Solar Thermal Project
Summary of Technical Parameters The Proposed Project Cycle
Capacity of solar portion (MWe) 20
Nameplate capacity of gas turbine (MWe) 79
Nameplate capacity of steam turbine (MWe) 76.5
Net electric energy (GWhe/a) 852
Solar electric energy (GWhe/a) 33
Solar share (%) 4%
Fuel saving due to the solar portion (T.O.E / a) 10000
CO2 reduction (T / a) 20000

- 113 -
Economical, Technological and Environmental Impact Assessment of National
Regulations and Incentives for RE and EE: Country Report Egypt
Egypt.doc
Characterisation of EE Situation
The 8.3% national energy savings target by the year 2022 corresponds to a value reflecting 20% of
the 2007/2008 energy consumption levels. The sectorial energy saving targets are shown in the table
below; the highest potential for energy savings is in the industrial sector followed by energy savings in
the transport sector.
Table 14: Potential Energy Savings at the End User Side (2022) - (Contributions to the 20% value
of year 2007/2008)
End user sector
Current Percentage
Use According
2007/2008 values
Sector Potential Percent-
age Savings According
2007/2008 values
Equivalent National Per-
centage Savings Accord-
ing 2007/2008 values
Agriculture & Irrigation 1 5 0.05
Gov. & Pub. Utilities 3 15 0.45
Res. & Comm. 20 15 3.00
Transportation 29 15 4.50
Industry 47 20 9.40
All sectors 100 17.40
On the supply side the energy efficiency targets are as follows:
Supply Sector Potential Saving
Petroleum products 0%
NG 0.4%
Electricity Generation 1.79%
Electricity Transmission & Distribution 0.4%