spring 2014 forecast - ey 2004 2006 2008 2010 2012 2014 2016 forecast prices
TRANSCRIPT

EY ITEM Club Spring 2014 forecast
April 2014

Contents
EY i
Contents
Highlights – Steady as she goes… 2
Introduction 4
Forecast in detail 13 Fiscal Policy 14 Monetary Policy 14 Prices and Wages 15 Activity 15 Consumer Demand 16 The Housing Market 17 The Company Sector 17 The Labour Market 18 Trade and the Balance of Payments 18
EY is the sole sponsor of the ITEM Club, which is the only non-governmental economic forecasting group to use the HM Treasury model of the UK economy. Its forecasts are independent of any political, economic or business bias.

Contents
EY 2
Highlights –
Steady as she
goes…

Highlights – Steady as she goes...
EY 3
Highlights – Steady as she goes...
► So far, the recovery has been financed largely by a fall in amount that household save, but the latest indicators suggest that it is moving to a firmer footing. Investment is now kicking in, boosted by high levels of corporate cash and confidence. We expect GDP to grow by 2.9% this year and 2.3% in 2015, with interest rates on hold until after the election. These are not spectacular growth rates but they are likely to be sustained, without the risks associated with excessive credit growth.
► Although we think that talk of a Goldilocks expansion of low inflation and strong growth is misleading, she would like the look of the labour market, where strong supply and demand ingredients now provide a tasty combination of real wage and employment growth to sustain the consumer. The labour supply is being swollen by late retirement and welfare to work. With unemployment falling, it is reasonable to believe – as the Chancellor does – that the UK could have the highest employment rate in the G7.
► The growth in the labour supply will help keep wages under wraps and is one of several factors pointing to a long period of steady growth and low inflation. High levels of business investment should revive productivity and also help keep costs down. The strong pound is reducing import costs, while the slowdown in China and other EMs has reduced world commodity prices, which are set to fall further.
► The London property market is pushing the boundaries established at the previous peak and there is little that higher interest rate or other measures can do to restrain cash buyers in central areas. However, it is doubly important for the lenders and the FCA to make sure that the income multiples of mortgage borrowers do not become too stretched. This will head off problems when interest rates do start to rise and will restrain prices in hotspots like Hackney, meaning that house prices move broadly in line with incomes.
► The strong revival in house building should help to keep the lid on prices outside the capital. So far, the increase in mortgage lending has been financed in the main by an increase in repayments by existing borrowers. New mortgage lending remains at rock bottom and does not seem to pose a significant threat to stability.
► The current account deficit increased to a worrisome 4.4% of GDP last year. However this increase was due to a fall in the income return on overseas assets rather than a deterioration in the trade balance or the UK's net asset position. Like our exports, overseas investment income is linked to the performance of developed rather than emerging economies and both should benefit as global growth is distributed more evenly between the two.

EY 4
Introduction

Introduction
EY 5
Introduction
The official statistics for the final quarter of last year hint at a rebalancing of demand, with business and residential investment recovering nicely. Services exports bounced back in the final quarter after a sustained period of weakness although an offsetting deterioration in the balance of overseas investment income meant that the current account remained in heavy deficit, running at 4.4% of GDP last year. More worrying, a fall in household real disposable income meant that the strength in consumer spending was financed by yet another decline in the household saving ratio, adding to concerns about the robustness of the recovery.
The labour market is critical…
Although surveys and other indicators point to another strong quarterly increase in the first quarter of this year, we expect the quarterly figures to ease back over the summer as the consumer pauses for breath. Inflation is set to fall further and the demand for labour should strengthen, restoring real wage growth and putting the consumer on a firmer footing. With investment being revived by high levels of corporate cash and confidence and signs of a pickup in our overseas markets, the recovery should begin to look more solid. Indeed the tantalising prospect of a long, low-inflation expansion is now on the horizon. This low inflation outlook will allow the MPC to leave interest rates on hold, helping to stimulate much needed investment growth and limiting household spending on mortgage payments.
… to the Chancellor’s new employment target…
The labour market remains in the headlines and is central to this forecast. Although the MPC no longer couches its forward guidance in terms of an explicit unemployment threshold, the Chancellor reinstated the full employment objective in his recent speech in Tilbury. However, unlike the unconditional objective of governments from Churchill’s until Callaghan’s, this is conditional upon unemployed workers taking up job offers, training and other opportunities. It is expressed in terms of the employment rate, the percentage of the population of working age that is in employment. This is essentially an efficiency target, that will be reached using microeconomic rather than macroeconomic instruments. Mr Osborne said he could see no reason why the UK shouldn’t aim to have the highest employment rate of any of the world’s leading economies.
0
1
2
3
4
5
6
2002 2004 2006 2008 2010 2012 2014 2016
UK: Bank Rate & 10-year bond yield%
Source : ITEM Club
Bank Rate
10-year government bond yield
Forecast
0
1
2
3
4
5
6
2002 2004 2006 2008 2010 2012 2014 2016
UK: CPI inflation% year
Source : ITEM Club
Forecast

Introduction
EY 6
The UK’s employment rate has been rising in recent years as a result of increased labour force participation, notably by people who would previously have been on welfare or opting for early retirement. We looked at these trends in our last report. Our estimates suggested that welfare to work programmes had added nearly 300,000 to the labour force in two years, with the move from early to late retirement adding over 500,000. These figures increase the percentage of the adult population either in work or looking for work (labour force participation). With unemployment falling by a quarter of a million over these two years, the rise in the employment rate was larger still. Our Table 11 (see detailed forecast tables accompanying this report) follows the OBR and defines participation relative to the adult population, while the charts show it relative to those aged 16-64, in line with the internationally comparable ILO conventions.
…and UK economic performance
Our last forecast predicted that another 300,000 workers would move from welfare into the labour force over the next two years as a result of the government’s reforms. With longer and more active lifespans and low rates of return continuing to persuade older workers to say on (or retired workers to return to work) participation by the over 50’s would increase by another 400,000. The Chancellor’s reform of the annuity system in the Budget may reduce this figure, but the economics of early retirement remain unfavourable and we expect this trend to persist. Our new forecast sees the participation rate increasing from 77.6% last year (on the ILO basis) to 78.4% in 2017, with the employment rate increasing from 71.2 to 73.7%. This performance might not be enough put the UK at the top of the G7 league tables (topped by Germany at 73.3% last year) but it would not be far off. In strong contrast, the US participation rate has fallen back dramatically since the crisis and is of great concern to policymakers.
The labour market also underpins the low inflation outlook…
The labour market is also central to our forecast of an extended low-inflation expansion. Short term, base effects from petrol prices, tariff reductions, cuts by some of the energy utilities and a supermarket price war will apply the brakes to inflation. The forward wholesale gas and electricity markets now make it feasible for the energy suppliers to follow SSE’s lead and promise their customers an extended price freeze. The Budget’s support for energy intensive industries will also benefit consumers, while the strong pound will maintain the downward pressure on profit margins and import prices. The contribution from administered prices like rail fares and student tuition fees should ease over the next couple of years. But the more tantalising prospect is provided by the labour and commodity markets, historically the prime suspects in the UK inflation drama.
The labour market has undergone a dramatic transformation over the last few decades as a result of deindustrialisation, deunionisation and globalisation, making it much more flexible. As noted, the supply of labour has been swollen in recent years by an increase in participation rates, putting downward pressure on wages. This helps to explain why this recovery has seen rising employment accompanied by falling real wages, in contrast to the usual labour demand led recovery, which sees both going hand in hand.
…restraining prices…
Besides participation, public sector redundancies have added over 300,000 to the supply of workers to the private sector over the last two years, with a similar number pencilled in by the OBR for the next two. Immigration remains a major influence particularly in hot spots like London. We estimate that these factors together are currently adding about half a million a year to the pool of workers available to the private employers, adding nearly one percent a year to their potential output.
68
70
72
74
76
78
80
2002 2004 2006 2008 2010 2012 2014 2016
UK: Participation & employment rates% of population aged 16-64
Source : ITEM Club
Participation rate
Employment rate
Forecast
Unemployed
0
1
2
3
4
5
6
7
8
9
2002 2004 2006 2008 2010 2012 2014 2016
UK: Unemployment%
Source : ITEM Club
Claimant count
ILO
Forecast

Introduction
EY 7
…and boosting future output…
This is an example of a favourable supply side effect, which restrains prices and boosts potential output. Of course in this case, these supply-side benefits are confused by the adverse demand-side effects of weak real wages. However, it looks like we have seen the worst of this downside effect, with wage inflation now overtaking price inflation. The demand for labour is strengthening in line with the economy, increasing both real wages and employment. Some surveys indicate that labour shortages are appearing. Private sector wages are accelerating, particularly in manufacturing companies.
… while business investment has similar effects
The strengthening of the economy and the labour market should help to kick-start industrial investment, raising productivity and supporting real wage growth. CBI survey respondents cited uncertainty about demand as one of the major factors holding back investment spending until recently and with business confidence indicators hitting record highs and capacity constraints and shortages of staff on the increase it is not surprising that investment is picking up. Business investment fell again in 2013 but increased by 8.7% through the year to the final quarter. Arithmetically, this makes a big positive contribution to GDP likely this year, which we expect to be sustained over the forecast.
20
22
24
26
28
30
32
2002 2003 2004 2005 2006 2007 2008 2009 2010 2011 2012 2013
UK: PNFC deposits4QMA, % of GDP
Source : Haver Analytics
35
40
45
50
55
60
65
70
75
80
85
2002 2004 2006 2008 2010 2012 2014
UK: BCC survey - recruitment difficulties% of firms
Source : Haver Analytics
Manufacturing
Services
-4
-3
-2
-1
0
1
2
3
4
5
6
7
2002 2004 2006 2008 2010 2012 2014
Source: Haver Analytics
% year
Services
Manufacturing
UK: Headline average earnings growth
-50
-40
-30
-20
-10
0
10
20
30
40
50
60
1996 1998 2000 2002 2004 2006 2008 2010 2012 2014
Source: BCC
% balance
UK: Confidence in profitability
Service sector
Manufacturing sector

Introduction
EY 8
The doubling of the Annual Investment Allowance in the Budget will help SMEs to grow, but with larger companies driving over 90% of business investment, fundamentals like asset prices and the cost of capital are likely to be a more important driver, with the low cost of bank borrowing and the strong stock market being paramount. Leveraged private equity deals are very strong at the moment. The US has already seen a move away from share buy backs to acquisitions and investment and we think UK boards are likely to follow. IPOs have been in the headlines, particularly for high-value tech companies. The market in UK industrial assets has been very active, with many investors saying they are overvalued and that organic growth through capital investment represents better value for their investors.
Housing investment helps restrain prices…
Housing investment has already shot up, propelled by the first part of Help to Buy (H2B1), the equity loan scheme for new build that came in after last year’s Budget. This should help to keep the lid on prices nationally. However, it will have little effect in London, where house price inflation is now seriously stretching the budgets of young first time buyers (FTBs). The Mayor of London has increased the target for new houses in the capital to 42,000. This is very ambitious, but the problem is that many of these homes will be out of the reach of those FTBs.
…and the London market will come to its senses…
So far, concerns about house price inflation are confined to the capital, indeed prices have only just begun to recover in many Northern regions. London is clearly a special case, fuelled by cash rather than mortgage borrowing, injected by overseas buyers, buy to let and the bank of mum and dad. As we thought, the H2B schemes announced in the 2013 Budget have had very little impact in the capital, where income multiples rather than loan to value (LTV) ratios are the main constraint. However, the pension
1.5
2.0
2.5
3.0
3.5
4.0
4.5
5.0
5.5
2002 2003 2004 2005 2006 2007 2008 2009 2010 2011 2012 2013
UK: Construction orders - new housing£bn, 2005 prices
Source : ONS
15
20
25
30
35
40
45
50
1996 1998 2000 2002 2004 2006 2008 2010 2012 2014
UK: Capacity utilization% of firms working at full capacity
Source : Haver Analytics
Manufacturing
Services
-40
-30
-20
-10
0
10
20
30
40
1996 1998 2000 2002 2004 2006 2008 2010 2012 2014Source: BCC
% balanceUK: Investment intentions
Service sector
Manufacturing sector
-15
-10
-5
0
5
10
15
20
25
30
2002 2004 2006 2008 2010 2012 2014 2016100
150
200
250
300
350
400
450
500
UK: House prices & transactionsPrices, % year
Source : ITEM Club
Forecast
Transactions, 000s
Prices(LHS)
Transactions(RHS)

Introduction
EY 9
reforms in this year’s Budget could push the market higher if people cash in their pension pots to invest in buy to let properties rather than annuities.
The average house price to income ratio reached its 2005 peak in London last year, with the mortgage income multiple not far off. In strong contrast, London LTV ratios are well below the peak. This makes it vitally important for the lenders and the Financial Conduct Authority (FCA) to make sure that multiples do not become too stretched and that affordability is rigorously checked. Significantly, the Bank of England’s Credit Conditions Survey reports that although there has been a surge in the availability of high LTV mortgages over the last three months, which is expected to continue over the next three, the increase in the availability of high loan to income mortgages has been modest and is not expected to continue.
…if prudential controls are rigorously enforced
The Mortgage Market Review which is now being implemented should help in this respect, extending affordability checks to major outgoings as well as income and making the lenders fully responsible for these checks. If income multiples remain realistic and are enforced properly this will eventually restrain London house prices, at least in hot spots like Hackney, meaning that house prices move broadly in line with incomes. (As the Governor of the Bank of England has indicated, there is not much that anyone can do to control overseas cash buyers in areas like Kensington and Chelsea.) Last year we argued that the rolling gentrification of new suburbs offers young people a way of getting into the market and many now have to consider moving out of London altogether. But if these prudential controls are not effective then a lot of borrowers (and their lenders) will find themselves in trouble once interest rates start to rise.
These trends are clearly reflected in the national house price ratios. Rising house prices have stretched the income multiple just as they did in the run up to the crisis, but it is interesting that caution on the part of lenders and borrowers seemed to cap the
60
62
64
66
68
70
72
74
EM ET GL NE NW NI SC SE SW WA WM YH UK
UK: Loan to value ratio, 2013% of purchase price
Source : ITEM Club calculations using ONS data
* Diamonds denote peak levels
2.0
2.2
2.4
2.6
2.8
3.0
3.2
EM ET GL NE NW NI SC SE SW WA WM YH UK
UK: Income multiple, 2013Mortgage value relative to average salary of borrower
Source : ITEM Club calculations using ONS data
* Diamonds denote peak levels
58
60
62
64
66
68
70
72
74
76
1992 1994 1996 1998 2000 2002 2004 2006 2008 2010 20122.0
2.1
2.2
2.3
2.4
2.5
2.6
2.7
2.8
2.9
3.0
UK: Lending critera% of purchase price
Source : ONS
Mortgage value relative to average salary of borrower
Average loan-to-value ratio
(LHS)
Average income multiple(RHS)
-2
0
2
4
6
8
10
12
1994 1996 1998 2000 2002 2004 2006 2008 2010 2012 20140
20
40
60
80
100
120
140
Source: Haver Analytics
£bn 000s
Number of loans approved for house purchase
(RHS)
Net mortgagelending (LHS)
UK: Housing market activity

Introduction
EY 10
average ratio at around three times income. The regional data support this impression, being clustered in the range 2.8-3.1. Even so, much of this lending was financed by overseas bank borrowing, meaning that the credit crunch hit the housing market very hard.
The average income multiple is now back to where it was at the peak, but the LTV ratio is well below. The Chancellor’s H2B2 mortgage guarantee scheme, which extends the availability of high LTV mortgages to existing homes, is likely to push this higher outside the capital. However, this should not be a problem provided that income multiples remain manageable and the lenders do not become dependent on overseas finance. So far, the increase in mortgage lending has been financed in the main by an increase in repayments by existing borrowers. New mortgage lending remains at rock bottom and does not seem to pose a significant threat to economic or financial stability.
The Peoples’ Republic is rebalancing successfully…
The other favourable supply side shock being experienced by the UK at the moment is the slowdown in the emerging markets and the consequent downward pressure on commodity prices. Again, this comes with a downside demand side felt in this case by UK exporters, but this is not serious given our poor penetration of these markets and the revival in the developed world. As we argued in our July 2013 Report, the rebalancing strategy adopted by the new Chinese government holds promise for the UK.
This view is now commonplace, but it is worth seeing how well this adjustment is proceeding. Rebalancing an economy away from over-dependence upon exports and investment towards consumption (or in the opposite direction as required in the UK) is never easy, as the Japanese found to their cost in the 1980s. It requires an increase in the real exchange rate to dampen exports and the profitability of investment accompanied by an offsetting boost to domestic demand to maintain output.
…which is good news for the UK
However, the Chinese authorities seem to be doing well, reflecting the control they still have over their economy. The first part of the adjustment has already happened: the renminbi has risen by 25% against the dollar since 2005. Since prices and wages are inflating much faster than in the US, the currency has appreciated by 35% in real terms according to the OECD, while relative labour costs have risen by 85%. The share of Chinese exports in major developed markets has stabilised since the start of the decade and the current account surplus has come down from over 10% of GDP to around 2% since the onset of the Global Financial Crisis in 2007. Exports have been growing at just 5% a year, falling as a share of GDP.
So far, the demand-side effects of the export slowdown have largely been offset by a stimulus to infrastructure and industrial investment. According to the official statistics, investment rose from 42% of GDP in 2007 to a staggering 48% in 2011. As we remarked in July, Germany and her capital goods exporters have been a major beneficiary of this shift. But they will find the going harder now that the new government has reduced the target growth rate to 7%. This will drastically reduce investment’s share of GDP, requiring faster consumption growth to offset this. This element of the rebalancing has eased the pressure on commodity price inflation and widened the door for UK exporters of branded consumer goods.
Commodity prices have fallen back considerably since 2011. The effects of lower oil and food prices have been felt on the forecourt and in the shopping basket, but the major beneficiaries of the emerging market slowdown have been manufacturers who have benefitted from lower industrial commodity prices. The cost of raw materials and fuel has fallen by 5.7% in the UK over the last year. The fall has been much larger for metal prices, which were driven skywards by the Chinese investment boom but
2.8
1.4
7.7
2.41.9 1.5
7.7
2.22.9
1.11.5
2.9
-0.6 -0.4
7.2
-2
-1
0
1
2
3
4
5
6
7
8
US Eurozone Japan China World
2012
2013
2014
World: GDP forecasts% year
Source : ITEM Club
-15
-10
-5
0
5
10
15
20
25
30
35
1996 1998 2000 2002 2004 2006 2008 2010 2012 2014Source: Haver Analytics
% yearUK: Headline producer prices
Output
Input

Introduction
EY 11
have now come back down to earth. Production is increasing in response to the period of high prices, demand is weakening and stocks are very high. Chinese metal producers rely heavily on stocks of iron ore and copper for collateral in the shadow credit market, which is being squeezed by the People’s Bank, causing stocks to be run off. Commodity forecasters are predicting further weakness in base metal prices.
The rebalancing of growth away from emerging towards developing markets should help UK exports. It should also help plug the large gap that has opened up in the UK’s net overseas income account. This has occurred because the rate of return on overseas assets has fallen relative to the return on liabilities rather than deterioration in the balance sheet, which would be much more of a concern. Indeed, the UK’s net asset sheet position improved significantly last year because capital gains on assets (which are not scored as a credit in the balance of payments account) offset capital gains as well as interest and other payments on liabilities. In 2011, 42% of UK overseas assets were in EU countries (as against only 2% in the BRICs) and a recovery in these economies should boost the income on these assets.
The forecast sees low inflation and interest rates…
The forecast sees GDP growth of 2.9% this year and with CPI inflation below target and inflation pressures subdued going forward, we expect base rate to remain on hold until after next year’s election. Industrial surveys remain very strong, pointing to another strong increase in the first quarter. However, we then expect the quarterly increases to moderate over the summer as the consumer pauses for breath. The manufacturing PMI published at the beginning of this month suggests that the stronger pound may be undermining export prospects but is continuing to ease import cost pressures.
The ITEM Club forecast for the UK Economy, Spring 2014
% changes on previous year except borrowing, current account and interest & exchange rates
GDP Domestic Demand Consumer spending Fixed investment Exports Imports
2011 1.1 -0.1 -0.4 -2.4 4.5 0.3
2012 0.3 1.2 1.4 0.8 1.7 3.4
2013 1.7 1.8 2.2 -0.6 1.0 0.5
2014 2.9 3.0 2.3 9.0 5.3 5.5
2015 2.3 2.5 2.2 8.2 5.9 6.2
2016 2.3 2.3 2.2 7.9 5.6 5.5
2017 2.5 2.1 2.0 7.3 5.3 4.1
Net Govt
Borrowing(*) Current account (%
of GDP) Average earnings CPI Bank Rate Effective exchange
rate
2011 7.7 -1.5 2.5 4.5 0.5 80.0
2012 5.2 -3.8 2.3 2.8 0.5 83.0
2013 5.9 -4.4 1.4 2.6 0.5 81.4
2014 4.7 -4.2 1.7 1.6 0.5 84.4
2015 3.8 -2.3 2.6 1.7 0.7 82.0
2016 2.5 -1.5 3.0 1.8 1.6 81.0
2017 2.1 -0.9 3.5 2.2 2.6 80.2
(*) Fiscal years, as % of GDP
Source: ITEM Club
…supporting demand…
Consumer spending grew by 2.2% last year but the pressure on real disposable incomes meant that this was financed by a fall in the saving ratio, from 7.4% in 2012 to 5.2%. However, wages are now accelerating and prices decelerating. Including bonuses, average weekly earnings for November 2013 to January 2014 were 1.4% higher than a year earlier, with pay excluding bonuses 1.3% higher. Although monthly figures are volatile, the January on January increases were respectively 1.7% and 1.8% (broadly in line with the February CPI figure), with private earnings stronger still. We expect pay to increase by 1.7% this year, just ahead of the CPI increase of 1.6%. And with the growth in employment continuing, wages and salaries should increase by 3.4% this year, with stronger growth expected over the rest of the forecast. Consumption increases by another 2.3% this year (just ahead of real disposable income growth of 2.2%) and another 2.2% (1.7%) in 2015. The saving ratio dips below 4% over the last three years of the forecast, when we start to see household debt to income ratios rising again.

Introduction
EY 12
…and the housing market…
Mortgage approvals dipped in February, but this seems likely to have been the effect of bad weather. We see house prices increasing by 7.4% this year and 7.2% next year, easing back to 4.2% in 2016. Transactions continue to strengthen over the next two years. Housing investment increases by 7% this year, 10.1% next year and a hefty 13.4% in 2016. By the end of the forecast we expect housing investment to top the peak reached in 2006.
As we have remarked, the growth in business investment through the year to the final quarter of 2013 means a strong 2014 figure, of 9.1% in the forecast. We expect the strength of investment to be sustained over the forecast, buoyed by the low cost of capital, the high levels of cash in company coffers and confidence in company boardrooms. We are forecasting investment growth of 9.5% next year followed annual growth of 7% or more in the remaining years of the forecast. Total investment should increase by 9% this year followed by 8.2% in 2015, with growth rates of around 7% expected over the rest of the forecast.
External trade still acts as a drag on growth on GDP this year and next but should begin to make a significant contribution to GDP by the end of the forecast, helping the composition of demand to broaden out. Service sector exports began to revive last year, with quarterly increase of 2.5% and 5.5% in the last two quarters. This upturn was correctly anticipated by the BCC’s survey, which continues to look positive. With exports of goods and services reviving in line with our major overseas markets total export volumes are forecast to increase by 5.3% this year, followed by 5.9% in 2015 and similar figures in the later years. However, the UK is growing faster than most other economies so imports will also be strong, up 5.5% this year and 6.2% in 2015 before easing back to around 4% in the final year of the forecast. This year’s current account deficit is near to last year’s record, but is much closer to balance by 2018.
… with the main risks remaining external to the UK.
We continue to see the main risks to this forecast lying overseas. While we remain bullish about the US recovery, this is still far from normal, meaning that the long period of low interest rates is set to continue, probably until next summer. This means that the search for yield which characterised the run up to the financial crisis gets ever more desperate, reducing the price of credit risk, increasing gearing and raising concerns about financial stability. As we have remarked, highly leveraged deals are increasing and indeed terms like ‘cov-lite’ are being blithely bandied around again. Nevertheless, these excesses do not as yet characterise the key UK credit markets where lenders remain cautious. Mortgage borrowing in particular is being financed by repayments rather than overseas bank borrowing and lending to SMEs is if anything still deficient.
So far the crisis in the Ukraine has had little impact on other countries. With production increasing in Iraq and the US, the oil market has been able to ride out supply disruptions in Libya as well as the uncertainty about Russian exports. The demand for Russian gas has been eased by the onset of spring in Europe. However, hostilities in the Ukraine would surely drive up energy and base metal prices, upsetting our low inflation outlook. Longer term it is risky to become dependent upon energy imports given the unstable autocratic regimes that run the major exporting countries. Many economists argue that mineral resources are a curse for the producing countries, forcing up the exchange rate and making life tough for other exporters. Similarly, some political theorists argue that resources concentrate economic and political power and those political systems that enjoy them are naturally prone towards a top-down autocracy, while those that depend instead upon a hard-working population that pays taxes are naturally inclined towards a bottom-up democracy. It remains to be seen how this theory will play out in Russia and indeed China.
-50
-40
-30
-20
-10
0
10
20
30
40
1996 1998 2000 2002 2004 2006 2008 2010 2012 2014Source: BCC
% balance
UK: Export orders
Service sector
Manufacturing sector
-1.5
-1.0
-0.5
0.0
0.5
1.0
1.5
2.0
2.5
3.0
3.5
4.0
1997-2007
2012 2013 2014 2015 2016 2017
Consumer spending Investment
Govt. consumption Inventories
Net trade
UK: Contributions to GDP growth%pts
Source : ITEM Club

Introduction
EY 13
Forecast in
detail

Forecast in detail
EY 14
Forecast in detail
Fiscal Policy
Although the economic recovery is steadily being reflected in an improvement in the fiscal numbers, the UK is still only half-way though the Government’s planned fiscal austerity.
In its Budget forecast, the Office for Budget Responsibility (OBR) made a modest downward revision to its 2013/14 borrowing forecast, from £111bn to £108bn (excluding APF transfers). Future years also saw small cuts in expected borrowing, with the OBR forecasting a surplus of £5bn in 2018/19. Our forecasts show a similar improvement in the public finances over the next five years.
Meanwhile, the OBR thinks that the Chancellor will meet his fiscal mandate with a similar margin for error (1.5% of GDP) as at the time of the Autumn Statement. However, the supplementary debt target (to have the ratio of public debt to GDP falling by 2015/16) is still expected to be missed by a year.
With fiscal policy now being centred around the government’s pursuit of a surplus in 2018-19, rather than merely complying with the fiscal mandate, Mr Osborne chose not to announce a big net ‘giveaway’ in the Budget. Measures announced were fairly modest and funded to a large extent by ‘takeaways’, including an extension of the further spending restraint announced in the Autumn Statement and raising more money from tax avoidance measures.
But whether the spending cuts that are still to come are really deliverable remains questionable. The squeeze on spending over the next few years is forecast by the OBR to take government consumption of goods and services to its smallest share of GDP since at least 1948. In the context of an ageing population and public demands for better public services, this will be very difficult to achieve.
Monetary Policy
The MPC set out ‘phase two’ of forward guidance in February. The strength of the recovery and the sharp fall in unemployment towards the 7% threshold used for the MPC’s first phase of forward guidance had led investors to bring forward their expectation for when a rise in Bank Rate would happen.
But February saw the MPC drop the explicit link between unemployment and interest rates (at least once the jobless rate falls below 7%). The Committee’s new guidance states that interest rates will only rise once a considerable amount of the spare capacity in the economy has been eliminated. With growth in demand likely to elicit an improvement in the economy’s supply capacity, as well as push down the ‘equilibrium’ rate of unemployment, the MPC’s new framework arguably gives it more leeway to keep interest rates lower for longer than the previous unemployment-based guidance.
With prospects for inflation looking benign, thanks in part to the stronger pound, Bank Rate should remain on hold at 0.5% until the third quarter of 2015. Thereafter the normalisation of rates is likely to be very gradual, with our forecast assuming that they increase by 100bp a year until reaching a neutral rate of 4.5%. However, the dovish commentary which accompanied the Inflation Report suggested that the MPC feel that rates may flatten off at a lower level.
0
20
40
60
80
100
120
Apr May Jun Jul Aug Sep Oct Nov Dec Jan Feb Mar0
20
40
60
80
100
120
Source: Haver Analytics
£bn
UK: Public sector net borrowing
Fiscal year 13/14
Fiscal year 12/13
Cumulative position
£bn
OBR forecast 13/14
0
1
2
3
4
5
6
2002 2004 2006 2008 2010 2012 2014 2016
UK: Bank Rate & 10-year bond yield%
Source : ITEM Club
Bank Rate
10-year government bond yield
Forecast

Forecast in detail
EY 15
Meanwhile, with US yields falling and a drop in expectations for the level to which Bank Rate will eventually rise, 10-year gilt yields have drifted down, moving from 3.2% at the beginning of the year to around 2.8% in March. But we expect yields to tick upwards over the rest of the year as the recovery gains momentum.
Since the beginning of the year, the pound has held onto the strength gained in the second half of 2013 and is broadly unchanged against both the euro and the dollar. Looking forward, with prospects that interest rates will be hiked more quickly in the US, sterling may fall against the dollar, taking the currency from an average of $1.63 to $1.58 next year and $1.56 in 2014. However, stronger relative growth prospects may see the pound show greater resilience against the euro. But in line with recent comments from MPC members, a further strengthening in sterling could lead to a rise in interest rates being delayed.
Prices and Wages
The early part of 2014 has seen a further slowdown in inflation, with the CPI rate falling to 1.7% in February, the slowest pace since 2009. Sliding petrol and energy prices have played a significant role in the decline, as have food prices. The impact of higher university fees has also eased relative to a year ago, further pulling down on the headline rate.
Underlying inflation remains well anchored, with CPI excluding food, energy, alcohol and tobacco standing at 1.7% in February. A large output gap and still relatively subdued demand in the economy is limiting the ability of firms to raise their prices, while there is still plenty of spare capacity in the labour market, which is keeping wage growth in check.
These factors are expected to remain in play in the near-term, keeping underlying inflationary pressures subdued. Several other factors also point to inflation remaining low. Reports of a growing price war between the major supermarkets suggest weak food price inflation, while the final cuts in domestic energy bills – caused by the changes to the Energy Companies Obligation scheme – are still to feed into the indices.
Strong base effects from last spring’s rise in petrol prices will also weigh on inflation rates in the near-term. And we expect oil prices to fall further over the next few months as concerns surrounding Ukraine and Libya ease and increased supply from both OPEC and non-OPEC countries comes on stream. The impact on retail petrol prices will be magnified by the appreciation of the pound, which is expected to be around 7% stronger than a year earlier against the dollar in Q2.
Indeed, the strength of sterling is weighing on the prices of all imported goods, as demonstrated by the fact that manufacturers’ input costs were down more than 5% on the year in February. As a result there is producer output price inflation is barely positive, so there is no evidence of any price pressures being generated in the supply chain. Taking all of these factors together, we expect CPI inflation to average just 1.6% in 2014.
Inflation rates are likely to rise thereafter, but only gradually. As demand in the economy continues to strengthen, the amount of spare capacity in the economy will steadily fall. A tighter labour market will enable workers to start pushing for higher wages – indeed we expect wage growth to overtake CPI inflation as early as April. And rising demand will also boost the ability of firms to raise prices. Combined with a slow depreciation of sterling, underpinned by rising interest rate and economic growth differentials with the US, we expect inflation to slowly edge upwards. RPI inflation will be higher throughout, reflecting both the so-called ‘formula effect’ and, from mid-2015, the impact of interest rate rises.
Activity
The economic recovery is becoming more entrenched and better balanced. Although consumer spending has continued to play the biggest role in driving growth, investment is increasingly making its presence felt. So while the UK economy is not completely out of the woods, 2014 should see a year of decent, if not spectacular, growth.
Having averaged only 0.1% in 2012, quarterly GDP growth rose to an average of 0.7% in 2013. And the monthly output data and business surveys point to this rate being exceeded in Q1 2014.
0
1
2
3
4
5
6
2002 2004 2006 2008 2010 2012 2014 2016
UK: CPI inflation% year
Source : ITEM Club
Forecast

Forecast in detail
EY 16
The recovery is likely to continue being driven primarily by the consumer. An easing of credit conditions, the decline in the household debt burden since 2008 and a boost to household wealth from rising house prices will all support consumers’ appetite to spend. And, with earnings growth set to soon push ahead of inflation, the consumer recovery should rest on sounder foundations.
Meanwhile, the base of the economic recovery should continue broadening out, continuing a trend that began in 2013. Business investment expanded for four successive quarters last year, growing by 8.7% over the year to Q4 2013, more than three times faster than growth in consumer spending. With surveys pointing to strong investment intentions among firms and the housing market recovery encouraging more housebuilding, overall investment should rise by 9% this year.
However, in the short-term the UK’s recovery will probably remain a mostly domestic affair. The Eurozone is likely to experience only modest growth in 2014 and the steady appreciation in sterling since the middle of 2013 will weigh on overseas sales. That said, recent export surveys have been positive and, despite the recovery in consumer spending, import growth has been fairly subdued.
We expect GDP growth of 2.9% this year and 2.3% in 2015. While prospects look brighter, downside risks haven’t completely gone away. The fiscal squeeze will continue to weigh on GDP growth, while the UK remains vulnerable to a renewed outbreak of financial turmoil in the Eurozone. But there is also some upside potential from companies investing their cash hoardings more aggressively.
Consumer Demand
Consumer spending has propelled the economic recovery despite average earnings continuing to decline in real terms. But falling inflation and the prospect of a recovery in productivity growth should prompt real wages to start rising soon. With additional support from gains in employment, the foundations of the consumer recovery look increasingly secure.
Rises in consumer spending in recent quarters have relied largely on households saving a smaller share of their incomes. With falling unemployment, increasing confidence and a ‘wealth effect’ from the rising house prices, there is the potential for the saving ratio to drop a little further.
But saving less is not a sustainable basis for continued growth in consumption. Fortunately, a more robust source of extra spending – rising real earnings – should soon be a reality. Inflation fell to its lowest level in four years in February. And a tighter labour market and the scope for a recovery in productivity should feed into faster growth in cash wages. So earnings should soon start to exceed inflation on a sustained basis for the first time since 2008. What’s more, a further rise in employment will also support growth in overall household incomes.
And households’ spending power will receive other boosts. The income tax personal allowance saw a big increase in April. And with banks announcing even larger provisions for compensation for mis-sold payment protection insurance, the addition to household incomes from this source should continue for some time.
That said, households’ budgets will not be free of pressures. Growth in real earnings this year is likely to be modest, while the removal of mortgage subsidies offered by the Funding for Lending Scheme may push up borrowing costs. And austerity continues, with the 1% cap on growth in most working-age benefits remaining in place and more (unspecified) welfare cuts to come in 2015.
-8
-6
-4
-2
0
2
4
6
2002 2004 2006 2008 2010 2012 2014 2016-8
-6
-4
-2
0
2
4
6
UK: Contributions to GDP growth% year
Source : ITEM Club
ForecastGDP
Net exports
Domesticdemand
0
1
2
3
4
5
6
7
8
9
2002 2004 2006 2008 2010 2012 2014 2016
UK: Savings ratio% of disposable income
Source : ITEM Club
Forecast

Forecast in detail
EY 17
But these pressures should not stop consumer spending expanding by 2.3% this year and by 2.2% in 2015. While healthy relative to recent years, growth will remain well short of the 3.6% annual rates seen in the decade prior to the 2008 crisis.
The Housing Market
The housing market ended 2013 on a strong note, with momentum building in both prices and transactions. And market indicators point to further acceleration in activity and prices this year.
As of March, annual growth in property prices was running at around 10% on both the Nationwide and Halifax measures. The ONS figures are a little lower, at just under 7%, but in London prices were reported to have increased by 13.2% in the year to January.
We are still sceptical about the likelihood of an unsustainable house price boom. Caution on the part of lenders, the adoption of tighter lending criteria following the Mortgage Market Review and the Bank of England’s recently gained macro-prudential tools should deter rapid credit growth, the precursor to past episodes of excessive rises in property values.
And we doubt that government incentives to encourage home purchases will do much to inflate a bubble. In the 11 months to February 2014, 16,465 mortgages were taken out through the equity loan element of the ‘Help to Buy’ (H2B) scheme, but this figure represented only 2¼% of all mortgages approved over that period.
And while the mortgage guarantee element of H2B appears to be increasing the availability of high loan-to-value mortgages, it is unlikely to have been having much impact in London and the South East, where income multiples rather than loan-to-value ratios are the source of affordability problems and the expense of H2B loans will deter many borrowers.
Moreover, there have been signs of an easing in housing demand. According to the RICS survey, the balance of surveyors reporting a rise in new buyer enquiries has fallen sharply since the end of 2013. That said, the same survey also saw a reduction in new sales instructions, with the balance remaining negative in February for a second successive month.
Supply should be boosted by a continuation of rapid growth in housing starts, with the extension to 2020 of the new build element of H2B providing further impetus. The number of new homes under construction was 23% higher in Q4 2013 than a year earlier. But with demand set to remain elevated, we expect property prices to rise by 7.4% this year and by a further 7.2% in 2015.
The Company Sector
Recent national accounts data suggest that the corporate sector has been playing a bigger role in the economic recovery than previously thought. Business investment rose by 8.7% over the year to Q4 2013 and surveys of investment intentions point to strong growth ahead. But what will hopefully be a sustained rise in investment is starting for a very low base.
In 2013 business investment was only 7.8% of GDP, lower than in many other advanced economies, especially the US. Meanwhile, in real terms, investment in Q4 was still almost 20% below its 2008 pre-crisis peak. So there would appear to be plenty of room for spending by firms to grow.
Economic recoveries tend to see investment initially lagging rises in GDP as firms wait to see if stronger demand persists. So with uncertainty about the durability of the recovery fading, companies now have more motivation to spend. Indeed, the CBI Industrial Trends survey has recently seen a drop in the balance of firms citing demand uncertainty as a constraint on investment. And the Budget’s extension of the Annual Investment Allowance will encourage smaller firms to bring forward spending into 2014 and 2015.
Meanwhile, corporates also have the means to fund more capital spending. Retained earnings have continued to exceed investment, resulting in firms’ holdings of cash expanding further. Corporate cash balances now amount to 31% of GDP, or almost four times spending on business investment in 2013.
-15
-10
-5
0
5
10
15
20
25
30
2002 2004 2006 2008 2010 2012 2014 2016
UK: House prices% year
Source : ITEM Club
Forecast

Forecast in detail
EY 18
Moreover, for companies requiring external finance, credit conditions should continue to ease. The latest Bank of England survey reported a significant increase in the availability of corporate credit at the end of 2013, with a further rise expected in the early part of this year. Positively, credit availability was increasing for both large and small firms.
That said, the large amount of slack we think is present in the economy will constrain the pace of growth in capital spending, as firms utilise existing capacity before investing in expansion.
However, GDP growth should still be more investment driven in 2014. We expect business investment to rise by 9.1% in 2014, which would be the strongest performance since 2007.
The Labour Market
The labour market figures have remained strong. The single month figures for January showed a first sub-7% reading for unemployment since 2009, while employment growth remains solid. Vacancies continue to rise, while business survey data reflect rising demand for labour across all industries.
The improvement in the jobs situation is finally starting to filter through to an improvement in the pace of earnings growth, which increased by 1.7% on the year in January. While this was still below the pace of inflation that month, we expect earnings to overtake prices within the next month or two.
But the flip side of the sustained strength in employment is the weakness in productivity, with output per worker flat in Q4 2013. This trend continues to puzzle – typically we would not expect firms to continue to soak up labour against a backdrop of weak output growth. While labour hording may have provided some explanation for this in the early post-financial crisis period, this explanation has become increasingly weak over the past couple of years since firms started to increase headcount. We think that a key factor underpinning the weakness in productivity and real wages is the sizeable shock to the labour supply over the past couple of years, with high levels of inward migration, people working longer and efforts to tighten eligibility for benefits combining to increase the pool of available labour and drive down wage inflation.
We expect the unemployment rate to continue its descent in the coming months, falling to 6.5% by end-2014, and 6.1% by end-2015, from 7.1% in Q1 2014. An increasingly tight labour market should be reflected in more brisk wage growth and we forecast nominal earnings growth of 1.7% in 2014, before an acceleration to 2.6% in 2015 and 3% in 2016.
The recovery in the labour market will mean households will be able to continue to spend without such a need to borrow or eat into savings, which would be a much healthier growth dynamic than we saw for much of 2013. But our growth forecast assumes that the recovery in activity will be accompanied by a rebound in productivity. Were the productivity response to be weaker, we would see stronger employment growth and, potentially, a pick-up in wage pressures as firms face skills shortages. This could generate stronger growth in consumer spending in the near-term, but over the longer term it would imply that the economy had weaker potential growth prospects.
Trade and the Balance of Payments
National accounts data for Q4 2013 revealed a 2.8% surge in export growth on the quarter, though while this suggests that the economy has started to rebalance, it did come on the back of a very poor Q3. Services exports came roaring back in the final quarter after a sustained period of weakness and goods exports also increased. This contributed to the UK trade deficit almost halving in Q4 compared to the previous three months. But a deterioration in investment income meant that the UK continued to run a very wide current account deficit
25
27
29
31
33
35
37
39
41
43
45
2002 2004 2006 2008 2010 2012 2014 2016
UK: Business investment£bn
Source : ITEM Club
Forecast
0
1
2
3
4
5
6
7
8
9
2002 2004 2006 2008 2010 2012 2014 2016
UK: Unemployment%
Source : ITEM Club
Claimant count
ILO
Forecast
Forecast in detail
EY 19
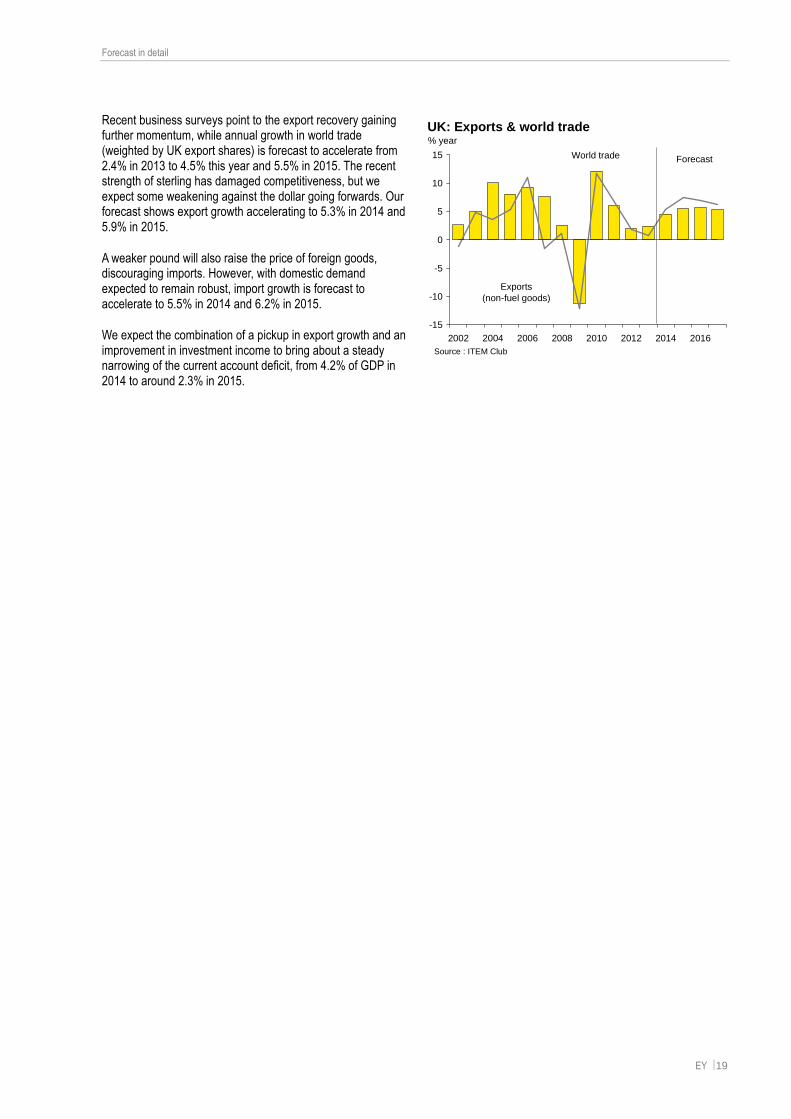
Recent business surveys point to the export recovery gaining further momentum, while annual growth in world trade (weighted by UK export shares) is forecast to accelerate from 2.4% in 2013 to 4.5% this year and 5.5% in 2015. The recent strength of sterling has damaged competitiveness, but we expect some weakening against the dollar going forwards. Our forecast shows export growth accelerating to 5.3% in 2014 and 5.9% in 2015.
A weaker pound will also raise the price of foreign goods, discouraging imports. However, with domestic demand expected to remain robust, import growth is forecast to accelerate to 5.5% in 2014 and 6.2% in 2015.
We expect the combination of a pickup in export growth and an improvement in investment income to bring about a steady narrowing of the current account deficit, from 4.2% of GDP in 2014 to around 2.3% in 2015.
-15
-10
-5
0
5
10
15
2002 2004 2006 2008 2010 2012 2014 2016
UK: Exports & world trade% year
Source : ITEM Club
ForecastWorld trade
Exports(non-fuel goods)

EY | Assurance | Tax | Transactions | Advisory
Ernst & Young LLP
www.ey.com/uk
About EY
EY is a global leader in assurance, tax, transaction and advisory services. Worldwide, our 167,000 people are united by our shared values and an unwavering commitment to quality. We make a difference by helping our people, our clients and our wider communities achieve their potential.
EY refers to the global organization of member firms of Ernst & Young Global Limited, each of which is a separate legal entity. Ernst & Young Global Limited, a UK company limited by guarantee, does not provide services to clients. For more information about our organization, please visit www.ey.com
About ITEM Club
The ITEM Club is the only non-governmental economic forecasting group to use the HM Treasury’s model of the UK economy. ITEM stands for Independent Treasury Economic Model. HM Treasury uses the UK Treasury model for its UK policy analysis and Industry Act forecasts for the Budget. ITEM’s use of the model enables it to explore the implications and unpublished assumptions behind Government forecasts and policy measures.
Uniquely, ITEM can test whether Government claims are consistent and can assess which forecasts are credible and which are not. Its forecasts are independent of any political, economic or business bias.
The UK firm Ernst & Young is a limited liability partnership registered in England and Wales with Registered number OC300001 and is a member firm of Ernst & Young Global Limited
Ernst & Young LLP, 1 More London Place, London, SE1 2AF.
© ITEM Club Limited. 2014. Published in the UK. All Rights Reserved.
All views expressed in ITEM Club Spring 2014 Forecast are those of ITEM Club Limited and may or may not be those of Ernst & Young LLP. Information in this publication is intended to provide only a general outline of the subjects covered. It should neither be regarded as comprehensive or sufficient for making decisions, nor should it be used in place of professional advice. Neither the ITEM Club Limited, Ernst & Young LLP nor the Ernst & Young ITEM Club accepts any responsibility for any loss arising from any action taken or not taken by anyone using this material. If you wish to discuss any aspect of the content of this newsletter, please talk to your usual Ernst & Young contact.
This document may not be disclosed to any third party without Ernst & Young’s prior written consent.
Reproduced with permission from ITEM Club Limited