can oil prices forecast exchange rates? - … · can oil prices forecast exchange rates? ... oil...
TRANSCRIPT

Can Oil Prices Forecast Exchange Rates?
Domenico Ferraro, Ken Rogo¤ and Barbara Rossi
Duke University Harvard University ICREA-UPF,BGSE,CREI
October 21, 2012
Abstract
This paper investigates whether oil prices have a reliable and stable out-of-sample
relationship with the Canadian/U.S dollar nominal exchange rate. Despite state-of-the-
art methodologies, we �nd little systematic relation between oil prices and the exchange
rate at the monthly and quarterly frequencies. In contrast, the main contribution is
to show the existence of a very short-term relationship at the daily frequency, which
is rather robust and holds no matter whether we use contemporaneous (realized) or
lagged oil prices in our regression. However, in the latter case the predictive ability
is ephemeral, mostly appearing after instabilities have been appropriately taken into
account.
J.E.L. Codes: F31, F37, C22, C53.
Acknowledgments: We would like to thank K. Sheppard and D. Wang for providing
data related to this project, as well as R. Alquist, H. Guay, A. Herrera, M. Chinn, L.
Kilian, M. Obstfeld, J. Wright and participants at the 2011 Bank of Canada-ECB
conference on "Exchange Rates and Macroeconomic Adjustment", the 2012 American
Economic Association Meetings and the Paris School of Economics for comments.
1

1 Introduction
In this paper, we focus on a particular commodity price, namely, oil prices, to predict
the �uctuations in the U.S.-Canada�s nominal exchange rates in a pseudo out-of-sample
forecast experiment.1 Our results suggest that, despite incredibly re�ned and clean data, we
�nd paradoxically little systematic relation between oil prices and the exchange rate if one
takes the monthly and quarterly frequencies into account. In contrast, the very short-term
relationship between oil and exchange rates is rather robust. The novelty of our approach is to
consider data at daily frequencies that capture the contemporaneous short-run movements in
these variables, as well as to allow for time variation in the relative performance of the models.
Our results indicate that contemporaneous realized oil prices are related to daily nominal
exchange rates between Canada and the U.S., and the relationship is strongly signi�cant.
On the other hand, the predictive ability of the lagged realized oil prices is more ephemeral,
and allowing for time variation in the relative performance is crucial to show that lagged
commodity prices are statistically signi�cant predictors of exchange rates out-of-sample. It
is noteworthy that, although in-sample �t is stronger in monthly and quarterly data than in
daily data, the out-of-sample predictive ability result breaks down for monthly or quarterly
data, thus suggesting that not only the predictive ability is transitory, but also that the
e¤ects of oil price changes on exchange rates are short-lived and that the frequency of the
data is crucial to capture them.
Although the main focus is on the Canadian-U.S. dollar exchange rate and oil prices,
due to the availability of data and its importance in the press,2 we demonstrate that similar
1Our study focuses on Canada for three reasons. The �rst is that crude oil represents a substantial
component of Canada�s total exports. The second is that Canada has a su¢ ciently long history of market-
based �oating exchange rate. Finally, Canada is a small-open economy whose size in the world oil market is
relatively small to justify the assumption that it is a price-taker in that market. For the latter reason, crude
oil price �uctuations serve as an observable and essentially exogenous terms-of-trade shock for the Canadian
economy.2For example, see the Wall Street Journal ("Canadian Dollar Slumps, Weighed Down By Softer CPI,
Oil Prices," January 25, 2011, at http://online.wsj.com/ article/BT-CO-20110125 -714898.html) and
"Canadian Dollar Foreign Exchange Pushes Higher on Oil Prices," at http://www.foreignexchangeservice.
co.uk/foreign-exchange-america/canada/01/2011/canadian-dollar-foreign-exchange-rate-pushes-higher-on-
2

results hold for other commodity prices/exchange rates. In particular, for the Norwegian
krone-U.S. dollar exchange rate and oil prices, we �nd signi�cant predictive ability of both
contemporaneous and lagged oil prices. Similar results hold for the South African rand-
U.S. dollar exchange rate and gold prices. For the Australian-U.S. dollar and oil prices and
the Chilean peso-U.S. dollar exchange rate and copper prices, we �nd strong and signi�cant
predictive ability only with realized, contemporaneous commodity prices as predictors.3 Our
result holds for in-sample daily data as well. We conjecture that the mechanism leading to
this result is the fact that, for a small open economy exporting oil, the exchange rate should
re�ect �uctuations in oil prices (see Obstfeld and Rogo¤, 1996). The e¤ects of changes in oil
prices are immediately translated into changes in exchange rates and are very short-lived.
This sheds light on why our out-of-sample forecasts are signi�cant in daily data but not at
monthly or quarterly frequencies.
To further study the link between oil prices and exchange rates, in addition to a simple
regression of exchange rates on oil prices, we consider the asymmetric model by Kilian and
Vigfusson (2009) as well as a threshold model where the oil price has asymmetric e¤ects
on the nominal exchange rate. Both the asymmetric and threshold model do not provide
signi�cantly better forecasts than the simple benchmark model. This result seems to suggest
that, as in Kilian and Vigfusson (2009), asymmetries are not too relevant.
Our empirical results are noteworthy and provide clear evidence of a short-term rela-
tionship between oil prices and exchange rate �uctuations, somewhat parallel to the very
high frequency relationship people have found between unanticipated Federal Reserve in-
terest rate, macroeconomic announcements and exchange rates. For example, Andersen et
al. (2003) have shown that macroeconomic news announcements are associated with jumps
in exchange rates at high frequencies. Faust, Rogers, Wang and Wright (2007) study the
response of the U.S. dollar and the term structure of interest rates to macro news announce-
ments in high frequency data. When comparing our results to theirs, we show that including
oil-prices.html.3Note, however, that the weight of oil on the Canadian commodity price index is between 20 and 25%
(source: IMF), and for Norway it is about 20% (source: Statistics Norway), whereas for Australia it is only
4% (source: RBA statistics).
3

macroeconomic news announcements in addition to oil prices does not improve forecasts of
the Canadian-U.S. dollar exchange rate �uctuations. Our results are also related to Kil-
ian and Vega (2008) and Chaboud, Chernenko and Wright (2008). The former show that
macroeconomic news announcements do not contemporaneously predict oil prices at either
daily or monthly frequencies, whereas we show that oil prices have predictive power for ex-
change rates, especially in out-of-sample �t exercises. The latter examine the high frequency
relationship between macro news announcements and trading volumes in foreign exchange
markets, whereas we focus on the relationship between oil price changes and nominal ex-
change rates in daily data.
Our paper is clearly also related to the literature on using commodity prices/indices
(in particular, oil prices) to predict exchange rates. In particular, in a very recent paper
Chen, Rogo¤ and Rossi (2010) �nd that exchange rates of commodity currencies predict
primary commodity prices both in-sample and out-of-sample; however, the out-of-sample
predictive ability in the reverse direction (namely, the ability of the commodity price index
to predict nominal exchange rates) is not strong at the quarterly frequency that they consider.
Other papers have considered oil prices or more general commodity prices as exchange rate
determinants, but mostly as in-sample explanatory variables for real exchange rates, whereas
in this paper we consider out-of-sample predictive ability for nominal exchange rates. Amano
and Van Norden (1995, 1998a,b), Issa, Lafrance and Murray (2008) and Cayen et al. (2010)
consider the in-sample relationship between real oil prices and the real exchange rate; Chen
and Rogo¤ (2003) consider instead commodity price indices and �nd in-sample empirical
evidence in favor of their explanatory power for real exchange rates4 �see Alquist, Kilian
and Vigfusson (2011) for a review of the literature on forecasting oil prices and Obstfeld
(2002) for a discussion on the correlation between nominal exchange rates and export price
indices.
More generally, our paper is related to the large literature on predicting nominal exchange
4Note that our paper signi�cantly extends the scope of Chen and Rogo¤ (2003) by showing that oil prices
have signi�cant predictive ability in forecasting nominal exchange rates out-of-sample. Chen and Rogo¤
(2003) �nd a stronger in-sample correlation when using a non-energy price index, but their data are not
available at daily frequencies.
4
rates using macroeconomic fundamentals.5 In particular, empirical evidence in favor of the
predictive ability of macroeconomic fundamentals has been found mainly at longer horizons
(see Mark, 1995; Chinn and Meese, 1995; Cheung, Chinn and Pascual, 2005, and Engel,
Mark and West, 2007), although inference procedures have been called into question (see
Kilian, 1999; Berkowitz and Giorgianni, 2001; Rogo¤, 2007; and Rossi, 2005, 2007). There
is, however, some empirical evidence that models with Taylor rule fundamentals may have
some predictive ability (Wang and Wu, 2008, Molodtsova and Papell, 2009; and Molodtsova,
Nikolsko-Rzhevskyy and Papell, 2008). See also Faust, Rogers and Wright (2003), Kilian
and Taylor (2003) and Engel, Mark and West (2007) for additional empirical evidence on
predictive ability at longer horizons. Our paper focuses instead on short-horizon predictive
ability, for which the empirical evidence in favor of the economic models has been more
controversial. In particular, Cheung, Chinn and Pascual (2005) concluded that none of the
fundamentals outperform the random walk and, in particular, found no predictive ability of
traditional macroeconomic models in forecasting the Canadian-U.S. Dollar exchange rate.
We show that oil prices contain valuable information for predicting exchange rates in a
country that is a signi�cant oil exporter when predictive ability is measured by out-of-
sample �t. Short-horizon predictive ability has never been convincingly demonstrated in
the literature, especially with the high statistical signi�cance levels that we are able to �nd.
Our result is rather the opposite of what is commonly found in the literature: we do �nd
predictive ability using daily data, which disappears at longer horizons. Our paper is also
related to Faust, Rogers and Wright (2003), who pointed out that predictive ability is easier
to �nd in real-time data: our paper focuses only on real-time data but uses an economic
fundamental that is very di¤erent from the traditional fundamentals used in their paper
(such as output, prices, money supply and the current account).
The paper is organized as follows. Section 2 describes the data. Section 3 shows our main
5Since the seminal works by Meese and Rogo¤ (1983a,b, 1988), the literature has yet to �nd convincing
empirical evidence that there exist standard macroeconomic fundamentals, such as interest rate di¤erentials
or income di¤erentials, which are reliable predictors for exchange rate �uctuations. See, for example, Mark,
Engel and West (2007), Rogo¤ (2007) and Rogo¤ and Stavrakeva (2008). Predictive ability, when it exists,
is unstable over time (see Rossi, 2006, and Giacomini and Rossi, 2010).
5

empirical results for the contemporaneous oil price model, and Section 4 reports results for
the lagged oil price model. Section 5 extends the analysis to other commodity prices and
currencies, and Section 6 presents the empirical results for more general oil price models that
allow for asymmetries and threshold e¤ects. Section 7 concludes.
2 Data Description
Our study focuses on Canada for three reasons. The �rst is that crude oil represents 21.4
percent of Canada�s total exports over the period 1972Q1-2008Q1. The second is that
Canada has a su¢ ciently long history of a market-based �oating exchange rate. Finally,
Canada is a small open economy whose size in the world oil market is relatively small to
justify the assumption that it is a price-taker in that market. For the latter reason, crude
oil price �uctuations serve as an observable and essentially exogenous terms-of-trade shock
for the Canadian economy.
We use data on Canadian-U.S. dollar nominal exchange rates, oil prices, and Canadian
and U.S. interest rates. The oil price series is the spot price of the West Texas Intermediate
crude oil. West Texas Intermediate (WTI) is a type of crude oil used as a benchmark in oil
pricing and the underlying commodity of the New York Mercantile Exchange�s oil futures
contracts. The Canadian-U.S. dollar nominal exchange rate is from Barclays Bank Inter-
national (BBI). Data at daily, monthly and quarterly frequency are end-of-sample.6 More
precisely, we follow the end-of-sample data convention from Datastream: the monthly ob-
servation is the observation on the �rst day of the month, whereas the quarterly observation
is the observation on the �rst day of the second month of the quarter. It is worthwhile to
recall that, while the previous literature focuses on monthly and quarterly frequencies, our
study switches the focus to daily data and provides a clean comparison of the results for
6Note that we focus on end-of-sample data because we are interested in relating our work to the previous
literature, according to which it is harder to �nd predictive ability using end-of-sample data than using
average-over-the-period data. Since the puzzle in the literature is lack of predictive ability, we do not
consider the latter. Note that our results are therefore a lower bound on the predictive ability one may be
able to �nd.
6

the three frequencies. The data sample ranges from 12/14/1984 to 11/05/2010. The daily
data set contains 6756 observations, the monthly data set 311, and the quarterly data set
104. We acknowledge the availability of quarterly data for the Canadian-U.S. dollar nominal
exchange rate since the early seventies, but we restrict our sample for the sake of comparison
across frequencies.
To construct the daily Canada-U.S. interest rates di¤erential data, we subtract the daily
U.S. short-term interest rate from the daily Canadian short-term rate. The Canadian short-
term interest rate is the daily overnight money market �nancing rate and the U.S. short-term
rate is the daily e¤ective Federal funds rate. The series of the daily Canadian overnight
money market �nancing rate is from the Bank of Canada, whereas the series of the Federal
funds rate is from the Board of Governors of the Federal Reserve System. From the daily
data, we construct the monthly and quarterly series: the monthly observation is the obser-
vation of the �rst day of the month and the quarterly observation is the observation of the
second month of the quarter.
We also extend our analysis to other currencies and commodities. The original series
for the Norwegian krone-U.S., South African rand-U.S. dollar and Australian Dollar-U.S.
dollar nominal exchange rates are from Barclays Bank International (BBI). The series for
the Chilean peso-U.S. dollar exchange rate is from WM Reuters (WMR). Beside the oil
price series described above, we use prices for copper and gold. All commodity prices and
exchange rates series are obtained from Datastream.7
3 Can Oil Prices Forecast Exchange Rate Movements?
In this section, we analyze the relationship between oil prices and exchange rates by eval-
uating whether oil prices have predictive content for future exchange rates. We �rst show
that oil prices have signi�cant predictive content in out-of-sample forecasts in daily data.
The predictive content, however, is much weaker at monthly frequencies and completely
7We also investigate whether our results hold for countries which are large importers of oil, rather than
exporters, by focusing on the Japanese Yen-U.S. Dollar exchange rate. Unreported results show that there
is no predictive ability in that case.
7

disappears at quarterly frequencies.
The �nding that oil prices do forecast nominal exchange rates overturns an important
conventional result in the literature, namely, the fact that nominal exchange rates are un-
predictable. It is therefore crucial to understand the reasons why we �nd predictability.
We will show that: (i) predictability is very short-lived: it appears at daily frequencies but
is much weaker at monthly frequencies and non-existent at quarterly frequencies; (ii) the
predictability at daily frequencies is speci�c to oil prices and does not extend to other tra-
ditional fundamentals such as interest rates; (iii) predictability is extremely reliable, in the
sense that it does not depend on the sample period; (iv) the predictability is not due to a
Dollar e¤ect and it is robust to controlling for macro news shocks; (v) in addition, we ver-
ify that the predictability is present not only out-of-sample but also in-sample. While this
section focuses on the contemporaneous predictive content of oil prices, based on realized
oil prices as predictors in the out-of-sample forecasting exercise, the next section veri�es the
robustness of the results to actual ex-ante predictive content by using lagged oil prices as
predictors.
3.1 Out-of-Sample Predictive Ability with Realized Fundamentals
We �rst assess the out-of-sample predictive ability of oil prices. We focus on the simplest oil
price model:8
�st = �+ ��pt + ut; t = 1; :::; T; (1)
where �st and �pt are the �rst di¤erence of the logarithm of respectively the Canadian-U.S.
dollar exchange rate9 and the oil price, T is the total sample size, and ut is an unforecastable
error term. Notice that the realized right-hand-side variable is used for prediction. In
the forecasting literature such �ex-post� forecasts are made when one is not interested in
ex-ante prediction but in the evaluation of predictive ability of a model given a path for
8Note that one could consider other econometric speci�cations, such as cointegrated models. Note that
the gains of cointegrated models typically are important at lower frequencies; therefore we do not consider
them, being the focus of this paper on high frequency data.9The value of the Canadian/U.S. exchange rate is expressed as the number of Canadian dollars per unit
of U.S. dollars.
8

some un-modelled set of variables � see West (1996).10 It is crucial to note that since
the realized value of the fundamental is used, this is not an actual out-of-sample forecast
exercise, rather an "out-of-sample �t" exercise. Important examples of the use of such
a technique include Meese and Rogo¤ (1983a,b) and Cheung, Chinn and Pascual (2005),
among others. Meese and Rogo¤ (1983a,b, 1988) demonstrated that even using realized
values of the regressors, traditional fundamentals such as interest rates and monetary or
output di¤erentials would have no predictive power for exchange rates. Another example
of the use of such technique is Andersen et al. (2003), who used realized macroeconomic
announcements to predict exchange rates. One of the objectives of this paper is to show
that the use of a di¤erent fundamental, namely, oil prices, can overturn the Meese and
Rogo¤�s (1983a,b) �nding at the daily frequencies, and link our paper to the literature on
macroeconomic news announcements; we therefore use the same forecasting strategy. In a
later section, we will assess the robustness of our results to models with lagged oil prices.
We estimate the parameters of the model with rolling in-sample windows and produce a
sequence of one-step-ahead pseudo out-of-sample forecasts conditional on the realized value of
the commodity prices.11 Let �sft+1 denote the one-step-ahead pseudo out-of-sample forecast:
�sft+1 = b�t + b�t�pt+1; t = R;R + 1; :::; T � 1where b�t; b�t are the parameter estimates obtained from a rolling sample of observations
ft�R + 1; t�R + 2; :::; tg, where R is the in-sample estimation window size. As previously
discussed, the pseudo out-of-sample forecast experiment that we consider utilizes the realized
value of the change in the oil price as a predictor for the change in the exchange rate. The
reason is that it is very di¢ cult to obtain a model to forecast future changes in the oil price,
since they depend on political decisions and unpredictable supply shocks. If we were to use
past values of oil prices in our experiment, and the past values of oil prices were not good
forecasts of future values of oil prices, we would end up rejecting the predictive ability of
oil prices even though the reason for the lack of predictive ability is not the absence of a
relationship between exchange rates and oil prices, but the poor forecasts that lagged price
10This analysis captures correlations, or comovements, since it uses realized fundamentals.11Table A.1 in the Appendix shows that our results are robust to using a recursive forecasting scheme.
9

changes generate for future price changes. To avoid this problem, we condition the forecast
on the realized future changes in oil prices. It is important to note, however, that our exercise
is not a simple in-sample �t exercise: we attempt to �t future exchange rates out-of-sample,
which is a notably di¢ cult enterprise. In this sense, this is an "out-of-sample �t" exercise.
We compare the oil price-based forecasts with those of the random walk, which, to date, is
the toughest benchmark to beat. We consider both a random walk without drift benchmark
as well as a randomwalk with drift benchmark given their importance in the literature: Meese
and Rogo¤ (1983a,b) considered both; in a very important paper, Mark (1995) considered
a random walk with drift benchmark, and found substantial predictive ability at longer
horizons; Kilian (1999) argued that the latter was mainly due to the presence of the drift in
the benchmark. By considering both benchmarks, we are robust to Kilian�s (1999) criticisms.
We implement the Diebold and Mariano (1995) test of equal predictive ability by com-
paring the Mean Squared Forecast Errors (MSFEs) of the oil price model with those of the
two benchmarks. Note that even though our models are nested, we can use the Diebold and
Mariano (1995) test for testing the null hypothesis of equal predictive ability at the estimated
(rather than pseudo-true) parameter values, as demonstrated in Giacomini and White (2006)
and discussed in Giacomini and Rossi (2010). As we show at the end of this section, using
the alternative test by Clark and West (2006) would only strengthen our results in favor of
the economic models.12 Hence, our results can be interpreted as a conservative lower bound
on the evidence of predictive ability that we �nd.
We test the null hypothesis of equal predictive ability with daily, monthly and quarterly
data. Figure 1A depicts the Diebold and Mariano (1995) test statistic for daily data com-
puted with varying in-sample estimation window sizes. The size of the in-sample estimation
window relative to the total sample size is reported on the x-axis.13 When the Diebold and
12Clark and West (2006) test the null hypothesis of equal predictive ability at the pseudo-true parameter
values.13Note that the procedure of reporting the test statistic for several estimation window sizes in our exercise
does not introduce spurious evidence in favor of predictive ability. In fact, the predictive ability is strong for
all window sizes and the results remain strongly signi�cant even if we implemented Inoue and Rossi�s (2012)
test robust to data mining across window sizes.
10

Mariano (1995) statistic is less than -1.96, we conclude that the oil price model forecasts
better than the random walk benchmark. Figure 1 shows that, no matter the size of the in-
sample window, the test strongly favors the model with oil prices. This result holds for both
benchmarks: the random walk without drift (solid line with circles) and with drift (solid
line with diamonds). Overall, we conclude that daily data show extremely robust results in
favor of the predictive ability of the oil price model.14
Our results show striking predictive ability relative to that reported in the literature.
In particular, let�s compare our results with those in Cheung, Chinn and Pascual (2005),
who consider the same model in �rst di¤erences for the Canadian-U.S. Dollar among other
models. In their paper, achieving a MSFE ratio lower than unity is actually considered a
success: they fail to �nd macroeconomic predictors which achieve a MSFE ratio lower than
one, let alone signi�cant at the 5% level, among all the models and currencies they consider,
including the Canadian-U.S. Dollar. So, why are we able to �nd predictive ability? The
following sub-sections explore various explanations to answer this important question.
3.2 Why Are We Able to Find Out-of-Sample Fit?
Our empirical results greatly di¤er from the existing literature in two crucial aspects. First,
we consider an economic fundamental for nominal exchange rates that is very di¤erent from
those commonly considered in the literature, namely, oil prices. Second, we focus on a
di¤erent data frequency, daily rather than monthly or quarterly. Therefore, it is important
to understand whether it is the frequency of the data or the nature of the fundamental that
drives our results.
In a �rst experiment we consider the model with oil prices but at the monthly and
quarterly frequencies. Figure 1B shows Diebold-Mariano�s (1995) test statistics for monthly
and quarterly data, respectively. For quarterly data, we are never able to reject the null
hypothesis of equal predictive ability. For monthly data, we �nd empirical evidence in favor
14Note that the MSFE ratio between the model and the random walk without drift is 0.94 for R=1/2, 0.93
for R=1/3 and 0.91 for R=1/5. Thus, the improvement in forecasting ability is non-negligible in economic
terms. The MSFE of the random walk without drift is 3.2976�10�5 for R=1/2, 2.6626�10�5 for R=1/3 and
2.3396�10�5 for R=1/5.
11

of the model with oil prices, although the signi�cance is much lower than that of daily data.
Since previous research focused only on either monthly or quarterly data, this may explain
why the existing literature never noticed the out-of-sample predictive ability in oil prices.
In a second experiment we consider a model with traditional fundamentals. Traditional
fundamentals include interest rate, output and money di¤erentials (see Meese and Rogo¤,
1983a,b, 1988, and Engel, Mark and West, 2007). Since output and money data are not
available at the daily frequency, we focus on interest rate di¤erentials. That is, we consider
the interest rate model:
�st = �+ ��it + �t (2)
where �it are the �rst di¤erence of the interest rate di¤erential between Canada and the
U.S., and �t is an unforecastable error term.
Figure 2 reports the results. Panel A in Figure 2 shows that the interest rate model never
forecasts better than the random walk benchmark; if anything, the random walk without
drift benchmark is almost signi�cantly better. Panels B and C show that similar results hold
at the monthly and quarterly frequencies.
Since in daily data we do �nd predictive ability when using oil price changes as predictor
but not when using interest rates as predictors, we conclude that the reason why we are able
to �nd predictive ability is the new fundamental that we consider (the oil price) rather than
the frequency of the data.
Frequency vs. Length of the Sample: Which One Matters?
In order to check whether the improved out-of-sample predictive ability at daily frequency
is due to the higher frequency of the data or to the larger number of observations, we make
them comparable by selecting the number of in-sample observations for daily data equal
to the number of in-sample observations for monthly and quarterly data. Table 1 reports
the results. Panel A compares daily and monthly frequencies. The Diebold and Mariano�s
(1995) test statistics against a random walk without drift is highly signi�cant in daily data:
it equals -4.1829, which implies a p-value of zero. For monthly data, instead, the statistic is
-2.5201, with a p-value of 0.011. This means that the evidence in favor of predictive ability
12

is much stronger in daily than in monthly data.15 Panel B compares daily and quarterly
frequencies. The Diebold and Mariano�s (1995) test statistics against a random walk without
drift is still signi�cant in daily data: it equals -2.11, which implies a p-value of 0.03. For
quarterly data, instead, the statistic is -1.79, and it is not signi�cant. This means that the
evidence in favor of predictive ability is present only in daily data and not at the quarterly
frequency.
In summary, even when the number of observations is the same, the daily oil price model
outperforms the monthly and quarterly oil price model out-of-sample. We conclude that the
reason of the forecasting success in daily data is the frequency of the data, rather than the
length of sample.16
Oil Prices And Macro News Announcements
We compare the predictive power of oil prices with that of other predictors which have
been found to be important in explaining exchange rate �uctuations at high frequencies.
Andersen et al. (2003) demonstrate that macroeconomic news announcements do predict
exchange rates at the daily frequency.17 They use the International Money Market Services
real-time database, which contains both expected and realized macroeconomic fundamen-
tals, and de�ne the �macroeconomic news announcement shock�as the di¤erence between
the two. They show, using contemporaneous in-sample regressions in 5-minute data, that
macroeconomic news announcements produce signi�cant jumps in exchange rates. It is nat-
ural to wonder whether oil prices are a better predictor for exchange rate changes than
macroeconomic news announcements.18
15In fact, at the 5% signi�cance level the predictive ability is evident at both frequencies, but at the 1%
level it is evident only in daily data.16Unreported results show that the predictive ability is still signi�cant when predicting daily exchange
rate changes one-month-ahead with realized oil price changes. Thus, our results are also quite robust to
longer forecast horizons. However, predicting monthly exchange rate changes is much more di¢ cult, since
shocks average out over lower frequencies.
Alternatively, one could run Monte Carlo simulations to evaluate the e¤ects of the sample length in small
samples.17We consider daily data and not 5-minutes data due to concerns of micro-structure noise.18Interesting work by Evans and Lyons (2002) has shown that order �ows are a good predictor for exchange
rates. However, as discussed in Andersen et al. (2003), it leaves us ignorant about the macroeconomic
13

To investigate this issue, we consider the following model based on Andersen et al. (2003):
�st = �+ ��pt +
KXk=1
kSk;t + ut; for t = 1; :::; T; (3)
where Sk;t is the k � th macroeconomic news announcement shock announced at time t.
The only di¤erence with Andersen et al. (2003) is that we include oil price changes among
the regressors. We consider the same macroeconomic announcements as in Andersen et
al. (2003), which include the unemployment rate, consumer price index, leading indicators
change in non-farm payrolls and industrial production, among others. We consider a total
of 32 macroeconomic announcements.19 Table 2 reports the performance of the models with
macroeconomic news relative to the random walk without or with drift (labeled "Random
Walk w/o drift" and "Random Walk w/ drift", respectively). We report results for four
window sizes equal to either half, a third, a fourth or a �fth of the total sample size. Panel
A report results for the model with macroeconomic news, eq. (3), whereas panel B report
results for the model with only oil prices, eq. (1). The results show that the model with oil
prices only forecasts better (relative to a random walk) than a model that includes both oil
prices and macroeconomic fundamentals. Unreported results show that the performance of
a model with only macroeconomic news (that is, a model that does not include oil prices)
performs much worse than the model with macroeconomic news and oil prices that we
consider.20 Thus, while it is hard to beat a random walk, the model that includes the oil
price gets closer to the random walk benchmark than the model that does not include it.
determinants of order �ows. In this paper, we focus on macroeconomic determinants of exchange rates, as
in Andersen et al. (2003).19More in detail, the announcements that we consider involve the following: Unemployment Rate, Con-
sumer Price Index, Durable Goods Orders, Housing Starts, Leading Indicators, Trade Balance, Change in
Nonfarm Payrolls, Producer Price Index, Advance Retail Sales, Capacity Utilization, Industrial Production,
Business Inventories, Construction Spending MoM, Consumer Con�dence, Factory Orders, NAPM/ISM
Manufacturing, New Home Sales, Personal Consumption, Personal Income, Monthly Budget Statement,
Consumer Credit, Initial Jobless Claims, GDP Annualized Advanced, GDP Annualized Preliminary, GDP
Annualized Final, CPI Ex Food and Energy month-on-month (MoM), PPI Ex Food and Energy MoM, Aver-
age Hourly Earnings MoM, Retail Sales Less Autos, as well as three measures of the GDP Price Index/GDP
Price De�ator.20Note however that Andersen et al. (2003) use 5-minutes data whereas we use daily data; thus, our
14

Is the Predictive Ability Due to a Dollar E¤ect?
Since the price of oil in international markets is quoted in U.S. Dollars, and our analysis
focuses on the U.S. Dollar-Canadian Dollar exchange rate, one might expect a correlation
due to the common U.S. Dollar denomination. It is important to assess whether the daily
predictive power holds up to a cross-exchange rate that does not involve the U.S. Dollar.21
We collected data on the Canadian Dollar-British Pound exchange rate from WM Reuters.
Our sample, which is limited by data availability, is shorter than the Canadian Dollar-U.S.
Dollar used previously: starts on 9/15/1989 and ends in 9/16/2010. Table 3 reports the
value of the Diebold and Mariano�s (1995) test statistic for various in-sample window sizes,
reported in the column labeled "Window". The table shows that our results are robust,
since the predictive ability is present in daily data even if we use an exchange rate that does
not involve the U.S. Dollar.22
Instabilities in Forecast Performance
The existing literature on the e¤ects of oil price shocks on the economy points to the
existence of instabilities over time �see Mork (1989), Hamilton (1996) and Hooker (1996). In
particular, Mork (1989) found that the behavior of GNP growth is unstable and indeed corre-
lated with the state of the oil market. Hooker (1996) provided sub-sample analyses and also
found empirical evidence of structural instability. In addition, Maier and DePratto (2008)
have noticed in-sample parameter instabilities in the relationship between the Canadian ex-
change rate and commodity prices. Since our focus is on out-of-sample forecasting ability,
in order to evaluate whether potential instabilities may a¤ect the forecast performance of
the oil price model we report the results of the Fluctuation test proposed by Giacomini and
Rossi (2010). The latter suggests to report rolling averages of (standardized) MSFE di¤er-
ences over time to assess whether the predictive ability changes over time. The in-sample
estimation window is one-half of the total sample size and the out-of-sample period equals
results should not be interpreted as invalidating theirs, but only indicating that, at the daily frequency, the
predictability of oil prices remains after controlling for "news".21We thank M. Chinn for raising this issue.22The predictive ability, however, depends on the window size, and seems to disappears for window sizes
that are very small; this might be due to the fact that the sample of data for the Canadian Dollar/British
Pound is shorter.
15
�ve hundred days. Panel A in Figure 3 shows the Fluctuation test for daily data. The �gure
plots the relative performance (measured by Diebold and Mariano�s (1995) statistics) for
the oil price model (eq. 1) against the random walk without drift (solid line with circles)
and with drift (solid line with diamonds), together with the 5% critical values (solid lines).
Since the values of the statistic are below the (negative) critical value, we reject the null
hypothesis of equal predictive ability at each point in time and conclude that the oil price
model forecasts better in some periods. Visual inspection of the graph suggests that the
oil price model performs signi�cantly better than the random walk after 2005. Panels B
and C in Figure 3 show the results of the Fluctuation test for monthly and quarterly data.
For monthly and quarterly data, the in-sample window size is the same as in daily data
and equals one-half of the total sample, whereas the out-of-sample window is chosen to be
the same across frequencies. At the monthly and quarterly frequencies we do not detect
signi�cant predictive ability improvements of the oil price model over the random walk.
In-sample Fit and Clark and West�s (2006) Out-of-Sample Test Analysis
To assess whether the out-of-sample �t is related to the in-sample �t of the models, we
estimate the oil price model, eq. (1), over the entire sample period with daily, monthly
and quarterly data. Panel A in Table 4 shows empirical results. The constant � is never
statistically signi�cant. The coe¢ cient on the growth rate of the oil price �, instead, is
statistically signi�cant at any standard level of signi�cance, and for all frequencies. The
in-sample �t of the model (measured by the R2) improves when considering quarterly data
relative to monthly and, especially, daily data. Comparing these results with those in the
previous section, interestingly, it is clear that the superior in-sample �t at monthly, and
especially quarterly, frequencies does not translate into superior out-of-sample forecasting
performance.23 The main conclusion that we can draw from the in-sample analysis is that
the frequency of the data does not matter for in-sample analysis, at least when we evaluate
the oil price model over the full sample.
Finally, we investigate the robustness of our results using the Clark and West�s (2006)
test statistic. Results are reported in Panel A in Table 5. It is clear that our results are
23Panel B in Table 1 reports in-sample estimates of the interest rate model, eq. (2). The coe¢ cient on
the interest rate is never signi�cant at any of the frequencies.
16

extremely robust to the use of this alternative test statistic, which �nds even more predictive
ability than the Diebold and Mariano�s (2005) test.
The Importance of Timing
Our results have shown that there is a strong and signi�cant contemporaneous relation-
ship between oil prices and exchange rates which disappears when considering monthly or
quarterly data. The reason why such relationship is much weaker at low frequencies is be-
cause when there are oil price shocks, typically exchange rates react very quickly, and it is
therefore essential that the researcher focuses on daily frequencies (or high frequencies) to
capture the relationship. If instead the researcher focuses on monthly or quarterly data,
spikes in oil prices and exchange rates would be much harder to identify in the data, as they
would be washed out in small samples.
We implemented a small Monte Carlo example where oil price spikes are generated ran-
domly according to a Poisson distribution with expectation �; they are therefore rare events:
in a sample of 6000 days with � = 0:05; an oil price spike happens approximately 300 times
in daily data; a spike is also observed about 10 times in monthly data at some point during
the month; however, the number of times a spike is observed in monthly data is much smaller
conditional on sampling at a speci�c day of the month, e.g. the last day of the month. We
generate exchange rate data equal to the poisson process plus a random standard normal
distribution. Thus, there is predictive ability in the actual data we create, although it is rare.
When � = 0:05; across 1000 simulations, the percentage of times a researcher would be able
to identify predictive ability using the Diebold and Mariano (1995) test based on daily data
is 100%, whereas the percentage is only 10% in end of sample monthly data. When � = 0:02;
the percentage of times a researcher would be able to identify predictive ability based on
daily data is 97%, whereas the percentage becomes 2% in end of sample monthly data. This
example shows that a researcher would �nd much less predictive ability in monthly than in
daily data, even if the predictability is there.
17

4 Can Lagged Oil Prices Forecast Exchange Rates?
The previous section focused on regressions where the realized value of oil price changes
are used to predict exchange rates contemporaneously. In reality, forecasters would not
have access to realized values of oil price changes when predicting future exchange rates.
So, while the results in the previous section are important to establish the existence of a
stronger link between oil prices and exchange rates in daily data (relative to monthly and
quarterly data), they would not be useful for practical forecasting purposes. In this section,
we consider a stricter test by studying whether lagged (rather than contemporaneous) oil
price changes have predictive content for future exchange rates. We �rst show that the
predictive ability now depends on the estimation window size being more favorable to the
model with lagged oil prices, but only for large in-sample estimation window sizes. We also
�nd that the predictive ability is now more ephemeral, pointing to strong empirical evidence
of time variation in the relative performance of the model with lagged oil prices relative to
the random walk benchmark. However, once that time variation is taken into account, we
can claim that the model with lagged oil prices forecasts signi�cantly better than the random
walk benchmark at the daily frequency. On the other hand, the same model at the monthly
and quarterly frequencies never forecasts signi�cantly better than the random walk. Also,
using lagged interest rates never improves the forecasting ability relative to the random walk
(with or without drift). The empirical evidence in favor of the model with lagged daily oil
prices clearly demonstrates that it is important not only to consider daily frequencies but
also to allow for the possibility that the relative forecasting performance of the models is
time varying, as the predictive ability is very transitory.
We focus on the following model with lagged oil prices:
�st = �+ ��pt�1 + ut; t = 1; :::; T; (4)
where �st and �pt, which are the �rst di¤erence of the logarithm, denote the Canadian-U.S.
dollar exchange rate and the oil price, respectively; T is the total sample size; and ut is an
unforecastable error term. Notice that the lagged value of the right-hand-side variable is
used for prediction in eq. (4), whereas the realized value of the explanatory variable was
18

used in eq. (1). We estimate the parameters of the model with rolling in-sample windows
and produce a sequence of 1-step ahead pseudo out-of-sample forecasts conditional on the
lagged value of commodity prices. Let�sft+1 denote the one-step ahead pseudo out-of-sample
forecast: �sft+1 = b�t+ b�t�pt; t = R;R+1; :::; T �1where b�t; b�t are the parameter estimatesobtained from a rolling sample of observations ft�R + 1; t�R + 2; :::; tg, where R is the
in-sample estimation window size. As before, we compare the oil price-based forecasts with
those of the random walk by using Diebold and Mariano�s (1995) test. Panel A in Figure
4 reports Diebold and Mariano�s (1995) test statistic for daily data computed with varying
in-sample estimation windows. The size of the in-sample estimation window relative to the
total sample size is reported on the x-axis. Clearly, predictability depends on the estimation
window size. Diebold and Mariano�s (1995) statistic is negative for large in-sample window
sizes, for which model (4) forecasts better than both the random walk, with and without
drift; however, the opposite happens for small in-sample window sizes. Since the Diebold and
Mariano (1995) statistic is never less than -1.96, we conclude that the oil price model never
forecasts signi�cantly better than the random walk benchmark on average over the out-of-
sample forecast period.24 Panel B in Figure 4 reports forecast comparisons for the same
model, eq. (4), at the monthly and quarterly frequencies. The model estimated at monthly
and quarterly frequencies forecasts worse than the one estimated in daily data. Again, the
model with monthly data does show some predictive ability for the largest window sizes,
although it is not statistically signi�cant, whereas the quarterly data model never beats the
random walk.
However, Figures 5 and 6 demonstrate that, once we allow the relative performance of the
models to be time-varying, the most interesting empirical results appear. Figure 5 reports
results based on the Fluctuation test using Diebold and Mariano�s (1995) statistic, either
with a random walk without drift benchmark (lines with circles) or with drift (lines with
triangles). Figure 6 reports results based on the Fluctuation test implemented with both
the Clark and West�s (2006) and Diebold and Mariano�s (1995) statistics (dashed-dot and
24Note that the MSFE ratio between the model and the random walk without drift is 0.99 for most window
sizes.
19

�+�lines, respectively).25 In particular, Panel A in Figures 5 and 6 report the Fluctuation
test in daily data. It is clear that there is strong signi�cant evidence in favor of the model
with lagged prices, especially with the Clark and West (2006) test, around 2007, against the
random walk without drift. Panels B and C show, instead, that there was never statistically
signi�cant empirical evidence in favor of the model for monthly and quarterly data (in
particular, against the toughest benchmark, the driftless random walk).
Note that the predictive ability again disappears if we use other economic fundamentals,
such as interest rates di¤erentials. Figure 7 reports the same analysis for the model with
lagged interest rate di¤erentials:
�st = �+ ��it�1 + "t: (5)
Clearly, in this case, the model�s forecasts never beat the random walk�s forecasts, no matter
what the estimation window size is.
Finally, Panel B in Table 5 demonstrates the robustness of our results using the Clark
and West�s (2006) test statistic. It is clear that our results are extremely robust to the use
of this alternative test statistic, which even �nds statistically signi�cant predictive ability
for large window sizes for the daily model.
5 Other Commodity Prices and Exchange Rates
In this section, we show that our results are not con�ned to the case of the Canadian-U.S.
dollar exchange rate and oil prices. We consider the predictive ability of exchange rates of
other exporting countries vis-a-vis the U.S. dollar for a few additional commodity prices.
In particular, we consider: (a) the price of copper (in U.S. dollars) and the Chilean peso-
U.S. dollar exchange rate; (b) the gold price (in U.S. dollars) and the South African rand-
U.S. dollar exchange rate; (c) the oil price and the Norwegian krone-U.S. dollar exchange
rate; and (d) the oil price and the Australian-U.S. Dollar exchange rate. The sample we
25Note that in Figure 3 the Fluctuation test was implemented using Diebold and Mariano�s (1995) statistic,
and that the Fluctuation test with Clark and West�s (2006) statistic would only �nd even stronger evidence
in favor of predictive ability.
20
consider is from 1/3/1994 to 9/16/2010 and the data are from Datastream. We will show
that in the Norwegian krone and the South African rand case, oil prices and gold prices,
respectively, statistically improve forecasts of exchange rates no matter if the oil price is a
contemporaneous regressor or a lagged regressor when we allow for time variation in the
relative forecasting performance of the models. The predictive ability is present only for the
contemporaneous regression model for the other countries/commodity prices.
Figure 8 shows the empirical results for forecasting the Norwegian krone-U.S. dollar ex-
change rate using oil prices. In this case, the data show a clear forecasting improvement
over a random walk both in the model with contemporaneous regressors (eq. 1) at daily
frequencies (see Panel I) as well as in monthly data (see Panel II), no matter which window
size is used for estimation. The forecasting improvement is statistically signi�cant in both
cases, although the predictive ability again becomes statistically insigni�cant at quarterly
frequencies. The Appendix shows that the predictive ability disappears in the model with
lagged fundamentals (eq. 4) under the assumption that the relative performance of the
models is constant over the entire out-of-sample span of the data. However, when allow-
ing the models� forecasting performance to change over time (Panel III), the model with
lagged regressors does forecast signi�cantly better than the random walk benchmark. Note
that the performance of the lagged regressor model in monthly and quarterly frequencies is
never signi�cantly better than the random walk benchmark even if we allow the forecasting
performance to change over time (Panels B and C in Figure 8, III).
Figure 9 shows that similar results hold when considering the South African rand ex-
change rate and gold prices. Panel I shows that the predictive ability of contemporaneous
gold prices is statistically signi�cant in daily data, despite whether the benchmark model
is a random walk with or without drift, and no matter which in-sample window size the
researcher chooses. In monthly and quarterly data, instead, Panel II demonstrates that
�uctuations in gold prices never improve the predictive ability over a random walk model.
Interestingly, again, unreported results show that the model with lagged data never performs
better than the random walk when we do not allow for time variation, regardless of the fre-
quency of the data. However, when we allow for time variation (Panel III), it is clear that
21

the model beats the driftless random walk (although it does not beat the random walk with
drift) in daily data (Panel A); there is some evidence that the model also beats the driftless
random walk at the quarterly frequency, but not at the monthly frequency (Panels B,C).
Figure 10(I), shows that the price of copper has a clear advantage for predicting the
Chilean peso-U.S. dollar exchange rate in the model with contemporaneous regressors at
daily frequencies relative to the random walk model (with or without drift), and it is strongly
statistically signi�cant. Figure 10(II), demonstrates that such predictive ability becomes sta-
tistically insigni�cant when considering end-of-sample monthly and quarterly data. However,
the forecasting performance disappears in the lagged regressor model even if we allow for
time variation in the forecasting performance (Panel III). Results are very similar when
considering predicting the Australian-U.S. dollar and oil prices �see Figure 11.26
6 Non-Linear Models
The recent debate on whether oil price changes have asymmetric e¤ects on the economy
motivates us to consider such models in our forecasting experiment. Hamilton (2003) found
signi�cant asymmetries of oil price changes on output. In a comprehensive study, Kilian
and Vigfusson (2009) found no evidence against the null of symmetric response functions in
U.S. real GDP data. Additional results in Kilian and Vigfusson (2011) (based on a longer
data set) showed some empirical evidence of asymmetries in the response of real GDP to
very large shocks, but none in response to shocks of normal magnitude. Thus, most of the
times the linear symmetric model provides a good enough approximation. Herrera, Lagalo
and Wada (2010) discuss similar �ndings for U.S. aggregate industrial production. However,
they found stronger evidence of asymmetric responses at the sectoral level than in aggregate
data. Clearly, the presence (or absence) of asymmetries depends on the sample. In this
section, we evaluate whether it is possible to improve upon the simple oil price model by
using non-linear models that account for the asymmetric e¤ects of oil prices. We focus on
predicting exchange rates using realized oil prices. The reason is as follows: if we do not �nd
26We also considered predicting the Australian/U.S. Dollar using gold prices, and the results were similar.
22

predictive ability even for contemporaneous fundamentals, which is the easiest case to �nd
predictability, we will not �nd predictive ability with lagged fundamentals either.
The model with asymmetries follows Kilian and Vigfusson (2009). We consider a model
where the exchange rate response is asymmetric in oil price increases and decreases:
�st = �+ + �+�pt + +�p+t + ut (6)
where �p+t =
8<: �pt if �pt > 0
0 otherwise.Our goal is to compare the forecasting ability of the model
with asymmetries (6) with the linear model in eq. (1).27
In addition, we also consider a threshold model in which �large� changes in oil prices
have additional predictive power for the nominal exchange rate:
�st = �q + �q�pt + q�pqt + ut (7)
where �pqt equals �pt if �pt > 80th quantile of �pt or< 20th quantile of �pt; and equals 0
otherwise; the quantiles of �pt are calculated over the full sample.28
We focus again on the representative case of the Canadian-U.S. dollar exchange rate and
oil prices. To preview our �ndings, the empirical evidence shows that, although both the
model with asymmetries and the model with threshold e¤ects are not rejected in-sample,
their forecasting ability is worse than that of the linear model, eq. (1). We focus on the
model with contemporaneous regressors; the Appendix shows that the same results hold
when using lagged non-linear explanatory variables. Figure 12, Panel A, reports the results
for the asymmetric model and the threshold model for daily data. Both �gures show the test
statistic for testing the di¤erence in the MSFEs of either model (6) or model (7) versus the
MSFE of the linear model, eq. (1). The �gure reports the test statistics calculated using a
27See also Kilian (2008a,b) for analyses of the e¤ects of oil price shocks on typical macroeconomic ag-
gregates, such as GDP, and Bernanke, Gertler and Watson (1997), Hamilton and Herrera (2004), Herrera
(2008) and Herrera and Pesavento (2009) on the relationship between oil prices, inventories and monetary
policy.28We calculate the thresholds over the full sample to improve their estimates. While this gives an unfair
advantage to the threshold models at beating the simple model, we still �nd that, even with the best estimate
of the threshold, the model does not beat the simple linear model, eq. (1).
23

variety of sizes for the in-sample estimation window, whose size relative to the total sample
size is reported on the x-axis. Negative values in the plot indicate that the linear model, eq.
(1), is better than the competitors. Panel B in Figure 12 reports results for monthly and
quarterly data.
In general the simple oil price model outperforms the asymmetric model. Regarding the
threshold model, the evidence is not clear cut. The threshold model is statistically better
than the simple oil price model when the in-sample window size is large, whereas the result
is the opposite when it is small. Figure 12 shows that for monthly and quarterly data the
non-linear models are never statistically better than the simple linear model, and the linear
model is signi�cantly better than the non-linear models for some window sizes.29
7 Conclusions
Our empirical results suggest that oil prices can predict the Canadian-U.S. dollar nominal
exchange rate at a daily frequency, in the sense of having a stable out-of-sample relationship.
However, the predictive ability is not evident at quarterly and monthly frequencies. When
using contemporaneous realized daily oil prices to predict exchange rates, the predictive
power of oil prices is robust to the choice of the in-sample window size, and it does not
depend on the sample period under consideration. When using the lagged oil prices to predict
exchange rates, the predictive ability is more ephemeral and shows up only in daily data after
allowing the relative forecasting performance of the oil price model and the random walk to
be time-varying. Both the out-of-sample and in-sample analyses suggest that the frequency
of the data is important to detect the predictive ability of oil prices, as the out-of-sample
predictive ability breaks down when considering monthly and quarterly data. Following
Kilian and Vigfusson (2009), we also consider two models aimed at modeling potentially
important non-linearities in the oil price-exchange rate relationship. We �nd that non-
29To evaluate whether forecast instabilities are important, we also implemented Fluctuation tests. The
Appendix reports the results of the Fluctuation test for both the asymmetric and threshold models at all
frequencies. The �gures show that the asymmetric and threshold models are never statistically better than
the linear oil price model at any point in time.
24

linearities do not signi�cantly improve upon the simple linear oil price model.
Our results suggest that the most likely explanations for why the existing literature
has been unable to �nd evidence of predictive power in oil prices are that researchers have
focused on low frequencies where the short-lived e¤ects of oil prices wash away and that the
predictive ability in oil prices is very transitory. At the same time, our results also raise
interesting questions. For example, does the Canadian-U.S. dollar exchange rate respond to
demand or supply shocks to oil prices? It would be interesting to investigate this question by
following the approach in Kilian (2009). However, Kilian�s (2009) decomposition requires a
measure of aggregate demand shock, which is not available at the daily frequency. It would
also be interesting to consider predictive ability at various horizons by adjusting the current
exchange rate for recent changes in oil price over a longer period (e.g. a week). We leave
these issues for future research.
25

References
Alquist, R., L. Kilian and R.J. Vigfusson (2011), �Forecasting the Price of Oil,� in: G.
Elliott and A. Timmermann, Handbook of Economic Forecasting Vol. 2, Elsevier.
Amano, R. and S. van Norden (1995), �Oil Prices and the Rise and Fall of the U.S. Real
Exchange Rate,�International Finance.
Amano, R. and S. Van Norden (1998a), �Exchange Rates and Oil Prices,�Review of
International Economics.
Amano, R. and S. Van Norden (1998b), �Oil Prices and the Rise and Fall of the U.S.
Real Exchange Rate,�Journal of International Money and Finance.
Andersen, T., Bollerslev, T., Diebold, F.X. and Vega, C. (2003), �Micro E¤ects of Macro
Announcements: Real-Time Price Discovery in Foreign Exchange,� American Economic
Review 93, 38-62.
Backus, D.K. and M.J. Crucini (2000), �Oil Prices and the Terms of Trade,�Journal of
International Economics 50(1), 185-213.
Berkowitz, J. and L. Giorgianni (2001), �Long-horizon Exchange Rate Predictability?,�
Review of Economics and Statistics 83, 81�91.
Bernanke, B.S., M. Gertler, and M. Watson (1997), �Systematic Monetary Policy and
the E¤ects of Oil Price Shocks,�Brookings Papers on Economic Activity 1, 91-142.
Cayen, J.P., D. Coletti, R. Lalonde and P. Maier (2010), �What Drives Exchange Rates?
New Evidence from a Panel of U.S. Dollar Exchange Rates,�Bank of Canada W.P. 2010-5.
Chaboud, A., S. Chernenko and J. Wright (2008), "Trading Activity and Macroeconomic
Announcements in High-Frequency Exchange Rate Data", Journal of the European Economic
Association 6, 589-596.
Chen,Y. and K.S. Rogo¤ (2003), �Commodity Currencies,�Journal of International Eco-
nomics 60, 133-169.
Chen,Y., K.S. Rogo¤ and B. Rossi (2010), �Can Exchange Rates Forecast Commodity
Prices?,�Quarterly Journal of Economics, forthcoming.
Chinn, M.D., and R.A. Meese, (1995), �Banking on Currency Forecasts: How Predictable
Is Change in Money?,�Journal of International Economics 38, 161�178.
26

Cheung, Y.W., M.D. Chinn, and A.G. Pascual (2005), �Empirical Exchange Rate Models
of the Nineties: Are Any Fit to Survive?,�Journal of International Money and Finance 24,
1150-1175.
Clark, T., and K. D. West (2006), �Using Out-of-sample Mean Squared Prediction Errors
to Test the Martingale Di¤erence Hypothesis,�Journal of Econometrics 135, 155-186.
Diebold, F.X., and R. Mariano (1995), �Comparing Predictive Accuracy,� Journal of
Business and Economic Statistics 13, 253-263.
Engel, C., N. Mark and K.D. West (2007), �Exchange Rate Models Are Not as Bad as You
Think,� in: NBER Macroeconomics Annual, D. Acemoglu, K.S. Rogo¤ and M. Woodford,
eds., Cambridge, MA: MIT Press.
Faust, J., J.H. Rogers and J.H. Wright (2003), �Exchange Rate Forecasting: The Errors
We�ve Really Made,�Journal of International Economics 60(1), 35-59.
Faust, J., J.H. Rogers, S-Y.B. Wang and J.H. Wright (2007), �The High-Frequency
Response of Exchange Rates and Interest Rates to Macroeconomic Announcements,�Journal
of Monetary Economics 54, 1051-1068.
Giacomini, R. and H. White (2006), �Tests of Conditional Predictive Ability,�Econo-
metrica 74(6), 1545-1578.
Giacomini, R. and B. Rossi (2010), �Forecast Comparisons in Unstable Environments,�
Journal of Applied Econometrics 25(4), 595-620.
Hamilton, J. D. (1996), "This is What Happened to the Oil Price-Macroeconomy Rela-
tionship," Journal of Monetary Economics 38(2), 215-220.
Hamilton, J.D. (2003), �What Is an Oil Shock?�Journal of Econometrics 113, 363-398.
Hamilton, J.D., and A.M. Herrera (2004), "Oil Shocks and Aggregate Macroeconomic
Behavior: The Role of Monetary Policy: Comment," Journal of Money, Credit and Banking
36(2), 265-86.
Herrera, A.M. (2008), �Oil Price Shocks, Inventories, and Macroeconomic Dynamics,�
mimeo, Department of Economics, Michigan State U.
Herrera, A.M., L.G. Lagalo and T. Wada (2010), �Oil Price Shocks and Industrial Pro-
duction: Is the Relationship Linear?,�mimeo, Wayne State U.
27

Herrera, A.M. and E. Pesavento (2007), �Oil Price Shocks, Systematic Monetary Policy
and the �Great Moderation�,�Macroeconomic Dynamics.
Hooker, M.A. (1996), �What Happened to the Oil Price-Macroeconomy Relationship?�
Journal of Monetary Economics 38, 195-213.
Inoue, A. and B. Rossi (2012), �Out-of-sample Forecast Tests Robust to the Window
Size Choice�, Journal of Business and Economics Statistics 30(3), 432-453
Issa, R., R. Lafrance and J. Murray (2008), �The Turning Black Tide: Energy Prices
and the Canadian Dollar,�Canadian Journal of Economics 41(3), 737-759.
Kilian, L. (1999), �Exchange Rates and Monetary Fundamentals: What Do We Learn
From Long-Horizon Regressions?,�Journal of Applied Econometrics 14, 491�510.
Kilian, L. (2008a), �The Economic E¤ects of Energy Price Shocks,�Journal of Economic
Literature 46, 871-909.
Kilian, L. (2008b), �Exogenous Oil Supply Shocks: How Big Are They and How Much
Do they Matter for the U.S. Economy?�Review of Economics and Statistics 90, 216-240.
Kilian, L. (2009), �Not All Oil Price Shocks Are Alike: Disentangling Demand and Supply
Shocks in the Crude Oil Market,�American Economic Review 99(3), 1053-1069.
Kilian, L. and C. Vega (2008), �Do Energy Prices Respond to U.S. Macroeconomic
News? A Test of the Hypothesis of Predetermined Energy Prices,�Review of Economics
and Statistics, forthcoming.
Kilian, L. and M.P. Taylor (2003), �Why is it so Di¢ cult to Beat the Random Walk
Forecast of Exchange Rates?,�Journal of International Economics, 60(1), 85-107.
Kilian, L. and R. Vigfusson (2009), �Are the Responses of the U.S. Economy Asymmetric
in Energy Price Increases and Decreases?,�Quantitative Economics, forthcoming.
Kilian, L. and R. Vigfusson (2011), �Nonlinearities in the Oil Price-Output Relationship,�
Macroeconomic Dynamics, forthcoming.
Maier, P. and B. DePratto (2008), �The Canadian Dollar and Commodity Prices: Has
the Relationship Changed over Time?,�Bank of Canada Discussion Papers 08-15,.
Mark, N.C. (1995), �Exchange Rates and Fundamentals: Evidence on Long-Horizon
Prediction,�American Economic Review 85, 201�218.
28

Meese, R. and K.S. Rogo¤ (1983a), �Exchange Rate Models of the Seventies. Do They
Fit Out of Sample?,�Journal of International Economics 14, 3-24.
Meese, R. and K.S. Rogo¤ (1983b), �The Out of Sample Failure of Empirical Exchange
Rate Models,�in: Exchange Rates and International Macroeconomics, J. Frankel, ed., Uni-
versity of Chicago Press.
Meese, R. and K.S. Rogo¤(1988), �Was it Real? The Exchange Rate-Interest Di¤erential
Relation Over the Modern Floating Rate Period,�Journal of Finance 43, 923-948.
Molodtsova, T. and D.H. Papell (2009), �Out-of-sample Exchange Rate Predictability
with Taylor Rule Fundamentals,�Journal of International Economics 77(2) 167-180.
Molodtsova, T., A. Nikolsko-Rzhevskyy and D.H. Papell (2008), �Taylor Rules With
Real-time Data: A Tale of Two Countries and One Exchange Rate,�Journal of Monetary
Economics 55, S63-S79.
Mork, K.A. (1989), �Oil and the Macroeconomy. When Prices Go Up and Down: An
Extension of Hamilton�s Results,�Journal of Political Economy 97, 740-744.
Obstfeld, M. (2002), �Exchange Rates and Adjustment: Perspectives from the New Open-
Economy Macroeconomics,�Monetary and Economic Studies, 23-46.
Obstfeld, M., and K.S. Rogo¤ (1996), Foundations of International Macroeconomics,
MIT Press.
Rogo¤, K.S. (2007), �Comment to: Exchange Rate Models Are Not as Bad as You
Think,� in: NBER Macroeconomics Annual, D. Acemoglu, K.S. Rogo¤ and M. Woodford,
eds., Cambridge, MA: MIT Press.
Rogo¤, K.S. and V. Stavrakeva (2008), �The Continuing Puzzle of Short-Horizon Ex-
change Rate Forecasting," NBER W.P. 14071.
Rossi, B. (2005), �Testing Long-Horizon Predictive Ability with High Persistence, and
the Meese-Rogo¤ Puzzle,�International Economic Review 46(1), 61-92.
Rossi, B. (2006), �Are Exchange Rates Really Random Walks,�Macroeconomic Dynam-
ics 10(1), 20-38.
Rossi, B. (2007), �Comment to: Exchange Rate Models Are Not as Bad as You Think,�
in: NBER Macroeconomics Annual, D. Acemoglu, K.S. Rogo¤ and M. Woodford, eds., MIT
29

Press.
Wang, J. and J. Wu (2008), �The Taylor Rule and Forecast Intervals for Exchange Rates,�
Federal Reserve Bank of Dallas W.P. 22.
West, K.D. (1996), �Asymptotic Inference about Predictive Ability,�Econometrica 64,
1067-1084.
30

Figures and Tables
Table 1. Frequency Versus Number of Observations
RW w/o drift RW w/ drift
Panel A. Comparing Daily and Monthly Data
Daily Data -4.1829 -4.3710
(0.0000) (0.0000)
Monthly Data -2.5201 -2.6630
(0.011) (0.007)
Panel B. Comparing Daily and Quarterly Data
Daily Data -2.1160 -2.7254
(0.0343) (0.0064)
Quarterly Data -1.7967 -1.8654
(0.0724) (0.0621)
Notes. The table reports the Diebold and Mariano�s (1995) test statistics (with p-values in
parentheses) calculated with a similar number of observations in both daily and monthly data
(Panel A), and in daily and quarterly data (Panel B). The benchmarks are the random walk
without drift (column labeled "RW w/o drift") and the random walk with drift (column labeled
"RW w drift"). The critical value of the statistic is -1.96.
Table 2. Macroeconomic News Versus Oil Prices
Window Size: 1/2 1/3 1/4 1/5
Panel A. Model with Macroeconomic News and Oil Prices, eq. (3)
Random Walk w/o drift -2.6283 -2.2467 -2.0037 -1.6407
Random Walk w/ drift -2.6975 -2.3084 -2.0311 -1.6829
Panel B. Model with Oil Prices only, eq. (1)
Random Walk w/o drift -3.9819 -3.3144 -3.1826 -2.9482
Random Walk w/ drift -4.0661 -3.3882 -3.2154 -2.9930
Notes. The table reports the MSFE of the models with macroeconomic news relative to the
MSFE of a random walk without or with drift (labeled "Random Walk w/o drift" and "Random
31

Walk w/ drift", respectively). Panel A report results for the model with macroeconomic news and
oil prices, eq. (3), whereas panel B report results for the model with only oil prices, whereas Panel
B reports results for the model with oil price only, eq. (1). We report results for four window sizes
equal to either half, a third, a fourth or a �fth of the total sample size.
Table 3. Oil Prices and the Canadian Dollar-British Pound
Window Size: RW w/o drift RW w/ drift
1/2 -2.326 (0.020) -2.304 (0.021)
1/3 -2.141 (0.032) -2.191 (0.028)
Notes. The table reports the Diebold and Mariano�s (1995) test statistic (and p-values in
parenthesis) for model (1) for various values of the window size as a fraction of the total sample
size (labeled "Window"), where the exchange rate is the Canadian dollar- British pound.
Table 4. Estimates of the Basic Linear Model with Oil Prices
Daily Monthly Quarterly
Panel A. Model With Oil Prices
R2 0.03 0.09 0.21
� -0.000 (-0.69) -0.000 (-0.59) -0.002 (-0.552)
� -0.03 (-7.14) -0.059 (-3.18) -0.085 (-2.95)
Panel B. Model With Interest Rates
R2 0.00001 0.0014 0.0008
� -0.00001 (-0.25) -0.0007 (-0.36) -0.0007 (-0.13)
� 0.00002 (0.09) 0.0004 (0.54) -0.0004 (-0.25)
Notes to the Table. The model in Panel A is eq. (1) and the model in Panel B is eq. (2); HAC
robust t�statistics reported in parentheses.30
30The HAC robust variance estimate was obtained by Newey and West�s (1987) HAC procedure with a
bandwidth equal to 4( T100 )1=4.
32

Table 5: Clark and West�s (2006) Test Statistic
A. Contemporaneous Oil P. Model B. Lagged Oil P. Model
Data Frequency Daily Monthly Quarterly Daily Monthly Quarterly
Window Size: P-value P-value P-value P-value P-value P-value
1/2 0.000 0.008 0.034 0.096 0.280 0.606
1/3 0.000 0.005 0.024 0.064 0.241 0.271
1/4 0.000 0.009 0.021 0.121 0.332 0.417
1/5 0.000 0.009 0.031 0.158 0.140 0.232
1/6 0.000 0.008 0.037 0.148 0.164 0.170
1/7 0.000 0.011 0.026 0.165 0.250 0.143
1/8 0.000 0.009 0.021 0.304 0.168 0.179
1/9 0.000 0.007 0.027 0.310 0.163 0.161
1/10 0.000 0.007 0.028 0.304 0.167 0.085
Notes to the Table. The table reports results based on Clark and West�s (2006) test statistic
for the Canadian/US Dollar exchange rate data and oil prices. Panel I reports results for the
Contemporaneous Oil Price Model, eq. (1), whereas Panel II reports results for the Lagged Oil
Price Model, eq. (4).
33

Figure 1A. Oil Price Model. Forecasting Ability in Daily Data
Figure 1B. Oil Price Model. Forecasting Ability in Monthly and Quarterly Data
Notes. Figure 1 plots Diebold and Mariano�s (1995) test statistic for comparing Model (1) to a
random walk without drift (circles) and with drift (diamonds) in daily data, calculated for several
in-sample window sizes (x-axis). Figure 2 similarly compares Model (1) to a random walk without
drift (circles for monthly and squares for quarterly data) and with drift (diamonds for monthly and
stars for quarterly data). Negative values indicate that Model (1) forecasts better. When the test
statistic is below the continuous line Model (1) forecasts signi�cantly better.
34

Figure 2. The Interest Rate Model.
Notes to the Figure. The �gure reports Diebold and Mariano�s (1995) test statistic for compar-
ing forecasts of Model (2) relative to a random walk without drift benchmark (line with circles) as
well as relative to the random walk with drift benchmark (line with diamonds) calculated for sev-
eral in-sample window sizes (x-axis). Negative values indicate that Model (2) forecasts better. The
continuous line indicates the critical value of Diebold and Mariano�s (1995) test statistic: When
the estimated test statistics are below this line, Model (2) forecasts signi�cantly better than its
benchmark.
35

Figure 3. Fluctuation Test For the Oil Price Model
Notes to the Figure. The �gure reports Giacomini and Rossi�s (2010) Fluctuation test statistic
for comparing forecasts of Model (1) relative to a random walk without drift benchmark (line with
circles) as well as relative to the random walk with drift benchmark (line with triangles). Negative
values indicate that Model (1) forecasts better. The continuous line indicates the critical value of
the Fluctuation test statistic: If the estimated test statistic is below this line, Model (1) forecasts
signi�cantly better than its benchmark.
36

Figure 4. Lagged Oil Price Model. Panel A. Forecasting Ability in Daily Data
Panel B. Forecasting Ability in Monthly and Quarterly Data
37

Figure 5. Fluctuation Test For the Lagged Oil Price Model
Figure 6. Fluctuation-CW Test For the Lagged Oil Price Model
Sep00 Sep02 Sep04 Oct06 Oct08 Nov 104
2
0
2
4Panel A: Fluctuation Test Daily Data
Rol
ling
Sta
tistic DM
CW
May 00 May 02 Jun04 Aug06 Sep08 Nov 104
2
0
2
4Panel B: Fluctuation Test Monthly Data
Rol
ling
Sta
tistic DM
CW
Feb00 Dec01 Jan04 Feb06 Mar08 Nov 104
2
0
2
4Panel C: Fluctuation Test Quarterly Data
Time
Rol
ling
Sta
tistic DM
CW
38

Figure 7. The Lagged Interest Rate Model
Notes to Figure 4. Panel A reports Diebold and Mariano�s (1995) test statistic for
comparing forecasts of Model (4) relative to a random walk without drift benchmark (line
with circles for monthly data and squares for quarterly data) as well as relative to the random
walk with drift benchmark (line with diamonds for monthly data and stars for quarterly data)
calculated for several in-sample window sizes (x-axis).
Panel B reports Diebold and Mariano�s (1995) test statistic for comparing forecasts of
Model (4) relative to a random walk without drift benchmark (line with circles for monthly
data and squares for quarterly data) as well as relative to the random walk with drift
benchmark (line with diamonds for monthly data and stars for quarterly data) calculated
for several in-sample window sizes. Negative values indicate that Model (4) forecasts better.
The continuous line indicates the critical value of Diebold and Mariano�s (1995) test statistic:
When the estimated test statistics are below this line, Model (4) forecasts signi�cantly better
than its benchmark.
39

Notes to Figures 5-6. Figure 5 reports Giacomini and Rossi�s (2010) Fluctuation test
statistic for comparing forecasts of Model (4) relative to a random walk without drift bench-
mark (line with circles) as well as relative to the random walk with drift benchmark (line
with triangles). Negative values indicate that Model (4) forecasts better. The continuous
line indicates the critical value of the Fluctuation test statistic: If the estimated test statistic
is below this line, Model (4) forecasts signi�cantly better than its benchmark. The contin-
uous and dashed lines denote, respectively, the two-sided 5% and 10%-level critical values.
Figure 6 reports Giacomini and Rossi�s (2010) Fluctuation test statistic implemented with
the Clark and West�s (2006) statistic for comparing forecasts of Model (4) relative to a ran-
dom walk without drift benchmark (dashed-dot line) as well as Giacomini and Rossi�s (2010)
Fluctuation test statistic implemented with the Diebold and Mariano (1995) and Giacomini
and White (2005) statistic for comparing forecasts of Model (4) relative to a random walk
without drift benchmark (line with �+�). Negative values indicate that Model (4) forecasts
better. The dashed and continuous lines denote, respectively, the one-sided 5% and 10%-
level critical values of the Fluctuation test statistic: If the estimated test statistic is below
this line, Model (4) forecasts signi�cantly better than its benchmark.
Notes to Figure 7. Figure 7 reports Giacomini and Rossi�s (2010) Fluctuation test statistic
for comparing forecasts of Model (5) relative to a random walk without drift benchmark (line
with circles) as well as relative to the random walk with drift benchmark (line with triangles).
Negative values indicate that Model (5) forecasts better. The continuous line indicates the
critical value of the Fluctuation test statistic: If the estimated test statistic is below this
line, Model (5) forecasts signi�cantly better than its benchmark.
40

.
Figure 8, Panel I. Norw. Krone and Oil.
Daily Data, Contemp. Model
Panel II. Norw. Krone and Oil.
Monthly and Quarterly Contemp. Model
Panel III. Norw. Krone and Oil. Fluctuation Test, Lagged P. Model
41

Figure 9, Panel I. S.A. Rand and Gold.
Daily Data, Contemp. Model
Panel II. S.A. Rand and Gold.
Monthly and Quarterly Contemp. Model
Panel III. S.A. Rand and Gold. Fluctuation Test, Contemp. Model
42

Figure 10, Panel I. Chilean Peso and Copper.
Daily Data, Contemp. Model
Panel II. Chilean Peso and Copper.
Monthly and Quarterly Contemp. Model
Panel III. Chilean Peso and Copper. Fluctuation Test, Contemp. Model
43

Figure 11, Panel I. Austr. $ and Oil.
Daily Data, Contemp. Model
Panel II. Austr. $ and Oil.
Monthly and Quarterly Contemp. Model
Panel III. Australian $ and Oil. Fluctuation Test, Contemp. Model
44

Notes to Figures 8-11. Panels (I,II) report Diebold and Mariano�s (1995) test statistic
for comparing forecasts of Model (1) relative to a random walk without drift benchmark
(line with circles) as well as relative to the random walk with drift benchmark (line with
diamonds) calculated for daily (panel I), monthly and quarterly data (panel II), and several
in-sample window sizes (x-axis). The continuous line indicates the critical value of Diebold
and Mariano�s (1995) test statistic: When the estimated test statistics are below this line,
Model (1) or (4) forecasts signi�cantly better than its benchmark. Panel III reports the
Fluctuation test statistic for comparing forecasts of Model (4) relative to a random walk
without drift benchmark (line with circles) as well as relative to the random walk with drift
benchmark (line with diamonds) calculated at daily, monthly and quarterly frequencies, and
several in-sample window sizes (x-axis). Negative values indicate that Model (1) forecasts
better. The continuous line indicates the critical value of Diebold and Mariano�s (1995)
test statistic: When the estimated test statistics are below this line, Model (1) forecasts
signi�cantly better than its benchmark.
Notes to Figure 12. Panel A reports Diebold and Mariano�s (1995) test statistic for
comparing forecasts of Model (1) relative to Model (6) (line with circles) as well as the
forecasts of Model (1) relative to Model (7) (line with diamonds) calculated for daily data
and several in-sample window sizes (x-axis). Panel B reports Diebold and Mariano�s (1995)
test statistic for comparing forecasts of Model (1) relative to Model (6) (line with circles for
monthly data and line with squares for quarterly data) as well as the forecasts of Model (1)
relative to Model (7) (line with diamonds for monthly data and line with stars for quarterly
data) calculated for several in-sample window sizes (x-axis). Negative values indicate that
Model (1) forecasts better. The continuous line indicates the critical value of Diebold and
Mariano�s (1995) test statistic: When the estimated test statistics are below this line, Model
(1) forecasts signi�cantly better than its benchmark, and when it is above this line Model
(1) forecasts worse.
45

Figure 12. Asymmetric and Threshold Models. Forecasting Ability
Panel A. Daily Data
Panel B. Monthly and Quarterly Data
46

Not-for-Publication Appendix to:"Can Oil Prices Forecast Exchange Rates?"
by Domenico Ferraro, Ken Rogo¤ and Barbara Rossi
Figure A.1. In-sample Fit of Oil Price Model �T-statistics Over Time
Notes to the Figure. The �gure reports in-sample t-statistics for comparing forecasts of
Model (1) calculated over rolling samples (dates reported on the x-axis). The continuous
line indicates the critical value of the t-statistic: if the estimated test statistics is below this
line, the coe¢ cient on the oil price in Model (1) is statistically signi�cantly negative. The
top panel is for daily data, the middle panel for monthly and the bottom panel for quarterly
data.
47

Figure A.2. In-sample Fit of Oil Price Model �R2statistics Over Time
Notes to the Figure. The �gure reports in-sample R2 statistics for comparing forecasts
of Model (1) calculated over rolling samples (dates reported on the x-axis).
48

Figure A.3 Panel I. Norw. Krone and Oil.
Daily Data, Lagged Model
Panel II. Norw. Krone and Oil.
Monthly and Quarterly Lagged Model
Panel III. Norw. Krone and Oil. Fluctuation Test
Contemporaneous Price Model
49

Figure A.4. Panel I. S.A. Rand and Gold.
Daily Data, Lagged Model
Panel II. S.A. Rand and Gold.
Monthly and Quarterly Lagged Model
Panel III. S.A. Rand and Gold. Fluctuation Test
Contemporaneous Model
50

Figure A.5. Panel I. Chilean Peso and Copper.
Daily Data, Lagged Model
Panel II. Chilean Peso and Copper.
Monthly and Quarterly Lagged Model
Panel III. Chilean Peso and Copper. Fluctuation Test
Contemporaneous Model
51

Figure A.6. Panel I. Austr. Dollar and Oil.
Daily Data, Lagged Model
Panel II. Austr. Dollar and Oil.
Monthly and Quarterly Lagged Model
Panel III. Australian Dollar and Oil. Fluctuation Test
Contemporaneous Model
52

Notes to Figures A.3-A.6. Panels (I,II) report the same analysis for Model (4). Negative
values indicate that Model (1) or (4) forecasts better. The continuous line indicates the critical
value of Diebold and Mariano�s (1995) test statistic: When the estimated test statistics are below
this line, Model (1) or (4) forecast signi�cantly better than its benchmark. Notes to the Figure.
Panel (III) reports the Fluctuation test statistic for comparing forecasts of Model (1) relative to a
random walk without drift benchmark (line with circles) as well as relative to the random walk with
drift benchmark (line with diamonds) calculated at daily, monthly and quarterly frequencies, and
several in-sample window sizes (x-axis). Negative values indicate that Model (1) forecasts better.
The continuous line indicates the critical value of Diebold and Mariano�s (1995) test statistic: When
the estimated test statistics are below this line, Model (1) forecasts signi�cantly better than its
benchmark.
53

Asymmetric and threshold models with lagged fundamentals.
The asymmetric model with lagged fundamentals is:
�st = �+ + �+�pt�1 + +�p+t�1 + ut; (8)
whereas the threshold model with lagged fundamentals is:
�st = �q + �q�pt�1 + q�pqt�1 + ut: (9)
54

Figure A.7. Asymmetric and Threshold Models. Forecasting Ability
in Daily Data, Lagged Model
Notes to the Figure. The �gure reports Diebold and Mariano�s (1995) test statistic for
comparing forecasts of Model (4) relative to Model (6) (line with circles for monthly data and
line with squares for quarterly data) as well as the forecasts of Model (4) relative to Model (7)
(line with diamonds for monthly data and line with stars for quarterly data) calculated for
several in-sample window sizes (x-axis). Negative values indicate that Model (4) forecasts
better. The continuous line indicates the critical value of Diebold and Mariano�s (1995)
test statistic: When the estimated test statistics are below this line, Model (4) forecasts
signi�cantly better than its benchmark.
55

Figure A.8. Asymmetric and Threshold Models. Forecasting Ability
in Monthly and Quarterly Data, Lagged Model
Notes to the Figure. The �gure reports Diebold and Mariano�s (1995) test statistic for
comparing forecasts of Model (4) relative to Model (6) (line with circles for monthly data and
line with squares for quarterly data) as well as the forecasts of Model (4) relative to Model (7)
(line with diamonds for monthly data and line with stars for quarterly data) calculated for
several in-sample window sizes (x-axis). Negative values indicate that Model (4) forecasts
better. The continuous line indicates the critical value of Diebold and Mariano�s (1995)
test statistic: When the estimated test statistics are below this line, Model (4) forecasts
signi�cantly better than its benchmark.
56

Figure A.9. Fluctuation Test on the Asymmetric Model
Notes to the Figure. The �gure reports Giacomini and Rossi�s (2010) Fluctuation test
statistic for comparing forecasts of Model (1) relative to a random walk without drift bench-
mark (line with circles) as well as relative to the random walk with drift benchmark (line
with diamonds) and the Asymmetric Model (line with pluses). Negative values indicate that
Model (6) forecasts better. The continuous line indicates the critical value of the Fluctuation
test statistic: If the estimated test statistic is below this line, Model (6) forecasts signi�cantly
better than its benchmark.
57
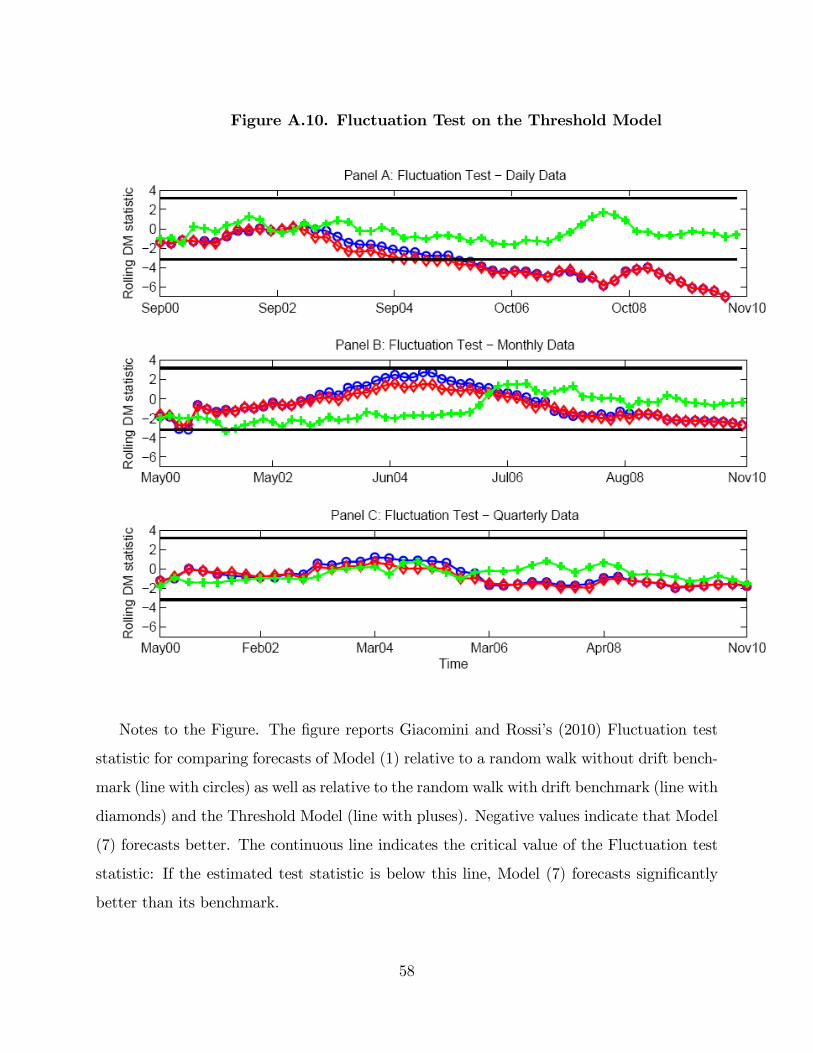
Figure A.10. Fluctuation Test on the Threshold Model
Notes to the Figure. The �gure reports Giacomini and Rossi�s (2010) Fluctuation test
statistic for comparing forecasts of Model (1) relative to a random walk without drift bench-
mark (line with circles) as well as relative to the random walk with drift benchmark (line with
diamonds) and the Threshold Model (line with pluses). Negative values indicate that Model
(7) forecasts better. The continuous line indicates the critical value of the Fluctuation test
statistic: If the estimated test statistic is below this line, Model (7) forecasts signi�cantly
better than its benchmark.
58

Figure A11. In-sample Fit of the Asymmetric Model �t-statistics Over Time
Notes to the Figure. The �gure reports in-sample t-statistics for comparing forecasts of
Model (1) calculated over rolling samples of size equal to one-half of the total sample size
(dates reported on the x-axis). The line with circles is the t-statistic on the coe¢ cient on
the oil price growth rate and the line with diamonds is the t-statistic on the coe¢ cient of the
non-linear variable, calculated over rolling samples of data. The continuous line indicates the
critical value of the t-statistic: If the estimated test statistic is below this line, the relevant
coe¢ cient in Model (1) is statistically signi�cantly negative.
59

Figure A.12. In-sample Fit of the Threshold Model �t-statistics Over Time
Notes to the Figure. The �gure reports in-sample t-statistics for comparing forecasts of
Model (1) calculated over rolling samples of size equal to one-half of the total sample size
(dates reported on the x-axis). The line with circles is the t-statistic on the coe¢ cient on
the oil price growth rate and the line with diamonds is the t-statistic on the coe¢ cient of the
non-linear variable, calculated over rolling samples of data. The continuous line indicates the
critical value of the t-statistic: If the estimated test statistic is below this line, the coe¢ cient
on the oil price in Model (1) is statistically signi�cantly negative.
60

Figure A.13. In-sample Fit of the Asymmetric Model �R2 Statistics Over Time
Notes to the Figure. The �gure reports in-sample R2 statistics for comparing forecasts of
Model (1) calculated over rolling samples of one-half of the total sample size (dates reported
on the x-axis).
61

Figure A.14. In-sample Fit of the Threshold Model �R2 Statistics Over Time
Notes to the Figure. The �gure reports in-sample R2 statistics for comparing forecasts
of Model (1) calculated over rolling samples (dates reported on the x-axis).
62

Table A.1 Recursive Estimation for Model 1
Estimation Method Rolling Recursive
Benchmark RW w/o Drift RW w/ Drift RW w/o Drift RW w/ Drift
1/2 -8.051 -8.094 -8.744 -8.760
1/3 -7.543 -7.563 -8.716 -8.735
1/4 -6.441 -6.504 -8.668 -8.720
1/5 -6.108 -6.145 -8.645 -8.691
1/6 -5.974 -6.023 -8.627 -8.682
1/7 -5.744 -5.780 -8.627 -8.675
1/8 -5.443 -5.499 -8.655 -8.703
1/9 -5.434 -5.479 -8.645 -8.688
1/10 -5.355 -5.402 -8.642 -8.687
Notes. The table reports Diebold and Mariano�s (1995) test statistic for comparing the
contemporaneous oil price model, eq. (1), with a random walk without drift (column labeled
"RW w/o Drift") and a random walk with drift (column labeled "RW w/ Drift") benchmark,
for di¤erent �rst starting window sizes as a fraction of the total sample size ("R/T"). The
columns labeled "Rolling" report results for a rolling window estimation scheme and those
labeled "Recursive" report results for a recursive estimation scheme.
63

Table A.2. Estimates of the Asymmetric Model
Daily Monthly Quarterly
R2 0.029 0.08 0.20
� - 0.000 0.000 -0.002
(-0.51) (0.22) (-0.40)
� -0.030 -0.046 -0.08
(-5.84) (-1.16) (-1.90)
0.000 -0.029 -0.001
(0.03) (-0.48) (-0.02)
Notes to the Table. The model is eq. (6); HAC robust t�statistics reported in parentheses.
Table A.3. Estimates of the Threshold Model
Daily Monthly Quarterly
R2 0.03 0.08 0.20
� -0.000 -0.000 -0.002
(-0.63) (-0.63) (-0.57)
� -0.04 -0.05 -0.08
(-4.16) (-1.46) (-1.73)
0.008 -0.014 -0.002
(0.85) (-0.39) (-0.03)
Notes to the Table. The model is eq. (7); HAC robust t�statistics reported in parentheses.
64