protein identification using mass...
TRANSCRIPT
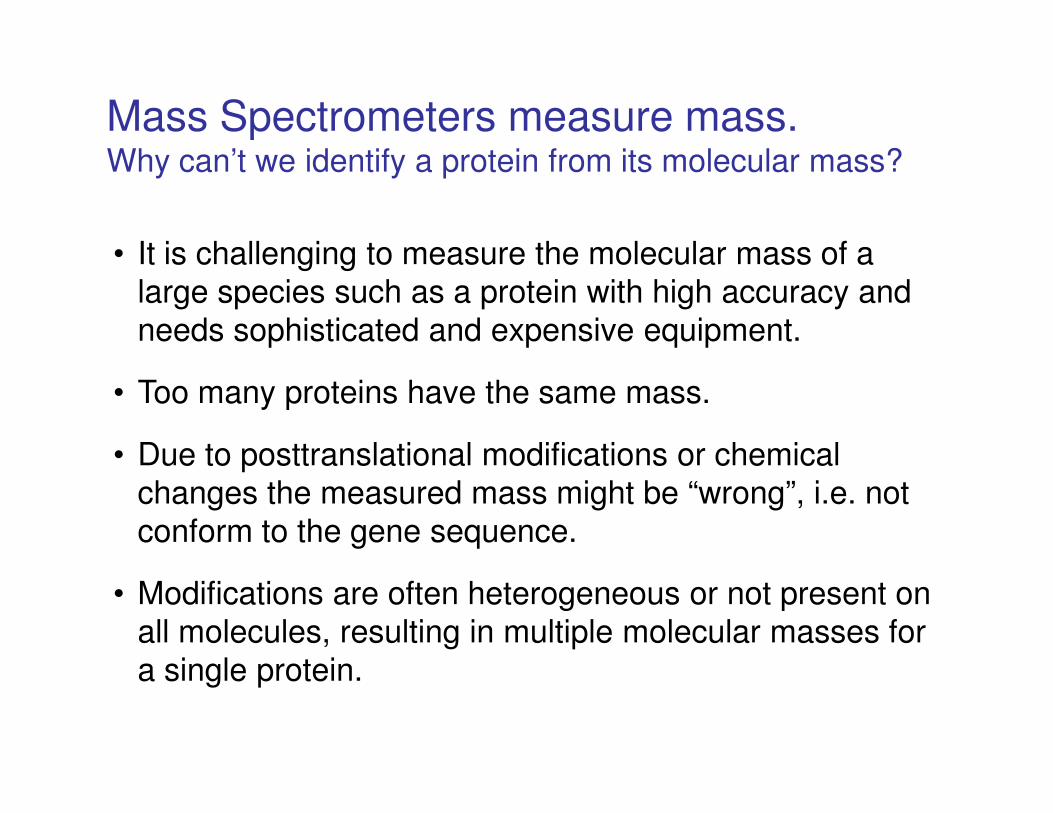
Mass Spectrometers measure mass.Why can’t we identify a protein from its molecular mass?
• It is challenging to measure the molecular mass of a
large species such as a protein with high accuracy and
needs sophisticated and expensive equipment.
• Too many proteins have the same mass.• Too many proteins have the same mass.
• Due to posttranslational modifications or chemical
changes the measured mass might be “wrong”, i.e. not
conform to the gene sequence.
• Modifications are often heterogeneous or not present on
all molecules, resulting in multiple molecular masses for
a single protein.
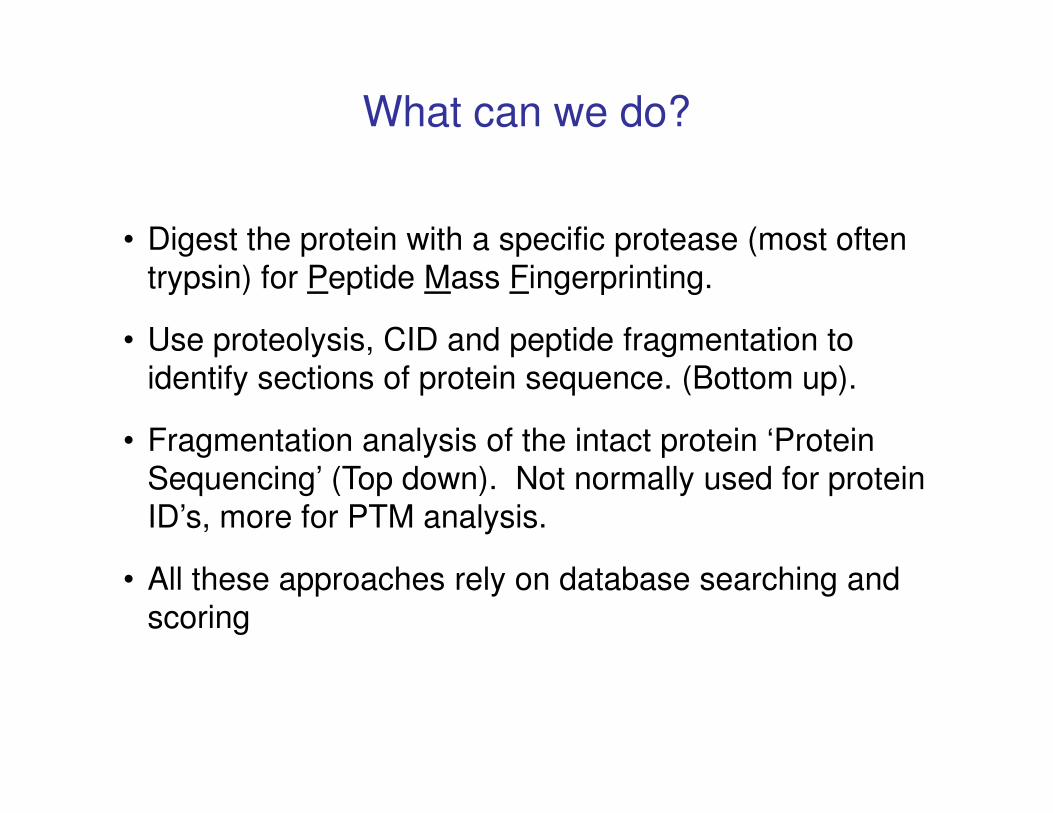
What can we do?
• Digest the protein with a specific protease (most often
trypsin) for Peptide Mass Fingerprinting.
• Use proteolysis, CID and peptide fragmentation to
identify sections of protein sequence. (Bottom up).
• Fragmentation analysis of the intact protein ‘Protein
Sequencing’ (Top down). Not normally used for protein
ID’s, more for PTM analysis.
• All these approaches rely on database searching and
scoring
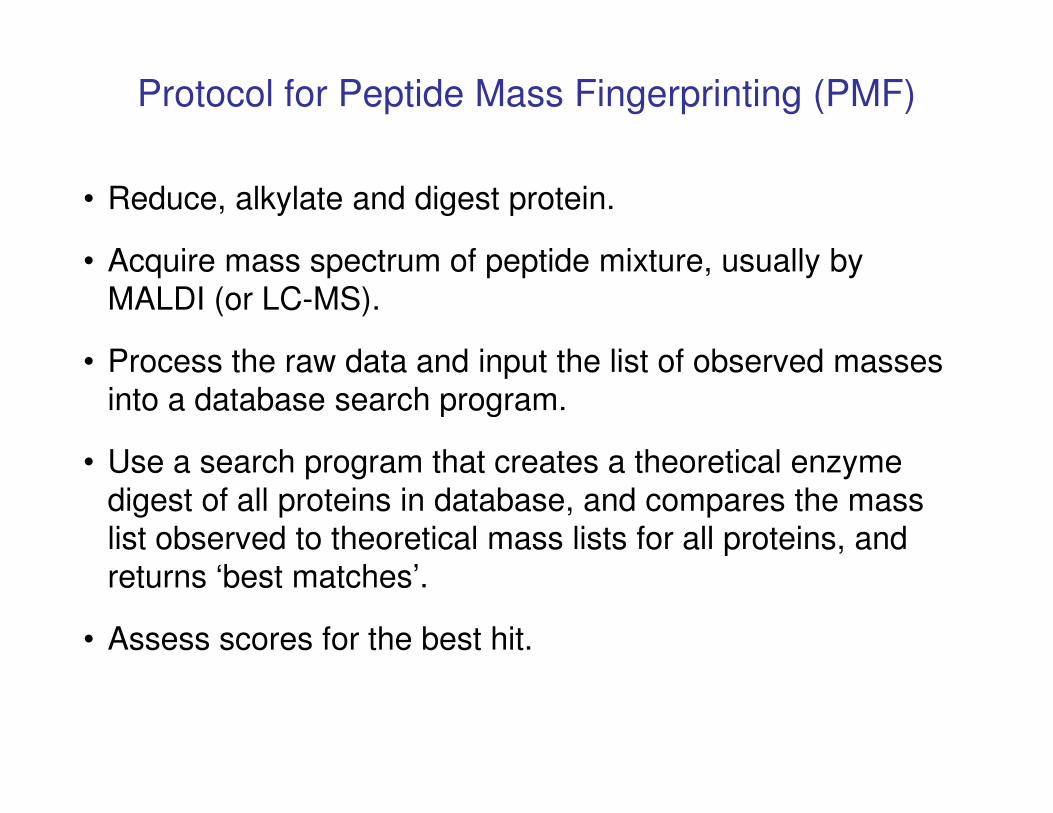
Protocol for Peptide Mass Fingerprinting (PMF)
• Reduce, alkylate and digest protein.
• Acquire mass spectrum of peptide mixture, usually by
MALDI (or LC-MS).
• Process the raw data and input the list of observed masses
into a database search program.into a database search program.
• Use a search program that creates a theoretical enzyme
digest of all proteins in database, and compares the mass
list observed to theoretical mass lists for all proteins, and
returns ‘best matches’.
• Assess scores for the best hit.
AcNH
R
R
R
R
R
K
KP
K
COOY
X
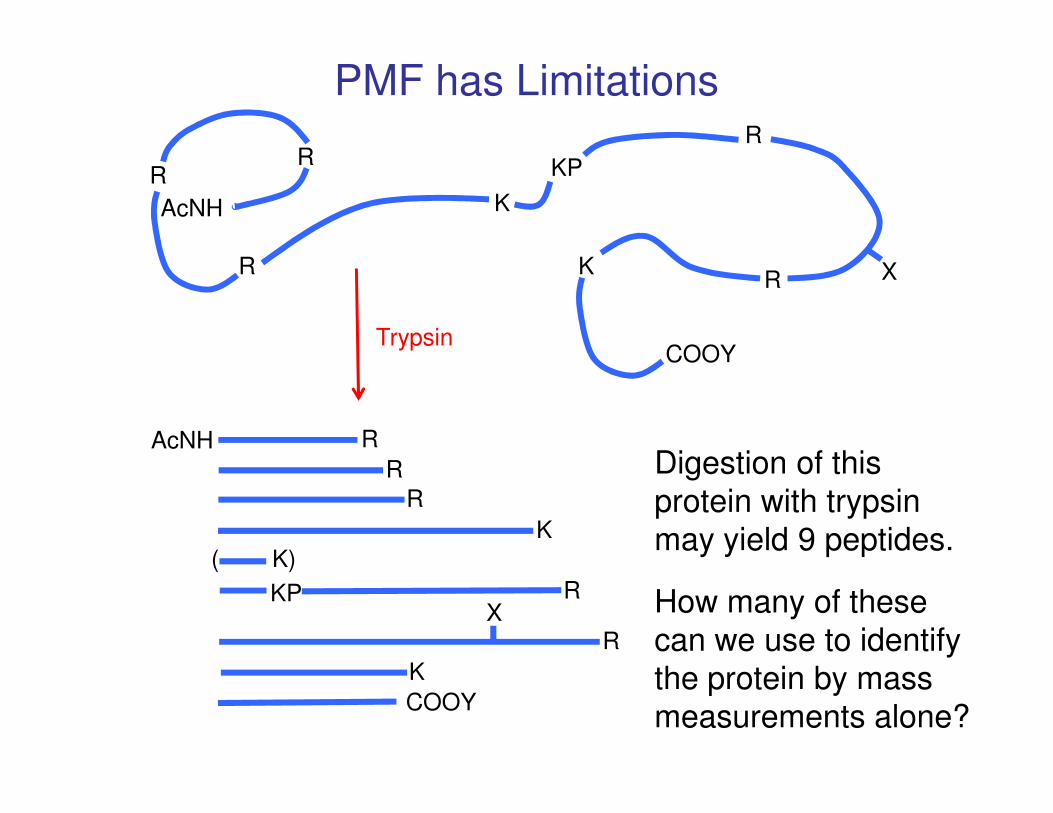
Trypsin
PMF has Limitations
AcNH R
R
R
K
K
COOY
RX
KP R
( K)
Digestion of this
protein with trypsin
may yield 9 peptides.
How many of these
can we use to identify
the protein by mass
measurements alone?
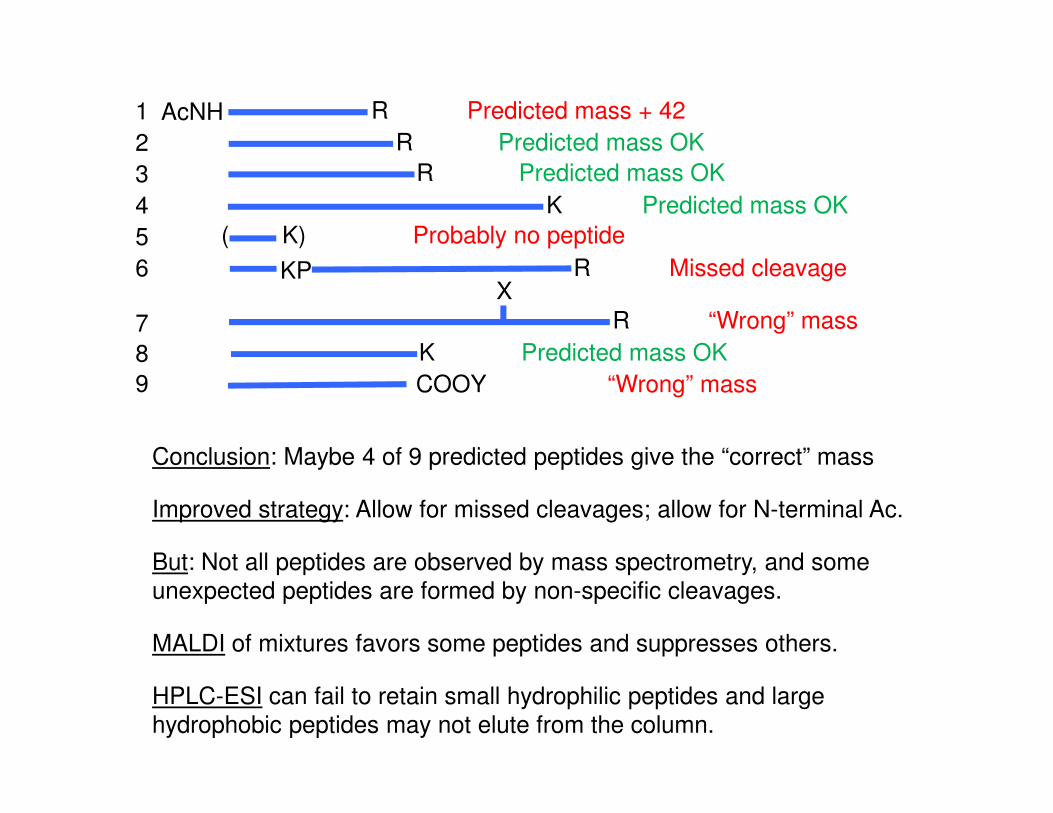
AcNH R Predicted mass + 42
R Predicted mass OK
R Predicted mass OK
K Predicted mass OK
K Predicted mass OK
COOY “Wrong” mass
R “Wrong” mass
XKP R Missed cleavage
( K) Probably no peptide
1
2
3
4
5
6
7
8
9
Conclusion: Maybe 4 of 9 predicted peptides give the “correct” mass
Improved strategy: Allow for missed cleavages; allow for N-terminal Ac.
But: Not all peptides are observed by mass spectrometry, and some
unexpected peptides are formed by non-specific cleavages.
MALDI of mixtures favors some peptides and suppresses others.
HPLC-ESI can fail to retain small hydrophilic peptides and large
hydrophobic peptides may not elute from the column.
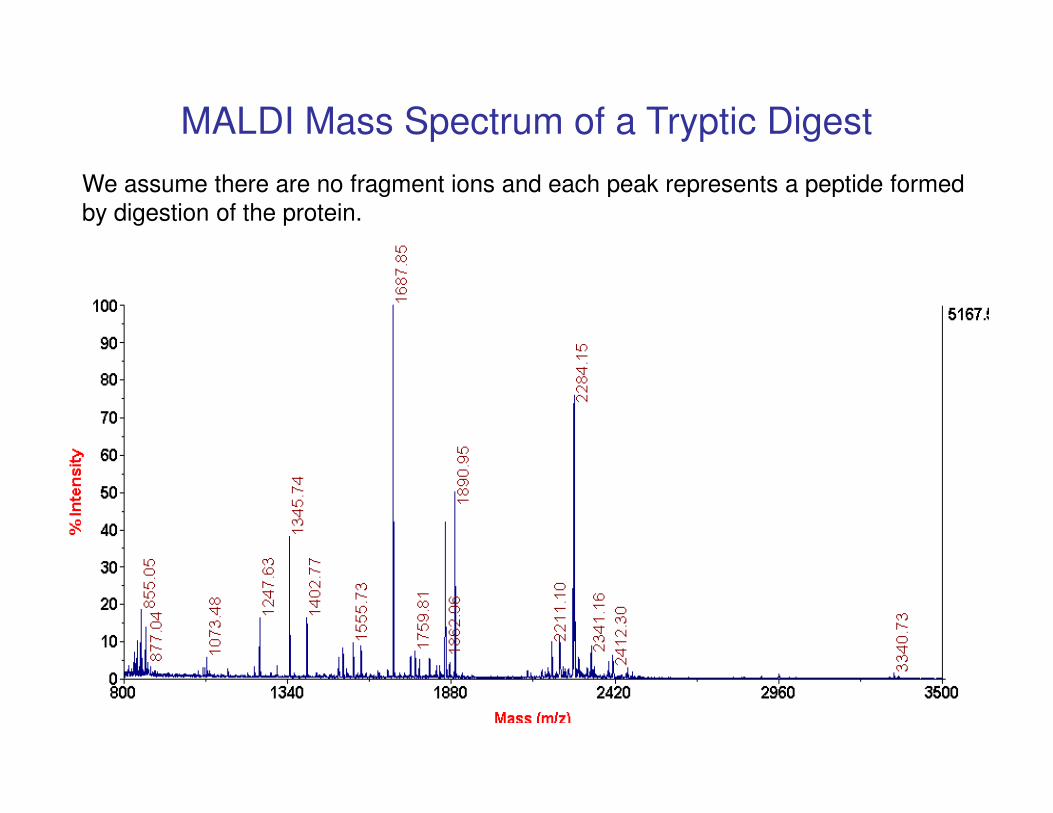
MALDI Mass Spectrum of a Tryptic Digest
We assume there are no fragment ions and each peak represents a peptide formed
by digestion of the protein.
Database Search Program
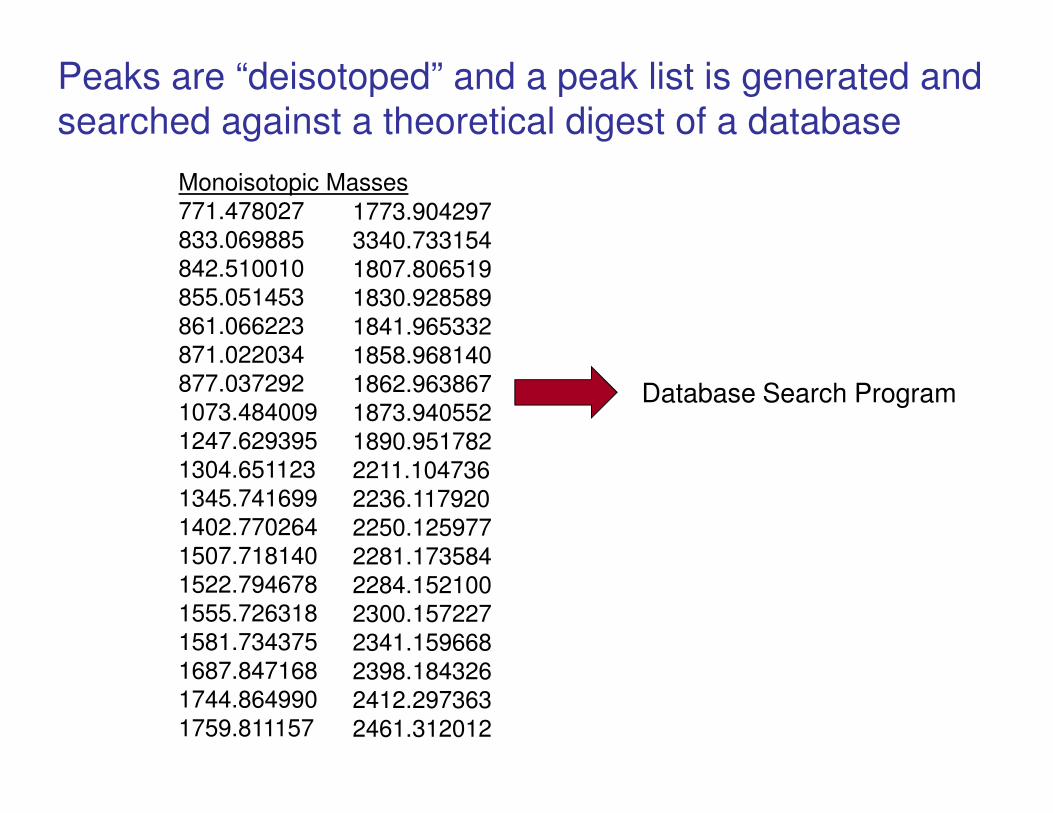
Peaks are “deisotoped” and a peak list is generated and
searched against a theoretical digest of a database
Monoisotopic Masses
771.478027
833.069885
842.510010
855.051453
861.066223
871.022034
877.037292
1073.484009
1773.904297
3340.733154
1807.806519
1830.928589
1841.965332
1858.968140
1862.963867
1873.940552Database Search Program
1073.484009
1247.629395
1304.651123
1345.741699
1402.770264
1507.718140
1522.794678
1555.726318
1581.734375
1687.847168
1744.864990
1759.811157
1873.940552
1890.951782
2211.104736
2236.117920
2250.125977
2281.173584
2284.152100
2300.157227
2341.159668
2398.184326
2412.297363
2461.312012
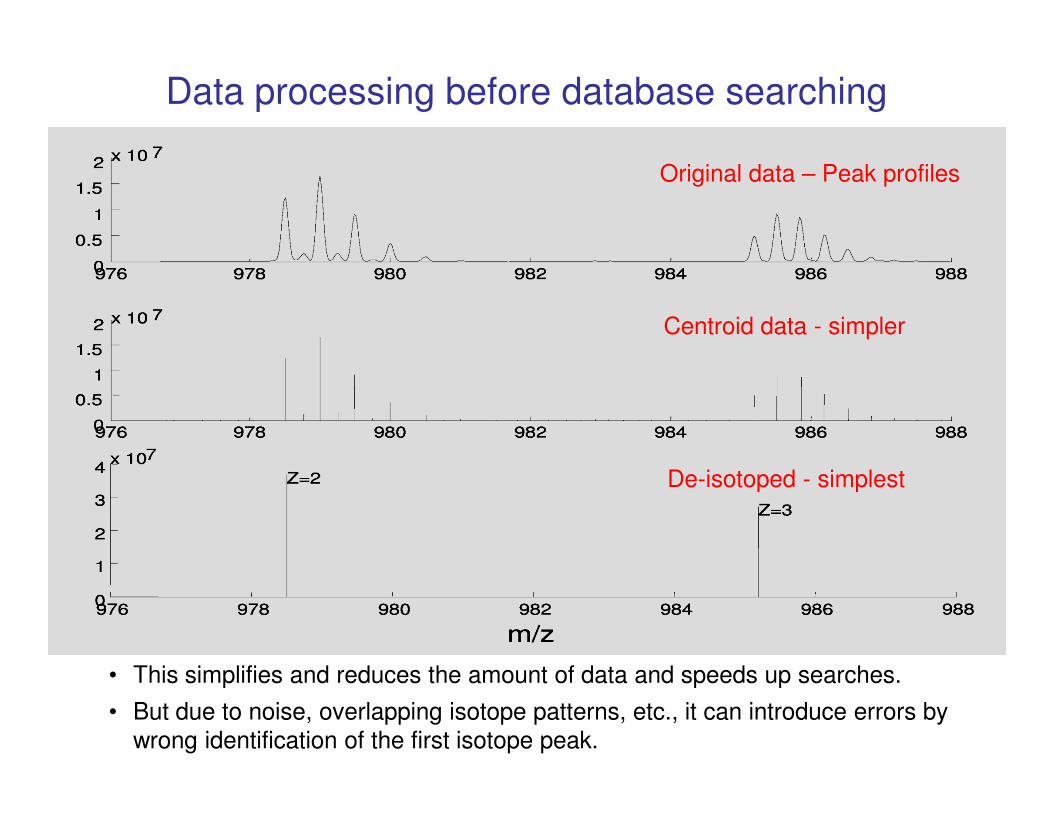
Data processing before database searching
Original data – Peak profiles
Centroid data - simpler
De-isotoped - simplest
• This simplifies and reduces the amount of data and speeds up searches.
• But due to noise, overlapping isotope patterns, etc., it can introduce errors by
wrong identification of the first isotope peak.
PMF Database Search Engines
Software is required to search the observed peptides against predictions from a theoretical digestion of all proteins in a database.
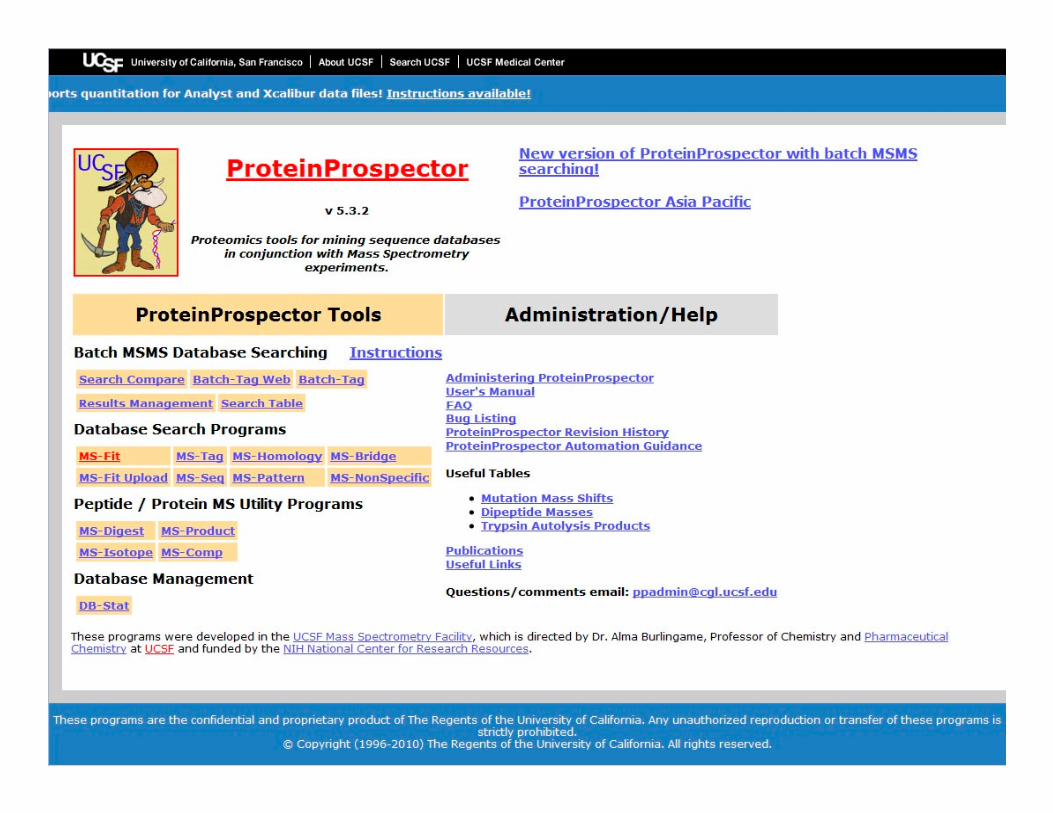
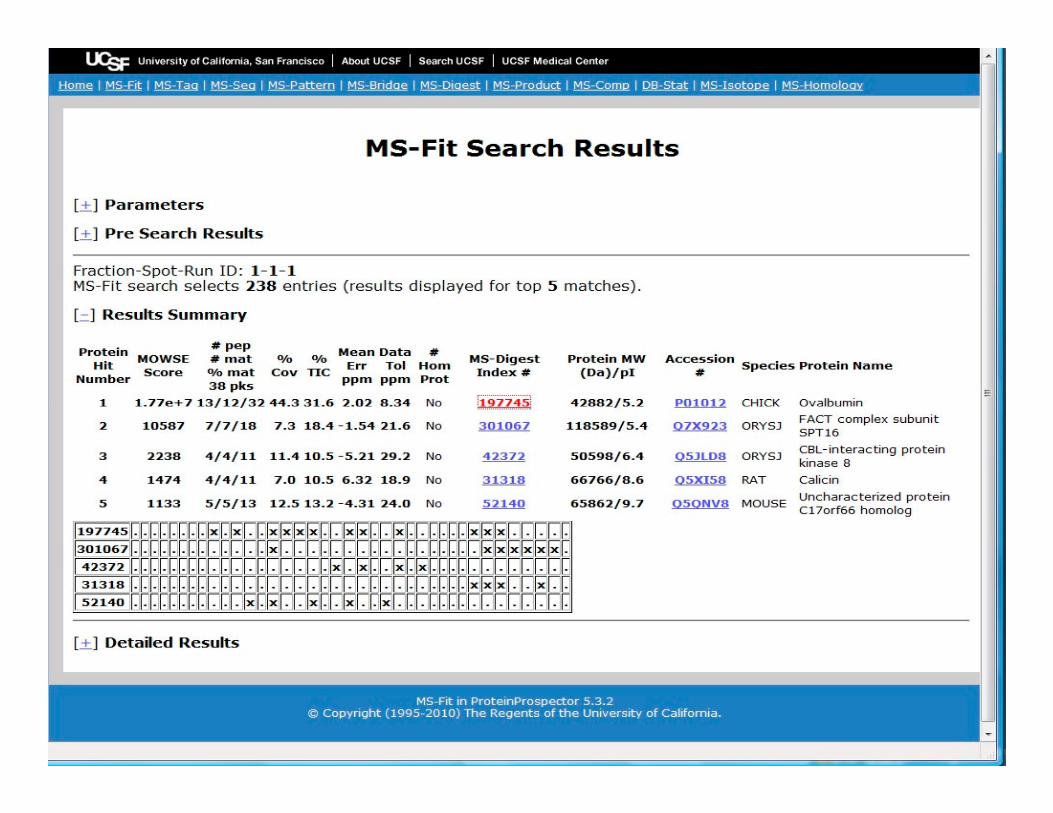
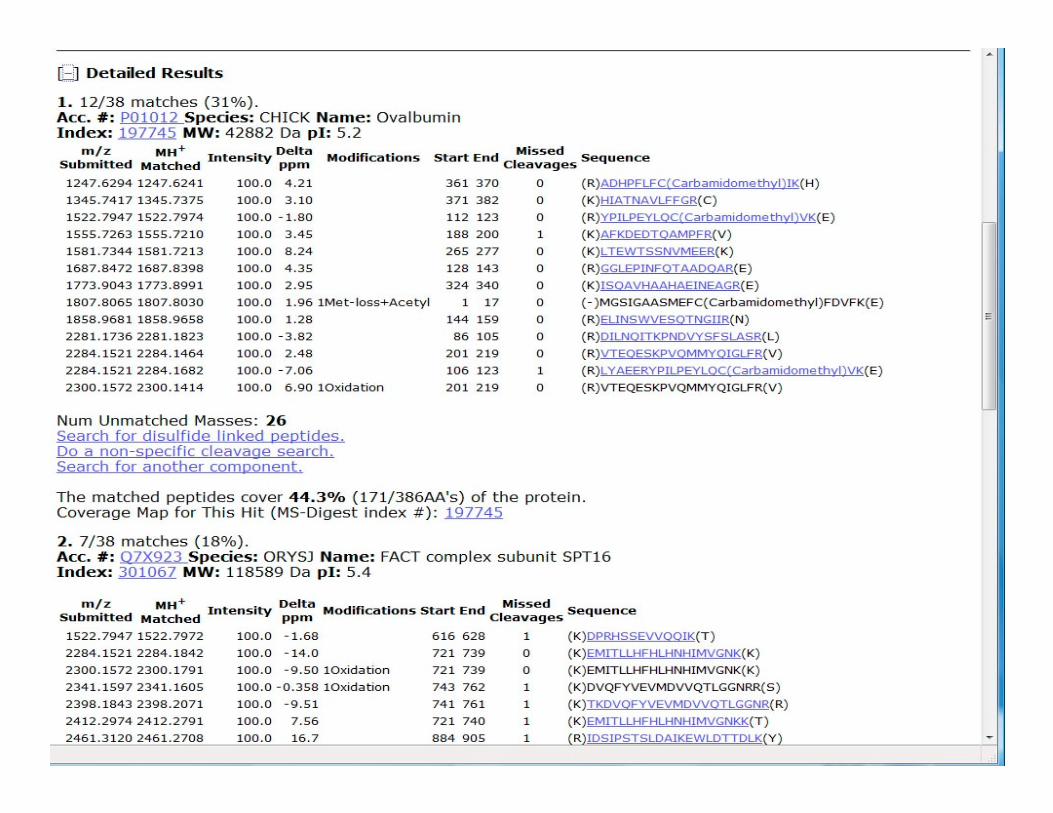
Protein Prospector
Developed at UCSF. Provides a suite of tools for all kinds of proteomic analysis, including protein mass fingerprinting, MSMS analysis, theoretical protein digestion, peptide fragmentation tools, etc.
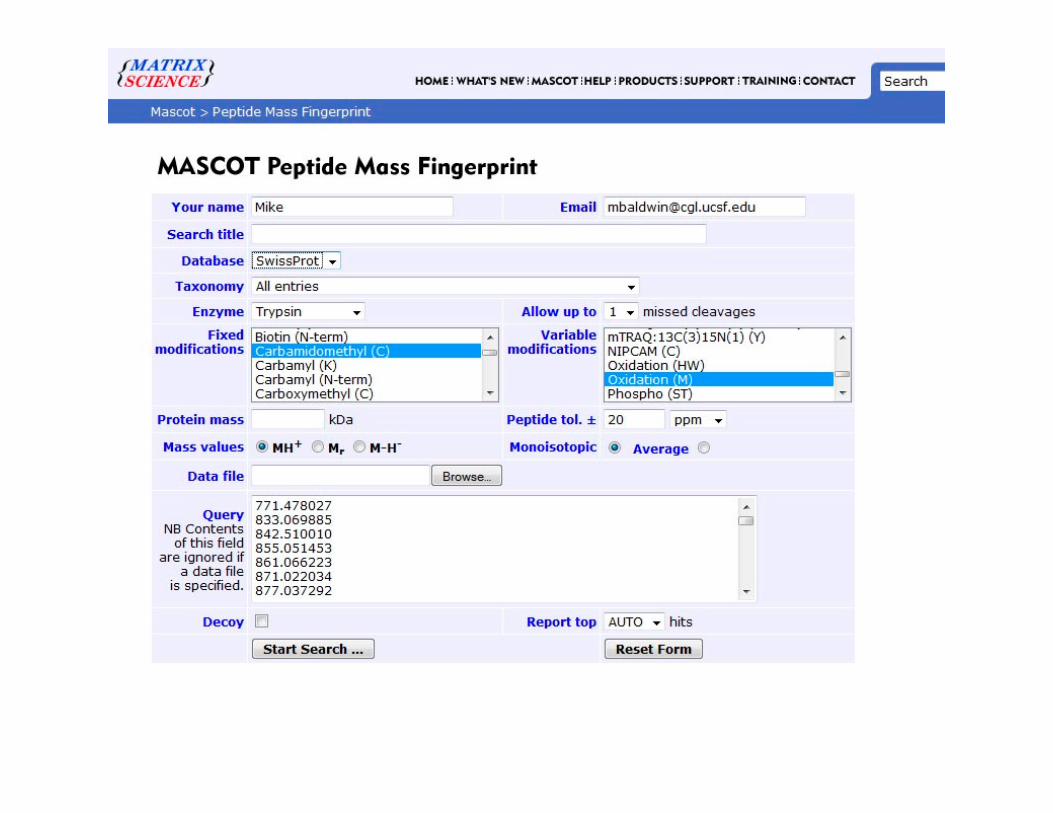
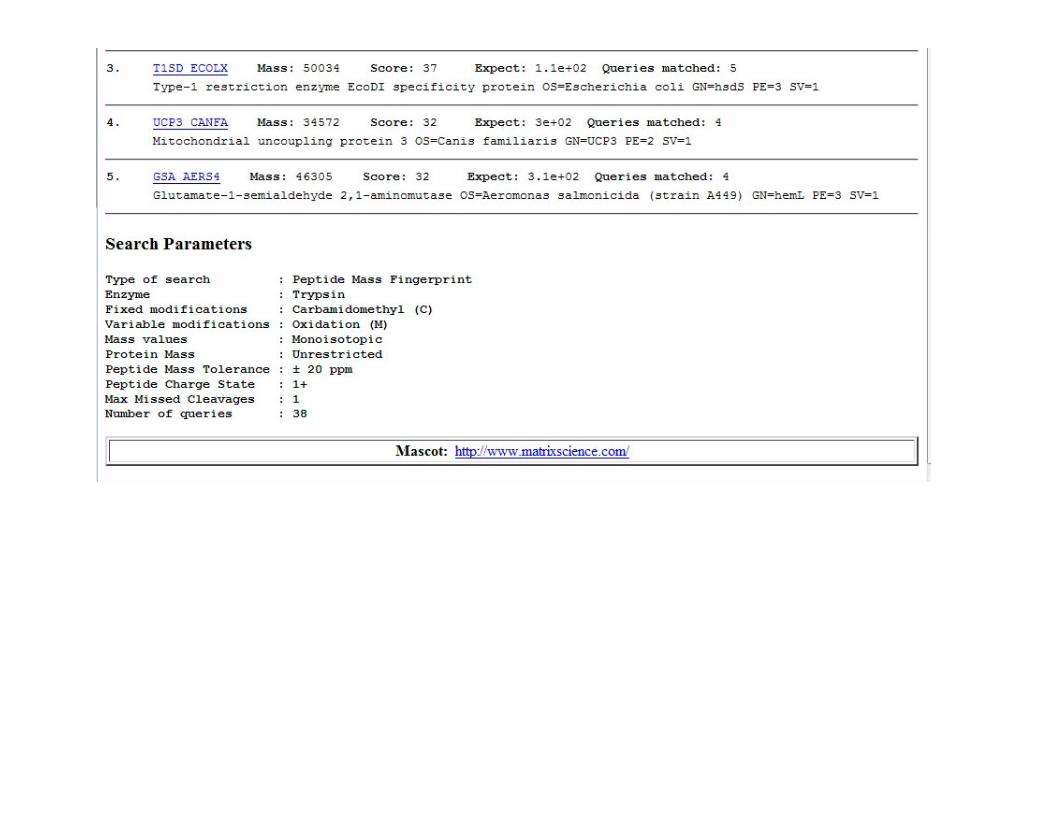
MascotMascot
Search engine for analyzing protein mass fingerprinting data and LC-MSMS data.
• Data is input and searched in a similar fashion for both, but they have different ‘scoring systems’ for deciding which matches are correct.
• Both are publicly available for on-line searching or users can purchase licenses for dedicated in-house versions.
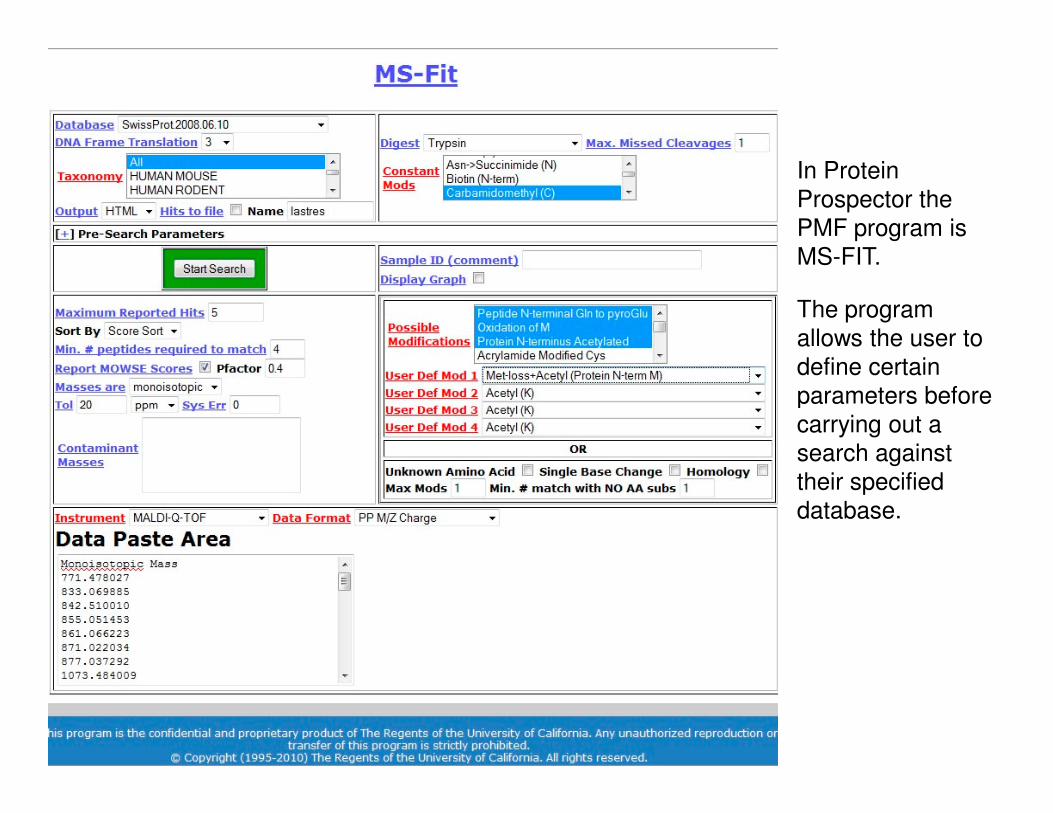
In Protein
Prospector the
PMF program is
MS-FIT.
The program
allows the user to
define certain
parameters before parameters before
carrying out a
search against
their specified
database.
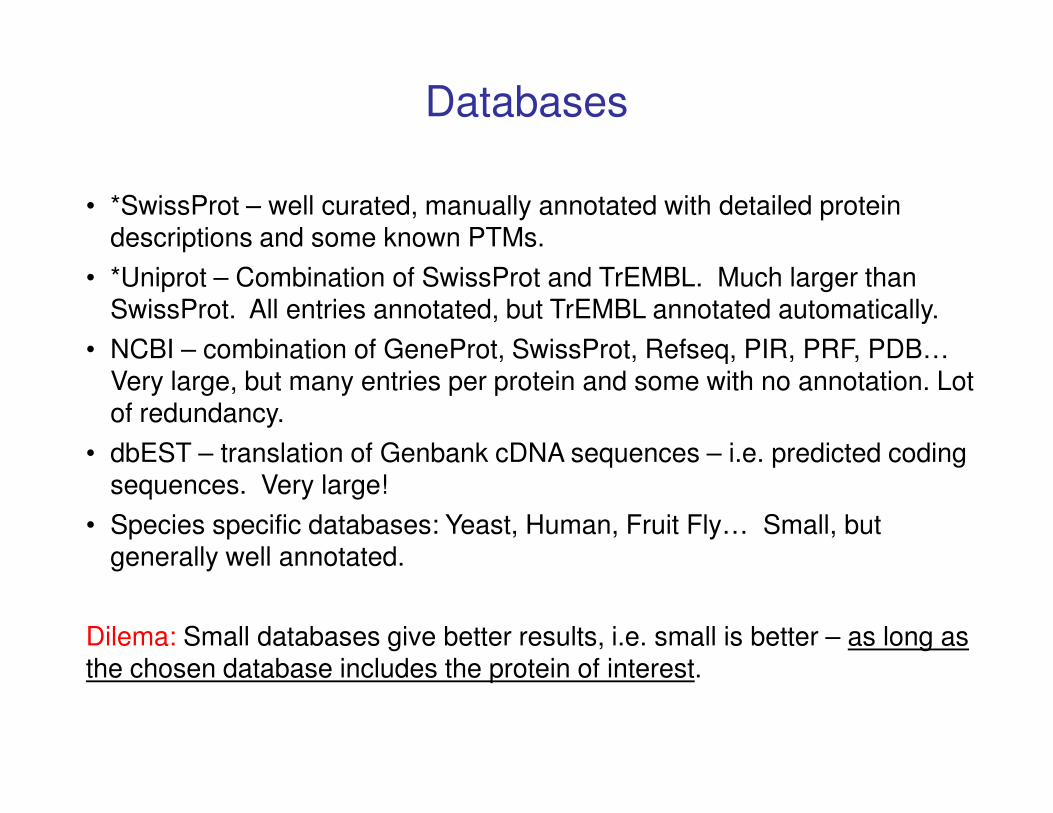
Databases
• *SwissProt – well curated, manually annotated with detailed protein descriptions and some known PTMs.
• *Uniprot – Combination of SwissProt and TrEMBL. Much larger than SwissProt. All entries annotated, but TrEMBL annotated automatically.
• NCBI – combination of GeneProt, SwissProt, Refseq, PIR, PRF, PDB… Very large, but many entries per protein and some with no annotation. Lot of redundancy.of redundancy.
• dbEST – translation of Genbank cDNA sequences – i.e. predicted coding sequences. Very large!
• Species specific databases: Yeast, Human, Fruit Fly… Small, but generally well annotated.
Dilema: Small databases give better results, i.e. small is better – as long as the chosen database includes the protein of interest.
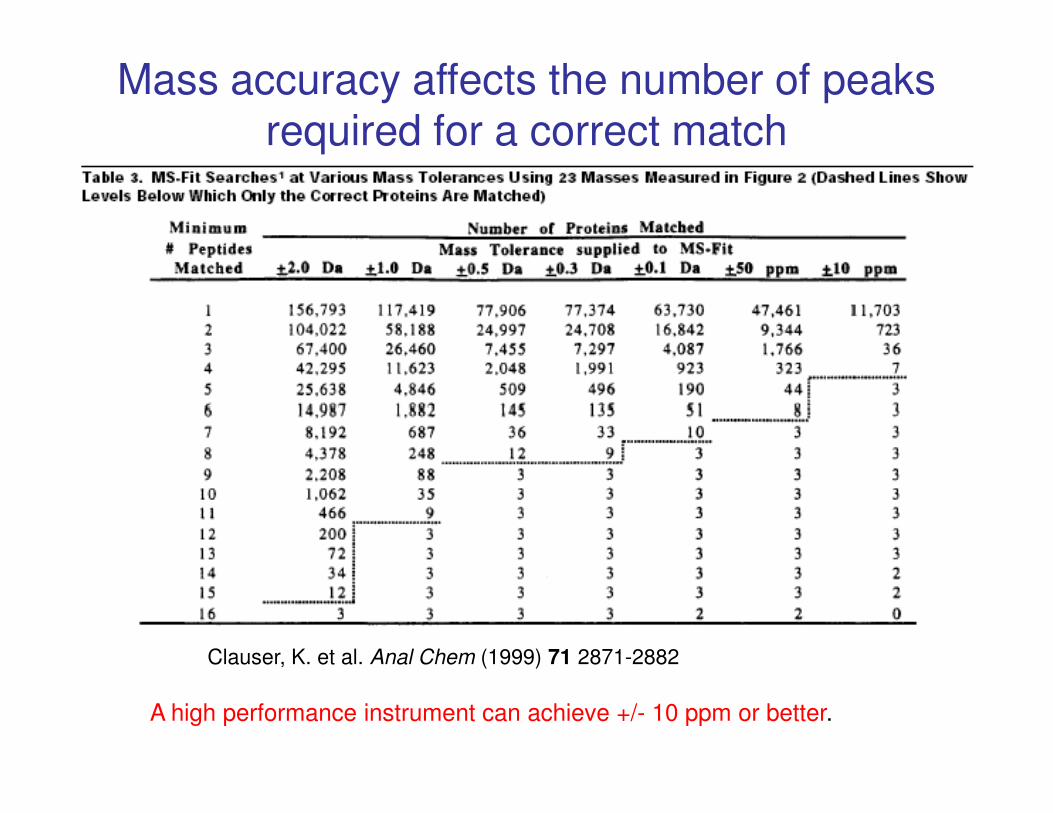
Mass accuracy affects the number of peaks required for a correct match
Clauser, K. et al. Anal Chem (1999) 71 2871-2882
A high performance instrument can achieve +/- 10 ppm or better.
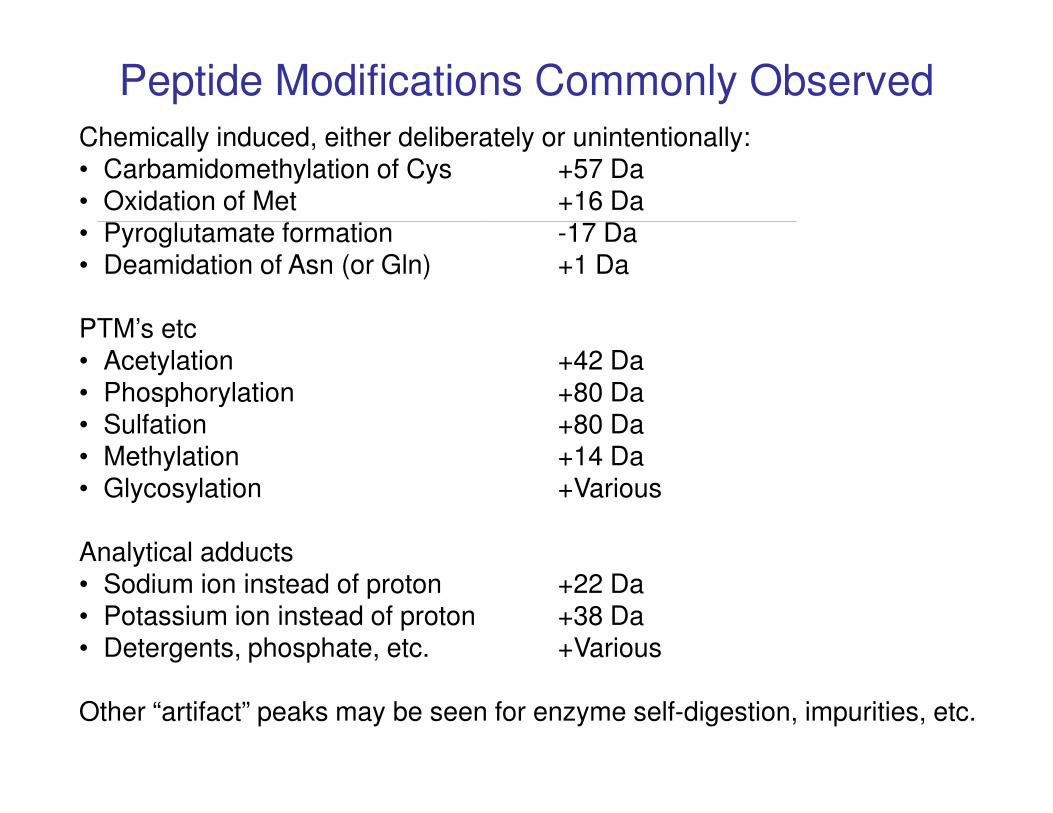
Chemically induced, either deliberately or unintentionally:• Carbamidomethylation of Cys +57 Da• Oxidation of Met +16 Da• Pyroglutamate formation -17 Da• Deamidation of Asn (or Gln) +1 Da
PTM’s etc• Acetylation +42 Da• Phosphorylation +80 Da
Peptide Modifications Commonly Observed
• Phosphorylation +80 Da• Sulfation +80 Da• Methylation +14 Da• Glycosylation +Various
Analytical adducts• Sodium ion instead of proton +22 Da• Potassium ion instead of proton +38 Da• Detergents, phosphate, etc. +Various
Other “artifact” peaks may be seen for enzyme self-digestion, impurities, etc.
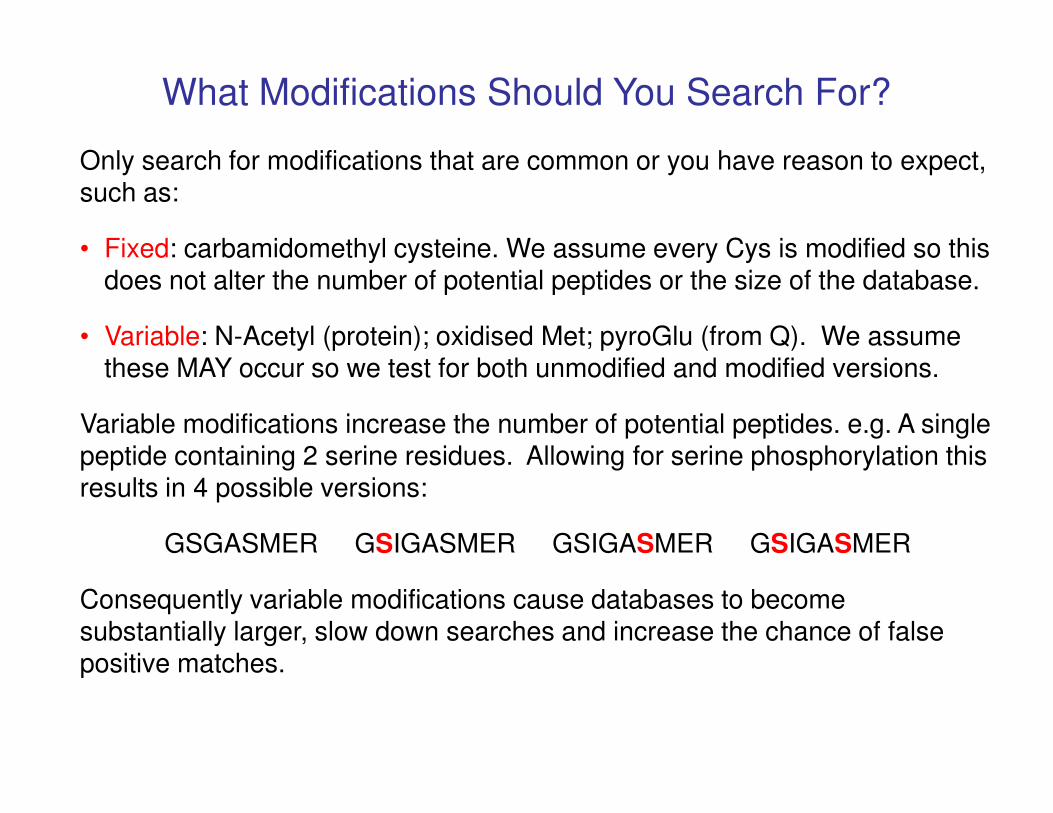
What Modifications Should You Search For?
Only search for modifications that are common or you have reason to expect, such as:
• Fixed: carbamidomethyl cysteine. We assume every Cys is modified so this does not alter the number of potential peptides or the size of the database.
• Variable: N-Acetyl (protein); oxidised Met; pyroGlu (from Q). We assume these MAY occur so we test for both unmodified and modified versions.
Variable modifications increase the number of potential peptides. e.g. A single peptide containing 2 serine residues. Allowing for serine phosphorylation this results in 4 possible versions:
GSGASMER GSIGASMER GSIGASMER GSIGASMER
Consequently variable modifications cause databases to become substantially larger, slow down searches and increase the chance of false positive matches.
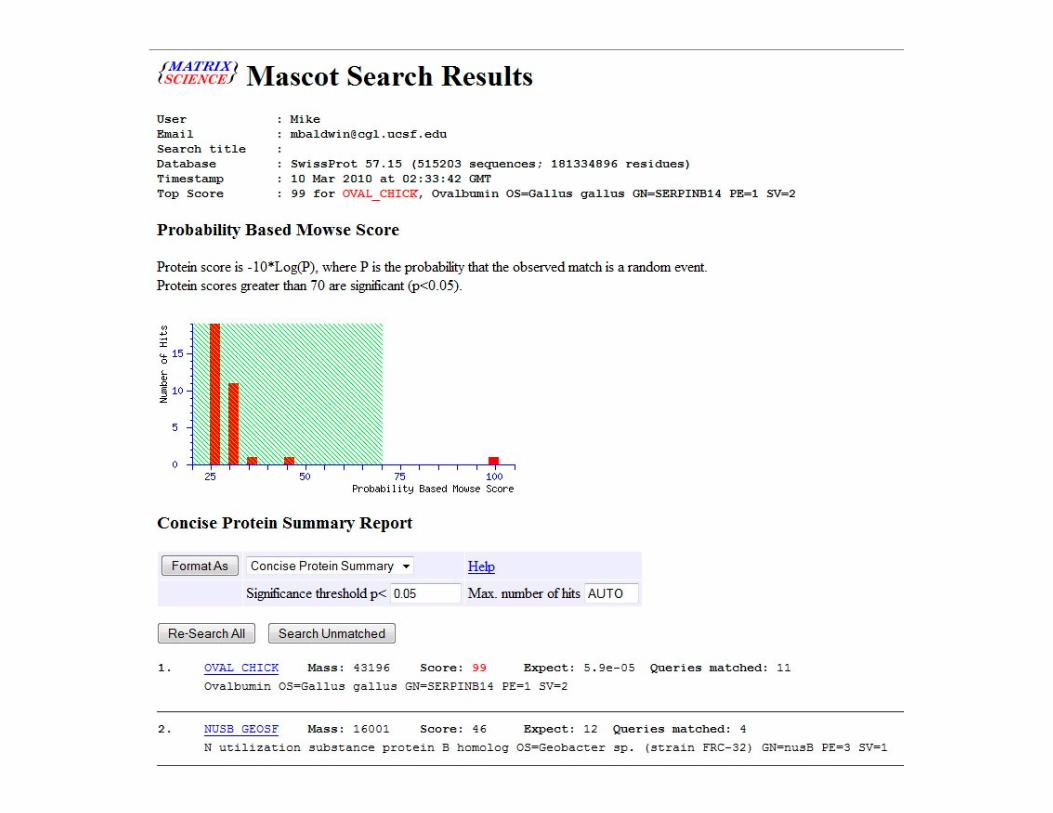
How are PMF Results Scored / Results Ranked?
• Which protein matches the highest fraction of the peptide masses observed?
• What is the probability that ‘x’ peaks match to a given protein at random?
What will affect this probability?
• How many peaks are submitted for the search?• How many peaks are submitted for the search?
• What mass accuracy are you allowing for the peaks?
• Size of protein: bigger protein will form more tryptic peptides, so is likely to match more peptides at random.
• Number of proteins in the database.
• What modifications you allow for.
• The scoring algorithm most commonly used is the “molecular weight search” (MOWSE) developed by Pappin et al, 1993.
PMF has advantages:
• Quick and simple to acquire data.
• Sensitive.
• Data can be obtained on a relatively simple mass spectrometer as MSMS is not required.
And disadvantages:
PMF Conclusions
And disadvantages:
• Not good for protein mixture analysis (even a simple mixture).
• Confidence of many search result assignments is low.
Enhanced alternatives involve collision induced dissociation
(CID) and/or electron transfer dissociation (ETD) and
sequence analysis, usually of peptides within the same digest
as PMF, but sometimes of intact proteins.
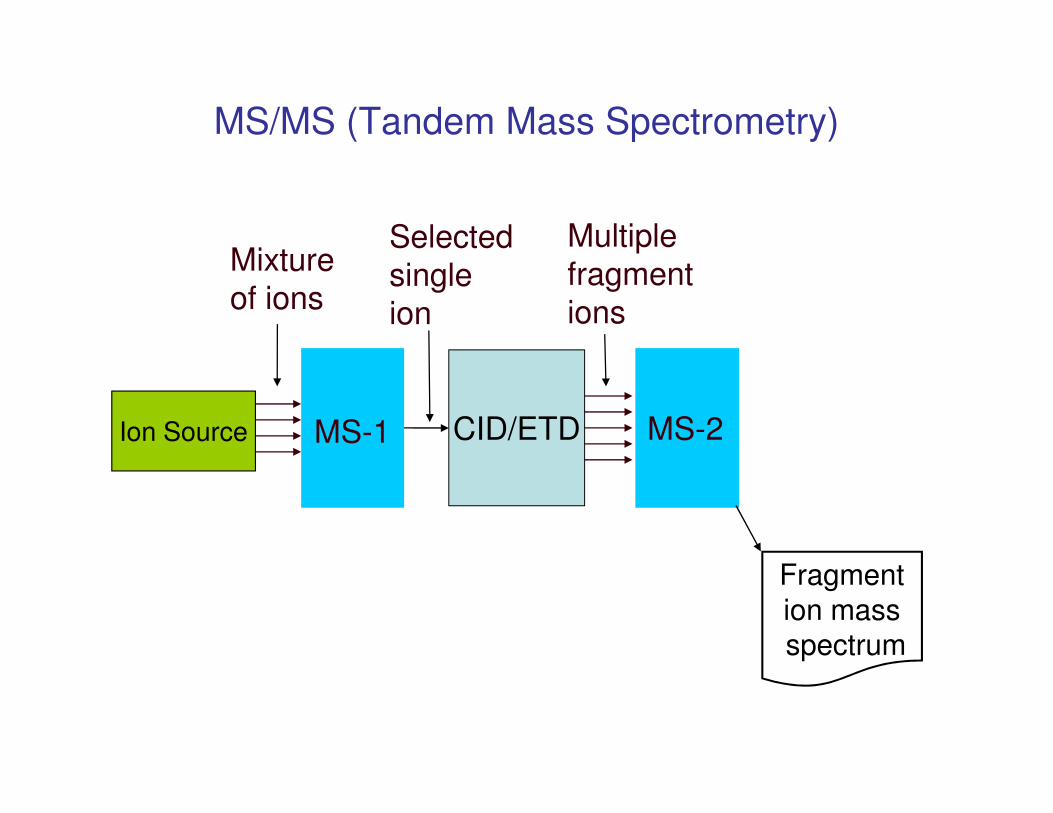
MS/MS (Tandem Mass Spectrometry)
Mixture
of ions
Selected
single
ion
Multiple
fragment
ions
MS-2MS-1 CID/ETD
Fragment
ion massspectrum
Ion Source
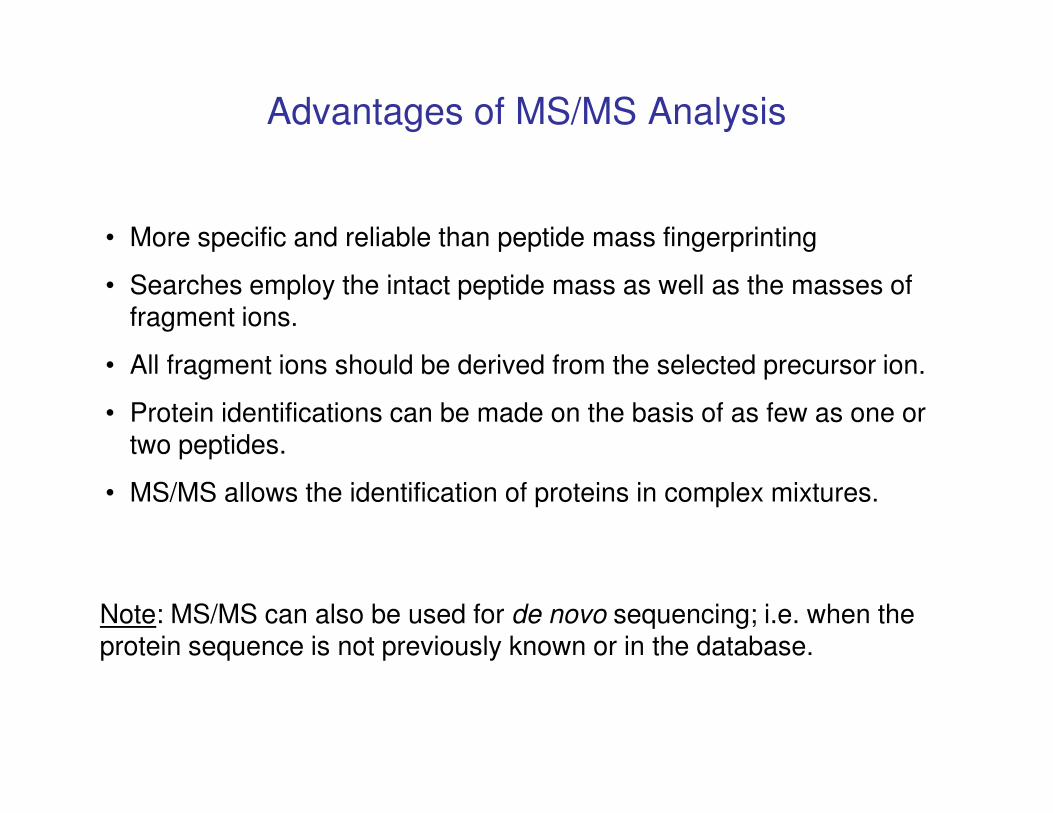
Advantages of MS/MS Analysis
• More specific and reliable than peptide mass fingerprinting
• Searches employ the intact peptide mass as well as the masses of fragment ions.
• All fragment ions should be derived from the selected precursor ion.
• Protein identifications can be made on the basis of as few as one or • Protein identifications can be made on the basis of as few as one or two peptides.
• MS/MS allows the identification of proteins in complex mixtures.
Note: MS/MS can also be used for de novo sequencing; i.e. when the protein sequence is not previously known or in the database.
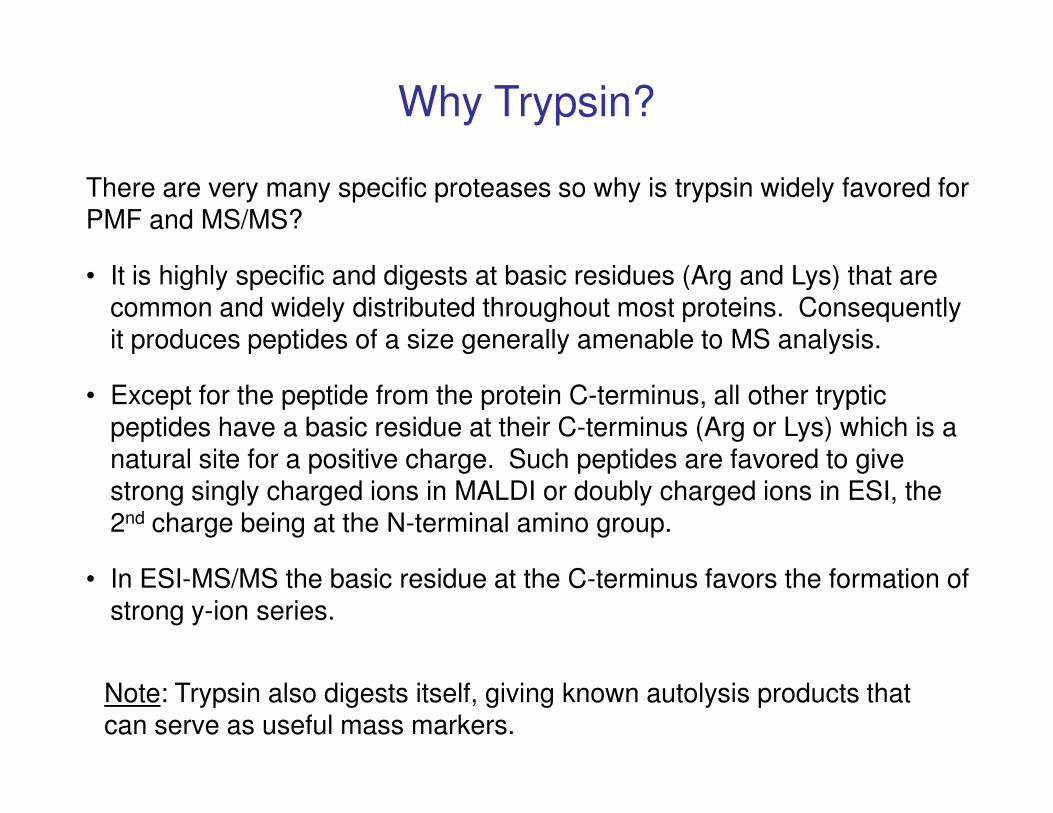
Why Trypsin?
There are very many specific proteases so why is trypsin widely favored for PMF and MS/MS?
• It is highly specific and digests at basic residues (Arg and Lys) that are common and widely distributed throughout most proteins. Consequently it produces peptides of a size generally amenable to MS analysis.
• Except for the peptide from the protein C-terminus, all other tryptic • Except for the peptide from the protein C-terminus, all other tryptic peptides have a basic residue at their C-terminus (Arg or Lys) which is a natural site for a positive charge. Such peptides are favored to give strong singly charged ions in MALDI or doubly charged ions in ESI, the 2nd charge being at the N-terminal amino group.
• In ESI-MS/MS the basic residue at the C-terminus favors the formation of strong y-ion series.
Note: Trypsin also digests itself, giving known autolysis products that can serve as useful mass markers.
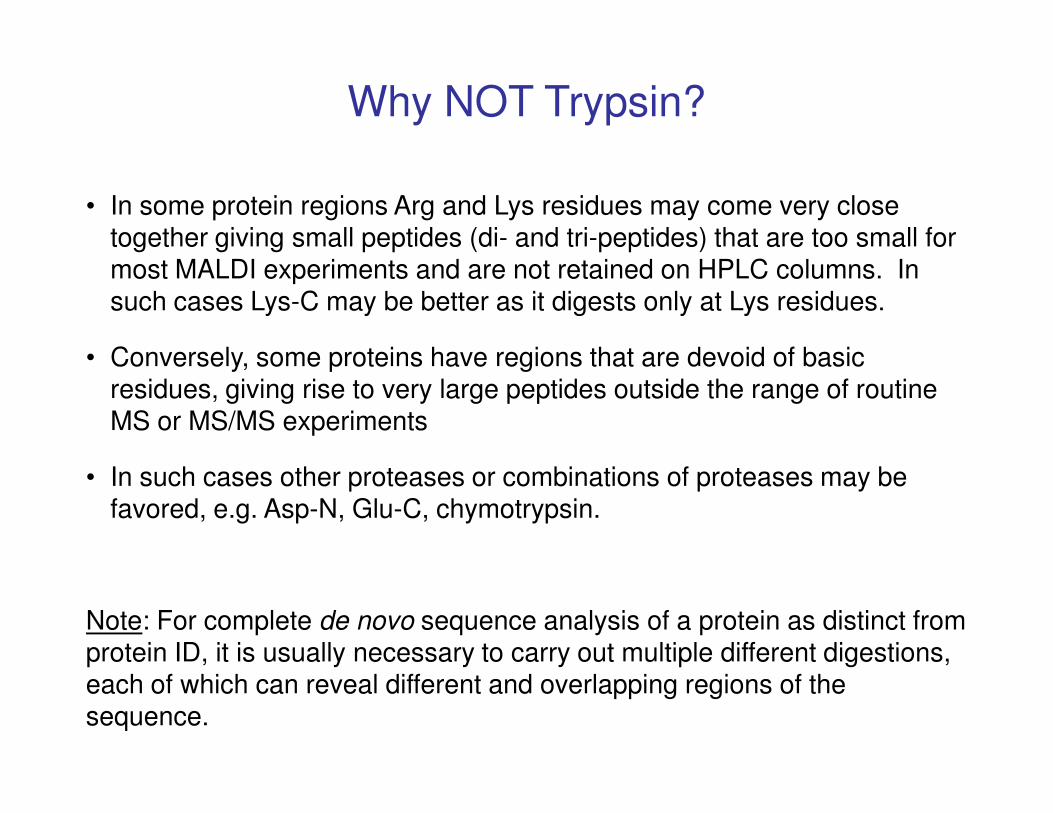
Why NOT Trypsin?
• In some protein regions Arg and Lys residues may come very close together giving small peptides (di- and tri-peptides) that are too small for most MALDI experiments and are not retained on HPLC columns. In such cases Lys-C may be better as it digests only at Lys residues.
• Conversely, some proteins have regions that are devoid of basic residues, giving rise to very large peptides outside the range of routine MS or MS/MS experimentsMS or MS/MS experiments
• In such cases other proteases or combinations of proteases may be favored, e.g. Asp-N, Glu-C, chymotrypsin.
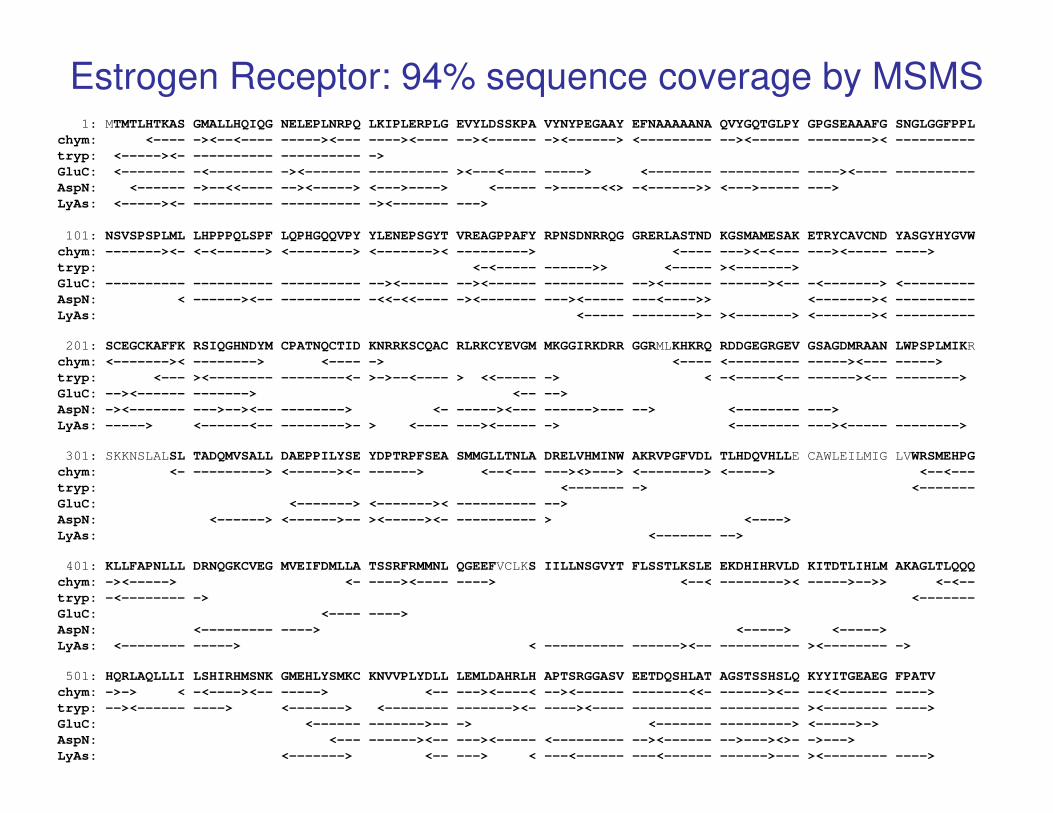
Note: For complete de novo sequence analysis of a protein as distinct from protein ID, it is usually necessary to carry out multiple different digestions, each of which can reveal different and overlapping regions of the sequence.
1: MTMTLHTKAS GMALLHQIQG NELEPLNRPQ LKIPLERPLG EVYLDSSKPA VYNYPEGAAY EFNAAAAANA QVYGQTGLPY GPGSEAAAFG SNGLGGFPPL
chym: <---- -><--<---- -----><--- ----><---- --><------ -><------> <--------- --><------ -------->< ----------
tryp: <-----><- ---------- ---------- ->
GluC: <-------- -<-------- -><------- ---------- ><---<---- -----> <-------- ---------- ----><---- ----------
AspN: <------ ->--<<---- --><-----> <--->----> <----- ->-----<<> -<------>> <--->----- --->
LyAs: <-----><- ---------- ---------- -><------- --->
101: NSVSPSPLML LHPPPQLSPF LQPHGQQVPY YLENEPSGYT VREAGPPAFY RPNSDNRRQG GRERLASTND KGSMAMESAK ETRYCAVCND YASGYHYGVW
chym: -------><- <-<------> <--------> <------->< ---------> <---- ---><-<--- ---><----- ---->
tryp: <-<----- ------>> <----- ><------->
GluC: ---------- ---------- ---------- --><------ --><------ ---------- --><------ ------><-- -<-------> <---------
AspN: < ------><-- ---------- -<<-<<---- -><------- ---><----- ---<---->> <------->< ----------
LyAs: <----- -------->- ><-------> <------->< ----------
201: SCEGCKAFFK RSIQGHNDYM CPATNQCTID KNRRKSCQAC RLRKCYEVGM MKGGIRKDRR GGRMLKHKRQ RDDGEGRGEV GSAGDMRAAN LWPSPLMIKR
chym: <------->< --------> <---- -> <---- <--------- -----><--- ----->
tryp: <--- ><-------- --------<- >->--<---- > <<----- -> < -<-----<-- ------><-- -------->
GluC: --><------ -------> <-- -->
AspN: -><------- --->--><-- --------> <- -----><--- ------>--- --> <-------- --->
Estrogen Receptor: 94% sequence coverage by MSMS
AspN: -><------- --->--><-- --------> <- -----><--- ------>--- --> <-------- --->
LyAs: -----> <------<-- -------->- > <---- ---><----- -> <-------- ---><----- -------->
301: SKKNSLALSL TADQMVSALL DAEPPILYSE YDPTRPFSEA SMMGLLTNLA DRELVHMINW AKRVPGFVDL TLHDQVHLLE CAWLEILMIG LVWRSMEHPG
chym: <- ---------> <------><- ------> <--<--- ---><>---> <--------> <-----> <--<---
tryp: <------- -> <-------
GluC: <-------> <------->< ---------- -->
AspN: <------> <------>-- ><-----><- ---------- > <---->
LyAs: <------- -->
401: KLLFAPNLLL DRNQGKCVEG MVEIFDMLLA TSSRFRMMNL QGEEFVCLKS IILLNSGVYT FLSSTLKSLE EKDHIHRVLD KITDTLIHLM AKAGLTLQQQ
chym: -><-----> <- ----><---- ----> <--< -------->< ----->-->> <-<--
tryp: -<-------- -> <-------
GluC: <---- ---->
AspN: <--------- ----> <-----> <----->
LyAs: <-------- -----> < ---------- ------><-- ---------- ><-------- ->
501: HQRLAQLLLI LSHIRHMSNK GMEHLYSMKC KNVVPLYDLL LEMLDAHRLH APTSRGGASV EETDQSHLAT AGSTSSHSLQ KYYITGEAEG FPATV
chym: ->-> < -<----><-- -----> <-- ---><----< --><------ -------<<- ------><-- --<<------ ---->
tryp: --><------ ----> <-------> <-------- -------><- ----><---- ---------- ---------- ><-------- ---->
GluC: <------ ------->-- -> <------- ---------> <----->->
AspN: <--- ------><-- ---><----- <--------- --><------ -->---><>- ->--->
LyAs: <-------> <-- ---> < ---<------ ---<------ ------>--- ><-------- ---->
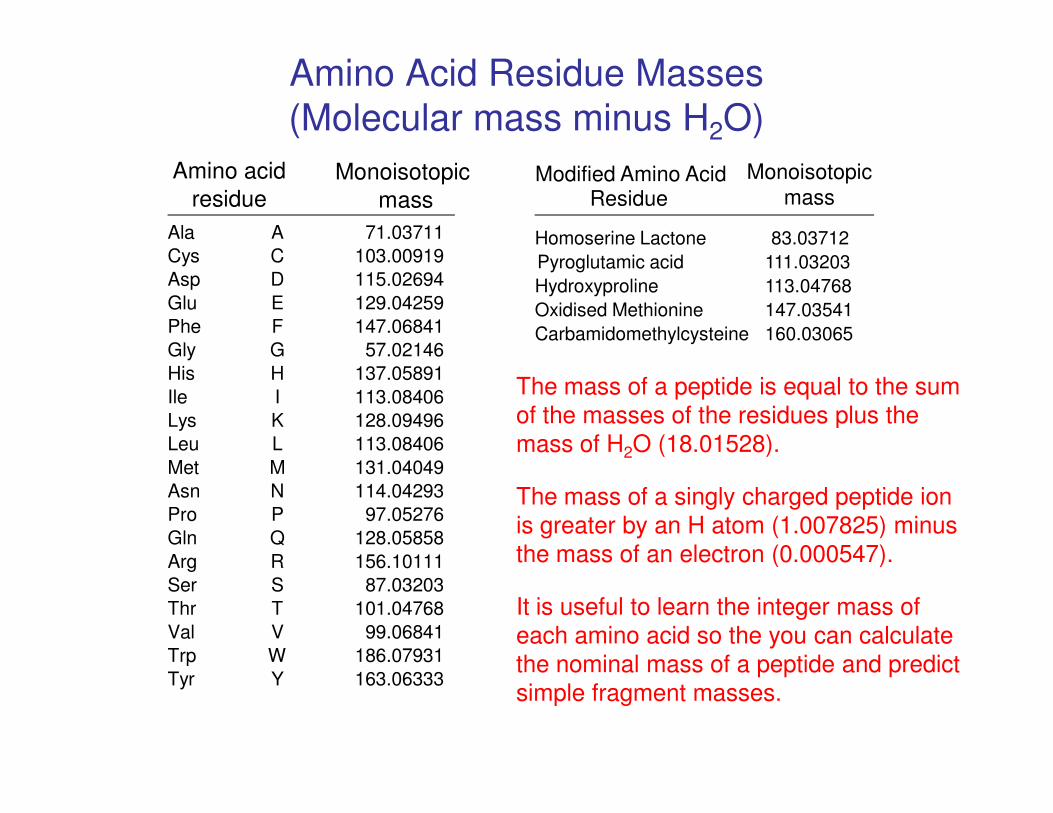
Amino Acid Residue Masses
(Molecular mass minus H2O)
Monoisotopic
mass
Ala A 71.03711
Cys C 103.00919
Asp D 115.02694
Glu E 129.04259
Phe F 147.06841
Gly G 57.02146
His H 137.05891
Ile I 113.08406
Amino acid
residue
The mass of a peptide is equal to the sum
of the masses of the residues plus the
Modified Amino AcidResidue
Monoisotopic
mass
Homoserine Lactone 83.03712
Pyroglutamic acid 111.03203
Hydroxyproline 113.04768
Oxidised Methionine 147.03541
Carbamidomethylcysteine 160.03065
Ile I 113.08406
Lys K 128.09496
Leu L 113.08406
Met M 131.04049
Asn N 114.04293
Pro P 97.05276
Gln Q 128.05858
Arg R 156.10111
Ser S 87.03203
Thr T 101.04768
Val V 99.06841
Trp W 186.07931
Tyr Y 163.06333
of the masses of the residues plus the
mass of H2O (18.01528).
The mass of a singly charged peptide ion
is greater by an H atom (1.007825) minus
the mass of an electron (0.000547).
It is useful to learn the integer mass of
each amino acid so the you can calculate
the nominal mass of a peptide and predict
simple fragment masses.
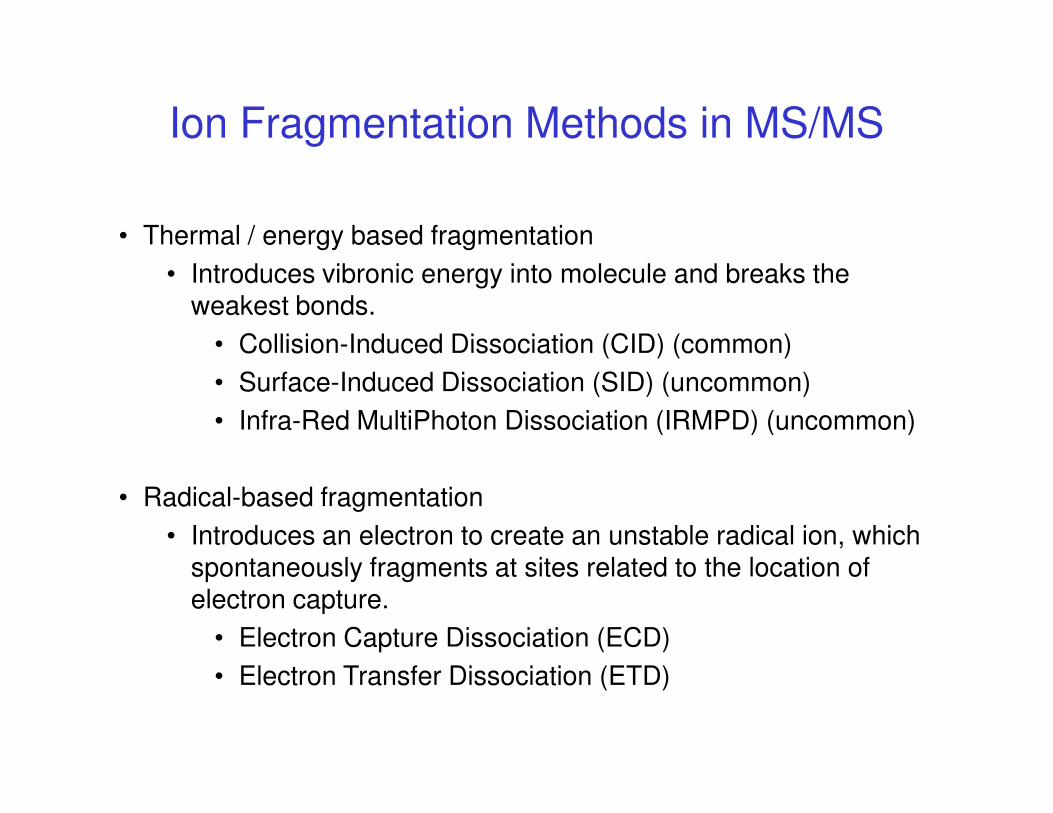
Ion Fragmentation Methods in MS/MS
• Thermal / energy based fragmentation
• Introduces vibronic energy into molecule and breaks the weakest bonds.
• Collision-Induced Dissociation (CID) (common)
• Surface-Induced Dissociation (SID) (uncommon)
• Infra-Red MultiPhoton Dissociation (IRMPD) (uncommon)• Infra-Red MultiPhoton Dissociation (IRMPD) (uncommon)
• Radical-based fragmentation
• Introduces an electron to create an unstable radical ion, which spontaneously fragments at sites related to the location of electron capture.
• Electron Capture Dissociation (ECD)
• Electron Transfer Dissociation (ETD)
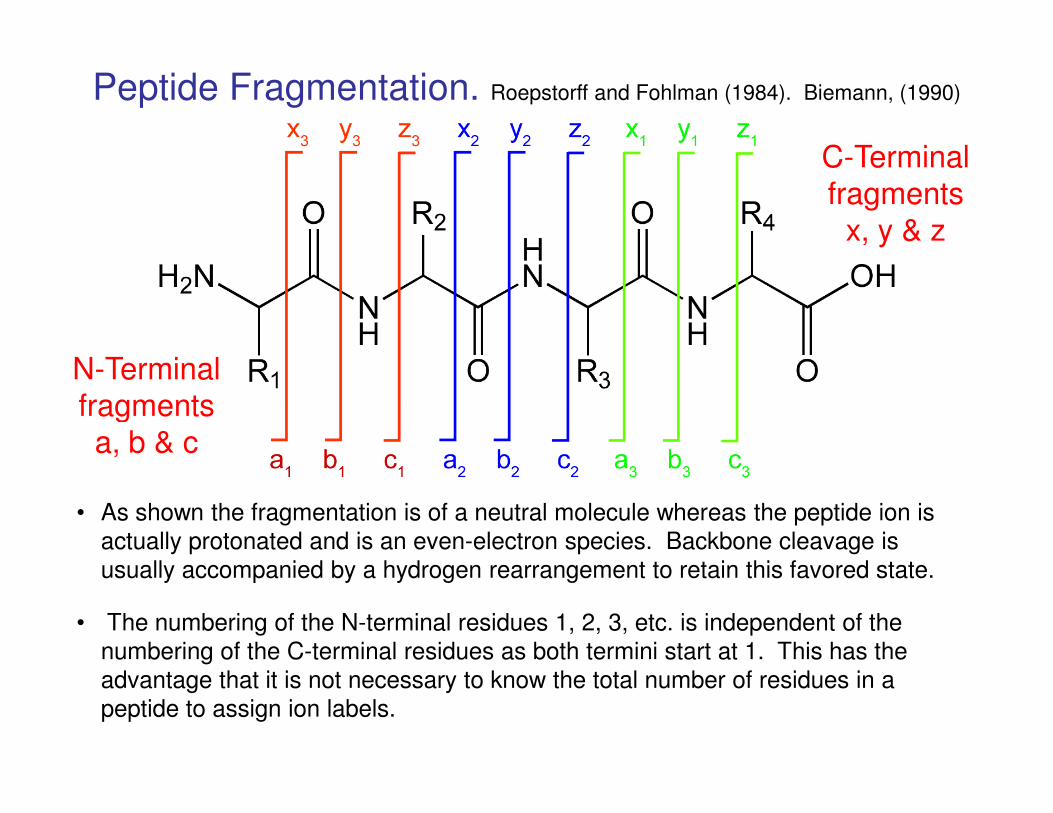
N-Terminal fragments
C-Terminal fragments
x, y & z
Peptide Fragmentation. Roepstorff and Fohlman (1984). Biemann, (1990)
fragmentsa, b & c
• As shown the fragmentation is of a neutral molecule whereas the peptide ion is
actually protonated and is an even-electron species. Backbone cleavage is
usually accompanied by a hydrogen rearrangement to retain this favored state.
• The numbering of the N-terminal residues 1, 2, 3, etc. is independent of the
numbering of the C-terminal residues as both termini start at 1. This has the
advantage that it is not necessary to know the total number of residues in a
peptide to assign ion labels.
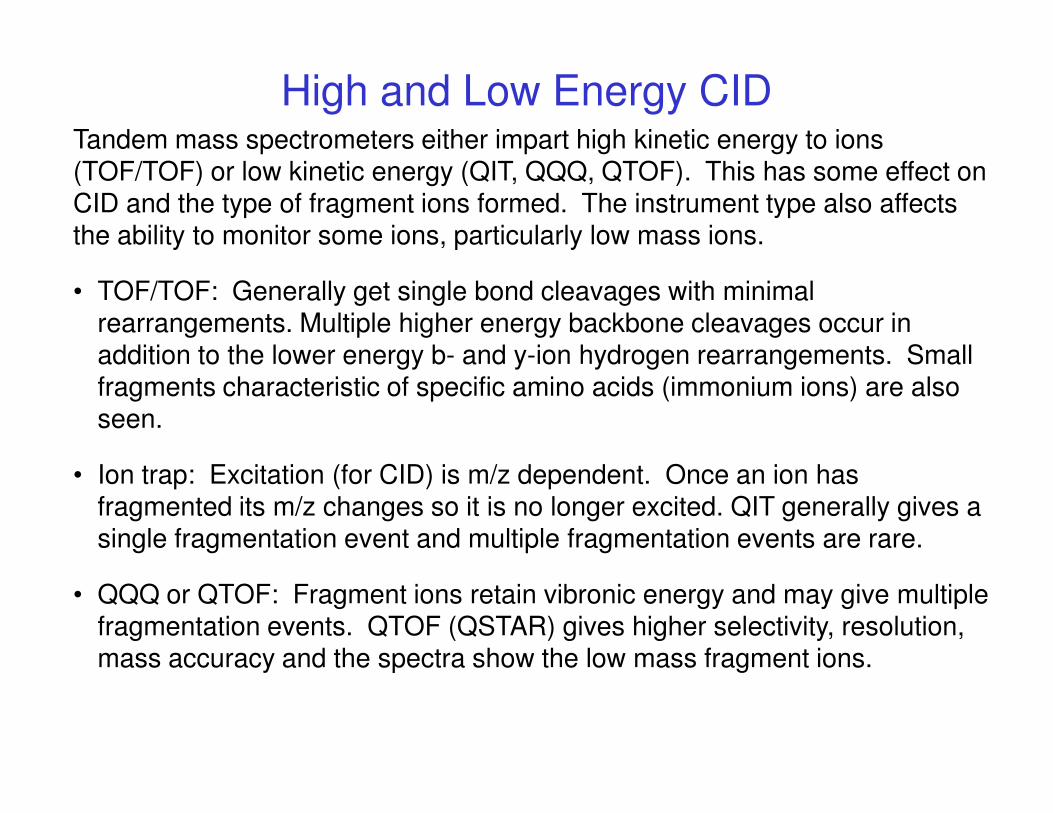
High and Low Energy CIDTandem mass spectrometers either impart high kinetic energy to ions (TOF/TOF) or low kinetic energy (QIT, QQQ, QTOF). This has some effect on CID and the type of fragment ions formed. The instrument type also affects the ability to monitor some ions, particularly low mass ions.
• TOF/TOF: Generally get single bond cleavages with minimal rearrangements. Multiple higher energy backbone cleavages occur in addition to the lower energy b- and y-ion hydrogen rearrangements. Small fragments characteristic of specific amino acids (immonium ions) are also seen.seen.
• Ion trap: Excitation (for CID) is m/z dependent. Once an ion has fragmented its m/z changes so it is no longer excited. QIT generally gives a single fragmentation event and multiple fragmentation events are rare.
• QQQ or QTOF: Fragment ions retain vibronic energy and may give multiple fragmentation events. QTOF (QSTAR) gives higher selectivity, resolution, mass accuracy and the spectra show the low mass fragment ions.
NH2- C---C---N---C---C N---C---C N---C CO2HH H H H H H H
R4R3 OOR2R1 OC-Terminal
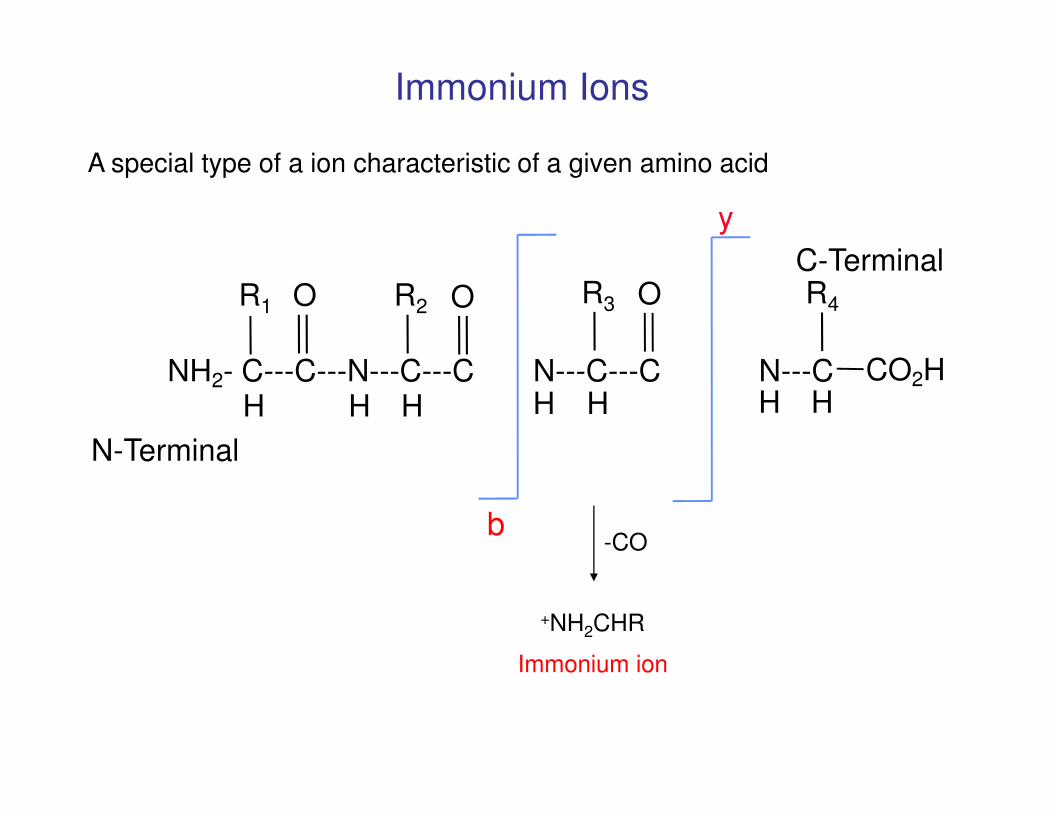
Immonium Ions
A special type of a ion characteristic of a given amino acid
y
H H H H H H H
b
N-Terminal
-CO
+NH2CHR
Immonium ion
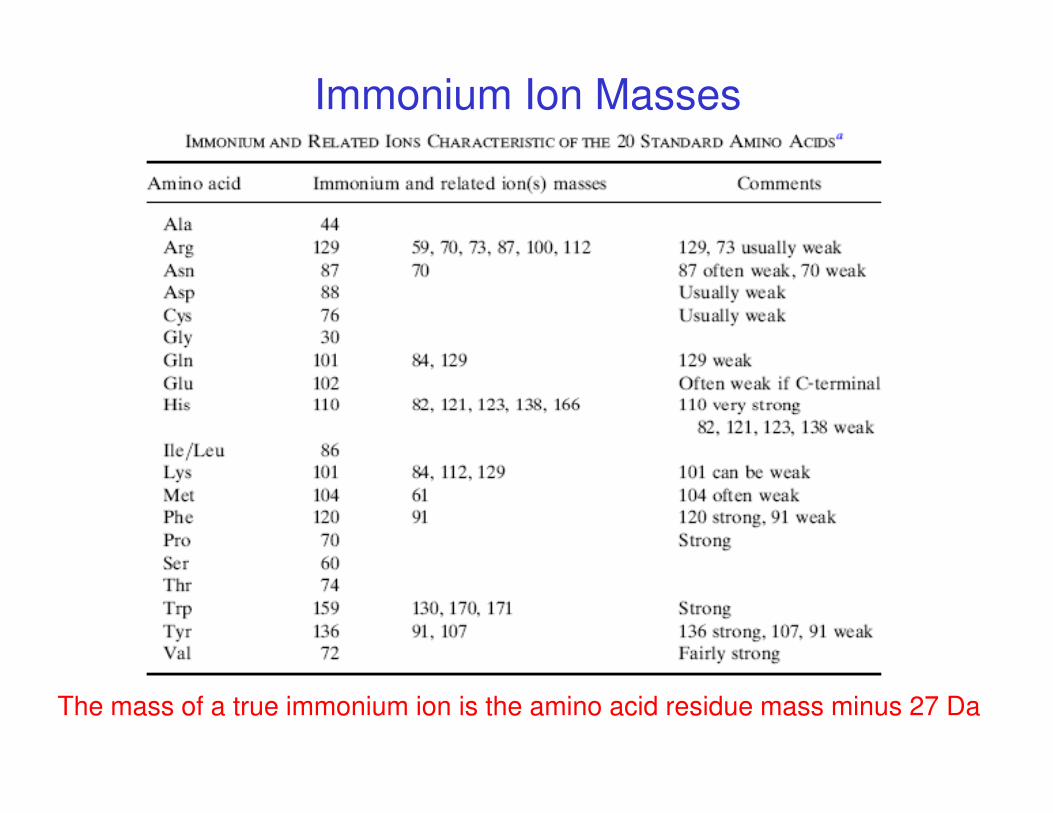
Immonium Ion Masses
The mass of a true immonium ion is the amino acid residue mass minus 27 Da
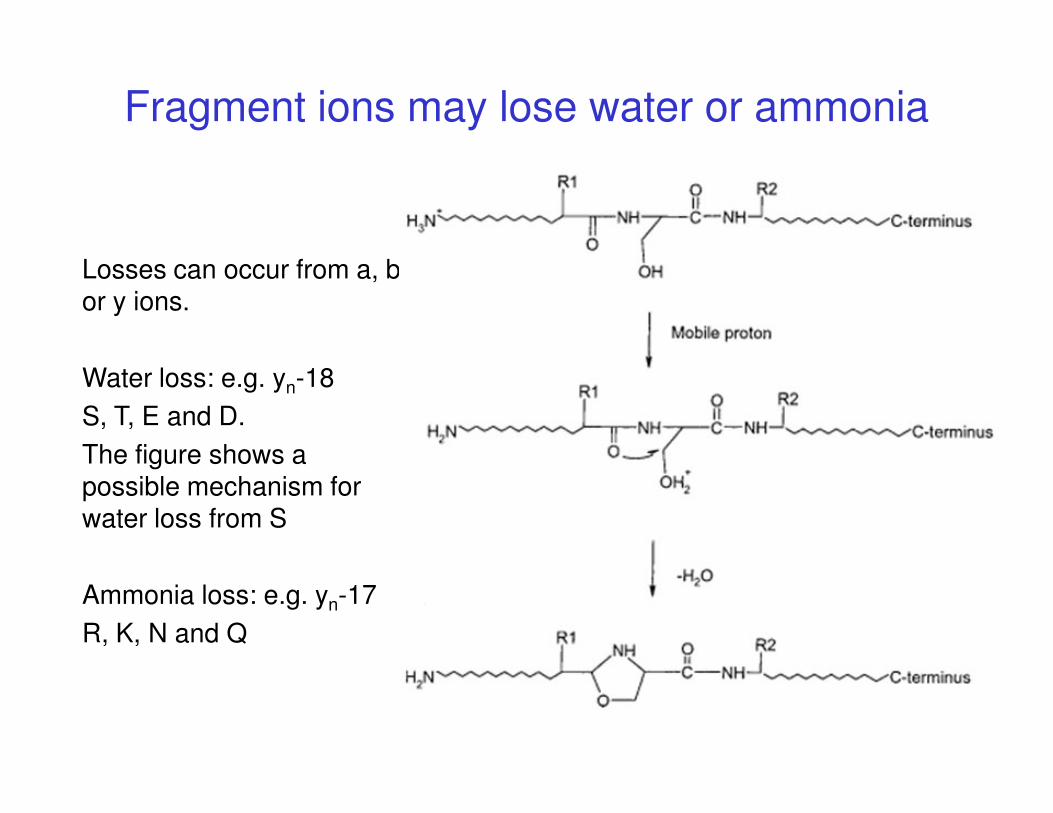
Fragment ions may lose water or ammonia
Losses can occur from a, b or y ions.
Water loss: e.g. yn-18
S, T, E and D.S, T, E and D.
The figure shows a possible mechanism for water loss from S
Ammonia loss: e.g. yn-17
R, K, N and Q
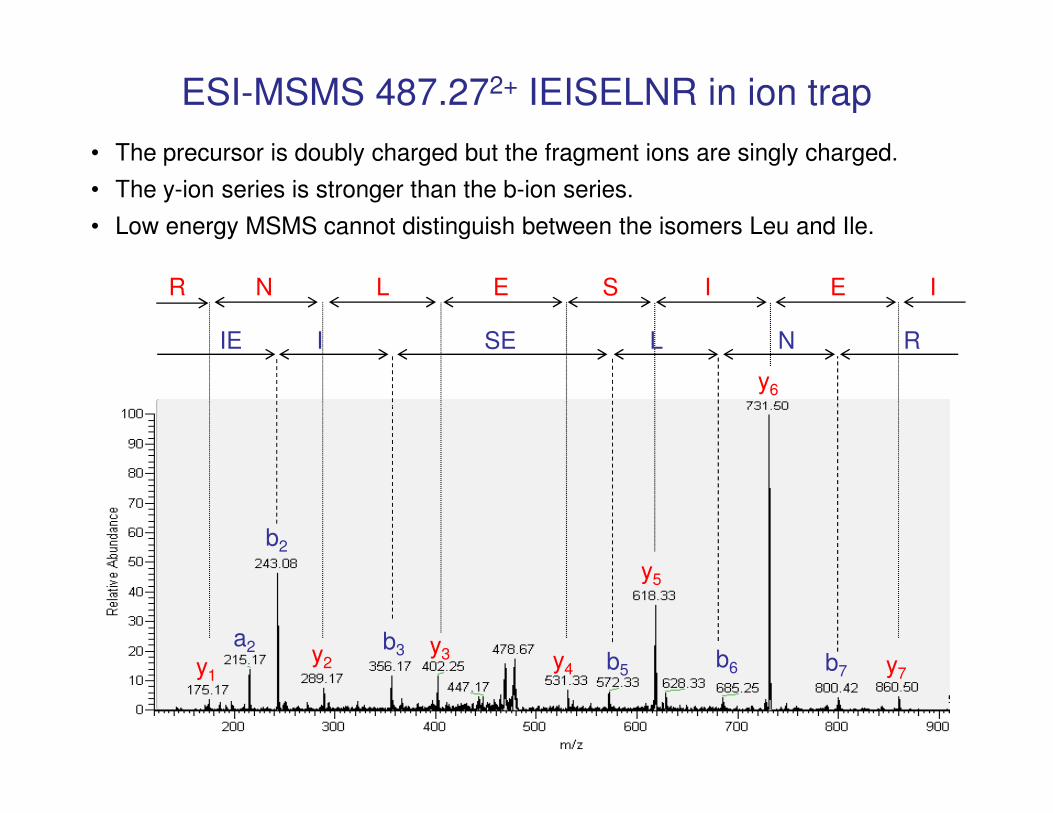
ESI-MSMS 487.272+ IEISELNR in ion trap
y6
IE I SE L N R
R N L E S I E I
• The precursor is doubly charged but the fragment ions are singly charged.
• The y-ion series is stronger than the b-ion series.
• Low energy MSMS cannot distinguish between the isomers Leu and Ile.
y7
y5
y4
y3y2y1
b2
a2 b3b5
b6 b7
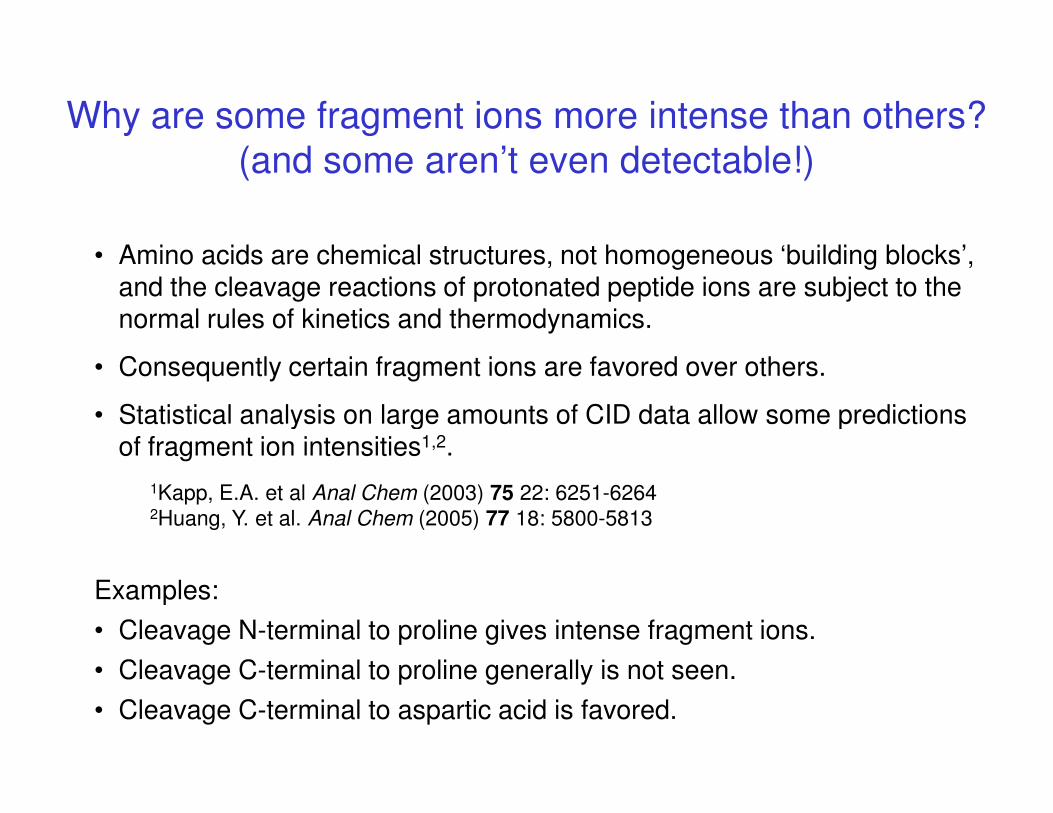
Why are some fragment ions more intense than others?
(and some aren’t even detectable!)
• Amino acids are chemical structures, not homogeneous ‘building blocks’, and the cleavage reactions of protonated peptide ions are subject to the normal rules of kinetics and thermodynamics.
• Consequently certain fragment ions are favored over others.
• Statistical analysis on large amounts of CID data allow some predictions • Statistical analysis on large amounts of CID data allow some predictions of fragment ion intensities1,2.
Examples:
• Cleavage N-terminal to proline gives intense fragment ions.
• Cleavage C-terminal to proline generally is not seen.
• Cleavage C-terminal to aspartic acid is favored.
1Kapp, E.A. et al Anal Chem (2003) 75 22: 6251-62642Huang, Y. et al. Anal Chem (2005) 77 18: 5800-5813
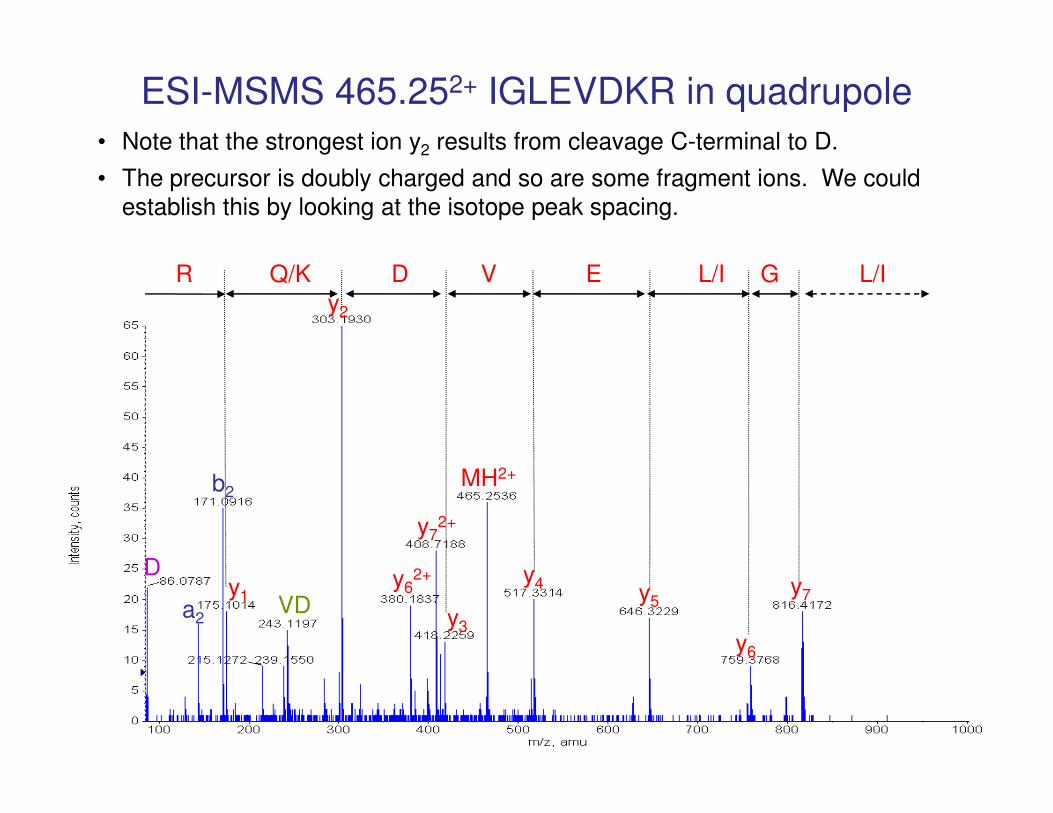
ESI-MSMS 465.252+ IGLEVDKR in quadrupole
R Q/K D V E L/I G L/I
y2
• Note that the strongest ion y2 results from cleavage C-terminal to D.
• The precursor is doubly charged and so are some fragment ions. We could
establish this by looking at the isotope peak spacing.
y7y4
y6
y5
MH2+
y3
y72+
y62+
y1
b2
D
a2VD
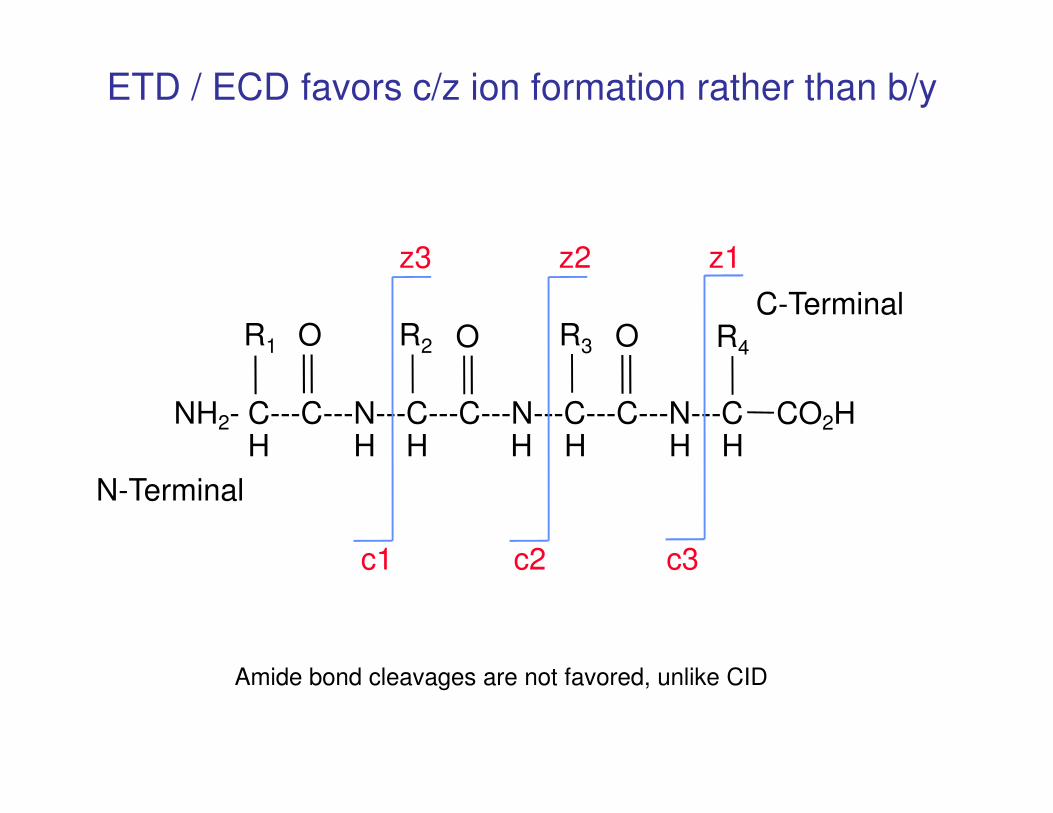
NH - C---C---N---C---C---N---C---C---N---C CO H
R4R3 OOR2R1 O
z1z2z3
C-Terminal
ETD / ECD favors c/z ion formation rather than b/y
NH2- C---C---N---C---C---N---C---C---N---C CO2HH H H H H H H
c3c2c1
N-Terminal
Amide bond cleavages are not favored, unlike CID
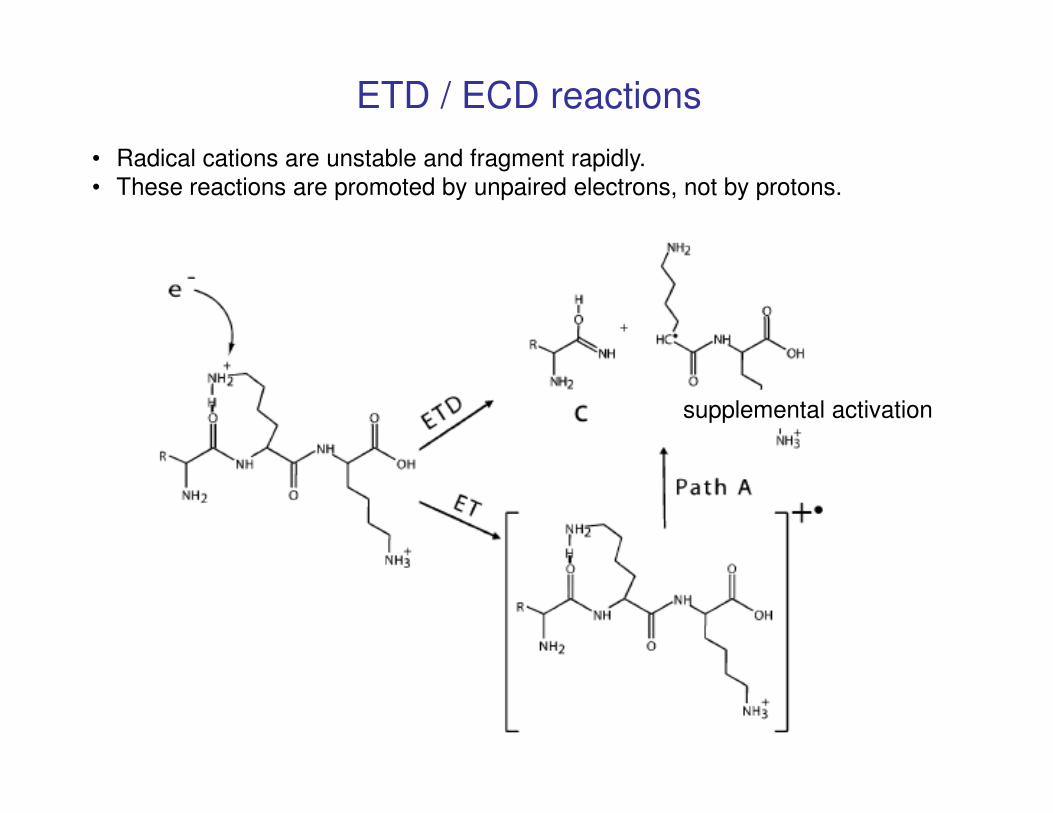
supplemental activation
ETD / ECD reactions
• Radical cations are unstable and fragment rapidly.
• These reactions are promoted by unpaired electrons, not by protons.
supplemental activation
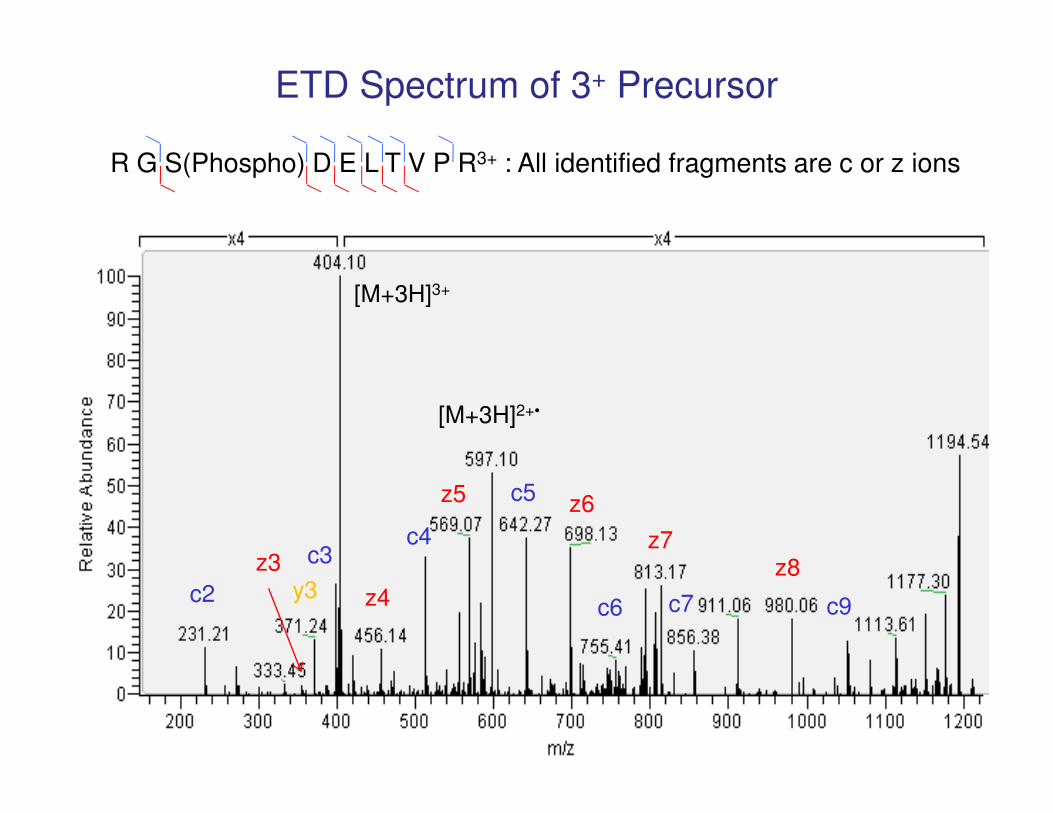
[M+3H]3+
[M+3H]2+•
R G S(Phospho) D E L T V P R3+ : All identified fragments are c or z ions
ETD Spectrum of 3+ Precursor
c2
c3c4
c5
c6 c7 c9
z8z7
z6z5
z3
z4y3
[M+3H]2+•
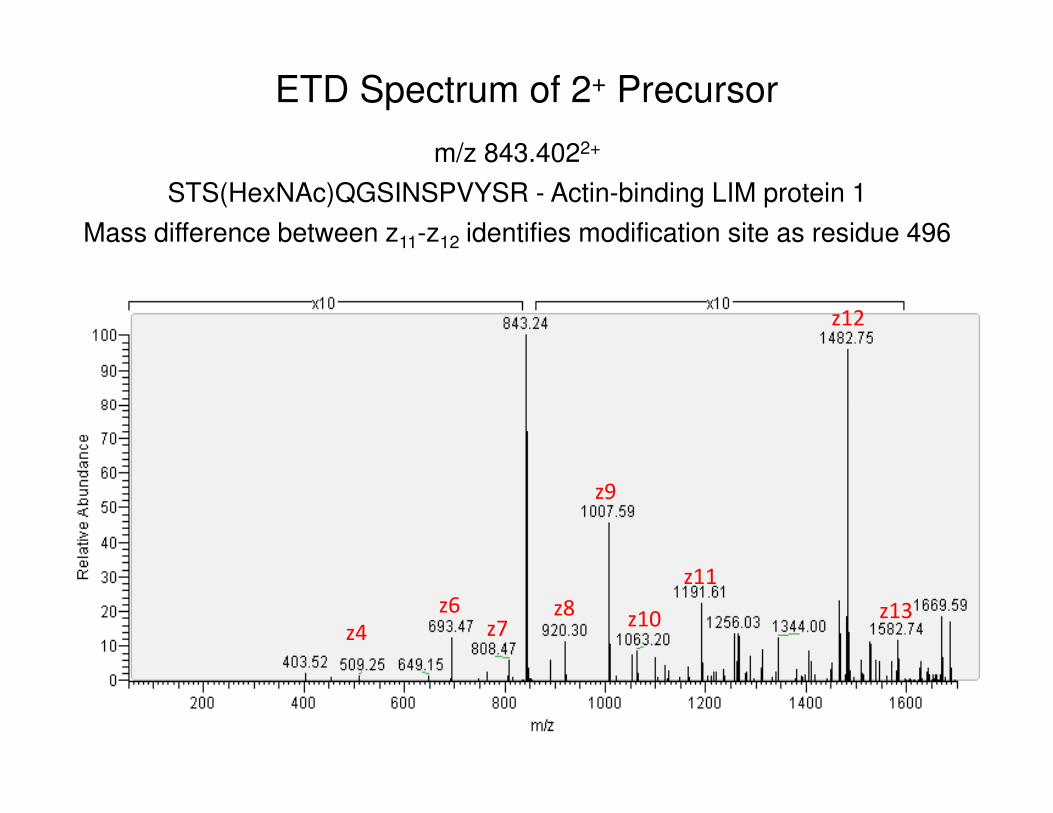
m/z 843.4022+
STS(HexNAc)QGSINSPVYSR - Actin-binding LIM protein 1
Mass difference between z11-z12 identifies modification site as residue 496
z12
ETD Spectrum of 2+ Precursor
z4
z6 z8z10
z9
z11
z13z7
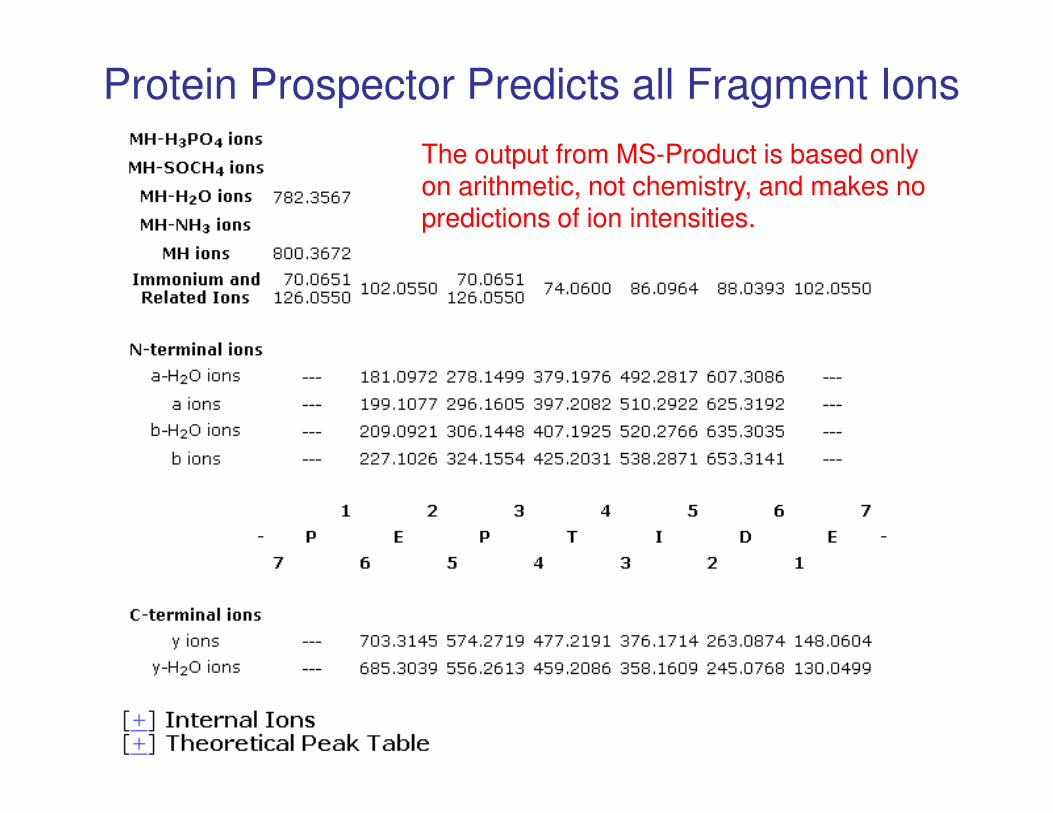
Protein Prospector Predicts all Fragment Ions
The output from MS-Product is based only on arithmetic, not chemistry, and makes no predictions of ion intensities.
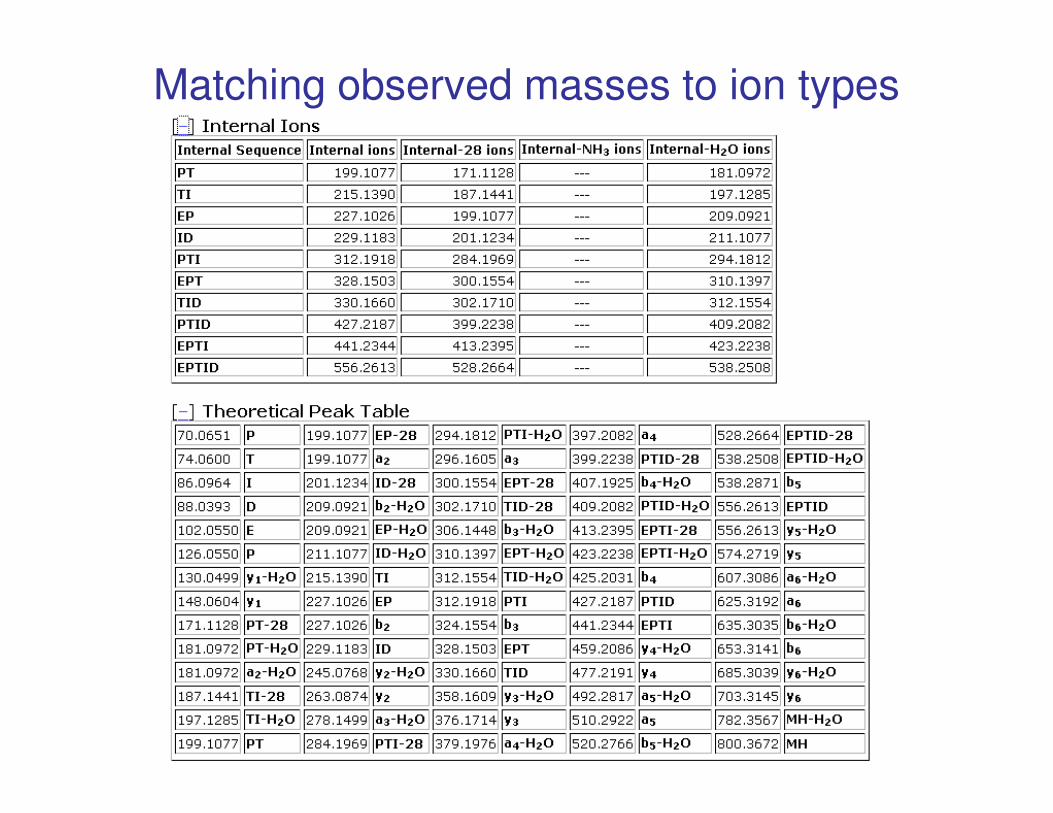
Matching observed masses to ion types
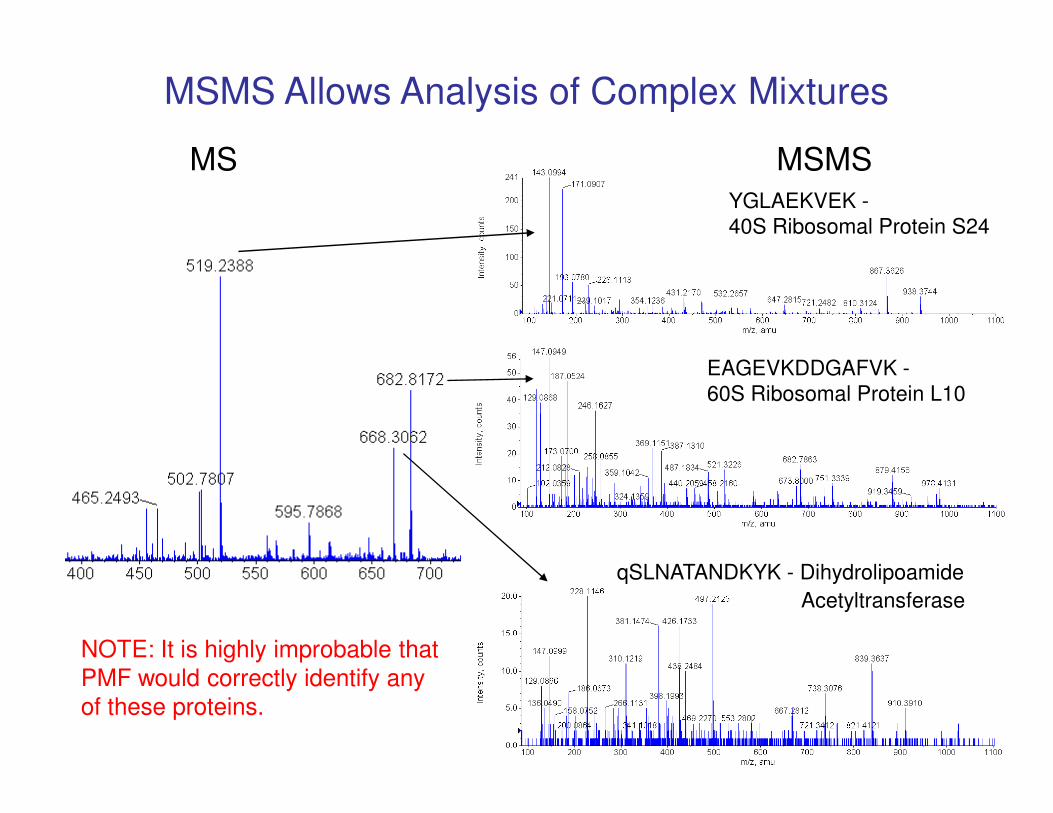
EAGEVKDDGAFVK -
60S Ribosomal Protein L10
YGLAEKVEK -
40S Ribosomal Protein S24
MS MSMS
MSMS Allows Analysis of Complex Mixtures
qSLNATANDKYK - Dihydrolipoamide
Acetyltransferase
NOTE: It is highly improbable that
PMF would correctly identify any
of these proteins.
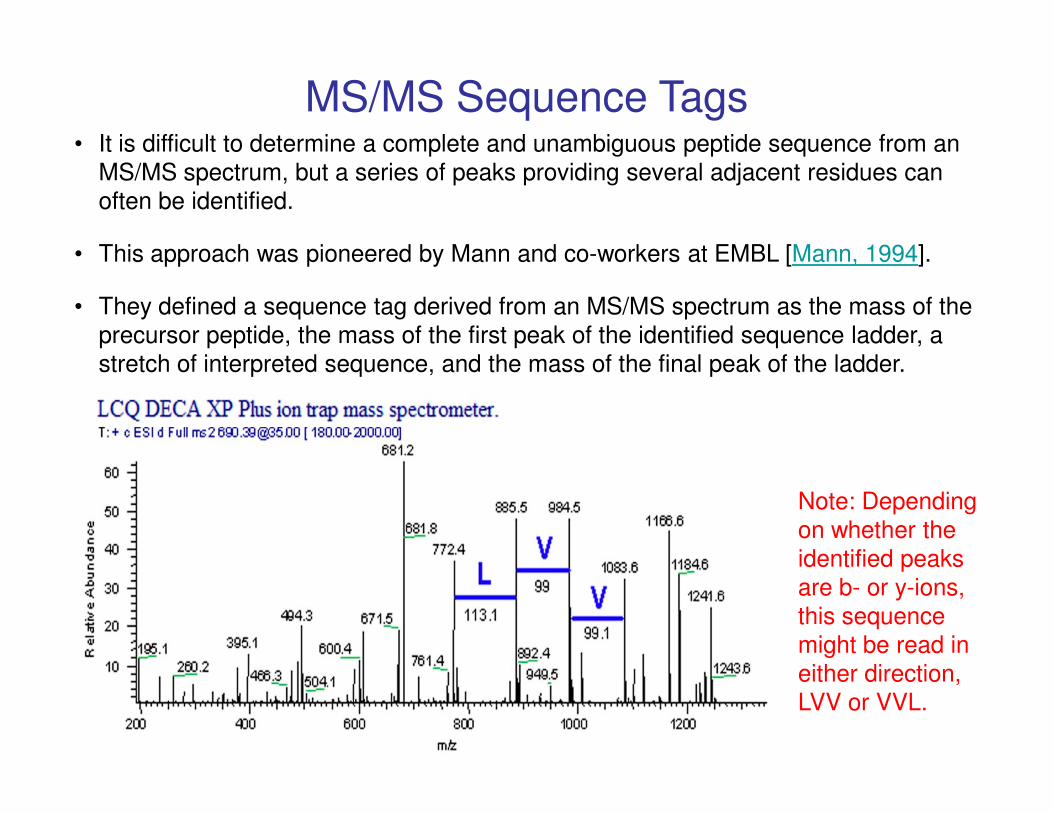
• It is difficult to determine a complete and unambiguous peptide sequence from an
MS/MS spectrum, but a series of peaks providing several adjacent residues can
often be identified.
• This approach was pioneered by Mann and co-workers at EMBL [Mann, 1994].
• They defined a sequence tag derived from an MS/MS spectrum as the mass of the
precursor peptide, the mass of the first peak of the identified sequence ladder, a
stretch of interpreted sequence, and the mass of the final peak of the ladder.
MS/MS Sequence Tags
Note: Depending
on whether the
identified peaks
are b- or y-ions,
this sequence
might be read in
either direction,
LVV or VVL.
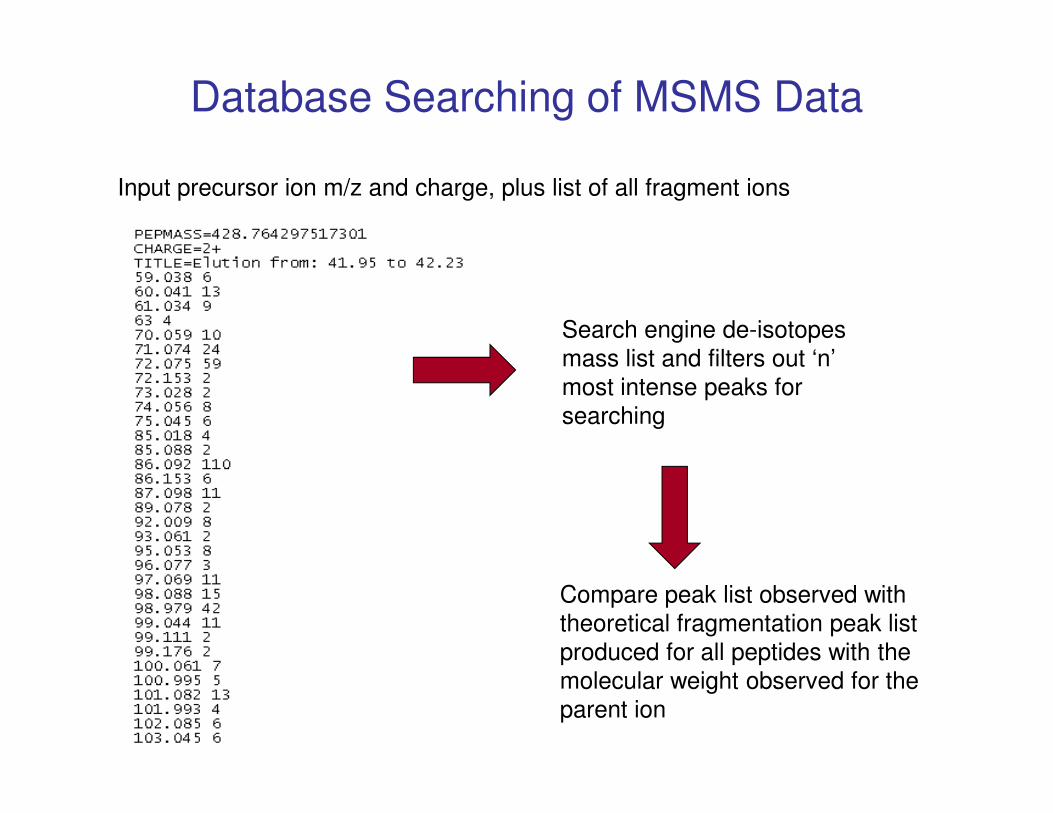
Database Searching of MSMS Data
Input precursor ion m/z and charge, plus list of all fragment ions
Search engine de-isotopes
mass list and filters out ‘n’
most intense peaks for
searchingsearching
Compare peak list observed with
theoretical fragmentation peak list
produced for all peptides with the
molecular weight observed for the
parent ion
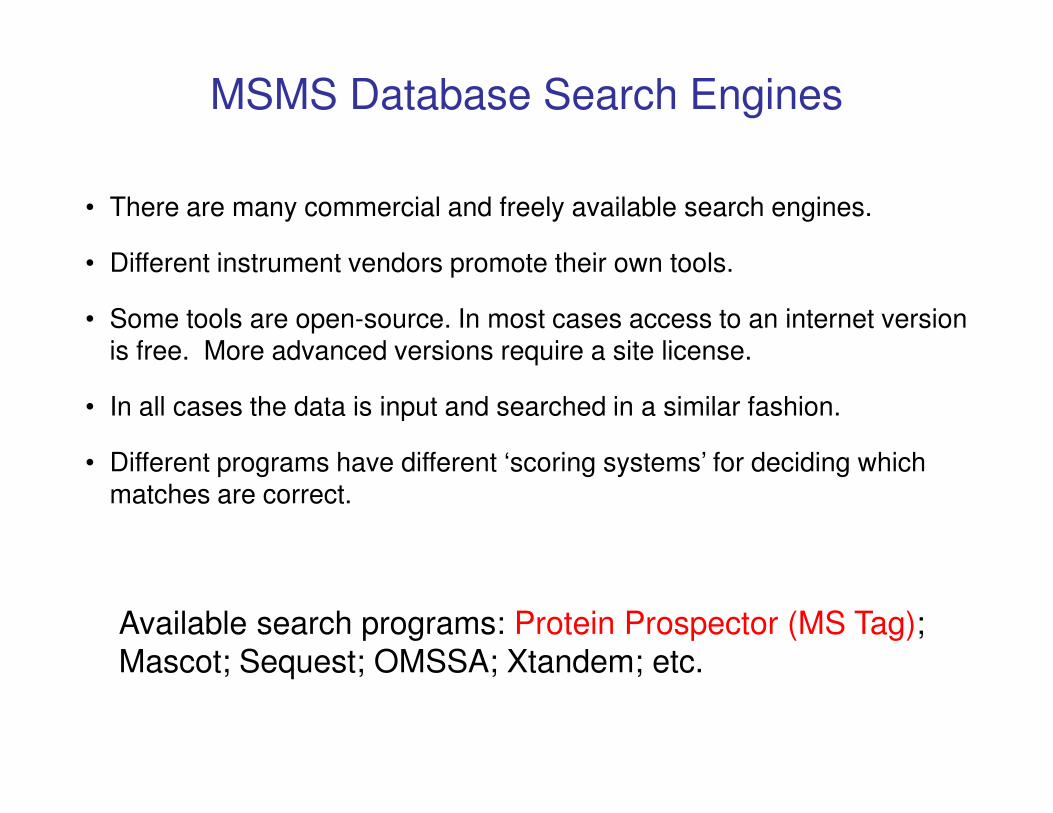
MSMS Database Search Engines
• There are many commercial and freely available search engines.
• Different instrument vendors promote their own tools.
• Some tools are open-source. In most cases access to an internet version is free. More advanced versions require a site license.
• In all cases the data is input and searched in a similar fashion.• In all cases the data is input and searched in a similar fashion.
• Different programs have different ‘scoring systems’ for deciding which matches are correct.
Available search programs: Protein Prospector (MS Tag);
Mascot; Sequest; OMSSA; Xtandem; etc.
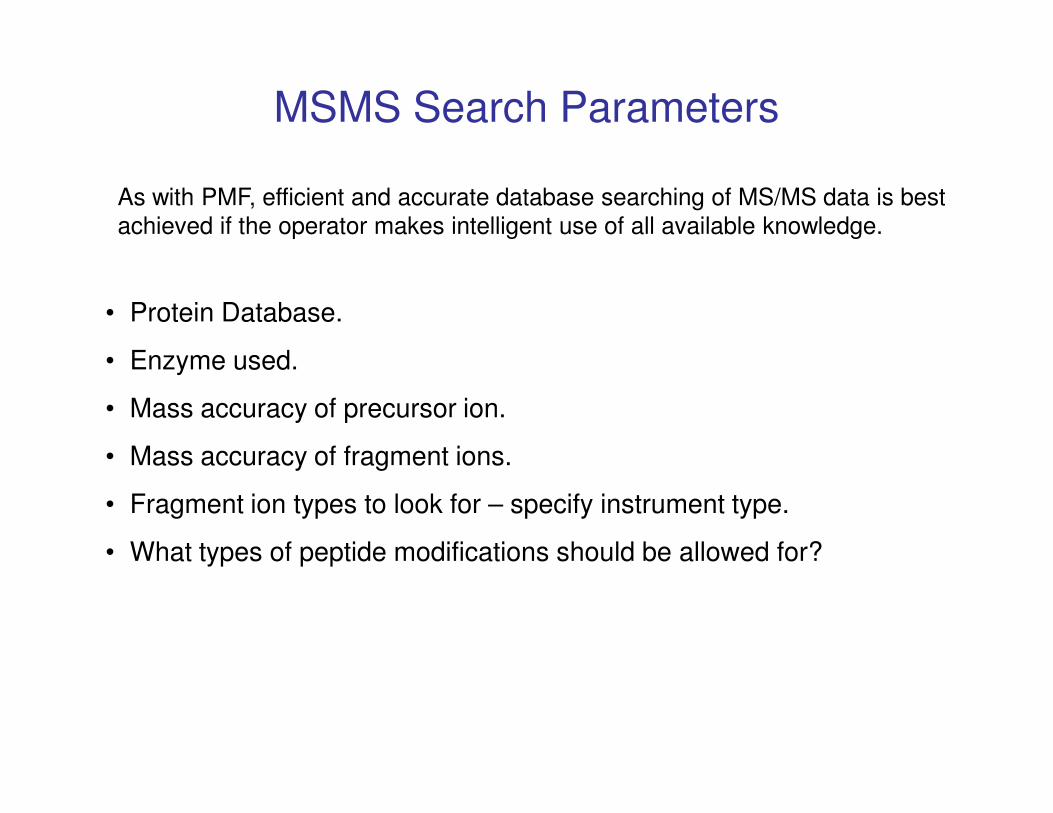
MSMS Search Parameters
• Protein Database.
• Enzyme used.
• Mass accuracy of precursor ion.
As with PMF, efficient and accurate database searching of MS/MS data is best
achieved if the operator makes intelligent use of all available knowledge.
• Mass accuracy of precursor ion.
• Mass accuracy of fragment ions.
• Fragment ion types to look for – specify instrument type.
• What types of peptide modifications should be allowed for?
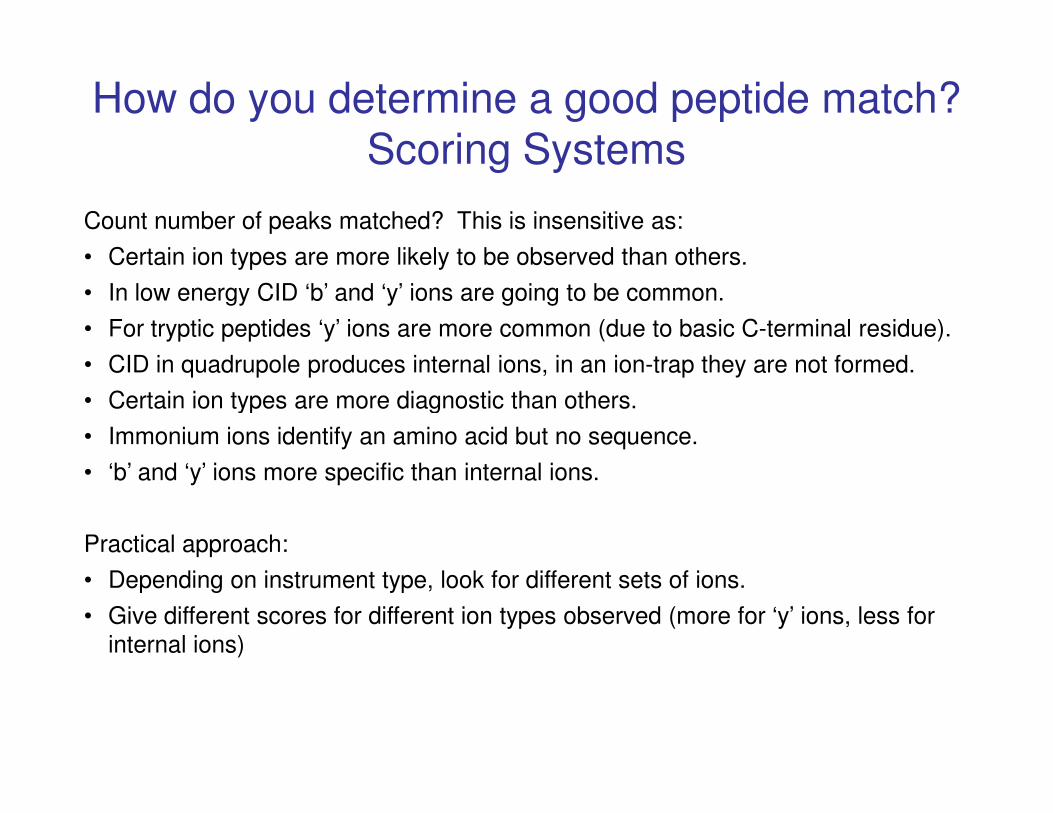
How do you determine a good peptide match?Scoring Systems
Count number of peaks matched? This is insensitive as:
• Certain ion types are more likely to be observed than others.
• In low energy CID ‘b’ and ‘y’ ions are going to be common.
• For tryptic peptides ‘y’ ions are more common (due to basic C-terminal residue).
• CID in quadrupole produces internal ions, in an ion-trap they are not formed.
• Certain ion types are more diagnostic than others.• Certain ion types are more diagnostic than others.
• Immonium ions identify an amino acid but no sequence.
• ‘b’ and ‘y’ ions more specific than internal ions.
Practical approach:
• Depending on instrument type, look for different sets of ions.
• Give different scores for different ion types observed (more for ‘y’ ions, less for
internal ions)
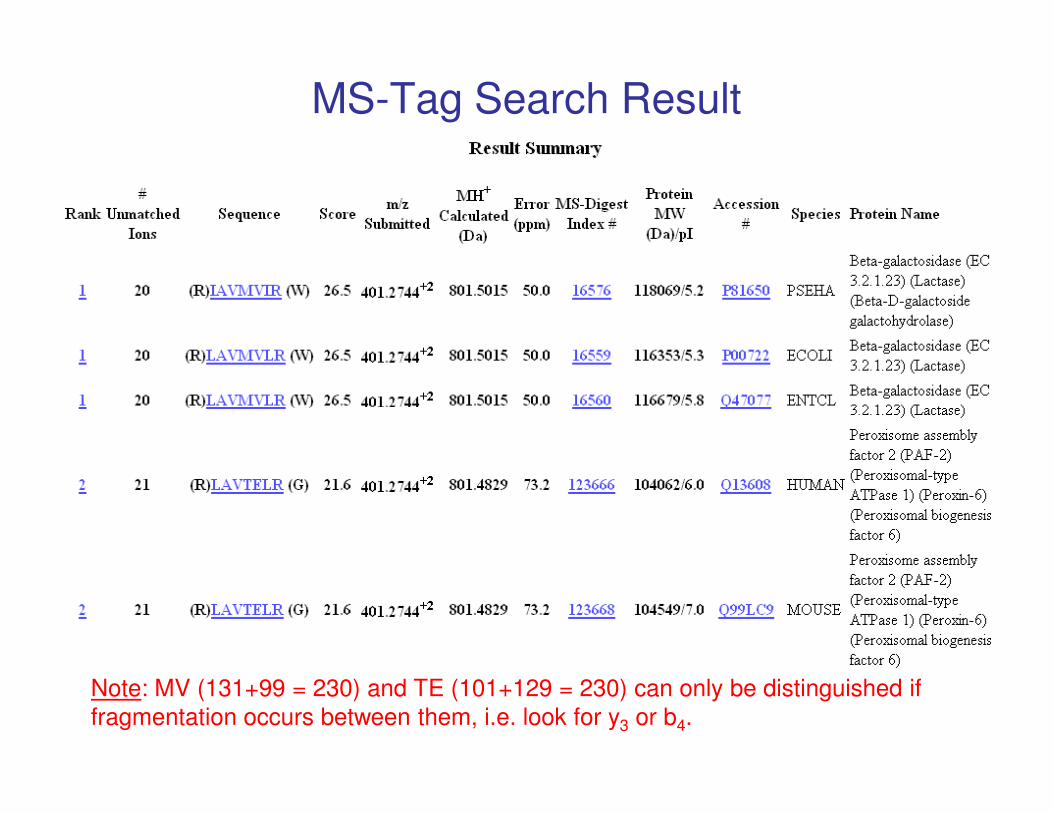
MS-Tag Search Result
Note: MV (131+99 = 230) and TE (101+129 = 230) can only be distinguished if
fragmentation occurs between them, i.e. look for y3 or b4.
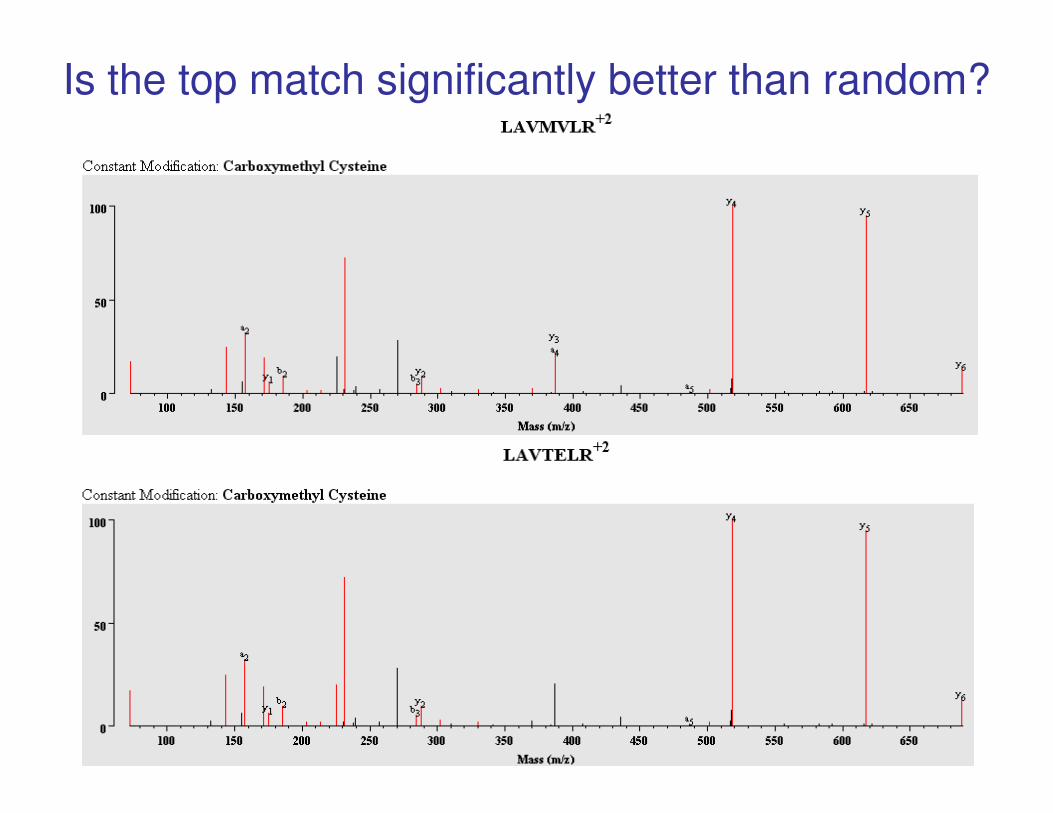
Is the top match significantly better than random?
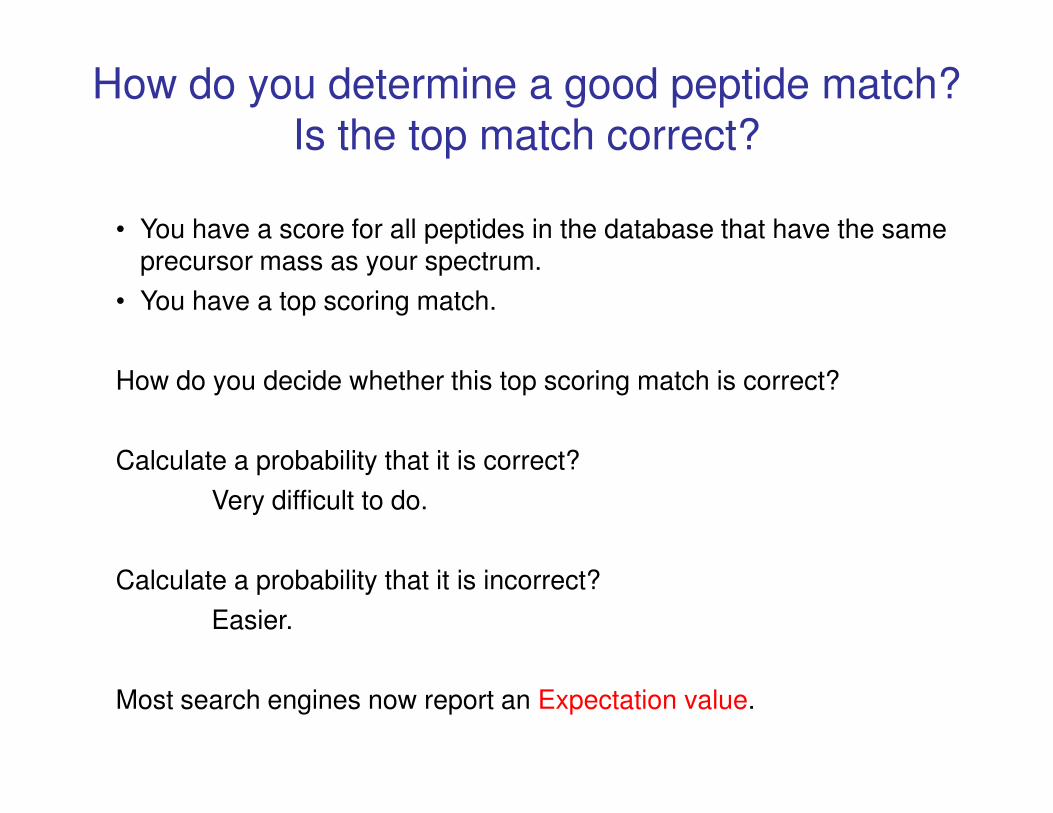
How do you determine a good peptide match?Is the top match correct?
• You have a score for all peptides in the database that have the same precursor mass as your spectrum.
• You have a top scoring match.
How do you decide whether this top scoring match is correct?
Calculate a probability that it is correct?
Very difficult to do.
Calculate a probability that it is incorrect?
Easier.
Most search engines now report an Expectation value.
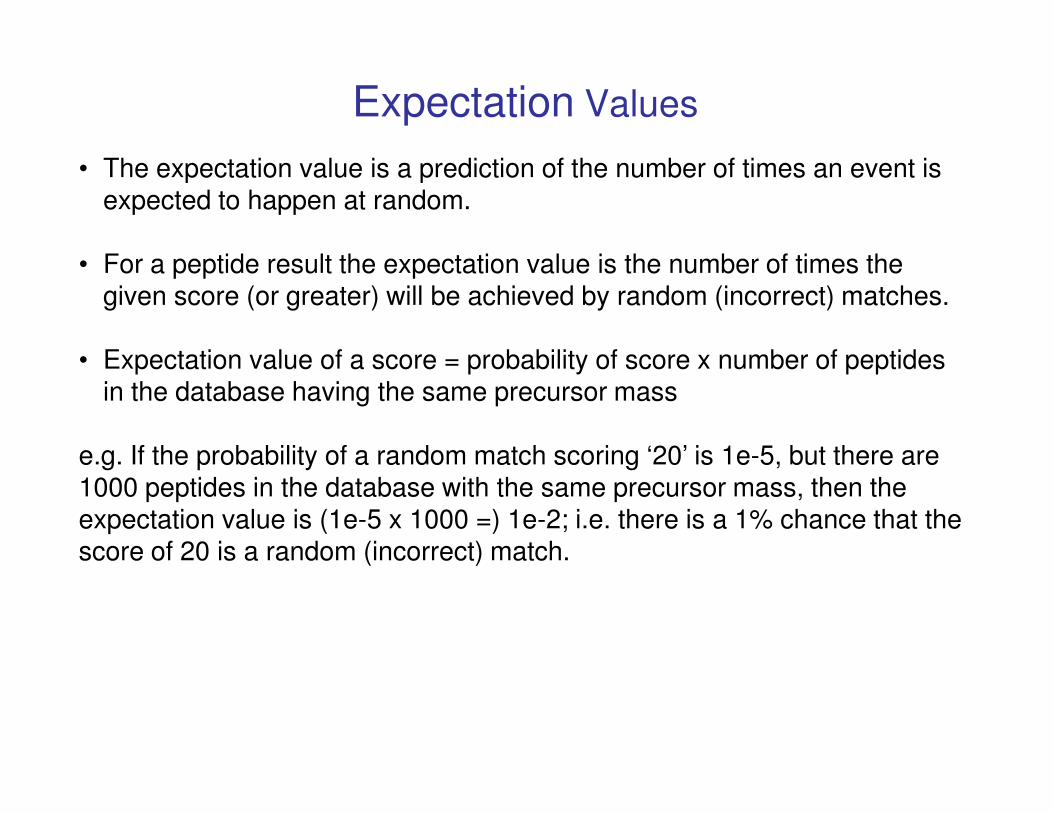
• The expectation value is a prediction of the number of times an event is expected to happen at random.
• For a peptide result the expectation value is the number of times the given score (or greater) will be achieved by random (incorrect) matches.
• Expectation value of a score = probability of score x number of peptides in the database having the same precursor mass
Expectation Values
e.g. If the probability of a random match scoring ‘20’ is 1e-5, but there are 1000 peptides in the database with the same precursor mass, then the expectation value is (1e-5 x 1000 =) 1e-2; i.e. there is a 1% chance that the score of 20 is a random (incorrect) match.
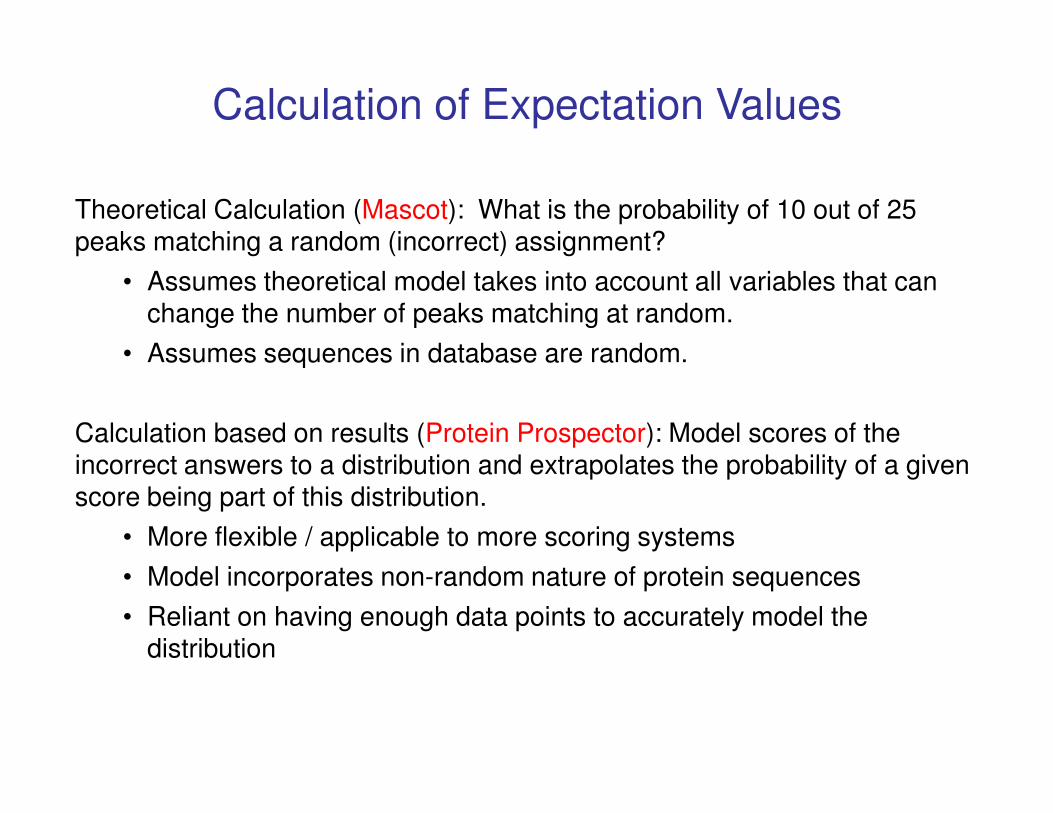
Calculation of Expectation Values
Theoretical Calculation (Mascot): What is the probability of 10 out of 25 peaks matching a random (incorrect) assignment?
• Assumes theoretical model takes into account all variables that can change the number of peaks matching at random.
• Assumes sequences in database are random.
Calculation based on results (Protein Prospector): Model scores of the incorrect answers to a distribution and extrapolates the probability of a given score being part of this distribution.
• More flexible / applicable to more scoring systems
• Model incorporates non-random nature of protein sequences
• Reliant on having enough data points to accurately model the distribution
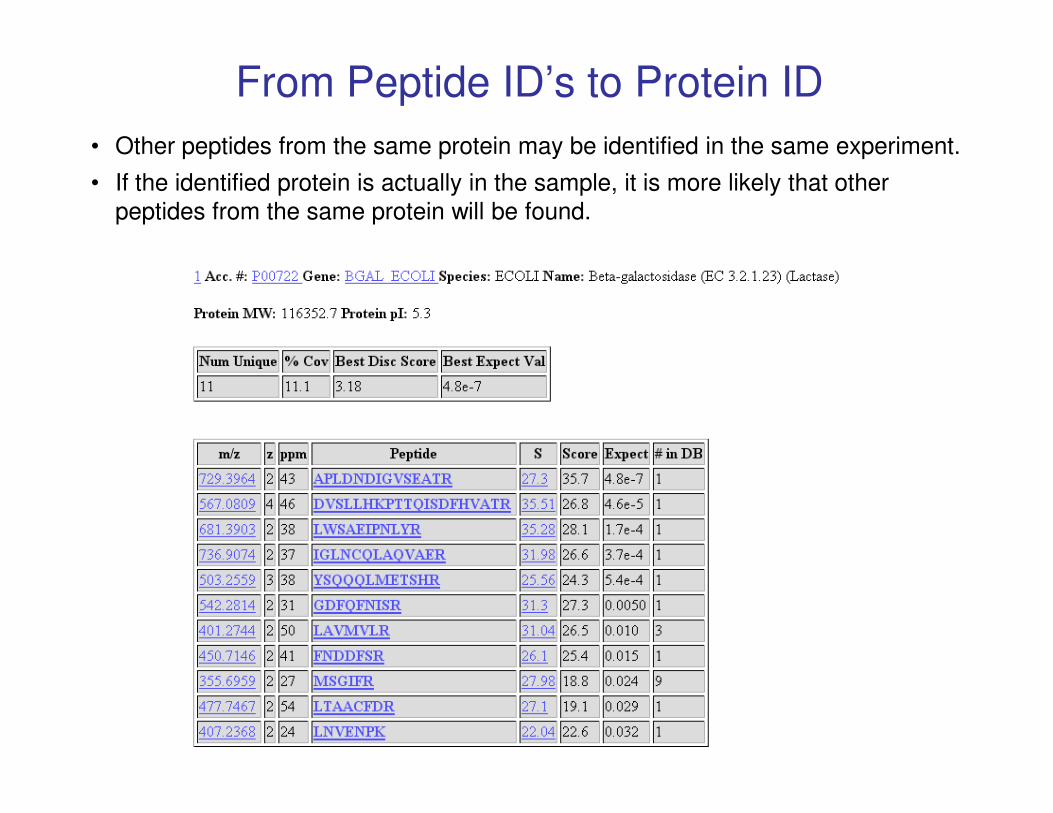
From Peptide ID’s to Protein ID
• Other peptides from the same protein may be identified in the same experiment.
• If the identified protein is actually in the sample, it is more likely that other
peptides from the same protein will be found.
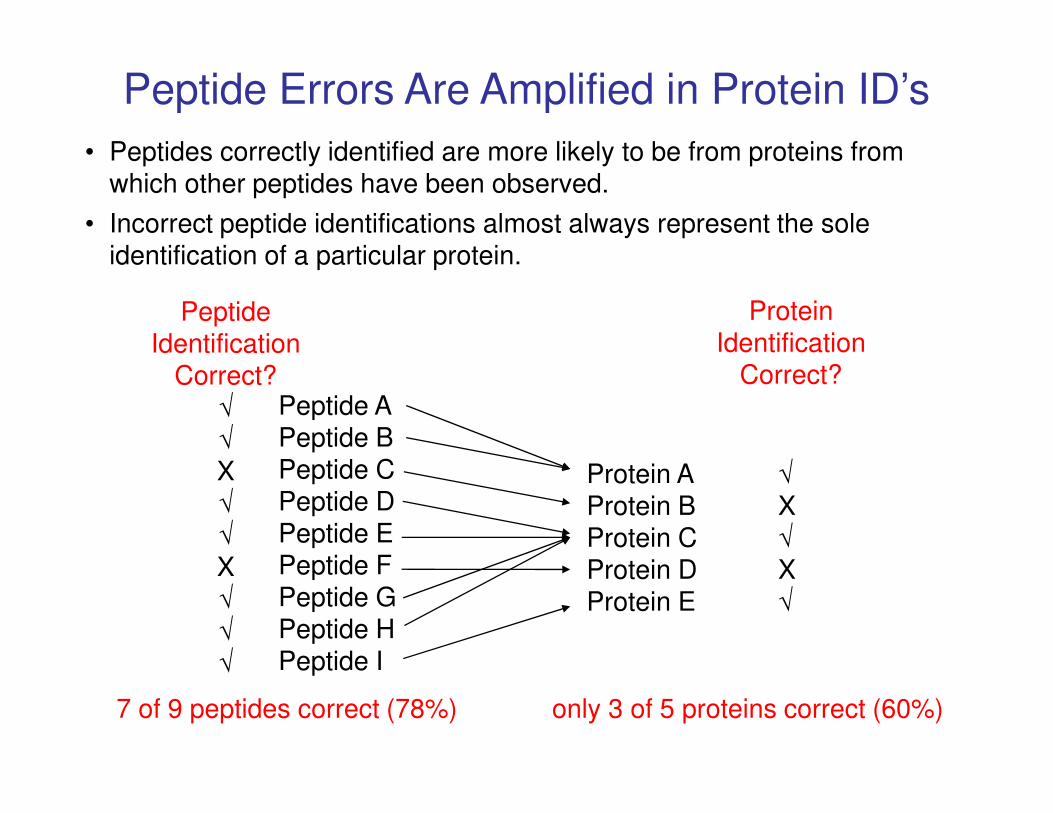
Peptide Errors Are Amplified in Protein ID’s
• Peptides correctly identified are more likely to be from proteins from which other peptides have been observed.
• Incorrect peptide identifications almost always represent the sole identification of a particular protein.
Peptide A
PeptideIdentification
Correct?√
ProteinIdentification
Correct?Peptide APeptide BPeptide CPeptide DPeptide EPeptide FPeptide GPeptide HPeptide I
Protein A √
Protein B XProtein C √
Protein D XProtein E √
√
√
X√
√
X√
√
√
7 of 9 peptides correct (78%) only 3 of 5 proteins correct (60%)
Best strategy
The conversion of peptide to protein information is also complicated by:
• multiple database entries for the same protein.
• sequence variants / isoforms.
• splice variants.
It is best to combine multiple parameters from a search result to create a new score that is better at discriminating between correct and incorrect new score that is better at discriminating between correct and incorrect answers than any one parameter from the search result.
This can be used to assign a new measure of reliability to a result.
• Protein Prospector reports a discriminant score.
• PeptideProphet / ProteinProphet (free open source software) can be used to re-analyze other search engine results.
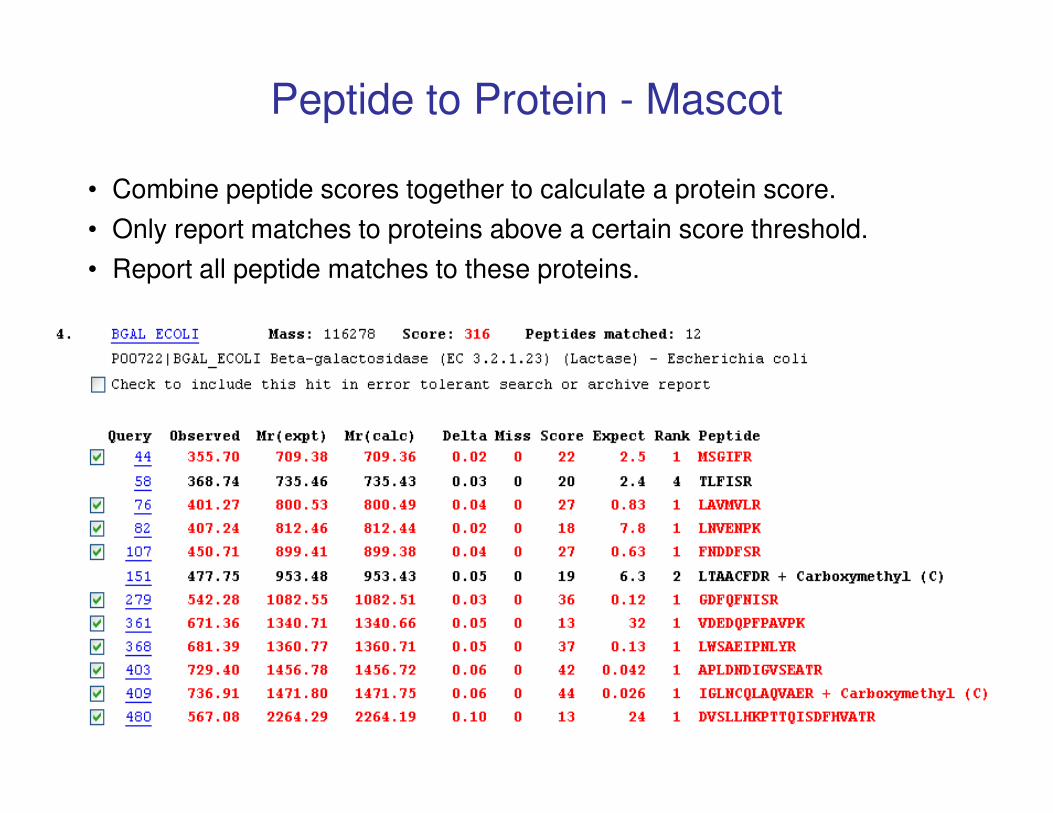
Peptide to Protein - Mascot
• Combine peptide scores together to calculate a protein score.
• Only report matches to proteins above a certain score threshold.
• Report all peptide matches to these proteins.
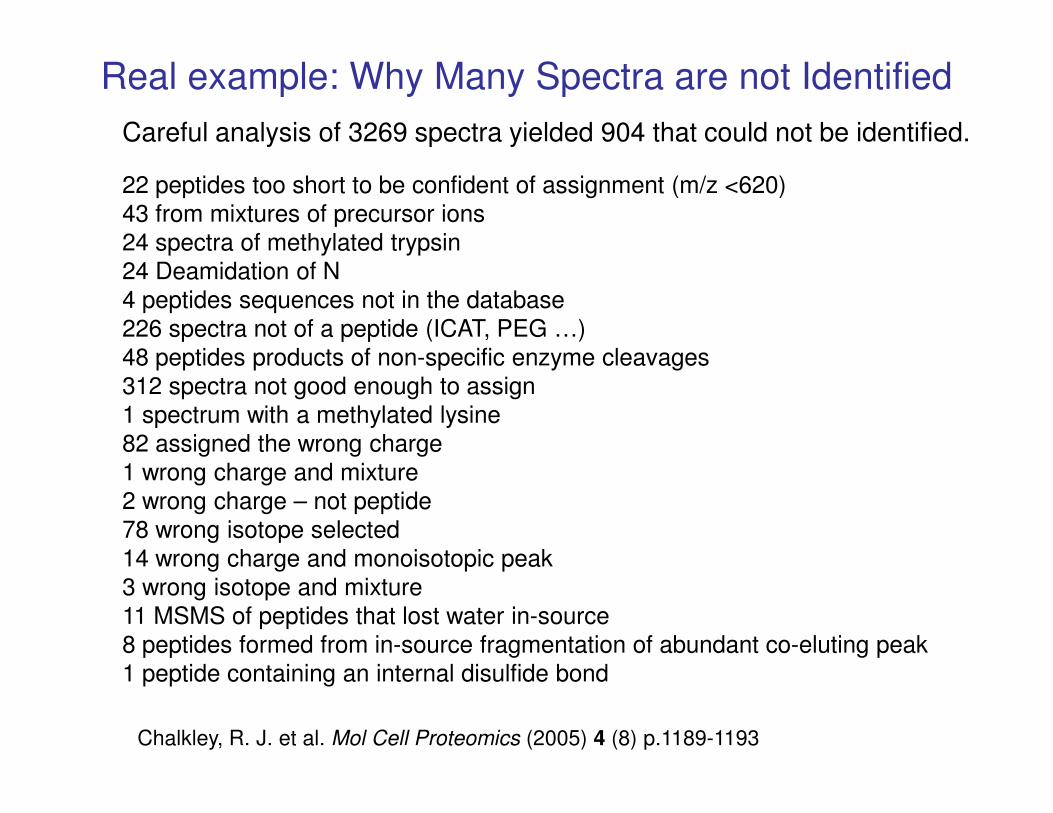
Real example: Why Many Spectra are not Identified
Careful analysis of 3269 spectra yielded 904 that could not be identified.
22 peptides too short to be confident of assignment (m/z <620)
43 from mixtures of precursor ions
24 spectra of methylated trypsin
24 Deamidation of N
4 peptides sequences not in the database
226 spectra not of a peptide (ICAT, PEG …)
48 peptides products of non-specific enzyme cleavages
312 spectra not good enough to assign
1 spectrum with a methylated lysine1 spectrum with a methylated lysine
82 assigned the wrong charge
1 wrong charge and mixture
2 wrong charge – not peptide
78 wrong isotope selected
14 wrong charge and monoisotopic peak
3 wrong isotope and mixture
11 MSMS of peptides that lost water in-source
8 peptides formed from in-source fragmentation of abundant co-eluting peak
1 peptide containing an internal disulfide bond
Chalkley, R. J. et al. Mol Cell Proteomics (2005) 4 (8) p.1189-1193
Homology-based searching – Brief introduction
• If your protein is not in the database, how do you identify it?
• It may be highly homologous either to another protein, or to the same protein from a different species
• De Novo Sequencing, then BLAST or MS-Homology• Searching allowing for amino acid substitutions• Searching allowing for amino acid substitutions
[213]ENFAGVGV[I|L]DFES 6[217]GA[Q|K][242]DENTR 4
• Scoring system based on likelihood of amino acid substitution• Ser to Thr: similar amino acids• Gly to Arg: very different amino acids
Peptide Mass Fingerprinting (PMF)• Protein is digested into peptides; MWs are measured on MS.• Peptide MWs are searched against a database.• Works for simple mixtures and the whole experiment is simple and fast.
Protein Identification Based on Peptide MSMS• One or two peptide ID’s by MSMS can give protein ID.• Works with complicated mixtures.
Summary of Protein Identification and Characterization
• Works with complicated mixtures.• Typically the data are acquired by LCMSMS.• Desirable with HighRes on precursor ions or survey scans.• HighRes on MSMS fragment ions is less critical.• May provide PTM site assignment.
BUT: Search engines make mistakes• Appropriate choice of search engine parameters is important.• Use probability/expectation values to measure assignment reliability.• Use of random/concatenated database searching can estimate false
positive rates for the dataset as a whole.