proprietary and confidential. this information does not ... · kannur pathanamthitta gddp...
TRANSCRIPT

1Proprietary and confidential. This information does not represent and should not be construed as, legal or professional advice. © 2011 NSDC. All Rights Reserved.

2
District Level Skill Gap Study for Kerala
Final Presentation
Proprietary and confidential. This information does not represent and should not be constructed as, legal or professional advice. © 2013 NSDC. All Rights Reserved

Contents
3
Objectives of the Study 4
Methodology 7
State Profile 10
Education & Skill Development 20
Migration 26
Youth Aspirations 30
Estimation of Skill Gap 33
Challenges in Skill Development in the State 39
Recommendations 42
Proprietary and confidential. This information does not represent and should not be constructed as, legal or professional advice. © 2013 NSDC. All Rights Reserved
Skill Gap Study – Kerala

4
Objectives of the Study
Proprietary and confidential. This information does not represent and should not be constructed as, legal or professional advice. © 2013 NSDC. All Rights Reserved

Scope of the Study
5
NSDC has mandated Deloitte to conduct a district level skill gap study for all the districts of Kerala
including the following
• Socio-economic profiling – demography, economic profile of district by industry & state of education
• Identify developmental opportunities keeping in mind factor endowments and stakeholders
perspectives
• Identify specific developmental initiatives/ projects which have an impact on employment generation
• Articulate the aspirations of the youth
• Identify the current and future (2011-12 to 2022) skills and manpower requirement by industry and
estimate the gap that exists
• Identify current schemes and programmes relating to skill development and their achievement/
challenges
• Study the existing VT infrastructure both in the private sector and the government domain
• Suggest suitable interventions/ recommendations to address the skill gap
• Create an action plan with indicative timelines
Proprietary and confidential. This information does not represent and should not be constructed as, legal or professional advice. © 2013 NSDC. All Rights Reserved
Skill Gap Study – Kerala

Objectives of the Study
6
Socio-
economic
profile
Identify
development
opportunities
Understand
stakeholders
perspective
Identify current
& future skill
gap
• Demography
• Economic profile by industry
• State of education / vocational
training
• Specific developmental initiatives/
project
• Current schemes and programmes
relating to skill development
• Articulate aspirations of the youth
• Industry requirements
• Barriers to skill development
• Skills and manpower requirement by
industry
• Estimate the existing gap
• Suggest suitable
interventions/
recommendations to
address the gap.
• Create an action plan
with indicative time
lines
Proprietary and confidential. This information does not represent and should not be constructed as, legal or professional advice. © 2013 NSDC. All Rights Reserved
Skill Gap Study – Kerala

7
Methodology
Proprietary and confidential. This information does not represent and should not be constructed as, legal or professional advice. © 2013 NSDC. All Rights Reserved

Approach & Methodology
8
Sector
Analysis
1. Assess
Review of schemes/ policies
Interactions
with institutes
and industry
As-Is Skill
scenario
Interactions with
government officials
Interactions
with youth/
students
Key insightsGrowth
scenarios
2. Estimate 3. Propose
Action plans for state
government, NSDC
Recommendations for training
institutes, employers
Recommend
ations
Skill and
manpower
demand
Skill and
manpower
supply
Future Skill
Gap
District
profile
Interviews/
Discussions and
Desk Research
Interviews/
Discussions and
FGDs
Desk research
and expert
opinions
Consultation with
NSDC and
government
Primary and
secondary
research , expert
opinions
Proprietary and confidential. This information does not represent and should not be constructed as, legal or professional advice. © 2013 NSDC. All Rights Reserved
Skill Gap Study – Kerala

Approach & Methodology
9
The study was carried out through both primary and secondary research methodology
• Primary Research: included structured and semi structured interviews and focused group discussions
(FGDs) with industry representatives & youth.
Various category of stakeholders met during the study:
• Secondary Research based on various sources including - Directorate of Economics and
Statistics, Census of India, NSSO, CMIE database, SPB Reports including Interim report of the Expert
Committee on Employment and Skills Development, MHRD, MoLE reports, Data published by MSME-
DI, Migration Studies by CDS, CII reports on industry sectors and skill development etc.
Stakeholders No
Govt. Officials of key departments (KASE, Higher Education, Labour and Rehabilitation, Tourism,
Coir Board, NORKA etc.)61
Representatives of industry & industry associations in each district (CII, Technopark, Coir Board,
Terumo Penpol, Apollo Tyres, Synthite, Carborundum Universal Ltd. Eastern Condiments, CGH, SFS
Builders, Abad Builders, Kunnel Constructions, Lakeshore hospitals, VKC Footwear, etc.)65
Personnel from Education and Skill Development Institutes ( IIM Kozhikode, CDS, S B Global,
SCMS, Govt ITI Aryanad, Women’s ITI Kazhakootam etc)44
Youth participated in surveys / FGDs 418
Skill Gap Study – Kerala
Proprietary and confidential. This information does not represent and should not be constructed as, legal or professional advice. © 2013 NSDC. All Rights Reserved

10
State Profile
Proprietary and confidential. This information does not represent and should not be constructed as, legal or professional advice. © 2013 NSDC. All Rights Reserved

Kerala Demography
11
Demography (2011) Kerala India
Population (crores) 3.34 121.06
Decadal Population
Growth Rate (2001-11)4.86% 17.7%
Population density per
sq. km860 382
Sex Ratio 1084 943
Percentage of Urban
Population47.7% 31.2%
Percentage of SC
population9.1% 16.6%
Percentage of ST
population1.5% 8.6%
Source: Census 2011
• Low Decadal Population Growth: 4.9% (2001-11), lowest among 17 major states in India.
• High Population Density: Kerala (860) higher than the national average (382). Thiruvanthapuram
(1509) district has highest pop. density.
• Balanced Urban-Rural Spread: 1.74 crores in rural (52.3%) and 1.59 crores in urban (47.7%).
• High Sex Ratio: Kerala is unique with a high sex ratio of 1084, ranking first among all states
Proprietary and confidential. This information does not represent and should not be constructed as, legal or professional advice. © 2013 NSDC. All Rights Reserved
Skill Gap Study – Kerala

Kerala Economic Profile
12
From 2004-05 to 2011-12
• Economy grew at CAGR of about
8.4%, from Rs 1192.6 Bn to Rs 2101.1 Bn
(2004-05 to 2011-12)
• Primary sector’s contribution declined
from 17.9% to 9.5%
• Secondary sector contribution fell from
22.5% to 20.2%
• Share of tertiary sector increased from
59.6% to 70.3%, due to increased
contributions from sectors such as
Transport, Storage and
Communication, and Banking and
Insurance.
In 2011-12,
• Ernakulam district (Rs 302.9 Bn)
contributes the most to the state
economy, followed by
Thiruvananthapuram (Rs. 231 Bn.).
• Wayanad district (Rs. 39.3 Bn)
contributed the least to the state
economySource: CSO State Series, 2004-05 prices
1,1931,313
1,4171,541
1,6271,776
1,919
2,101
0
500
1000
1500
2000
2500
2004-05 2005-06 2006-07 2007-08 2008-09 2009-10 2010-11 2011-12
GSDP at constant prices (2004-05) in Rs. Bn.
CAGR: 8.4%
17.9% 17.1% 14.9% 13.5% 13.1% 11.9% 10.5% 9.5%
22.5% 22.4% 22.3% 22.1% 21.0% 20.6% 20.7% 20.2%
59.6% 60.4% 62.9% 64.4% 65.9% 67.5% 68.8% 70.3%
0%
10%
20%
30%
40%
50%
60%
70%
80%
90%
100%
2004-05 2005-06 2006-07 2007-08 2008-09 2009-10 2010-11 2011-12
Sector level Contribution to GSDP
Primary Secondary Tertiary
Proprietary and confidential. This information does not represent and should not be constructed as, legal or professional advice. © 2013 NSDC. All Rights Reserved
Skill Gap Study – Kerala

6.9%
24.6%
10.4%
13.2%
17.0%
11.9%
11.1%
5.8%
8.3%
5.9%
6.5%
13.7%
8.2%
13.1%
32.7%
14.2%
22.0%
15.8%
11.0%
16.0%
16.5%
21.8%
19.1%
20.6%
19.9%
12.3%
17.7%
12.1%
60.4%
61.2%
67.7%
71.0%
72.0%
72.1%
72.3%
72.4%
72.6%
73.5%
73.6%
74.0%
74.1%
74.7%
0% 10% 20% 30% 40% 50% 60% 70% 80% 90% 100%
Ernakulam
Idukki
Palakkad
Kottayam
Wayanad
Kollam
Malappuram
Trivandrum
Alappuzha
Thrissur
Kozhikode
Kasargod
Kannur
Pathanamthitta
GDDP Contribution (2011-12)
Primary Secondary Tertiary
Kerala Economic Profile
13
• The tertiary sector contributes the highest to the economy followed by the secondary sector
except in four districts including Idukki, Wayanad, Kasaragod, Pathanamthitta where the primary
sector contributes more than the secondary sector.
• Ernakulam district contributes the highest to all the three sectors of the economy followed by
Kottayam for primary sector, Trivandrum to secondary sector and tertiary sector
Source: CSO State Series, 2004-05 prices
Proprietary and confidential. This information does not represent and should not be constructed as, legal or professional advice. © 2013 NSDC. All Rights Reserved
Skill Gap Study – Kerala

Kerala Economic Profile– Tertiary Sector
14
• Tertiary sector key to economy in terms
of growth and contribution.
• In 2011-12 Trade, hotels and
restaurants comprised 30.4% of the
tertiary sector, followed by real estate
and business activities (16%) and other
services (14.4%).
• Ernakulam district contributed the
highest to overall tertiary output.
(12.4%)
71
0.7
79
3.5
89
0.8
99
2.6
1,0
72
.7
1,1
97
.9
1,3
20
.9
1,4
76
.8
0
200
400
600
800
1000
1200
1400
1600
04-05 05-06 06-07 07-08 08-09 09-10 10-11 11-12
Tertiary Sector – GSDP, Rs billion
CAGR: 11.0%
Transport and
Storage, 11.1%
Communic-ation, 11.8
%Trade, Hote
ls and Restaurants
, 30.4%Banking & Insurance, 1
0.6%
Real estate, Busi
ness services, 16
.0%
Public admin-
istration, 5.7%
Other services, 14
.4%
Tertiary Sector – 2011-12
Source: CSO State Series, 2004-05 prices
District
Contribution of
district to overall
state tertiary output,
2011-12
Ernakulam 12.4%
Thiruvananthapuram 11.3%
Thrissur 10.4%
Kozhikode 9.2%
Malappuram 8.0%
Kannur 7.7%
Kollam 7.6%
Proprietary and confidential. This information does not represent and should not be constructed as, legal or professional advice. © 2013 NSDC. All Rights Reserved
Skill Gap Study – Kerala

Kerala Economic Profile– Tertiary Sector
15
Tourism: focus on emerging areas such as adventure tourism, promotion of local souvenirs and handicrafts, continued emphasis on backwater tourism and Ayurveda, promotion of homestays and environment-friendly tourism (Tourism Policy 2012)
Information Technology: Establish 3,000 technology start-ups, 5 lakh direct employment by 2020; Promote IT parks around Thiruvananthapuram, Ernakulam and Kozhikode (IT Policy 2012)
Communication: 29% growth between 2004-05 and 2011-12, 11.8% to the tertiary sector in 2011-12
Other Services: Growth of 9.4% between 2004-05 and 2011-12, 14.4% to the tertiary sector in 2011-12.
Sector includes Education & Skill Development, Healthcare, Media & Entertainment, Informal sector services
BFSI: Growth of 14.5% between 2004-05 and 2011-12. 10.6% to tertiary sector in 2011-12
Proprietary and confidential. This information does not represent and should not be constructed as, legal or professional advice. © 2013 NSDC. All Rights Reserved
Skill Gap Study – Kerala

Kerala Economic Profile– Secondary Sector
16
• Contribution to economy declined;
22.5% in 2004-05 to 20.2% in 2011-12.
• 2011-12: Construction comprised
58%, registered manufacturing
(20%), unregistered manufacturing (16%)
and electricity, gas & water supply (6%).
• Construction: 7.8% growth (2004-05 to
2011-12). Contribution to secondary sector
rose from 53.9% to 57.6%
• Ernakulam district contributed the highest
to overall secondary output (23.3%).
District
Contribution of district to
state secondary output,
2011-12
Ernakulam 23.3%
Thiruvananthapuram 11.8%
Thrissur 10.1%
Kozhikode 8.6%
Palakkad 8.2%
26
8.9
29
4.7
31
5.5
34
0.3
34
1.3
36
6.4
39
7.1
42
5.0
050
100150200250300350400450
Secondary Sector – GSDP, Rs. billion
CAGR: 6.8%
Manufacturing -
Regd16%
Manufacturing -Unregd
20%
Construc-tion58%
Electricity, Gas & Water Supply
6%
Source: CSO State Series, 2004-05 prices
Secondary Sector, 2011-12
Proprietary and confidential. This information does not represent and should not be constructed as, legal or professional advice. © 2013 NSDC. All Rights Reserved
Skill Gap Study – Kerala

Kerala Economic Profile– Secondary Sector
17
• MSMEs: Kerala accounted for 10% of the
functional MSMEs in the country providing
employment for nearly 7% of the total employed
in MSME sector.
(4th All-India MSME Census)
• Key MSME industries (in terms of employment):
• Food Processing:
Thiruvananthapuram, Alappuzha, Kottayam,
Ernakulam, Kollam
• Ready-made garments & embroidery:
Thiruvananthapuram, Alappuzha, Kottayam,
Ernakulam
• Wood/wooden based furniture:
Alappuzha, Kottayam, Ernakulam
• Chemical/Chemical based:
Ernakulam, Alappuzha
• Rubber, Plastic & Petro-Based:
Alappuzha, Kottayam, Ernakulam
Source: DIC, ‘Study on Kerala – Roadmap for Inclusive Growth’ ASSOCHAM 2012, Primary Interactions, MSME DI District ProfilesProprietary and confidential. This information does not represent and should not be constructed as, legal or professional advice. © 2013 NSDC. All Rights Reserved
Skill Gap Study – Kerala

Kerala Economic Profile– Primary Sector
18
21
3.0
22
4.7
21
0.4
20
8.0 21
2.6
211
.4
20
0.7
19
9.2
185
190
195
200
205
210
215
220
225
230
04-05 05-06 06-07 07-08 08-09 09-10 10-11 11-12
Primary Sector – GSDP, Rs. billion
CAGR: -0.9%
• Contribution to economy declined; 17.5% in
2004-05 to 9.5% in 2011-12.
• In 2011-12, Agriculture comprised 75%
followed by forestry & logging (12%), fishing
(9%) and mining and quarrying (4%).
• Ernakulam district contributed the highest
to overall primary output (10.5%).
District
Contribution of district to
state primary output,
2011-12
Ernakulam 10.5%
Kottayam 9.6%
Kollam 9.3%
Malappuram 9.1%
Idukki 8.9%
Agriculture
75%
Forestry & Logging
12%
Fishing9% Mining &
Quarry-ing4%
Source: CSO State Series, 2004-05 prices
Proprietary and confidential. This information does not represent and should not be constructed as, legal or professional advice. © 2013 NSDC. All Rights Reserved
Skill Gap Study – Kerala

Promotional Initiatives – Thrust Sectors
19
• Industries: Khadi and Handlooms, Handicrafts, Coir, Bamboo, Cashew, Food
Processing, Bio-technology, nano-technology
• Services:
Healthcare, Entertainment, Education, IT, Tourism, Ayurveda, Logistics, Transport, Financia
l Services, Communication, Retail
Industrial and Commercial Policy – Key Focus Areas
• Growth centres in Kannur, Kozhikode, Alappuzha and Malappuram
• Other key projects: Kochi – Palakkad NIMZ (National Investment Manufacturing
Zone), Electronic Hardware Park at Kochi, Light Engineering Industrial Park in
Palakkad, Electronic Hardware Park at Kochi and Life Sciences Park in
Thiruvananthapuram
KSIDC Investments
• l4 theme based Industrial Parks in Kerala in areas such as
garments, infotainment, marine/seafood, rubber, exports, food processing, etc.
• Key projects: International Apparel Park at Thiruvananthapuram; India’s first Export
Promotion Industrial Park at Ernakulam; India’s first Infotainment Park, the Film & Video
Park at Thiruvananthapuram and India’s first Food Processing Industrial Park at
Malappuram
KINFRA Investments
Proprietary and confidential. This information does not represent and should not be constructed as, legal or professional advice. © 2013 NSDC. All Rights Reserved
Skill Gap Study – Kerala
20
Education & Skill
Development
Proprietary and confidential. This information does not represent and should not be constructed as, legal or professional advice. © 2013 NSDC. All Rights Reserved

Kerala – Literacy and Education levels
21
Source: Source: NSS Report 551 - Status of Education and Vocational Training in India
Literacy
• Kerala is the most literate state in the country, with literacy recorded at 94%
• Male literacy: 96.1%; Female literacy: 92.1%.
• Urban literacy: 94.9%; Rural literacy: 92.9%.
• Most literate district: Kottayam (97.2%); Least literate: Wayanad (89.0%).Source: Census 2011
Education Level (per
1000, 15 years and
above)
Kerala India
Male Female Person Male Female Person
Illiterate 33 86 61 214 423 317
Literate up to middle
school545 509 526 422 346 385
Secondary and
Higher Secondary
School
277 271 274 259 169 215
Diploma/Certificate 53 36 44 15 6 11
Graduate and Above 92 97 95 90 56 73
Education Levels
• 92 men and 97 women
estimated to be graduates
and above, only slightly
higher than the all-India
estimation for men at 90 (per
1000)
• 53 per 1000 men and 36 per
1000 women estimated to
have a diploma or certificate
in Kerala; relative preference
for such certifications among
men
Proprietary and confidential. This information does not represent and should not be constructed as, legal or professional advice. © 2013 NSDC. All Rights Reserved
Skill Gap Study – Kerala

Kerala - School Education
22
Source: KDISE 2011-12 Report, and SEMIS 2011-12 report
• The top 3 districts in terms of number of
schools are Malappuram
(1596), Kannur(1466) and Kozhikode(1412)
• In terms of enrolment, the top districts are
Malappuram (6,76,606), Thrissur (4,41,889)
and Kozhikode (4,35,221)Source: DISE Report 2011-12, SEMIS report 2011-12, MHRD 2010-11 All
India Higher Education Survey
School category Number
NUMBER OF SCHOOLS
Lower primary Schools (I-IV) 7872
Upper Primary Schools (V-VII) 3761
High Schools (VIII-X) 3650
Total 15,283
TOTAL ENROLMENT
Lower primary Schools(I-V) 17,95,723
Upper Primary Schools (VI-VII) 15,21,904
High Schools (IX-X) 13,50,746
Total 46,68,373
TOTAL TEACHERS
Lower primary Schools(I-IV) 48676
Upper Primary Schools(V-VII) 56791
High Schools (VIII-X) 77782
Total 1,83,249
Lower Primary Enrolments(I-IV): 18.0 Lakhs
Upper Primary Enrolments(V-VIII): 15.2 Lakhs
Secondary Enrolments: 13.5 Lakhs
Higher Secondary Enrolments:
4.9 Lakhs
UG Enrolments :
5.9 Lakhs
PG Enrol-ment0.7 L
Proprietary and confidential. This information does not represent and should not be constructed as, legal or professional advice. © 2013 NSDC. All Rights Reserved
Skill Gap Study – Kerala

Kerala - Higher Education
23
Educational
Infrastructure
No. of
Institutes
Sanctioned
Intake
Engineering/ Technology 153 48,988
Arts Science and
Commerce Colleges414 1,76,798
Agriculture 5 289
Medicine (including
Ayurveda, Homeopathy, 66 6,957
Nursing 111 7,363
BPharm 29 2,641
Paramedical and Applied
Sciences28 1,143
Law 16 2,004
Management 88 7,950
Distribution
• 52 arts and science colleges (12.6%) for
Ernakulam to 12 (2.9%) for Wayanad.
• Distribution of engineering colleges varies
from 29 in the Ernakulam to 1 in Wayanad
• Ernakulam (26) has the maximum number
of Management institutes
• Kasaragod, Idukki and Wayanad do not
have any medical college
• Centres of Excellence include Technopark,
Vikram Sarabhai Space Centre, Rajiv
Gandhi Centre for Biotechnology, IISER,
Cyberpark, IIM Kozhikode, NIT Kozhikode,
Cochin University of Science and
Technology (CUSAT)
Source: Directorate of technical education, Kerala University
website, CEE Website, AICTE, List of Affiliate medical Colleges
Proprietary and confidential. This information does not represent and should not be constructed as, legal or professional advice. © 2013 NSDC. All Rights Reserved
Skill Gap Study – Kerala

Kerala - Vocational Training
24
ProgramNo. of
Institutes
Sanctioned
IntakeITI/ITCs 612 ~67000
Polytechnic 59 ~10,500
• Kerala has 612 ITI/ ITCs with the government ITIs
comprising 12.41% of the total.
• Thiruvananthapuram (73) has the maximum
number of ITI/ITCs while Wayanad (7) has the
lowest number of ITI/ITCs in the state.
• Except the districts of Kasaragod(12) , Idukki(12)
and Wayanad (7), all the districts have more than 35
ITIs.
• SDIS: 250 registered Vocational Training Providers
(VTPs) in the state, 70 VTPs estimated to be
functional.
• NSDC partners: S B Global is the first private
training institution based in Kerala to be approved
by NSDC as a Skill Development Partner, with
centres at Kochi, Kottayam, Thrissur and Kannur.
Other NSDC partners with operations in Kerala
include Future Sharp, IIJT and Talent Sprint.
Source: DGET website and Board of Technical Examinations
Proprietary and confidential. This information does not represent and should not be constructed as, legal or professional advice. © 2013 NSDC. All Rights Reserved
Skill Gap Study – Kerala

Kerala- Skill Development Key State Government Initiatives
25
• State Skill Development Project,
implemented jointly by the Labour
(Employment & Training), General Education,
Higher Education and Local Self Government
Departments.
• To cover 14.8 lakh people over the XII FYP
• Additional Skill Acquisition Programme
(ASAP): vocational training to Higher
Secondary School Students and B.A, B.Sc.,
B.Com Students at the Undergraduate levels
in colleges.
• ASAP has a target of training 3.1 lakh
trainees between 2012-17 with a budget of
Rs. 633.3 crores
• KASE - Additional Skill Enhancement
Programme (ASEP): skill up gradation to
ITI students and registered applicants through
Employment Exchanges with services
including skill mapping and trainings
• ASEP has a target of training 11.7 lakh
trainees between 2012 and 2017 with a
budget of Rs. 2295.4 crores.
8400
33600
50400
67200
84000
240010800 13800 16800
22800
0
20000
40000
60000
80000
100000
2012-13 2013-14 2014-15 2015-16 2016-17
ASAP Target Trainees (2012-17)
Higher Secondary Under Graduate
4800063200
91200
119200
147360
7200094800
136800
178800
221040
0
50000
100000
150000
200000
250000
2012-13 2013-14 2014-15 2015-16 2016-17
ASEP Target Trainees (2012-17)
MES Trainees ASEP Trainees
Source: State Skill Development Project – Preliminary Project Report, GoK, 2012
Proprietary and confidential. This information does not represent and should not be constructed as, legal or professional advice. © 2013 NSDC. All Rights Reserved
Skill Gap Study – Kerala

26
Migration
Proprietary and confidential. This information does not represent and should not be constructed as, legal or professional advice. © 2013 NSDC. All Rights Reserved

Migration – Non Resident Keralites
27
• Non-Resident Keralites (NRKs), the sum of emigrants and return emigrants, estimated at 34.3 lakhs in
2011.
• 90% of Kerala’s emigrants reside in the Middle East in countries such as UAE and Saudi Arabia
• Mallapuram district had highest share of NRKs at 5.6 lakhs, Idukki district had the least with 0.14
lakh NRKs
• Volume of remittances to Kerala from abroad, estimated at Rs. 49,675 cr., accounting for 31% of SDP
in 2011.
• Trend of return migration, estimated at 11.5 lakhs, owing to factors such as demographic
transition, comparable life styles in Kerala/India, increasing cost of emigration etc.
Source: Inflexion in Kerala’s Gulf Connection, Report on Kerala Migration Survey 2011, Centre for Development Studies
14.4
106.7
129
.3
166
.0
198
.4
199
.1
225
.4
284
.4
321
.1
347
.5
408
.3
425
.8
563.0
5.2
21.8
33.226.4
57.2
22.8
37 35.842.2 45.6
51.1
74.1
50.5
71.2
0
100
200
300
400
500
600
0
20
40
60
80
Th
ou
sa
nd
s
Non-Resident Keralites, 2011
Number NRK per 100 HH
Implications for skill development in terms of re-skilling/up skilling of returning migrants
Proprietary and confidential. This information does not represent and should not be constructed as, legal or professional advice. © 2013 NSDC. All Rights Reserved
Skill Gap Study – Kerala

Migration – Education and Occupational Status
28
Occupation before emigration
Agriculture/ Animal Husbandry 21.9%
Construction worker / labourer 9.0%
Cultivator 8.3%
Motor Vehicle Driver 5.8%
Shop Salesman 5.4%
Educational Status:
• Emigrants: 8.1% having attained a
ITI certificate or a polytechnic
diploma and 19.1% with a degree or
above.
Occupational Status:
• Key occupations: agriculture/ animal
husbandry, shop salesman, motor
vehicle drivers, construction
workers/labourers and
teachers/lecturers.
Source: Inflexion in Kerala’s Gulf Connection, Report on Kerala Migration Survey 2011
Implications for professionally skilling emigrants/out-migrants with internationally/ nationally
recognized certification
8.8%0.9%
64.0%
84.8%
8.1%4.3%
19.1%
10.0%
0.0%
20.0%
40.0%
60.0%
80.0%
100.0%
Emigrants Return-Emigrants
Illiterate Pre-primary to Class XII ITI and Polytechnic Degree and Above
Proprietary and confidential. This information does not represent and should not be constructed as, legal or professional advice. © 2013 NSDC. All Rights Reserved
Skill Gap Study – Kerala

Migration – In-migrants from other states
29
Domestic Migrant Labour
• Estimated over 25 lakh migrant
labourers in Kerala, with an annual
arrival rate of 2.4 lakhs
• West Bengal (20%) dominated the
states from where migrants were
found to originate, followed by Bihar
(18.1%), Assam (17.3%) and U.P
(14.8%).
• Estimated that 60% work in
construction, 8.3% in manufacturing
and 6.9% in hotels and restaurants.
• Most of the migrant labourers are
unskilled labourers especially in
sectors such as construction
Source: Domestic Migrant Labour in Kerala, Report submitted to Department of Labour and
Rehabilitation, 2013
Influx of in-migrants has implications for integration into main-stream employment and also for
skilling and re-skilling in relevant sectors
State % of total migrants in Kerala
West Bengal 20.0%
Bihar 18.1%
Assam 17.3%
Uttar Pradesh 14.8%
Orissa 6.7%
Others 23.1%
Sector % of total migrants in Kerala
Construction 60.0%
Manufacturing 8.3%
Hotels and Restaurants 6.9%
Agriculture 2.3%
Trade 1.7%
Others 17.5%
Not Reported 3.1%
Source: Domestic Migrant Labour in Kerala, Report submitted to Department of Labour and
Rehabilitation, 2013
Proprietary and confidential. This information does not represent and should not be constructed as, legal or professional advice. © 2013 NSDC. All Rights Reserved
Skill Gap Study – Kerala
30
Aspirations of the Youth
Proprietary and confidential. This information does not represent and should not be constructed as, legal or professional advice. © 2013 NSDC. All Rights Reserved

Aspirations of the Youth
31
Preferred Job Opportunities
• Most of the ITI students prefer to be
employed in Government
organizations like
KELTRON, KSEB, KSRTC
• Students of courses such as Hotel
Management, Hospitality prefer to
work for private sector
Preferred Location of Employment
• Students in northern districts seem
more willing to migrate to other
districts and states such as
Karnataka, Tamil Nadu etc. due to
limited opportunities
• Nursing students find the need to
migrate to other states due to
limited opportunities
Challenges and Barriers
• Limited exposure to
communication/soft skills
• Lack of practical on job training on
account to limited local
apperenticeship opportunities
• Limited entrepreneurship
awareness/devt
• Lack of industry appreciation for
vocationally skilled
Preferred Sectors
• Preference for trades in
Construction, Mechanical, Electroni
cs/Electrical and Computer Science
(Surveyor/civil, MMV, COPA etc)
• Preference for NCVT course over
SCVT courses Vocational
Training is
perceived to be
less desirable
compared to
professional
qualifications
Proprietary and confidential. This information does not represent and should not be constructed as, legal or professional advice. © 2013 NSDC. All Rights Reserved
Skill Gap Study – Kerala
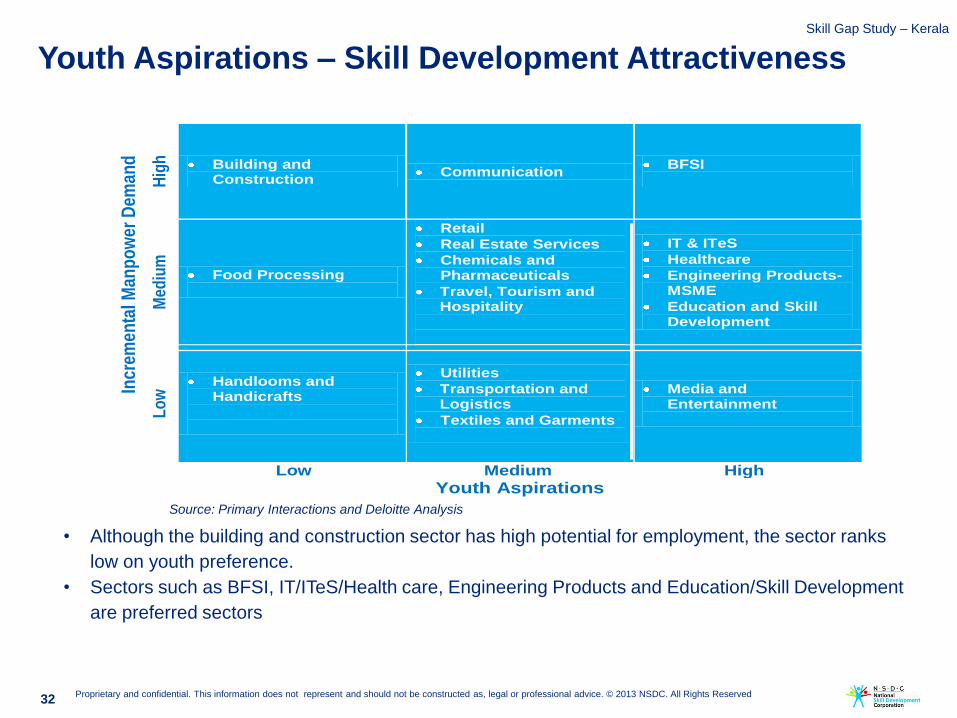
Youth Aspirations – Skill Development Attractiveness
32
• Although the building and construction sector has high potential for employment, the sector ranks
low on youth preference.
• Sectors such as BFSI, IT/ITeS/Health care, Engineering Products and Education/Skill Development
are preferred sectors
Source: Primary Interactions and Deloitte Analysis
Incr
emen
tal M
anp
ow
er D
eman
d
Hig
h
Building and Construction
Communication BFSI
Med
ium
Food Processing
Retail
Real Estate Services
Chemicals and Pharmaceuticals
Travel, Tourism and Hospitality
IT & ITeS
Healthcare
Engineering Products- MSME
Education and Skill Development
Lo
w Handlooms and
Handicrafts
Utilities
Transportation and Logistics
Textiles and Garments
Media and Entertainment
Low Medium High
Youth Aspirations
Proprietary and confidential. This information does not represent and should not be constructed as, legal or professional advice. © 2013 NSDC. All Rights Reserved
Skill Gap Study – Kerala

33
Estimation of Skill Gap
Proprietary and confidential. This information does not represent and should not be constructed as, legal or professional advice. © 2013 NSDC. All Rights Reserved
Skill Gap Study – Kerala

Incremental manpower demand
Incremental HR Demand (in ‘000) 2012-17 2017-22 Total
Skilled 499 663 1,162
Semi-Skilled 566 725 1,292
Minimally-Skilled 424 520 943
Incremental manpower demand (2012-22) 1,489 1,908 3,397
34
Source: Deloitte Analysis
• 38% of incremental demand expected in the semi-skilled segment, 34% in skilled segment.
• Building and construction to generate 16.5% of the incremental demand, highest share across
sectors.
• Projected incremental demand in BFSI, Communication and Education/Skill Development
sectors contribute to 14.8%, 14.0% and 10.2%
• Education and Health care sectors together contribute significantly to the creation of skilled jobs
(22%).
• Manufacturing: Engineering contributes 20%, followed by food processing/agro-based (16%) and
Textiles & garments (13%).
• The select informal sectors include industries like the security and surveillance, facilities
management and housekeeping, etc. which are important from the view of skill enhancement.
• A significant number of the workforce (~8 Lakhs) is expected to exit from the agriculture sector
between 2012-22 and added to the incremental supply of workers in this period.
Proprietary and confidential. This information does not represent and should not be constructed as, legal or professional advice. © 2013 NSDC. All Rights Reserved
Skill Gap Study – Kerala

Estimated Incremental Manpower Demand for key sectors
(in `000)
2012-17 2017-2022
KeySectors SkilledSemi-
Skilled
Minimally-
skilledSkilled Semi-Skilled
Minimally-
skilled
Building & Construction 39 104 118 45 119 134
BFSI 97 87 10 154 139 15
Communication 40 80 80 55 110 110
Education/ Skill development 100 23 31 125 29 39
Manufacturing 22 58 40 19 62 44
IT / ITES Services 42 20 3 59 27 5
Retail 10 32 22 10 33 23
Healthcare services 12 21 8 16 26 10
Travel, Tourism & Hospitality 6 16 9 7 17 10
Other Services 82 38 6 113 52 9
Select Informal Sectors 12 43 68 16 55 86
Total Incremental demand 499 566 423 663 725 519
Overall Incremental Demand 3,397
Workers exiting sectors
Mining and Quarrying -1 -5 -10 -2 -4 -7
Agriculture and allied activities -14 -45 -393 -10 -32 -282
Total workers exiting -820
35 Proprietary and confidential. This information does not represent and should not be constructed as, legal or professional advice. © 2013 NSDC. All Rights Reserved
Skill Gap Study – Kerala

Incremental manpower supply
36
Source: Deloitte Analysis
Incremental HR Supply (in ‘000) 2012-17 2017-22 Total
Skilled 448 448 896
Semi-Skilled 565 564 1,128
Minimally-Skilled 621 474 1,095
Incremental manpower supply (2012-22) 1,634 1,486 3,120
• Proportion of incremental supply of minimally skilled manpower to decline from 38% in the 2012-
17 period to 31% in the 2018-22 periods.
Significantly, the semi- skilled segment is expected to emerge as the largest category of supply
over the 2012-22 period and account for 11.28 Lakhs or 36% of the incremental workforce.
• The trend of migration is expected to be outward across skill levels. However, there is also a
trend towards inward migration from other states, especially for minimally skilled jobs in sectors
like building and construction and hospitality.
• Incremental supply of manpower also augmented by workforce moving from agriculture and
other sectors.
Proprietary and confidential. This information does not represent and should not be constructed as, legal or professional advice. © 2013 NSDC. All Rights Reserved
Skill Gap Study – Kerala

Estimated Incremental Skill Gap 2012-17
37
Text
Text
Skilled
Semi-Skilled
Minimally Skilled
Incremental Human
Resource Requirement
2012 to 2017
Incremental Human
Resource Availability
2012 to 2017
Demand-Supply gap of
Human Resources 2012
to 2017
4.98 L
5.66 L
4.24L
5.65 L
4.48L
6.21 L
0.51 L
0.02 L
(1.97) L
There is an estimated incremental deficit of manpower in skilled manpower of 0.51 lakhs which
may be bridged by skilling people in the semi-skilled and minimally skilled category
Proprietary and confidential. This information does not represent and should not be constructed as, legal or professional advice. © 2013 NSDC. All Rights Reserved
Skill Gap Study – Kerala

Estimated Incremental Skill Gap 2018-22
38
Text
Text
Skilled
Semi-Skilled
Minimally Skilled
Incremental Human
Resource Requirement
2018 to 2022
Incremental Human
Resource Availability
2018 to 2022
6.63 L
7.25 L
5.19L
5.64 L
4.48 L
4.74 L
2.15 L
1.61 L
0.45L
Demand-Supply gap of
Human Resources 2018
to 2022
Excess demand for skilled, semi-skilled and minimally skilled manpower with highest demand for
skilled resources.
Proprietary and confidential. This information does not represent and should not be constructed as, legal or professional advice. © 2013 NSDC. All Rights Reserved
Skill Gap Study – Kerala

39
Challenges in Skill Development in the State
Proprietary and confidential. This information does not represent and should not be constructed as, legal or professional advice. © 2013 NSDC. All Rights Reserved

Key Challenges
40
Limited placement opportunities for students
This may be attributed to lack of institutional infrastructure for continuous interaction with industry/
employers.
Need to update curriculum regularly with industry participation
Scope to continuously update curriculum due to evolving industry needs with greater emphasis on
technology-based skill modules.
Poor industry readiness of the vocationally trained students
According to industry, students from ITI lack proper grooming, work ethic and soft skills required to
satisfactorily perform the duties at the work place.
Limited Awareness of Skill Development Initiatives
Mobilization of students is a key issue expressed by training providers.
Need to strengthen Quality Assurance/Control for Skill Trainings
The interim report of the Expert Committee on Employment and Skills Development highlights the lack of
quality control/assurance arising due to absence of high quality faculty and quality assurance systems.
Limited opportunities/awareness for up skilling/continuous learning
Limited options available for existing employees to continuously learn and upgrade their skills
Limited Availability of local labour for minimally skilled jobs
Proprietary and confidential. This information does not represent and should not be constructed as, legal or professional advice. © 2013 NSDC. All Rights Reserved
Skill Gap Study – Kerala

Key Challenges
41
Preference for white collar jobs and professional education
The perceptions associated with vocational education results in students taking up vocational training as
a last resort. This has also resulted in the state having to rely on migrant labour for certain jobs in
industries such as construction and tourism/hospitality.
Skilling of traditional industries
Since the agriculture sector is an important sector in terms of food security, rural livelihoods and
exports, even though there may not be incremental demand in HR in the sector, it presents opportunities
for re-skilling and up-skilling of the current workforce.
Lack of Entrepreneurship Culture
Primary interactions revealed the lack of an entrepreneurial culture among youth and the inherent
challenges of devising skill development schemes to encourage entrepreneurship on a large scale
Challenges related to migrant labour
Emigrants: large proportion of emigrant labour estimated to lack a professional degree or certification
Labour restrictions in Middle Eastern countries => emigrants returning in significant numbers
In-migrants: Some of the industry representatives felt that in the context of high turnover among this
segment, the statutory rules related to migrant labour may need to be relooked.
Need to improve availability of nationally recognized certification
Interactions with youth indicated preference for courses with industry / national recognition e.g. NCVT
certified courses over SCVT courses since they believe it improves their chances of placements and
opportunities outside the state
Proprietary and confidential. This information does not represent and should not be constructed as, legal or professional advice. © 2013 NSDC. All Rights Reserved
Skill Gap Study – Kerala

42
Recommendations
Proprietary and confidential. This information does not represent and should not be constructed as, legal or professional advice. © 2013 NSDC. All Rights Reserved

Recommendations – Government of Kerala
43
• In sectors such as Construction, Electronics, Automotive Engineering, Health
Care, Hospitality and Tourism, Communication, as part of the State
Government’s ASEP initiative through KASE
• In proposed and current projects of KSIDC e.g. rubber and apparel design
courses in Kannur, food processing, footwear design and electronics courses in
Kozhikode, IT, engineering trades and education courses in Alappuzha,
electronics trades at Kochi and Palakkad and healthcare and life sciences in
Thiruvananthapuram.
• Integrated with the infrastructure development plans (KINFRA projects) in
areas such as garments, infotainment, marine/seafood, rubber, exports, food
processing, etc. e.g. apparel & garment sector and media & entertainment
related courses for the proposed Apparel and Film & Video Park at
Thiruvananthapuram, food processing at Malappuram, etc.
Set up Very Large
Multi Skill Training
Centres
Skill Development
Centres targeted at
the unorganised
sector
• With the support of grass-root organisations such as Kudumbashree, NGOs
focused on literacy, basic numeracy and communication skills apart from core
technical skills.
Mobilize youth to
participate in skill
development
• Students may be encouraged from primary school onwards to value skills in
vocational trades such as carpentry, painting etc.
• Mobilizing greater participation in existing schemes in priority sectors such as
Tourism
• Skills competition in the lines of World skills competition at the state level.
Proprietary and confidential. This information does not represent and should not be constructed as, legal or professional advice. © 2013 NSDC. All Rights Reserved
Skill Gap Study – Kerala

Recommendations – Government of Kerala
44
• These include initiatives for the following crops- Coconut in
Kozhikode, Malappuram & Kannur, Rubber in Kottayam, Ernakulam &
Pathanamthitta, Coffee in Wayanad, Pepper in Idukki, Wayanad and
Kannur, Cashew in Kannur and Cardamom in Idukki and Wayanad.
• Similarly in Alappuzha, Thiruvananthapuram and Ernakulam for fisheries.
• For traditional industries such as coir, modern technology and mechanization
to enable competitiveness of products. Additionally, alternative sources of
livelihood to support them in case of industries like beedi making, etc.
Re-skilling and Multi-
skilling initiatives
In Traditional and
Unorganised Sectors
• Faculty development programmes may be developed with exchange
programmes with institutes in other states and even abroad.
• Create a pool of master trainers of skilled emigrants/return migrants
• Very Large Multi Skill Training Centres need to recruit highly skilled trainers
across multiple disciplines. Possible sources could be skilled, retired
personnel from the public sector and industry.
Faculty Development
• Sharing of infrastructure with private training providers like NSDC partners
• This can also be a source of internal revenue generation for the institutes
improving their viability and growth.
Leverage Training
Infrastructure
Proprietary and confidential. This information does not represent and should not be constructed as, legal or professional advice. © 2013 NSDC. All Rights Reserved
Skill Gap Study – Kerala

Recommendations – Government of Kerala
45
• MSME Development: Cluster development by providing entrepreneurship and
managerial skills in sectors like Food Processing, Ready-made garments &
embroidery, Wood/wooden based furniture, Chemical/Chemical based
products, Rubber, Plastic & Petro products and Handlooms sector
Organizations such as Kerala Financial Corporation and MSME Development
Institute-Thrissur, to encourage greater uptake of such trainings.
• Entrepreneurship Awareness Campaigns in high schools and colleges
• Specific initiatives targeted at home-makers to become entrepreneurs in sectors
such as Food Processing, Readymade Garments, Tourism/Hospitality may
be designed by organizations such as KITTS.
Entrepreneurship
Development
• Potential Emigrants:
• Assess training/certification needs of emigrants
• Track emigrants to understand the nature of occupations they engage in after
emigration through tracer studies
• Identify emerging needs in new countries and devise specific initiatives for e.g.
Training nurses in geriatric health care.
• Globally recognised certifications may be developed in co-ordination with
KASE.
• Returning Emigrants:
• Study the profile of returning emigrants in terms of education/ skill attainment
and occupational profile, and assess skilling needs. if any
• Form a pool of faculty (returning emigrants) for courses targeted towards
employment in Middle East and other countries.
Initiatives for Migrants
Proprietary and confidential. This information does not represent and should not be constructed as, legal or professional advice. © 2013 NSDC. All Rights Reserved
Skill Gap Study – Kerala

Recommendations – NSDC
46
• NSDC can promote private training initiatives in:
• BFSI
• Building and Construction
• Communication
• Education and Skill development
• Manufacturing – Food Processing
• Engineering Products, Rubber, Coir, Cashew
• IT/ ITeS
• Retail
• Healthcare
• Travel, Tourism and Hospitality
• Security and Facilities Management
Promote training in
priority sectors
Promote NSDC
training partners and
Sector Skill Councils
• NSDC to encourage more private training providers
• Skill Councils to participate in the standardization of curriculum and content
• NSDC can also collaborate with Sector Skill Councils to conduct detailed skill-
mapping studies in each sector to map skill levels of personnel in various
occupations with occupational roles/expectations and work experience
Initiatives for in-
migrants
• Understand specific skill gaps and training needs of migrant labour.
• On-site trainining for migrant labour
• NSDC training providers present in the places of origin of the migrants can be
connected to the industries in Kerala through industry bodies to equip them
with basic literacy, language and technical skills
Proprietary and confidential. This information does not represent and should not be constructed as, legal or professional advice. © 2013 NSDC. All Rights Reserved
Skill Gap Study – Kerala

Recommendations – Industry
47
• Adoption of vocational training institutes through infrastructure up
gradation, provision of technical equipment, capacity development of faculty
and industry visits
• Active participation in curriculum design and content through continuous
feedback to institutes
• Participation in placements through career guidance and counseling
workshops and recruitment drives for relevant trades.
Pro-active support of
skill development
Promote
Apprenticeships
• Industry can actively promote paid internships for vocational training students
• Since the state has 44 Public Sector Enterprises (PSEs), apprenticeship
programs can be designed and conducted in collaboration with PSEs.
Up-Skilling and
Continuous Learning
• To collaborate with industry associations and SSCs to develop skill
assessment tools for existing employees to ascertain their skill gaps and
training needs.
• To encourage employees to engage in up-skilling certifications in respective
sectors through accredited courses of short-term duration
• For flexible training options, online education can be promoted.
• Employees to actively participate in skill gap assessment and up-skilling
through appropriate awareness campaigns
Proprietary and confidential. This information does not represent and should not be constructed as, legal or professional advice. © 2013 NSDC. All Rights Reserved
Skill Gap Study – Kerala

Recommendations – Industry
48
Preferential recruitment or wage differential for certified applicants,
prioritizing the regularization of contract employees who opt for skill
enhancement
To provide identity cards to all sections of employees, whether in blue-
collared or white-collared jobs.
Uniforms for personnel in blue-collared jobs.
Employee benefits such as health insurance and social security
Changing mind-sets
towards blue-collar
jobs
Sector Skill Council
Collaboration
Increased membership of prominent industry players from Kerala within the
SSCs
Kerala to be positioned as a location for setting up of centres of excellence
(CoEs), in collaboration with industry bodies like NASSCOM/CII.
Centres of excellence to develop trainers for key sectors with the help of
relevant SSCs, industry associations, international training providers and
state agencies like KASE.
Proprietary and confidential. This information does not represent and should not be constructed as, legal or professional advice. © 2013 NSDC. All Rights Reserved
Skill Gap Study – Kerala

Recommendations – Skill Development Institutes
49
Language Training and Soft Skills: Setting up centres that function as
‘finishing schools’ which focus on providing communicative English, soft skills
training and foreign language training.
Life Skills: Provision of life skills including goal setting, career planning, self-
awareness, etc.
Promote soft skills and
life skills training
Sector Key Districts Key Skills
Building &
Construction
Ernakulam, Thiruvananthapuram,
Thrissur, Kozhikode, Malappuram,
Palakkad
• Engineers: Project Management and People Management Skills, Knowledge of
green/eco-building design, Knowledge of design and tools such as AutoCAD
• Supervisors and Workmen: plumbing, electrical works, carpentry, masonry, painting,
drilling, Attitude towards safety and quality
BFSIErnakulam, Thrissur,
Thiruvananthapuram
• Middle level managers: Banking operations, Client and team management skills,
Interpersonal and communication skills
• Officer and Trainee: Product Knowledge, communication Skills, Inter-personal skills
• Customer Service Executives: Computer skills, Basic accounting knowledge,
communication skills
CommunicationAcross districts • Customer care executive at call centre: Verbal communication especially related to
selling, Basic computer skills
• Customer care executive at repair centre: Basic knowledge of products, Documentation,
Communication
IT/ITeSThiruvananthapuram, Ernakulam
and Kozhikode
• BPO/KPO: Basic computer skills, Customer services attitude
• IT Companies: Project management skills, Entrepreneurial skills
Travel, Tourism
and Hospitality
Thiruvananthapuram, Alappuzha,
Kollam, Ernakulam, Idukki,
Wayanad, Kozhikode, Kasaragod,
Malappuram, Thrissur and Kannur
• Drivers: Communication/Language skills
• Guides: Knowledge of history/culture/nature for specialist guides, Entrepreneurial and
creative skills, Tour operations
• Hospitality: Front Office Management skills, Housekeeping skills, Customer Service
skills, Culinary and food production skills
Education & Skill
Development
Ernakulam, Kozhikode,
Thiruvananthapuram, Kottayam,
Thrissur
• Faculty and Trainers: use of modern teaching aids and activity-based learning modules,
Industry exposure or experience, Technical knowledge in trades such as fashion design;
fine arts, visual communication
Proprietary and confidential. This information does not represent and should not be constructed as, legal or professional advice. © 2013 NSDC. All Rights Reserved
Skill Gap Study – Kerala

Recommendations – Skill Development Institutes
50
Sector Key Districts Key Skills
Food
Processing
Ernakulam, Idukki, Alappuzha, Palakkad,
Kottayam, Thiruvananthapuram, Thrissur,
Kollam
• Plant associates and operators: Basic engineering knowledge, Process
knowledge e.g. distillation, modern production techniques, Basic understanding of
repair and maintenance- electrical and mechanical, Quality and safety awareness,
Industrial exposure for updated technology use , Exposure to industrial relations
• Material handlers: Basic computer skills including barcode reading, etc. Quality,
health and hygiene awareness (food proc.),
• Sales and marketing: Communication skills, Ability and willingness to understand
the product and manufacturing process
• Traditional Industries e.g. Coir Worker: Fibre extraction, spinning, manufacturing
Entrepreneur: managerial skills, production- planning, quality & modernization,
value addition and product diversification
Engineering
Products
Thiruvananthapuram, Palakkad, Kozhikode
Other
Manufacturing
– Rubber,
Coir, Cashew
• Rubber: Kottayam, Idukki, Kozhikode,
Wayanad, Ernakulam, Thrissur
• Coir: Alappuzha, Thiruvananthapuram,
Kollam, Kozhikode
• Cashew: Kollam
• Others: Ernakulam, Palakkad, Thrissur,
Thiruvananthapuram, Kozhikode
RetailThiruvananthapuram, Ernakulam • Front end services: Communication and customer services knowledge, Cashier -
data entry and basic computer skills
• Stocking and Inventory: Industry knowledge, Documentation skills
• Procurement, Supply Chain and Store managers: Communication Skills, People
Management skills
Healthcare• Ernakulam, Palakkad, Thiruvananthapuram
• Ayurveda: Thrissur, Palakkad
• Medical Tourism: Kozhikode, Ernakulam,
Malappuram, Thiruvananthapuram
• Nurses/ Paramedics/ Home-Care Specialists: Geriatric care, Technical knowledge
and machine operation skills, Inter-personal skills, Crisis management
• Occupational Therapy skills
• Ayurveda Nurses/Pharmacists: Panchakarma and technical knowledge about
curative medicine
Security &
Facilities
Management
Ernakulam, Palakkad, Thrissur,
Thiruvananthapuram, Kozhikode
• Security Guards: armed and unarmed training
• Cash management services: Bank ATMs operations knowledge
• Security Supervisor: Surveillance, CCTV operations, Communication Skills,
People Management skills
• Logistics back office: Knowledge of operations and ERP software, documentation
skills
• Air Cargo and Warehouse management: knowledge of DGR (Dangerous Goods
Regulations)
• Ground Service: IATA certification related skills
Proprietary and confidential. This information does not represent and should not be constructed as, legal or professional advice. © 2013 NSDC. All Rights Reserved
Skill Gap Study – Kerala

51 Proprietary and confidential. This information does not represent and should not be constructed as, legal or professional advice. © 2013 NSDC. All Rights Reserved
V. Namasivayam M. Ali Shariff
Senior Director Senior Manager
+91 (080) 6627 6112 +91(080) 6627 6266
[email protected] [email protected]
Arvind B. Elizabeth Mathew
Manager Senior Consultant
+91(080) 6627 6371 +91(080) 6627 6397
[email protected] [email protected]
Skill Gap Study – Kerala