prolonged simulated acid rain treatment in the subarctic: effect on the soil respiration rate and...
TRANSCRIPT
Biol Fertil Soils (1996) 23:7-14 �9 Springer-Vedag 1996
P. V a n h a l a �9 H. F r i t z e �9 S. N e u v o n e n
Prolonged simulated acid rain treatment in the subarctic: Effect on the soil respiration rate and microbial biomass
Received: 20 December 1994
A b s t r a c t Humus chemistry and respiration rate, ATE er- gosterol, and muramic acid concentration as measures of chemical properties, microbial activity, biomass, and indi- cators of fungal and bacterial biomass were studied in a long-term acid rain experiment in the far north of Finnish Lapland. The treatments used in this study were dry con- trol, irrigated control (spring water, pH 6), and two levels of simulated acid rain (pH 4 and pH 3). Originally (1985- 1988), simulated acid rain was prepared by adding both H2SO4 and HNO3 (1.9:1 by weight). In 1989 the treat- ments were modified as follows. In subarea 1 the treat- ments continued unchanged (HzSO4+HNO3 in rain to pH 4 and pH 3), but in subarea 2 only H2SO 4 was ap- plied. The plots were sampled in 1992. The acid applica- tion affected hunms chemistry by lowering the pH, cation exchange capacity, and base saturation (due to a decrease in Ca and Mg) in the treatment with H2SO4+HNO3 to pH 4 (total proton load over 8 years 2.92 kmol ha-l), whereas the microbial variables were not affected at this proton load, and only the respiration rate decreased by 20% in the strongest simulated acid rain treatment (total proton load 14.9 kmol ha-l). The different ratios of H2SO4+HNO3 in subareas 1 and 2 did not affect the re- sults.
Key words Acid rain - Coniferous humus �9 Ergosterol �9 Microbial biomass - Muramic acid - Soil respiration �9 Subarctic areas
R Vanhala ([~) Finnish Environment Agency, P.O. Box 140, FIN-00251 Helsinki, Finland
H. Fritze Finnish Forest Research Institute, RO. Box 18, FIN-01301, Vantaa, Finland
S. Neuvonen University of Turku, Subarctic Research Institute, FIN-20500 Turku 50, Finland
Introduction
A great deal of information has accumulated during the past 15 years on the detrimental effects of acid precipita- tion from industrial emissions on the northern coniferous forest ecosystem (Kauppi et al. 1990). The effects of this acid load on soil chemical properties are well known and can be summarized as a decrease in soil fertility, dffe to the loss of base cations (Ca a+, Mg 2§ K +, Na +) by leaching with SO42- and NO3- as the accompanying anions, and a decrease in soil pH, causing toxic concentrations of A13+ and heavy metals in soil solution (de Vries and Breeuws- ma 1987; Falkengren-Gremp 1987; Nygaard and Abra- hamsen 1991). As all organic material deposited on or in the soil is decomposed and mineralized mainly through the activities of fungi, bacteria, and soil animals, soil microorganisms are of prime importance in maintaining the fertility of terrestrial habitats. Consequently, factors that alter the rates of microbial processes in soil may be of importance for forest ecosystem function. There are con- flicting data concerning the effects of soil acidification on specific microbial processes. Almost every soil microbial activity measurement performed has been demonstrated to the either reduced, stimulated, or unaffected after simu- lated acid rain. Acidic loads applied during a short time period, sometimes even in a single load, demonstrate the toxic effects of acid on the soil respiration rate, microbial community structure, and biomass (Fritze 1992). The length of time in which the acid is applied is critical and will influence the result obtained. Therefore, field studies in which simulated acid rain is applied in low doses over a long period of time approximate most closely to the situation in nature. Such studies are rare.
In the present study we report on the basal soil respira- tion rate and ATP concentration in a subarctic soil environ- ment after 8 years of artificial acidification. These parame- ters are used as estimates of microbial activity and micro- bial biomass, respectively. As fungi are likely to predomi- nate in acid soils, and populations of relatively acid-sensi- tive bacteria tend to decline with increasing acidity (Alex- ander 1980), we also separated the fungal and bacterial
8
f r ac t ions o f the m i c r o b i a l b i o m a s s b y m e a s u r e m e n t s o f er- gos te ro l and m u r a m i c acid.
Materials and methods
Site description
The study was carried out near the Kevo Subarctic Research Station (69 ~ 45' N, 27~ in northern Finland. The mean annual temperature and precipitation were -2.0~ and about 400 mm (30-40% falling as snow), respectively. The growing season lasts from 110 to 125 days. The study area is in general a dr),, nutrient-poor, mixed pine-moun- tain birch woodland (Pinus sylvestris, Betula pubenscens spp. tartuo- sa). Such pine forest outliers are typical of the Ulsjoki river valley (H~rnet-Ahti 1963). The ground cover is typically a mosaic of dwarf shrub and lichen patches, The area subject to an annual average back- ground deposition (1971-1988) of strong acids at 0.017 kmol H + ha -1, 1.70 kg SO4azS ha -1, and 0.45 kg NO3-N ha -1 (J~-vinen and V~inni 1990).
Experimental set-up and sampling
The samples were taken from plots belonging to a large-scale investiga- tion of the effects of simulated acid rain in a subarctic area (Neuvonen et al. 1990). The plot size was about 5x5 m, and each plot supported at least one pine and one mountain birch. The total number of plots used in tlae present study was 40. To guarantee a good interspersion of treat- ments, a randomized block design was used. The plots were in two ad- jacent subareas, both having five blocks consisting of four different treatments in random order. The treatments applied were dry control, irrigated control (spring water, pH 6), and two levels of simulated acid rain, pH 4 and pH 3 (Neuvonen et at. 1990). Originally (1985-1988), simulated acid rain was prepared by adding both H2SO4 and HNO3 (1.9:1 by weight). In 1989 the treatments were modified as follows. In subarea 1 treatments continued unchanged (H2SO4+HNO 3 in rain to pH 4 and pH 3), but in subarea 2 only H2SO 4 was applied (respec- tively). The cumulative levels of S and N applied during the experi- ment are shown in Table 1. The proton load supplied by the stronger acid treatment ( topH 3) in subarea 1 was about 13-fold higher than the ambient SOl--S- load and about 16-fold higher than the ambient NO3-N load, but was still within the range of deposition over wide areas in Central Europe (Kauppi et at. 1992).
Samples were collected between 26 June and 2 July 1992. At each plot, five subsamples (soil core diameter 7.2 cm) of the humus layer (F/I-I horizon) were separately combined to give bulk samples. After collection, the samples were coded and deep-frozen immedi- ately. Before analysis the samples were melted at room temperature, sieved to pass through a 4-ram mesh, and stored at 4~ not longer than 1 week. All the analyses were performed on the coded samples in random order by the analyst blinded to the treatment.
Table 1 Treatments on study plots. Subarea 2 was treated as subarea 1 until 1989
Treatment Subarea Cumulative acid stress 1985-1992 (kg ha -1)
S N
1985-1992 Irrigated control, pH 6 1+2 7.4 1.3 H2SO4+HNO3, pH 4 1 34.4 10.8 H2SO4+HNO3, pH 3 1 171.2 58.6
1989-1992 H2804, pH 4 2 34.4 5.6 H2804, pH 3 2 171.2 27.5
Ckemical analyses
Subsamples of field-moist humus were heated at 105~ for 12 h to determine the dry weight and moisture content; pH was measured in both water (1:2 v/v) and 0.1 M BaCla (1:10 v/v) supensions. Total or- ganic C and N were determined by dry combustion (Leco CHN-600) after the destruction of possible carbonate C by adding HC1 (10%). To determine the cation exchange capacity, extractions were made with unbuffered 0.1 M BaCle using a soil:solution volume ratio of 1:10, the suspensions were left to stand overnight before being sha- ken for 1 h and then filtered, Elemental concentrations of Ca, Ms, K, and Na were determined from the soil extracts, using a inductively coupled plasma emission spectrophotometer (ICP-AES, ARL 3580). Exchangeable acidity was determined from the BaC12 extracts by ti- tration with 0.05 M NaOH to an endpoint of pH 7. Cation exchange capacity was calculated as the sum of extractable base cations plus exchangeable acidity and was expressed in milliequivalents of 100 g dry weight soil. The degree of base saturation degree was expressed as the percentage of base cations in the cation exchange capacity.
Microbiological analyses
The soil moisture content was adjusted to 60% water-holding capacity and samples were stored for 7 days at 14~ to stabilize the microbio- logical properties. The soil respiration rate and the ATP content were determined from 4 g wet weight samples as described in Vanhala and Ahtiainen (1994). Ergosterol concentrations were measured as Fritze et at. (1994) using the modified method of Grant and West (I986). Muramic acid was extracted from 0.5 g wet weight of soil by hydro- lyzing the soil sample with 7.5 ml 6 M HC1 for 3 h at 105~ The hydrolyzate was centrifuged (3000 rpm, 10 min), and free muramic acid was analyzed from the supematant by adding 6 M NaOH to 50 gl of the supernatant to raise the pH to between 8 and 8.5 (Moriarty 1983; Zelles 1988). The muramic acid was derived with 500 pl o-phthalaldehyde2-mercaptoethanol (Zelles 1988), diluted with 400 gl HaO, and 40 gl was injected to a high performance li- quid chromatograph and analyzed as described in Rtnkk6 et al. (1994).
Statistical analyses
The r of subarea, blocks within subareas, treatments, and treat- mentxsubarea interaction on the microbiological and chemical char- acteristics of the soil samples were tested by analysis of variance for the randomized block experimental design. As soil respiration and mi- crobial biomass are known to be dependent on the soil C content (Nohrstedt 1985; Vanhala et at. 1995), the organic C content was used as a co-variate. Blocking within subareas captured a number of different sources of variability, in particular, the differences associated with sampling, treatment, and position of the study plots in the field (with associated differences in topography and vegetation, etc.). Thus the comparison among treatments (within blocks) was, in fact, an ex- tension of the matched-pair test. The model also tested the existence of a treatment• interaction. With this type of interaction there may be two sources (which cannot be separated), a differential effect of treatment in the two subareas because of possible differences in to- pography and soil conditions, or the modification to the simulated acid rain treatment in subarea 2 in 1989. The treatment effects were further separated into three orthogonal contrasts, according to Sokal and Rohlf (1981); the dry controls were compared with the other treatments (irrigated control and simulated acid rain), the irrigated controls were compared with all acid treatments (H2SO 4 with or with- out HNO3 at pH 3 or 4), and finally, the two levels of acid treatment (H2SO 4 with or without HNO3 at pH 4 versus H2SO 4 with or without HNO3 at pH 3) were compared. This was not the only possible way of testing an orthogonal contrast with these four treatment levels, but it was selected because of the probable importance of moisture condi- tions for the microbial measurements (Zelles et al. 1987; Neuvonen and Suomela 1990),
The posssible main and interactive effects of vegetation type were also screened. The study plots, although situated in a dry and nutri- ent-poor forest site, were approximately divided according to their ground vegetation into three classes on the basis of nutrient status and moisture: dry, medium, and moist plots. Dry plots were character- ized by lichens in the open areas and by dominant Empetrum hermaph- roditum and Vaccinium vitis-idaea under the trees; medium types had less lichen but more grasses (Calamagrostis lapponica and Festuca ovi- na) but were otherwise very similar to the dry plots (V. uliginosum and Ledum palustre occurred in some plots); and in the moist plots mosses (Polytrichum sp.) dominated the ground layer, while V. vitis-idaea and E. hermaphroditum still dominated the field layer. Vegetation type was partly confounded with the block term in our experimental de- sign, and vegetation type was explicitly included in the analysis of var- iance model only when analyzing soil respiration.
Results and discussion
Chemical properties
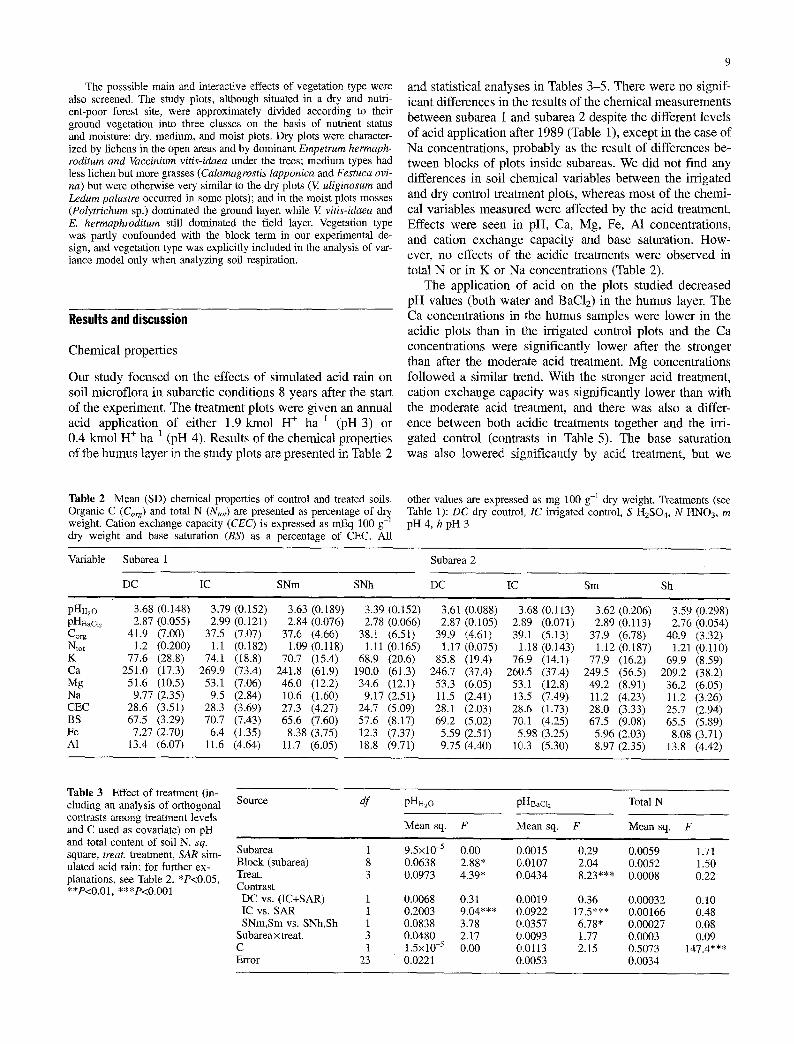
Our study focused on the effects of simulated acid rain on soil microflora in subarctic conditions 8 years after the start of the experiment. The treatment plots were given an annual acid application of either 1.9 kmol H + ha -I (pH 3) or 0.4 kmol H + ha -1 (pH 4). Results of the chemical properties of the humus layer in the study plots are presented in Table 2
and statistical analyses in Tables 3-5. There were no signif- icant differences in the results of the chemical measurements between subarea 1 and subarea 2 despite the different levels of acid application after 1989 (Table 1), except in the case of Na concentrations, probably as the result of differences be- tween blocks of plots inside subareas. We did not find any differences in soil chemical variables between the irrigated and dry control treatment plots, whereas most of the chemi- cal variables measured were affected by the acid treatment, Effects were seen in pH, Ca, Mg, Fe, A1 concentrations, and cation exchange capacity and base saturation. How- ever, no effects of the acidic treatments were observed in total N or in K or Na concentrations (Table 2).
The application of acid on the plots studied decreased pH values (both water and BaCI2) in the humus layer. The Ca concentrations in the humus samples were lower in the acidic plots than in the irrigated control plots and the Ca concentrations were significantly lower after the stronger than after the moderate acid treatment. Mg concentrations followed a similar trend. With the stronger acid treatment, cation exchange capacity was significantly lower than with the moderate acid treatment, and there was also a differ- ence between both acidic treatments together and the irri- gated control (contrasts in Table 5). The base saturation was also lowered significantly by acid treatment, but we
Table 2 Mean (SD) chemical properties of control and treated soils. Organic C (Corg) and total N (Ntot) are presented as percentage of weight. Cation exchange capacity (CEC) is expressed as mEq 100 g- dry weight and base saturation (BS) as a percentage of CEC. All
other values are expressed as mg 100 g-a dry weight. Treatments (see Table 1): DC dry control, IC irrigated control, S H2SO4, N HNO3, m pH 4, h pH 3
Variable Subarea 1
DC IC SNm SNh
pHH~o 3.68 (0.148) 3.79 (0.152) 3.63 (0.189) 3.39 (0.152) pHB~c12 2.87 (0.055) 2.99 (0.121) 2.84 (0.076) 2.78 (0.066) Co~g 41.9 (7.00) 37.5 (7.07) 37.6 (4.66) 38.1 (6.51) Ntot 1.2 (0.200) 1.1 (0.182) 1.09 (0.118) 1.11 (0.165) K 77.6 (28.8) 74.1 (18.8) 70.7 (15.4) 68.9 (20.6) Ca 251.0 (17.3) 269.9 (73.4) 241.8 (61.9) 190.0 (61.3) Mg 51.6 (10.5) 53.1 (7.06) 46.0 (12.2) 34.6 (12.1) Na 9.77 (2.35) 9.5 (2.84) 10.6 (1.60) 9.17 (2.51) CEC 28.6 (3.51) 28.3 (3.69) 27.3 (4.27) 24.7 (5.09) BS 67.5 (3.29) 70.7 (7.43) 65.6 (7.60) 57.6 (8.17) Fe 7.27 (2.70) 6.4 (1.35) 8.38 (3.75) 12.3 (7.37) A1 13.4 (6.07) 11.6 (4.64) 11.7 (6.05) 18.8 (9.71)
Subarea 2
DC IC Sm Sh
3.61 (0.088) 3.68 (0.113) 3.62 (0.206) 3.59 (0.298) 2.87 (0.105) 2.89 (0.071) 2.89 (0.113) 2.76 (0.054)
39.9 (4.61) 39.1 (5.13) 37.9 (6.78) 40.9 (3.32) 1.17 (0.075) 1.18 (0.143) 1.12 (0.187) 1.21 (0.110)
85.8 (19.4) 76.9 (14.1) 77.9 (16.2) 69.9 (8.59) 246.7 (37.4) 260.5 (37.4) 249.5 (56.5) 209.2 (38.2) 53.3 (6.05) 53.1 (12.8) 49.2 (8.91) 36.2 (6.05) 11.5 (2.41) 13.5 (7.49) 11.2 (4.23) 11.2 (3.26) 28.1 (2.03) 28.6 (1.73) 28.0 (3.33) 25.7 (2.94) 69.2 (5.02) 70.1 (4.25) 67.5 (9.08) 65.5 (5.89) 5.59 (2.51) 5.98 (3.25) 5.96 (2.03) 8.08 (3.71) 9.75 (4.40) 1(3,.3 (5.30) 8.97 (2.35) 13.8 (4.42)
Table 3 Effect of treatment (in- cluding an analysis of orthogonal contrasts among treatment levels and C used as covariate) on pH and total content of soil N. sq. square, treat, treatment, SAR sim- ulated acid rain; for further ex- planations, see Table 2. *P<0.05, **P<0.01, ***P<0.001
Source df pHH20
Subarea 1 Block (subarea) 8 Treat. 3 Contrast DC vs. (IC+SAR) 1 IC vs. SAR 1 SNm,Sm vs. SNh,Sh 1
Subareaxtreat. 3 C 1 Error 23
pHB~e12 Total N
Mean sq. F Mean sq. F Mean sq. F
9.5x10 -5 0.00 0.0015 0.29 0.0059 1.71 0.0638 2.88* 0.0107 2.04 0.0052 1.50 0.0973 4.39* 0.0434 8.23*** 0.0008 0.22
0.0068 0.31 0.0019 0.36 0.00032 0.10 0.2003 9.04*** 0.0922 17.5"** 0.00166 0.48 0.0838 3.78 0.0357 6.78* 0.00027 0.08 0.0480 2.17 0.0093 1.77 0.0003 0.09 1.5x10 -5 0.00 0.0113 2.15 0.5073 147.4"** 0.0221 0.0053 0.0034
10
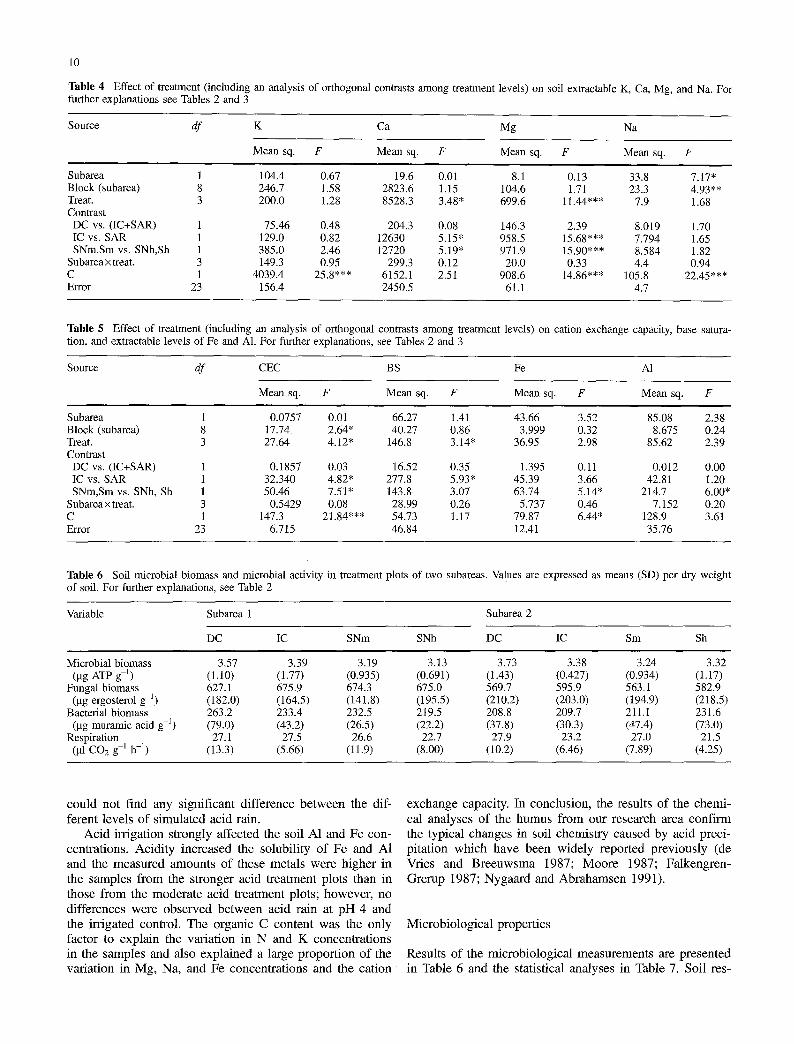
Table 4 Effect of treatment (including an analysis of orthogonal contrasts among treatment levels) on soil extractable K, Ca, Mg, and Na. For further explanations see Tables 2 and 3
Source df K Ca Mg Na
Mean sq. F Mean sq. F Mean sq. F Mean sq. F
Subarea 1 104.4 0.67 19.6 0.01 8.1 0.13 33.8 7.17" Block (subarea) 8 246.7 1.58 2823.6 1.15 104.6 1.71 23.3 4.93** Treat. 3 200.0 1.28 8528.3 3.48* 6 9 9 . 6 11.44"** 7.9 1.68 Contrast DC vs. (IC+SAR) 1 75.46 0.48 204.3 0.08 146.3 2.39 8.019 1.70 IC vs. SAR 1 129.0 0.82 12630 5.15" 958 .5 15.68"** 7.794 1.65 SNm,Sm vs. SNh,Sh 1 385.0 2.46 12720 5.19" 971 .9 15.90"** 8.584 1.82
Subareax treat. 3 149.3 0.95 299.3 0.12 20.0 0.33 4.4 0.94 C 1 4039.4 25.8*** 6152.1 2.51 9 0 8 . 6 14.86"** 105 .8 22.45*** Error 23 156.4 2450.5 61.1 4.7
Table 5 Effect of treatment (including an analysis of orthogonal contrasts among treatment levels) on cation exchange capacity, base satura- tion, and extractable levels of Fe and A1. For further explanations, see Tables 2 and 3
Source df CEC BS Fe A1
Mean sq. F Mean sq. F Mean sq. F Mean sq. F
Subarea 1 0.0757 0.01 66.27 1.41 43.66 3.52 85.08 2.38 Block (subarea) 8 17.74 2.64* 40.27 0.86 3.999 0.32 8.675 0.24 Treat. 3 27.64 4.12" 146.8 3.14" 36.95 2.98 85.62 2.39 Contrast DC vs. (IC+SAR) 1 0.1857 0.03 16.52 0.35 1.395 0.11 0.012 0.00 IC vs. SAR 1 32.340 4.82* 277.8 5.93* 45.39 3.66 42.81 1.20 SNm,Sm vs. SNh, Sh 1 50.46 7.51" 143.8 3.07 63.74 5.14" 214.7 6.00*
Subareaxtreat. 3 0.5429 0.08 28.99 0.26 5.737 0.46 7.152 0.20 C 1 147 .3 21.84"** 54.73 1.17 79.87 6.44* 128.9 3.61 Error 23 6.715 46.84 12.41 35.76
Table 6 Soil microbial biomass and microbial activity in treatment plots of two subareas. Values are expressed as means (SD) per dry weight of soil. For further explanations, see Table 2
Variable Subarea 1 Subarea 2
DC IC SNm SNh DC IC Sm Sh
Microbial biomass 3.57 3.39 3.19 3.13 3.73 3.38 3.24 3.32 (lag ATP g 1) (1.10) (1.77) (0.935) (0.691) (1.43) (0.427) (0.934) (1.17)
Fungal biomass 627.1 675.9 674.3 675.0 569.7 595.9 563.1 582.9 (gg ergosterol g l ) (182.0) (164.5) (141.8) (195.5) (210.2) (203.0) (194.9) (218.5)
Bacterial biomass 263.2 233.4 232.5 219.5 208.8 209.7 211.1 231.6 (lag muramic acid g-l) (79.0) (43.2) (26.5) (22.2) (37.8) (30.3) (47.4) (73.0)
Respiration 27.1 27.5 26.6 22.7 27.9 23.2 27.0 21.5 (gl CO 2 g 1 h-l) (13.3) (5.66) (11.9) (8.00) (10.2) (6.46) (7.89) (4.25)
could not find any significant difference between the d i f - ferent levels of simulated acid rain.
Acid irrigation strongly affected the soil A1 and Fe con- cent_rations. Acidity increased the solubility of Fe and A1 and the measured amounts of these metals were higher in the samples from the stronger acid treatment plots than in those from the moderate acid treatment plots; however, no differences were observed between acid rain at pH 4 and the irrigated control. The organic C content was the only factor to explain the variation in N and K concentrations in the samples and also explained a large proportion of the variation in Mg, Na, and Fe concentrations and the cation
exchange capacity. In conclusion, the results of the chemi- cal analyses of the humus from our research area confirm the typical changes in soil chemistry caused by acid preci- pitation which have been widely reported previously (de Vries and Breeuwsma 1987; Moore 1987; Falkengren- Grerup 1987; Nygaard and Abrahamsen 1991).
Microbiological properties
Results of the microbiological measurements are presented in Table 6 and the statistical analyses in Table 7. Soil res-
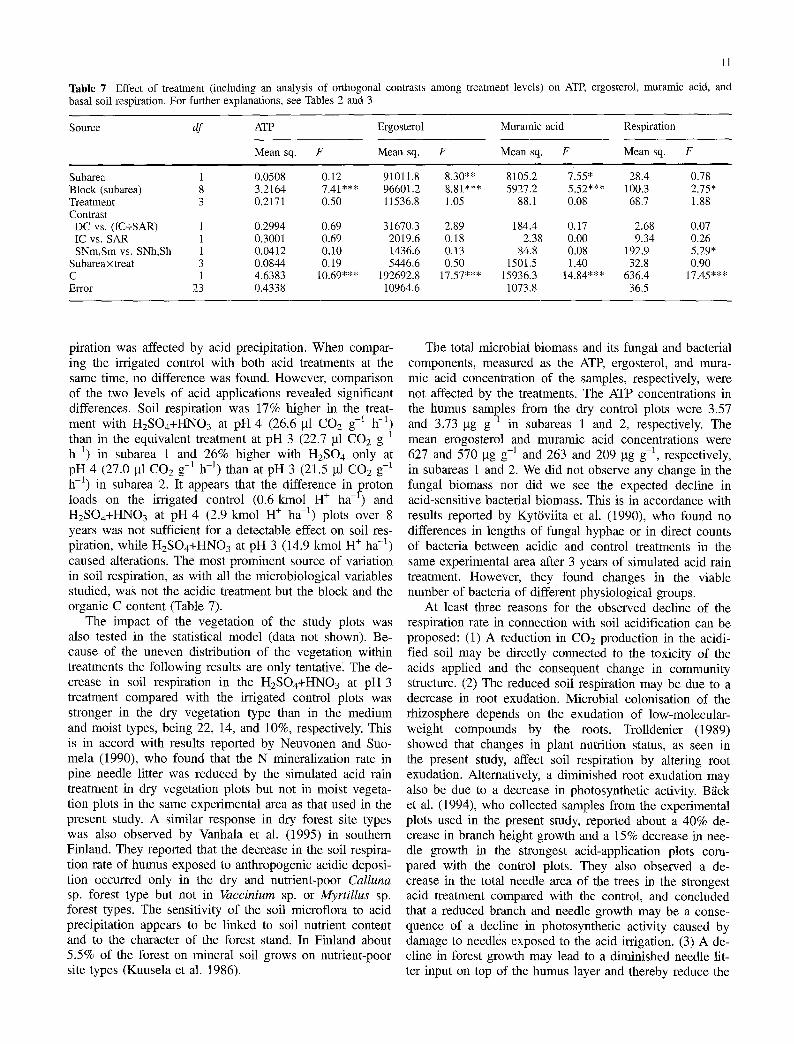
Table 7 Effect of treatment (including an analysis of orthogonal contrasts among treatment levels) basal soil respiration. For further explanations, see Tables 2 and 3
11
on ATP, ergosterol, muramic acid, and
Source df ATP Ergosterol Muramic acid Respiration
Mean sq. F Mean sq. F Mean sq. F Mean sq. F
Subarea 1 0.0508 0.12 91011.8 8.30** 8105.2 7.55* 28.4 0.78 Block (subarea) 8 3.2164 7.41"** 96601.2 8.81"** 5927.2 5.52*** 100.3 2.75* Treatment 3 0.2171 0.50 11536.8 1.05 88.1 0.08 68.7 1.88 Contrast DC vs. (IC+SAR) 1 0.2994 0.69 31670.3 2.89 184.4 0.17 2.68 0.07 IC vs. SAR 1 0.3001 0.69 2019.6 0.18 2.38 0.00 9.34 0.26 SNm,Sm vs. SNh,Sh 1 0.0412 0.10 1436.6 0.13 84.8 0.08 192.9 5.29*
Subareaxtreat 3 0.0844 0.19 5446.6 0.50 1501.5 1.40 32.8 0.90 C 1 4.6383 10.69"** 192692.8 17.57"** 15936.3 14.84"** 636.4 17.45"** Error 23 0.4338 10964.6 1073.8 36.5
piration was affected by acid precipitation. When compar- ing the irrigated control with both acid treatments at the same time, no difference was found. However, comparison of the two levels of acid applications revealed significant differences. Soil respiration was 17% higher in the treat- ment with H2SO4+HNO 3 at pH 4 (26.6 gl CO2 g-~ h -~) than in the equivalent treatment at pH 3 (22.7 gl CO2 g-1 h -1) in subarea 1 and 26% higher with H2SO 4 only at pH 4 (27.0 ~tl COa g-1 h-l) than at pH 3 (21.5 gl CO2 g-i
t h- ) in subarea 2. It appears that the difference in proton loads on the irrigated control (0.6 kmol H § ha -l) and H2SO4+HNO3 at pH 4 (2.9 kmol H + ha -1) plots over 8 years was not sufficient for a detectable effect on soil res- piration, while H2SO4+HNO 3 at pH 3 (14.9 kmol H + ha -z) caused alterations. The most prominent source of variation in soil respiration, as with all the microbiological variables studied, was not the acidic treatment but the block and the organic C content (Table 7).
The impact of the vegetation of the study plots was also tested in the statistical model (data not shown). Be- cause of the uneven distribution of the vegetation within treatments the following results are only tentativel The de- crease in soil respiration in the H2SO4+HNO3 at pH 3 treatment compared with the irrigated control plots was stronger in the dry vegetation type than in the medium and moist types, being 22, 14, and 10%, respectively. This is in accord with results reported by Neuvonen and Suo- mela (1990), who found that the N mineralization rate in pine needle litter was reduced by the simulated acid rain treatment in dry vegetation plots but not in moist vegeta- tion plots in the same experimental area as that used in the present study. A similar response in dry forest site types was also observed by Vanhala et al. (1995) in southern Finland. They reported that the decrease in the soil respira- tion rate of humus exposed to anthropogenic acidic deposi- tion occurred only in the dry and nutrient-poor Calluna sp. forest type but not in Vaccinium sp. or Myrtillus sp. forest types. The sensitivity of the soil microflora to acid precipitation appears to be linked to soil nutrient content and to the character of the forest stand. In Finland about 5.5% of the forest on mineral soil grows on nutrient-poor site types (Kuusela et al. 1986).
The total microbial biomass and its fungal and bacterial components, measured as the ATR ergosterol, and mura- mic acid concentration of the samples, respectively, were not affected by the treatments. The ATP concentrations in the humus samples from the dry control plots were 3.57 and 3.73 ~tg g-X in subareas 1 and 2, respectively. The mean erogosterol and muramic acid concentrations were 627 and 570 gg g-1 and 263 and 209 gg g-a, respectively, in subareas 1 and 2. We did not observe any change in the fungal biomass nor did we see the expected decline in acid-sensitive bacterial biomass. This is in accordance with results reported by Kyttviita et al. (1990), who found no differences in lengths of fungal hyphae or in direct counts of bacteria between acidic and control treatments in the same experimental area after 3 years of simulated acid rain treatment. However, they found changes in the viable number of bacteria of different physiological groups.
At least three reasons for the observed decline of the respiration rate in connection with soil acidification can be proposed: (1) A reduction in CO2 production in the acidi- fied soil may be directly connected to the toxicity of the acids applied and the consequent change in community structure. (2) The reduced soil respiration may be due to a decrease in root exudation. Microbial colonisation of the rhizosphere depends on the exudation of low-molecular- weight compounds by the roots. Trolldenier (1989) showed that changes in plant nutrition status, as seen in the present study, affect soil respiration by altering root exudation. Alternatively, a diminished root exudation may also be due to a decrease in photosynthetic activity. B~ick et al. (1994), who collected samples from the experimental plots used in the present study, reported about a 40% de- crease in branch height growth and a 15% decrease in nee- dle growth in the strongest acid-application plots com- pared with the control plots. They also observed a de- crease in the total needle area of the trees in the strongest acid treatment compared with the control, and concluded that a reduced branch and needle growth may be a conse- quence of a decline in photosynthetic activity caused by damage to needles exposed to the acid irrigation. (3) A de- cline in forest growth may lead to a diminished needle lit- ter input on top of the humus layer and thereby reduce the
12
amount of suitable substrate for microbes, leading to de- creased microbial activity.
On the basis of short-term laboratory experiments Bew- ley and Stotzky (1983) reported that different anionic con- stituents of acid rain affect microbial respiratory activity differently. In their experiment, combined H2SO4 and HNO3 was more toxic than H2SO4 alone. We did not ob- serve any difference between our subarea 1 (t-I2SO 4 and HNO3) and subarea 2 (H2SO4) in soil respiration or bio- mass measurements. We also expected that irrigation of the soil (irrigation control versus dry control) would have an influence on the variables we measured. Zelles et al. (1987) and von Lfitzow et al. (1992) reported that an irri- gated control yielded higher respiration and biomass N va- lues than a dry control treatment. Because the results from the dry and the irrigated control did not differ in the pre- sent study, soil moisture was apparently, not a limiting fac- tor for microbial activity or biomass. The reason for this might have been the unusually heavy rains during summer 1992 when the sampling took place.
Vanhala et al. (1995) presented regression models be- tween the organic C content of the soil sample and the soil respiration rate and the ATP concentration for differ- ent forest types in southern Finland. Using their model for the Calluna sp. forest type, which corresponds to the type in the present study, and our dry control organic C values, the model predicts lower values for the soil respiration rate (20.5 gl g-1 h-l) and the ATP concentration (1.15 tag g-S) than those actually measured in the present study (27.5 gl g-1 h-i and 3.65 gg g-l, respectively). This is in accord with results reported by Bringmark and Bringmark (1991), who found a north-south gradient, with increasing values towards the north representing the soil respiration rate in the mor layer of Swedish coniferous forests. Ergos- terol and muramic acid concentrations were higher in the soil of the present study than values reported in more southern areas. Fritze et al. (1994) reported ergosterol va- lues of ca. 400 gg g-~ and Zelles et al. (1990) muramic acid values of ca. 120 gg g-1 in humus layers of southern Germany.
The subarctic areas of Ettrope, including Finnish Lap- land, repeatedly undergo episodes of high acidity with either dry or wet deposition. In nothern and northeastern Lapland this acidity comes mainly from sulphates, about 55% of which are deposited dry, being released by the indus- trial centers of the Kola Peninsula (Tuovinen et al. 1993). In northernmost forest areas exposed to acidic deposition in Finland, coniferous species are growing at their extreme ecological limits (Kallio etal . 1969). Therefore it has been postulated that the northernmost terrestrial ecosystems are more sensitive to acidic deposition than boreal or temperate ecosystems. If this also holds for the subarctic soil environ- ment a negative effect on the microbial variables measured in the present study will be achieved with lower proton in- put loads. Therefore the results obtained were compared with those from non-subarctic areas in relation to the calcu- lated experimental proton input loads.
There have been a number of studies on the impact of artificial soil acidification on soil microbiological proper-
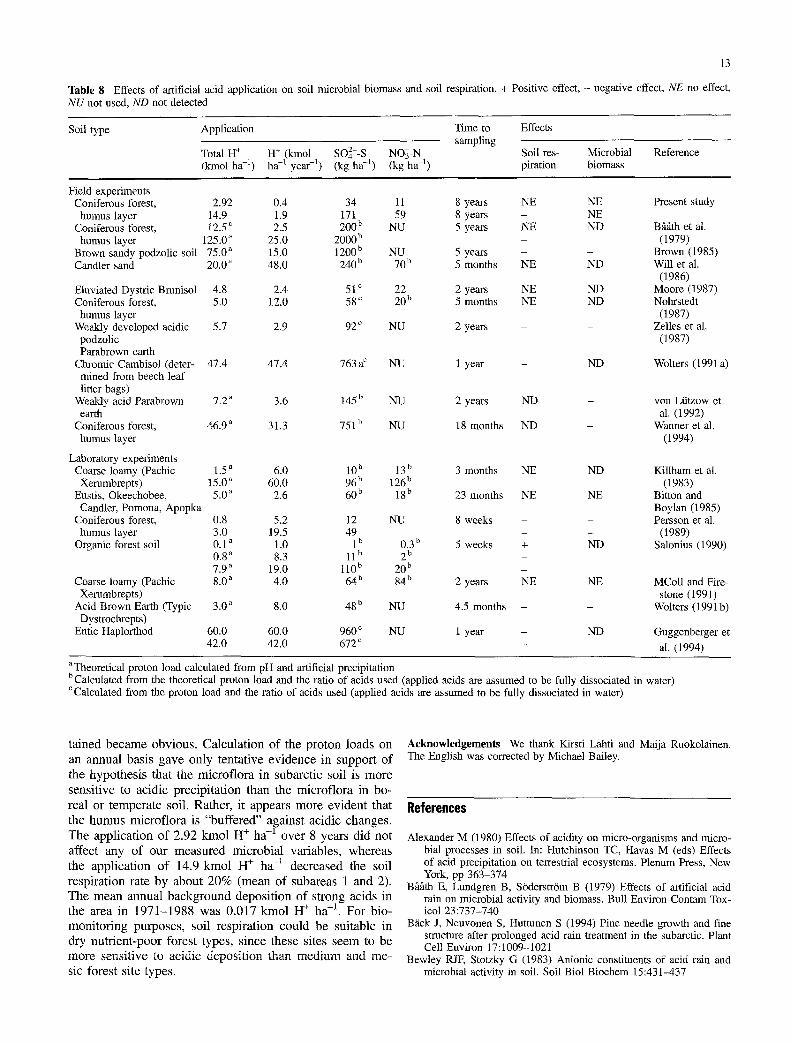
ties. Table 8 lists experiments in which the soil respiration rate or soil microbial biomass was measured in order to de- termine whether, independently of different soil origins, there is a critical proton load in the soil which affects the soil respiration rate. We recalculated the acid application used in the experiments, if not given in the original paper, in relation to the proton input (kmol H + ha-l), the proton input over 1 year (kmol H + ha -1 year-l), S (kg SO42--S ha-l), or N (kg NO3--N ha -1) in order to compare the differ- ent experiments. In Table 1 the experiments are divided into two main groups, field and laboratory experiments.
It was difficult to estimate any clear level of proton in- put at which the soil microflora is affected. Effects have been observed on the respiration rate and on the level of microbial biomass but the results are highly variable and also partly contradictory. Following acid rain treatment, soil respiration was reported as unaffected, decreased, or increased (Table 8). It appears that a decrease in the soil respiration and in the microbial biomass is observed at least at extremely high acid loads. The lowest proton input (applied until sampling) that decreased soil respiration in field studies was reported to be 5.7 kmol H + h a -1 (Zelles et al. 1987). However, Will et al. (1986) used 20 kmol H + ha -1 without observing any effects on soil respiration. These results must depend not only on the soil type but also on the duration of the study and the annual acid ap- plication (Table 8). In the group of laboratory experiments, the highest proton input without effects was 8.0 kmol H + ha -1 over a period of 2 years (McColl and Firestone 1991) and the lowest input that caused a reduction in soil respira- tion was 0.8 kmol H + ha -I, which was used in two differ- ent experiments (Persson et al. 1989; Salonius 1990). A low level (0.1 kmol H + ha -~) of application appeared to increase the soil respiration rate (Salonius 1990).
The soil microbial biomass concentration was less fre- quently used as a variable than soil respiration in the artifi- cial acidification studies. The lowest proton load that cause a decrease in the microbial biomass was 5.7 kmol H + ha -1 over 2 years in a field experiment (Zelles et al. 1987) but only 0.8 kmol H + ha -1 in a laboratory study (Persson et al. 1989). McColl and Firestone (1991) applied 8.0 kmol H + ha -1 in a laboratory study without observing any changes in the microbial biomass. In the present study we used a considerably higher proton load (14.9 kmol H § ha -1) without any decrease in the microbial biomass.
One reason for the differences between the reported ob- servations might be the varying periods of time over which the artificial acidification studies were carried out. Most of the artificial acid rain experiments were carried out over a relatively short time, so that the microflora had little time to adapt to the new, more acidic environment. Recalculating the lowest applications of acid that caused an effect in field and laboratory experiments (Zelles et al. 1987; Salonius 1990; Persson et al. 1989; Table 8) on an annual basis, we obtained 2.9, 8.3, and 5.2 kmoI H + ha -1 year -1, respec- tively. These values exceed the highest annual acid load used in the present study (1.9 kmol H + ha-l).
In comparing our results with those in the studies re- viewed ones, the importance of time for the results ob-
13
Table 8 Effects of artificial acid application on soil microbial biomass and soil respiration. + Positive effect, - negative effect, NE no effect, NU not used, ND not detected
Soil type Application Time to Effects sampling
Total H + H + (kmol SO4z--S NOg-N Soil res- Microbial Reference (kmol ha -t) ha -t year -t) (kg ha -t) (kg ha -t) piration biomass
Field experiments Coniferous forest, 2.92
humus layer 14.9 Coniferous forest, 12.5"
humus layer 125,0 ~ Brown sandy podzolic soil 75.0 ~ Candler sand 20.0 a
Eluviated Dystric Brunisol 4.8 Coniferous forest, 5.0
humus layer Weakly developed acidic 5.7
podzolic Parabrown earth
Chromic Cambisol (deter- 47.4 mined from beech leaf litter bags)
Weakly acid Parabrown 7.2 a earth
Coniferous forest, 46.9 a
humus layer
Laboratory experiments Coarse loamy (Pachic 1.5 a
Xerumbrepts) 15.0 a Eustis, Okeechobee, 5.0 a
Candler, Pomona, Apopka Coniferous forest,
humus layer Organic forest soil
Coarse loamy (Pachic Xerumbrepts)
Acid Brown Earth (Typic Dystrochrepts)
Entic Haplorthod
0.4 34 1.9 171 2.5 200 b
25.0 2000 b 15.0 1200 b 48.0 240 b
2.4 51 c 12.0 58 c
2.9 92 c
47.4 763a c
3.6 145 b
31.3 751 b
6.0 lO b
60.0 96 b 2.6 60 b
0.8 5.2 12 3.0 19.5 49 0.1 a 1.0 1 b 0.8 a 8.3 11 b 7.9 a 19.0 l l0 b 8.0 ~ 4.0 64b
3.0 a 8.0 48 b
60.0 60.0 960 c 42.0 42.0 672 c
11 8 years NE NE Present study 59 8 years - NE
NU 5 years NE ND Bgt~tth et al. - (1979)
NU 5 years - - Brown (1985) 70 b 5 months NE ND Will et al.
(1986) 22 2 years NE ND Moore (1987) 20 b 5 months NE ND Nohrstedt
(1987) NU 2 years - - Zelles et al.
(1987)
NU 1 year - ND Wolters (1991 a)
NU 2 years ND - yon Liitzow et al. (1992)
NU 18 months ND - Wanner et al. (1994)
13 b 3 months NE ND Killham et al. 126 b (1983)
18 b 23 months NE NE Bitton and Boylan (1985)
NU 8 weeks - - Persson et al. - - (1989)
0.3 b 5 weeks + ND Salonius (1990) 2 b
20 b 84 b 2 years NE NE MColl and Fire-
stone (1991) NU 4.5 months - - Wolters (1991b)
NU 1 year - ND Guggenberger et
- al. (1994)
aTheoretical proton load calculated from pH and artificial precipitation bCalculated from the theoretical proton load and the ratio of acids used (applied acids are assumed to be fully dissociated in water) CCaleulated from the proton load and the ratio of acids used (applied acids are assumed to be fully dissociated in water)
t a ined b e c a m e obv ious . Ca l cu l a t i on o f the p r o t o n loads on
an annua l bas i s g a v e on ly t en ta t ive e v i d e n c e in suppo r t o f
the h y p o t h e s i s tha t the m i c r o f l o r a in subarc t i c soil is m o r e sens i t ive to acidic p rec ip i t a t ion t han the mic ro f lo ra in bo-
real or t e m p e r a t e soil. Rather , i t appears m o r e e v i d e n t tha t
the h u m u s m i c r o f l o r a is " b u f f e r e d " aga ins t ac id ic changes .
The app l i ca t ion o f 2 .92 k m o l H § h a -1 o v e r 8 years d id no t affect any o f our m e a s u r e d m i c r o b i a l var iables , whe rea s the app l i ca t ion o f 14.9 k m o l H + h a -1 dec reased the soil
r e sp i ra t ion ra te b y a b o u t 2 0 % ( m e a n o f suba reas 1 and 2). T h e m e a n a n n u a l b a c k g r o u n d depos i t i on o f s t rong acids in the area in 1 9 7 1 - 1 9 8 8 was 0 .017 k m o l H § h a -1. For b io-
m o n i t o r i n g pu rposes , soi l r esp i ra t ion cou ld b e su i tab le in dry n u t r i e n t - p o o r fores t types , s ince these si tes s e e m to be
m o r e sens i t i ve to ac id ic d e p o s i t i o n t han m e d i u m and me- sic fores t si te types .
Acknowledgements We thank Kirsti Lahti and Maija Ruokolainen. The English was corrected by Michael Bailey.
References
Alexander M (1980) Effects of acidity on micro-organisms and micro- bial processes in soil. In: Hutchinson TC, Havas M (eds) Effects of acid precipitation on terrestrial ecosystems. Plenum Press, New York, pp 363-374
Bgtfith E, Lundgren B, SOderstrtm B (1979) Effects of artificial acid rain on microbial activity and biomass. Bull Environ Contain Tox- icol 23:737-740
Brick J, Neuvonen S, Huttunen S (1994) Pine needle growth and fine structure after prolonged acid rain treatment in the subarctic. Plant Cell Environ 17:1009-1021
Bewley RJF, Stotzky G (1983) Anionic constituents of acid rain and microbial activity in soil. Soil Biol Biochem 15:431--437
14
Bitton G, Boylan RA (1985) Effects of acid precipitation on soil mi- crobial activity: I. Soil core studies. J Environ Qual 14:66-69
Bringmark E, Bringmark L (1991) Large-scale pattern of mor layer degradability in Sweden measured as standardized respiration. Lect Notes Earth Sci 33:255-259
Brown KA (1985) Acid deposition: Effect of sulphuric acid at pH 3 on chemical and biochemical properties of bracken litter. Soil Biol Biochem 17:31-38
Falkengren-Grerup U (1987) Long-term changes in the pH of forest soils in southern Sweden. Environ Pollnt 43:79-90
Fritze H (1992) Effects of environmental pollution on forest soil mi- croflora - a review. Silva Fenn 26:37-47
Fritze H, Smolander A, Levula T, Kitunen V, M~ilk6nen E (1994) Wood-ash fertilization and fire treatments in a Scots pine forest stand: Effects on the organic layer, microbial biomass, and micro- bial activity. BioI Fertil Soils 17:57-63
Grant WD, West AW (1986) Measurement of ergosterol, diaminopi- melic acid and glucosamine in soil: Evaluation as indicators of microbial biomass. J Microbiol Methods 6:47-53
Guggenberger G, Glaser B, Zech W (1994) Heavy metal binding by hydrophobic and hydrophilic dissolved organic carbon fractions in a spodosol A and B horizon. Water Air Soil Pollut 72:111-127
Hgrnet-Ahti L (1963) Zonation of the mountain birch forest in north- ernmost Fennoscandia. Annales botanici Societatis zoologicae-bo- tanicae Fennicae 34, 4:1-127
J~vinen O, Vfinni T (1990) Bulk deposition chemistry in Finland. In: Kauppi B, Anttila P, KenttSmies K (eds) Acidification in Finland. Springer-Verlag, Berlin Heidelberg, pp 151-165
Kallio P, Laine U, M~ldnen Y (1969) Vascular flora of Inari Lapland. I. Introduction and Lycopodiaceae - Polypodiaceae. Rep Kevo Res Sta 5:1- t08
Kauppi E Anttila P, Kentt~mies K (1990) Acidification in Finland. Springer-Verlag, Berlin Heidelberg
Kauppi PE, Mielik~iinen K, Kuusela K (1992) Biomass and carbon budget of European forests, 1971 to 1990. Science 256:70-74
Killham K, Firestone MK, McColl JG (1983) Acid rain and soil mi- crobial activity: Effects and their mechanisms. J Environ Qual 12:133-137
Kuusela K, Mattila E, Salminen S (1986) Forest resources in north Finland by forestry board districts, 1982 to 1984. Folia For 655:1-86
Kyt6viita M-M, Fritze H, Neuvonen S (1990) The effects of acidic ir- rigation on soil microorganisms at Kevo, Northern Finland. Envi- ron Pollut 66:21-31
yon Ltttzow M, Zelles L, Scheunert I, Ottow JCG (1992) Seasonal ef- fects of liming, irrigation, and acid precipitation on microbial bio- mass N in a spruce (Picea abies L.) forest soil. Biol Fertil Soils 13:130-134
McColl JG, Firestone MK (1991) Soil chemical and microbial effects of simulated acid rain on clover and soft chess. Water Air Soil Pollut 60:301-313
Moore TR (1987) The effect of simulated acid rain on the nutrient status of subarctic woodland soil in eastern Canada. Can J For Res 17:370-378
Moriarty DJW (1983) Measurement of muramic acid in marine sedi- ments by high performance liquid chromatography. J Microbiol Methods 1:111-117
Nohrstedt H-13 (1985) Biological activity in soil from forest stands in central Sweden, as related to site properties. Microb Ecol 11:259- 266
Nohrstedt H-O (1987) A field study on forest floor respiration re- sponse to artificial heavy metal contaminated acid rain. Scand J For Res 2:13-19
Neuvonen S, Suomela J (1990) The effect of simulated acid rain on pine needle and birch leaf litter decomposition. J Appl Ecol 27:857-872
Neuvonen S, Suomela J, Hankioja E, Lindgren M, RuohomXki K (1990) Ecological effects of simulated acid rain in a subarctic area with low ambient sulphur deposition. In: Kauppi R Anttila R Kenttfimies K (eds) Acidification in Finland. Springer Verlag, Ber- lin Heidelberg, pp 477-493
Nygaard PH, Abrahamsen G (1991) Effects of long-term artificial acidification on the ground vegetation and soil in a 100 year-old stand of Scots pine (Pinus sylvestris). Plant and Soil 131:151-160
Persson T, Lundkvist H, Wiren A, Hyv6nen R, Wessen B (1989) Ef- fects of acidification and liming on carbon and nitrogen minerali- zation and soil organism in mor humus. Water Air Soil Pollut 45:77-96
R6nkk6 R, Pennanen T, Smolander A, Kimnen V, Kortemaa H, Haah- tela K (1994) Quantification of Frankia strains and other root-as- sociated bacteria in pure cultures and in the rhizosphere of axenic seedlings by high-performance liquid chromatography-based muramic acid assay. Appl Environ Microbiol 60:3672-3678
Salonius PO (1990) Respiration rates in forest soil organic horizon materials treated with simulated acid rain. Can J For Res 20:910- 913
Sokal R, Rohlf FJ (1981) Biometry, 2nd edn. Freeman, New York Tuovinen J-R Laurila T, L/ittil~i H, Ryaboshapko A, Brukhanov P,
Korovlev S (1993) Impact of the sulphur dioxide sources in the Kola peninsula on air quality in northernmost Europe. Atmos En- viron 27A: 1379-1395
Trolldenier G (1989) Plant nutritional and soil factors in relation to microbial activity in the rhizosphere, with particular emphasis on denitrification. Z Pflanzenemghr Bodenkd 152:223-230
Vanhala R Ahtialnen J (1994) Soil respiration, ATP content and Photobacterium toxicity test as indicators of metal pollution in soil. Environ Toxicol Water Qual 9:115-121
Vanhala R Kiikkil~i O, Fritze H (1995) Microbial responses of forest soil to moderate anthropogenic air pollution: A large scale field survey. Water Air Soil Pollut (in press)
de Vries W, Breeuwsma A (1987) The relation between soil acidifica- tion and element cycling. Water Air Soil Pollut 35:293-310
Wanner M, Funke I, Funke W (1994) Effects of liming, fertilization and acidification on pH, soil moisture, and ATP concentration of soil from a spruce forest in southern Germany. Biol Fertil Soils 17:297-300
Will ME, Graetz DA, Roof BS (1986) Effect of simulated acid preci- pitation on soil microbial activity in a Typic Quartzipsamment. J Environ Qual 15:399-403
Wolters V (1991a) Effects of acid rain on leaf-litter decomposition in a beech forest on calcareous soil. Biol Fertil Soils 11:151-156
Wolters V (1991b) Biological processes in two beech forest soils treated with simulated acid rain - a laboratory experiment with Isotoma Tigrina (insecta, collenbola). Soil Biol Biochem 23:381-390
Zelles L (1988) The simultaneous determination of muramic acid and glucosamine in soil by high-performance liquid chromatography with precolumn fluorescence derivatisation. Biol Fertil Soils 6:125-130
Zelles L, Scheunert I, Kreutzer K (1987) Effect of artificial irrigation, acid precipitation and liming on the microbial activity in soil of a spruce forest. Biol Fertil Soils 4:137-143
Zelles L, Stepper K, Zsolnay A (1990) The effect of lime on micro- bial activity in spruce (Picea abis L.) forests. Biol Fertil Soils 9:87-82