project performance audit report for indonesia fileasian development bank operations evaluation...
TRANSCRIPT

ASIAN DEVELOPMENT BANK Operations Evaluation Department
PROJECT PERFORMANCE AUDIT REPORT
FOR
INDONESIA
In this electronic file, the report is followed by the Management response.

Project Performance Audit Report
PPA: INO 24333 (Final)
Higher Education Project (Loan 1253-INO) in Indonesia January 2005
Operations Evaluation Department ecial Evaluation Study

CURRENCY EQUIVALENTS
Currency Unit –Indonesian Rupiah (Rp)
At Appraisal At Project Completion At Operations Evaluation (May 1993) (June 2000) (July 2004)
Rp1.00 = $0.000478 $0.000103 $0.000109 $1.00 = Rp2,091 Rp9,685 Rp9,185
ABBREVIATIONS
ADB – Asian Development Bank AMIK – Akademi Manajemen Informatika dan Komputer BIOTROP – Southeast Asian Regional Center for Tropical Biology BME – benefit monitoring and evaluation CPIU – central project implementation unit DGHE – Directorate General of Higher Education EIRR – economic internal rate of return GER – gross enrollment rate IRM – Indonesia Resident Mission ITS – Sepuluh Nopember Technological Institute, Surabaya (Surabaya Institute of Technology) LPIU – local project implementation unit MDG – Millennium Development Goal MONE – Ministry of National Education MORA – Ministry of Religious Affairs NER – net enrollment rate OEM – Operations Evaluation Mission PCR – project completion report PPAR – project performance audit report PSC – Project Steering Committee REPELITA – Rencana Pembangunan Lima Tahun (Five-Year Development Plan) UNEJ – University of Jember UNSOED – University of Jenderal Soedirman
NOTES
(i) The fiscal year (FY) of the Government ends on 31 December. (ii) In this report, “$” refers to US dollars.
Director General, Operations Evaluation Department: Bruce Murray Evaluation Team Leader: Suganya Hutaserani
Operations Evaluation Department, PE-659

CONTENTS
Page BASIC DATA iii EXECUTIVE SUMMARY iv MAP vii I. BACKGROUND 1 A. Rationale 1
B. Formulation 1 C. Purpose and Outputs 1 D. Cost, Financing, and Executing Arrangements 2 E. Completion and Self-Evaluation 2 F. Operations Evaluation 2
II. PLANNING AND IMPLEMENTATION PERFORMANCE 3
A. Formulation and Design 3 B. Achievement of Outputs 4 C. Cost and Scheduling 5 D. Procurement and Construction 5 E. Organization and Management 6
III. ACHIEVEMENT OF PROJECT PURPOSE 7
A. Operational Performance 7 B. Performance of the Operating Entity 12 C. Sustainability 12 D. Economic Reevaluation 13
IV. ACHIEVEMENT OF OTHER DEVELOPMENT IMPACTS 13
A. Socioeconomic Impact 13 B. Environmental Impact 14 C. Impact on Institutions and Policy 14
Suganya Hutaserani, principal evaluation specialist (team leader), prepared this report, conducted document reviews and key informant interviews, and guided the fieldwork undertaken by the international consultant. Norma Llena, international consultant, managed a local team of survey coordinators and enumerators, conducted field surveys, and prepared survey tables and background of the higher education sector in Indonesia. Olive Nuestro, evaluation officer, supported the team with research assistance from Manila. The guidelines formally adopted by the Operations Evaluation Department (OED) on avoiding conflict of interest in its independent evaluations were observed in the preparation of this report. To the knowledge of the management of OED, there were no conflicts of interest of the persons preparing, reviewing, or approving this report.

ii
Page V. OVERALL ASSESSMENT 14
A. Relevance 14 B. Efficacy 15 C. Efficiency 15 D. Sustainability 15 E. Institutional Development and Other Impacts 15 F. Overall Project Rating 16 G. Assessment of Asian Development Bank and Borrower Performance 16
VI. ISSUES, LESSONS, AND FOLLOW-UP ACTIONS 16
A. Key Issues for the Future 16 B. Lessons Identified 17 C. Follow-Up Actions 17
APPENDIXES 1. Estimated and Actual Project Costs 19 2. Project Universities/Institutions and the Sample Surveys 20 3. Education System and Organizational Structure 22 4. Achievement of Output Targets 25 5. Output and Outcome Analysis 27 6. Sustainability Analysis 39 7. Economic Analysis 41 8. Socioeconomic Status of the Sample Graduates 44 Attachment: Management Response on the Project Performance Audit Report
on the Higher Education Project (Loan 1253-INO) in Indonesia.

BASIC DATA Higher Education Project (Loan 1253-INO)
Project Preparation TA No. TA Name Type Person-Months Amount1 ($) Approval Date 1702 Outer-Islands
Universities Project PPTA 35.5 465,000 25 May 1992
1761 Surabaya Institute of Technology Project
ADTA 78,000 30 Sep 1992
Key Project Data ($ million) As per ADB Loan Documents Actual Total Project Cost 235.0 161.9 Foreign Exchange Cost 121.7 91.7 Local Currency Cost 113.3 70.2 ADB Loan Amount/Utilization 140.0 102.6 ADB Loan Amount/Cancellation 37.4 Key Dates Expected Actual Fact-Finding Oct 1991 11-Feb–4 Mar 1993Appraisal Dec 1991 29 Apr–21 May 1993Loan Negotiations Jun 1992 16 Aug–20 Aug 1993Board Approval Jul 1992 21 Sep 1993Loan Agreement Aug 1992 02 Mar 1994Loan Effectiveness Jan 1994 29 Apr 1994First Disbursement 1 Jun 1994Project Completion 30 Oct 1999 30 Apr 2000Loan Closing 1 April 2000 15 Jan 2001Months (effectiveness to completion) 66 72 Key Performance Indicators Internal Rate of Return (%) Appraisal (Estimated by PPAR) PCR PPAR Economic Internal Rate of Return 17.5% – 9.4% Borrower Republic of Indonesia Executing Agency Directorate General of Higher Education Mission Data Type of Mission No. of Missions No. of Person-Days Fact-Finding 1 84 Appraisal 1 100 Project Administration Inception 1 8 Review 8 112 Project Completion 1 75 Operations Evaluation 1 382 ADB = Asian Development Bank, ADTA = advisory technical assistance, PCR = project completion report, PPAR = project performance audit report, PPTA = project preparatory technical assistance, TA = technical assistance. 1 Approved amount. 2 Comprising S. Hutaserani (Mission Leader/Principal Evaluation Specialist) and N. Llena (Staff Consultant/Education
Evaluation Specialist), who visited Indonesia during 28 June–16 July 2004.

EXECUTIVE SUMMARY Since the formulation of the First Five-Year Development Plan (REPELITA I, 1969–1973), education has been accorded high priority by the Government of Indonesia. With significant progress made in primary and secondary education, REPELITA V (1989–1993) and REPELITA VI (1994–1998) focused on higher (tertiary) education to build up a strong competitive workforce, which is a precondition for increased productivity and sustainable economic growth. During the early 1990s, there was a substantial imbalanced development and unsatisfied regional demand for qualified human resources in engineering, science, and technology. These factors demonstrated the need to focus on less-developed parts of the country through upgrading regional universities. The upgrading would provide students with greater access to good regional universities, save them the higher costs of education at major urban centers, and increase their employment prospects and chances of staying in their regions. Thus, in 1991, the Government requested the Asian Development Bank (ADB) to support the Higher Education Project. The project objectives were to improve the quality and efficiency of higher education in selected regional public and private universities/institutions. This was expected to reduce regional imbalances in the long run. The Project comprised three main components: (i) regional university development to strengthen 9 public universities in different provinces (e.g., curriculum development/improvement; staff development; improved equipment, teaching/research facilities, and learning materials; and student and technical support), together with 21 nearby less-developed private universities/institutions; (ii) university networking to reduce the insularity of higher education institutions and increase complementarity among them by strengthening the capacity of two major public institutions to function as regional resource centers; and (iii) management strengthening at the central and regional levels.
The Directorate General of Higher Education (DGHE), under the Ministry of National Education, was the Executing Agency. It established the central project implementation unit to manage project implementation. A local project implementation unit (LPIU) was established at each project university by its rector to manage day-to-day project implementation. A Project Steering Committee, chaired by the DGHE Director General, was established to give policy guidance to the central project implementation unit. It included representatives from concerned agencies.
The Project envisaged an implementation of 5.5 years. Actual implementation took 6.0 years. This was mainly due to a 4-month initial delay in loan effectiveness. There was a lack of proper guidance and training to LPIUs in carrying out their responsibilities. Project implementation was also affected by DGHE’s poor supervision during the first half of project implementation; frequent staff transfers; project complexities; inadequate communications between LPIUs and academic consultants; varied performance of LPIUs, ranging from poor to very good; and the Asian financial crisis in the late 1990s.
At appraisal, the total project cost was estimated at $235.0 million, comprising $121.7 million in foreign exchange cost and $113.3 million equivalent in local currency cost. An ADB loan of $140.0 million from ordinary capital resources was approved to finance 60% of the total cost, including $121.7 million of foreign exchange cost and $18.3 million equivalent of the local currency cost. The Government was to provide the remaining $95.0 million equivalent. The actual project cost of $161.9 million was 31% lower than the appraisal estimate. ADB’s loan was reduced by 27% to $102.6 million through four cancellations of loan surplus balance. The Government’s share decreased by 38% to $59.3 million equivalent. The reduction of the loan amount was due mainly to the Asian financial crisis, which led to a dramatic depreciation of the rupiah, from about Rp2,000 to about Rp9,000 against the US dollar, during the project period.

v
The cost of consulting services was reduced, since a large number of Indonesian consultants, though holding international qualifications, were paid in rupiah.
The Project was consistent with ADB’s country strategy and the Government’s development strategy, both of which focused on strengthening human resources to support the achievement of the country’s broader development objectives. ADB’s education strategy shifted from technical and higher education to basic education in the early 1990s. During the early 1990s, Indonesia had made significant progress in basic education but there was a clear shortage of university graduates in the work force, especially in the poorer, less developed regions. The Project was designed to promote regional balance in terms of the location of the universities/institutions assisted. It had a good balance of hardware (e.g., facilities and equipment) and software (e.g., staff development and student support programs) components, with the latter accounting for over 30% of the total project cost. It was also designed to strengthen the role of private providers by supporting less-developed private institutions in the vicinity of the project public universities. The Project is rated as highly relevant.
The Project largely achieved the physical output targets envisaged at appraisal (e.g., improved curricula, facilities, and equipment; staff development; and increased enrollment). These outputs contributed to fulfilling the project objectives in terms of improved quality and efficiency of higher education (e.g., improved graduation rates and employment opportunities). Despite this progress, further improvements are needed in such areas as curriculum updating. On balance, the Project is rated as efficacious.
The Project achieved a reasonable degree of external efficiency (relevance to market demand). The majority of the sample graduates were able to find jobs within 6 months. Their employers were generally satisfied with their job performance. Except for the underutilization of some facilities and equipment at the two regional resource centers, project facilities were reasonably well utilized. The estimated economic internal rate of return (9.4%) is slightly less than ADB’s benchmark economic opportunity cost of capital (12.0%), even with the heavy depreciation of the local currency following the unforeseen Asian financial crisis. On balance, the Project is rated as efficient. The financial crisis posed a heavy fiscal burden on the Government. Some project public universities had the potential to generate more income from other sources (e.g., development of research proposals for outside funding, provision of extension programs, and renting out of facilities) and to rely less on the Government’s budget. However, the proportion of this income remains small. Coupled with difficulties of increasing tuition fees in the near future, the prospect for the Project’s financial sustainability is less likely (partly satisfactory), depending upon each university’s financial capacity. The Project had a substantial positive institutional impact. A critical mass of a new generation of lecturers (755) were trained (423 abroad and 332 in-country), who subsequently contributed to strengthening university teaching/research capacities. DGHE’s management capacity also improved at the central level. The Project had positive socioeconomic impacts on the sample graduates through improved employment and earning prospects. The Project did not have any adverse environmental impact, as the construction took place in an environmentally acceptable way, within the project campuses. The combined institutional and other impacts are considered substantial (highly satisfactory). The overall Project is rated as successful. Five key issues emerged from the evaluation: (i) need to integrate the Project’s benefit monitoring and evaluation (BME) systems into normal operations of the project universities, (ii) need to improve the operation and maintenance (O&M) of project facilities, (iii) need for universities to increase cost recovery, (iv) need to update program curricula, and (v) need to improve networking activities with private universities and private enterprises.

vi
The following are lessons drawn from the evaluation for ongoing and future projects.
(i) Under the ongoing Technological and Professional Skills Development Sector Project, the BME system should be integrated into normal operations of the project institutions. It should also be linked to DGHE’s management and information system.
(ii) Under the same project, the project institutions should be required to prepare
annual preventive O&M plans in accordance with manufacturers’ recommendations and to allocate sufficient annual recurrent budget for O&M.
(iii) For any employment-related project, key private enterprises should be involved
at the design phase to ensure that the skills being taught are relevant to the market demand, and at the implementation phase (e.g., through participation in project steering committee) to gain their support throughout the project.
DGHE has agreed to implement the follow-up actions below to address all the issues:
(i) Request each project public and private university to integrate the Project’s BME
system with its normal operations by starting to update key employment-related data, for submission to DGHE by end-December 2005. The extent of the updating should depend on each university’s financial and human resource capacities. DGHE should assess the updated indicators and bring them to the attention of each university rector to help identify improvements needed.
(ii) Request each project public and private university to prepare a 3-year annual
utilization and preventive O&M plan for project facilities and equipment in accordance with the manufacturers’ recommended procedures, for submission to DGHE by end-December 2005. The plan should be prepared within the context of the overall annual recurrent budget (showing sources and uses of funds), so that the cost recovery issue will be addressed by setting some targets to increase income from other sources by certain percentage points (e.g., more than the change in the consumer price index), depending upon the university’s capacity.
(iii) Request the Akademi Manajemen Informatika dan Komputer, a project private
institution, to prepare a report on the stolen project computers, for submission to DGHE by end-December 2005.
(iv) Request each project public and private university to prepare an indicative action
plan for improving the quality of its program curricula, research, and staff as well as for improving the networking activities, for submission to DGHE by end-December 2005. The curriculum part should focus on improving the teaching/ research quality and the curriculum relevance to the job market, with less dependence on DGHE’s core curriculum templates. The networking part for public universities should focus on providing more support of various kinds to private universities in the vicinity and on getting private enterprises to participate more in university management, teaching/research, and student support.
Bruce Murray Director General Operations Evaluation Department


I. BACKGROUND A. Rationale 1. Since the formulation of the First Five-Year Development Plan (REPELITA I, 1969–1973), education has been accorded high priority by the Government of Indonesia. With significant progress made in primary and secondary education, REPELITA V (1989–1993) and REPELITA VI (1994–1998) focused on higher (tertiary) education to build up a strong competitive workforce, which is a precondition for increased productivity and sustainable economic growth. During the early 1990s, there was a substantial imbalanced development and unsatisfied regional demand for qualified human resources in engineering, science, and technology. These factors demonstrated the need to focus on less-developed parts of the country through upgrading regional universities. The upgrading would provide students with greater access to good regional universities, save them the higher costs of education at major urban centers, and increase their employment prospects and chances of staying in their regions. Thus, in 1991, the Government requested the Asian Development Bank (ADB) to support the Higher Education Project.1 The Project was consistent with ADB’s country operational strategy for Indonesia, in which human resources development was one of the strategic priorities.2 B. Formulation 2. Upon the Government’s request, ADB provided project preparatory technical assistance3 to help design the Project. During the preparation of this technical assistance, the Government requested ADB to finance the improvement of one more institution—the Surabaya Institute of Technology (ITS)—which was not originally included. A small-scale technical assistance4 was provided for ITS. Subsequently, the Government and ADB agreed to combine the two feasibility studies as the basis for the Project. ADB fielded a fact-finding mission in February–March 1993. An appraisal mission was fielded in April–May 1993 to confirm the viability of the Project and its suitability for ADB financing. C. Purpose and Outputs 3. The project purpose or objectives were to improve the quality and efficiency of the higher education system in selected regional public and private universities/institutions. This was expected to reduce regional imbalances in the long run. The Project comprised three main
1 Loan 1253-INO: Higher Education Project, for $140 million, approved on 21 September 1993. During 1975–1990,
ADB supported seven higher education projects in Indonesia to build up the required professional human resources for the country’s socioeconomic development. These included Loan 244-INO: Surabaya Institute of Technology, for $14.5 million, approved on 2 December 1975; Loan 402-INO(SF): University of Hasanuddin, for $25 million, approved on 7 June 1979; Loan 525-INO: University of North Sumatra, for $26.0 million, approved on 24 September 1981; Loan 737-INO: University of Sriwijaya, for $37.9 million, approved on 21 May 1985; Loan 894/895-INO(SF): Marine Sciences Education, for $73.3 million, approved on 14 July 1988; and Loan 1013-INO: Six Universities Development and Rehabilitation, for $114 million, approved on 8 March 1990.
2 From 1975 to 2003, ADB provided 30 education loans totaling $2.1 billion to Indonesia, consisting of 24 loans ($1.9 billion) from ordinary capital resources (OCR) and 6 loans ($0.2 billion) from the Asian Development Fund (ADF). Of the OCR loans, 21% went to basic education (primary and junior secondary education), 10% to senior secondary education, 43% to technical education and vocational training, and 26% to higher education. As for the ADF loans, 51% went to basic education, 24% to technical education and vocational training, and 25% to higher education. At present, three education projects are ongoing (one each in basic, senior secondary, and higher education). There are two basic education projects of $200 million from OCR in the pipeline for 2004–2005.
3 TA 1702-INO: Outer-Islands Universities Project, for $465,000, approved on 25 May 1992. 4 TA 1761-INO: Surabaya Institute of Technology Project, for $78,000, approved on 30 September 1992.

2
components: (i) regional university development to strengthen 9 public universities in different provinces (e.g., curriculum development/improvement; staff development; improved equipment, teaching/research facilities, and learning materials; and student and technical support), together with 21 nearby less-developed private universities/institutions; (ii) university networking to reduce the insularity of higher education institutions and increase complementarity among them by strengthening the capacity of two major public institutions to function as regional resource centers; and (iii) management strengthening at the central and regional levels. The location of the institutions assisted are shown on the map (p. vii). D. Cost, Financing, and Executing Arrangements 4. The total project cost at appraisal was estimated at $235.0 million, comprising $121.7 million in foreign exchange cost and $113.3 million equivalent in local currency cost (Appendix 1). An ADB loan of $140.0 million from ordinary capital resources was approved to finance 60% of the total cost, including $121.7 million of foreign exchange cost and $18.3 million equivalent of the local currency cost. The Government was to provide the remaining $95.0 million equivalent. The Directorate General of Higher Education (DGHE), under the Ministry of National Education (MONE), was the Executing Agency. It established the central project implementation unit (CPIU) to manage project implementation. A local project implementation unit (LPIU) was established at each project university by its rector to manage day-to-day project implementation. A Project Steering Committee (PSC) was established by DGHE to give policy guidance to the CPIU. The PSC was chaired by the DGHE Director General, and included DGHE directors, representatives from the National Development Planning Agency5 and the Ministry of Finance, rectors from the project universities, the CPIU project manager and assistant manager, the team leader of the project consultants, and the project managers of other higher education projects assisted by other funding agencies. E. Completion and Self-Evaluation 5. The Project was physically completed in April 2000. A project completion report (PCR), prepared by ADB’s Indonesia Resident Mission (IRM) was circulated to the Board in January 2002. The PCR rated the overall Project as successful, mainly because of its relevance to both ADB’s country strategy and the Government’s development strategy, together with its achievement of most of the physical outputs envisaged at appraisal. According to the PCR, the Project established a strong foundation and a critical mass of 755 trained lecturers (423 overseas and 332 in-country) in the project universities to produce higher quality graduates with skills relevant to the market demand. This was achieved despite the financial crisis that struck the country. The PCR focused more on assessing the achievement of the Project’s physical outputs than outcomes in terms of increased quality and efficiency (e.g., increased graduation and employment rates of the graduates). It also did not assess the relevance of project design, efficiency of investment, or financial sustainability. F. Operations Evaluation 6. This project performance audit report (PPAR) evaluates the Project based on the five standard evaluation criteria of the Operations Evaluation Department, including relevance, efficacy, efficiency, sustainability, and institutional development and other impacts. Key issues, lessons, and follow-up actions are identified. The main data used are primary data from tracer
5 The agency is known in Indonesian as Badan Perencanaan dan Pembangunan Nasional (BAPPENAS).

3
surveys6 conducted by the Operations Evaluation Mission (OEM). The Project supported 2 major public institutions to function as regional resource centers (the Southeast Asian Regional Center for Tropical Biology [BIOTROP] and ITS), 9 regional public universities in different provinces, and 21 nearby less-developed private universities/institutions. The OEM sample surveys included the 2 regional resource centers, 5 public universities, and 11 nearby private universities/institutions (Appendix 2, Table A2.1). Table A2.2 (Appendix 2) shows that from the OEM samples, four beneficiary groups were interviewed: university administrators, lecturers trained by the Project, graduates in the past 5 years, and employers of these graduates. 7. Additional data and information used were obtained through (i) desk reviews of project-related documents, including the Project’s benefit monitoring and evaluation (BME) studies; (ii) consultations with concerned ADB divisions; and (iii) focus group discussions with staff of DGHE, the sample project public and private universities/institutions, and other concerned agencies. Copies of the draft PPAR were submitted for review to DGHE and ADB’s concerned divisions, including IRM. Comments have been incorporated in finalizing the PPAR.
II. PLANNING AND IMPLEMENTATION PERFORMANCE A. Formulation and Design 8. The Project was designed in accordance with the Government’s educational priorities, which focused on building up professional skills required for improving productivity of the country’s labor force. It was consistent with ADB’s country strategy. It was designed to promote regional balance in terms of the location of the institutions assisted. It had reasonably high software components (e.g., staff development and student support programs) accounting for over 30% of the total project cost. It also tried to strengthen the private sector’s role in providing higher education by supporting a number of less-developed private institutions located near to the project public universities. The structure of Indonesia’s overall education is shown in Figure A3.1 (Appendix 3). Two parallel education systems—general and Islamic—proceed from preschool to higher education. The former system is run by MONE, under which DGHE is assigned to look after higher education (Appendix 3, Figure A3.2). The latter system is run by the Ministry of Religious Affairs (MORA). None of the institutions supported under the Project were under the responsibility of MORA. 9. Of about 2,200 universities in Indonesia in 2003, the ones under MONE accounted for 87% (84% private and 3% public) and under MORA for 13% (3% private and 10% public). Table A3.1 (Appendix 3) shows that in 2003, the number of MONE universities was 1,924, the number of undergraduate students was 2.2 million (44% female), the number of lecturers was 210,210 (21% female, 10% with doctoral degrees, 43% with master’s degrees, and 47% with bachelor’s degrees), and the student-lecturer ratio was 10:1. The undergraduate enrollment in MONE universities increased rapidly over the past decade, from 1.6 million in 1994 to 2.2 million in 2003. Table A3.2 (Appendix 3) shows that the net enrollment rate (NER)7 in higher education increased from 6.5% in 1994 to 8.6% in 2003. The gross enrollment rate
6 The surveys were based on purposive sampling, taking into account accessibility, security, willingness to respond,
and budget and time constraints. Thus, the actual sample size of each category of respondents is small and not equal to the planned number.
7 The NER for a particular level of education is defined as enrollment in the age group for that level of education as a proportion of the total number of people in the same age group.

4
(GER)8 in higher education remained roughly constant at around 10%, which was well below other countries in the region at approximately the same level of development (e.g., about 30% in the Philippines and 25% in Thailand). This implies that Indonesia needs to increase its investment in higher education. 10. Two of the eight Millennium Development Goals (MDGs) are related to education. These are MDG2: achievement of universal primary education and MDG3: promotion of gender equality and empowerment of women. The target for MDG2 is to ensure that by 2015, children everywhere, boys and girls alike, will be able to complete a full course of primary schooling. The target for MDG3 is to eliminate gender disparity in primary and secondary education preferably by 2005 and in all levels of education no later than 2015. The key indicators for MDG2 include NER in primary education and adult literacy rate, and those for MDG3 include ratios of girls to boys in primary, secondary, and higher education. In the case of Indonesia, primary and secondary education was accorded higher priority over the past decades, accounting for about 70% of the Government’s total recurrent expenditure in education. As a result, the NER in primary education (grades 1–6) exceeded 90% during 1994–2003. In junior secondary education (grades 7–9), the NER increased from 36% to 64% and in senior secondary education (grades 10–12), it increased from 24% to 41% (Appendix 3, Table A3.2). The adult literacy rate was higher than 85% during 1994–2003. Girls accounted for about half of the total enrollment at the primary level, but less than half at the secondary level (about 45%). The increases in the NERs in primary and secondary education were the results of the combined efforts of the Government and the funding agencies involved in the primary and secondary education subsectors. ADB has been a major funding agency in these subsectors (footnote 2).9
Although this Project was for higher education, which was not directly linked to MDG2 or MDG3, it is expected to help strengthen the country’s competitiveness position in the longer term through better human resources, increased technology transfer, and higher value added activities. The graduates should be on the right side of the digital divide. B. Achievement of Outputs 11. For each component, the Project achieved most of the physical output targets as envisaged at appraisal. These included (i) curriculum development/updating; (ii) provision of 755 overseas and in-country fellowships to academic staff—595 for master’s degrees (283 overseas and 312 in-country) and 160 for doctoral degrees (140 overseas and 20 in-country); (iii) provision of short-term training to academic, administrative, and technical staff; (iv) building construction/rehabilitation; (v) provision of modern teaching/research equipment and learning materials; (vi) provision of research grants for 1,400 research topics; (vii) provision of scholarships to 10,894 poor students; (viii) establishment of student advisory centers for job counseling/placement; (ix) upgrading of BIOTROP and ITS to regional resource centers; (x) development of networking programs among the project resource centers and universities/institutions; and (xi) establishment of BME systems at the central and university levels to improve management of operations and planning.
8 The GER for a particular level of education is defined as enrollment of people regardless of age as a proportion of
the total number of people in the age group for that level of education. 9 ADB started to focus on supporting basic education in the early 1990s. ADB and the World Bank are the major
multilateral funding agencies in the education sector in Indonesia. The major bilateral funding agencies in this sector include the Australian Agency for International Development, Canadian International Development Agency, German Agency for Technical Cooperation, Japan Bank for International Cooperation, and Japan International Cooperation Agency. Like the World Bank, ADB assistance in the education sector in Indonesia covered every subsector, but was location-specific given the archipelago nature of Indonesia.

5
C. Cost and Scheduling 12. The Project envisaged an implementation of 5.5 years. Actual implementation took 6.0 years. This was mainly due to a 4-month initial delay in loan effectiveness. There was a lack of proper guidance and training to LPIUs in carrying out their responsibilities. Project implementation was also affected by DGHE’s poor supervision during the first half of project implementation; frequent staff transfers; project complexities; inadequate communications between LPIUs and academic consultants; varied performance of LPIUs, ranging from poor to very good; and the Asian financial crisis in the late 1990s. 13. The actual project cost ($161.9 million) was 31% lower than the appraisal estimate ($235.0 million) (Appendix 1). The ADB loan was reduced by 27% from $140.0 million to $102.6 million through four cancellations of the loan surplus balance totaling $37.4 million. The share of the Government decreased by 38% from $95.0 million equivalent to $59.3 million equivalent. The reduction of the loan amount was due primarily to the Asian financial crisis, which led to a dramatic depreciation of the rupiah, from about Rp2,000 to about Rp9,000 against the US dollar, during the project period. As a result, the cost of consulting services became much less, since a large number of Indonesian consultants, though holding international qualifications, were paid at local rates in rupiah. D. Procurement and Construction 14. Consulting services were engaged in accordance with ADB’s Guidelines on the Use of Consultants. Fellowship programs were managed by consulting firms due to the complexity and difficulty in placing a large number of fellows for overseas programs. The overall consultants’ performance was generally satisfactory. However, many variations were made in the consultants’ contracts to accommodate changes in the timing of their deployment, which sometimes was not synchronized with actual needs and resulted in implementation delays. 15. Procurement was carried out in accordance with ADB’s Guidelines for Procurement. Contracts for civil works and furniture were awarded through local competitive bidding among prequalified bidders in conformity with ADB and government requirements. Supply contracts for equipment and learning materials of $500,000 or more were awarded through international competitive bidding, while those for less than $500,000 employed international shopping. Although the performance of the domestic engineering firms engaged by the LPIUs was generally acceptable, the quality of civil works varied from university to university. For example, the fisheries building at the University of Haluoleo had broken tiles in traffic areas and nonfunctional laboratory rooms, while student dormitories at the University of Nusa Cendana had poor maintenance, with water supply and toilet leakages. Although remedial actions had been undertaken, these problems implied that the management of some project universities and LPIUs did not closely monitor the implementation of civil works. As for equipment supplies, the procurement and installation were generally satisfactory, with minor problems at some universities. These project universities need to prepare their own preventive operation and maintenance (O&M) programs.

6
E. Organization and Management
16. The Borrower was generally able to comply with loan covenants, except for one requiring DGHE to encourage project public universities to increase tuition fees10 at a rate greater than the change in the consumer price index. Tuition fees are not determined solely by DGHE or individual universities. The local governments are also involved and take into account their localities’ socioeconomic conditions. Thus, the revision procedures took time, and the covenant could not be implemented even prior to the 1997 Asian financial crisis. Once the crisis broke out, ADB agreed to DGHE’s request for no increase in tuition fees, and emphasized that other forms of cost recovery (e.g., income generation from extension programs, research grants, and renting out of facilities) should be encouraged instead. Cost recovery through increased tuition fees is not really an issue in Indonesia’s higher education for the following reasons: (i) some project universities (e.g., ITS and University of Jenderal Soedirman [UNSOED]) were able to increase tuition fees by about 60% after project completion; (ii) both public and private universities normally increase their tuition fees almost every year for new students, without regularly reporting to DGHE; (iii) under DGHE’s autonomy plan,11 public universities will gradually become autonomous and be able to generate more income from various sources on their own (about half of their annual recurrent budget); and (iv) since students in private universities pay full user fees and account for 72% of the total undergraduate enrollment in the universities under MONE (Table A3.1, Appendix 3), the overall cost recovery for the higher education subsector in Indonesia is much higher than the average of the Organization for Economic Cooperation and Development countries (79% versus 30%). 17. Project management was weak during the initial project implementation period. During this period, the PSC was not actively involved and the CPIU was not sufficiently supervised by DGHE. There was frequent staff turnover at the CPIU and inadequate interaction with the LPIUs. The performance of the LPIUs varied across project universities, depending upon the management style of LPIUs and the degree of involvement of the rectors. Project management was improved during the latter half of project implementation. After the Inception Mission, there were no ADB review missions during the first 2 years of project implementation. Afterwards, the missions occurred approximately every 6 months, with eight review missions plus one completion mission. Project monitoring and supervision improved after all aspects of project implementation were delegated to IRM in 1996. All project institutions were visited, although not in the same review missions.
10 Tuition fees vary across universities and fields of study. Excluding faculties of medicine and dentistry, average
tuition fees per student in public universities are about Rp700,000 per semester (or Rp1,400,000 per year) plus average entrance fees of about Rp420,000 per 4 years (or Rp105,000 per year), totaling Rp1.5 million per year ($163 equivalent). The corresponding figures for private universities are about Rp3 million per year as tuition fees plus Rp3 million per year as entrance fees, totaling Rp6 million per year ($653 equivalent).
11 The plan initially covered 10 public universities, 5 of which have been able to meet the autonomy requirements. These include the Bandung Institute of Technology, Bogor Pertanian Institute, University of Diponegoro, University of Gajah Mada, and University of Indonesia.

7
III. ACHIEVEMENT OF PROJECT PURPOSE
A. Operational Performance 18. This section assesses the achievement of project physical outputs under each component (subsections 1–3) and their contributions to achieving project outcomes or objectives (subsection 4). 19. The main data used below are primary data collected by the OEM surveys12 from (i) the 2 regional resource centers (BIOTROP and ITS), (ii) a sample of 5 (from 9) project public universities in different provinces, and (iii) a sample of 11 (from 21) less-developed project private universities/institutions adjacent to these public universities (para. 6). However, these institutions were not assisted equally. The private institutions received much less support from the Project, mostly in terms of staff development and equipment, because (i) public universities in Indonesia are normally bigger and have better quality as well as absorption capacity, and (ii) the Project intended to develop these regional public universities to serve as support centers for smaller private universities/institutions nearby to enhance the role of private providers.
1. Component 1: Regional University Development — Outputs 20. This component aimed to develop 9 regional public universities in various aspects, together with 21 nearby private universities/institutions. The actual outputs under this component met or exceeded the appraisal targets (Appendix 4). These included (i) curriculum development/improvement for undergraduate programs in many priority areas, including accountancy; agriculture; animal science; basic science (biology, chemistry, and physics); business management; economics; engineering; fisheries; and mathematics; (ii) staff development for 755 academic persons (versus the appraisal target of 705) through 423 overseas fellowships (283 for master’s and 140 for doctoral degrees), 332 in-country fellowships (312 for master’s and 20 for doctoral degrees), and some other short-term training programs for academic and administrative staff; (iii) improved teaching/research facilities (buildings, classrooms, computer rooms, greenhouses, laboratories, libraries, and power and water supplies); (iv) improved teaching/research equipment (computers, laboratory equipment, and other equipment); learning materials (journals, library books, teacher books, and textbooks); and technical support (short-term training for laboratory and library technicians); (v) research grants for 1,400 topics (versus the appraisal target of 1,000) to enhance the research capacity of academic staff and promote collaborative research among universities; and (vi) support for increased access of the poor to higher education (scholarships to 10,894 poor students) and job counseling/placement services (establishment of student advisory centers). 21. Appendix 5, Table A5.1 shows the annual enrollment of all students based on the OEM sample surveys of 5 project public universities and 11 private universities/institutions over 10 years (1994–2003). Annual enrollment in public universities increased more rapidly than that in private counterparts (5.7% versus 2.6%). The same was true for annual enrollment of year-1 students (8.7% versus 1.0%) (Appendix 5, Table A5.2). The enrollment demand index, as measured by the number of applicants from Table A5.3 (Appendix 5) over the number of year-1
12 The analysis drawn from these survey data is qualitative, focusing on interpreting the data and information to gain
insight into the real situations, rather than doing rigorous statistical tests.

8
students, was much higher for public universities, averaging 6.3 over the 10 years, compared with 1.2 for their private counterparts (Appendix 5, Table A5.4). 22. Such increases in enrollment were expected to result from the achievement of the combined outputs (para. 20). For example, under the curriculum development/updating outputs, the Project assisted in creating some new programs and improving the curricula of some existing programs, although much of the curricula still depends on the core curricula provided under DGHE’s templates. 23. Under the staff development outputs, the OEM survey data found that the overseas training acquired under the Project was perceived by the sample lecturers to be fully utilized (81%) or moderately (14%) utilized (Appendix 5, Table A5.5).13 The corresponding figures for the in-country training were 62% and 31%, respectively (Appendix 5, Table A5.6). This, in turn, can be expected to improve lecturers’ teaching/research performance. After their overseas training, the majority of the trainees were assigned more responsibilities, e.g., teaching more subjects (57%) and holding important decision-making posts (24%) (Appendix 5, Table A5.7). The same was true for the in-country trainees (57% and 17%, respectively) (Appendix 5, Table A5.8). Table A5.9 (Appendix 5) shows that the sample public universities generally have better quality lecturers and management than their private counterparts, as indicated by higher proportions of staff with master’s degrees (58% versus 33%), doctoral degrees (9% versus 2%), and permanent status (96% versus 61%). 24. As for the outputs of teaching/research facilities (including buildings), the OEM surveys found that they were generally well utilized in almost all of the sample project universities. The quality of civil works varied across universities/buildings. For example, a roof of the basic science building at the University of Bengkulu collapsed after an earthquake. Although remedial action was undertaken, a proper O&M plan is needed. 25. Most of the learning materials, teaching/research resources, and other equipment were generally in good condition and well utilized, particularly at big universities such as UNSOED and the University of Jember (UNEJ). At one private institution—the Akademi Manajemen Informatika dan Komputer (AMIK) Purwokerto—the OEM survey team could not locate some computers provided by the Project. AMIK’s management informed the OEM that 9 of the 13 project computers were stolen in 2001. This, to some extent, reflected the lack of an equipment management and preventive O&M plan. Most project universities/institutions did not prepare such plans, except for one public university (UNEJ) and two private universities/institutions (the University of Muhammadiyah and the Sekolah Tinggi Ilmu Ekonomi Mandala Jember) in the sample. The case of stolen computers at AMIK also reflected weak governance as AMIK did not make the case transparent by reporting to DGHE, and no AMIK staff was held responsible for the case. Generally, institutions in the education sector were perceived by a public opinion poll14 to rank 10th out of 15 institutions in various sectors in terms of poor governance or high corruption. It had the score of 3.2 compared with the highest score of 4.4 for political parties, which was perceived as the most corrupt institution. Religious institutions were perceived to be the least corrupt institution, having the score of 1.8 and the rank of 15th.
13 The data given in Tables A5.5–A5.8 also take into account the data of BIOTROP and ITS from Component 2
(para. 29). 14 Transparency International. 2004. Corruption Barometer for Indonesia. Jakarta.

9
2. Component 2: University Networking — Outputs
26. The actual outputs of this component met the appraisal targets (Appendix 4). These included (i) development of various networking/linkage programs between BIOTROP/ITS and other project universities/institutions as well as between the project public universities and their private counterparts; and (ii) development of BIOTROP and ITS into regional resource centers, including (a) curriculum improvement and research support for the programs in engineering and technology at ITS; and establishment of a new international master’s degree program in information technology for natural resources management, together with research support, at BIOTROP; (b) staff development for about 20% of the academic and administrative staff; (c) improved equipment, learning materials, teaching/research facilities, and technical support; and (d) student support for job counseling/placement through the establishment of student advisory centers. 27. Based on the OEM survey data, similar to the sample 5 project public and 11 private universities, overall actual enrollment at the two resource centers increased over the 10 years (1994–2003) at an average annual growth rate of 1.1% for ITS and 19.1% for BIOTROP (Appendix 5, Table A5.1). The corresponding enrollment growth rates of year-1 students were about 1.2% and –2.8%, respectively (Appendix 5, Table A5.2). The enrollment demand index, as measured by the number of applicants from Table A5.3 (Appendix 5) over the number of year-1 students, was very high for ITS, averaging 7.8 over the 10 years and 8.5 over the most recent 3 years (Appendix 5, Table A5.4). The enrollment demand for BIOTROP was stable (averaging 1.3% over the 10 years) and much lower than that of ITS because BIOTROP offered only a small international graduate program. 28. The increases in both actual enrollment and enrollment demand, particularly at ITS, were expected to result from the achievement of the combined outputs (para. 26). For example, the outputs of curriculum/program development and research support helped facilitate ITS’ role as a technology resource center supporting universities in eastern Indonesia. BIOTROP, with its project-assisted graduate program, has been recognized as a regional resource center for environment studies. This was reflected in the number of international students from Southeast Asia and the Middle East enrolled in the program. The program shows potential for sustainability with the increase in total enrollment and stable enrollment of year-1 students. In terms of quality, the program did not have to rely too much on hiring many expensive experts from abroad, because the skills developed/transferred during the Project were well utilized. However, since the program was developed during the early project period, it is time to consider updating the curriculum. 29. Under the staff development outputs, the OEM survey data found that the overseas and in-country training acquired through the Project was generally well utilized (see explanation in para. 23, as the data for BIOTROP and ITS are integrated with the data for the other five sample project public universities in Tables A5.5–A5.8). This was expected to help improve the lecturers’ teaching/research performance. 30. According to the OEM surveys, most of the teaching/research facilities provided by the Project were generally in good condition and well utilized. An exception was the big conference center provided by the Project at BIOTROP, which was underutilized. Although BIOTROP regularly rented it out for other purposes, the number of uses was only about five times per year, with a total income generated of about Rp200–300 million per year. This situation reflects a flaw in project design, as the conference center is not only underutilized, but also requires a large budget each year for proper maintenance.

10
31. Most of the teaching/research resources, learning materials, and other equipment were in good condition and well utilized. At BIOTROP, research work carried out using some project laboratory equipment (e.g., large microscopes) contributed to developing new seeds and plants for sale, from which the income generated in 2003 was more than that generated from renting out the conference center. However, some highly sophisticated equipment and imported items for the Engineering Faculty at ITS were rarely used due to their very high O&M cost. BIOTROP had prepared utilization and preventive O&M plans for project facilities and equipment. ITS had not done so. 32. Based on the OEM surveys, most of the administrators at the five sample public universities found the networking/linkage activities with BIOTROP/ITS quite useful. These included data/information exchange, joint conferences/seminars, lecturer exchange, research collaboration, technical assistance and supervision, and training for academic and technical staff. These five public universities established some networking activities with the nearby project private universities/institutions (e.g., provision of lecturers on a part-time basis, and data/information sharing). However, their linkages with the private universities/institutions were observed to be much weaker than those with the two resource centers. In addition, fewer linkages with private enterprises, which are potential employers, were observed. Some big public universities (e.g., UNSOED and UNEJ) and the two resource centers have representatives from private enterprises on their universities’ management boards. Small public and private universities, and even such a big private university as the University of Wijaya Kusuma, have yet to establish networking cooperation with private enterprises. The lack of such cooperation indicates weak management capacity (e.g., lack of confidence to initiate linkages) in private universities compared with public ones.
3. Component 3: Management Strengthening at the Central and Regional Levels — Outputs
33. The actual outputs of this component met the appraisal targets (Appendix 4). These included (i) staff development through short-term training (including seminars and workshops) in education management and related areas for administrative staff from DGHE, CPIU, and LPIUs; and (ii) development of an integrated management and information system (data base center) for higher education at DGHE for BME, linked to the BME systems at the project universities’ LPIUs. 34. Based on the OEM surveys, most of the administrative staff trained under the Project felt that the training acquired was useful. DGHE’s management capacity for decentralization and networking of higher education has improved, which helped facilitate project progress during the latter half of its implementation. Its technical capacity also improved, which helped support the BME operations. The OEM surveys found that the BME systems established at all LPIUs were discontinued along with the LPIUs after project completion. Thus, useful employment-related data (e.g., job search period and employment rates of graduates) were neither utilized nor updated. 4. All Components Combined — Outcomes/Objectives 35. The project objectives were to improve quality and efficiency of higher education, as measured by certain outcome indicators—both quantitative and qualitative. This subsection assesses whether or not the combined outputs of the three project components contributed to achieving the project objectives. The quantitative outcome indicators used below include graduation rate, graduates’ employment rates, and job search periods. The qualitative

11
indicators include graduates’ perceptions about the relevance of their curricula to job requirements, and employers’ satisfaction with the job performance of these graduates. 36. During 1994–2003, the number of graduates increased at an average annual rate of 5.9% for the sample project public institutions (including the two resource centers) and 7.1% for their private counterparts (Appendix 5, Table A5.10). Table A5.11 (Appendix 5) shows that graduation rate, as measured by the number of graduates each year as a proportion of the same cohort who enrolled as year-1 students 4 years earlier,15 fluctuated during the project period. It has been high over 1998–2003 for the sample public institutions (including the two resource centers), averaging about 100%, compared with 73% for their private counterparts. This reflected the better quality of the former. The sample lecturers from the public and private universities were asked to suggest the most effective methods to improve student performance. The methods most frequently mentioned by both groups were more interactions between lecturers and students (21%), better textbooks and reference books (19%), and more teaching resources/aid (14%) (Appendix 5, Table A5.12). 37. Table A5.13 (Appendix 5) compares average employment rates of the graduates from the sample project public and private universities (including the two resource centers) at the end of the project (2000) and recently (2003). The rates increased from 56% to 65% for the former, and from 50% to 58% for latter. The lower rates in 2000 for both groups compared with those in 2003 reflect some lingering impacts of the 1997 Asian financial crisis. Consistent with the common perception in Indonesia that public universities outperform private ones, the average employment rates of the former were higher in both 2000 and 2003. 38. Table A5.14 (Appendix 5) shows that the majority (60%) of the sample graduates were able to get jobs (including self-employment) within less than 6 months, and another 19% were able to do so in less than a year. About 21% took more than a year. The majority of the sample graduates (59%) said that their curricula were highly relevant to job requirements, while 24% indicated moderate relevance and 12% saw only partial relevance (Appendix 5, Table A5.15). About 5% perceived no relevance between their jobs and their education. When asked to suggest how to improve the relevance of their curricula, the most frequently mentioned suggestions were more training provided by the private sector during the study period (30%), more research support from the private sector during the study period (22%), and active representation of the private sector on the university management board for curriculum improvement (15%) (Appendix 5, Table A5.16). 39. The two most frequent suggestions mentioned by the sample graduates were the same as those mentioned by the sample lecturers and employers of these graduates (Appendix 5, Tables A5.17 and A5.18, respectively). Most of the sample employers were moderately satisfied (48%) or very satisfied (45%) with the job performance of the graduates from the project public universities (Appendix 5, Table A5.19). The same was true for their private counterparts, with the corresponding response rates of 73% and 21%, respectively. These responses reflect a sufficient degree of external efficiency or relevance of the curricula in the context of market demand.
15 Graduation rate in this case is an indicative rate. It can be biased upward (e.g., even higher than 100%) if
(i) students from earlier cohorts who did not graduate within 4 years were able to graduate later in that particular year, and (ii) there were some transfer students from other programs/universities. In the case of BIOTROP, graduation rate is calculated by the number of graduates each year as a proportion of the same cohort who enrolled as year-1 students 2 years earlier (rather than 4 years earlier), because it offers only a graduate program with a 2-year completion period.

12
40. With these documented achievements of improved quality and efficiency of higher education, the outputs of components 1–3 altogether are considered as having contributed to achieving the project outcomes or objectives. However, further improvements in both student performance and relevance of the curricula are needed, especially in the areas suggested by the sample lecturers (para. 36) as well as by the sample graduates, lecturers, and employers (paras. 38 and 39). The outputs of components 1–3 are also expected to contribute to achieving the project goal of reducing regional disparities and poverty in the long run. Investment in education is one of the most effective ways to escape poverty through increased employment and earning opportunities. The total of 9 project public universities plus ITS provided access to higher education for many students from relatively less well-off families outside Jakarta. They enrolled a total of about 15,000 new students each year, which was more or less the same number as the graduates produced per year. They provided scholarships to 10,894 poor students under the Project. B. Performance of the Operating Entity 41. Table A6.1 (Appendix 6) shows that the Government’s total recurrent education budget16 as a proportion of gross domestic product has been stable over the past decade (1995–2003), at around 0.8%. It declined to an average of 0.6% during the aftermath of the Asian financial crisis (1998–2000), after which it increased gradually to 0.9% in 2003. This share was lower than those in some other developing countries, such as Bangladesh (1.4%) and Nepal (2.5%). The share of the recurrent education budget in the overall recurrent budget in Indonesia decreased from 7.2% in 1995 to an average of 4.9% during the aftermath of the financial crisis (1998–2000), before increasing to 8.2% in 2003. The increase reflected the Government’s efforts to improve education, although the share was still lower in Indonesia than in Bangladesh (11.0%) and Nepal (20.0%). Of the total recurrent education budget, the share allocated to each education subsector has been stable, with more priority given to primary and secondary education, accounting for about 70% combined. Higher education received about 17%–18% throughout the past decade, leaving the remaining share to nonformal and technical education and vocational training. C. Sustainability 42. The PCR did not analyze the financial sustainability of the Project. Due to the lingering effects of the Asian financial crisis, the policy of increasing tuition fees became difficult to adopt. DGHE has been trying to encourage public universities to increase cost recovery by generating more income from other sources and becoming more autonomous (para. 16). Table A6.2 (Appendix 6) shows that government funding was the major source of recurrent budget at the five sample public universities (65%). Tuition and other fees from regular programs accounted for 27%, and other income (e.g., through extension programs, renting out of facilities, and research funding support) only for 8%. ITS had a similar pattern, while BIOTROP had a different pattern because it offered only a small international graduate program. BIOTROP’s pattern (80% tuition fees and 20% other income) was similar to that of the 11 sample private universities. Table A6.2 shows that given the large government funding support, the average recurrent budget per student of public universities is generally much higher than that of private universities (Rp4.7 million versus Rp1.7 million). This is the main reason why the quality of public universities in Indonesia is generally better than that of private counterparts.
16 The education budget includes only that under MONE. In this case, “budget” and “expenditure” are used
interchangeably, because budget allocated from one source to a recipient will finally become an expenditure of the recipient.

13
43. Public universities rely largely on government funding which has imposed a fiscal burden on the government budget. At the macro level, the Government has shown a commitment to improving the education sector (para. 41). But at the university/project level, although the sample project public universities were able to generate some income from other sources, the proportion was low compared with private universities. Given that tuition fees are difficult to increase in the aftermath of the Asian financial crisis, particularly for small universities, more income from other sources is needed for improving the universities’ financial status and the Project’s prospects for financial sustainability. 44. Table A6.2 shows that most of the budget was used to finance staff salaries/support in the five sample public universities (93%), leaving only small amounts for O&M activities (3%) and other quality-enhancing inputs (e.g., learning resource materials and equipment) (4%). The staff salaries proportion in the 11 private universities was lower (73%). This is because, unlike their public counterparts, they did not have excess permanent staff on their payrolls who may be nonproductive. They selectively hired good staff from public universities on a part-time basis when needed. As such, they tended to spend higher proportions of their budget on O&M activities (10%) and other quality-enhancing inputs (17%) compared with their public counterparts. The public universities should try to increase such proportions, particularly if they are able to generate more income from other sources. D. Economic Reevaluation 45. No economic analysis was conducted at appraisal or in the PCR. To assess the efficiency of project investment, this PPAR estimated an economic internal rate of return (EIRR) (Appendix 7). The economic cost was the project cost, divided into traded and nontraded components. The economic benefits were the difference in productivity gains to the economy between the project and nonproject situations. The Project contributed to increasing both the numbers of graduates and their quality, and thus their employment opportunities. The productivity gains were measured by the product of the numbers of graduates from all project public and private universities combined (not just the sample universities) and their corresponding average incremental wage rates over their earning lifetime, adjusted by the average regional employment rates. The estimated EIRR at the time of evaluation is 9.4% (Appendix 7, Table A7.1). Despite the heavy depreciation of the rupiah against the US dollar as a result of the unforeseen Asian financial crisis during the late 1990s, the EIRR is slightly less than ADB’s benchmark economic opportunity cost of capital (12.0%). For comparison, this PPAR also estimated an EIRR using the data on the project cost and benefits during appraisal (Appendix 7, Table A7.2). The resulting EIRR at appraisal, 17.5%, justified the project investment.
IV. ACHIEVEMENT OF OTHER DEVELOPMENT IMPACTS A. Socioeconomic Impact 46. The Project had a pro-poor element as it focused on increasing access and quality of regional universities to reduce regional disparities. The Project contributed to increasing employment of graduates from regional universities, averaging 65% for graduates from the sample public universities and 58% for their private counterparts in 2003 (para. 37). These rates might be considered low in absolute terms. But in relative terms, they are comparable with the data from the provincial bureaus of statistics on regional employment rates of about 64%–68% in 2003, which increased from the rates during the financial crisis aftermath of 53%–

14
57% (Appendix 8, Table A8.1). Table A8.2 (Appendix 8) shows that most of the sample graduates (86%) earned monthly salaries higher than the prevailing monthly salaries of high school graduates of Rp600,000.17 Since the Project had a positive socioeconomic impact on the graduates from the project universities, it is expected to contribute to reducing regional imbalances and poverty in the long run. Although the Project did not intend to focus on gender issues, female enrollment accounted for almost half (48%) of total enrollment in the sample public universities and 45% in their private counterparts (Table A5.9). These figures compare to about 44% of female students in higher education on the nationwide basis (Table A3.1). B. Environmental Impact
47. The Project did not cause any adverse environmental impacts. Construction activities were undertaken within the existing premises, with due attention to the environment and without having any resettlement impact. A number of programs/courses assisted by the Project addressed environmental awareness, including the environment-related study program established at BIOTROP. C. Impact on Institutions and Policy 48. The OEM surveys found that capacity building provided by the Project had generated significant institutional impact. The Project provided large numbers of overseas (423) and in-country (332) scholarships for the master’s and doctoral levels as well as short-term training. These numbers were sufficient to create a critical mass of a new generation of lecturers (755). Most of them have used the knowledge and experience gained to strengthen the university teaching/research capacity18 and to produce better-quality graduates. For example, UNSOED created seven master’s programs after project completion and developed research projects for outside funding, including winning government budgetary support from DGHE’s research competition program. Most of those trained have remained at the same universities. 49. At the central level, one example of DGHE’s improved management capacity was the development of an innovative and useful research competition program. All public and private universities were encouraged to develop quality research proposals to compete for DGHE funding. This program is expected to contribute to improved quality of university research and teaching nationwide.
V. OVERALL ASSESSMENT A. Relevance 50. The Project was consistent with ADB’s country strategy and the Government’s development strategy, both of which focused on strengthening human resources to support the achievement of the country’s broader development objectives (para. 8). ADB’s education strategy shifted from technical and higher education to basic education in the early 1990s. However, Indonesia had made significant progress in basic education. During project formulation, a clear shortage of university graduates in the work force was identified, especially 17 The current minimum monthly wage rate is Rp600,000 ($65 equivalent). The most current official data on poverty
incidence in Indonesia was 18.2% in 2002, lower than the crisis peak of 23.5% in the late 1990s. 18 One lecturer at UNSOED (Mr. Mulyoto Pangestu) received a “Gold Young Inventors Award” in 2000 from the Far
Eastern Economic Review for developing an inexpensive process for preserving animal sperm in conjunction with his doctoral dissertation research at Monash University, Australia.

15
in the poorer, less developed regions. The Project was designed to promote regional balance in terms of the location of the universities assisted. It had a good balance of hardware (e.g., facilities and equipment) and software (e.g., staff development and student support programs) components, with the latter accounting for over 30% of the total project cost. It was also designed to strengthen the role of private providers by supporting less-developed private institutions in the vicinity of the project public universities. The Project is rated as highly relevant. B. Efficacy 51. The Project largely achieved the physical output targets envisaged at appraisal (e.g., improved curricula, facilities, and equipment; staff development; and increased enrollment). These outputs contributed to fulfilling the project objectives in terms of improved quality and efficiency of higher education (e.g., improved graduation rates and employment opportunities—para. 40). Despite this progress, further improvements are needed in such areas as curriculum updating. On balance, the Project is rated as efficacious. C. Efficiency 52. The Project achieved a reasonable degree of external efficiency (relevance to market demand). The majority of the sample graduates were able to find jobs within 6 months. Their employers were generally satisfied with their job performance. Except for the underutilization of the big conference center at BIOTROP and of some sophisticated engineering equipment at ITS, which together accounted for less than 5% of the total project cost, project facilities were reasonably well utilized. The estimated EIRR (9.4%) is slightly less than ADB’s benchmark economic opportunity cost of capital (12.0%), even with the heavy depreciation of the local currency following the unforeseen Asian financial crisis (para. 45). On balance, the Project is rated as efficient. D. Sustainability 53. The financial crisis posed a heavy fiscal burden on the Government. Public universities should rely less on government budgetary support. The sample public universities had the potential to generate more income from other sources (e.g., development of research proposals for outside funding, provision of extension programs, and renting out of facilities). However, the proportion of this income remained small (para. 43). Coupled with difficulties in substantially increasing tuition fees in the near future, the prospect for financial sustainability of the Project is rated as less likely (partly satisfactory), depending upon each university’s financial capacity. E. Institutional Development and Other Impacts 54. The Project had a substantial positive institutional impact. A critical mass of a new generation of lecturers (755) were trained (423 abroad and 332 in-country), who subsequently contributed to strengthening university teaching/research capacities (para. 48). DGHE’s management capacity also improved at the central level. The Project had positive socioeconomic impacts on the sample graduates through improved employment and earning prospects. The Project did not have any adverse environmental impact, as the construction took place in an environmentally acceptable way, within the project campuses. The combined institutional and other impacts are considered substantial (highly satisfactory).

16
F. Overall Project Rating 55. Based on the results of the five evaluation criteria above and the standard weighting system of the Operations Evaluation Department, the Project is rated as successful.
G. Assessment of Asian Development Bank and Borrower Performance
56. Except for one loan covenant, which required the Borrower to encourage public project universities to increase tuition fees at a rate higher than the change in the consumer price index, the Borrower generally fulfilled its obligations (para. 16). During the initial project implementation period, the performance of both ADB and the Borrower was poor. There were insufficient ADB review missions and support/supervision by DGHE to the CPIU and LPIUs. The quality of some civil works and the condition of project facilities were not closely monitored. During the latter half of project implementation, ADB’s performance improved, with the delegation of the Project to IRM and more frequent review missions (para. 17). This helped improve the Borrower’s performance in project administration. Interaction between the CPIU and LPIUs increased despite their widely scattered geographical locations. On balance, the performance of ADB and the Borrower is considered satisfactory.
VI. ISSUES, LESSONS, AND FOLLOW-UP ACTIONS A. Key Issues for the Future 57. The following five issues emerged from the evaluation: 58. Need to Integrate the Project’s BME Systems into Normal Operations. The BME systems of the project universities were transferred from the LPIUs to the universities’ central administrations after project completion. Useful employment-related data were not updated. DGHE should encourage the universities to update the systems to ensure sustainability of the project benefits. The updating can be modest, depending upon their financial status. At least, the existing recent data on job placement services provided by the project-supported student advisory centers should be systematically recorded. This kind of updating does not need any extra budget for surveys. The universities only have to assign some existing staff to do so. 59. Need to Improve the Utilization and Maintenance of Project Facilities. Most of the sample project universities did not prepare utilization and preventive O&M plans for project facilities and equipment. Such plans are needed to increase the utilization efficiency and sustain their working life. Preventive measures against human hazards (e.g., stealing) should be part of the plans. The universities’ recurrent budget allocated to O&M remained low—averaging about 3% (para. 44). More income should be allocated to O&M purposes. 60. Need for Universities to Increase Cost Recovery. ADB agreed with DGHE’s request to encourage the project public universities to increase income from other sources, rather than from tuition fees. Although the sample universities were able to do so, the average proportion of income from other sources remained less than 10% of the universities’ recurrent budget (para. 42). Some big universities (ITS, UNSOED and UNEJ) had good prospects for higher income generation, while small universities had difficulties doing so. This would require more commitment of DGHE to set some targets for them to follow, depending upon their capacities.

17
61. Need to Update Program Curricula. The Project assisted in improving the curricula of existing programs and in establishing some new programs at the project universities. The programs appear to be sustainable, with high enrollment growth rates and enrollment demand. However, to ensure long-term sustainability, the universities need to start updating the curricula to improve the quality of teaching/research and make them more relevant to the market demand. Since the program at BIOTROP is an international graduate program, it should focus on establishing linkages (e.g., through a joint degree program) with a good overseas university. 62. Need to Improve Networking Activities with Private Universities and Private Enterprises. Based on the evaluation findings, the sample employers, graduates, and lecturers suggested that the best way to increase the relevance of curricula and employability of the graduates would be to establish strong linkages with appropriate private enterprises for future research funding and on-the-job training. Only big public universities in the sample have established such linkages. Small public and private universities should be more proactive in doing so. B. Lessons Identified 63. The following are lessons drawn from the evaluation. The first two lessons are for an ongoing ADB project. The third lesson is for ADB’s future interventions.
(i) Under the ongoing Technological and Professional Skills Development Sector Project,19 the BME system should be integrated into normal operations of the project institutions. It should also be linked to DGHE’s management and information system. This should be recorded in the Memorandum of Understanding of subsequent review mission.
(ii) Under the ongoing Technological and Professional Skills Development Sector
Project, the project institutions should be required to prepare annual preventive O&M plans in accordance with manufacturers’ recommendations and to allocate sufficient annual recurrent budget for O&M activities. This should be recorded in the Memorandum of Understanding of subsequent review mission.
(iii) For any employment-related project, key private enterprises should be involved
at the design phase to ensure that the skills being taught are relevant to the market demand, and at the implementation phase (e.g., through participation in PSC) to gain their support throughout the project.
C. Follow-Up Actions 64. DGHE has agreed to implement the follow-up actions below to address all the issues discussed in section A:
(i) Request each project public and private university to integrate the Project’s BME system with its normal operations by starting to update key employment-related data, for submission to DGHE by end-December 2005. The extent of the updating should depend on each university’s financial and human resource capacities. Tracer surveys, which would involve extra cost, are not necessarily
19 Loan 1792-INO: Technological and Professional Skills Development Sector Project, for $180 million, approved on
29 November 2000.

18
required. At least the existing data at the project-supported student advisory centers should be systematically recorded in the system. These data may include the annual numbers of students and graduates by program and faculty; staff by faculty and education level; students receiving scholarships; students considered as poor; employed graduates; and graduates assisted by the student advisory centers for job counseling and placement, together with their job search periods and the type of jobs they found. DGHE should assess these indicators and bring them to the attention of each university rector to help identify improvements needed.
(ii) Request each project public and private university to prepare a 3-year annual
utilization and preventive O&M plan for project facilities and equipment in accordance with the manufacturers’ recommended procedures, for submission to DGHE by end-December 2005. The plan should (a) include a list of facilities and equipment provided by the Project, current utilization and condition for each of them, intended actions to be taken to improve the utilization and condition for each of them, expected year to improve the condition for each of them, and precautionary measures against human hazards; and (b) be prepared within the context of the overall annual recurrent budget (showing both sources and uses of the budget), so that the cost recovery issue will be addressed by setting some targets to increase income from other sources by certain percentage points (e.g., more than the change in the consumer price index), depending upon the university’s capacity.
(iii) Request AMIK to prepare a report on the stolen project computers, for
submission to DGHE by end-December 2005. The report should include the police investigation results, AMIK’s own investigation of their staff, and proposed measures to prevent future such incidents.
(iv) Request each project public and private university to prepare an indicative action
plan for improving the quality of its program curricula, research, and staff as well as for improving the networking activities with other universities and private enterprises, for submission to DGHE by end-December 2005. The curriculum part of the plan should focus on improving the teaching/research quality and the curriculum relevance to the job market, with less dependence on DGHE’s core curriculum templates. The networking part of the plan for public universities should focus on providing more support of various kinds to private universities in the vicinity and on getting private enterprises to participate more in university management, teaching/research, and student support.

($ million)
Actual (PCR Stage) %(Underrun)/OverrunItem Foreign Local Total Foreign Local Total Foreign Local TotalCivil Works
Rehabilitation 0.73 2.18 2.91 0.25 0.75 1.00 (65.8) (65.6) (65.6)Construction 8.25 24.74 32.99 6.25 18.74 24.99 (24.2) (24.3) (24.2)Design and Supervision 0.57 1.72 2.29 0.42 1.27 1.69 (26.3) (26.2) (26.2) Subtotal 9.55 28.64 38.19 6.92 20.76 27.68 (27.5) (27.5) (27.5)
Equipment and MaterialsEquipment 33.56 8.39 41.95 31.87 0.00 31.87 (5.0) (100.0) (24.0)Library Materials 2.69 1.15 3.84 2.65 0.00 2.65 (1.5) (100.0) (31.0)Furniture and Service Equipment 1.17 3.52 4.69 0.13 0.39 0.52 (88.9) (88.9) (88.9) Subtotal 37.42 13.06 50.48 34.65 0.39 35.04 (7.4) (97.0) (30.6)
Specialists ServicesProject Consultants 2.18 1.35 3.53 1.27 0.44 1.71 (41.7) (67.4) (51.6)Academic Advisors 4.32 1.85 6.17 2.41 0.90 3.31 (44.2) (51.4) (46.4)Student Support Experts 0.22 0.16 0.38 0.28 0.00 0.28 27.3 (100.0) (26.3)Visiting Fellows 1.47 1.23 2.70 0.99 0.35 1.34 (32.7) (71.5) (50.4)Technical Specialists 1.94 1.30 3.24 1.30 0.48 1.78 (33.0) (63.1) (45.1)Language Specialists 2.52 1.08 3.60 2.94 0.12 3.06 16.7 (88.9) (15.0) Subtotal 12.65 6.97 19.62 9.19 2.29 11.48 (27.4) (67.1) (41.5)
Overseas Staff DevelopmentFellowships 20.42 0.00 20.42 19.20 0.55 19.75 (6.0) – (3.3)Short-Term Training 3.19 14.43 17.62 2.61 0.14 2.75 (18.2) (99.0) (84.4) Subtotal 23.61 14.43 38.04 21.81 0.69 22.50 (7.6) (95.2) (40.9)
In-Country Staff DevelopmentFellowships 0.00 4.49 4.49 0.05 2.44 2.49 – (45.7) (44.5) Subtotal 0.00 4.49 4.49 0.05 2.44 2.49 – (45.7) (44.5)
Special ProgramsStudent Support and Scholarships 0.00 3.90 3.90 0.57 4.56 5.13 – 16.9 31.5Research and Networking 0.00 2.96 2.96 0.22 1.98 2.20 – (33.1) (25.7) Subtotal 0.00 6.86 6.86 0.79 6.54 7.33 – (4.7) 6.9
Project Implementation Cost 0.00 12.93 12.93 0.00 24.37 24.37 – 88.5 88.5
Taxes 0.00 11.98 11.98 0.00 12.72 12.72 – 6.2 6.2
Interest During Construction 26.47 0.00 26.47 18.29 0.00 18.29 (30.9) – (30.9)
Unallocated 12.00 13.94 25.94 0.00 0.00 0.00 (100.0) (100.0) (100.0)
Total 121.70 113.30 235.00 91.70 70.20 161.90 (24.7) (38.0) (31.1)PCR = project completion report.Source: ADB. 2002. Project Completion Report on the Higher Education Project in Indonesia . Manila; staff estimates.
ESTIMATED AND ACTUAL PROJECT COSTS
Appraisal Estimate
Appendix 1
19

Institution/Location Supported by the ProjectIncluded in the
Sample Surveys Supported by the ProjectIncluded in the
Sample SurveysResource Centers
Bogor/West Java 1. Southeast Asian Regional Center for Tropical Biology (BIOTROP) X —
Surabaya/East Java 2. Surabaya Institute of Technology (ITS) X — Universities/Institutions
Bengkulu/Sumatra 1. University of Bengkulu (UNIB) X 1. University of Prof. Dr. Hazairin, S.H.2. Akademi Manajemen dan Komputer Remox
XX
Jambi/Sumatra 2. University of Jambi (UNJA) X 3. University of Batanghari4. Akademi Sekretari dan Manajemen Jambi
XX
Purwokerto/Central Java 3. University of Jenderal Soedirman (UNSOED) X 5. University of Wijaya Kusuma6. Akademi Manajemen Informatika dan Komputer Purwokerto
XX
Jember/East Java 4. University of Jember (UNEJ) X 7. University of Muhammadiyah8. University of Moch. Sroedji9. Sekolah Tinggi Ilmu Ekonomi Mandala a Jember
XXX
Mataram/West Nusa Tenggara 5. University of Mataram (UNRAM) X 10. University of Islam Al-Azhar11. University of '45 Mataram
XX
Palu/Sulawesi 6. University of Tadulako (UNTAD) 12. University of Al-Khairat13. University of Muhammadiyah14. Sekolah Tinggi Ilmu Ekonomi Panca a Bhakti Palu
Kendari/Sulawesi 7. University of Haluoleo (UNHALU)
Kupang/Timor 8. University of Nusa Cendana (UNDANA)
9. University of Cenderawasih (UNCEN) Manokwari/Irian Jaya - Manokwari CampusJayapura/Irian Jaya - Jayapura Campus
Source: ADB. 2002. Project Completion Report on the Higher Education Project in Indonesia . Manila; field surveys in July 2004.
Pubic Universities Private Universities/Institutions
PROJECT UNIVERSITIES/INSTITUTIONS AND THE SAMPLE SURVEYSTable A2.1: List of Universities/Institutions Supported by the Project and Included in the Sample Surveys
15. University of Dayanu Ikhsanuddin Bau-Bau 16. Akademi Teknik Kendari17. University of Muhammadiyah18. University of Kristen Artha Wacana19. University of Katolik Widya Mandira Kupang
20. Sekolah Tinggi llmu Ekonomi Ottow and Geissler21. Sekolah Tinggi llmu Ekonomi Yapis Jayapura
20 Appendix 2

Category of Respondents Administrators/Rectorsb 7 11 18 Lecturersc 56 80 136 Employed Graduates 62 102 164 Employers of Employed Graduates 31 52 83 Total 156 245 401univ. = university.
b One administrator/rector was interviewed per university.c Of the sample of 56 lecturers from public universities, 16 were trained overseas by the Project and 40 were trained in-country. Of the sample of 80 lecturers from private universities, 5 were trained overseas and 75
Source: Field surveys in July 2004.
were trained in-country.Note: The sample sizes for lecturers shown in Tables A5.12 and A5.17 are not the same as those shown abovebecause in such tables, one sample lecturer gave more than one answer. The same reason applies to the samplesizes for employed graduates in Table A5.16, and for employers of these graduates in Table A5.18.
a The surveys were based on purposive sampling, taking into account accessibility, security, willingness to respond, and budget and time limitations. Thus, the actual sample size of each category of respondents is small and not equal to the planned number. The analysis drawn from these survey data is qualitative, focusing on interpreting the data and information to gain insight into the real situations, rather than doing rigorous statistical tests.
Resource Centers &TotalPublic Univ.
Table A2.2: Survey Sample Size by Category of Respondents
Number of Sample Respondentsa
Private Univ.
Appendix 2 21

EDUCATION SYSTEM AND ORGANIZATIONAL STRUCTURE
Islamic Academic Education
under MORA
Professional Education under
MONE
IslamicDoctorate Program
ProfessionalProgram
Official
School
Age
MONE = Ministry of National Education, MORA = Ministry of Religious Affairs, no. = number.a Based on Education Law No. 20, 2003.Source : MONE.
22
21
20
19
13
12
11
18
17
16
Figure A3.1: Education System in Indonesiaa
Master's Program
6
5
10
9
General Academic Education
under MONE
15
8
14
7
Senior Secondary Education
Diploma 3 Program Diploma 2
Program Diploma 1 Program
Islamic Under-graduate Program
Under-graduate Degree
Program
Diploma 4 Program
Islamic Senior Secondary
School
Professional Program
Preschool
Higher Education
DoctorateProgram
Islamic Master's Program
General Senior
Secondary School
Vocational Senior Secondary School
IslamicJunior
Secondary School
GeneralJunior Secondary School
Islamic Primary School
Junior Secondary Education
Islamic Kindergarten
GeneralPrimary School
Kindergarten
Primary Education
22 Appendix 3
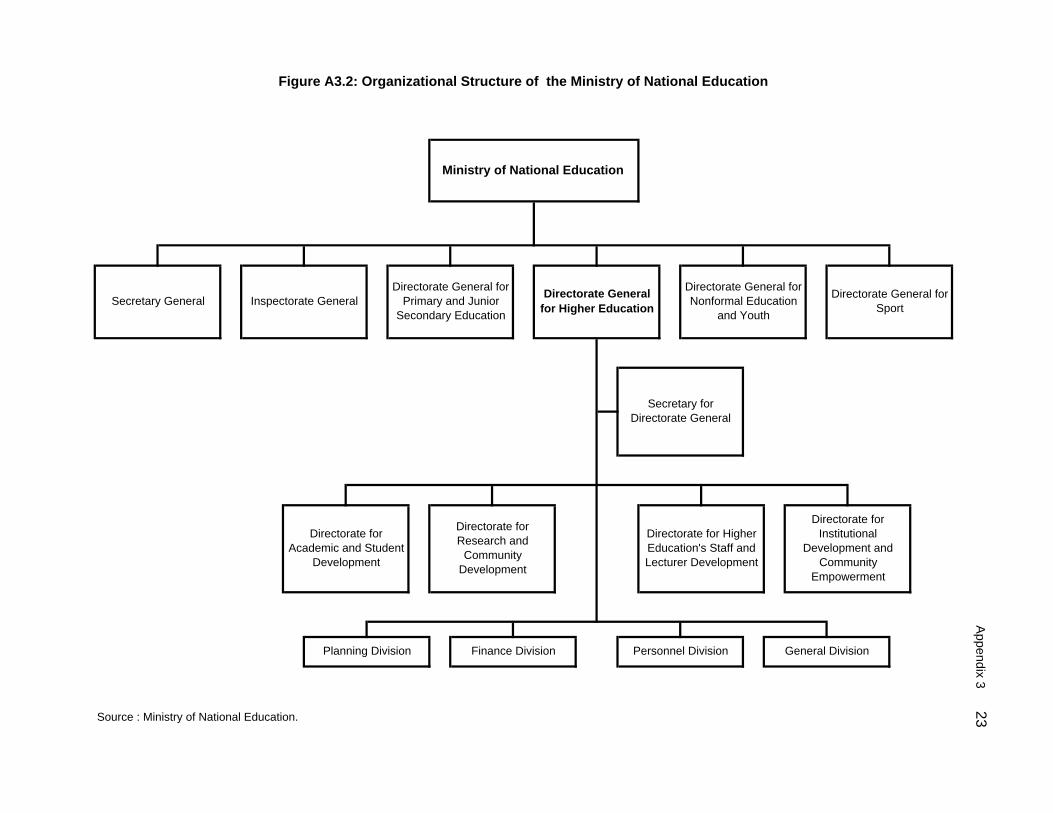
Source : Ministry of National Education.
Ministry of National Education
Directorate General for Primary and Junior
Secondary EducationInspectorate GeneralSecretary General
Directorate for Research and
Community Development
Directorate for Academic and Student
Development
Directorate General for Higher Education
Directorate General for Nonformal Education
and Youth
Figure A3.2: Organizational Structure of the Ministry of National Education
Planning Division Personnel Division General Division
Directorate General for Sport
Secretary for Directorate General
Directorate for Institutional
Development and Community
Empowerment
Finance Division
Directorate for Higher Education's Staff and Lecturer Development
Appendix 3 23

1994 1998 2003Basic Data Public Private Total Public Private Total Public Private Total No. of Universities 76 1,543 1,619 76 1,671 1,747 78 1,846 1,924 No. of Lecturers 49,609 134,772 184,381 52,220 141,865 194,085 53,717 156,493 210,210 - % Female 17.5 15.2 16.4 22.6 16.1 19.4 24.3 17.7 21.0 - % with Doctoral Degrees 8.1 6.8 7.4 9.4 7.1 8.2 12.1 7.3 9.7 - % with Master's Degrees 37.5 31.7 34.6 42.6 35.7 39.2 45.0 41.2 43.1 - % with Bachelors' Degrees 54.4 61.5 58.0 48.0 57.2 52.6 42.9 51.5 47.2 No. of Undergraduate Students 534,724 1,105,764 1,640,488 565,972 1,233,198 1,799,170 594,239 1,562,636 2,156,875 - % Female 43.7 45.2 44.5 42.5 44.9 43.7 46.0 40.9 43.5 No. of Students/No. of Lecturers 11 8 9 11 9 9 11 10 10MONE = Ministry of National Education, no. = number.Source: Central Bureau of Statistics, MONE, staff estimates.
Enrollment Data 1994 1998 GER in Primary Education 110.8 114.7 105.8 NER in Primary Education 93.3 95.0 92.6 GER in Junior Secondary Education 46.3 56.1 81.1 NER in Junior Secondary Education 36.2 44.9 63.5 GER in Senior Secondary Education 30.6 33.6 50.9 NER in Senior Secondary Education 24.3 26.4 40.6 GER in Higher Education 10.0 10.4 10.8 NER in Higher Education 6.5 7.0 8.6GER = gross enrollment rate, MONE = Ministry of National Education, NER = net enrollment rate.Source: Central Bureau of Statistics, MONE.
2003
Table A3.1: Nationwide Basic Data on Universities under MONE
Table A3.2: Nationwide Enrollment Data at Different Levels of Education (%)
24 Appendix 3

ACHIEVEMENT OF OUTPUT TARGETS
Item Appraisal Actual (at OEM)A. Regional University Development
1. Curriculum Development/Improvement for Developing/improving undergraduate program Completed Undergraduate Programs curricula in many priority areas in 9 regional public universities and 21 adjacent private
universities/institutions. The priority areas includedaccountancy; agriculture; animal science; basicscience (biology, chemistry, and physics); business management; economics; engineering; fisheries; and mathematics.
2. Staff Development through Overseas and Providing 705 (about 400 overseas and 305 755 academic staff received fellowships, In-Country Fellowships and Short-Term in-country) fellowships in priority areas to academic including 423 overseas (283 for master's Training staff for pursuing master's and doctoral degrees. and 140 for doctoral degrees) and 332
in-country (312 for master's and 20 fordoctoral degrees)
Providing short-term training seminars and Completedworkshops about the new/revised program curricula to relevant academic and administrativestaff.
3. Improvement of Teaching/Research Constructing/Renovating buildings, classrooms, Completed Facilities computer rooms, greenhouses, laboratories, and
libraries; and installing power and water supply.
4. Improvement of Teaching/Research Providing teching/research equipment (computers, Completed Equipment, Learning Materials, and Technical laboratory equipment, and other equipment); learning Support materials (journals, library books, teacher books,
and textbooks); and technical support (short-termtraining for laboratory and library technicians).
5. Enhancement of Research Capacity and Providing individual and collaborative research 1,400 research grants provided Promotion of Collaborative Research grants for 1,000 topics to academic staff.
6. Student Support for Increased Access and Providing scholarships to 10,894 poor students and Completed Job Counseling/Placement establishing student advisory centers.
Continued on next page
Appendix 4
25

Item Appraisal Actual (at OEM)B. University Networking
1. Development of University Networking Developing networking/linkage activities (e.g., data/ Completed Programs information exchange, joint conferences/seminars,
lecturer exchange, research collaboration, technicalassistance and supervision, and training for academic and technical staff) between BIOTROP/ITS and project universities as well as between project public universities and their adjacent projectprivate universities.
2. Development of Resource Centers at Developing BIOTROP and ITS into regional Completed BIOTROP and ITS to Support Other resource centers through the following: Regional Universities
- curriculum improvement and research support for the programs in engineering and technology at ITS;
- establishment of a new international master's degree program in information technology for natural resources management, together with research support, at BIOTROP;
- improvement of research/teaching equipment, facilities, learning materials, and technical support; and
- establishment of student advisory centers for job counseling/placement.
C. Management Strengthening at the Central and Regional Levels
1. Staff Development through Short-Term Providing short-term training (including seminars Completed Training to Relevant Administrative Staff and workshops) in education management and related areas to relevant administrative staff from
CPIU, DGHE, and LPIUs.
2. Development of an Integrated MIS Developing an integrated MIS at DGHE linked to the CompletedBME systems at the project universities' LPIUs.
BIOTROP = Southeast Asian Regional Center for Tropical Biology, BME = benefit monitoring and evaluation, CPIU = central project implementation unit, DGHE = Directorate General of Higher Education, ITS = Surabaya Institute of Technology, LPIU = local project implementation unit, MIS = management information system, OEM = Operations Evaluation Mission. Source: ADB. 2002. Project Completion Report on the Higher Education Project in Indonesia . Manila; OEM, 2004; Project's BME studies.
26 Appendix 4

1994 1995 1996 1997 1998 1999 2000 2001 2002 2003
University of Bengkulu (UNIB) 3,284 3,465 4,699 6,380 6,566 6,932 6,581 6,768 6,896 6,964 8.7 58,535University of Jambi (UNJA) 5,612 5,708 5,544 5,993 5,851 6,063 5,450 6,000 5,500 5,076 (1.1) 56,797University of Jenderal Soedirman (UNSOED) 6,237 6,838 7,507 8,007 8,605 9,157 10,594 12,483 14,634 14,556 9.9 98,618University of Jember (UNEJ) 8,897 9,231 9,233 9,705 9,893 10,203 9,921 10,472 11,239 12,472 3.8 101,266University of Mataram (UNRAM) 4,371 4,920 4,754 5,247 5,713 6,051 6,713 7,108 7,909 7,880 6.8 60,666 Subtotal for 5 Project Public Universities 28,401 30,162 31,737 35,332 36,628 38,406 39,259 42,831 46,178 46,948 5.7 375,882Surabaya Institute of Technology (ITS) 7,647 7,713 7,991 7,938 8,456 8,883 8,875 8,987 8,704 8,425 1.1 83,619BIOTROP 0 0 0 0 15 25 21 22 30 36 19.1 149 Subtotal for 2 Project Resource Centers 7,647 7,713 7,991 7,938 8,471 8,908 8,896 9,009 8,734 8,461 1.1 83,768
36,048 37,875 39,728 43,270 45,099 47,314 48,155 51,840 54,912 55,409 4.9 459,650
University of Prof. Dr. Hazairin, S.H. 1,436 1,837 2,005 1,689 1,984 1,884 2,225 2,603 3,146 2,365 5.7 21,174Akademi Manajemen dan Komputer Remox 98 150 138 171 219 356 537 736 844 765 25.6 4,014University of Batanghari 1,916 2,013 2,013 2,248 1,817 2,206 2,218 2,445 2,541 2,222 1.7 21,639Akademi Sekretari dan Manajemen Jambi 304 280 310 359 347 359 385 476 479 366 2.1 3,665University of Wijaya Kusuma 4,672 4,644 4,581 4,946 5,086 4,849 6,236 5,103 7,102 6,439 3.6 53,658AMIK Purwokerto 603 597 615 627 588 570 549 757 311 296 (7.6) 5,513University of Muhammadiyah 1,708 1,950 2,133 2,287 1,774 1,322 1,591 2,205 2,306 2,333 3.5 19,609University of Moch. Sroedji 1,000 1,051 1,019 770 806 787 776 791 842 832 (2.0) 8,674STIE Mandala Jember 1,515 1,223 1,234 1,319 1,426 1,435 1,329 1,458 1,494 1,264 (2.0) 13,697University of Islam Al-Azhar 1,250 1,450 1,510 1,515 1,576 1,598 1,616 1,675 1,603 1,644 3.1 15,437University of '45 Mataram 640 625 605 640 585 586 705 709 733 517 (2.3) 6,345
15,142 15,820 16,163 16,571 16,208 15,952 18,167 18,958 21,401 19,043 2.6 173,425 Total for All Project Universities 51,190 53,695 55,891 59,841 61,307 63,266 66,322 70,798 76,313 74,452 4.3 633,075
AMIK = Akademi Manajemen Informatika dan Komputer, av. = average, BIOTROP = Southeast Asian Regional Center for Tropical Biology, gr. = growth, STIE = Sekolah Tinggi Ilmu Ekonomi.a Including only undergraduate students, except for BIOTROP, where there are only graduate students at the master's level.
OUTPUT AND OUTCOME ANALYSISTable A5.1: Annual Enrollment of Studentsa (1994–2003)
Universities/InstitutionsYear Total of
All Av. Annual
Gr. Rate
Source: Field surveys in July 2004, staff estimates.
Project Public Universities/Institutions
Total for 7 Project Public UniversitiesProject Private Universities/Institutions
Total for 11 Project Private Universities
Appendix 5
27

1994 1995 1996 1997 1998 1999 2000 2001 2002 2003
University of Bengkulu (UNIB) 503 662 744 1,182 1,218 1,567 1,655 1,145 1,234 1,297 11.1 11,207University of Jambi (UNJA) 914 965 1,009 1,108 1,219 1,230 1,325 1,496 1,373 1,355 4.5 11,994University of Jenderal Soedirman (UNSOED) 1,141 1,756 1,693 1,462 1,550 1,984 1,984 3,080 3,334 2,794 10.5 20,778University of Jember (UNEJ) 1,320 1,353 1,499 2,045 1,986 2,273 2,179 2,332 2,607 2,628 8.0 20,222University of Mataram (UNRAM) 769 776 915 1,078 1,167 1,216 1,267 1,316 1,857 1,776 9.7 12,137 Subtotal for 5 Project Public Universities 4,647 5,512 5,860 6,875 7,140 8,270 8,410 9,369 10,405 9,850 8.7 76,338Surabaya Institute of Technology (ITS) 1,471 1,514 1,623 1,679 1,590 1,704 1,766 1,649 1,611 1,631 1.2 16,238BIOTROP 0 0 0 0 15 10 11 11 12 13 (2.8) 72 Subtotal for 2 Project Resource Centers 1,471 1,514 1,623 1,679 1,605 1,714 1,777 1,660 1,623 1,644 1.2 16,310
6,118 7,026 7,483 8,554 8,745 9,984 10,187 11,029 12,028 11,494 7.3 92,648
University of Prof. Dr. Hazairin, S.H. 505 530 650 684 798 659 788 875 953 808 5.4 7,250Akademi Manajemen dan Komputer Remox 56 79 49 63 88 177 199 156 149 111 7.9 1,127University of Batanghari 388 614 583 463 402 558 640 655 691 493 2.7 5,487Akademi Sekretari dan Manajemen Jambi 115 108 121 149 139 163 183 169 172 156 3.4 1,475University of Wijaya Kusuma 785 780 724 833 911 773 1,308 1,031 1,329 781 (0.1) 9,255AMIK Purwokerto 113 134 138 152 166 123 87 119 71 73 (4.7) 1,176University of Muhammadiyah 420 453 386 344 198 171 454 831 863 611 4.3 4,731University of Moch. Sroedji 251 262 242 333 332 244 278 318 247 199 (2.5) 2,706STIE Mandala Jember 400 400 400 397 390 380 370 310 300 250 (5.1) 3,597University of Islam Al-Azhar 255 270 284 247 305 320 347 328 194 161 (5.0) 2,711University of '45 Mataram 135 113 132 120 104 91 102 98 115 102 (3.1) 1,112
3,423 3,743 3,709 3,785 3,833 3,659 4,756 4,890 5,084 3,745 1.0 40,627 Total for All Project Universities 9,541 10,769 11,192 12,339 12,578 13,643 14,943 15,919 17,112 15,239 5.3 133,275
AMIK = Akademi Manajemen Informatika dan Komputer, av. = average, BIOTROP = Southeast Asian Regional Center for Tropical Biology, gr. = growth, STIE = Sekolah Tinggi Ilmu Ekonomi.a Including only undergraduate students, except for BIOTROP, where there are only graduate students at the master's level.Source: Field surveys in July 2004, staff estimates.
Project Public Universities/Institutions
Total for 7 Project Public UniversitiesProject Private Universities/Institutions
Total for 11 Project Private Universities
Table A5.2: Annual Enrollment of Year-1 Studentsa (1994–2003)
Universities/InstitutionsYear Total of
All Av. Annual
Gr. Rate
28 A
ppendix 5

1994 1995 1996 1997 1998 1999 2000 2001 2002 2003
University of Bengkulu (UNIB) 3,308 3,566 3,987 2,803 2,716 7,468 11,630 9,527 9,596 5,943 6.7 60,544University of Jambi (UNJA) 4,665 6,996 5,741 7,972 6,941 7,021 9,283 8,382 8,396 7,261 5.0 72,658University of Jenderal Soedirman (UNSOED) 11,915 15,438 16,229 11,003 9,414 10,130 17,977 17,891 20,158 12,155 0.2 142,310University of Jember (UNEJ) 11,426 11,473 11,579 12,162 12,148 12,368 12,334 12,531 12,830 12,829 1.3 121,680University of Mataram (UNRAM) 4,775 5,546 5,396 5,772 6,052 7,623 7,458 7,684 8,700 8,450 6.5 67,456 Subtotal for 5 Project Public Universities 36,089 43,019 42,932 39,712 37,271 44,610 58,682 56,015 59,680 46,638 2.9 464,648Surabaya Institute of Technology (ITS) 10,671 11,950 12,961 12,433 11,924 12,041 12,662 13,910 13,800 13,818 2.9 126,170BIOTROP 0 0 0 0 18 13 15 15 16 16 (2.3) 93 Subtotal for 2 Project Resource Centers 10,671 11,950 12,961 12,433 11,942 12,054 12,677 13,925 13,816 13,834 2.9 126,263
46,760 54,969 55,893 52,145 49,213 56,664 71,359 69,940 73,496 60,472 2.9 590,911
University of Prof. Dr. Hazairin, S.H. 525 548 661 699 813 679 793 880 960 857 5.6 7,415Akademi Manajemen dan Komputer Remox 76 113 75 90 90 219 251 229 211 127 5.9 1,481University of Batanghari 406 625 606 482 413 572 675 680 744 549 3.4 5,752Akademi Sekretari dan Manajemen Jambi 174 186 165 199 201 244 242 260 271 263 4.7 2,205University of Wijaya Kusuma 987 981 878 1,019 963 868 1,530 1,408 1,624 838 (1.8) 11,096AMIK Purwokerto 131 135 150 192 205 127 93 162 72 93 (3.7) 1,360University of Muhammadiyah 463 471 431 357 239 214 484 885 878 730 5.2 5,152University of Moch. Sroedji 271 294 260 344 351 260 297 337 256 210 (2.8) 2,880STIE Mandala Jember 550 405 442 411 404 389 370 311 306 260 (8.0) 3,848University of Islam Al-Azhar 290 315 385 357 375 360 362 360 224 175 (5.5) 3,203University of '45 Mataram 225 258 270 257 261 190 277 283 283 247 1.0 2,551
4,098 4,331 4,323 4,407 4,315 4,122 5,374 5,795 5,829 4,349 0.7 46,943 Total for All Project Universities 50,858 59,300 60,216 56,552 53,528 60,786 76,733 75,735 79,325 64,821 2.7 637,854
AMIK = Akademi Manajemen Informatika dan Komputer, av. = average, BIOTROP = Southeast Asian Regional Center for Tropical Biology, gr. = growth, STIE = Sekolah Tinggi Ilmu Ekonomi.a Including only applicants to enter year-1 undergraduate level, except for BIOTROP, where the applicants were to enter year-1 graduate program.
Table A5.3: Annual Applicants to Enter Year 1a (1994–2003)
Universities/InstitutionsYear Total of
All Av. Annual
Gr. Rate
Source: Field surveys in July 2004, staff estimates.
Project Public Universities/Institutions
Total for 7 Project Public UniversitiesProject Private Universities/Institutions
Total for 11 Project Private Universities
Appendix 5 29

Average1994 1995 1996 1997 1998 1999 2000 2001 2002 2003 of All
University of Bengkulu (UNIB) 6.6 5.4 5.4 2.4 2.2 4.8 7.0 8.3 7.8 4.6 5.4University of Jambi (UNJA) 5.1 7.2 5.7 7.2 5.7 5.7 7.0 5.6 6.1 5.4 6.1University of Jenderal Soedirman (UNSOED) 10.4 8.8 9.6 7.5 6.1 5.1 9.1 5.8 6.0 4.4 7.3University of Jember (UNEJ) 8.7 8.5 7.7 5.9 6.1 5.4 5.7 5.4 4.9 4.9 6.3University of Mataram (UNRAM) 6.2 7.1 5.9 5.4 5.2 6.3 5.9 5.8 4.7 4.8 5.7 Subtotal for 5 Project Public Universities 7.8 7.8 7.3 5.8 5.2 5.4 7.0 6.0 5.7 4.7 6.3Surabaya Institute of Technology (ITS) 7.3 7.9 8.0 7.4 7.5 7.1 7.2 8.4 8.6 8.5 7.8BIOTROP - - - - 1.2 1.3 1.4 1.4 1.3 1.2 1.3 Subtotal for 2 Project Resource Centers 7.3 7.9 8.0 7.4 7.4 7.0 7.1 8.4 8.5 8.4 7.8
7.6 7.8 7.5 6.1 5.6 5.7 7.0 6.3 6.1 5.3 6.5
University of Prof. Dr. Hazairin, S.H. 1.0 1.0 1.0 1.0 1.0 1.0 1.0 1.0 1.0 1.1 1.0Akademi Manajemen dan Komputer Remox 1.4 1.4 1.5 1.4 1.0 1.2 1.3 1.5 1.4 1.1 1.3University of Batanghari 1.0 1.0 1.0 1.0 1.0 1.0 1.1 1.0 1.1 1.1 1.0Akademi Sekretari dan Manajemen Jambi 1.5 1.7 1.4 1.3 1.4 1.5 1.3 1.5 1.6 1.7 1.5University of Wijaya Kusuma 1.3 1.3 1.2 1.2 1.1 1.1 1.2 1.4 1.2 1.1 1.2AMIK Purwokerto 1.2 1.0 1.1 1.3 1.2 1.0 1.1 1.4 1.0 1.3 1.2University of Muhammadiyah 1.1 1.0 1.1 1.0 1.2 1.3 1.1 1.1 1.0 1.2 1.1University of Moch. Sroedji 1.1 1.1 1.1 1.0 1.1 1.1 1.1 1.1 1.0 1.1 1.1STIE Mandala Jember 1.4 1.0 1.1 1.0 1.0 1.0 1.0 1.0 1.0 1.0 1.1University of Islam Al-Azhar 1.1 1.2 1.4 1.4 1.2 1.1 1.0 1.1 1.2 1.1 1.2University of '45 Mataram 1.7 2.3 2.0 2.1 2.5 2.1 2.7 2.9 2.5 2.4 2.3
1.2 1.2 1.2 1.2 1.1 1.1 1.1 1.2 1.1 1.2 1.2 Total for All Project Universities 5.3 5.5 5.4 4.6 4.3 4.5 5.1 4.8 4.6 4.3 4.8
AMIK = Akademi Manajemen Informatika dan Komputer, BIOTROP = Southeast Asian Regional Center for Tropical Biology, STIE = Sekolah Tinggi Ilmu Ekonomi.a Demand index was calculated by dividing the number of applicants for year 1 by the number of year-1 students each year.
Table A5.4: Annual Enrollment Demand Indexa (1994–2003)
Universities/InstitutionsYear
Source: Field surveys in July 2004, staff estimates.
Project Public Universities/Institutions
Total for 7 Project Public UniversitiesProject Private Universities/Institutions
Total for 11 Project Private Universities
30 Appendix 5

Utilization of Overseas Studiesin the Trained Areas No. % No. % No. %
Fully Utilized 12 75.0 5 100.0 17 81.0Moderately Utilized 3 18.8 0 0.0 3 14.3Partly Utilized 1 6.3 0 0.0 1 4.8Not Utilized 0 0.0 0 0.0 0 0.0 Total 16 100.0 5 100.0 21 100.0
no. = number, univ. = university.Source: Field surveys in July 2004.
Utilization of In-Country Trainingin the Trained Areas No. % No. % No. %
Fully Utilized 23 57.5 48 64.0 71 61.7Moderately Utilized 12 30.0 24 32.0 36 31.3Partly Utilized 5 12.5 2 2.7 7 6.1Not Utilized 0 0.0 1 1.3 1 0.9 Total 40 100.0 75 100.0 115 100.0
no. = number, univ. = university.Source: Field surveys in July 2004.
Increase in Job Assignmentafter Overseas Studies No. % No. % No. %
Teaching More Subjects 8 50.0 4 80.0 12 57.1Important Decison Making 5 31.3 0 0.0 5 23.8Doing More Research 2 12.5 0 0.0 2 9.5Administrative Work 0 0.0 1 20.0 1 4.8No Change 1 6.3 0 0.0 1 4.8 Total 16 100.0 5 100.0 21 100.0
no. = number, univ. = university.Source: Field surveys in July 2004.
Table A5.5: Lecturers' Perceptions about Utilization of Overseas Studies
Total
Table A5.7: Increase in Job Assignments for Lecturers Finishing Overseas Studies
Table A5.6: Lecturers' Perceptions about Utilization of In-Country Training
Public Univ. Private Univ.
Public Univ. Private Univ. Total
Public Univ. Private Univ. Total
Appendix 5 31
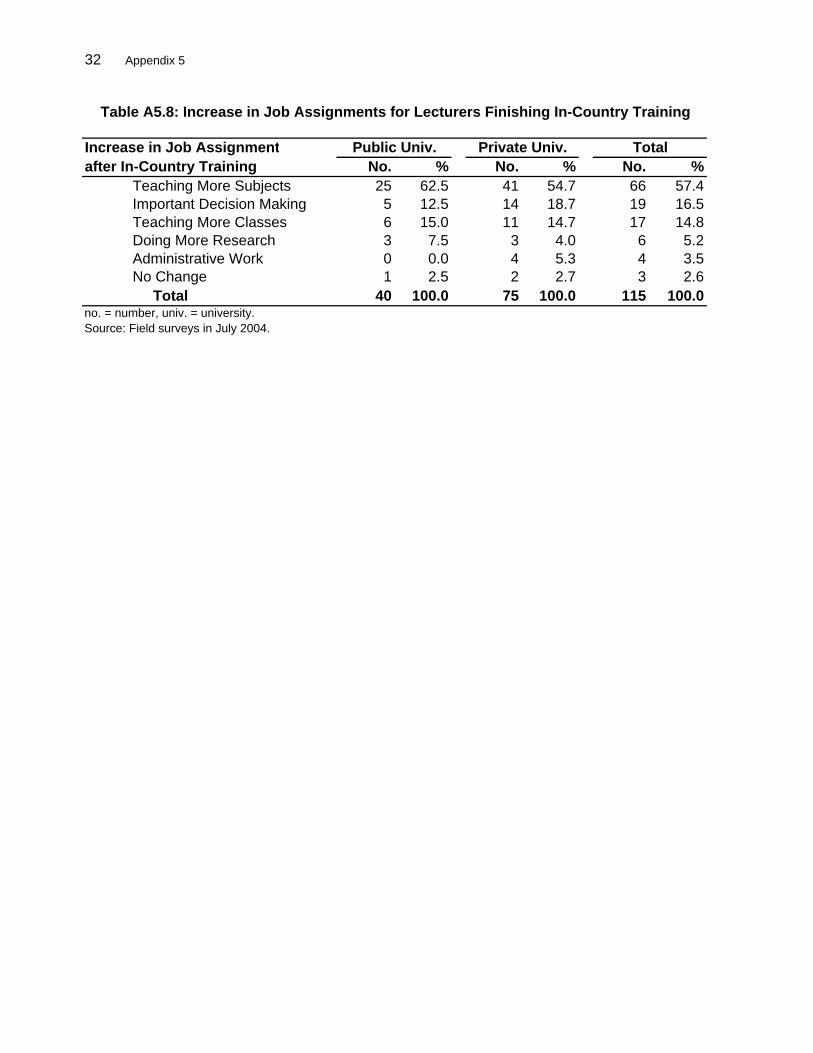
Increase in Job Assignmentafter In-Country Training No. % No. % No. %
Teaching More Subjects 25 62.5 41 54.7 66 57.4Important Decision Making 5 12.5 14 18.7 19 16.5Teaching More Classes 6 15.0 11 14.7 17 14.8Doing More Research 3 7.5 3 4.0 6 5.2Administrative Work 0 0.0 4 5.3 4 3.5No Change 1 2.5 2 2.7 3 2.6 Total 40 100.0 75 100.0 115 100.0
no. = number, univ. = university.Source: Field surveys in July 2004.
Total
Table A5.8: Increase in Job Assignments for Lecturers Finishing In-Country Training
Public Univ. Private Univ.
32 Appendix 5

Total % % with Master's % with Doctoral % Permanent Total % % ReceivingNo. Females Degrees Degrees Status No. Females Scholarships
Project Public Universities/InstitutionsUniversity of Bengkulu (UNIB) 596 31.9 65.6 9.7 100.0 6,964 60.0 20.5University of Jambi (UNJA) 852 39.6 59.9 5.9 100.0 5,076 55.3 28.3University of Jenderal Soedirman (UNSOED) 799 35.3 58.9 5.9 96.1 14,556 48.9 14.4University of Jember (UNEJ) 880 28.0 56.1 8.1 100.0 12,472 54.3 18.5University of Mataram (UNRAM) 954 19.2 58.9 7.3 81.4 7,880 42.2 23.1Surabaya Institute of Technology (ITS) 874 34.8 48.5 16.9 100.0 8,425 29.4 14.0BIOTROP 13 30.8 7.7 84.6 100.0 36 37.9 100.0 Av. for Project Public Univ. (excl. BIOTROP)a 826 31.5 58.0 9.0 96.3 9,229 48.4 19.8
Project Private Universities/InstitutionsUniversity of Prof. Dr. Hazairin, S.H. 120 22.5 50.8 0.0 91.7 2,365 40.0 0.6Akademi Manajemen dan Komputer Remox 66 30.3 28.8 3.0 30.3 765 37.1 2.0University of Batanghari 108 62.0 41.7 5.6 82.4 2,222 31.8 0.0Akademi Sekretari dan Manajemen Jambi 30 30.0 6.7 0.0 50.0 366 65.3 0.0University of Wijaya Kusuma 310 26.1 31.3 1.6 58.7 6,439 35.1 2.0AMIK Purwokerto 33 9.1 12.1 0.0 48.5 296 51.0 3.4University of Muhammadiyah 262 24.0 30.5 2.7 77.9 2,333 55.0 9.0University of Moch. Sroedji 128 17.2 35.9 3.1 59.4 832 25.1 13.0STIE Mandala Jember 32 68.8 53.1 0.0 100.0 1,264 50.9 18.1University of Islam Al-Azhar 213 10.8 39.4 5.6 46.0 1,644 26.5 3.8University of '45 Mataram 165 21.2 27.3 3.0 28.5 517 72.0 0.0 Av. for Project Private Univ. 133 29.3 32.5 2.2 61.2 1,731 44.5 4.7 Av. for All Project Univ. (excl. BIOTROP)a 378 30.0 41.5 4.6 73.6 4,377 45.9 10.0
AMIK = Akademi Manajemen Informatika dan Komputer, av. = average, BIOTROP = Southeast Asian Regional Center for Tropical Biology, excl. = excluding, no. = number, STIE = Sekolah Tinggi Ilmu Ekonomi, univ. = university.a BIOTROP is excluded from the calculation of the average figures due to its being a different kind of institution, focusing on research and offering only a small graduate program.Source: Field surveys in July 2004, staff estimates.
Universities/Institutions
Table A5.9: Current Information on Lecturers and Students in Bachelor's Degree Programs (2003)
Lecturers Students
Appendix 5 33

1994 1995 1996 1997 1998 1999 2000 2001 2002 2003
University of Bengkulu (UNIB) 564 534 527 614 568 595 758 736 956 1,274 9.5 7,126University of Jambi (UNJA) 968 1,037 1,174 1,251 1,445 1,114 1,415 1,381 1,474 1,758 6.9 13,017University of Jenderal Soedirman (UNSOED) 1,023 1,156 792 947 1,048 1,367 1,216 1,988 2,162 2,211 8.9 13,910University of Jember (UNEJ) 1,109 1,259 1,459 1,457 1,772 1,492 1,512 1,575 1,613 1,844 5.8 15,092University of Mataram (UNRAM) 762 873 926 1,115 937 1,106 1,360 1,295 934 1,020 3.3 10,328 Subtotal for 5 Project Public Universities 4,426 4,859 4,878 5,384 5,770 5,674 6,261 6,975 7,139 8,107 7.0 59,473Surabaya Institute of Technology (ITS) 1,321 1,209 1,144 1,070 899 1,062 1,380 1,412 1,394 1,539 1.7 12,430BIOTROP 0 0 0 0 0 0 15 10 4 7 (22.4) 36 Subtotal for 2 Project Resource Centers 1,321 1,209 1,144 1,070 899 1,062 1,395 1,422 1,398 1,546 1.8 12,466
5,747 6,068 6,022 6,454 6,669 6,736 7,656 8,397 8,537 9,653 5.9 71,939
University of Prof. Dr. Hazairin, S.H. 327 356 410 383 361 361 411 542 564 661 8.1 4,376Akademi Manajemen dan Komputer Remox 53 61 48 33 61 50 40 65 66 59 1.2 536University of Batanghari 266 213 268 327 285 184 230 225 261 316 1.9 2,575Akademi Sekretari dan Manajemen Jambi 109 117 116 141 146 159 166 150 164 166 4.8 1,434University of Wijaya Kusuma 206 201 358 409 499 451 712 849 981 1,073 20.1 5,739AMIK Purwokerto 14 22 67 116 90 74 161 101 124 122 27.2 891University of Muhammadiyah 211 203 190 209 156 135 156 185 165 241 1.5 1,851University of Moch. Sroedji 183 150 454 160 153 141 123 132 151 196 0.8 1,843STIE Mandala Jember 126 152 170 176 221 237 271 213 235 208 5.7 2,009University of Islam Al-Azhar 240 232 230 235 240 258 277 235 233 279 1.7 2,459University of '45 Mataram 106 89 95 86 85 40 67 68 137 78 (3.4) 851
1,841 1,796 2,406 2,275 2,297 2,090 2,614 2,765 3,081 3,399 7.1 24,564 Total for All Project Universities 7,588 7,864 8,428 8,729 8,966 8,826 10,270 11,162 11,618 13,052 6.2 96,503
AMIK = Akademi Manajemen Informatika dan Komputer, av. = average, BIOTROP = Southeast Asian Regional Center for Tropical Biology, gr. = growth, STIE = Sekolah Tinggi Ilmu Ekonomi.Source: Field surveys in July 2004, staff estimates.
Project Public Universities/Institutions
Total for 7 Project Public UniversitiesProject Private Universities/Institutions
Total for 11 Project Private Universities
Table A5.10: Annual Number of Graduates (1994–2003)
Universities/InstitutionsYear Total of
All Av. Annual
Gr. Rate
34 A
ppendix 5
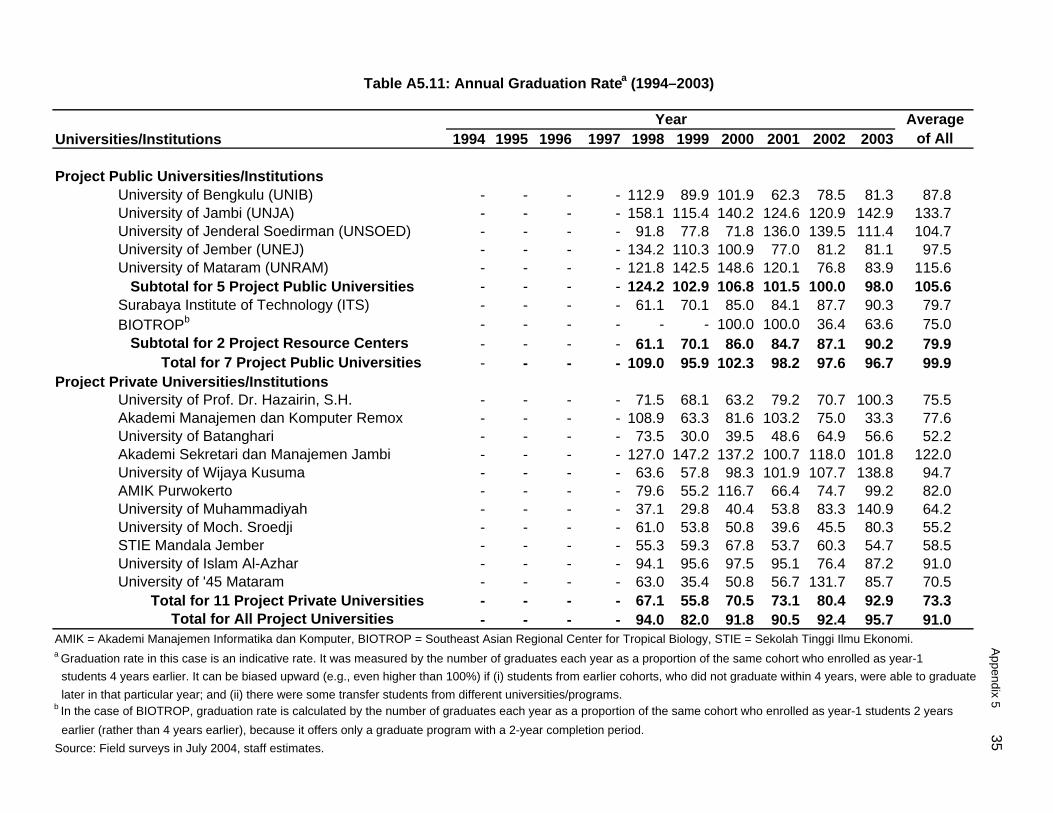
1994 1995 1996 1997 1998 1999 2000 2001 2002 2003
University of Bengkulu (UNIB) - - - - 112.9 89.9 101.9 62.3 78.5 81.3 87.8University of Jambi (UNJA) - - - - 158.1 115.4 140.2 124.6 120.9 142.9 133.7University of Jenderal Soedirman (UNSOED) - - - - 91.8 77.8 71.8 136.0 139.5 111.4 104.7University of Jember (UNEJ) - - - - 134.2 110.3 100.9 77.0 81.2 81.1 97.5University of Mataram (UNRAM) - - - - 121.8 142.5 148.6 120.1 76.8 83.9 115.6 Subtotal for 5 Project Public Universities - - - - 124.2 102.9 106.8 101.5 100.0 98.0 105.6Surabaya Institute of Technology (ITS) - - - - 61.1 70.1 85.0 84.1 87.7 90.3 79.7BIOTROPb - - - - - - 100.0 100.0 36.4 63.6 75.0 Subtotal for 2 Project Resource Centers - - - - 61.1 70.1 86.0 84.7 87.1 90.2 79.9
- - - - 109.0 95.9 102.3 98.2 97.6 96.7 99.9Project Private Universities/Institutions
University of Prof. Dr. Hazairin, S.H. - - - - 71.5 68.1 63.2 79.2 70.7 100.3 75.5Akademi Manajemen dan Komputer Remox - - - - 108.9 63.3 81.6 103.2 75.0 33.3 77.6University of Batanghari - - - - 73.5 30.0 39.5 48.6 64.9 56.6 52.2Akademi Sekretari dan Manajemen Jambi - - - - 127.0 147.2 137.2 100.7 118.0 101.8 122.0University of Wijaya Kusuma - - - - 63.6 57.8 98.3 101.9 107.7 138.8 94.7AMIK Purwokerto - - - - 79.6 55.2 116.7 66.4 74.7 99.2 82.0University of Muhammadiyah - - - - 37.1 29.8 40.4 53.8 83.3 140.9 64.2University of Moch. Sroedji - - - - 61.0 53.8 50.8 39.6 45.5 80.3 55.2STIE Mandala Jember - - - - 55.3 59.3 67.8 53.7 60.3 54.7 58.5University of Islam Al-Azhar - - - - 94.1 95.6 97.5 95.1 76.4 87.2 91.0University of '45 Mataram - - - - 63.0 35.4 50.8 56.7 131.7 85.7 70.5 Total for 11 Project Private Universities - - - - 67.1 55.8 70.5 73.1 80.4 92.9 73.3 Total for All Project Universities - - - - 94.0 82.0 91.8 90.5 92.4 95.7 91.0
AMIK = Akademi Manajemen Informatika dan Komputer, BIOTROP = Southeast Asian Regional Center for Tropical Biology, STIE = Sekolah Tinggi Ilmu Ekonomi.a Graduation rate in this case is an indicative rate. It was measured by the number of graduates each year as a proportion of the same cohort who enrolled as year-1 students 4 years earlier. It can be biased upward (e.g., even higher than 100%) if (i) students from earlier cohorts, who did not graduate within 4 years, were able to graduate later in that particular year; and (ii) there were some transfer students from different universities/programs.b In the case of BIOTROP, graduation rate is calculated by the number of graduates each year as a proportion of the same cohort who enrolled as year-1 students 2 years earlier (rather than 4 years earlier), because it offers only a graduate program with a 2-year completion period.Source: Field surveys in July 2004, staff estimates.
Total for 7 Project Public Universities
Project Public Universities/Institutions
Table A5.11: Annual Graduation Ratea (1994–2003)
Universities/InstitutionsYear Average
of All
Appendix 5 35

Areas of Improvements Needed No. % No. % No. %More Interactions between Lecturers and Students 28 20.6 42 20.6 70 20.6Better Textbooks and Reference Books 23 16.9 43 21.1 66 19.4More Teaching Resources/Aid 19 14.0 29 14.2 48 14.1More Homework/Assignments 16 11.8 31 15.2 47 13.8Smaller Classes 22 16.2 17 8.3 39 11.5More Lecturers with Overseas Degrees 14 10.3 20 9.8 34 10.0More Home Support 10 7.4 20 9.8 30 8.8Othersa 4 2.9 2 1.0 6 1.8
Totalb 136 100.0 204 100.0 340 100.0no. = number, univ. = university.a More tutorials, more field studies, and more training for student's life skills.b In this table, the sample size appears to be larger than that in Tables A5.5–A5.8 because one sample lecturer gave more than one answer.Source: Field surveys in July 2004.
Average Employment Rate 2000 Average Employment Rate 50
grad. = graduate, univ. = university.Source: Field surveys in July 2004.
200056
2003 a 58
2003 a 65
Table A5.13: Average Employment Rate of Graduates from Project Universities
Public Univ. Grad. Private Univ. Grad.
Table A5.12: Lecturers' Suggestions on How to Improve Student Performance
Public Univ. Private Univ. Total
(%)
36 Appendix 5

No. % No. % No. %< 6 Months 43 69.4 56 54.9 99 60.46 Months to 1 Year 12 19.4 19 18.6 31 18.9> 1 Year 7 11.3 27 26.5 34 20.7 Total 62 100.0 102 100.0 164 100.0
grad. = graduate, no. = number, univ. = university.Source: Field surveys in July 2004.
No. % No. % No. %Highly Relevant 30 48.4 66 64.7 96 58.5Moderately Relevant 19 30.6 21 20.6 40 24.4Partly Relevant 7 11.3 12 11.8 19 11.6Not Relevant 6 9.7 3 2.9 9 5.5
Total 62 100.0 102 100.0 164 100.0grad. = graduate, no. = number, univ. = university.Source: Field surveys in July 2004.
No. % No. % No. %More Training Provided by Potential Employers during Study Period 47 27.8 72 30.6 119 29.5More Research Support from Employers 40 23.7 47 20.0 87 21.5Rep. of Potential Employers in Univ. Mgt. Board for Curriculum Consultations 27 16.0 32 13.6 59 14.6More Lecturers with Overseas Degrees 20 11.8 38 16.2 58 14.4More Budget Support from MONE 24 14.2 33 14.0 57 14.1More Tuition Fees Collected from Students 9 5.3 8 3.4 17 4.2Othersa 2 1.2 5 2.1 7 1.7
Totalb 169 100.0 235 100.0 404 100.0grad. = graduate, mgt. = management, MONE = Ministry of National Education, no. = number, rep. = representative, univ. = university.a More suitable subjects, more grants for teaching/research, and more equipment related to studies.b In this table, the sample size appears to be larger than that in Tables A5.14 and A5.15 because one sample graduate gave more than one answer.Source: Field surveys in July 2004.
Areas of Improvements Needed
Public Univ. Grad. Private Univ. Grad. Total
Table A5.16: Graduates' Suggestions on How to Improve the Relevance of Curricula to Job Requirements
Public Univ. Grad. Private Univ. Grad. Total
Extent of Relevance
Table A5.14: Job Search Period of Employed Graduates
Table A5.15: Graduates' Perceptions about the Relevance of Curricula to Job Requirements
Private Univ. Grad. TotalPublic Univ. Grad. Job Search Period
Appendix 5 37

Areas of Improvements Needed No. % No. % No. %More Training Provided by Potential Employers during Study Period 21 21.9 40 24.1 61 23.3More Research Support from Employers 25 26.0 35 21.1 60 22.9More Budget Support from MONE 15 15.6 30 18.1 45 17.2More Lecturers with Overseas Degrees 15 15.6 26 15.7 41 15.6Rep. of Potential Employers in Univ. Mgt. Board for Curriculum Consultations 13 13.5 21 12.7 34 13.0More Tuition Fees Collected from Students 4 4.2 14 8.4 18 6.9Othersa 3 3.1 0 0.0 3 1.1 Totalb 96 100.0 166 100.0 262 100.0
mgt. = management, MONE = Ministry of National Education, no. = number, rep. = representative, univ. = university.a More grants for teaching/research and more equipment related to studies.b In this table, the sample size appears to be larger than that in Tables A5.5–A5.8 because one sample lecturer gave more than one answer.Source: Field surveys in July 2004.
Areas of Improvements Needed No. % No. % No. %More Training Provided by Potential Employers during Study Period 38 26.6 63 22.7 101 24.0More Research Support from Employers 26 18.2 60 21.7 86 20.5More Lecturers with Overseas Degrees 26 18.2 46 16.6 72 17.1More Budget Support from MONE 24 16.8 47 17.0 71 16.9Rep. of Potential Employers in Univ. Mgt. Board for Curriculum Consultations 14 9.8 35 12.6 49 11.7More Tuition Fees Collected from Students 13 9.1 23 8.3 36 8.6Othersa 2 1.4 3 1.1 5 1.2 Totalb 143 100.0 277 100.0 420 100.0
mgt. = management, MONE = Ministry of National Education, no. = number, rep. = representative, univ. = university.a More grants for teaching/research and more equipment related to studies.b In this table, the sample size appears to be larger than that in Table A5.19 because one sample employer gave more than one answer.Source: Field surveys in July 2004.
Extent of Satisfaction No. %Performance of Graduates from Public Universities Highly Satisfied 14 45.2 Moderately Satisfied 15 48.4 Partly Satisfied 2 6.5 Not Satisfied 0 0.0 Total 31 100.0Performance of Graduates from Private Universities Highly Satisfied 11 21.2 Moderately Satisfied 38 73.1 Partly Satisfied 1 1.9 Not Satisfied 2 3.8 Total 52 100.0no. = number.Source: Field surveys in July 2004.
Table A5.18: Employers' Suggestions on How to Improve the Relevance of Curricula to Job Requirements
Table A5.17: Lecturers' Suggestions on How to Improve the Relevance of Curricula to Job Requirements
Public-Sector Employers
Employers
Private Univ. Lecturers
Private Sector-Employers
Table A5.19: Employers' Satisfaction with Performance of Graduates from Project Public and Private Universities
Public Univ. Lecturers
Total Employers
Total
38 Appendix 5

Table A6.1: Government's Financial Sustainability Prospects
1995 1996 1997 1998 1999 2000 2001 2002 2003GDP (at current price, Rp billion) 454,514 532,568 627,695 955,753 1,099,732 1,264,919 1,467,655 1,610,012 1,786,691
Recurrent Exp.Overall Rec. Exp. (Rp billion)a 50,435 62,561 89,610 103,261 156,756 161,387 218,924 189,070 188,583Overall Rec. Exp./GDP (%) 11.1 11.7 14.3 10.8 14.3 12.8 14.9 11.7 10.6
Total Rec. Education Exp. (Rp billion)b 3,635 4,217 5,183 5,667 7,495 6,955 11,436 13,357 15,493 - Primary Education 1,280 1,313 1,614 1,765 2,505 2,330 3,854 4,581 5,252 - Secondary Education 1,249 1,305 1,603 1,753 2,619 2,441 3,957 4,568 5,190 - Higher Education 663 722 900 996 1,316 1,192 1,978 2,378 2,789 - Others (Nonformal and Technical Education) 443 876 1,066 1,153 1,055 991 1,647 1,830 2,262
Total Rec. Education Exp./GDP (%) 0.8 0.8 0.8 0.6 0.7 0.5 0.8 0.8 0.9Total Rec. Education Exp./Overall Rec. Exp. (%) 7.2 6.7 5.8 5.5 4.8 4.3 5.2 7.1 8.2
- Primary Education Rec. Exp./Total Rec. Education Exp. (%) 35.2 31.1 31.1 31.1 33.4 33.5 33.7 34.3 33.9 - Secondary Education Rec. Exp./Total Rec. Education Exp. (%) 34.4 30.9 30.9 30.9 34.9 35.1 34.6 34.2 33.5 - Higher Education Rec. Exp./Total Rec. Education Exp. (%) 18.2 17.1 17.4 17.6 17.6 17.1 17.3 17.8 18.0 - Other Education Rec. Exp./Total Rec. Education Exp. (%) 12.2 20.8 20.6 20.3 14.1 14.3 14.4 13.7 14.6
av. = average, exp. = expenditure, GDP = gross domestic product, gr. = growth, MONE = Ministry of National Education, rec. = recurrent.a In this case, "budget" and "expenditure" are used interchangeably, because budget allocated from one source to a recipient will finally become an expenditure of the recipient.b Including only education expenditure under MONE.Source: Central Bureau of Statistics, MONE, staff estimates.
Year
Item
SUSTAINABILITY ANALYSIS Appendix 6 39

Item Amount % Amount % Amount % Amount % Total Annual Recurrent Budget (Rp billion) 1.0 59.5 221.6 31.8 Average Annual Recurrent Budget per University (Rp billion) 1.0 59.5 44.3 2.9 Total Students in All Programs 36 8,425 46,948 19,043 Average Annual Recurrent Budget per Student (Rp million) 27.8 7.1 4.7 1.7 Sources of Recurrent Budget (%) 100.0 100.0 100.0 100.0 - Government 0.0 60.6 64.8 0.0 - Tuition and Other Fees from Regular Programs 80.0 37.7 27.1 84.6 - Income from Other Sources 20.0 1.7 8.1 15.4
Uses of Recurrent Budget (%) 100.0 100.0 100.0 100.0 - Staff Salaries/Support 85.9 89.4 93.4 73.0 - Operation and Maintenance 5.7 3.5 2.7 10.3 - Quality-Enhancing Activities 8.4 7.1 3.9 16.7BIOTROP = Southeast Asian Regional Center for Tropical Biology, ITS = Surabaya Institute of Technology, univ. = university.Source: Field surveys in July 2004.
Table A6.2: Sources and Uses of Universities' Annual Recurrent Budget (2003)
BIOTROPProject Univ. Project Resource Centers
ITS 11 Private Univ.5 Public Univ.
40 Appendix 6

ECONOMIC ANALYSIS
1. No economic analysis was done at appraisal or at project completion. This project performance audit report estimated an economic internal rate of return (EIRR) as an indicator for efficiency of project investment. The calculations of the economic cost and benefits of the Project were based on the world price numeraire, using a standard conversion factor of 0.9 to adjust the nontraded component of the economic cost and benefits to the border price level. The economic cost was the project cost, divided into traded and nontraded components. Both components were expressed in constant 2003 prices, by using a dollar deflator (manufacturing unit value index) applied to the traded component and a domestic deflator (gross domestic product deflator) to the nontraded component, and converted to the local currency. The Project’s capital cost was incurred during project implementation. The Project’s recurrent cost continued after the project period. The cut-off year in the EIRR estimates is 2027, during which the scrap value of capital is assumed negligible. 2. The economic benefits were the difference in productivity gains to the economy between the project and non-project situations. The Project contributed to increasing both the numbers of graduates and their quality, hence employment opportunities. Thus, the productivity gains were measured by the product of the numbers of graduates from all project public and private universities combined (not just the sample universities) and their corresponding average incremental wage rates1 over their earning lifetime, adjusted by the average regional employment rates.2 Future productivity gains after the cut-off year was discounted and their present values added to the productivity gains in the cut-off year. The numbers of graduates used in the estimates for the with-project case were the actual numbers up to year 2003, after which the estimated numbers were used, based on the average annual growth rate of graduates after the project period (2001–2003).3 As for the without-project case, the actual numbers were used up to year 2000, after which approximate numbers were used based on the average annual growth rate of graduates before or during the project period (1994–2000). Intangible benefits of higher education could not be captured in the EIRR calculation. The estimated EIRR at the time of evaluation is 9.4% (Table A7.1). Despite the heavy depreciation of the rupiah against the US dollar as a result of the unforeseen Asian financial crisis during the late 1990s, the EIRR is slightly less than ADB’s benchmark economic opportunity cost of capital (12.0%). 3. For comparison, this project performance audit report also estimated an EIRR using the data on the project cost and benefits during appraisal (Table A7.2). The resulting EIRR at appraisal, 17.5%, justified the project investment. The currency depreciation reduced the EIRR at the time of evaluation because a portion of the project cost was denominated in US dollar. This cost became much more expensive relative to the benefits when converted into rupiah.
1 Based on the field surveys conducted by the Operations Evaluation Mission in July 2004, the prevailing wage rate
of high school graduates was about Rp600,000/month. The incremental wage rate between public university graduates and high school graduates was about Rp200,000/month (Rp2.4 million/year), and that between private university graduates and high school graduates was about Rp150,000/month (Rp1.8 million/year). These incremental wage rates are assumed to increase 2%/year because the wage rates of university graduates normally grow faster than those of high school graduates.
2 Based on the same surveys mentioned above, the average regional employment rate before (without) the Project was about 54% and after (with) the Project was about 66%. The latter was assumed to increase gradually to 74%.
3 The average annual growth rates of graduates after the project period are 8% for public universities and 10% for private universities. The corresponding growth rates before the project period were 6% for both public and private universities.
Appendix 7 41

42 Appendix 7
Table A7.1: Economic Internal Rate of Return at Project Evaluation (Rp million)
Econ. Values Project Cost Gained from Total NetProductivity Capital Cost Recurrent Cost Project Economic
Year Increase Traded Nontraded Nontraded Cost Benefits1994 0 7,580 10,206 7,524 25,310 (25,310)1995 0 28,637 37,103 27,351 93,091 (93,091)1996 0 67,465 76,833 62,931 207,229 (207,229)1997 0 137,458 128,848 111,743 378,049 (378,049)1998 0 101,072 51,879 63,738 216,688 (216,688)1999 0 286,370 129,313 70,092 485,775 (485,775)2000 0 197,595 79,295 50,829 327,720 (327,720)2001 5,843 50,829 50,829 (44,986)2002 11,074 50,829 50,829 (39,755)2003 17,954 50,829 50,829 (32,875)2004 27,903 50,829 50,829 (22,926)2005 39,274 50,829 50,829 (11,555)2006 52,222 50,829 50,829 1,3932007 66,921 50,829 50,829 16,0922008 83,560 50,829 50,829 32,7312009 102,348 50,829 50,829 51,5192010 123,514 50,829 50,829 72,6852011 147,311 50,829 50,829 96,4822012 174,016 50,829 50,829 123,1872013 203,932 50,829 50,829 153,1032014 241,766 50,829 50,829 190,9372015 283,882 50,829 50,829 233,0532016 330,715 50,829 50,829 279,8862017 382,740 50,829 50,829 331,9112018 440,479 50,829 50,829 389,6502019 504,502 50,829 50,829 453,6732020 575,436 50,829 50,829 524,6072021 653,966 50,829 50,829 603,1372022 740,843 50,829 50,829 690,0142023 836,889 50,829 50,829 786,0602024 943,006 50,829 50,829 892,1772025 1,060,179 50,829 50,829 1,009,3502026 1,189,488 50,829 50,829 1,138,6592027 10,491,307 50,829 50,829 10,440,478
EIRR = 9.4%Econ. = economic, EIRR = economic internal rate of return.Source: Staff estimates.

Appendix 7 43
Table A7.2: Economic Internal Rate of Return at Project Appraisal (Rp million)
Econ. Values Project Cost Gained from Total NetProductivity Capital Cost Recurrent Cost Project Economic
Year Increase Traded Nontraded Nontraded Cost Benefits1994 0 2,468 1,547 226 4,241 (4,241)1995 0 9,263 5,590 816 15,668 (15,668)1996 0 21,987 11,678 1,894 35,559 (35,559)1997 0 44,559 19,514 3,350 67,423 (67,423)1998 0 32,675 7,786 1,894 42,354 (42,354)1999 0 92,578 19,231 2,064 113,873 (113,873)2000 0 64,382 11,861 1,505 77,749 (77,749)2001 3,885 1,505 1,505 2,3802002 7,576 1,505 1,505 6,0712003 12,762 1,505 1,505 11,2572004 20,265 1,505 1,505 18,7602005 28,845 1,505 1,505 27,3402006 38,619 1,505 1,505 37,1142007 49,721 1,505 1,505 48,2162008 62,293 1,505 1,505 60,7882009 76,496 1,505 1,505 74,9912010 92,503 1,505 1,505 90,9982011 110,506 1,505 1,505 109,0012012 130,715 1,505 1,505 129,2102013 153,364 1,505 1,505 151,8592014 182,004 1,505 1,505 180,4992015 213,897 1,505 1,505 212,3922016 249,372 1,505 1,505 247,8672017 288,792 1,505 1,505 287,2872018 332,555 1,505 1,505 331,0502019 381,095 1,505 1,505 379,5902020 434,890 1,505 1,505 433,3852021 494,463 1,505 1,505 492,9582022 560,385 1,505 1,505 558,8802023 633,286 1,505 1,505 631,7812024 713,852 1,505 1,505 712,3472025 802,836 1,505 1,505 801,3312026 901,062 1,505 1,505 899,5572027 8,156,492 1,505 1,505 8,154,987
EIRR = 17.5%Econ. = economic, EIRR = economic internal rate of return.Source: Staff estimates.

44 Appendix 8
2000 2003Western Region
Bengkulu 54 68Jambi 55 67South Sumatra 54 66Lampung 54 66Central Java 53 64East Java 53 64West Java 54 65
Eastern RegionBali 57 66East Nusa Tenggara 54 65
Source: Provincial bureaus of statistics.
Region and Province
SOCIOECONOMIC STATUS OF THE SAMPLE GRADUATES
Table A8.1: Average Employment Rate by Province and Region(%)
Average Employment Rate

Appendix 8 45
Monthly Salary Range No. % No. % No. %Rp600,000 8 12.9 15 14.7 23 14.0Rp600,001–2,000,000 40 64.5 78 76.5 118 72.0Rp2,000,001–4,000,000 11 17.7 7 6.9 18 11.0> Rp4,000,000 3 4.8 2 2.0 5 3.0 Total 62 100.0 102 100.0 164 100.0
no. = number, univ. = university.Source: Field surveys in July 2004.
Table A8.2: Average Monthly Salary Range of Employed Graduates
Public Univ. Private Univ. Total
MANAGEMENT RESPONSE TO THE PROJECT PERFORMANCE AUDIT REPORT ON THE HIGHER EDUCATION PROJECT IN INDONESIA
(Loan 1253-INO)
On 17 March 2005, the Director General, Operations Evaluation Department, received
the following response from the Managing Director General on behalf of Management:
1. Management finds the report well prepared and contains a thorough analysis. The issues and lessons given are pertinent to future projects in the sector. 2. The Project Completion Report rated this project successful. The PPAR also rates the Project as successful. While the project had a substantial institutional development impact, it is noted that sustainability is less than the desired in a difficult period. 3. The Project, approved in 1992 and closed in 2000, was implemented during a period of significant changes, the most important being the financial crisis having impact on the second half of its implementation. The crisis put a heavy fiscal burden on the Government, and the universities had to generate revenues from sources other than the state budget. However, during the crisis, external sources were limited and the proportion of other revenues remained small, which made the Project’s financial sustainability less likely for many universities. Cost recovery and revenue enhancement remain an important issue for future operations. 4. Five key issues emerged from the evaluation of this operation: the need to (i) integrate the Project’s benefit monitoring and evaluation (BME) systems into the normal operations of the project universities; (ii) improve the operations and maintenance (O&M) of project facilities; (iii) increase cost recovery; (iv) update program curricula: and (v) improve networking activities with private universities and enterprises. 5. Management notes that the three key issues of PPAR (items [iii] to [v]) have already guided the design of the ongoing Loan 1792-INO: Technological Professional Skills Development Sector Project (TPSDSP) approved in November 2000, and will continue to guide any future higher education project. 6. ADB has also addressed recently the key issue item (i). It has ensured that the TPSDSP BME will be integrated into the management information system of the Directorate General for Higher Education (DGHE) as well as to the 74 participating universities and higher education institutions. The integration of the systems, which is already well on its way, is recorded in an MOU from a recent project review mission signed by DGHE and ADB on 10 January 2005. 7. As to recommendation item (ii) that the 74 project institutions should prepare preventive O&M plans, Management agrees that this is important. The implementation of this recommendation under TPSDSP, including detailed

procedures and funding requirements, will therefore be a major subject for the next project review mission planned later this year. 8. Finally, Management notes the PPAR recommendation that any future employment-related project should be designed in consultation with key private enterprises. There will be a need to ensure a balance between requests of single and dominating local enterprises and the needs of the local, regional, or national labor markets more generally. While private higher education institutions may choose to supply skilled labor force for a few local enterprises, state universities will have to maintain broader objectives for their study programs.