production of chitin-glucan complex by · diana filipa vieira araújo degree in biochemistry...
TRANSCRIPT
Diana Filipa Vieira Araújo
Degree in Biochemistry
Production of chitin-glucan complex by
Pichia pastoris
Dissertation for the Degree of Master in Biotechnology
Supervisor: Dr.ª Maria Filomena Andrade de Freitas,
Post-Doctoral Researcher, Faculdade de Ciências e
Tecnologia, UNL
Co-supervisor: Professor Maria da Ascensão Carvalho
Fernandes Miranda Reis, Full professor, Faculdade de
Ciências e Tecnologia, UNL
Jury:
President: Prof. Dr. Pedro Miguel Calado Simões
Examiner: Dr. Christophe François Aimé Roca
September, 2013


Diana Filipa Vieira Araújo
Degree in Biochemistry
Production of chitin-glucan complex by
Pichia pastoris
Dissertation for the Degree of Master in Biotechnology
Supervisor:
Dr.ª Maria Filomena Andrade de Freitas, Post-Doctoral
Researcher, Faculdade de Ciências e Tecnologia, UNL
Co-supervisor:
Professor Maria da Ascensão Carvalho Fernandes
Miranda Reis, Full professor, Faculdade de Ciências e
Tecnologia, UNL
September, 2013

Production of chitin-glucan complex by Pichia pastoris Copyright © Diana Filipa Vieira Araújo, Faculdade de Ciências e Tecnologia, Universidade Nova de Lisboa A Faculdade de Ciencias e Tecnologia e a Universidade Nova de Lisboa tém 0 direito, perpétuo e sem limites geográficos, de arquivar e publicar esta dissertação através de exemplares impressos reproduzidos em papel ou de forma digital, ou por qualquer outro meio conhecido ou que venha a ser inventado, e de a divulgar atraves de repositôrios cientificos e de admitir a sua
côpia e distnibuiçao com objectivos educacionais ou de investigacao, não comerciais, desde
que seja dado crédito ao autor e editor.

i
Acknowledgments
I wish to express my sincere gratitude to my supervisor Dr.ª Filomena Freitas for all
kinds of help, friendship, continuous support and guidance during my research on this project.
I am grateful to my co-supervisor Prof. Dr. Maria Ascensão Reis for giving me the
opportunity to use the laboratories of Biochemical and Process Engineering Group (FCT/UNL)
and for her valuable advices and critics.
I would like to thank to Bárbara Chagas, for her help and important suggestions through
this work.
I am also thankful to all members of BPEG group, especially to Inês Farinha, Sílvia
Antunes and Margarida Carvalho for their help, patience and advices that give to me.
I am grateful to my friends for their friendship and continuous support for years, even in
sleepless days and nights.
The most importantly, I would to like specially thank to my dear parents, sisters,
grandparents and my boyfriend for their love, support, understanding and encouragement me
all through my life. I wish especially thankful to my mum for her strength and support in my
formation and education.

ii
iii
Abstract
The yeast Pichia pastoris produces chitin-glucan complex (CGC), as a cell wall component.
CGC is composed of two types of biopolymers, chitin and β-glucans, which confer it great
potential for use in the food, cosmetic and pharmaceutical industries. CGC hydrolysis, allows
obtaining chitin/chitosan and glucans individually. The chitin and chitosan obtained from CGC
have the considerable advantage of being of non-animal origin, which further extends their
applications. In last year’s, the production of CGC by Pichia pastoris was realized with glycerol
as sole carbon source, achieving high cell density.
In this study, different substrates were tested for cultivation of P. pastoris and CGC
production. In the first part, mixtures of glucose and xylose, in varying proportions, were tested.
Since glucose and xylose are two of the main sugar components of lignocellulosic wastes, the
ability of P. pastoris to use them as carbon sources would allow their valorization into value-
added products. In the second part, several wastes and byproducts generated by different
industries were tested for their suitability as substrates for P. pastoris cultivation.
In study of the glucose/xylose mixtures, the best performance was achieved in batch
bioreactor experiments with 25% xylose in the medium (20 gL-1
of xylose and 60 gL-1
of
glucose), where 35.25 gL-1
biomass was obtained in 64 hours of cultivation. CGC content in the
cell wall reached 15% with a volumetric productivity of 0.085 gL-1
.h-1
. The molar ratio of chitin:β-
glucan in the extracted biopolymer was 47:53, higher than obtained with crude glycerol (16:84).
In the second part of study, several wastes and byproducts (used cooking oil, sugarcane
molasses, cheese whey, waste paper and spent coffee grounds) were tested. The results show
that P. pastoris presented low biomass concentration using any of these substrates.
Nevertheless, in batch bioreactor experiments the best results were achieved with sugarcane
molasses, where 17.78 gL-1
biomass were obtained with a CGC content of 17%.
Among the tested substrates, the mixtures of glucose/xylose appear to be the most
promising due the good CGC production obtained and the high glucosamine molar fraction in
produced polymer. This study opens the hypothesis of utilization of lignocellulosic materials with
xylose percentages up to 50%.
Keywords: Chitin, Chitin-glucan complex, Pichia pastoris, Carbon source, Residues, Xylose

iv

v
Resumo
A levedura Pichia Pastoris produz, como componente da parede celular, o complexo
quitina-glucanos (CQG). CQG é composto por dois tipos de biopolímeros, quitina e β-glucanos,
que lhe conferem grande potencial para utilização nas indústrias alimentar, cosmética e
farmacêutica. A hidrólise de CQG permite obter individualmente quitina/quitosano e glucanos. A
quitina/quitosano obtida a partir de CQG possue uma vantagem considerável por ser de origem
não animal, alargando a gama de aplicações.
Neste estudo, foram testados diferentes substratos para o cultivo de P. pastoris e
produção de CQG. Na primeira parte, misturas de glucose e xilose, em proporções variáveis,
foram estudadas. Uma vez que glucose e xilose são dois dos principais açúcares constituintes
de resíduos lignocelulósicos, a capacidade de P. pastoris para usá-los como fonte de carbono
permitirá a sua valorização em produtos de valor acrescentado. Na segunda parte do estudo,
vários resíduos e subprodutos gerados por diferentes indústrias foram testados quanto à sua
potencialidade como substratos para o cultivo de P. pastoris.
No estudo de misturas de glucose e xilose, o melhor desempenho foi alcançado pela
mistura com 25% de xilose no meio (20 gL-1
de xilose e 60 gL-1
de glucose), onde 35.25 gL-1
de
biomassa foi obtida em 64 horas de cultivo. A percentagem de CQG atingiu os 15% com uma
produtividade volumetrica de 0.085 gL-1
.h-1
. O ratio molar de quitina:glucanos no biopolímero
extraído foi de 47:53, maior que o obtido com glicerol da indústria do biodiesel (16:84).
Na segunda parte do estudo, vários resíduos e subprodutos como melaços de cana-de-
açúcar, soro de leite e borra de café, foram testados. Os resultados demonstram que utilizando
estes substratos, P. pastoris atinge uma baixa concentração de biomassa. No entanto, em
ensaios batch em bioreactor os melhores resultados foram atingidos com melaço de cana de
açúcar onde 17.78 gL-1
de biomassa foram obtidos com um teor de 17% em CQG.
De entre os substratos testados, as misturas de glucose/xilose aparentam ser as mais
promissoras devido à boa produção de CQG obtida e à elevada fracção molar de glucosamina
no polímero produzido. Este estudo permite a hipótese de utilização de materiais
lignocelulósicos com percentagem de xilose não superior a 50%.
Keywords: Quitina, Complexo Quitina-glucanos, Pichia pastoris, Fonte de carbono, Resíduos,
Xilose

vi
vii
Contents
ACKNOWLEDGMENTS ................................................................................................................ I
ABSTRACT .................................................................................................................................. III
RESUMO ....................................................................................................................................... V
CONTENTS ................................................................................................................................. VII
LIST OF FIGURES ....................................................................................................................... IX
LIST OF TABLES ........................................................................................................................ XI
ABBREVIATIONS ...................................................................................................................... XIII
1. MOTIVATION ........................................................................................................................ 1
2. INTRODUCTION ................................................................................................................... 3
2.1 PICHIA PASTORIS ............................................................................................................. 3
2.2 YEAST CELL WALL ............................................................................................................ 5
2.2.1 Glucans and Mannans............................................................................................... 7
2.2.2 Chitin / Chitosan ........................................................................................................ 8
2.2.3 CGC ......................................................................................................................... 11
2.3 WASTES / BYPRODUCTS ................................................................................................. 12
2.3.1 Sugarcane Molasses ............................................................................................... 12
2.3.2 Cheese Whey .......................................................................................................... 13
2.3.3 Spent Coffee Grounds ............................................................................................. 13
2.3.4 Other wastes/byproducts ......................................................................................... 14
3. MATERIALS AND METHODS ............................................................................................ 17
3.1 YEAST STRAIN AND GROWTH MEDIA ................................................................................ 17
3.2 INOCULA PREPARATION .................................................................................................. 19
3.3 SHAKE FLASK SCREENING ............................................................................................. 19
3.4 BATCH BIOREACTOR EXPERIMENTS ................................................................................. 20
3.5 ANALYTICAL TECHNIQUES ............................................................................................... 20
3.5.1 Cell growth ............................................................................................................... 20
3.5.2 Biomass quantification............................................................................................. 20
3.5.3 Substrate concentration........................................................................................... 20
3.5.4 CGC Extraction ........................................................................................................ 21
3.5.5 CGC composition .................................................................................................... 21
3.5.6 Kinetic parameters ................................................................................................... 22
4. RESULTS AND DISCUSSION ........................................................................................... 23
4.1 USE OF GLUCOSE AND XYLOSE MIXTURES FOR CULTIVATION OF PICHIA PASTORIS AND
CHITIN-GLUCAN COMPLEX PRODUCTION ...................................................................................... 23
4.1.1 Shake flask screening ............................................................................................. 23
4.1.2 Batch bioreactor experiments .................................................................................. 25
4.1.3 Conclusions ............................................................................................................. 31
4.2 VALORIZATION OF FOOD AND INDUSTRY BYPRODUCTS FOR THE PRODUCTION OF CHITIN-
GLUCAN COMPLEX ...................................................................................................................... 33
4.2.1 Substrates preparation ............................................................................................ 33
4.2.2 Shake flask screening ............................................................................................. 35
4.2.3 Batch bioreactor experiments .................................................................................. 36
4.2.4 Conclusions ............................................................................................................. 41

viii
5. GENERAL CONCLUSIONS AND FUTURE WORK .......................................................... 43
5.1 GENERAL CONCLUSIONS ................................................................................................ 43
5.2 FUTURE WORK ............................................................................................................... 43
5.2.1 Testing lignocellulosic residues ............................................................................... 44
5.2.2 Bioreactor operating mode ...................................................................................... 44
5.2.3 Impact of residues in CGC composition .................................................................. 44
6. REFERENCES .................................................................................................................... 47
7. APPENDIX .......................................................................................................................... 53
ix
List of Figures
Figure 1.1 Schematic drawing of a yeast cell showing its typical morphology ............................. 3
Figure 1.2 Diagrammatic life cycle of yeast .................................................................................. 4
Figure 1.3 Electron micrographs of P. pastoris grown on different carbon sources: glucose (A)
and glycerol (B) ............................................................................................................................. 4
Figure 1.4 Schematic representation of the constituents of the cell membrane and cell wall of a
yeast .............................................................................................................................................. 6
Figure 1.5 Scheme of the cell cycle of budding yeast ................................................................... 6
Figure 1.6 Schematic representation of β-(1,3) and β-(1,6) linkages of a β-glucan
polysaccharide............................................................................................................................... 7
Figure 1.7 Structure of chitin (A) and chitosan (B) molecules ..................................................... 10
Figure 4.1 CDW and CGC obtained by cultivation of P. pastoris in the shake flask assays with
different glucose/xylose mixtures. ............................................................................................... 23
Figure 4.2 Cultivation profiles of the batch bioreactor experiments: 0%Xyl (A), 12.5%Xyl (B) and
25%Xyl (C). ................................................................................................................................. 26
Figure 4.3 Cultivation profiles of the batch bioreactor experiments: 50%Xyl (A) and 75%Xyl (B).
..................................................................................................................................................... 28
Figure 4.4 CGC composition for experiments with 0%, 25% and 75% of xylose. %mol Glc, %
molar of glucose; %mol GclN, % molar of glucosamine. ............................................................ 30
Figure 4.5 Efficiency of acid hydrolysis, in terms of total sugar concentration in the hydrolysates
..................................................................................................................................................... 34
Figure 4.6 Biomass growth (CDW) obtained by cultivation of P. pastoris in the shake flask
assays with different residues. .................................................................................................... 35
Figure 4.7 Cultivation profile of the batch bioreactor with biodiesel byproduct crude glycerol as
sole carbon source. ..................................................................................................................... 37
Figure 4.8 Cultivation profiles of the batch bioreactor experiments with sugarcane molasses. . 38
Figure 4.9 Cultivation profiles of the batch bioreactor experiments with spent coffee grounds
hydrolysate .................................................................................................................................. 39
Figure 7.1 Calibration curves obtained for glucose (A) and xylose (B) concentration ................ 53
Figure 7.2 Calibration curves obtained for glucose (A) and xylose (B) concentration. ............... 54
Figure 7.3 Standard curves for Dubois assay. ............................................................................ 55
Figure 7.4 Calibration curves obtained for glucosamine (A), glucose (B) and mannose (C)
concentration. .............................................................................................................................. 56

x
xi
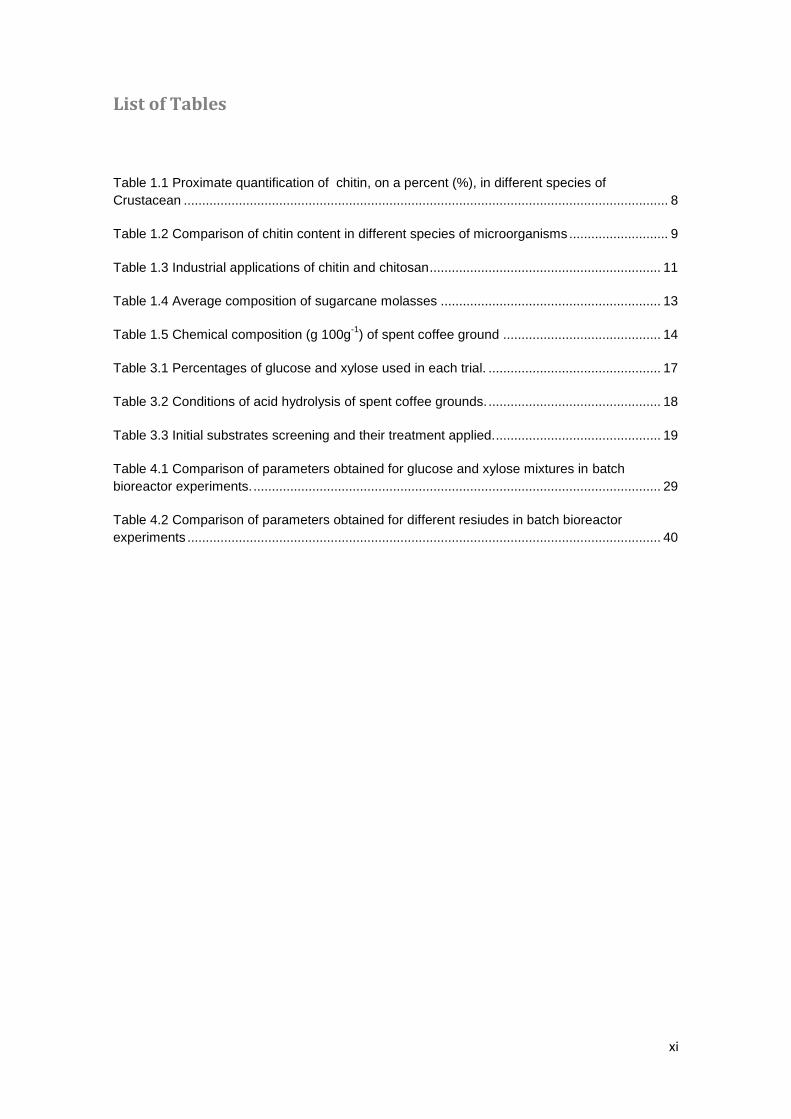
List of Tables
Table 1.1 Proximate quantification of chitin, on a percent (%), in different species of
Crustacean .................................................................................................................................... 8
Table 1.2 Comparison of chitin content in different species of microorganisms ........................... 9
Table 1.3 Industrial applications of chitin and chitosan ............................................................... 11
Table 1.4 Average composition of sugarcane molasses ............................................................ 13
Table 1.5 Chemical composition (g 100g-1
) of spent coffee ground ........................................... 14
Table 3.1 Percentages of glucose and xylose used in each trial. ............................................... 17
Table 3.2 Conditions of acid hydrolysis of spent coffee grounds. ............................................... 18
Table 3.3 Initial substrates screening and their treatment applied.............................................. 19
Table 4.1 Comparison of parameters obtained for glucose and xylose mixtures in batch
bioreactor experiments. ............................................................................................................... 29
Table 4.2 Comparison of parameters obtained for different resiudes in batch bioreactor
experiments ................................................................................................................................. 40

xii

xiii
Abbreviations
AOX – Peroxisome Alcohol Oxidase
CDW – Dry Cell Weight (gL-1
)
CGC – Chitin-Glucan Complex
DOC – Dissolved Oxygen Concentration (pO2 (%))
EPS – Exopolysaccharides
Glc – Glucose
GlcN – Glucosamine
GlcNAc – N-acetyl-D-glucosamine
HCl – Hydrochloric acid
HPLC – High Performance Liquid Chromatography
OD600nm – Optical density at 600 nm
PHA – Polyhydroxyalkanoate
rp – Overall volumetric productivity (gL-1
.h-1
)
rpm – rotation per minute
RS – Substrate consumption rate
SCG – Spent Coffee Grounds
SCP – Single-Cell Protein
TFA – Trifluoroacetic acid
vvm – gas volume per liquid volume per time
Xyl – Xylose
YP/S – Production yield (g g-1
)
YX/S – Growth yield (g g-1
)
μmax – Maximum specific growth rate (h-1
)

xiv

Production of chitin-glucan complex by Pichia pastoris
1
1. Motivation
In the last decade, the advancement of technology has allowed industries to have a
remarkable development, which led to an exponential demand of their processes. On the other
hand, the high demand for industrial products has led to an increased generation of wastes
and/or byproducts that often pose economical and environmental concerns
(Pipatti et al., 2006).The growing demand for raw materials, coupled to the exponential increase
of industrial wastes/byproducts generated, has led to the emergence of the valorization concept,
which aims at the production of value-added products from industrial wastes/byproducts
(sustainable development) (FitzPatrick et al., 2010; Laufenberg et al., 2003).
Industrial wastes/byproducts have a very varied composition, depending on the type of
industry that generates them. In particular, many agro-food industry wastes/byproducts are
essentially composed of lignocellulosic material, which gives them great advantages for their
use in biotechnological processes. Agro-industrial wastes and byproducts, such as wheat straw,
corn stover, winter rye, corn cobs, beet pulp, bran and waste wood are examples of
lignocellulosic-rich raw materials (Nigam and Pandey, 2009). The lignocellulosic materials are
composed essentially of cellulose, hemicellulose and lignin. Cellulose and hemicellulose, the
major constituents of lignocellulosic materials, are macromolecules of different sugars, whereas
lignin is an aromatic polymer (Sánchez, 2009).
In most cases, agro-industrial residues are wasted in landfills or used in low-valued
applications, such as burning and composting. However, in the last decade, the growing
environmental awareness increased the interest in using those materials, due to their eco-
friendly properties: they are renewable, recyclable, sustainable and biodegradable materials
(Satyanarayana et al., 2009). Consequently, the value of such materials has increased due to
the development of new chemical and physical techniques that allowed their conversion into
value-added products, such as, for example, reducing sugars, ethanol, furfural and many other
chemical products (Sun and Cheng, 2002; Demirbas, 2008).
Currently, there is great need to develop novel bio-based products and other innovative
technologies that can decrease dependence on fossil fuel. In recent years, biopolymers
production from renewable “feedstock” has attracted the public attention due to environmental
and economical concerns: preservation of fossil-based raw materials, complete biological
degradability, the reduction in the volume of garbage and compostability in the natural cycle,
protection of the climate through the reduction of carbon dioxide released, as well as the
application possibilities of agricultural resources for the production of bio/green materials
(Mohanty et al., 2000; Mohanty et al., 2002).
Production of chitin-glucan complex by Pichia pastoris
2
An alternative for the use of these residues is their biological valorization, using those
carbon rich wastes/byproducts as substrates for microbial cultivation and production of different
value added products, namely microbial biopolymers, such as polyhydroxyalkanoate (PHAs)
(Koller et al., 2010) and exopolysaccharides (EPS) (Öner, 2013).
Another example of microbial biopolymer is chitin-glucan complex (CGC) produced by
yeasts, including Pichia pastoris (P. pastoris) (Roca et al., 2012). As any other yeast, P. pastoris
produces CGC as a component of its cell wall that confers rigidity and stability to the cells.
Hydrolysis of this complex allows obtaining chitin/chitosan and glucans individually, two
bioactive biopolymers, which gives CGC great potential for use in pharmaceutical, cosmetics
and food applications (Roca et al., 2012). Recently, a patented process based on the cultivation
of P. pastoris to produce CGC was developed, based on the use of crude glycerol from
biodiesel industry as carbon source (Reis et al., 2010; Roca et al., 2012).
Production of chitin-glucan complex by Pichia pastoris
3
2. Introduction
2.1 Pichia pastoris
Pichia pastoris was initially developed in 1970 by a North American oil company, named
Philips Petroleum Company, for production of single-cell protein (SCP) as high-protein animal
feed (Cereghino and Cregg, 2000; Cos et al., 2006). The increased interest of this company for
the development of tools and protocols for the growth of this yeast, was based on the attractive
cell densities achieved on methanol (>130 gL-1
dry weight) (Cereghino and Cregg, 2000; Cregg,
1998). However, the production of SCP from this source has become unattractive, due to the
rising cost of methane, caused by the oil crisis and also to the fall in soybean prices. In the
following decade, P. pastoris has emerged as an important organism in biotechnology, when
Phillips Petroleum Company together with the Salk Institute Biotechnology / Industrial
Associates, Inc. (Sibia, La Jolla, CA) made this yeast an organism for heterologous protein
expression (Cos et al., 2006). At present, this ability still remains active, being P. pastoris widely
applied in various industries, mainly pharmaceutical, for the production of heterologous proteins
(Cereghino and Cregg, 2000).
Taxonomically, P. pastoris was classified as belonging to the Kingdom Fungi, Phylum
Ascomycota, Class Saccharomycetes, Order Saccharomycetales, Family Saccharomycetaceae
and Genus Pichia. Recently, a few species belonging the Genus Pichia were reclassified as
Komagataella, namely K. pastoris, K. phaffii and K. pseudopastoris (Kurtzman, 2009;
Kurtzman, 2005).
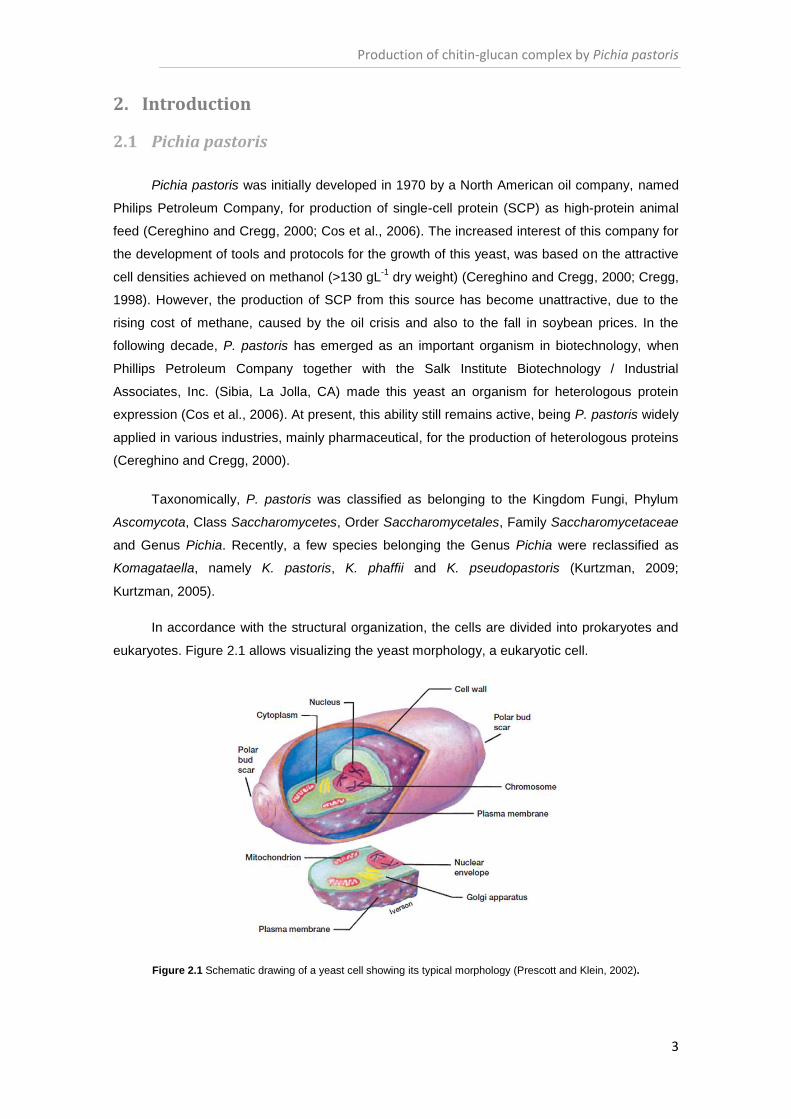
In accordance with the structural organization, the cells are divided into prokaryotes and
eukaryotes. Figure 2.1 allows visualizing the yeast morphology, a eukaryotic cell.
Figure 2.1 Schematic drawing of a yeast cell showing its typical morphology (Prescott and Klein, 2002).

Production of chitin-glucan complex by Pichia pastoris
4
Belonging to the Phylum Ascomycota, P. pastoris exists preferentially in the haploid
vegetative state, with asexually reproduction by multilateral budding. In this type of
reproduction, a dilation of the external surface of the parent body occurs, formed by mitosis.
This expansion, called the bud, remains attached to the mother cell until it is ripened. After that,
the bud can separate and give rise to a new individual cell, which is genetically identical to the
parent organism. Alternatively, sexual reproduction may occur, where the union between two
diploid cells creates the diploid phase (Figure 2.2) (Prescott and Klein, 2002).
Figure 2.2 Diagrammatic life cycle of yeast (adapted from Prescott and Klein, 2002).
P. pastoris is a unicellular eukaryotic organism, being its cells generally oval visible
under optical microscopy. Figure 2.3 shows P. pastoris cells visualized under electron
microscope at different growth conditions.
Figure 2.3 Electron micrographs of P. pastoris grown on different carbon sources: glucose (A) and glycerol (B). The
organelles are identified: mitochondria, M; Vacuole, V; Nucleus, N (bars indicate the size of cells and organelles)
(adapted from Wriessnegger et al., 2007).

Production of chitin-glucan complex by Pichia pastoris
5
Yeast growth is conditioned by many factors, including temperature and nutrition. For
the temperature, P. pastoris is known as a mesophilic organism, with an optimum growth
temperature of 30 ºC. As for nutrition, yeasts are chemoorganoheterotrophic organisms that
require the supply of organic compounds as carbon and energy sources (Prescott and
Klein, 2002).
The peculiarity that most characterizes the yeast P. pastoris, is its ability to metabolize
reduced one-carbon compounds, such as methanol, using them as the sole carbon and energy
sources for growth (methylotrophic yeast). This ability is possible due to overexpression of the
enzyme peroxisome alcohol oxidase (AOX), which can reach about 30% of the intracellular
protein in the presence of methanol (Couderc, 1980). In addition to this feature, the widespread
use of P. pastoris in biotechnology is based on two major advantages. One advantage consists
in achieving high cell densities during fermentation, over 130 gL-1
dry weight, in a controlled
environment (Cregg, 1998; Cereghino and Cregg, 2000). Another advantage of P. pastoris is its
capacity to efficiently use a wide range of substrates, including low-cost raw materials (e.g.
biodiesel waste glycerol and methanol) (Bai et al., 2009; Cui and Ellison, 2012), making the
production process economically viable and sustainable (Roca et al., 2012).
2.2 Yeast cell wall
The cell wall of yeast is about 100 to 200 nm thick and represents from 15% to 25%, by
weight, of the dry cell weight (Waites et al., 2001). Chemically, the yeast cell wall is composed
mainly of polysaccharides (85 - 90%) and protein (10 - 15%) (Nguyen and Fleet, 1998). The
polysaccharides have a structural function, while the proteins are important for the permeability
of the wall. The polysaccharides present in the yeast cell wall are essentially divided into three
classes: glucans, mannans and chitin.
Mannose molecules are attached to large proteins, located on the periphery of the cell wall,
are named mannoproteins. The constituents of the cell membrane and cell wall of yeast are
represented in Figure 2.4.

Production of chitin-glucan complex by Pichia pastoris
6
Figure 2.4 Schematic representation of the constituents of the cell membrane and cell wall of a yeast (adapted from
Ashley et al., 2006).
The cell wall structure is relatively uniform, except the septal region. The septal region is the
area where a scar is formed after budding. Figure 2.5 shows the formation of the bud scar.
Figure 2.5 Scheme of the cell cycle of budding yeast. In A to G, the old wall has been represented as empty and the new one is stippled; chitin is filled in black and the plasma membrane is shown as a dotted line. SP, septal primordia; PS, primary septum; SS, secondary septa; BSc, bud scar (Cabib and Roberts, 1982).
In the vegetative cycle of budding yeast, the bud creation occurs by phases. At beginning, a
polysaccharide (chitin) appears on the inner surface of the cell wall and, with as cell division
progresses, the bud and its wall, grow to a size slightly smaller than that of the mother cell
(Figure 2.5 A, B). By invaginations of the plasma membrane, the primary septum is formed
(Figure 2.5 C, D). Following this stage, occurs the emergence of secondary septa (consisting of
Production of chitin-glucan complex by Pichia pastoris
7
glucans and mannans) on both sides of the primary septum (Figure 2.5 E). Finally, the cells
separate, with bud scar formation (Figure 2.5 F) (Cabib and Roberts, 1982).
2.2.1 Glucans and Mannans
Among the various polysaccharides cell wall constituents of ascomycetes yeast, β-
glucans are major structural components. β-glucans are polysaccharides of D-glucose
monomers linked by β-glycosidic linkages. It is possible to find a huge variety of attachment
position of glucose molecules. There is often a linear chain of glucose molecules repetitions,
defining a main chain and from that, there are branches that produce smaller side chains (Cabib
and Roberts, 1982; Lipke and Ovalle, 1998).
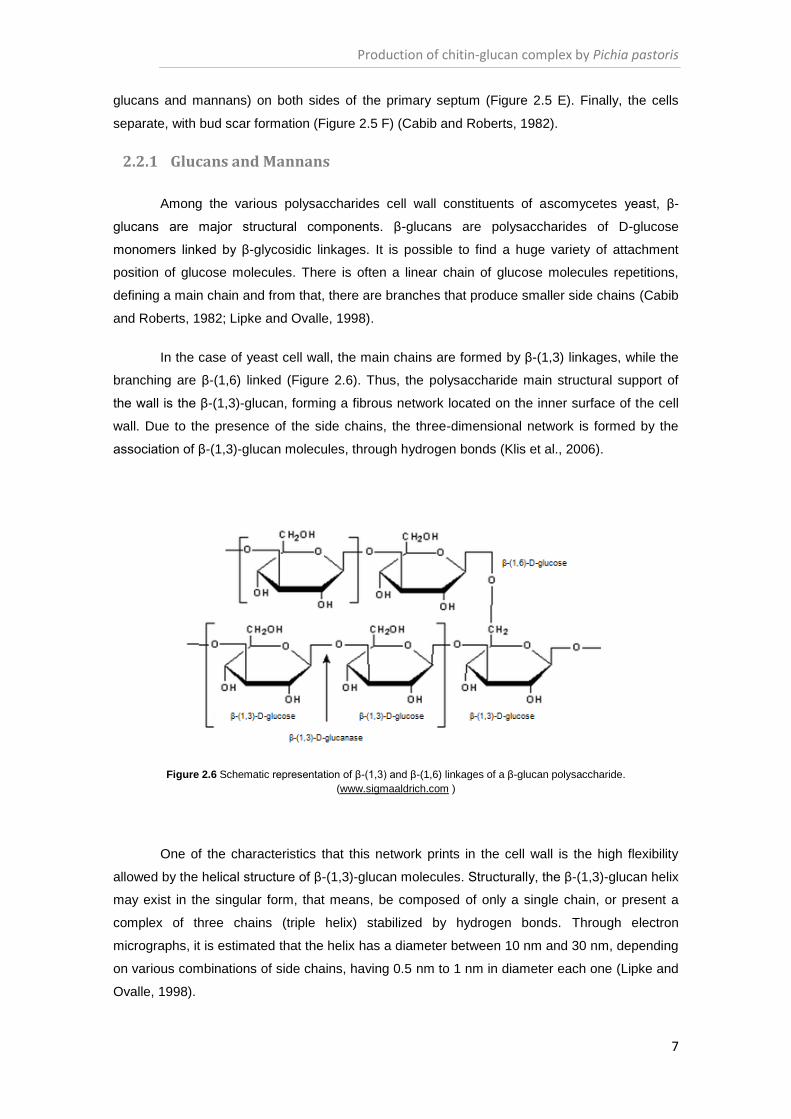
In the case of yeast cell wall, the main chains are formed by β-(1,3) linkages, while the
branching are β-(1,6) linked (Figure 2.6). Thus, the polysaccharide main structural support of
the wall is the β-(1,3)-glucan, forming a fibrous network located on the inner surface of the cell
wall. Due to the presence of the side chains, the three-dimensional network is formed by the
association of β-(1,3)-glucan molecules, through hydrogen bonds (Klis et al., 2006).
Figure 2.6 Schematic representation of β-(1,3) and β-(1,6) linkages of a β-glucan polysaccharide.
(www.sigmaaldrich.com )
One of the characteristics that this network prints in the cell wall is the high flexibility
allowed by the helical structure of β-(1,3)-glucan molecules. Structurally, the β-(1,3)-glucan helix
may exist in the singular form, that means, be composed of only a single chain, or present a
complex of three chains (triple helix) stabilized by hydrogen bonds. Through electron
micrographs, it is estimated that the helix has a diameter between 10 nm and 30 nm, depending
on various combinations of side chains, having 0.5 nm to 1 nm in diameter each one (Lipke and
Ovalle, 1998).
Production of chitin-glucan complex by Pichia pastoris
8
On the outer side of the network β-(1,3)-glucan, arise β (1,6)-glucan chains which is
characterized by being highly branched and allow for linking to other cell wall components,
including mannoproteins (Lipke and Ovalle, 1998).
Yeast wall mannoproteins polypeptides are extensively glycosylated and their main
function is to limit cell wall permeability to solutes. In yeast, these polypeptides are composed of
50 to 200 mannose monomers, linked to a long chain molecules of β-(1,6)-glucan.
Phosphorylation of the mannosyl side chains confers a negative charge on the surface of the
yeast cell wall (Lipke and Ovalle, 1998).
With regard to solubility, there is a cell wall fraction soluble in alkaline medium,
constituted by β-(1,3)-glucans with significant number of links β(1,6) in the branches, a soluble
fraction in acidic medium, constituted by β-(1,6)-glucans, and also a fraction insoluble in acidic
and basic media, constituted by β-(1,3) glucan linked to chitin (Phaff, 2001).
2.2.2 Chitin / Chitosan
With the exception of cellulose, chitin is the most abundant polymer in nature. This
polymer is synthesized by various organisms, being a common component of exoskeletons of
invertebrates and cell wall of fungi and yeasts (Synowiecki and Al-Khateeb, 2003;
Dutta et al., 2004).
Currently, the main sources of chitin for industrial processing are shellfish, namely
crustacean. The synthesis of this polymer in annual freshwater and marine ecosystems is about
600 and 1600 million ton, respectively. The chitin content in crustaceans varies from 2 to 12%,
and this number varies between different crustacean (Synowiecki and Al-Khateeb, 2003).
Belonging to the order Decapoda, the crab and shrimp are species that have a higher content of
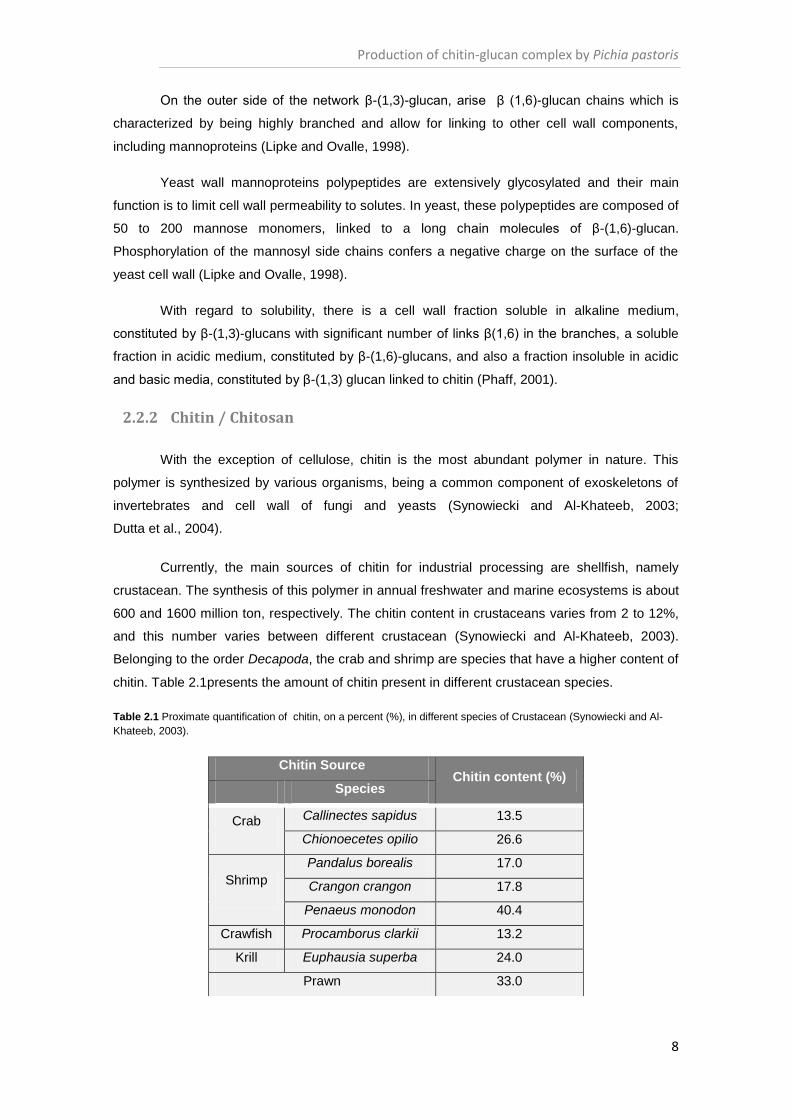
chitin. Table 2.1presents the amount of chitin present in different crustacean species.
Table 2.1 Proximate quantification of chitin, on a percent (%), in different species of Crustacean (Synowiecki and Al-
Khateeb, 2003).
Chitin Source Chitin content (%)
Species
Crab Callinectes sapidus 13.5
Chionoecetes opilio 26.6
Shrimp
Pandalus borealis 17.0
Crangon crangon 17.8
Penaeus monodon 40.4
Crawfish Procamborus clarkii 13.2
Krill Euphausia superba 24.0
Prawn 33.0
Production of chitin-glucan complex by Pichia pastoris
9
Although chitin is a product with high added-value in many application areas
(pharmaceutical and cosmetic), its use is limited when it comes from crustacean due to the
potential allergen. Other limiting factors are the seasonal nature of the producing species,
environmental pollution produced by processing of crustaceans, the variability of the
composition of the raw material and the limited supply of shell waste in some countries. These
limitations make the extraction process less economical and with low reproducibility (Synowiecki
and Al-Khateeb, 2003).
An alternative source of chitin, surpassing the limitations described above, is its
production by microbial organisms, such as fungi and yeast (Synowiecki and Al-Khateeb, 2003).
The utilization of fungi and yeasts to obtain chitin has numerous advantages over the
chitin produced from crustacean wastes. Yeasts reach high growth rates, associated with large
cell densities (which increases polymer productivity), decrease the cost of demineralization
(because the cell wall does not contain high amounts of calcium carbonate), allows for greater
control of product quality by fermentation conditions, composition and properties stable, use of
culture media of low cost, the production does not have a seasonal nature and there is the
possibility of use in biomedical applications, since it is not a product derived from animal
sources. All these advantages make the process economically feasible (Synowiecki and Al-
Khateeb, 2003).
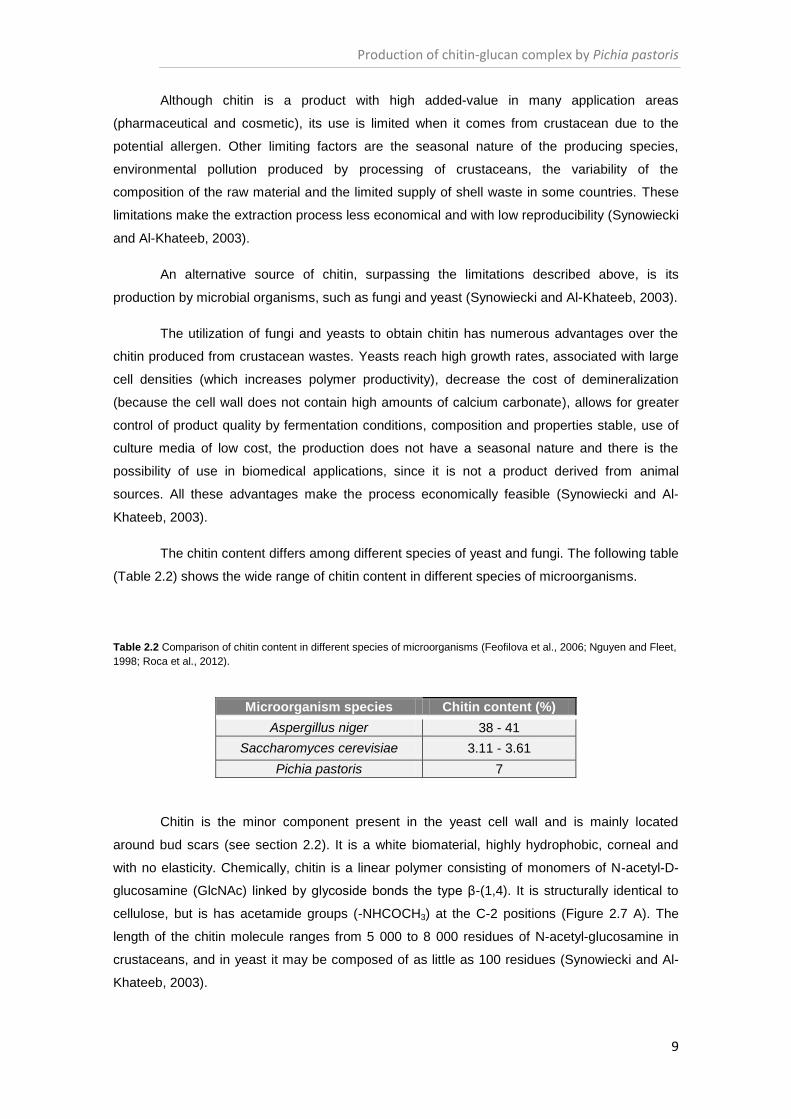
The chitin content differs among different species of yeast and fungi. The following table
(Table 2.2) shows the wide range of chitin content in different species of microorganisms.
Table 2.2 Comparison of chitin content in different species of microorganisms (Feofilova et al., 2006; Nguyen and Fleet,
1998; Roca et al., 2012).
Chitin is the minor component present in the yeast cell wall and is mainly located
around bud scars (see section 2.2). It is a white biomaterial, highly hydrophobic, corneal and
with no elasticity. Chemically, chitin is a linear polymer consisting of monomers of N-acetyl-D-
glucosamine (GlcNAc) linked by glycoside bonds the type β-(1,4). It is structurally identical to
cellulose, but is has acetamide groups (-NHCOCH3) at the C-2 positions (Figure 2.7 A). The
length of the chitin molecule ranges from 5 000 to 8 000 residues of N-acetyl-glucosamine in
crustaceans, and in yeast it may be composed of as little as 100 residues (Synowiecki and Al-
Khateeb, 2003).
Microorganism species Chitin content (%)
Aspergillus niger 38 - 41
Saccharomyces cerevisiae 3.11 - 3.61
Pichia pastoris 7
Production of chitin-glucan complex by Pichia pastoris
10
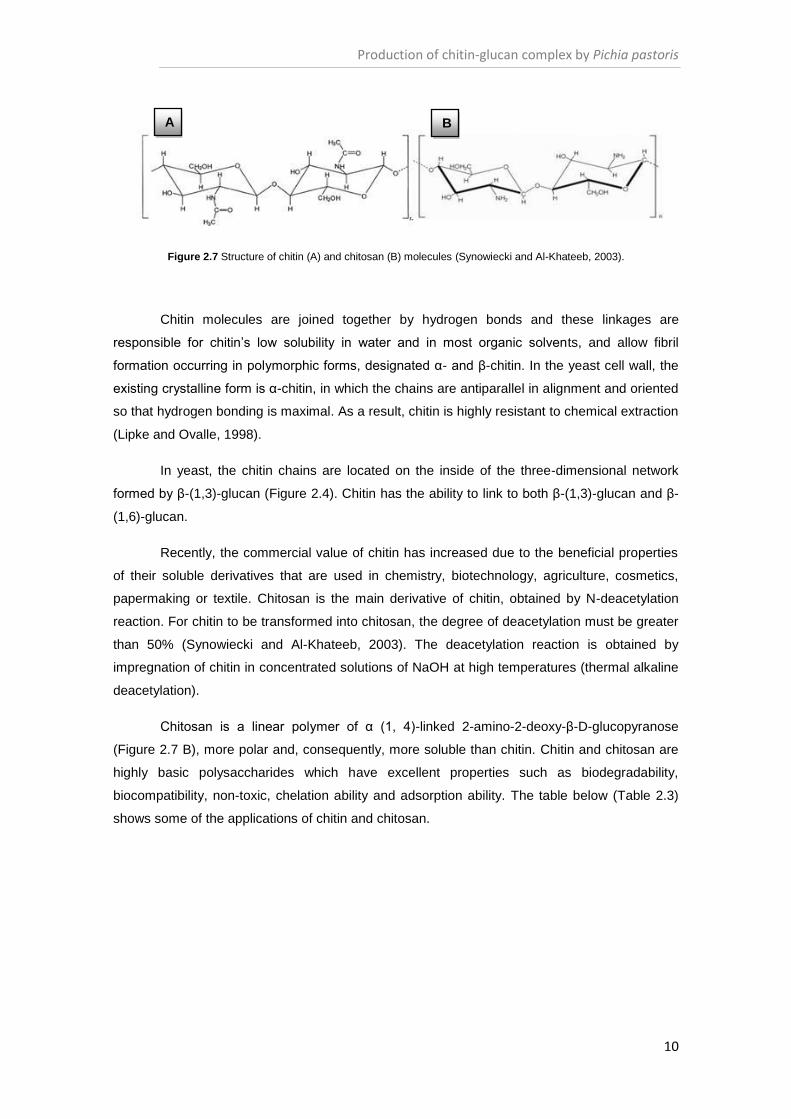
Figure 2.7 Structure of chitin (A) and chitosan (B) molecules (Synowiecki and Al-Khateeb, 2003).
Chitin molecules are joined together by hydrogen bonds and these linkages are
responsible for chitin’s low solubility in water and in most organic solvents, and allow fibril
formation occurring in polymorphic forms, designated α- and β-chitin. In the yeast cell wall, the
existing crystalline form is α-chitin, in which the chains are antiparallel in alignment and oriented
so that hydrogen bonding is maximal. As a result, chitin is highly resistant to chemical extraction
(Lipke and Ovalle, 1998).
In yeast, the chitin chains are located on the inside of the three-dimensional network
formed by β-(1,3)-glucan (Figure 2.4). Chitin has the ability to link to both β-(1,3)-glucan and β-
(1,6)-glucan.
Recently, the commercial value of chitin has increased due to the beneficial properties
of their soluble derivatives that are used in chemistry, biotechnology, agriculture, cosmetics,
papermaking or textile. Chitosan is the main derivative of chitin, obtained by N-deacetylation
reaction. For chitin to be transformed into chitosan, the degree of deacetylation must be greater
than 50% (Synowiecki and Al-Khateeb, 2003). The deacetylation reaction is obtained by
impregnation of chitin in concentrated solutions of NaOH at high temperatures (thermal alkaline
deacetylation).
Chitosan is a linear polymer of α (1, 4)-linked 2-amino-2-deoxy-β-D-glucopyranose
(Figure 2.7 B), more polar and, consequently, more soluble than chitin. Chitin and chitosan are
highly basic polysaccharides which have excellent properties such as biodegradability,
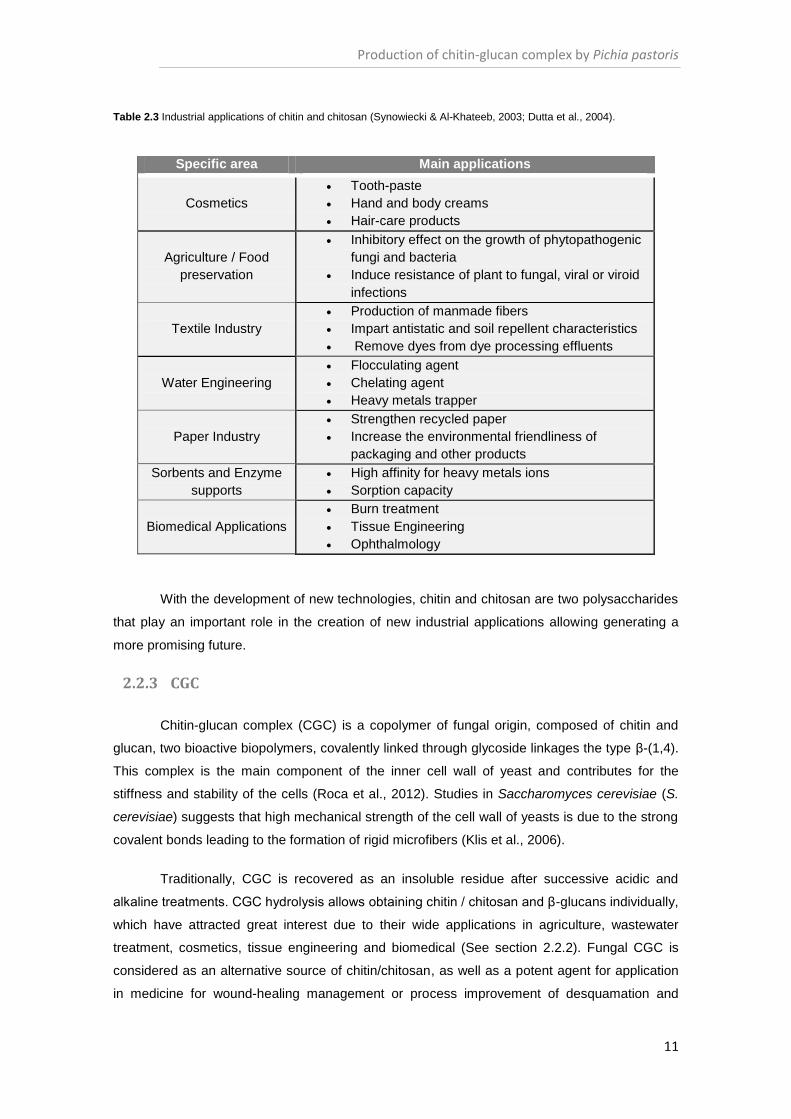
biocompatibility, non-toxic, chelation ability and adsorption ability. The table below (Table 2.3)
shows some of the applications of chitin and chitosan.
A B
Production of chitin-glucan complex by Pichia pastoris
11
Table 2.3 Industrial applications of chitin and chitosan (Synowiecki & Al-Khateeb, 2003; Dutta et al., 2004).
With the development of new technologies, chitin and chitosan are two polysaccharides
that play an important role in the creation of new industrial applications allowing generating a
more promising future.
2.2.3 CGC
Chitin-glucan complex (CGC) is a copolymer of fungal origin, composed of chitin and
glucan, two bioactive biopolymers, covalently linked through glycoside linkages the type β-(1,4).
This complex is the main component of the inner cell wall of yeast and contributes for the
stiffness and stability of the cells (Roca et al., 2012). Studies in Saccharomyces cerevisiae (S.
cerevisiae) suggests that high mechanical strength of the cell wall of yeasts is due to the strong
covalent bonds leading to the formation of rigid microfibers (Klis et al., 2006).
Traditionally, CGC is recovered as an insoluble residue after successive acidic and
alkaline treatments. CGC hydrolysis allows obtaining chitin / chitosan and β-glucans individually,
which have attracted great interest due to their wide applications in agriculture, wastewater
treatment, cosmetics, tissue engineering and biomedical (See section 2.2.2). Fungal CGC is
considered as an alternative source of chitin/chitosan, as well as a potent agent for application
in medicine for wound-healing management or process improvement of desquamation and
Specific area Main applications
Cosmetics
Tooth-paste
Hand and body creams
Hair-care products
Agriculture / Food
preservation
Inhibitory effect on the growth of phytopathogenic
fungi and bacteria
Induce resistance of plant to fungal, viral or viroid
infections
Textile Industry
Production of manmade fibers
Impart antistatic and soil repellent characteristics
Remove dyes from dye processing effluents
Water Engineering
Flocculating agent
Chelating agent
Heavy metals trapper
Paper Industry
Strengthen recycled paper
Increase the environmental friendliness of
packaging and other products
Sorbents and Enzyme
supports
High affinity for heavy metals ions
Sorption capacity
Biomedical Applications
Burn treatment
Tissue Engineering
Ophthalmology
Production of chitin-glucan complex by Pichia pastoris
12
xerosis reduction in diabetic patients, for reduction of aortic fatty streak accumulation (Smirnou
et al., 2011). Currently, chitin-glucan complex is obtained mainly from waste biomass from the
production of citric acid by Aspergillus niger (Ul-Haq et al., 2002).
CGC can be extracted from the cell wall of P. pastoris grown on glycerol from the
biodiesel industry as the sole carbon source (Roca et al., 2012). A CGC content of 16% in P.
pastoris cell wall, corresponding a ratio of 16:84 (mol%) of chitin:β-glucan were reported
(Roca et al., 2012). These results are similar to the CGC content reported for other fungi, such
as Aspergillus niger (15-25%), and yeast, such as S. cerevisiae (25%), using cane molasses
and glucose as carbon sources, respectively (Feofilova et al., 2006). The biomass concentration
obtained with P. pastoris (104 gL-1
) was much higher than for Aspergillus niger (20 gL-1
) and
similar to S. cerevisiae (120 gL-1
). The high cellular density achieved, the acceptable amount of
CGC and utilization of wastes as substrate, make P. pastoris an organism favorable for CGC
production.
2.3 Wastes / byproducts
In fermentation processes, the use of a culture medium based on low cost substrates
allows increasing the economic viability of biopolymers production. As any other biopolymer,
production of CGC has a great interest in use renewable materials. In previous studies, glycerol
from biodiesel industry was used as carbon source to produce CGC, minimizing production
costs (Roca et al., 2012). The search for new carbon sources for this bioprocess, allows making
the process more versatile, eliminating the dependence on a single substrate (pure or crude
glycerol) and may increase productivity and / or have an impact on the CGC composition.
Alternatively to the biodiesel byproduct, several wastes/byproducts can be used as
substrates for microbial growth, such as, for example, sugarcane molasses, cheese whey and
spent coffee grounds.
2.3.1 Sugarcane Molasses
Sugarcane molasses are a byproduct resulting from the processing of sugarcane
(Saccharum L.) for the production of refined sugar. Currently, Brazil is the largest producer of
sugarcane and consequently, of molasses from this plant. About 17.9 million tons of sugarcane
molasses are produced annually (In FAOSTAT 2011) that, in addition to being used for
cultivation of microorganisms, is a major feed ingredient, used as an energy source and as a
binder in compound feeds. Sugarcane molasses is a viscous, dark and sugar-rich byproduct of
sugar extraction from the sugarcane. The composition of sugarcane molasses is divergent due
to the peculiarity of sugarcane and the manufacturing conditions (Olbrich, 2006). Average
composition values are represented in Table 2.4.
Production of chitin-glucan complex by Pichia pastoris
13
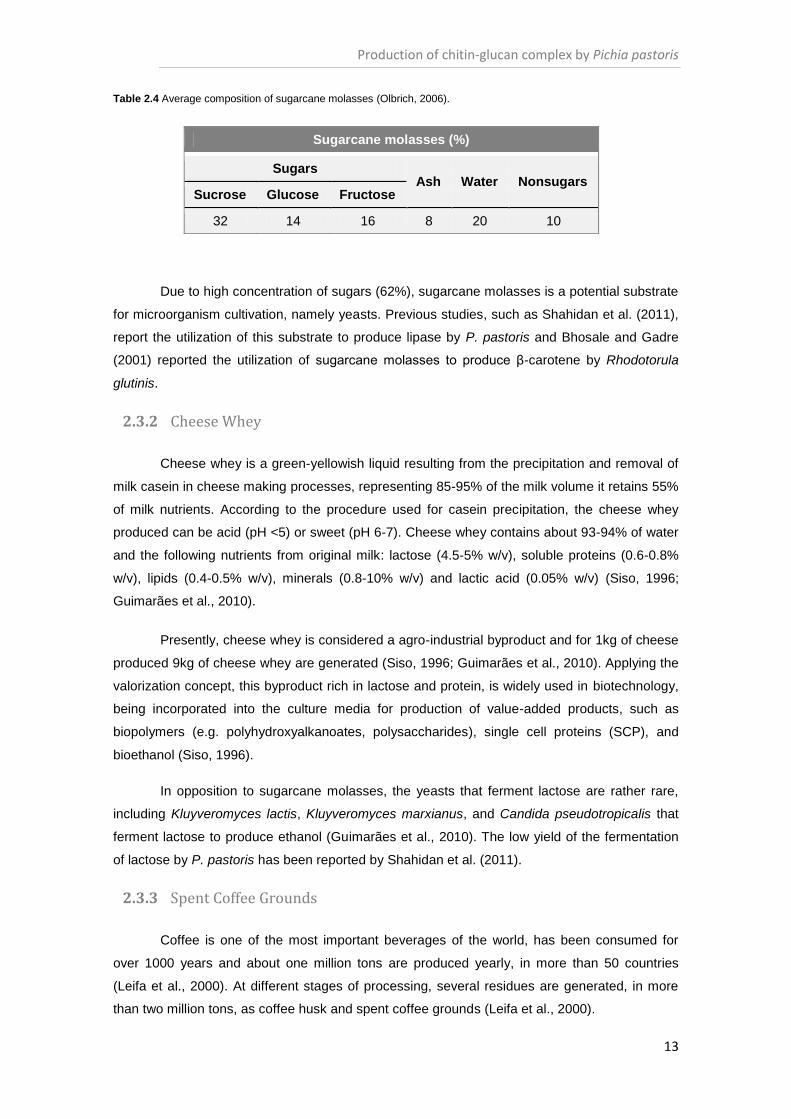
Table 2.4 Average composition of sugarcane molasses (Olbrich, 2006).
Due to high concentration of sugars (62%), sugarcane molasses is a potential substrate
for microorganism cultivation, namely yeasts. Previous studies, such as Shahidan et al. (2011),
report the utilization of this substrate to produce lipase by P. pastoris and Bhosale and Gadre
(2001) reported the utilization of sugarcane molasses to produce β-carotene by Rhodotorula
glutinis.
2.3.2 Cheese Whey
Cheese whey is a green-yellowish liquid resulting from the precipitation and removal of
milk casein in cheese making processes, representing 85-95% of the milk volume it retains 55%
of milk nutrients. According to the procedure used for casein precipitation, the cheese whey
produced can be acid (pH <5) or sweet (pH 6-7). Cheese whey contains about 93-94% of water
and the following nutrients from original milk: lactose (4.5-5% w/v), soluble proteins (0.6-0.8%
w/v), lipids (0.4-0.5% w/v), minerals (0.8-10% w/v) and lactic acid (0.05% w/v) (Siso, 1996;
Guimarães et al., 2010).
Presently, cheese whey is considered a agro-industrial byproduct and for 1kg of cheese
produced 9kg of cheese whey are generated (Siso, 1996; Guimarães et al., 2010). Applying the
valorization concept, this byproduct rich in lactose and protein, is widely used in biotechnology,
being incorporated into the culture media for production of value-added products, such as
biopolymers (e.g. polyhydroxyalkanoates, polysaccharides), single cell proteins (SCP), and
bioethanol (Siso, 1996).
In opposition to sugarcane molasses, the yeasts that ferment lactose are rather rare,
including Kluyveromyces lactis, Kluyveromyces marxianus, and Candida pseudotropicalis that
ferment lactose to produce ethanol (Guimarães et al., 2010). The low yield of the fermentation
of lactose by P. pastoris has been reported by Shahidan et al. (2011).
2.3.3 Spent Coffee Grounds
Coffee is one of the most important beverages of the world, has been consumed for
over 1000 years and about one million tons are produced yearly, in more than 50 countries
(Leifa et al., 2000). At different stages of processing, several residues are generated, in more
than two million tons, as coffee husk and spent coffee grounds (Leifa et al., 2000).
Sugarcane molasses (%)
Sugars Ash Water Nonsugars
Sucrose Glucose Fructose
32 14 16 8 20 10

Production of chitin-glucan complex by Pichia pastoris
14
Spent coffee grounds (SCG) is the main insoluble residue generated during the
production of soluble coffee by thermal water extraction from roasted coffee beans. SCG is an
acid residue, with 80-85% of humidity and constituted by fine particle size. For 1 ton of green
coffee 650 Kg of SCG was generated and about 2 Kg of wet SCG are obtained for each 1 Kg of
soluble coffee produced (Mussato et al., 2011a). The chemical composition of this residue
reveals a high sugar content, particularly mannose and galactose (Table 2.5).
Table 2.5 Chemical composition (g 100g-1) of spent coffee grounds (Mussato et al., 2011b).
Due to the toxic character conferred by caffeine, tannins and polyphenols present in
SCG, this is considered a dangerous residue to the environment. Nevertheless, SCG has some
applications in different areas, as fuel in industrial boilers of the same industry, as potential
source for biodiesel production and other value-added products, such as hydrogen and ethanol
(Mussato et al., 2011a). The high content in sugar allows integration of SCG in cultivation
medium for microorganisms, such as S. cerevisiae. The hydrolysate resulting from the acid
hydrolysis of SCG has been used in the fermentation medium by this yeast for ethanol
production, with a 50.1% efficiency (Mussato et al., 2011a).
2.3.4 Other wastes/byproducts
In last decade, wastes from the paper and pulp industries have being used as substrates
for yeast growth. The valorization of recycled paper sludge have been reported for cultivation of
yeasts such as Pichia stipitis for production of ethanol (Marques et al., 2008). The composition
of waste was determinate do be (on a dry weight basis): 34.1% cellulose, 29.3% ash, 20.4%
lignin, 7.9% xylan, 4.8% protein and 3.5% fat (Marques et al., 2008).
Other wastes with potential for use as substrates for microbial growth are wastes rich in
fatty acids. Previous studies indicate that P. pastoris mutant strains were able to grow in
medium with 0.2% oleic acid with a specific growth rate of 0.35 h-1
(Wriessnegger et al., 2009).
Liu et al. (1992) reported that wild type of P. pastoris grew poorly in medium supplemented with
0.1% of oleic acid.
This study aimed to assess the suitability of different substrates for the cultivation of the
yeast P. pastoris and production of CGC. The first part of the work consisted in investigating the
Spent Coffee Grounds hydrolysate (%)
Sugars Ash Water Nonsugars
Arabinose Glucose Mannose Galactose
1.7 8.6 21.2 13.8 1.6 36.7 15.8

Production of chitin-glucan complex by Pichia pastoris
15
ability of the culture to use glucose and xylose mixtures for growth and their impact on CGC
production. In the second part of the study, the potential of different industrial wastes and / or
byproducts as substrates for this yeast was evaluated, to finding substrates alternative to
glycerol. The utilization of alternative substrates allows increase the process versatility,
extinguishing dependence on a single substrate, and decrease the production cost, since the
price of glycerol (even from biodiesel industry) can vary widely and also lead to a variation of
cost of CGC production.

Production of chitin-glucan complex by Pichia pastoris
16
Production of chitin-glucan complex by Pichia pastoris
17
3. Materials and methods
3.1 Yeast strain and growth media
All experiments were performed with Pichia pastoris strain DSM 70877. The culture was
cultivated in standard basal salts medium (BSM) (Pichia Fermentation Process Guidelines,
Invitrogen), with the following composition: H3PO4 85%, 26.70 mL L-1
; CaSO4, 0.93 gL-1
; K2SO4,
18.20 gL-1
; MgSO4.7H2O, 14.90 gL-1
; KOH, 4.13 gL-1
and 4.35 mL L-1
of a trace elements
solution (PTM) comprising: CuSO4.5H2O, 6 gL-1
; NaI, 0.08 gL-1
; MnSO4.H2O, 3 gL-1
;
Na2MoO4.2H2O, 0.2 gL-1
; H3BO3, 0.02 gL-1
; CoCl2.6H2O, 0.5 gL-1
; ZnCl2, 20 gL-1
; Fe2SO4.7H2O,
65 gL-1
; biotin, 0.2 gL-1
and H2SO4, 5.0 mL L-1
. The BSM medium was sterilized at 121 ºC for 20
minutes and the PTM solution was filter-sterilized (0.2 μm, Sartorius stedim Minisart). The PTM
solution was added after cooling. The pH was adjusted to 5.0 with a 25% (v/v) ammonium
hydroxide solution (Scharlau).
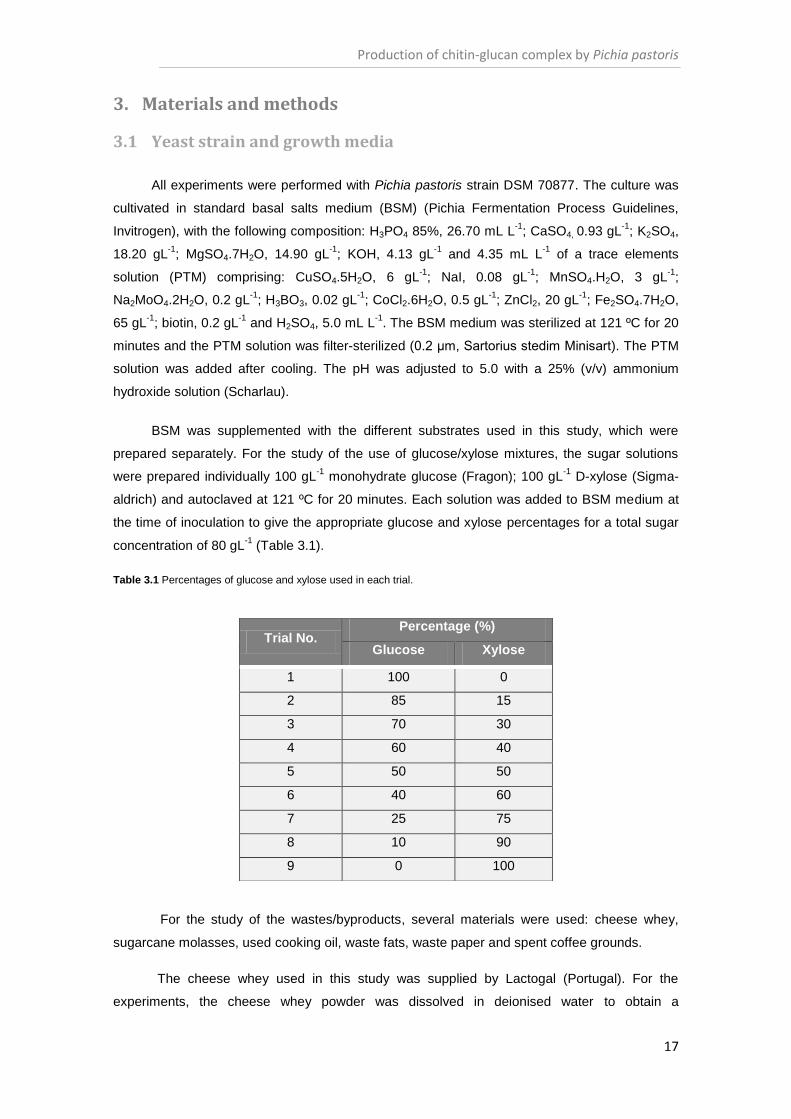
BSM was supplemented with the different substrates used in this study, which were
prepared separately. For the study of the use of glucose/xylose mixtures, the sugar solutions
were prepared individually 100 gL-1
monohydrate glucose (Fragon); 100 gL-1
D-xylose (Sigma-
aldrich) and autoclaved at 121 ºC for 20 minutes. Each solution was added to BSM medium at
the time of inoculation to give the appropriate glucose and xylose percentages for a total sugar
concentration of 80 gL-1
(Table 3.1).
Table 3.1 Percentages of glucose and xylose used in each trial.
For the study of the wastes/byproducts, several materials were used: cheese whey,
sugarcane molasses, used cooking oil, waste fats, waste paper and spent coffee grounds.
The cheese whey used in this study was supplied by Lactogal (Portugal). For the
experiments, the cheese whey powder was dissolved in deionised water to obtain a
Trial No. Percentage (%)
Glucose Xylose
1 100 0
2 85 15
3 70 30
4 60 40
5 50 50
6 40 60
7 25 75
8 10 90
9 0 100

Production of chitin-glucan complex by Pichia pastoris
18
concentration of 40 gL-1
. The solution was autoclaved at 121 ºC for 20 minutes and centrifuged
(17 418 g for 15 minutes) to remove precipitated protein aggregates.
The sugarcane molasses used in this study was supplied by RAR – Refinarias de
Açúcar Reunidas. The sugarcane molasses were diluted in deionised water to obtain a
pretended concentration and the solution was sterilized at 121 ºC for 20 minutes.
The used cooking oil for this study came from the snack bar of the Chemistry
Department, at FCT-UNL. For the experiments, the used cooking oil was sterilized by
autoclaving (121 ºC for 20 minutes).
The waste fat used in this study was supplied by FIMA – Produtos Alimentares, SA
(Grupo Unilever, Jerónimo Martins). The solid waste fat sample was sterilized by autoclaving
(121 ºC for 20 minutes) and stored at room temperature until used in the tests. Prior to its use in
the experiments, the solid waste fat was melted at 70 ºC, for 20 minutes and added to the
cultivation media while still hot (~50 ºC).
The paper and spent coffee grounds were both subjected to acid hydrolysis prior to their
use in the experiments. The waste paper used in this study was a mixture of magazines and
used office paper. Spent coffee grounds were supplied by the snack bar of the Chemistry
Department, at FCT-UNL. Before hydrolysis, the waste paper was ground into a powder to
increase the efficiency of the process, while the spent coffee grounds were subjected to drying
(70 ºC for 3 hours). To prepare the solutions for hydrolysis, 10 g of spent coffee grounds were
mixed with 100 mL of deionised water and 4 g of powdered paper were mixed with 200 mL of
deionised water. Two acid hydrolysis procedures were performed with different acids, namely,
orto-phosphoric acid 85% (H3PO4) and sulfuric acid 98% (H2SO4), at different concentrations
(26.7 mL L-1
and 100 mL L-1
). To select the best hydrolysis conditions, hydrolysis at different
temperatures and reaction time were performed (Table 3.2).
Table 3.2 Conditions of acid hydrolysis of spent coffee grounds.
After cooling to room temperature, the hydrolysates were centrifuged (9820 g, for 30
minutes) and two fractions were obtained: a solid residue and a sugar solution. The solid
residues were discarded and the sugar solutions were used for the experiments. Before their
use, the pH of the hydrolysates was adjusted to 5.0 by the addition of a 25% (v/v) ammonium
hydroxide solution. Table 3.3 summarizes the substrates and treatments applied to each one.
1 Autoclaving at 121 ºC and 1 bar.
Trial No. 1 2 3 4 5 6 7 8 9 10 11 12 13 14 15
Temperature (ºC) 30 60 90 100 121 1
Time (min) 20 45 60 20 45 60 20 45 60 20 45 60 20 45 60

Production of chitin-glucan complex by Pichia pastoris
19
Table 3.3 Initial substrates screening and their treatment applied.
3.2 Inocula preparation
Pre-inocula for the experiments were prepared in 100 mL shake flasks by inoculating
1 mL of the cryopreserved culture (stored at -80 ºC) in 40 mL of BSM medium, containing
glycerol (40 gL-1
). The pre-inocula were incubated for 72 hours at 30 ºC and 200 rpm, in an
orbital shaker (IKA KS 260 basic).
Inocula for the experiments were prepared by inoculating 10% (v/v) of pre-inoculum in
BSM medium, supplemented with the appropriate substrate, in 500 mL shake flasks, and
incubating for 72 hours at 30 ºC, in an orbital shaker (200 rpm).
The inoculums prepared for all experiments, were performed with glycerol as substrate
obtaining high cell density and the same cell concentration at the beginning of all trials.
3.3 Shake Flask Screening
The experiments were performed in 500 mL shake flasks with 150 mL of BSM medium,
supplemented with the appropriate substrate. The medium was inoculated with 10% (v/v) of
inoculums, prepared as described above, and growth occurred at 30 ºC and 200 rpm.
The assays were run for 50-175 hours, depending on the substrate tested, and 3 mL
samples were periodically taken for measurement of the optical density at 600nm (OD600nm) and
pH, and determination of biomass and substrate concentrations. At the end of the experiments,
20 mL samples were also collected for CGC quantification and polymer composition analysis.
Substrate Treatment
Cheese whey Sterilization by autoclaving of an
aqueous solution and centrifugation
Sugarcane
molasses
Dilution in deionised water and
sterilization by autoclaving
Used cooking oil Sterilization by autoclaving
Waste fat Sterilization by autoclaving
Waste paper Acid hydrolysis
Spent coffee
grounds Acid hydrolysis

Production of chitin-glucan complex by Pichia pastoris
20
3.4 Batch bioreactor experiments
Experiments were carried out in BioStat® B-plus bioreactors (Sartorius) with 2 L and 3 L
of working volumes. The bioreactors, containing BSM medium, were inoculated with 10% (v/v)
of inoculums, prepared as described above, and operated with controlled temperature
(30±0.1 ºC) and pH (5.0±0.02), for all runs. pH was controlled by the automatic addition of 25%
(v/v) ammonium hydroxide and HCl 2M solutions. The ammonium hydroxide solution also
served as the nitrogen source. The dissolved oxygen concentration (DOC, pO2) was controlled
at 50% air saturation by the automatic variation of the stirring rate, from 300 to 2000 rpm, while
the airflow rate was kept constant during all experiments (1 vvm). When the stirring rate reached
its maximum value (2000 rpm), the DOC was controlled by the automatic supplementation of
the air stream with pure oxygen (> 99.995%). During the assay, foam formation was suppressed
by the automatic addition of Antifoam A (Sigma-aldrich). All experiments were performed in a
batch mode. 25 mL samples were periodically taken for biomass, substrate and CGC
quantification.
3.5 Analytical techniques
3.5.1 Cell growth
Cell growth was monitored during the experiments by measurement of the optical
density at 600 nm (OD600nm) in UV-Vis spectrophotometer (Thermo Spectronic, Heλios α) and
pH (Crison, Basic 20). Broth samples were diluted with deionised water so that the measured
OD600nm value was below 0.3. The measurements were done in duplicate.
3.5.2 Biomass quantification
Cell dry weight (CDW), defined as the dry weight of cells per litre of fermentation broth,
was determined gravimetrically. 20 mL broth samples were centrifuged at 17 418 g for 15
minutes at +4 ºC. The cell-free supernatant was stored at -20 ºC for substrate quantification.
The cell pellet was washed twice with deionised water (re-suspension in water and
centrifugation at 17 418 g, for 15 minutes at +4 ºC). After washing, the pellets were frozen in
liquid nitrogen and lyophilized (Telstar, Cryodos) for 48 hours at -40 ºC and bellow 0.3 mbar.
The CDW was determined as the weight of the lyophilized cell pellets. This analysis was done
in quadruplicate.
3.5.3 Substrate concentration
For quantification of sugars, cell-free supernatant samples collected during the
experiments were diluted. After dilution, the samples were filtered with 0.20 μm centrifuge filters
(9 600 g for 5 minutes; VWR) prior to the analysis.

Production of chitin-glucan complex by Pichia pastoris
21
The concentration of glucose and xylose was determined by high performance liquid
chromatography (HPLC), using an ion exchange column (Metacarb 87H; 300 mm x 7.8 mm,
9 mm; Varian) coupled to a refractive index detector (RI-71, Merck). The mobile phase was
0.001 M H2SO4 solution at a flow rate of 0.5 mL min-1
and the column was operated at 30 ºC.
For this method, samples were dilutes with 0.001 M H2SO4 solution. Standard solutions of
glucose (Fragon) and xylose (Sigma-aldrich, 99%) with 0.156 – 5 gL-1
were used to generate
the calibration curves (Appendix).
The sugar monomers composition of the wastes/byproducts substrates (Lactose,
galactose, glucose, fructose, sucrose, mannose and arabinose) were determined by HPLC
using a CarboPac PA10 column (Dionex), equipped with an amperometric detector. The
analysis was performed with sodium hydroxide (NaOH 18 mM) as eluent, at a flow rate of
0.8 mL min-1
and carried out at 30 ºC. For this method, samples were dilutes with deionised
water. Lactose, galactose, glucose, fructose, sucrose, mannose and arabinose (Sigma-aldrich)
with 0.006 - 0.2 gL-1
, were used as standards.
For the concentration of the total sugars in the waste paper and spent coffee grounds
hydrolysate and sugarcane molasses samples, Dubois method was used. Dubois is a
colorimetric method where 2.5 mL of H2SO4 was added to the 0.5 mL of 5% (v/v) phenol
solution and 0.5 mL of sample. The solution was conserved in dark place for 30 minutes and its
optical density was measured at 490 nm. In this method, glucose solutions with concentrations
of 0.003 - 0.1 gL-1
were used as standards. The calibration curves are given in Appendix.
3.5.4 CGC Extraction
For extraction of CGC from the yeast biomass, 100-300 mg of the lyophilized cells were
treated with 30 mL NaOH 5M at 65 ºC, for 2 hours, under constant stirring (800 rpm), for
solubilisation of cell wall components. The alkali-insoluble material (containing the CGC)
obtained by centrifugation of the mixture (17 418 g, for 15 min) was re-suspended in deionised
water (30 mL) and neutralised with HCl 6M. After centrifugation (17 418 g, for 15 min), the
polymer was washed twice with deionised water to remove alkali soluble components and,
finally, it was freeze dried for the gravimetric quantification of the polymer content in the
biomass.
3.5.5 CGC composition
The determination of CGC sugar composition was performed by acid hydrolysis, using
trifluoroacetic acid (TFA) and hydrochloric acid (HCl) to hydrolyse the glucan and the chitin
fractions of the polymer, respectively. To increase the hydrolysis efficiency, both hydrolysis were
performed with a constant stirring (800 rpm), keeping the solution homogenous. To quantify the
glucan content in the polymer, about 5 mg of lyophilized polymer samples were re-suspended in
5 mL of deionised water and 100 μL TFA 99% was added. The hydrolysis was performed at

Production of chitin-glucan complex by Pichia pastoris
22
120 ºC for 2 hours. For the HCl hydrolysis, about 5 mg of dry polymer samples were re-
suspended in 5 mL of HCl 12M and hydrolysis was performed at 120 ºC for 5 hours. After HCl
hydrolysis, 1 mL of the hydrolysates was evaporated to dryness and re-suspended in 1 mL of
deionised water.
Both hydrolysates were used for the quantification of the constituent monosaccharides
by HPLC using a CarboPac PA10 column (Dionex), as described in section 3.5.3. Glucose,
mannose and glucosamine with 0.006 - 0.2 gL-1
(Sigma-aldrich) were used as standards, being
subjected to the same hydrolysis procedures as the polymer samples. The calibration curves
are given in Appendix.
3.5.6 Kinetic parameters
The specific cell growth rate (µmax, h-1
) was determined using the follow equation:
ln (x/x0) = µ t (1)
where x0 (gL-1
) is the CDW at the beginning of the assay and x (gL-1
) is the CDW at time t (h).
The CGC volumetric productivity (rp, gL-1
h-1
) was determined as follows:
rp = Δp / Δt (2)
Δp = CDW × %CGC (3)
where Δp corresponds to the product, CGC (gL-1
), produced at time t (h), and Δt is the time
interval between the beginning of the assay and time t (h).
The biomass yield (YX/S, gCDW gsubstrate-1
) was determined using the follow equation:
YX/S = dX / dS (4)
where dX (gL-1
) is the CDW at time and dS (gL-1
) is the substrate consumed at time t (h).
The product yield (YP/S, gCGC gsubstrate-1
) was determined as follows:
YP/S = dP / dS (5)
where dP (gL-1
) is the product at the time and dS (gL-1
) is the substrate consumed at time t (h).

Production of chitin-glucan complex by Pichia pastoris
23
4. Results and Discussion
4.1 Use of glucose and xylose mixtures for cultivation of Pichia
pastoris and chitin-glucan complex production
Glucose and xylose are two of the main sugar components present in lignocellulosic
wastes (e.g. corn stover, wheat straw, winter rye), in varying proportions. The content in each of
those sugars depends on the type of material, but, in most of cases, glucose is present in higher
amounts than xylose. For example, corn stover, an abundant agricultural byproduct, which
consists on the stalk, cob and leaves, is constituted mostly by glucose (39.0% (w/w)) and xylose
(14.8% (w/w)) (Aristidou and Penttilä, 2000). Similar glucose/xylose contents are found in wheat
straw: 36.6% (w/w)% glucose and 19.2% (w/w)) xylose (Aristidou and Penttilä, 2000; Kootstra et
al., 2009). Winter rye has higher glucan and xylan contents, reaching 40.8% (w/w) and
22.3% (w/w), respectively (Petersson et al., 2007). More rarely, the xylose content can be
higher than that of glucose, as is the case of: corn cobs, with 68.2% (w/w) of xylose and
8.4% (w/w) of glucose (Kim et al., 1999) and birch wood, with 55.4% (w/w) of xylose and 7.8%
(w/w) of glucose (Morris, 1992). The aim of this study was to assess the ability of P. pastoris for
utilization of mixtures of those sugars, xylose and glucose, as carbon sources and, hence,
evaluate the suitability of lignocellulosic materials rich in glucose and/or xylose for production of
CGC. Commercial glucose and xylose were chosen for this study as model substrates,
considering that the results could be extrapolated for lignocellulosic materials.
4.1.1 Shake flask screening
In order to determine the most appropriate glucose and xylose mixtures for P. pastoris
cultivation, a preliminary shake flask screening was performed, wherein different percentages of
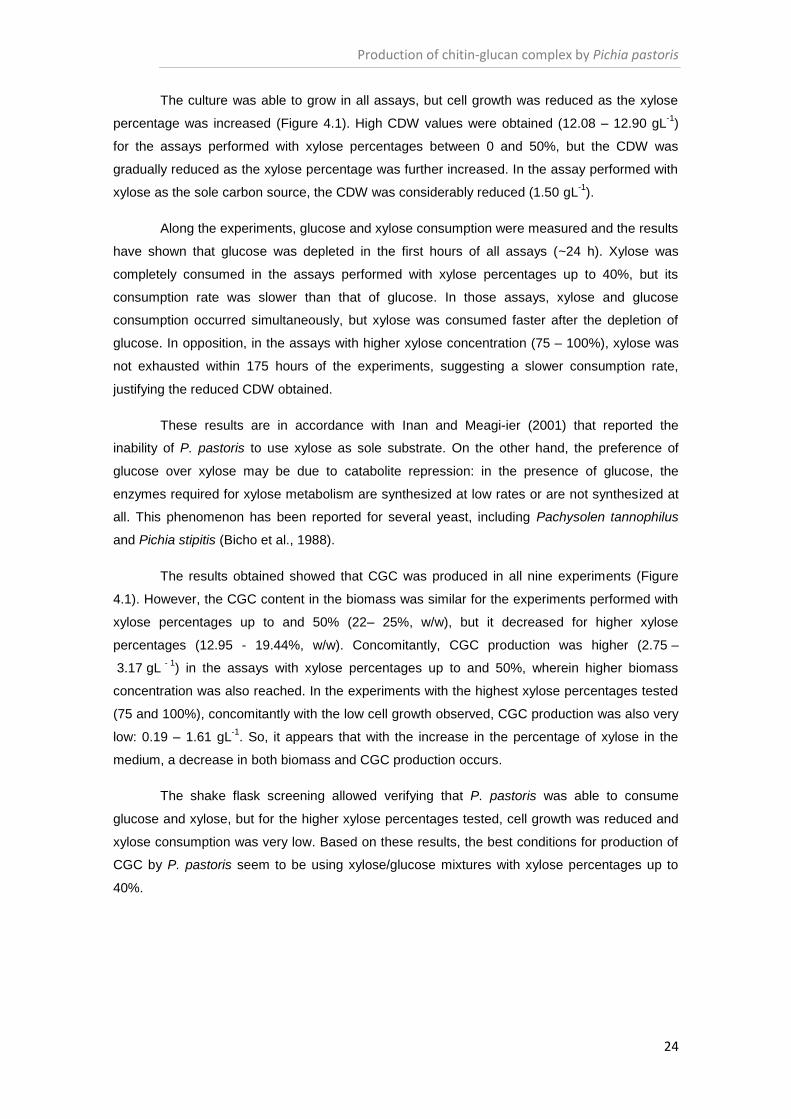
xylose were tested (Table 3.1). Figure 4.1 shows the results obtained in each assay in terms of
CDW and CGC production.
Figure 4.1 CDW and CGC obtained by cultivation of P. pastoris in the shake flask assays with different glucose/xylose
mixtures.
CGC
CDW
0,0
5,0
10,0
15,0
0 15 30
40 50
60 75
90 100
CG
C (
gL
-1)
or
CD
W (
gL
-1)
Xyl (%)
Production of chitin-glucan complex by Pichia pastoris
24
The culture was able to grow in all assays, but cell growth was reduced as the xylose
percentage was increased (Figure 4.1). High CDW values were obtained (12.08 – 12.90 gL-1
)
for the assays performed with xylose percentages between 0 and 50%, but the CDW was
gradually reduced as the xylose percentage was further increased. In the assay performed with
xylose as the sole carbon source, the CDW was considerably reduced (1.50 gL-1
).
Along the experiments, glucose and xylose consumption were measured and the results
have shown that glucose was depleted in the first hours of all assays (~24 h). Xylose was
completely consumed in the assays performed with xylose percentages up to 40%, but its
consumption rate was slower than that of glucose. In those assays, xylose and glucose
consumption occurred simultaneously, but xylose was consumed faster after the depletion of
glucose. In opposition, in the assays with higher xylose concentration (75 – 100%), xylose was
not exhausted within 175 hours of the experiments, suggesting a slower consumption rate,
justifying the reduced CDW obtained.
These results are in accordance with Inan and Meagi-ier (2001) that reported the
inability of P. pastoris to use xylose as sole substrate. On the other hand, the preference of
glucose over xylose may be due to catabolite repression: in the presence of glucose, the
enzymes required for xylose metabolism are synthesized at low rates or are not synthesized at
all. This phenomenon has been reported for several yeast, including Pachysolen tannophilus
and Pichia stipitis (Bicho et al., 1988).
The results obtained showed that CGC was produced in all nine experiments (Figure
4.1). However, the CGC content in the biomass was similar for the experiments performed with
xylose percentages up to and 50% (22– 25%, w/w), but it decreased for higher xylose
percentages (12.95 - 19.44%, w/w). Concomitantly, CGC production was higher (2.75 –
3.17 gL - 1
) in the assays with xylose percentages up to and 50%, wherein higher biomass
concentration was also reached. In the experiments with the highest xylose percentages tested
(75 and 100%), concomitantly with the low cell growth observed, CGC production was also very
low: 0.19 – 1.61 gL-1
. So, it appears that with the increase in the percentage of xylose in the
medium, a decrease in both biomass and CGC production occurs.
The shake flask screening allowed verifying that P. pastoris was able to consume
glucose and xylose, but for the higher xylose percentages tested, cell growth was reduced and
xylose consumption was very low. Based on these results, the best conditions for production of
CGC by P. pastoris seem to be using xylose/glucose mixtures with xylose percentages up to
40%.

Production of chitin-glucan complex by Pichia pastoris
25
4.1.2 Batch bioreactor experiments
Glucose/xylose mixtures with different xylose percentages (0, 12.5, 25 and 50%) were
selected to perform batch bioreactor experiments due to the high cell growth and CGC
production observed within that range in the preliminary shake flask assays. A xylose
percentage of 75% was also tested to evaluate in the bioreactor a higher percentage of xylose
that can be present in several lignocelullosic wastes (e. g., corn cob (Kim et al., 1999), birch
wood (Morris, 1992) and oat hulls (Garleb et al., 1991)). Hence, these experiments aimed to
evaluate the ability of the culture to grow and produce CGC in a large range of xylose
concentrations.
4.1.2.1 CGC production
The first experiment (0%Xyl) was performed (Figure 4.2 A) using glucose as the sole
substrate. In this trial, after a lag phase of 15 hours, P. pastoris grew at a specific cell growth
rate of 0.20 h-1
and reached a final CDW of 33.90 gL-1
within 37 hours of cultivation (Table 4.1).
As expected, after 20 hours, the growth stabilized when the carbon source was depleted. Along
the experiment, the culture consumed all the initial glucose (74.75 gL-1
), with a consumption rate
of 8.59 gL-1
.h-1
(Table 4.1). The CGC concentration reached the highest value (5.57 gL-1
) in the
stationary phase. This value represents a 16.44 % content of CGC in the biomass.
The specific cell growth rate achieved in this experiment was slightly higher than the
value obtained with glycerol as sole carbon source (0.17 h-1
) by Chagas et al. (2013). Despite
this difference, the CGC content in the biomass was similarly in both assays with either carbon
source (16%). These results suggest that P. pastoris grew faster with glucose than with glycerol
but this fact did not significantly affect the CGC content.
The overall volumetric productivity of the assay (0.149 gL-1
.h-1
) was within the range of
values obtained with glycerol as sole carbon source (0.105 – 0.168 gCGC L-1
.h-1
) reported by
Chagas et al. (2013).
The culture reached a growth yield of 0.45 gbiomass gglucose-1
demonstrating the high
conversion of glucose into biomass. This value was slightly lower than that obtained from crude
glycerol (0.55 gbiomass gglycerol-1
) in Roca et al. (2012), indicating that glycerol was more efficiently
converted into biomass. Similarly, the product yield (0.08 gCGC gglucose-1
) was also lower than that
obtained for crude glycerol (0.15 gCGC gglycerol-1
) (Roca et al., 2012).
The results obtained in this experiment were lower than the results obtained by Heyland
et al. (2010), where P. pastoris SMD1168H grew on glucose at a specific grow rate of 0.28 h-1
,
reaching a final CDW of 68 gL-1
, in a batch bioreactor experiment, for recombinant protein
production. The biomass yield achieved (0.55 gbiomass gglucose-1
) was also higher than that
reached in the 0%Xyl experiment (Table 4.1).

Production of chitin-glucan complex by Pichia pastoris
26
Figure 4.2 Cultivation profiles of the batch bioreactor experiments: 0%Xyl (A), 12.5%Xyl (B) and 25%Xyl (C).
Dry cell weight ( , gL-1), glucose ( , gL
-1), xylose ( , gL
-1) and CGC concentrations ( , gL
-1).
0,0
1,0
2,0
3,0
4,0
5,0
6,0
7,0
0
10
20
30
40
50
60
70
80
0 12 24 36 48 60
CG
C
CD
W o
r G
luc
os
e
Time (h)
0,0
1,0
2,0
3,0
4,0
5,0
6,0
7,0
0
10
20
30
40
50
60
70
80
0 12 24 36 48 60 C
GC
CD
W, g
luc
os
e o
r x
ylo
se
Time (h)
0,0
1,0
2,0
3,0
4,0
5,0
6,0
7,0
0
10
20
30
40
50
60
70
80
0 12 24 36 48 60
CG
C
CD
W, g
luc
os
e o
r x
ylo
se
Time (h)
A
B
C

Production of chitin-glucan complex by Pichia pastoris
27
The addition of xylose to the medium, at percentages of 12.5% (Figure 4.2 B) and 25%
(Figure 4.2 C) led to the decrease of the maximum specific growth rate to 0.17 h-1
and 0.14 h-1
,
respectively, comparing to the 0%Xyl experiment (Table 4.1). This decrease may suggest that
the presence of xylose affected the cellular division of the culture, causing an attenuation of
exponential phase, leading to a specific growth rate reduction. These results are in agreement
with studies for Pichia stipitis (Agbogbo et al., 2006), in which a maximum specific growth rate of
0.10 h-1
was obtained for cultivation in glucose, while the addition of xylose (25%Xyl) led to a
reduction of the maximum specific growth rate to 0.075 h-1
.
Nevertheless, similar maximum CDW were obtained in all three assays, 0%Xyl,
12.5%Xyl and 25%Xyl (27.80 - 35.25 gL-1
), as well as similar CGC content in the biomass
(15.47 – 19.13%) and CGC production (5.32 – 5.57 gL-1
) (Table 4.1). In opposition, the addition
of xylose negatively affected the overall volumetric productivity, reducing the values to 0.099
and 0.085 gL-1
h-1
for assays with 12.5% and 25% of xylose, respectively, comparing to the
0%Xyl (Table 4.1).
In all three experiments (0, 12.5 and 25% of xylose), glucose was completely consumed
during the first 23 hours (Figure 4.2). Although the xylose consumption rate in the presence of
glucose was much lower, Figure 4.2 shows that it was initiated before glucose was depleted,
indicating that P. pastoris was able to simultaneously metabolize both sugars. Similar results
were reported for P. stipitis, with glucose being the preferred substrate when glucose/xylose
mixtures were used as substrates. This is due to repression of xylose uptake by glucose (Bicho
et al., 1988). However, for P. stipitis, xylose fermentation started only after glucose depletion.
As Figure 4.2 shows, the CDW obtained during the consumption of glucose was higher
than that achieved with xylose, after glucose depletion. After glucose depletion, cell growth was
considerably reduced, indicating that the observed xylose consumption was probably for cell
maintenance or production of secondary metabolites.
As for CDW values, the biomass (0.36 - 0.45 g g-1
) and production yields (0.07 g g-1
)
obtained for experiments 12.5%Xyl and 25%Xyl were similar to the values obtained for 0%Xyl
(0.45 g g-1
and 0.08 g g-1
, respectively) (Table 4.1). These results show that it is possible to use
glucose/xylose mixtures with xylose percentages up to 25% with no significant impact on cell
growth or CGC production.
In order to determine the culture’s ability to grow in medium with higher concentrations
of xylose, experiments with 50 and 75% xylose were performed (Figure 4.3). The results show
that specific cell growth rate was not significantly affected by increasing xylose percentage in
the medium. The specific cell growth was similar for all assays performed with xylose
percentages between 12.5 and 75% (Table 4.1), which is probably related to the fact that the
initial cell growth during the exponential phase was due to the available glucose.
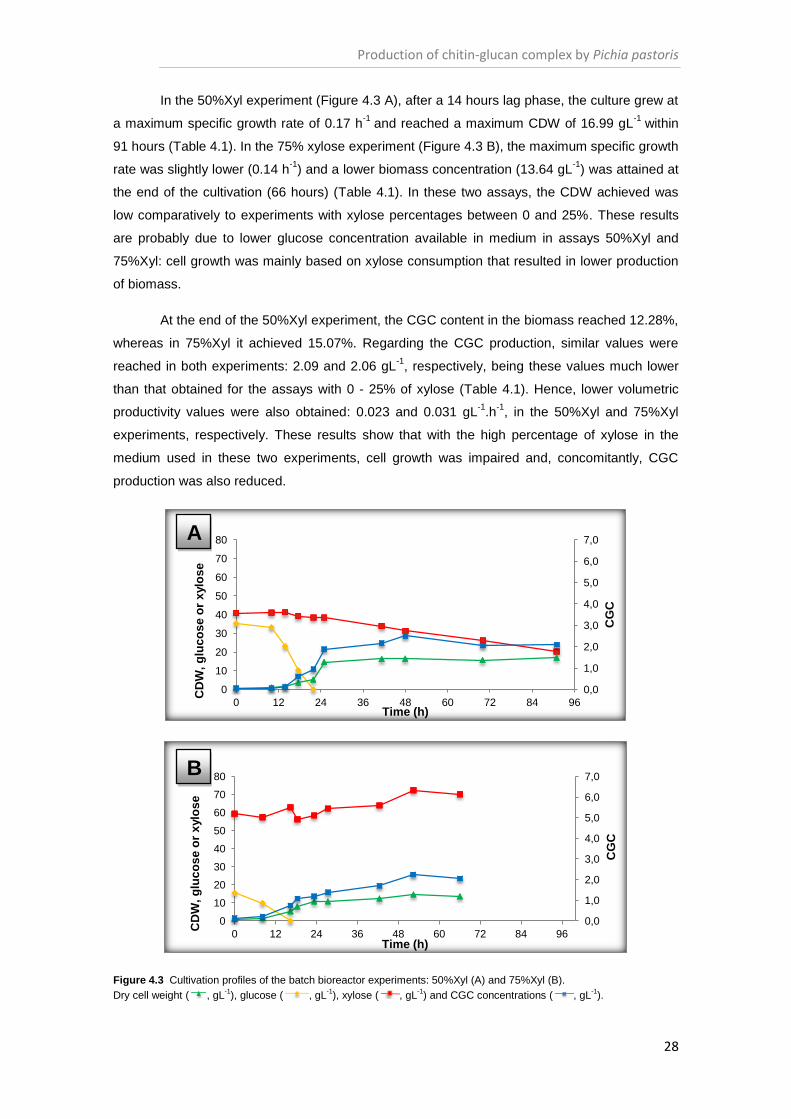
Production of chitin-glucan complex by Pichia pastoris
28
In the 50%Xyl experiment (Figure 4.3 A), after a 14 hours lag phase, the culture grew at
a maximum specific growth rate of 0.17 h-1
and reached a maximum CDW of 16.99 gL-1
within
91 hours (Table 4.1). In the 75% xylose experiment (Figure 4.3 B), the maximum specific growth
rate was slightly lower (0.14 h-1
) and a lower biomass concentration (13.64 gL-1
) was attained at
the end of the cultivation (66 hours) (Table 4.1). In these two assays, the CDW achieved was
low comparatively to experiments with xylose percentages between 0 and 25%. These results
are probably due to lower glucose concentration available in medium in assays 50%Xyl and
75%Xyl: cell growth was mainly based on xylose consumption that resulted in lower production
of biomass.
At the end of the 50%Xyl experiment, the CGC content in the biomass reached 12.28%,
whereas in 75%Xyl it achieved 15.07%. Regarding the CGC production, similar values were
reached in both experiments: 2.09 and 2.06 gL-1
, respectively, being these values much lower
than that obtained for the assays with 0 - 25% of xylose (Table 4.1). Hence, lower volumetric
productivity values were also obtained: 0.023 and 0.031 gL-1
.h-1
, in the 50%Xyl and 75%Xyl
experiments, respectively. These results show that with the high percentage of xylose in the
medium used in these two experiments, cell growth was impaired and, concomitantly, CGC
production was also reduced.
Figure 4.3 Cultivation profiles of the batch bioreactor experiments: 50%Xyl (A) and 75%Xyl (B).
Dry cell weight ( , gL-1), glucose ( , gL
-1), xylose ( , gL
-1) and CGC concentrations ( , gL
-1).
0,0
1,0
2,0
3,0
4,0
5,0
6,0
7,0
0
10
20
30
40
50
60
70
80
0 12 24 36 48 60 72 84 96
CG
C
CD
W, g
luc
os
e o
r x
ylo
se
Time (h)
0,0
1,0
2,0
3,0
4,0
5,0
6,0
7,0
0
10
20
30
40
50
60
70
80
0 12 24 36 48 60 72 84 96
CG
C
CD
W, g
luc
os
e o
r x
ylo
se
Time (h)
A
B
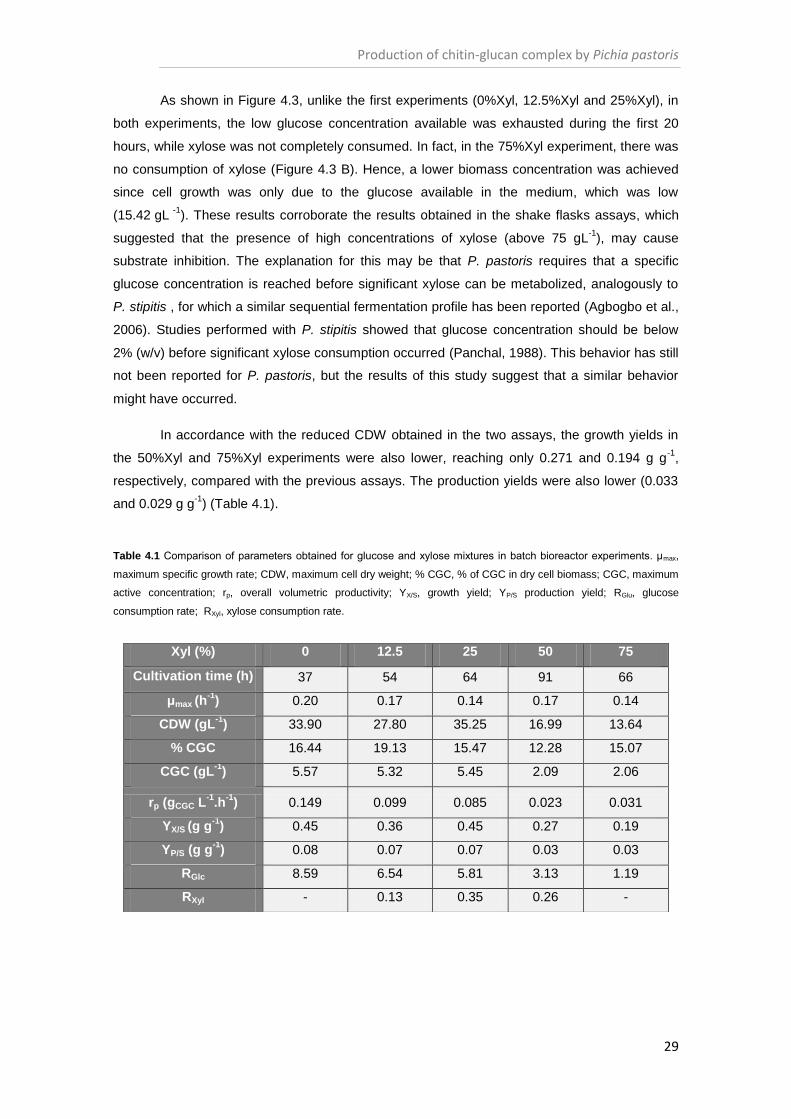
Production of chitin-glucan complex by Pichia pastoris
29
As shown in Figure 4.3, unlike the first experiments (0%Xyl, 12.5%Xyl and 25%Xyl), in
both experiments, the low glucose concentration available was exhausted during the first 20
hours, while xylose was not completely consumed. In fact, in the 75%Xyl experiment, there was
no consumption of xylose (Figure 4.3 B). Hence, a lower biomass concentration was achieved
since cell growth was only due to the glucose available in the medium, which was low
(15.42 gL -1
). These results corroborate the results obtained in the shake flasks assays, which
suggested that the presence of high concentrations of xylose (above 75 gL-1
), may cause
substrate inhibition. The explanation for this may be that P. pastoris requires that a specific
glucose concentration is reached before significant xylose can be metabolized, analogously to
P. stipitis , for which a similar sequential fermentation profile has been reported (Agbogbo et al.,
2006). Studies performed with P. stipitis showed that glucose concentration should be below
2% (w/v) before significant xylose consumption occurred (Panchal, 1988). This behavior has still
not been reported for P. pastoris, but the results of this study suggest that a similar behavior
might have occurred.
In accordance with the reduced CDW obtained in the two assays, the growth yields in
the 50%Xyl and 75%Xyl experiments were also lower, reaching only 0.271 and 0.194 g g-1
,
respectively, compared with the previous assays. The production yields were also lower (0.033
and 0.029 g g-1
) (Table 4.1).
Table 4.1 Comparison of parameters obtained for glucose and xylose mixtures in batch bioreactor experiments. μmax,
maximum specific growth rate; CDW, maximum cell dry weight; % CGC, % of CGC in dry cell biomass; CGC, maximum
active concentration; rp, overall volumetric productivity; YX/S, growth yield; YP/S production yield; RGlu, glucose
consumption rate; RXyl, xylose consumption rate.
Xyl (%) 0 12.5 25 50 75
Cultivation time (h) 37 54 64 91 66
μmax (h-1
) 0.20 0.17 0.14 0.17 0.14
CDW (gL-1
) 33.90 27.80 35.25 16.99 13.64
% CGC 16.44 19.13 15.47 12.28 15.07
CGC (gL-1
) 5.57 5.32 5.45 2.09 2.06
rp (gCGC L-1
.h-1
) 0.149 0.099 0.085 0.023 0.031
YX/S (g g-1
) 0.45 0.36 0.45 0.27 0.19
YP/S (g g-1
) 0.08 0.07 0.07 0.03 0.03
RGlc 8.59 6.54 5.81 3.13 1.19
RXyl - 0.13 0.35 0.26 -
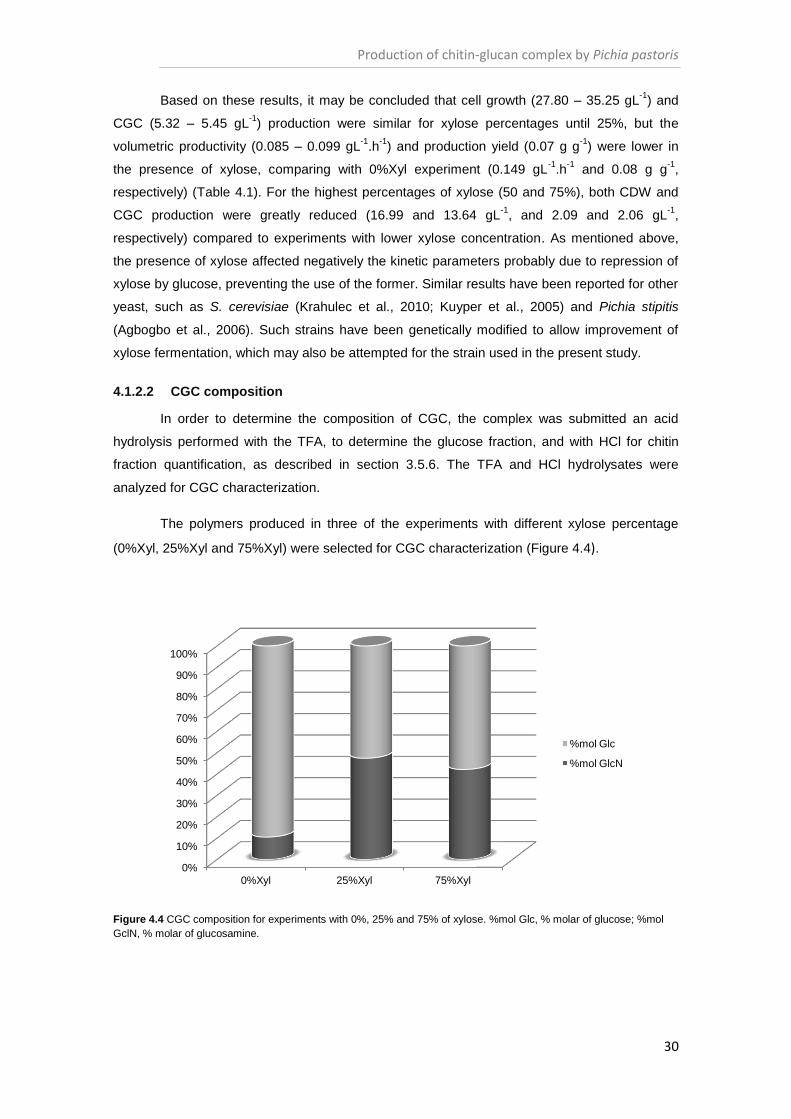
Production of chitin-glucan complex by Pichia pastoris
30
Based on these results, it may be concluded that cell growth (27.80 – 35.25 gL-1
) and
CGC (5.32 – 5.45 gL-1
) production were similar for xylose percentages until 25%, but the
volumetric productivity (0.085 – 0.099 gL-1
.h-1
) and production yield (0.07 g g-1
) were lower in
the presence of xylose, comparing with 0%Xyl experiment (0.149 gL-1
.h-1
and 0.08 g g-1
,
respectively) (Table 4.1). For the highest percentages of xylose (50 and 75%), both CDW and
CGC production were greatly reduced (16.99 and 13.64 gL-1
, and 2.09 and 2.06 gL-1
,
respectively) compared to experiments with lower xylose concentration. As mentioned above,
the presence of xylose affected negatively the kinetic parameters probably due to repression of
xylose by glucose, preventing the use of the former. Similar results have been reported for other
yeast, such as S. cerevisiae (Krahulec et al., 2010; Kuyper et al., 2005) and Pichia stipitis
(Agbogbo et al., 2006). Such strains have been genetically modified to allow improvement of
xylose fermentation, which may also be attempted for the strain used in the present study.
4.1.2.2 CGC composition
In order to determine the composition of CGC, the complex was submitted an acid
hydrolysis performed with the TFA, to determine the glucose fraction, and with HCl for chitin
fraction quantification, as described in section 3.5.6. The TFA and HCl hydrolysates were
analyzed for CGC characterization.
The polymers produced in three of the experiments with different xylose percentage
(0%Xyl, 25%Xyl and 75%Xyl) were selected for CGC characterization (Figure 4.4).
Figure 4.4 CGC composition for experiments with 0%, 25% and 75% of xylose. %mol Glc, % molar of glucose; %mol
GclN, % molar of glucosamine.
0%
10%
20%
30%
40%
50%
60%
70%
80%
90%
100%
0%Xyl 25%Xyl 75%Xyl
%mol Glc
%mol GlcN

Production of chitin-glucan complex by Pichia pastoris
31
The CGC biopolymer produced from glucose as carbon source (0%Xyl experiment) had
glucosamine and glucose molar contents of 5 and 39%, respectively, corresponding to a
chitin:β-glucan ratio of 11:89 (%mol). This ratio is similar to the values reported by Roca et al.
(2012) for CGC production with crude glycerol (16:84 %mol). These results are in accordance
with the typical composition of yeast cell wall (section 2.2.1), where β-glucans are the major
structural component.
CGC polymers obtained in experiments with addition of xylose presented considerably
higher chitin contents, namely 26 and 23%, for the 25%Xyl and 75%Xyl assays, respectively.
These values correspond to a chitin:β-glucan ratio of 47:53 (mol%) and 42:58 (mol%) for
25%Xyl and 75%Xyl experiments, respectively, suggesting that the presence of xylose in the
medium was advantageous for the process, since it led to increased chitin content in the
produced biopolymer (Figure 4.4). This highest fraction of chitin in CGC may confer new
properties to the polymer and also can allow to obtain pure chitin in highest quantity than usual
CGC, produced in other cultivation conditions. These results were much higher than those
obtained from crude glycerol, where the glucose and glucosamine contents was 35 and 7 wt%,
respectively, corresponding to a chitin:β-glucan ratio of 16:84 (mol%) (Roca et al., 2012).
As mentioned above, currently CGC is extracted from the biomass of Aspergillus niger
from the citric acid production process (section 2.2.3). The CGC composition of Aspergillus
niger is mainly composed of glucan, presenting a chitin:β-glucan ratio of 40:60 (mol%)
(Feofilova et al., 2006). This CGC composition is similar to that obtained in this study for P.
pastoris grown on glucose/xylose mixtures, namely the 25%Xyl and 75%Xyl experiments
(47:53 (mol%) and 42:58 (mol%), respectively).
4.1.3 Conclusions
In the present study, glucose and xylose mixtures were used as substrates for
cultivation of P. pastoris and production of CGC. The results indicate that not all glucose/xylose
mixtures are suitable for this bioprocess, namely the mixtures with highest percentages of
xylose (above 75%). Nevertheless, this study has shown that it is feasible to valorize glucose
and xylose containing lignocellulosic materials for the production of the value-added CGC
biopolymer, as long as the percentage of xylose is not above 50%. According to the results, P.
pastoris might be able to use a large of range of lignocellulosic residues (e.g. corn stover, rice
straw and wheat straw) that are mostly composed by glucose, with lower xylose contents
(Aristidou and Penttilä, 2000).
The specific cell growth rate and biomass yield obtained using glucose/xylose mixtures,
with xylose percentages up to 50%, namely 12.5 and 25% (0.17 – 0.14 h-1
and 0.36 – 0.45 g g-1
,
respectively), were similar to the results obtained with glycerol biodiesel byproduct (0.17 h-1
and
0.55 gbiomass gglycerol-1
, respectively) (Roca et al., 2012). In terms of overall volumetric productivity,
the results for glucose/xylose mixtures (0.023 – 0.059 gL-1
.h-1
) was very lower comparatively to

Production of chitin-glucan complex by Pichia pastoris
32
obtained with glycerol (0.105-0.168 gL-1
.h-1
) (Chagas et al., 2013). This reduction of productivity
decreases the expectation to industrial scale-up, however the process based on glucose/xylose
containing substrates can be improved to achieve this aim.
Despite the lower overall volumetric productivity, the use of glucose/xylose mixtures
increased the content of chitin in CGC from 5% with glucose as sole carbon source to 23 - 26%
with xylose in the medium (25%Xyl and 75%, respectively). The maximum chitin content was
achieved with 25% of xylose, corresponding to a chitin:β-glucan ratio of 47:53 (mol%), which is
considerably higher than the chitin:β-glucan ratio (16:84 mol%) reported for growth in crude
glycerol (Roca et al., 2012).
According to the results, lignocellulosic wastes with percentages of xylose not above
50% could be an alternative to glycerol, thus avoiding the dependence on this substrate and
making the process more versatile. Another advantage of using lignocellullsic materials is the
decrease of the overall production costs, since the price of glycerol (even from biodiesel
industry) can vary widely and also lead to a variation of cost of CGC production. The availability
of raw material is increased with the use of these wastes due to weak utilization of such
materials, in opposition to glycerol which is used in several applications.
Process improvements may be attained with implementation of fed-batch or continuous
systems, which can enable considerable increases of productivity. Genetically modified P.
pastoris strains, able to efficiently grow on higher xylose percentages, might also be an
alternative to improve the process. These variations on procedure can contribute to the increase
of the CGC content and also impact on the chemical composition of the polymer.

Production of chitin-glucan complex by Pichia pastoris
33
4.2 Valorization of food and industry byproducts for the production of
chitin-glucan complex
Agro-industrial residues are derived from the processing of a particular crop or animal
product (Nigam and Pandey, 2009). Examples of those residues (cheese whey, sugarcane
molasses, used cooking oil, waste fat, waste paper and spent coffee sounds) were used in this
study for cultivation of P. pastoris and CGC production. As mentioned above, the wastes used
in this study were supplied by several agro-industrial companies, namely Lactogal (cheese
whey supplier), RAR (sugarcane molasses supplier) and FIMA (waste fat supplier). The used
cooking oil for this study came from the snack bar of the Chemistry Department, at FCT-UNL,
and the waste paper was a mixture of magazines and used office paper collected in the lab.
4.2.1 Substrates preparation
In order to enable the accessibility of the nutrients constituents of the wastes by
P. pastoris, the substrates were subjected to specific pre-treatment procedures (Table 3.3).
The aqueous solutions of cheese whey and sugarcane molasses were simply sterilized
by autoclaving prior to their addition to the cultivation media. After sterilization in autoclave,
used cooking oil and waste fat were added directly to the BSM medium.
Waste paper and spent coffee grounds are complex substrates and it was necessary to
hydrolyze them to obtain simple sugars more easily metabolized by the yeast. Acid hydrolysis of
waste paper and spent coffee grounds were performed with two different acids: 1) orto-
phosphoric acid (H3PO4) was used in the amounts usually present in BSM medium; and 2)
sulfuric acid (H2SO4) was used as an attempt to increase the efficiency of the hydrolysis since it
is a stronger acid.
Prior to hydrolysis, both wastes were characterized by elemental analysis and their ash
contents were determined. The elemental analysis showed that the spent coffee grounds
contained 1.37% of nitrogen, 8.14% of hydrogen and 30.64% of carbon, whereas waste paper
contained 0.10% of nitrogen, 5.11% of hydrogen and 38.75% of carbon. The spent coffee
grounds had an ash content of 0.42% (w/w), while a considerably higher value was obtained for
the waste paper (32.43%, w/w), which is in accordance with literature values for recycled paper
sludge (29.3% ash, see section 2.3.4).
Figure 4.5 shows the results of total sugars concentration obtained for each acid
hydrolysis for different temperatures (30 – 121 ºC) and reaction times (20 – 60 minutes).
Figure 4.5 shows that the hydrolysis performance was affected by temperature and
reaction time: an increase of the hydrolysis performance was observed by the increase of both
variables. The results illustrated that for both substrates, the highest total concentration of

Production of chitin-glucan complex by Pichia pastoris
34
sugars was found at the highest levels of temperature (121 ºC) and reaction time (60 minutes)
assayed.
As expected, the results obtained show that the hydrolysis with sulfuric acid was more
efficient than with orto-phosphoric acid (Figure 4.5). This fact was justified by difference in
strength of the used acids and their concentration. The H3PO4 concentration used was lower
(26.7 mL L-1
) to maintain the concentration used in normal BSM medium (see section 3.1), while
the H2SO4 concentration used (100 mL L-1
) was based in values reported in the literature for
hydrolysis of olive tree pruning residues (Romero et al., 2010) and spent coffee grounds
(Mussatto et al., 2011b). Thus, for spent coffee grounds hydrolyzed with H3PO4 and H2SO4 the
maximum total sugar concentrations achieved were 12.54 gL-1
and 35.83 gL-1
, respectively. For
waste paper, the maximum total sugar concentrations achieved were considerably lower in both
hydrolysates: 1.15 gL-1
, for H3PO4, and 6.20 gL
-1, for sulfuric acid. These values was measured
by Dubois method, where all soluble carbohydrates present in mixture are accounted, including
monosaccharides, oligosaccharides and polysaccharides, as well as methyl ester with free or
potentially free reducing groups (DuBois et al., 1956).
Figure 4.5 Efficiency of acid hydrolysis, in terms of total sugar concentration in the hydrolysates, with sulfuric acid
applied to spent coffee grounds (A) and waste paper (B), and with orto-phosphoric acid applied to spent coffee grounds
(C) and waste paper (D).
A C
D B
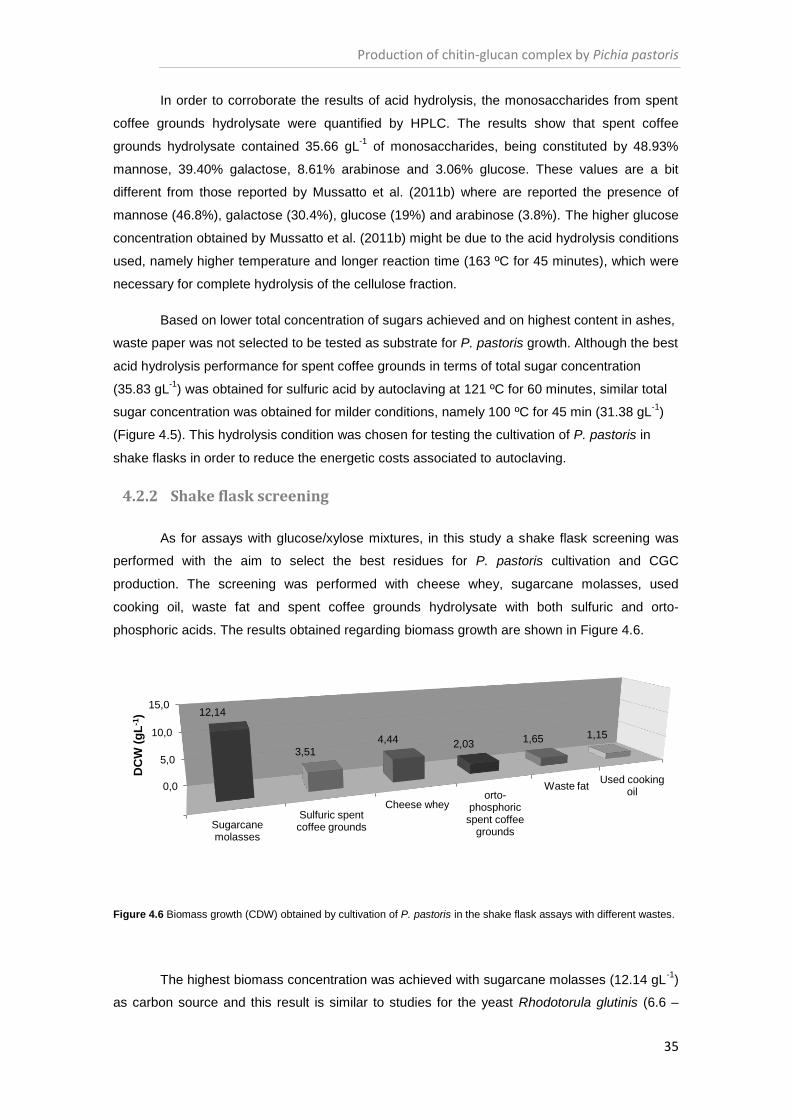
Production of chitin-glucan complex by Pichia pastoris
35
In order to corroborate the results of acid hydrolysis, the monosaccharides from spent
coffee grounds hydrolysate were quantified by HPLC. The results show that spent coffee
grounds hydrolysate contained 35.66 gL-1
of monosaccharides, being constituted by 48.93%
mannose, 39.40% galactose, 8.61% arabinose and 3.06% glucose. These values are a bit
different from those reported by Mussatto et al. (2011b) where are reported the presence of
mannose (46.8%), galactose (30.4%), glucose (19%) and arabinose (3.8%). The higher glucose
concentration obtained by Mussatto et al. (2011b) might be due to the acid hydrolysis conditions
used, namely higher temperature and longer reaction time (163 ºC for 45 minutes), which were
necessary for complete hydrolysis of the cellulose fraction.
Based on lower total concentration of sugars achieved and on highest content in ashes,
waste paper was not selected to be tested as substrate for P. pastoris growth. Although the best
acid hydrolysis performance for spent coffee grounds in terms of total sugar concentration
(35.83 gL-1
) was obtained for sulfuric acid by autoclaving at 121 ºC for 60 minutes, similar total
sugar concentration was obtained for milder conditions, namely 100 ºC for 45 min (31.38 gL-1
)
(Figure 4.5). This hydrolysis condition was chosen for testing the cultivation of P. pastoris in
shake flasks in order to reduce the energetic costs associated to autoclaving.
4.2.2 Shake flask screening
As for assays with glucose/xylose mixtures, in this study a shake flask screening was
performed with the aim to select the best residues for P. pastoris cultivation and CGC
production. The screening was performed with cheese whey, sugarcane molasses, used
cooking oil, waste fat and spent coffee grounds hydrolysate with both sulfuric and orto-
phosphoric acids. The results obtained regarding biomass growth are shown in Figure 4.6.
Figure 4.6 Biomass growth (CDW) obtained by cultivation of P. pastoris in the shake flask assays with different wastes.
The highest biomass concentration was achieved with sugarcane molasses (12.14 gL-1
)
as carbon source and this result is similar to studies for the yeast Rhodotorula glutinis (6.6 –
Sugarcane molasses
Sulfuric spent coffee grounds
Cheese whey orto-
phosphoric spent coffee
grounds
Waste fat Used cooking
oil 0,0
5,0
10,0
15,0 12,14
3,51 4,44 2,03
1,65 1,15
DC
W (
gL
-1)

Production of chitin-glucan complex by Pichia pastoris
36
12.0 gL-1
), where sugarcane molasses were used to produce β-carotene, in shake flask
experiments (Bhosale and Gadre, 2001). In previous studies (Shahidan et al., 2011), the
utilization of molasses by P. pastoris strain GS115 has already been reported but biomass
concentration achieved with this residue was not reported.
The lower biomass concentration was attained with used cooking oil (1.15 gL-1
) being
identical to that obtained with fat waste (1.65 gL-1
). These results suggest that P. pastoris can
use residues rich in fatty acids to grow, although the values achieved are extremely low. The
results obtained in this study are in accordance with previous studies, where P. pastoris X33
grew in medium with 0.2% of oleic acid but cell growth was much lower than in medium with
glucose (Wriessnegger et al., 2007). Liu et al. (1992) also reported the lower growth of wild type
P. pastoris strain JC100 on medium supplemented with 0.1% of oleic acid.
For the assays performed with cheese whey as carbon source, the culture achieved a
biomass concentration of 4.44 gL-1
, a value higher than with used cooking oil and fat waste but
lower than for growth with sugarcane molasses (Figure 4.6). These results are consistent with
studies for P. pastoris strain GS115 growing in medium containing lactose (1%), where biomass
growth was lower than that obtained with 1% of sugarcane molasses (Shahidan et al., 2011).
In the experiments with spent coffee grounds hydrolysates as carbon sources, the
biomass concentration achieved was different for the two types of acids. As expected, due to
the different sugar concentration in each hydrolysate, in the medium supplemented with sulfuric
acid hydrolysate, a higher biomass concentration (3.51 gL-1
) was reached compared to the
medium with orto-phosphoric acid hydrolysate (2.03 gL-1
) (Figure 4.6). The result obtained for
sulfuric acid is slightly lower than previous studies (5.5 gL-1
), where sulfuric acid was used for
acid hydrolysis of spent coffee grounds and cultivation of S. cerevisiae (Mussatto et al., 2012).
However, growth of P. pastoris in spent coffee grounds hydrolysates has still not been reported.
The shake flask screening allowed verifying that P. pastoris was able to consume the
different tested residues, being the composition of those residues a determinant factor to yeast
growth. The yeast demonstrated preference to residues with glucose in its constitution and this
fact favored the sugarcane molasses, while used cooking oil and waste fat were not suitable
substrates. Based on these results, sugarcane molasses and sulfuric acid spent coffee grounds
hydrolysate were selected, among the tested residues, for further experiments with P. pastoris
cultivation in bioreactor.
4.2.3 Batch bioreactor experiments
Sugarcane molasses and spent coffee grounds hydrolysate with sulfuric acid were
selected to perform batch bioreactor experiments due to results observed in the preliminary
shake flask trials. An experiment using glycerol from biodiesel industry was also tested in
bioreactor to serve of comparison between other residues. Glycerol from biodiesel industry
(supplied by SGC Energia, SGPS, SA, Portugal), with a glycerol content of 86%, was used as

Production of chitin-glucan complex by Pichia pastoris
37
standard residue due to high cellular density achieved and interesting amount of CGC
production achieved previously (Roca et al., 2012).
The experiment using crude glycerol as sole carbon source was the first experiment to
be performed (Figure 4.7). In this trial, after 24 hours of lag phase, P. pastoris grew at a specific
cell growth rate of 0.15 h-1
and achieved a final CDW of 37.94 gL-1
within 42 hours of cultivation
(Table 4.2). The specific cell growth rate achieved in this experiment was slightly lower than that
obtained by Chagas et al. (2013) (0.17 h-1
) with pure glycerol as carbon source and this
difference could be due to lower initial concentration of glycerol used (40 gL-1
) in contrast with
concentration used in this study (~70 gL-1
).
Figure 4.7 Cultivation profile of the batch bioreactor with biodiesel byproduct crude glycerol as sole carbon source.
Dry cell weight ( , gL-1), glycerol ( , gL
-1) and CGC concentrations ( , gL
-1).
Along the experiment, the culture consumed all initial glycerol concentration (67.50gL-1
),
with a consumption rate of 3.98 gL-1
.h-1
and, as expected, after 38 hours, the growth stabilized
when the carbon source was depleted (Figure 4.7). The CGC concentration reached the highest
value (6.25 gL-1
) at the end of the exponential phase. This value represented a 15.88 % content
of CGC in the biomass (Table 4.2). The difference in specific cell growth rate seems not to have
affected the CGC content since its value was even higher than that obtained in identical
conditions (13%) by Chagas et al. (2013).
The overall volumetric productivity obtained in this experiment (0.135 gL-1
.h-1
) was in
accordance with studies for pure glycerol (0.105 – 0.168 gCGC L-1
.h-1
) reported by Chagas et
al. (2013), suggesting that this parameter was not affected by purity/concentration of crude
glycerol.
In terms of yields, in this study, the culture achieved lower biomass
(0.493 gbiomass gglycerol-1
) and a product yields (0.073 gCGC gglycerol-1
) than the values obtained by
0,0
1,0
2,0
3,0
4,0
5,0
6,0
7,0
0
10
20
30
40
50
60
70
80
0 12 24 36 48
CG
C
CD
W o
r g
lyc
ero
l
Time (h)

Production of chitin-glucan complex by Pichia pastoris
38
Roca et al. (2012) (0.55 gbiomass gglycerol-1
and 0.15 gCGC gglycerol-1
, respectively), where crude
glycerol was used as sole carbon source.
In order to determine the culture´s ability to grow in medium with the other residues
selected in this study, under controlled bioreactor conditions, experiments with sugarcane
molasses (Figure 4.8) and spent coffee grounds hydrolysate (Figure 4.9) were performed in
duplicate experiments.
In the experiments with sugarcane molasses (Figure 4.8), after a 7 hours lag phase, the
culture grew at a specific cell growth rate of 0.11 h-1
reaching a maximum CDW of 17.78 gL-1
,
within 71 hours of cultivation (Table 4.2). The maximum of CDW reached in end of trial was
higher than that obtained for Rhodotorula glutinis (10 gL-1
) cultivated on molasses for β-
carotene production in batch fermentation, reported by Bhosale and Gadre (2001). For
P. pastoris wild type strains, there are no reported studies about its growth in sugarcane
molasses.
At the end of experiment, the CGC concentration reached 3.12 gL-1
that corresponds to
a CGC content of 17.53% in the biomass. This value reflected in an overall volumetric
productivity of 0.044 gL-1
h-1
(Table 4.2).
Figure 4.8 Cultivation profiles of the batch bioreactor experiments with sugarcane molasses.
Dry cell weight ( , gL-1) and CGC ( , gL
-1) and total sugars concentration ( , gL
-1).
The experiment with spent coffee grounds hydrolysate (Figure 4.9) had a longer
cultivation time of 92 hours. In this assay, the maximum biomass concentration (3.46 gL-1
) was
much lower than that obtained for growth with sugarcane molasses as carbon source
(17.78 gL -1
).
0
0,5
1
1,5
2
2,5
3
3,5
0
10
20
30
40
50
60
70
80
90
0 12 24 36 48 60 72 84
CG
C
CD
W o
r to
tal s
ug
ars
c
on
ce
ntr
ati
on
Time (h)

Production of chitin-glucan complex by Pichia pastoris
39
Figure 4.9 Cultivation profiles of the batch bioreactor experiments with spent coffee grounds hydrolysate: A - Dry cell
weight ( , gL-1) and CGC concentration ( , gL
-1); B - galactose ( , gL
-1), glucose ( , gL
-1), mannose (
gL-1) and arabinose concentration ( , gL
-1).
As mentioned above, cultivation of P. pastoris in spent coffee grounds hydrolysates has
still not been reported. However, this residue has been studied for other yeast, such as S.
cerevisiae (Mussatto et al., 2012). The results, namely biomass concentration, obtained in this
study for P. pastoris were lower than reported by Mussatto et al. (2012) for S. cerevisiae
(5.5 gL -1
) for ethanol production, in shake flasks. This difference could be due to higher
temperature used in the acid hydrolysis (163 ºC, for 45 minutes), reaching a higher total sugar
concentration (50 gL-1
, approximately) that allowed higher cell growth.
As for CDW values, the CGC concentration obtained with spent coffee grounds
hydrolysate (0.52 gL-1
), that represented 15.04% of biomass, was lower than that achieved with
sugarcane molasses. This difference could be justified by the lower biomass concentration
reached with spent coffee grounds hydrolysate due to lower sugar concentration available (only
0,0
0,1
0,2
0,3
0,4
0,5
0,6
0,7
0,8
0,9
1,0
0
5
10
0 12 24 36 48 60 72 84 96 108
CG
C
DC
W
Time (h)
0,0
0,2
0,4
0,6
0,8
1,0
1,2
1,4
1,6
1,8
2,0
0
5
10
15
0 12 24 36 48 60 72 84 96 108
Glu
co
se
Ma
nn
os
e, g
ala
cto
se
or
a
rab
ino
se
Time (h)
A
B
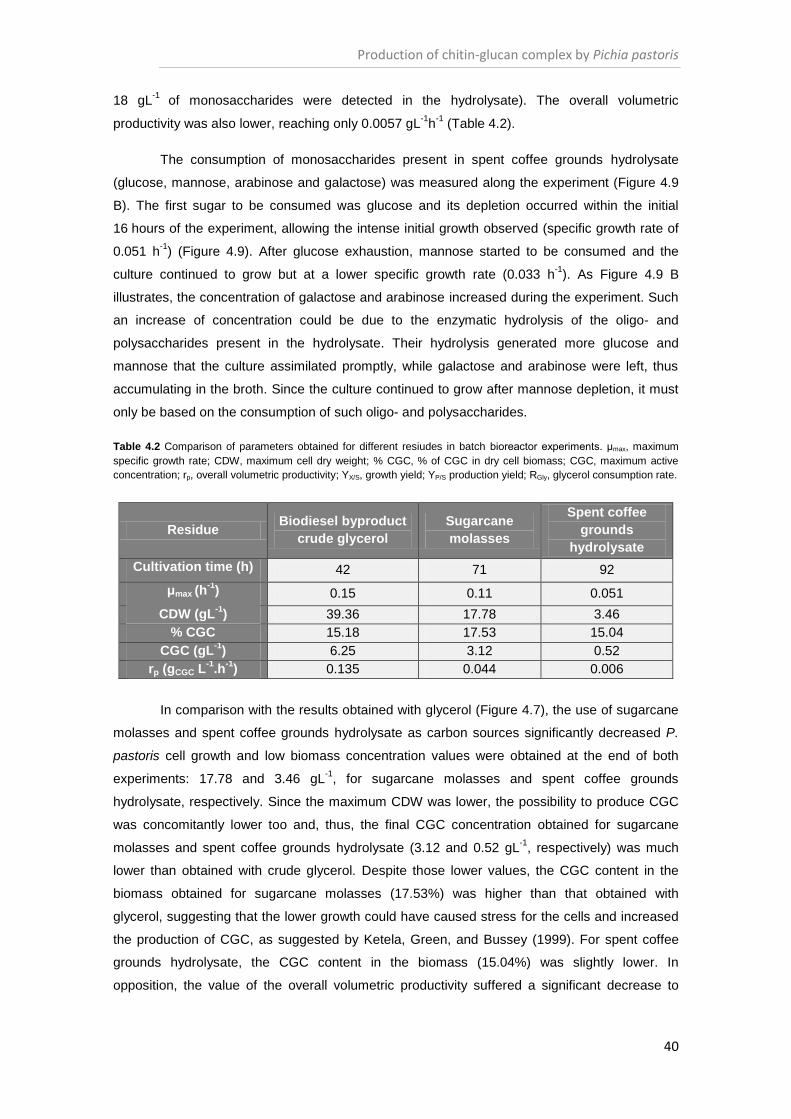
Production of chitin-glucan complex by Pichia pastoris
40
18 gL-1
of monosaccharides were detected in the hydrolysate). The overall volumetric
productivity was also lower, reaching only 0.0057 gL-1
h-1
(Table 4.2).
The consumption of monosaccharides present in spent coffee grounds hydrolysate
(glucose, mannose, arabinose and galactose) was measured along the experiment (Figure 4.9
B). The first sugar to be consumed was glucose and its depletion occurred within the initial
16 hours of the experiment, allowing the intense initial growth observed (specific growth rate of
0.051 h-1
) (Figure 4.9). After glucose exhaustion, mannose started to be consumed and the
culture continued to grow but at a lower specific growth rate (0.033 h-1
). As Figure 4.9 B
illustrates, the concentration of galactose and arabinose increased during the experiment. Such
an increase of concentration could be due to the enzymatic hydrolysis of the oligo- and
polysaccharides present in the hydrolysate. Their hydrolysis generated more glucose and
mannose that the culture assimilated promptly, while galactose and arabinose were left, thus
accumulating in the broth. Since the culture continued to grow after mannose depletion, it must
only be based on the consumption of such oligo- and polysaccharides.
Table 4.2 Comparison of parameters obtained for different resiudes in batch bioreactor experiments. μmax, maximum
specific growth rate; CDW, maximum cell dry weight; % CGC, % of CGC in dry cell biomass; CGC, maximum active
concentration; rp, overall volumetric productivity; YX/S, growth yield; YP/S production yield; RGly, glycerol consumption rate.
In comparison with the results obtained with glycerol (Figure 4.7), the use of sugarcane
molasses and spent coffee grounds hydrolysate as carbon sources significantly decreased P.
pastoris cell growth and low biomass concentration values were obtained at the end of both
experiments: 17.78 and 3.46 gL-1
, for sugarcane molasses and spent coffee grounds
hydrolysate, respectively. Since the maximum CDW was lower, the possibility to produce CGC
was concomitantly lower too and, thus, the final CGC concentration obtained for sugarcane
molasses and spent coffee grounds hydrolysate (3.12 and 0.52 gL-1
, respectively) was much
lower than obtained with crude glycerol. Despite those lower values, the CGC content in the
biomass obtained for sugarcane molasses (17.53%) was higher than that obtained with
glycerol, suggesting that the lower growth could have caused stress for the cells and increased
the production of CGC, as suggested by Ketela, Green, and Bussey (1999). For spent coffee
grounds hydrolysate, the CGC content in the biomass (15.04%) was slightly lower. In
opposition, the value of the overall volumetric productivity suffered a significant decrease to
Residue Biodiesel byproduct
crude glycerol
Sugarcane
molasses
Spent coffee
grounds
hydrolysate
Cultivation time (h) 42 71 92
μmax (h-1
) 0.15 0.11 0.051
CDW (gL-1
) 39.36 17.78 3.46
% CGC 15.18 17.53 15.04
CGC (gL-1
) 6.25 3.12 0.52
rp (gCGC L-1
.h-1
) 0.135 0.044 0.006

Production of chitin-glucan complex by Pichia pastoris
41
0.044 and 0.0057 gL-1
.h-1
for sugarcane molasses and spent coffee grounds hydrolysate,
respectively, comparatively to that obtained with crude glycerol (0.135 gL-1
.h-1
) (Table 4.2).
The presence of caffeine in SCG confers a potential advantage for CGC production,
since for S. cerevisiae it has been reported that although caffeine inhibits the cellular growth by
50% (Kuranda et al., 2006), it induces the increase of the chitin content in the cell wall as a
response to stress (Ketela et al., 1999). Thus, one of the factors that may have contributed to
lower biomass growth in this study was the presence of caffeine, but it was not possible to
analyze its content over time in the samples. This analysis will be carried out in future work.
Due to the lower biomass concentration achieved in the experiments with sugarcane
molasses and spent coffee grounds hydrolysate, it was not possible to analyze the CGC
polymers for their composition in glucans and chitin.
4.2.4 Conclusions
In the present study, several residues, namely sugarcane molasses, cheese whey, waste
fat, used cooking oil and spent coffee grounds, were used as substrates for cultivation of P.
pastoris and production of CGC. The results indicate that not all wastes are suitable for this
bioprocess, namely waste paper, used cooking oil and waste fat. Nevertheless, this study has
shown that sugarcane molasses, cheese whey and spent coffee grounds can be used as
substrates for P. pastoris cultivation, although cell growth was not efficient for all of them.
The experiment performed with glycerol biodiesel byproduct was used as a standard for
comparison, since this waste was already reported for CGC production by P. pastoris (Roca et
al., 2012). The specific cell growth rate and biomass yield obtained in this study (0.15h-1
and
0.49 gbiomass gglycerol-1
, respectively) are similar to reported by Roca et al. (2012) (0.17h-1
and
0.55 gbiomass gglycerol-1
, respectively).
The biomass concentration obtained using sugarcane molasses and spent coffee ground
hydrolysate (3.46 - 17.78 gL-1
, respectively) were much lower than the results obtained with
glycerol biodiesel byproduct (0.15 and 39.36 gL-1
, respectively). In terms of overall volumetric
productivity, the results for sugarcane molasses and spent coffee ground hydrolysate (0.044
and 0.006 gL-1
.h-1
) were very low comparatively to that obtained with glycerol biodiesel
byproduct (0.135 gL-1
.h-1
). This reduction of volumetric productivity is a consequence of lower
biomass concentration achieved with those wastes and indicates that they are not suitable for
P. pastoris cultivation nor for CGC production.
According to the results, sugarcane molasses is the best substrate among the tested of
wastes. Nevertheless, the process needs improvements to achieve the proposed aim. The
process improvement may be attained with implementation of fed-batch or continuous system to
increase the biomass concentration and, consequently, CGC production.

Production of chitin-glucan complex by Pichia pastoris
42
Production of chitin-glucan complex by Pichia pastoris
43
5. General conclusions and future work
5.1 General conclusions
This study aimed to assess the suitability of different substrates for the cultivation of the
yeast P. pastoris and production of CGC. The first part of the work consisted in investigating the
ability of the culture to use glucose and xylose mixtures for growth and their impact on CGC
production. In the second part of the study, the potential of different industrial wastes and / or
byproducts as substrates for this yeast was evaluated, to search for alternative substrates to
glycerol. This strategy is advantageous for industries generating those materials, which can
valorize them by producing value-added products (CGC, chitin, chitosan, glucans) with
applications in many areas.
Firstly, glucose and xylose mixtures were used as substrates for cultivation of P.
pastoris and production of CGC. This study has shown that it is feasible to valorize glucose and
xylose containing materials, such as lignocellulosic wastes and byproducts, for the production of
the value-added CGC biopolymer, as long as the percentage of xylose is not above 50%. The
best performance was achieved in batch bioreactor experiment with addition of 25% of xylose in
the medium, where 35.25 gL-1
biomass was obtained in 64 hours of cultivation. The CGC
content in the cell wall reached 15% with a volumetric productivity of 0.085 gL-1
.h-1
and the
molar ratio of chitin:β-glucan in the extracted biopolymer was 47:53, which is a considerably
higher chitin content than the values obtained with crude glycerol (16:84 mol%) by Roca et al.
(2012). According to the results, lignocellulosic wastes with percentage of xylose below 50%
could be an alternative to glycerol, thus eliminating the dependency of the bioprocess on a
single substrate (glycerol) and making it more versatile. The availability of raw material is
increased with use of these wastes due to weak utilization of these materials, in opposition to
glycerol which is used to several applications.
In the second part of the study, several wastes and /or byproducts (used cooking oil, waste
fats, sugarcane molasses, cheese whey and spent coffee grounds) were tested. The results
show that P. pastoris reached low biomass concentration using these substrates. In batch
bioreactor experiments the best results were achieved with sugarcane molasses, where
17.78 gL-1
biomass obtained contains 17% of CGC, a value higher than that obtained with crude
glycerol (16%).
5.2 Future work
Based on the results, it is clear the need to improve the process and to reach this aim the
following improvements should be implemented.

Production of chitin-glucan complex by Pichia pastoris
44
5.2.1 Testing lignocellulosic residues
In the first part of this study, it was possible to demonstrate that P. pastoris grows
efficiently in glucose and xylose containing materials where the percentage of xylose is not
above 50%. This fact allows valorizing several wastes containing those sugars, particularly
those that have this preferred percentage of xylose. In this way, lignocellulosic wastes that are
constituted mostly by glucose, with lower xylose contents, such as corn stover, wheat straw and
winter rye are potentially suitable for use as substrates for CGC production by P. pastoris (see
section 4.1). The utilization of one of these wastes could increase the growth of P. pastoris and
CGC production.
Another waste that could be interested tested was the waste paper due to composition
in glucose and xylose (see section 2.3.4). As mentioned above, for use of this waste as
substrate, the conditions of acid hydrolysis should be optimized, such as increasing the
temperature, the reaction time and the concentration of sulfuric acid used. Moreover, the high
inorganic content in this waste should be reduced to improve the hydrolysate’s sugar content.
This optimization will allow obtaining high sugar concentration that would work as substrate for
yeast cultivation.
5.2.2 Bioreactor operating mode
As described above, P. pastoris was able to grow in many substrates including
industrial wastes and/or byproducts. However, in the wastes studied in this work the cellular
growth was not very high and this affects the overall productivity of the process. In order to
increase biomass growth and, consequently the CGC productivity, a fed-batch mode or a
continuous system should be applied. In this way it could be possible to achieve the high cell
concentration and a higher maximum of CGC might be reached.
5.2.3 Impact of residues in CGC composition
In this study, the residues tested as substrates for P. pastoris growth did not allow to
achieve high cellular density and consequently the determination of CGC composition was
limited. Applying the two strategies submitted earlier, the biomass concentration could be
attained by modifying the bioreactor operating mode and CGC with variable chitin:glucan ratios
could be achieved with variability of the wastes composition. Such CGC polymers with different
composition might possess distinct properties that could be useful for different applications.
In case of spent coffee grounds the insignificant growth can be justify by presence of
caffeine. As mentioned above, caffeine provokes a negative effect in growth but can induce an
increase of chitin fraction in CGC. To explore this hypothesis, an increase of CGC production
was necessary to allow analyzing the CGC composition in chitin and glucans. To overcome the
eventual caffeine growth inhibition, mixed substrates could be used, for example, by supplying
the culture with a glucose-rich substrate during the initial phase of the run to attain high cell-
Production of chitin-glucan complex by Pichia pastoris
45
density, followed by feeding it with SCG hydrolysate afterwards to obtain a glucosamine
enriched polymer.

Production of chitin-glucan complex by Pichia pastoris
46

Production of chitin-glucan complex by Pichia pastoris
47
6. References
Agbogbo, Frank K, Guillermo Coward-kelly, Mads Torry-smith, and Kevin S Wenger. 2006.
“Fermentation of Glucose / Xylose Mixtures Using Pichia Stipitis.” Process
Biochemistry 41: 2333–2336. doi:10.1016/j.procbio.2006.05.004.
Aristidou, Aristos, and Merja Penttilä. 2000. “Metabolic Engineering Applications to
Renewable Resource Utilization.” Current Opinion in Biotechnology 11: 187–198.
Ashley, Elizabeth S Dodds, Russell Lewis, James S Lewis, Craig Martin, and David Andes.
2006. “Pharmacology of Systemic Antifungal Agents.” Clinical Infectious Diseases 43:
28–39.
Bai, Yingguo, Peilong Yang, Yaru Wang, Pengjun Shi, Huiying Luo, Kun Meng, Bo Wu, and Bin
Yao. 2009. “Phytase Production by Fermentation of Recombinant Pichia Pastoris in
Monosodium Glutamate Wastewater.” World Journal of Microbiology and Biotechnology
25: 1643–1649. doi:10.1007/s11274-009-0058-7.
Bhosale, P, and R V Gadre. 2001. “β-Carotene Production in Sugarcane Molasses by a
Rhodotorula Glutinis Mutant.” Journal of Industrial Microbiology and Biotechnology
26: 327–332.
Bicho, Paul A, P Lynn Runnals, J Douglas Cunningham, and Hung Lee. 1988. “Induction of
Xylose Reductase and Xylitol Dehydrogenase Activities in Pachysolen Tannophilus
and Pichia Stipitis on Mixed Sugars.” Applied and Environmental Microbiology 54: 50–
54.
Cabib, Enrico, and Rowena Roberts. 1982. “Synthesis of the yeast cell wall and its
regulation.” Annual Review of Biochemistry 51: 769–793.
Cereghino, Joan Lin, and James M Cregg. 2000. “Heterologous Protein Expression in the
Methylotrophic Yeast Pichia Pastoris.” FEMS Microbiology Reviews 24: 45–66.
Chagas, B, I Farinha, F Freitas, and M A Reis. 2013. “Production of Chitin-glucan Complex
by Pichia Pastoris: Effect of pH and Temperature on Production and Polymer
Composition.” Journal Applied Microbiology. Submitted.
Cos, Oriol, Ramón Ramón, José Luis Montesinos, and Francisco Valero. 2006. “Operational
Strategies , Monitoring and Control of Heterologous Protein Production in the
Methylotrophic Yeast Pichia Pastoris Under Different Promoters : A Review.”
Microbial Cell Factories 5: 1–20.

Production of chitin-glucan complex by Pichia pastoris
48
Couderc, R.; Baratti J. 1980. “Oxidation of Methanol by the Yeast, Pichia Pastoris.
Purification and Properties of the Alcohol Oxidase” Agricultural and biological
chemistry 44 (10): 2279–2289.
Cui, X, and M Ellison. 2012. “Effects of Biodiesel Waste Glycerol on the Growth
Characteristics of Pichia Pastoris Genetically Modified to Produce Spidroin.”
International Journal of ChemTech Research 4 (2): 713–719.
Demirbas, A. 2008. “Products from Lignocellulosic Materials via Degradation Processes.”
Energy Sources, Part A: Recovery, Utilization and Environmental Effects 30: 27–37.
DuBois, Michel, K. a. Gilles, J. K. Hamilton, P. a. Rebers, and Fred Smith. 1956. “Colorimetric
Method for Determination of Sugars and Related Substances.” Analytical Chemistry
28 (3): 350–356.
Dutta, P K, Joydeep Dutta, and V S Tripathi. 2004. “Chitin and Chitosan : Chemistry,
Properties and Applications.” Journal of Scientific & Industrial Research 63: 20–31.
Feofilova, E P, D V Nemtsev, V M Tereshina, and A S Memorskaya. 2006. “Developmental
Change of the Composition and Content of the Chitin – Glucan Complex in the
Fungus Aspergillus Niger.” Applied Biochemistry and Microbiology 42: 624–628.
FitzPatrick, M, P Champagne, M Cunningham, and R Whitney. 2010. “A Biorefinery
Processing Perspective: Treatment of Lignocellulosic Materials for Production of
Value-added Products.” Bioresource Technology 101: 8915–8922.
Garleb, K A, L D Bourquin, J T Hsu, G W Wagner, S J Schmidt, and G C Fahey. 1991.
“Isolation and Chemical Analyses of Nonfermented Fiber Fractions of Oat Hulls and
Cottonseed Hulls.” Journal of Animal Science 69: 1255–1271.
Guimarães, Pedro M R, José A Teixeira, and Lucília Domingues. 2010. “Fermentation of
Lactose to Bio-ethanol by Yeasts as Part of Integrated Solutions for the Valorisation
of Cheese Whey.” Biotechnology Advances 28: 375–384.
Heikki Heikkila, E., and Kantvik Goran Hyoky. 1992. “Method for Recovering Xilose.” United
States Patent US005084104.
Heyland, Jan, Jianan Fu, Lars M Blank, and Andreas Schmid. 2010. “Quantitative Physiology
of Pichia Pastoris During Glucose-Limited High-Cell Density Fed-Batch Cultivation
for Recombinant Protein Production.” Biotecnology and Bioengeneering 107 (2): 357–
368.

Production of chitin-glucan complex by Pichia pastoris
49
Higgins, D. R., and J. M. Cregg. 1998. “Pichia Protocols.” Methods in Molecular Biology
103: 1–15.
Inan, Mehmet, and Michael M Meagi-ier. 2001. “Non-Repressing Carbon Sources for
Alcohol Oxidase ( AOX1 ) Promoter of Pichia Pastoris.” Journal of Bioscience and
Bioengineering 92: 585–589.
Ketela, Troy, Robin Green, and Howard Bussey. 1999. “Saccharomyces Cerevisiae Mid2p Is
a Potential Cell Wall Stress Sensor and Upstream Activator of the PKC1-MPK1 Cell
Integrity Pathway.” Journal of Bacteriology 181: 3330–3340.
Kim, Sang-yong, Deok-kun Oh, and Jung-hoe Kim. 1999. “Evaluation of Xylitol Production
from Corn Cob Hemicellulose Hydrolysate by Candida Parapsilosis.” Biotechnology
Letters 21: 891–895.
Klis, Frans M, Andre Boorsma, and Piet W J De Groot. 2006. “Cell Wall Construction in
Saccharomyces Cerevisiae.” Yeast 23: 185–202.
Koller, Martin, Aid Atli, Miguel Dias, Angelika Reiterer and Gerhart Braunegg. 2010. “Microbial
PHA Production from Waste Raw Materials.” In Plastics from Bacteria: Natural
Functions and Applications. Vol. 14.
Kootstra, a Maarten J, Hendrik H Beeftink, Elinor L Scott, and Johan Pm Sanders. 2009.
“Optimization of the Dilute Maleic Acid Pretreatment of Wheat Straw.” Biotechnology
for Biofuels 2: 1–14.
Krahulec, Stefan, Barbara Petschacher, Michael Wallner, Karin Longus, Mario Klimacek, and
Bernd Nidetzky. 2010. “Fermentation of Mixed Glucose-xylose Substrates by
Engineered Strains of Saccharomyces Cerevisiae : Role of the Coenzyme Specificity
of Xylose Reductase , and Effect of Glucose on Xylose Utilization.” Microbial Cell
Factories 9 (16): 1–14.
Kuranda, Klaudia, Veronique Leberre, Serguei Sokol, Grazyna Palamarczyk, and Jean
François. 2006. “Investigating the Caffeine Effects in the Yeast Saccharomyces
Cerevisiae Brings New Insights into the Connection Between TOR, PKC and
Ras/cAMP Signalling Pathways.” Molecular Microbiology 61 (5): 1147–66.
Kurtzman, C. 2005. “Description of Komagataella Phaffii Sp. Nov. and the Transfer of
Pichia Pseudopastoris to the Methylotrophic Yeast Genus Komagataella.”
International Journal of Systematic and Evolutionary Microbiology 55: 973–976.

Production of chitin-glucan complex by Pichia pastoris
50
Kurtzman, C. 2009. “Biotechnological Strains of Komagataella (Pichia) Pastoris Are
Komagataella phaYi as Determined from Multigene.” Journal of Industrial Microbiology and
Biotechnology 36: 1435–1438.
Kuyper, Marko, Maurice J Toirkens, Jasper A Diderich, Aaron A Winkler, Johannes P Van
Dijken, and Jack T Pronk. 2005. “Evolutionary Engineering of Mixed-sugar Utilization
by a Xylose-fermenting Saccharomyces Cerevisiae Strain.” FEMS Yeast Research
5: 925–934.
Laufenberg, G, B Kunz, and M Nystroem. 2003. “Transformation of Vegetable Waste into
Value Added Products.” Bioresource Technology 87: 167–198.
Leifa, F., A. Pandey, and C. Soccol. 2000. “Solid State Cultivation – an Efficient Method to
Use Toxic Agro-industrial Residues.” Journal Basic Microbiology 40: 187–197.
Lipke, Peter N, and Rafael Ovalle. 1998. “Cell Wall Architecture in Yeast : New Structure
and New Challenges.” Journal of Bacteriology 180: 3735–3740.
Liu, Henry, Xuqiu Tan, Marten Veenhuis, Dannel Mccollum, and James M Cregg. 1992. “An
Efficient Screen for Peroxisome-Deficient Mutants of Pichia Pastoris.” Journal of
Bacteriology 174: 4943 – 4951.
Marques, S., L. Alves, J.C. Roseiro, and F.M. Gírio. 2008. “Conversion of Recycled Paper
Sludge to Ethanol by SHF and SSF Using Pichia Stipitis.” Biomass and Bioenergy
32: 400–406.
Mohanty, A K, M Misra, and L T Drzal. 2002. “Sustainable Bio-Composites from Renewable
Resources : Opportunities and Challenges in the Green Materials World.” Journal of
Polymers Ant the Environment 10: 19–26.
Mohanty, A K, M Misra, and G Hinrichsen. 2000. “Biofibres , Biodegradable Polymers and
Biocomposites : An Overview.” Macromolecular Materials and Engineering 24: 1–24.
Mussato S., Machado E., Martins S., Teixeira A. 2011a. “Production , Composition , and
Application of Coffee and Its Industrial Residues.” Food and Bioprocess Technology
(4): 661–672.
Mussatto, Solange I., Livia M. Carneiro, João P.A. Silva, Inês C. Roberto, and José a. Teixeira.
2011b. “A Study on Chemical Constituents and Sugars Extraction from Spent Coffee
Grounds.” Carbohydrate Polymers 83: 368–374.

Production of chitin-glucan complex by Pichia pastoris
51
Mussatto, Solange I., Ercília M.S. Machado, Lívia M. Carneiro, and José a. Teixeira. 2012.
“Sugars Metabolism and Ethanol Production by Different Yeast Strains from Coffee
Industry Wastes Hydrolysates.” Applied Energy 92: 763–768.
Nguyen, T. H., G. H. Fleet, and P. L. Rogers. 1998. “Composition of the Cell Walls of Several
Yeast Species.” Applied Microbiology and Biotechnology 50: 206–212.
Nigam, Poonam, and Ashok Pandey. 2009. "Biotechnology for Agro-Industrial Residues
Utilization." Utilisation of Agro-Residues.
Olbrich, Hubert. 2006. “The Molasses.”
Öner, Ebru Toksoy. 2013. “Microbial Production of Extracellular Polysaccharides from
Biomass.” In Pretreatment Techniques for Biofuels and Biorefineries, 35 – 56.
Panchal, C. J. 1988. “Repression of Xylose Utilization by Glucose in Xylose-fermenting
Yeasts.” Canadian Journal of Microbiology 34 (12): 1316–1320.
Petersson, a, M Thomsen, H Hauggaardnielsen, and a Thomsen. 2007. “Potential Bioethanol
and Biogas Production Using Lignocellulosic Biomass from Winter Rye, Oilseed
Rape and Faba Bean.” Biomass and Bioenergy 31 (11-12): 812–819.
Phaff, Herman J. 2001. “Yeasts.” In Encyclopedia of Life Sciences, 1–11.
Pipatti, R, C Sharma, M Yamada, J Alves, and Q Gao. 2006. “Waste Generation,
Composition and Management Data.” In 2006 IPCC Guidelines for National Greenhouse
Gas Inventories, Volume 5.
Prescott, Lansing M, and Prescott Harley Klein. 2002. "Microbiology" 5th Edition.
Reis, M. A.M., R. Oliveira, F. Freitas, B. Chagas, and L. Cruz. 2010. “Process for the Co-
production of Chitin, Its Derivates and Polymers Containing Glucose, Mannose
And/or Galactose by the Fermentation of the Yeast Pichia Pastoris.” Int. Pat.
Application WO2010013174.
Roca, Christophe, Bárbara Chagas, Inês Farinha, Filomena Freitas, Luís Mafra, Filipe Aguiar,
Rui Oliveira, and Maria a.M. Reis. 2012. “Production of Yeast Chitin–glucan Complex
from Biodiesel Industry Byproduct.” Process Biochemistry 47 (11): 1670–1675.
Romero, I., E. Ruiz, E. Castro, and M. Moya. 2010. “Acid Hydrolysis of Olive Tree Biomass.”
Chemical Engineering Research and Design 88 (5-6): 633–640.

Production of chitin-glucan complex by Pichia pastoris
52
Sánchez, Carmen. 2009. “Lignocellulosic Residues.” Biotechnology Advances 27 (2): 185–
194.
Satyanarayana, K., G. Arizaga, and F. Wypych. 2009. “Biodegradable Composites Based on
Lignocellulosic Fibers - An Overview.” Progress in Polymer Science 34: 982–1021.
Shahidan, N H, R N Z A Rahman, T C Leow, M Rosfarizan, and M Basri. 2011. “The Effect of
Carbon Sources on the Expression Level of Thermostable L2 Lipase in Pichia
Pastoris.” African Journal of Biotechnology 10 (12): 13528–13535.
Siso, M I González. 1996. “The Biotechnological Utilization of Cheese Whey: a Review.”
Bioresource Technology 57: 1–11.
Smirnou, Dzianis, Martin Krcmar, and Eva Prochazkova. 2011. “Chitin-glucan Complex
Production by Schizophyllum Commune Submerged Cultivation.” Polish Journal of
Microbiology 60 (3): 223–228.
Sun, Ye, and Jiayang Cheng. 2002. “Hydrolysis of Lignocellulosic Materials for Ethanol
Production : a Review.” Bioresource Technology 83: 1–11.
Synowiecki, Józef, and Nadia Ali Al-Khateeb. 2003. “Production, Properties, and Some New
Applications of Chitin and Its Derivatives.” Critical Reviews in Food Science and
Nutrition 43 (2): 145–171.
Ul-Haq, I, S Ali, and J Iqbal. 2002. “Influence of Cultivation Conditions on Citrate
Production by Aspergillus Niger in a Semi-pilot-scale Plant.” Folia Microbiologica
47 (5): 511–515.
Waites, Michael J, Neil L Morgan, John S Rockey, and Gary Higton. 2001. Industrial
Microbiology : An Introduction.
Wriessnegger, T, E Leitner, M R Belegratis, E Ingolic, and G Daum. 2009. “Lipid Analysis of
Mitochondrial Membranes from the Yeast Pichia Pastoris.” Biochimica et Biophysica
Acta 1791 (3): 166–72.
Wriessnegger, Tamara, Georg Gübitz, Erich Leitner, Elisabeth Ingolic, James Cregg, Bernard J
De La Cruz, and Günther Daum. 2007. “Lipid Composition of Peroxisomes from the
Yeast Pichia Pastoris Grown on Different Carbon Sources.” Biochimica et Biophysica
Acta 1771 (4): 455–461.

Production of chitin-glucan complex by Pichia pastoris
53
7. Appendix
Calibration curves
Calibration curve for determination of glucose and xylose concentration in shake flask
experiments
Figure 7.1 Calibration curves obtained for glucose (A) and xylose (B) concentration; analysis was performed by HPLC.
y = 2.879.833,70x + 24.272,00 R² = 1,00
0,00E+00
5,00E+06
1,00E+07
1,50E+07
2,00E+07
0 1 2 3 4 5 6
Are
a
Concentration (gL-1)
y = 3.964.860,44x - 14.694,32 R² = 1,00
0,00E+00
5,00E+06
1,00E+07
1,50E+07
2,00E+07
2,50E+07
0 1 2 3 4 5 6
Are
a
Concentration (gL-1)
A
B

Production of chitin-glucan complex by Pichia pastoris
54
Calibration curve for determination of glucose and xylose concentration in batch bioreactor
experiments
Figure 7.2 Calibration curves obtained for glucose (A) and xylose (B) concentration; analysis was performed by HPLC.
y = 3.084.769,50x - 9.214,62 R² = 1,00
0,00E+00
5,00E+06
1,00E+07
1,50E+07
2,00E+07
0 1 2 3 4 5 6
Are
a
Concentration (gL-1)
y = 3.216.424,96x - 1.645,53 R² = 1,00
0,00E+00
5,00E+06
1,00E+07
1,50E+07
2,00E+07
0 1 2 3 4 5 6
Are
a
Concentration (gL-1)
A
B

Production of chitin-glucan complex by Pichia pastoris
55
Calibration curve for Dubois assay (acid hydrolysis)
Figure 7.3 Standard curves for Dubois assay.
y = 0,0125x + 0,0077 R² = 0,9833
0,0
0,2
0,4
0,6
0,8
1,0
1,2
1,4
0,0 20,0 40,0 60,0 80,0 100,0 120,0
Op
tic
al d
en
sit
y a
t 4
90
nm
Concentration (gL-1)

Production of chitin-glucan complex by Pichia pastoris
56
Calibration curve for CGC composition in Dionex
Figure 7.4 Calibration curves obtained for glucosamine (A), glucose (B) and mannose (C) concentration; analysis was
performed by HPLC (Dionex).
0,0
5,0
10,0
15,0
20,0
25,0
30,0
35,0
0,000 0,013 0,025 0,037 0,050 0,063 0,075 0,088 0,100 0,120
GlucoN External ED_1_TotalArea [nC*min]
g/L
0
20
40
60
80
100
120
140
160
180
0,000 0,025 0,050 0,075 0,100 0,125 0,150 0,175 0,200 0,225 0,250
Glucose External ED_1_TotalArea [nC*min]
g/L
0
20
40
60
80
100
120
140
0,000 0,025 0,050 0,075 0,100 0,125 0,150 0,175 0,200 0,225 0,250
Mannose External ED_1_TotalArea [nC*min]
g/L
A
B
C
y = 2,8142x +0,01689 R2 = 0,9976
y = 11,4416x + 0,03249 R2 = 0,9961
y = 7,6845x + 0,008289 R2 = 0,9984