proceeding of rasce 2015
DESCRIPTION
Proceeding of Rasce 2015TRANSCRIPT

PROCEEDINGS OFNATIONAL LEVEL CONFERENCE
ON RECENT ADVANCEMENT AND
SUSTAINABILITY IN CIVIL ENGINEERING
ORGANIZED BYDEPARTMENT OF CIVIL ENGINEERINGVELAMMAL ENGINEERING COLLEGE
10TH APRIL 2015RASCE 2015
Proceedings of the Fifth “National Conference on Recent Advancement
and Sustainability in Civil Engineering” (RASCE-2015)
10.04.2015
Convenor
Dr.R.Ganesan
Coordinators
S.Aravind
J.Alex Christopher
G.Surendar
Department of Civil Engineering
Velammal Engineering College
Ambathur-Redhills Road, Surapet,
Chennai-600066
ACKNOWLEDGEMENT
We would like to express our deep gratitude to our beloved Chairman
Shri.M.V.Muthuramalingam and respected Chief Executive Officer Shri.M.V.M
Velmurugan for their kind interest to bring out this conference proceeding.
We humbly express our sincere thanks to Dr. L. Jawahar Nesan, Advisor for being the
source of inspiration in bringing out this conference proceeding.
We express our heartfelt thanks to Dr.N.Duraipandian, Principal,Velammal Engineering
College for his support and encouragement in bringing out this proceeding.
Finally we express our immense thanks to Dr.R.Ganesan, Professor and Head of the
Department of Civil Engineering and all the Teaching faculty & Non-teaching Staff
membersof Civil Engineering Department for their kind cooperation.
Editors

CHAIRMAN’S MESSAGE
I feel proud to support the National Conference on “Recent Advancement &
Sustainability in Civil Engineering” (RASCE-2015) organized by Civil Engineering
Department on 10th
April 2015. I am glad as many eminent people from academic institutions
and young researches are going to gather in our college premises for an intellectual exchange
of information related to Recent Developments in Civil Engineering.
I hope the conference will be a grand success-providing an opportunity for all of them to
interact, connect, propose and validate their works.
Wish you all a great success.
Shri.M.V.Muthuramalingam,
Chairman, VET.

FROM CEO’S DESK
I am very glad to congratulate the Civil Engineering Department of our College for
organizing the National Conference on “Recent Advancement & Sustainability in Civil
Engineering” (RASCE-2015)
I also take this opportunity to congratulate the dignitaries who have agreed to be the
keynote speakers, the paper presenting delegates, participants, H.O.D., Faculty of our College
and all others for making it happen.
I am sure that this conference will emphasize on the recent developments in civil
engineering. Also this will inculcate the faculty members to do research in this innovative
area.
Wish you all a great success.
Shri.M.V.M.Velmurugan, BL.,
CEO, VET

PRINCIPAL MESSAGE
I am very much proud and delighted to note that the Civil Engineering Department is
bringing out Proceedings during the conduct of National Conference on “Recent
Advancement & Sustainability in Civil Engineering” (RASCE-2015).
I am sure that this conference will be a platform for the exchange of many novel and useful
ideas and will be rewarding for all the participants. I extend my best wishes and warm
felicitations to the organizers and participants. .
With best wishes,
Dr.N.Duraipandian,
Principal, VEC

FROM HOD
Welcome to “RASCE-2015” a National Conference on “Recent Advancement and
Sustainability in Civil Engineering”. This conference provides a perfect forum for students &
researchers to exchange their knowledge, experience and views in key areas in the field of
Recent Developments in Civil Engineering.
On Behalf of Conference Committee it gives me a great pleasure to welcome all
the participants to attend the conference & will return home with innovative ideas.
To conclude, I would like to thank all those participating in RASCE-2015 for
contributing to its success. I wish all the participants with stimulating discussions, numerous
new research contacts and a pleasant stay in Velammal Engineering College.
Dr.R.Ganesan,
HOD-CIVIL
CONTENTS
S.No. Title of the Paper Page
No.
1.
Studies on the Mechanical Properties of Glass Fiber Reinforced Concrete
with Using Recycled Aggregate.
-P.Ganesan, A.Jebaraj, V.Venkateshwaran, K.Vijay
01
2.
Study on the torsional effect on infilled frame an influence of different
interface materials used in condtruction industry
-S.Muthu kumar, K.S.Satyanarayanan,S.Thiagharajan
07
3.
Study on use of concrete demolition waste in uniaxially loaded columns
-S.R.Anod Remington,V.Padmapriya 13
4.
Strength properties of concrete using crumb rubber with partial
replacementof fineaggregate
-S.Selvakumar, R.Venkatakrishnaiah 21
5.
Study of water quality analysis in ambur town
-K.Waseem raza, D.Sathish kumar,
R.Arul raj, B.Anuradha,G.Karthik
28
6.
Experimental investigation on behaviour of hybrid fiber reinforced
concrete column under axial loading
- Jackson Jacob, Ms.P.Sarala, Mr.R.S.Muralitharan 34
7.
Effect of Vertical Stiffness Irregularity on Multi-Storey Shear Wall-
framed Structures using Response Spectrum Analysis
-Hema Mukundan, S.Manivel
39
8.
Behavior of Infilled Frames with Different Interface Materials
-V.THIRUMURNGAN, S.MUTHU KUMAR,WALA HUSAM AHMED,
T.P.GANESAN,K.S. SATYANARAYANAN
53
9
Experimental studies on flexural behaviour of beam using lathe waste in
sifcon
-S.Gowthami, Dr.B.Hemalatha 59
10
Study on fibre reinforced tubular beam column connection by various
connection methods
-F.S.Frieda, S.Senthil selven
65
11 Analysis of reinforced concrete girder bridge
-K.Preethi, D.Arulprakash 73
12 Study on the influence of marine algae properties use on the concrete
-Abdul raffi,S.Divya 79
13
Study on behavior of removal of cover concrete over reinforced concrete
beam
- Ch.Sowmith,S.Divya
85
S.No. Title of the Paper Page
No.
14.
Experimental investigation on interaction behaviour of rc frame with wall
panel
-N.Shifu Jahan, Ms.K.S.Divya 91
15.
Groundwater flow modeling for delineation of seawater-freshwater
interface
-Revathi.M.P, Revathee.T, Ravikumar.G
97
16.
Comprehensive study of cement mortar using manufactured sand
-D. Sivakumar, N.P. Rajamane, M. Ilango, T. Nedunchezhiyan
106
17.
Durability and mechanical characterisation of concrete using alccofines
-D.Sivakumar, T. Hemalatha, N. Shakthi Sri, T. Shobana, C. Soundarya
114
18.
Influence of kongu tree saw dust on removal of fluoride in aqueous
solution
-D.Sivakumar, R. Anand, S. Deepak, B. Hemanth Kumar
122
19.
Irrigation suitability of groundwater around Pallavaram tannery industrial
belt
-D.Sivakumar, A.N.Kandaswamy, V. Kalpana Priya, S.Hemalatha
128
20.
Size effect studies on concrete made of natural and artificial sand
-D. Sivakumar, T. Hemalatha, M. Kotteeswaran,
N. Murugan, R. Rajeshwaran
138
21.
Response of reinforced sandwich panels under lateral loading
-A.N.Kandaswamy, M. Ponvalavan, A. Jagathan Prakaash,
S. Kumarappan, D. Raj Kumar
147
22 Comparison of productivity across various construction project
-A. Mohamad Rafi, P. Jagadeesh 156
23
Effect of cryogenic treatment on cold-formed steel against corrosion
-J.Jenifar Monica, B.Bhuvaneshwari, P.Prabha,
G.S.Palani, M.N.A.Gulshan Taj 166
24.
Sustainable campus plan for an educational institution - A Case Study of
TCE, Madurai
-R.Jegan , V.Ravi Sankar
173
25.
Analysis of optimal selection of energy efficient roofing material – An
Experimental study
-R. Moorthy Dr. M. V. Molykutty
180
26.
Study on the behaviour of styrene acrylic polymer concrete
-DR.P.Asha, E.Saranyasri
187

S.No. Title of the Paper Page
No.
27. Safety management and hazards control measures in Construction
-Selvam .A, Krithika Priyadarshini 193
28.
Role of water hyacinth in zero waste generation and power generation - A
study
-Reya George.K, Dr.R.Ganesan, Alex christopher 201
29.
De-icing concrete -A study methodology
-AJ Samson, TA Rajha Rajeswaran 207
30.
Effect of change in types and location of shear wall on soft-storey
building subjected to lateral load
-Abdul haseeb, Mr.K.Dhanasekar 211
31. Green Concrete –A Review
-A.Latha, Dr.R.Ganesan,
Reya George
219

National Conference on Recent Advancement and Sustainability in Civil Engineering, 10th
April2015
RASCE 2015 1
1. Studies on the Mechanical Properties of Glass Fiber Reinforced Concrete
with Using Recycled Aggregate.
P.Ganesan1, A.Jebaraj
2, V.Venkateshwaran
3, K.Vijay
4
1Teching Fellow, Dept of Civil Engg, UCET, Tindivanam
2,3,4Final Year Students, UCET, Tindivanam
ABSTRACT
The use of Recycled Concrete Aggregate is gaining importance throughout the globe due to the
depleting source of natural aggregate and disposal problem of demolished waste. Concrete is a
versatile material with numerous applications thus by using recycled aggregate in it we can
achieve economy and sustainability, but the only problem is its brittleness. Thus this brittleness
in concrete can be overcome by dispersing fibers discretely in the concrete. The aim of this
research work is to determine the suitability of glass fibers for use in structural recycled
aggregate concrete of high strength. In this research work we have partially replaced recycled
aggregate concrete (0%, 20%, 40%, 60%) with varying percentages of glass fibers (0.02%,
0.04%, 0.06%) and have compared it with the corresponding conventional aggregate concrete.
Thus the mechanical properties of M20 grade concrete with various replacements levels of
coarse aggregate were studied and it was found that Recycled Aggregate Concrete (RAC) had
lower strength compared to Natural Aggregate Concrete (NAC) and showed an increase in
strength with the addition of fiber.
Keywords:-High strength concrete, Recycled Aggregate Concrete, Glass Fiber Reinforced
Concrete.
1. INTRODUCTION
Recycled aggregates are generally comprised of crushed inorganic materials that have been
used in the construction and demolition debris. The aim for this on – going project is to
determine the strength characteristic of recycled aggregates for application in high strength
concrete, which will provide a better understanding on the properties of concrete with recycled
aggregates, as an alternative material to natural aggregate in structural concrete [1]. Recycling
is the process of using the waste material to produce new products. Due to the advancement in
the infrastructure area and to reduce the usage of natural aggregate, the usage of recycled
aggregate is getting more and more intense. The recycled aggregates are generally from roads,
buildings, bridges, and sometimes even from certain unpredicted disasters such as, wars and
earthquakes. Due to the critical shortage of natural aggregate, the usage of demolished recycled
concrete aggregate (RCA) is increasing. Using this waste aggregate as RCA, it conserves
natural aggregate by decreasing the energy consumption and provides cost saving. Recycled
aggregates are truly the material for the future. The application of RCA has been started in
many countries for construction projects.

National Conference on Recent Advancement and Sustainability in Civil Engineering, 10th
April2015
RASCE 2015 2
2. SIGNIFICANCE OF THE PRESENT WORK
It is known from the literature that proper introduction of fibers in conventional concrete
improves both mechanical properties and durability. Therefore an attempt has been made, in
the present work to assess the mechanical properties of high strength recycled aggregate
concrete mixes containing glass fibers and to arrive at the optimum dosage of glass fibers. In
our work three different fiber contents were used to study the effect of addition of fibers on the
properties of high strength recycled aggregate concrete. The results of the present work are
encouraging and substantiate the use of the recycled aggregates and glass fibers in the
construction.
3. EXPERIMENTAL INVESTIGATION
Materials Used
Cement
Ordinary Portland cement (OPC) of 43 grade confirming to IS 8112-1989 was used for the
experimental work. The physical properties of cement are shown in Table 1.
Table 1. Physical properties of cement
S.NO Property Test Method
IS 4031
Test Result
1. Normal Consistency Vicat apparatus 32%
2. Specific gravity Specific gravity
bottle
3.14
3. Initial setting time Vicat apparatus 35 mins
4. Final setting time Vicat apparatus 320 mins
5. Fineness Seive test on sieve
no.9
5%
Fine Aggregate
The fine aggregate used in this experimental investigation was natural river sand confirming to
zone III of IS 383-1970 and having specific gravity 2.61
Natural Coarse Aggregate
Machine crushed well graded aggregates of nominal size 20mm and specific gravity 2.79 was
used as natural aggregate
Recycled Coarse Aggregate
Recycled aggregate from demolished waste was chipped and was used as recycled coarse
aggregate.

National Conference on Recent Advancement and Sustainability in Civil Engineering, 10th
April2015
RASCE 2015 3
Water
Portable water available in laboratory was used for mixing and curing the concrete specimens.
Pre Soaking Treatment
The recycle aggregates were crushed and soaked in acidic environment for 24 hours and then
washed water soaked for 24 hours and dried [2].
Test Programme
In this experimental work the concrete specimens were casted and tested according to the
standard procedure. The specimens consisted of 150 mm x 150 mm x 150 mm cubes, 500 mm
x 100 mm x 100 mm prisms and 300 mm x 150 mm cylinders. The mix design of concrete was
done according to Indian standard guidelines for the target mean strength of 27.6 N/mm2 and
the water-cement ratio is 0.5. The present study was carried out on natural aggregates by
replacing with Recycled coarse aggregate. Recycled aggregate was procured from a
demolished building at Tindivanam. The experimental work consists of three phases; first
phase consists of casting and testing of conventional concrete specimens. In the second phase
natural aggregates were replaced by recycled aggregates and tested. In the third phase to
increase the strength of the RCA specimens glass fibers were added discretely and the strengths
of the specimens were studied.
4. RESUTS AND DISSCUSIONS
The test results such as compressive strength, split tensile strength and flexural strength with
different proportions of recycled aggregate and glass fibers are discussed below,
Compressive Strength
Compressive strength is the major parameter which influences other properties of concrete. The
compressive strength of conventional aggregate concrete at 7 & 28 days were observed to be
19.33 Mpa and 28.7 Mpa. The test results for the different proportion of mixtures are listed in
the table below. From above test results it is clear that when the natural coarse aggregate is
substituted with RCA, the compressive strength is reducing. This may be due to the fact that
the failure of normal strength concrete is caused by mortar failure. Thus this decreasing
strength is improved by the addition of glass fiber.
Split Tensile Strength
Spilt tensile strength of the conventional aggregate concrete at 7 & 28 days were observed to
be 2.90 Mpa and 3.96 Mpa. The strength results of the different proportion of recycled
aggregate (0%, 20%, 40%, and 60%) for the fiber content 0.02%, 0.04% and 0.06% are listed
in the table below. Here also, when the natural coarse aggregate is substituted with RCA, the
tensile strength reduces and so fiber was added to enhance it.

National Conference on Recent Advancement and Sustainability in Civil Engineering, 10th
April2015
RASCE 2015 4
2.42 2.54 2.63 2.72
3.58 3.66 3.74 3.8
0
1
2
3
4
0% 0.02% 0.04% 0.06%
CO
MP
RE
SS
IVE
ST
RE
NG
TH
N/m
m2
PERCENTAGE OF GLASS
FIBER
VARIATION OF
COMPRESSIVE
STRENGTH WITH 20%
RCA
7 DAYS 28 DAYS
17.42 17.52 18.04 18.2
24.6 25.02 25.73 26.03
0
5
10
15
20
25
30
0 0.02%0.04%0.06%
CO
MP
RE
SS
IVE
ST
RE
NG
TH
N/m
m2
PERCENTAGE OF GLASS
FIBER
VARIATION OF
COMPRESIVE
STRENGTH WITH 40%
RCA
7 DAYS 28 DAYS
13.9 14.06 14.66 13.1
19.86 20.06 20.86 21.54
0
5
10
15
20
25
0 0.02%0.04%0.06%
CO
MP
RE
SS
IVE
ST
RE
NG
TH
N/m
m2
PERCENTAGE OF GLASS
FIBER
VARIATION OF
COMPRESIVE
STRENGTH WITH 60%
RCA
7 DAYS 28 DAYS
2.42 2.54 2.63 2.72
3.58 3.66 3.74 3.8
0
1
2
3
4
0% 0.02% 0.04% 0.06%
CO
MP
RE
SS
IVE
ST
RE
NG
TH
N/m
m2
PERCENTAGE OF GLASS
FIBRER
VARIATION OF TENSILE
STRENGTH WITH 20%
RCA
7 DAYS 28 DAYS
2.19 2.32 2.46 2.54
3.12 3.38 3.45 3.56
0
1
2
3
4
0% 0.02% 0.04% 0.06%
CO
MP
RE
SS
IVE
ST
RE
NG
TH
N/m
m2
PERCENTAGE OF GLASS
FIBRER
VARIATION OF
TENSILE STRENGTH
WITH 40% RCA
7 DAYS 28 DAYS
1.81 2.06 2.12 2.19 2.64 2.86 2.94 3.01
0
1
2
3
4
0% 0.02% 0.04% 0.06%
CO
MP
RE
SS
IVE
ST
RE
NG
TH
N/m
m2
PERCENTAGE OF GLASS
FIBRER
VARIATION OF TENSILE
STRENGTH WITH 60%
RCA
7 DAYS 28 DAYS

National Conference on Recent Advancement and Sustainability in Civil Engineering, 10th
April2015
RASCE 2015 5
Flexural Strength
Flexural strength of the conventional aggregate concrete at 7 & 28 days were observed to be
4.63 Mpa and 6.44 Mpa. The strength results of the different proportion of recycled aggregate
(0%, 20%, 40%, and 60%) for the fiber content 0.02%, 0.04% and 0.06% are listed in the table
below. Here also, when the natural coarse aggregate is substituted with RCA, the compressive
strength is reducing and so fiber was added to enhance it.
5. CONCLUSION
Based on the experimental investigations carried out on high strength glass fiber reinforced
concrete with partial replacement of natural coarse aggregate by recycle coarse aggregate, the
following conclusions are drawn:
4.27 4.36 4.42 4.5
6.12 6.22 6.29 6.36
0
1
2
3
4
5
6
7
0% 0.02% 0.04% 0.06%
CO
MP
RE
SS
IVE
ST
RE
NG
TH
N/m
m2
PERCENTAGE OF GLASS FIBRER
VARIATION OF FLEXURAL
STRENGTH WITH 20% RCA
7 DAYS 28 DAYS
3.97 4.18 4.26 4.32
5.67 5.93 6.02 6.14
0
1
2
3
4
5
6
7
0% 0.02% 0.04% 0.06%
CO
MP
RE
SS
IVE
ST
RE
NG
TH
N/m
m2
PERCENTAGE OF GLASS FIBER
VARIATION OF FLEXURAL
STRENGTH WITH 40% RCA
7 DAYS 28 DAYS
3.6 3.78 3.83 3.96
5.13 5.35 5.43 5.58
0
1
2
3
4
5
6
0% 0.02% 0.04% 0.06%
CO
MP
RE
SS
IVE
ST
RE
NG
TH
N/m
m2
PERCENTAGE OF GLASS FIBER
VARIATION OF FLEXURAL
STRENGTH WITH 60% RCA
7 DAYS 28 DAYS

National Conference on Recent Advancement and Sustainability in Civil Engineering, 10th
April2015
RASCE 2015 6
1. Thus the mechanical properties such as the compressive strength, flexural strength and
split tensile strength were enhanced with the increase in fiber content from 0.00% to 0.06% the
volume of the concrete.
2. The ductility character of the conventional concrete beams were improved by adding
glass fiber, thus indicating an improvement in the tensile strength of concrete beams.
3. The strength of RCA concrete at all fiber content are comparable to those of concrete
with conventional aggregate. Thus it clearly suggests the use of glass fibers in high strength
RCA concrete.
6. REFERENCE
1. V.Bala Krishna, M.K.M.V.Ratnam, Dr.U.Ranga Raju., An experimental study on
compressive strength of Fiber Reinforced High Strength Concrete Using recycled
Coarse Aggregate, IJERD Volume 10 Issue 12, PP.45-51.
2. G.Murali, C.M. Vivek varadhan, Gabreila Rajan, G.J. Janani, N.Shifu Jajan and
R.Ramya sri, Experimental study on reinforced aggregate concrete,IJERA, Vol.2,
Issue 2, PP.407-410.
3. K.Jagannadha Rao and T.Ahmed Khan, Suitability of glassfibers in high strength
recycled Aggregate concrete-an experimental investigatin. Asian journal of civil
engineering( Building and Housing), Volume 10, No. 6, PP 681 – 689.
4. IS:383-1970, Specifications for Coarse and Fine aggregate from natural sources for
concrete(Second revision).
5. IS:10262-2009, Recommended guidelines for concrete mix design, BIS New delhi,
India 2009.
6. IS:456-2000, Specifications for plain and reinforced concrete.
7. IS:516-1959, method of test for strength of concrete BIS indian standards
NewDelhi, India.
8. IS:5816-1999, method of test for spliting tensile strength of concrete BIS
NewDelhi.
9. IS:9399-1979, Specifications for apparatus for Flexural testing of concrete BIS New
Delhi
National Conference on Recent Advancement and Sustainability in Civil Engineering, 10th
April2015
RASCE 2015 7
2. STUDY ON THE TORSIONAL EFFECT ON INFILLED FRAME AN
INFLUENCE OF DIFFERENT INTERFACE MATERIALS USED IN
CONDTRUCTION INDUSTRY
1S.Muthu Kumar,
2K.S.Satyanarayanan,
3S.Thiagharajan
1Ph.D Research Scholar, Department of Civil Engineering, SRM University
2Professor, Department of Civil Engineering, SRM University
3P.G. Student, Structural Engineering, SRM University
ABSTRACT
Multi storied structural failures under earthquake loads due to torsional effect are common in
the case of structural irregularity. Some of the factors that introduce structural irregularity
include provision of infilling walls at only selected bays. This may lead to both mass and
stiffness irregularities by the presence or absence of infills. Even if the infilling is carried out
symmetrically there can be openings in the walls for door or windows or ventilators. It is
observed during the earthquake failures that even this type of dissimilarity can lead to torsional
failures and local shear failure of columns. In recent times use of different interface materials
such as lead, cork, etc. is in vogue so as to provide a gap between the frame and infill to avoid
load transfer as well as to obtain thermal insulation for the rooms. It has been found out from
earlier works that there can be a significant change in the infilled frame stiffness by using
different interface materials. A practical 3D building whose parallel planes are infilled
symmetrically but by using interface materials differently can lead to stiffness irregularity.
Hence in this study the influence of inclusion of interface materials such as lead, cork are tried.
Analytical studies of a 3D one-fourth scaled model infilled frame which is infilled on parallel
planes but with different interface materials in each plane are carried out. The results of
stiffness and chord rotation are compared for lateral static monotonic loading condition.
Keywords: Structural stiffness irregularity, Infill opening, Seismic resistance, Brick masonry,
Torsional effects.
1. General:
The recent year have seen rapid increase in the growth of multi-storied buildings both in
density as well as in height. As the height grows the buildings suffer from increased lateral
loads due to wind or earthquake forces. In order to ensure the lateral sway is under durable
limits as prescribed by the human comfort criteria lateral load resisting system are used. It has
been long established system that the filler walls interact compositely with the bounding
frame and evolve into an efficient and economical system, named as infilled frames under the
action of inplane lateral loads.
The aseismic design criteria aims at minimizing vertical and horizontal irregularity in the
structural system to avoid torsional mode of failure of the system under earthquake loads.
The one of the major reasons for stiffness irregularity is due to the parallel frames that have
different in-plane lateral stiffness. In practice this may be caused even in otherwise in
symmetric build by the alteration of frame stiffness by factors such as presence of infill,
presence of door and windows opening in the infill, use of different interface materials like
rubberized cork, lead, etc… in the plane of cement mortar in interior frames.
National Conference on Recent Advancement and Sustainability in Civil Engineering, 10th
April2015
RASCE 2015 8
2. Literature Review:
Experimental literature have shown that laterally loaded frames, tend to separate from the
infill on windward lower and leeward upper corners of the infill panels, causing compressive
contact stress to develop between frame and infill. Recognizing this behaviour, the stiffness
contribution of the infill is represented with an equivalent compression strut connecting along
the loaded direction.
From the literature review, it is found that not much at work has been done to quantify the
effect of use of different interface materials on the behaviour of infilled frames. It is
significance to have this knowledge so as to evaluate the degree of stiffness irregularity
introduction practical building.
From literature review, it is observed that majority of the work has been carried out on
infilled frame made of steel frames with concrete wall panels, short column effects, and open
ground storey in 2D RC frames which is conventionally used in present day construction.
In the present work an attempt is made to study the torsional effect on absence of infill panel
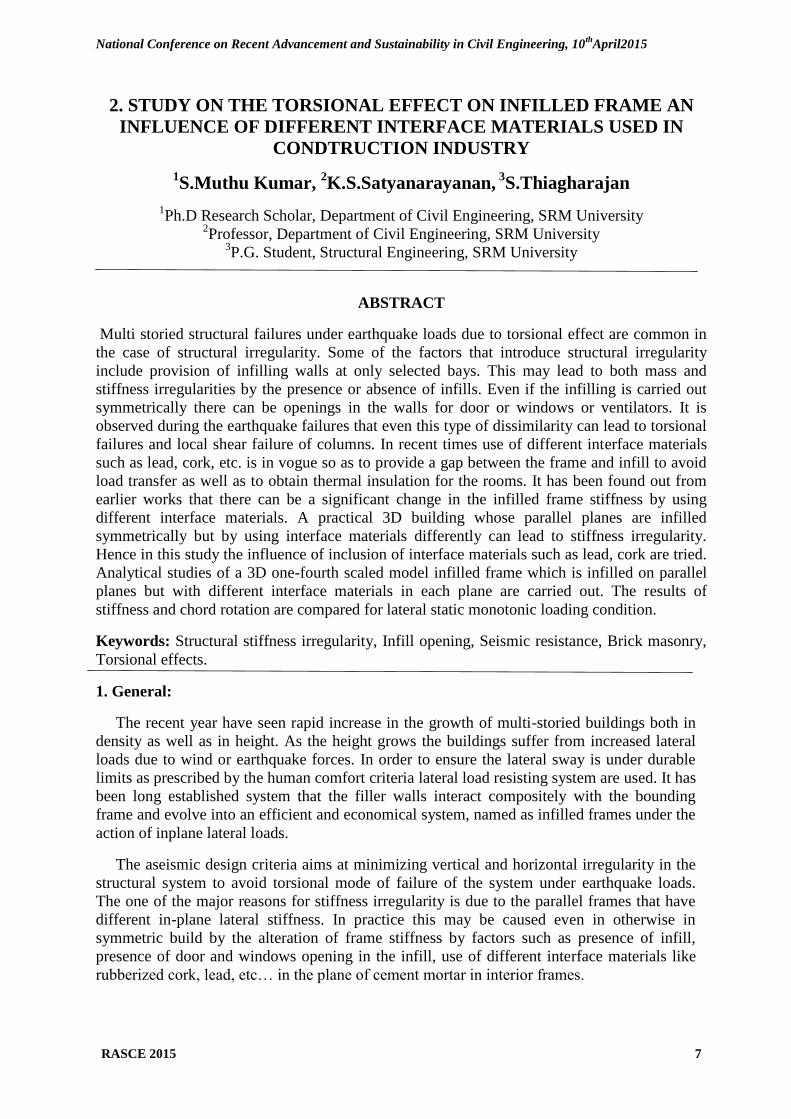
and combination of interface materials on the behaviour of brick masonry infilled RC frame
under lateral loading, using SAP2000 software of finite element analysis. The general view of
openings in infilled of RC frame is shown in figure 1.
Figure 1. Typical infilled frame
2. Details of Frames
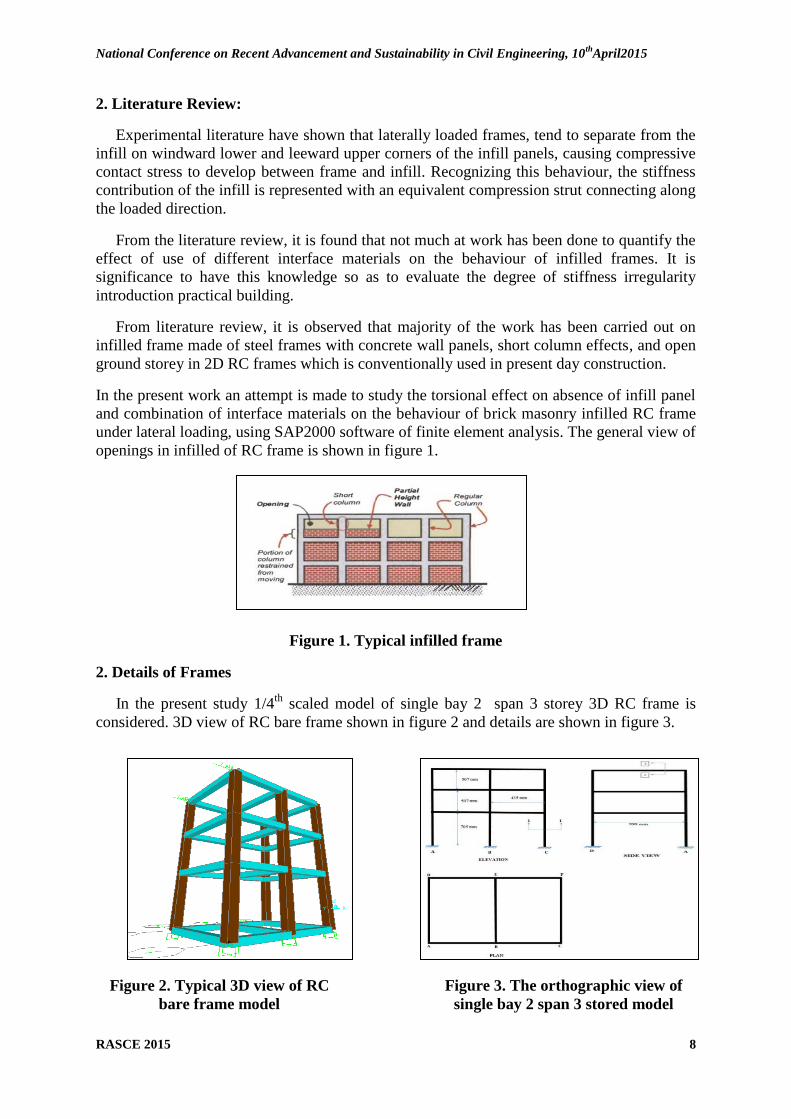
In the present study 1/4th
scaled model of single bay 2 span 3 storey 3D RC frame is
considered. 3D view of RC bare frame shown in figure 2 and details are shown in figure 3.
Figure 3. The orthographic view of
single bay 2 span 3 stored model
Figure 2. Typical 3D view of RC
bare frame model

National Conference on Recent Advancement and Sustainability in Civil Engineering, 10th
April2015
RASCE 2015 9
The scaled infill panels that are made 435 mm × 507 mm and 435 mm × 705 mm in span
direction and 700 mm × 507 mm and 700 mm × 705 mm in bay direction. The thickness of
the infill panel is taken as 60 mm. The 2 percentage of steel used for RC beam and column
for study. The loading is applied on stronger direction.
3. Element Discretization:
In the FEM analysis the structural elements models are discretized according to the
predefined properties of elements. The reinforced concrete frame members are represented by
two noded linear beam link element having six degrees of freedom at each node, i.e., three
translational and three rotational degrees of freedom (ux, uy, uz and Rx, Ry, Rz). The brick
masonry panel is represented as a four noded plane stress rectangular element. The interface
between RC frame and the masonry panel represented by a four noded plane stress
rectangular element. The concertized connection of RC frame and interface medium by a
linear spring elements of constant stiffness with 3 degrees of freedom at each node is shown
in figure 4.
Figure 4. Elements used
The discretisation of the infill panel is done by helping the element aspect ratio of 1:1.2
through by 8 × 8 grid as the size of infill panel in 3D Frame.
4. Material Properties:
Materials and interface properties are adopted from the available literature [11] are given
in table 1 and table 2.
Table 1. Properties of materials for frame and infill
Materials Modulus of elasticity
(kN/mm2)
Poisson’s ratio
()
Concrete
20 0.2
Reinforcement
MS – steel
200 0.2
Infill
(brick masonry)
18.5 0.15

National Conference on Recent Advancement and Sustainability in Civil Engineering, 10th
April2015
RASCE 2015 10
Interface
Elements
Parameters
Table 2. Properties of Interface Materials
Mortar
Lead
Cork
Density
(kN/m3)
18 111.2 1.765
Modulus of Elasticity
(N/mm2)
27386 8000 20
Poisson’s ratio 0.15 0.447 0.097
Coefficient of Thermal
Expansion /C
1 × 10⁻⁶
2.9 ×10⁻⁵
4×10⁻⁵
Compressive Strength
(N/mm2)
30 20 0.25
5. Analytical Investigation:
Analytical studies of a 3D one-fourth scaled model infilled frame which is infilled or
without infill on parallel planes but with different interface materials in each plane are carried
out. The results of parallel plane stiffness and cord rotation are compared for lateral static
monotonic loading condition. The discretization 2D view of RC infilled frame at lateral and
longitudinal directions shown in figure 5.
Figure 5. The discretization 2D view of RC infilled frame of lateral & longitudinal
directions

National Conference on Recent Advancement and Sustainability in Civil Engineering, 10th
April2015
RASCE 2015 11
5.1 Case study an interface:
From the different case studies it is know that stiffness of frame varies as there is
presence or absence of infill and difference in interface material. The pattern of case study as
shown in figure 6 and list of cases analyzed is as shown in table 3.
Table 3. List of case analysis
Case No. Longitudinal Direction Lateral Direction
Notation
point A B 1 2 3
1 CM CM CM CM CM
2 CM CM L L L
3 CM CM Co Co Co
4 L L CM CM CM
5 L L L L L
6 L L Co Co Co
7 Co Co CM CM CM
8 Co Co L L L
9 Co Co Co Co Co
10 CM L CM CM CM
11 CM L L L L
12 CM L Co Co Co
13 L Co CM CM CM
14 L Co L L L
15 L Co Co Co Co
16 Co CM CM CM CM
17 Co CM L L L
18 Co CM Co Co Co
19 No Infill CM CM CM CM
20 No Infill L L L L
21 No Infill Co Co Co Co
CM – Cement mortar L – Lead Co – Cork
Figure 6. Loading Pattern
6. Results:
The results are presented as parallel planes stiffness along the loading direction and
compared by means of beam chord rotation as torsional effect on buildings. The relative
stiffness between the parallel planes as shown in figure 7.
National Conference on Recent Advancement and Sustainability in Civil Engineering, 10th
April2015
RASCE 2015 12
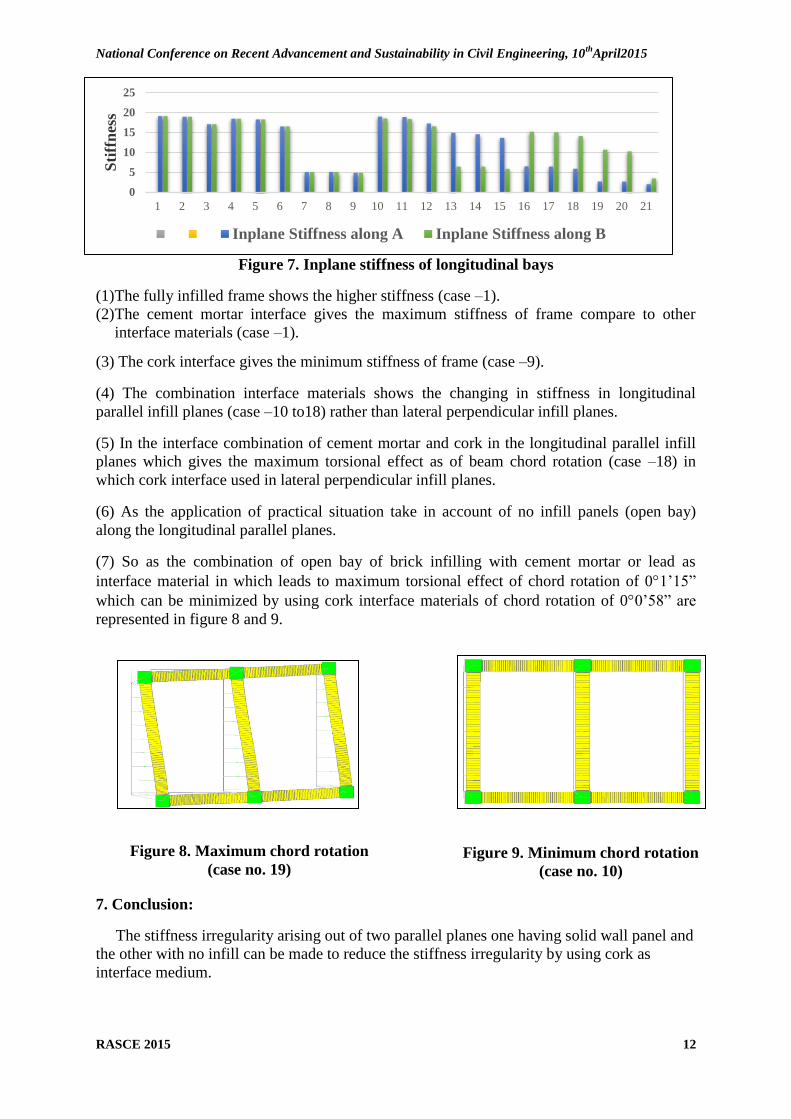
Figure 7. Inplane stiffness of longitudinal bays
(1) The fully infilled frame shows the higher stiffness (case –1).
(2) The cement mortar interface gives the maximum stiffness of frame compare to other
interface materials (case –1).
(3) The cork interface gives the minimum stiffness of frame (case –9).
(4) The combination interface materials shows the changing in stiffness in longitudinal
parallel infill planes (case –10 to18) rather than lateral perpendicular infill planes.
(5) In the interface combination of cement mortar and cork in the longitudinal parallel infill
planes which gives the maximum torsional effect as of beam chord rotation (case –18) in
which cork interface used in lateral perpendicular infill planes.
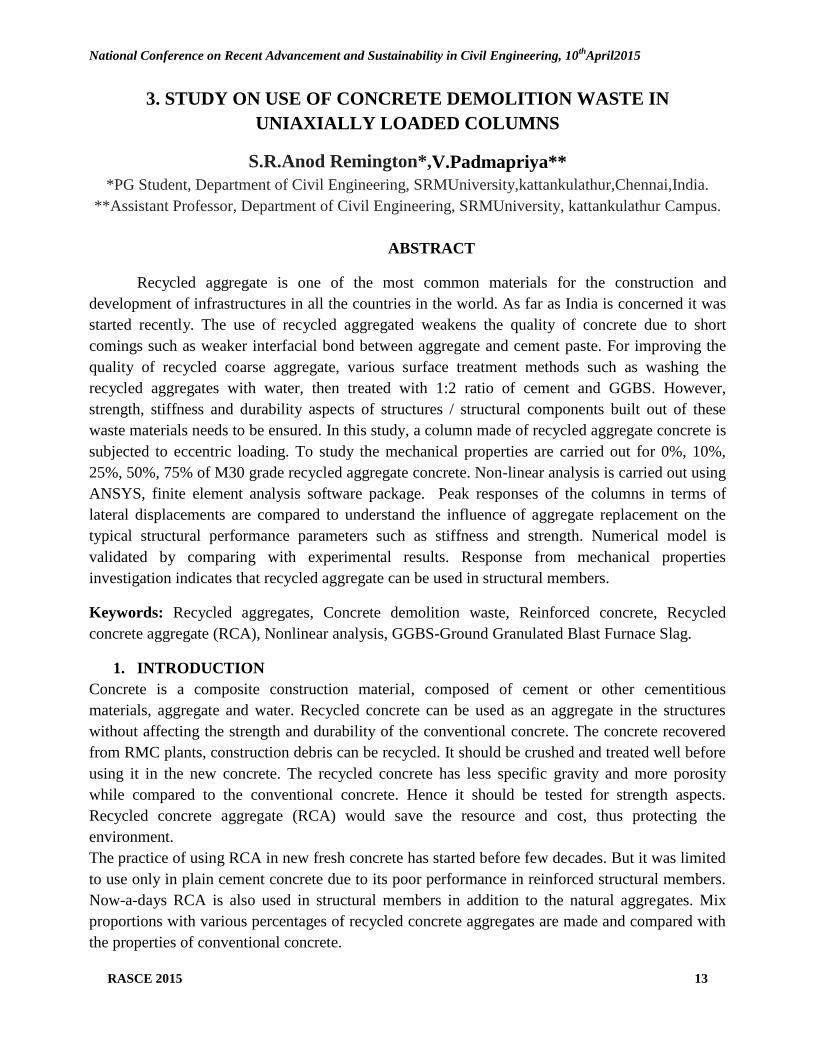
(6) As the application of practical situation take in account of no infill panels (open bay)
along the longitudinal parallel planes.
(7) So as the combination of open bay of brick infilling with cement mortar or lead as
interface material in which leads to maximum torsional effect of chord rotation of 01‘15‖
which can be minimized by using cork interface materials of chord rotation of 00‘58‖ are
represented in figure 8 and 9.
7. Conclusion:
The stiffness irregularity arising out of two parallel planes one having solid wall panel and
the other with no infill can be made to reduce the stiffness irregularity by using cork as
interface medium.
0
5
10
15
20
25
1 2 3 4 5 6 7 8 9 10 11 12 13 14 15 16 17 18 19 20 21
Sti
ffn
ess
Inplane Stiffness along A Inplane Stiffness along B
Figure 8. Maximum chord rotation
(case no. 19)
Figure 9. Minimum chord rotation
(case no. 10)
National Conference on Recent Advancement and Sustainability in Civil Engineering, 10th
April2015
RASCE 2015 13
3. STUDY ON USE OF CONCRETE DEMOLITION WASTE IN
UNIAXIALLY LOADED COLUMNS
S.R.Anod Remington*,V.Padmapriya**
*PG Student, Department of Civil Engineering, SRMUniversity,kattankulathur,Chennai,India.
**Assistant Professor, Department of Civil Engineering, SRMUniversity, kattankulathur Campus.
ABSTRACT
Recycled aggregate is one of the most common materials for the construction and
development of infrastructures in all the countries in the world. As far as India is concerned it was
started recently. The use of recycled aggregated weakens the quality of concrete due to short
comings such as weaker interfacial bond between aggregate and cement paste. For improving the
quality of recycled coarse aggregate, various surface treatment methods such as washing the
recycled aggregates with water, then treated with 1:2 ratio of cement and GGBS. However,
strength, stiffness and durability aspects of structures / structural components built out of these
waste materials needs to be ensured. In this study, a column made of recycled aggregate concrete is
subjected to eccentric loading. To study the mechanical properties are carried out for 0%, 10%,
25%, 50%, 75% of M30 grade recycled aggregate concrete. Non-linear analysis is carried out using
ANSYS, finite element analysis software package. Peak responses of the columns in terms of
lateral displacements are compared to understand the influence of aggregate replacement on the
typical structural performance parameters such as stiffness and strength. Numerical model is
validated by comparing with experimental results. Response from mechanical properties
investigation indicates that recycled aggregate can be used in structural members.
Keywords: Recycled aggregates, Concrete demolition waste, Reinforced concrete, Recycled
concrete aggregate (RCA), Nonlinear analysis, GGBS-Ground Granulated Blast Furnace Slag.
1. INTRODUCTION
Concrete is a composite construction material, composed of cement or other cementitious
materials, aggregate and water. Recycled concrete can be used as an aggregate in the structures
without affecting the strength and durability of the conventional concrete. The concrete recovered
from RMC plants, construction debris can be recycled. It should be crushed and treated well before
using it in the new concrete. The recycled concrete has less specific gravity and more porosity
while compared to the conventional concrete. Hence it should be tested for strength aspects.
Recycled concrete aggregate (RCA) would save the resource and cost, thus protecting the
environment.
The practice of using RCA in new fresh concrete has started before few decades. But it was limited
to use only in plain cement concrete due to its poor performance in reinforced structural members.
Now-a-days RCA is also used in structural members in addition to the natural aggregates. Mix
proportions with various percentages of recycled concrete aggregates are made and compared with
the properties of conventional concrete.

National Conference on Recent Advancement and Sustainability in Civil Engineering, 10th
April2015
RASCE 2015 14
Structural members are generally subjected to combined forces, of which torsion, bending and
shear are important. Reinforcements are provided both longitudinally and transversely to resist
these actions.
In the present work, reinforced concrete column that are made with recycled concrete as
aggregate are subjected to eccentric loading and to find the buckling of column. The result obtained
will be compared with the behavior of RC columns of conventional concrete.
1.1.RECYCLED AGGREGATE
The use of recycled aggregate in concrete is gaining momentum these days. In the years to
come the recycled aggregate concrete may become the need of the day. The waste concrete can be
produced from a number of different sources. Many concrete structures like building, bridges, side
walls and roads are razed after a period of time into their service life for purpose of replacement or
landscape changes. Other sources of waste include natural disasters like earthquakes, avalanches,
and tornadoes. All these contribute to vast quantities of waste concrete that must be managed in
some way.
Most of the waste materials produced by demolishing structures are disposed by dumping
them as landfill or for reclaiming land. But with the demand for land increasing day by day, the
locations, capacity and width of the land that can receive waste materials are becoming limited. In
addition to that, the cost of transportation for disposal makes a major problem. Hence, reuse of
demolition waste appears to be an effective solution, it is the most appropriate and large-scale use
to produce concrete for new construction. After the Second World War, a number of European
countries like Germany, England, Netherlands and Japan made their attempts to study and reuse
demolition materials in the construction of civil engineering works.
An existing plant for the production of crushed – rock aggregate, comprising primary and
secondary crusher and screens were used to produce recycled concrete aggregate in various size
fractions, 20-10, 10-5 and <5 mm.
2. SPECIMEN DETAILS
2.1. Cube Specimens
Cube of size 150 X 150 X 150 mm is used for making both conventional concrete and
recycled concrete specimens.
2.2. Cylinder Specimens
Cylinders of 150mm diameter and 300mm height are used for making both conventional
concrete and recycled concrete Specimens.
2.3. Disk Specimens
Disk of 150mm diameter and 50 mm height are used for making both conventional concrete
and recycled concrete Specimens.
National Conference on Recent Advancement and Sustainability in Civil Engineering, 10th
April2015
RASCE 2015 15
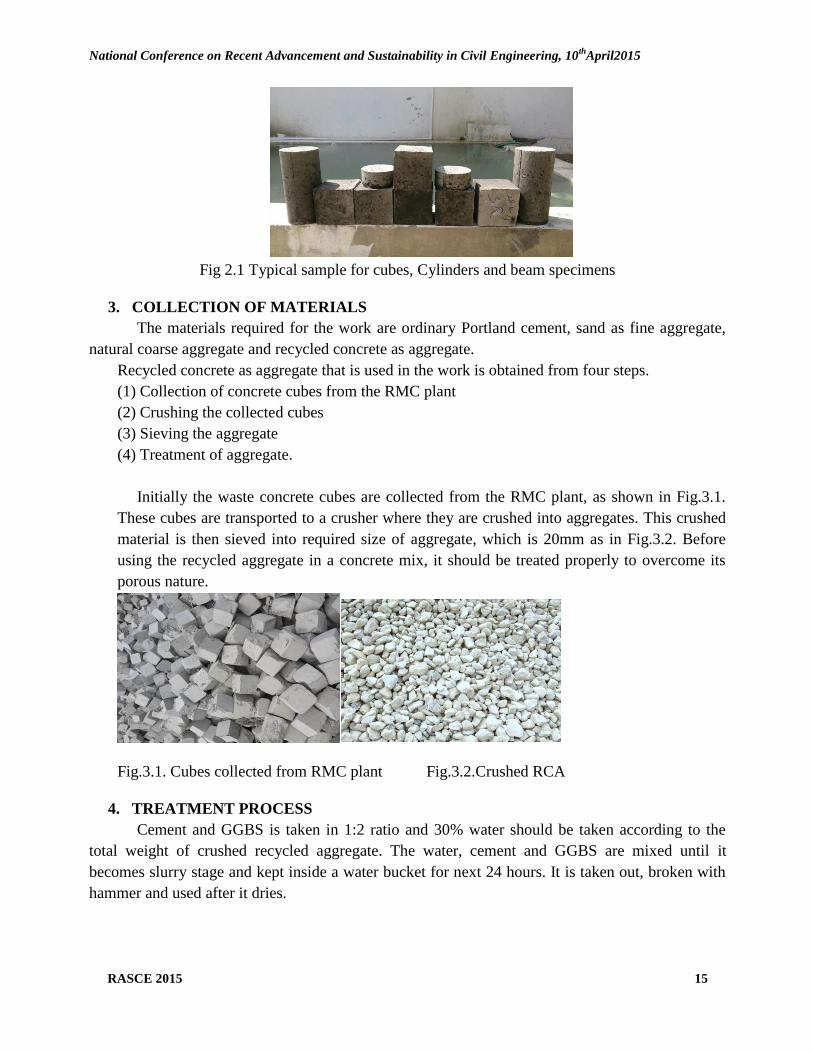
Fig 2.1 Typical sample for cubes, Cylinders and beam specimens
3. COLLECTION OF MATERIALS
The materials required for the work are ordinary Portland cement, sand as fine aggregate,
natural coarse aggregate and recycled concrete as aggregate.
Recycled concrete as aggregate that is used in the work is obtained from four steps.
(1) Collection of concrete cubes from the RMC plant
(2) Crushing the collected cubes
(3) Sieving the aggregate
(4) Treatment of aggregate.
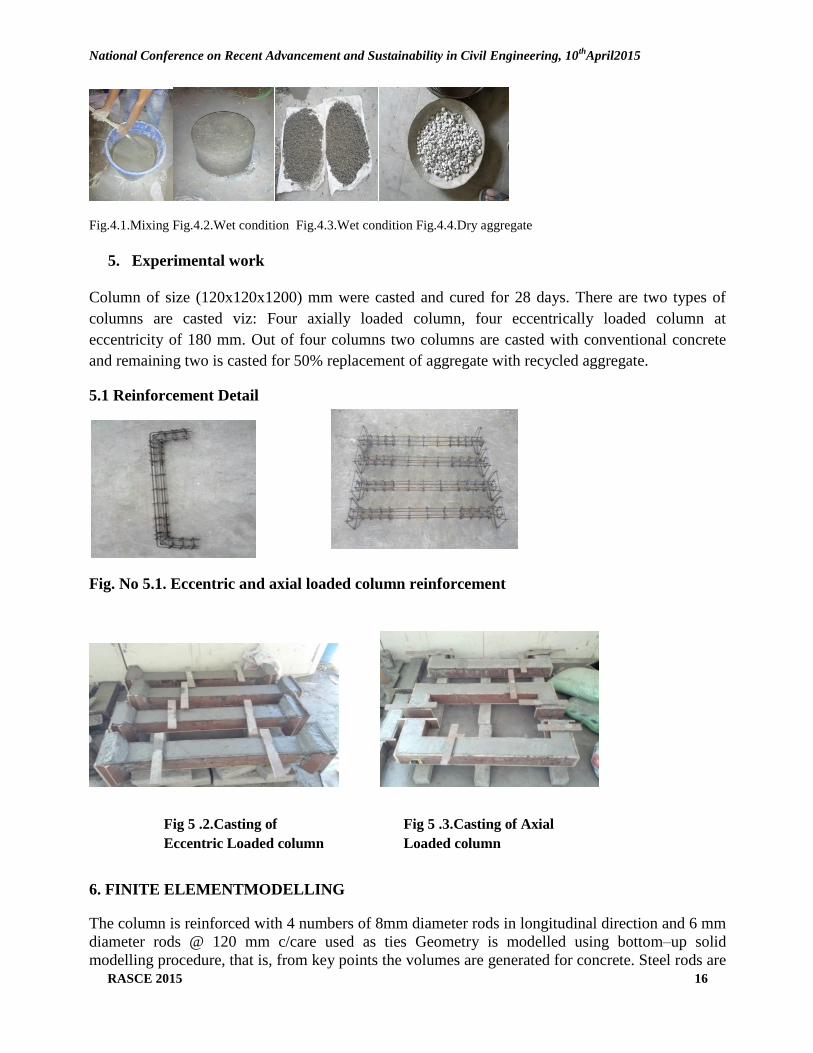
Initially the waste concrete cubes are collected from the RMC plant, as shown in Fig.3.1.
These cubes are transported to a crusher where they are crushed into aggregates. This crushed
material is then sieved into required size of aggregate, which is 20mm as in Fig.3.2. Before
using the recycled aggregate in a concrete mix, it should be treated properly to overcome its
porous nature.
Fig.3.1. Cubes collected from RMC plant Fig.3.2.Crushed RCA
4. TREATMENT PROCESS
Cement and GGBS is taken in 1:2 ratio and 30% water should be taken according to the
total weight of crushed recycled aggregate. The water, cement and GGBS are mixed until it
becomes slurry stage and kept inside a water bucket for next 24 hours. It is taken out, broken with
hammer and used after it dries.
National Conference on Recent Advancement and Sustainability in Civil Engineering, 10th
April2015
RASCE 2015 16
Fig.4.1.Mixing Fig.4.2.Wet condition Fig.4.3.Wet condition Fig.4.4.Dry aggregate
5. Experimental work
Column of size (120x120x1200) mm were casted and cured for 28 days. There are two types of
columns are casted viz: Four axially loaded column, four eccentrically loaded column at
eccentricity of 180 mm. Out of four columns two columns are casted with conventional concrete
and remaining two is casted for 50% replacement of aggregate with recycled aggregate.
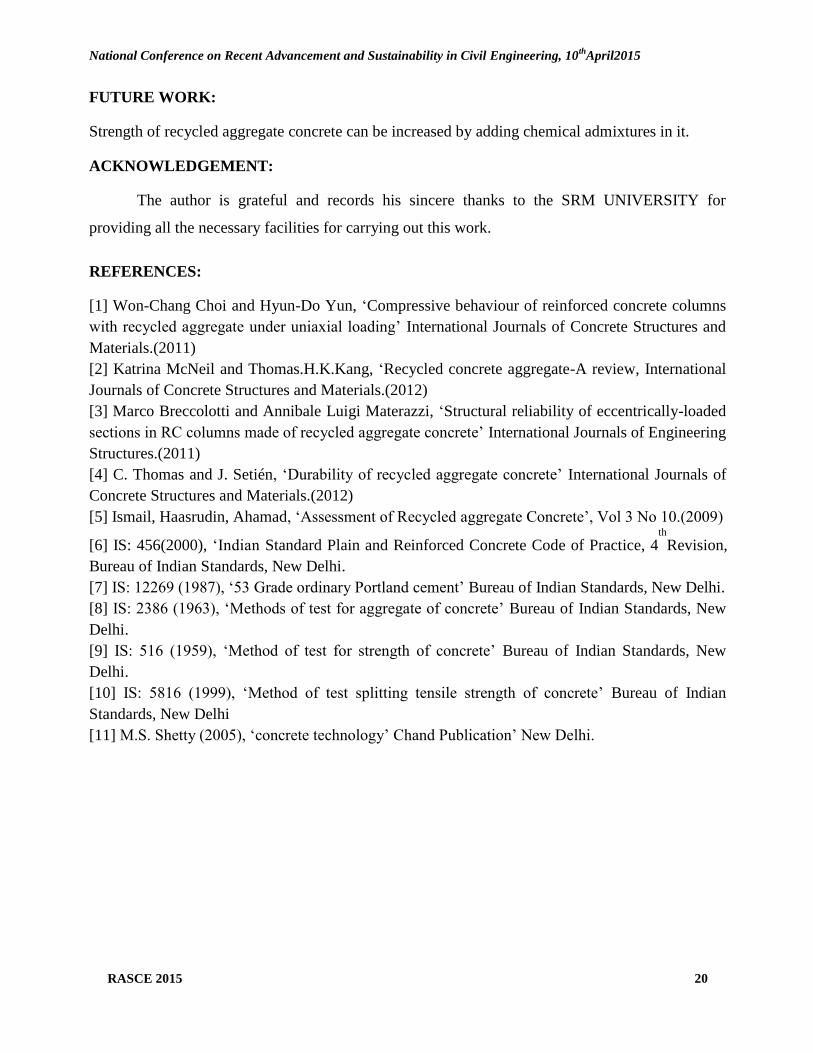
5.1 Reinforcement Detail
Fig. No 5.1. Eccentric and axial loaded column reinforcement
6. FINITE ELEMENTMODELLING
The column is reinforced with 4 numbers of 8mm diameter rods in longitudinal direction and 6 mm
diameter rods @ 120 mm c/care used as ties Geometry is modelled using bottom–up solid
modelling procedure, that is, from key points the volumes are generated for concrete. Steel rods are
Fig 5 .2.Casting of
Eccentric Loaded column
Fig 5 .3.Casting of Axial
Loaded column

National Conference on Recent Advancement and Sustainability in Civil Engineering, 10th
April2015
RASCE 2015 17
modelled using line element. SOLID 65 shown in Fig. 7.1,is a three dimensional element, which
has three degrees of freedom per node. It is an eight node orthotropic element that allows
translation, deflection and can withstand large strain capabilities. The element has the capability to
model crushing and cracking. For reinforcing steel rods, LINK 8 elements shown in Fig.2 are used.
As LINK 8 elements are of two dimensional elements, areas of the rods were given as real
constants. It can take only axial tension and compression.
Fig.6.1.Solid 65 element
As per finite element concept, the model is discretized into very fine elements of size 20mm x
20mm.Free and mapped meshing are used. This type of mesh divides the full model into uniform
size elements. Similarly for the modelling of steel reinforcement, line mesh serves this purpose.
This composite structure is modelled by discrete element approach in which concrete and steel acts
together. In this case, the bond slip effect is neglected. The element connectivity was ensured
before solving. The boundary conditions are given after meshing. At bottom the column is entirely
fixed. At top the load is applied. Then non linear solution options are given. The analysis is
performed using Newton–Raphson solution procedure. Frontal solver is used.
Fig.6.3.Meshed model with boundary conditions
7. RESULT AND DISCUSSION
As per IS 10262: 2009 and IS 456:2000, the concrete mix design was carried out for
concrete grade M30. The conventional concrete cubes, cylinders and beams was casted and tested.
The average compressive strength obtained after 7 and 28 days are 25.01 N/mm2 and
39.03N/mm2respectively.
Fig.6.2. Cross Section of Column

National Conference on Recent Advancement and Sustainability in Civil Engineering, 10th
April2015
RASCE 2015 18
The average compressive strength of 50% recycled obtained 7 and 28 days are 24.00 N/mm2 and
36.28 N/mm2
respectively. The average split tensile strength obtained after 7 and 28 days are 2.35
N/mm2
and 3.68 N/mm2respectively. The average split tensile strength of 50% recycled obtained 7
and 28 days are 2.22 N/mm2
and 3.59 N/mm2respectively. Theoretical values obtained for all the
tests conducted satisfies the code provision for the concrete grade M30.
Table 7.1.Properties of Normal and Recycled aggregate:
S.No characteristics Normal Coarse
Aggregate
Before treatment
RAC
After treatment
RAC
1 Specific gravity 2.71 2.59 2.63
2 Crushing strength 19.77% 18.77% 18076%
3 Percentage of wear 4.9% 5.9% 6%
4 Impact strength 25.53 Mpa 23.65 Mpa 24.20 Mpa
Table 7.2.Experimental work and test results of Normal and Recycled aggregate:
Content 0% 10% 25% 50% 75%
7
days
28
days
7
days
28
days
7
days
28
days
7
days
28
days
7
days
28
days
Compressive
strength
N/mm2
25.01 39.03 24.84 37.82 24.51 37.01 24.00 36.28 19.90 28.98
Tensile
strength
N/mm2
2.35 3.68 2.29 3.65 2.28 3.63 2.22 3.59 1.99 2.98
Modulus of
elasticity
N/mm2
18.5 28.42 18.49 28.20 18.01 28.03 18.01 26.53 17.32 24.01
Table 7.3 Impact Strength
S.No Concrete type 7days impact
strength
28 days impact
strength
Initial Final Initial Final
1 Conventional concrete 58 61 132 134
2 10% 57 59 115 118
3 25% 55 58 104 107
4 50% 50 53 96 99
5 75% 38 39 62 64

National Conference on Recent Advancement and Sustainability in Civil Engineering, 10th
April2015
RASCE 2015 19
Fig.7.1. Comparison of 7 & 28 days compression strength of Conventional Concrete and RAC.
Fig.7.2.Comparison of 7 days tensile strength of Conventional Concrete and RAC
.
Fig.7.3. Comparison of 7&28 day‘s modulus of elasticity
CONCLUSION:
The results shows that the compressive strength, tensile strength and young‘s modulus of recycled
aggregate concrete is reduced by 7.5%, 2.5% and 7% with that of conventional concrete
respectively. Stiffness of columns with recycled aggregate concrete is reduced by 10% when
compared with that of columns with conventional concrete. The mechanical properties of concrete
with normal aggregate and with recycled aggregate concrete show similar performance and hence it
can be used for building structural elements. Tensile strength and modulus of elasticity are same
for normal concrete and treated recycled concrete.
0
10
20
30
40
50
0% 10% 25% 50% 75%
7days
28days
0
1
2
3
4
0% 10% 25% 50% 75%
7 days
28 days
0
5
10
15
20
25
30
35
0% 10% 25% 50% 75%
7days
28days
National Conference on Recent Advancement and Sustainability in Civil Engineering, 10th
April2015
RASCE 2015 20
FUTURE WORK:
Strength of recycled aggregate concrete can be increased by adding chemical admixtures in it.
ACKNOWLEDGEMENT:
The author is grateful and records his sincere thanks to the SRM UNIVERSITY for
providing all the necessary facilities for carrying out this work.
REFERENCES:
[1] Won-Chang Choi and Hyun-Do Yun, ‗Compressive behaviour of reinforced concrete columns
with recycled aggregate under uniaxial loading‘ International Journals of Concrete Structures and
Materials.(2011)
[2] Katrina McNeil and Thomas.H.K.Kang, ‗Recycled concrete aggregate-A review, International
Journals of Concrete Structures and Materials.(2012)
[3] Marco Breccolotti and Annibale Luigi Materazzi, ‗Structural reliability of eccentrically-loaded
sections in RC columns made of recycled aggregate concrete‘ International Journals of Engineering
Structures.(2011)
[4] C. Thomas and J. Setién, ‗Durability of recycled aggregate concrete‘ International Journals of
Concrete Structures and Materials.(2012)
[5] Ismail, Haasrudin, Ahamad, ‗Assessment of Recycled aggregate Concrete‘, Vol 3 No 10.(2009)
[6] IS: 456(2000), ‗Indian Standard Plain and Reinforced Concrete Code of Practice, 4th
Revision,
Bureau of Indian Standards, New Delhi.
[7] IS: 12269 (1987), ‗53 Grade ordinary Portland cement‘ Bureau of Indian Standards, New Delhi.
[8] IS: 2386 (1963), ‗Methods of test for aggregate of concrete‘ Bureau of Indian Standards, New
Delhi.
[9] IS: 516 (1959), ‗Method of test for strength of concrete‘ Bureau of Indian Standards, New
Delhi.
[10] IS: 5816 (1999), ‗Method of test splitting tensile strength of concrete‘ Bureau of Indian
Standards, New Delhi
[11] M.S. Shetty (2005), ‗concrete technology‘ Chand Publication‘ New Delhi.
National Conference on Recent Advancement and Sustainability in Civil Engineering, 10th
April2015
RASCE 2015 21
4. STRENGTH PROPERTIES OF CONCRETE USING CRUMB
RUBBER WITH PARTIAL REPLACEMENT OF FINE
AGGREGATE
S.Selvakumar1, R.Venkatakrishnaiah
2
P.G. Student, Department of Civil Engineering, Adhiparasakthi Engineering College,
Melmaravathur, India1
Associate Professor, Department of Civil Engineering, Adhiparasakthi Engineering College,
Melmaravathur, India2
ABSTRACT
Concrete is most widely used building material in the world, as well as the largest user of natural
resources with annual consumption of 12.6 billion tons. Basically it consists of aggregates
which are bonded together by cement and water. The major part of concrete besides the cement
is the aggregate. Aggregate include sand and crushed stone / Gravel. Use of these conventional
materials in concrete is likely to deplete the resources unless there is a suitable substitute.
Rubber which is generated in large quantities as waste does not have useful disposal till now.
But rubber is found to possess properties that are required for viable replacement of fine
aggregate in concrete. Hence we in this project have aimed to study the effectiveness of rubber
as substitute for fine aggregate and utilize the crumb rubber tyres in concrete, to minimize global
warming. Aggregate properties viz., specific gravity, water absorption, acid resistance were to be
conducted to ascertain the properties concrete specimens were to be casted and tested for
concrete mix with various percentage of replacement (5%,10%,15% &20%) and its viability for
replacement are discussed in this project.
Key words: Crumb rubber, Compressive strength, Splitting tensile strength, Flexural Strength,
Fine aggregate.
I. INTRODUCTION
The use of rubber product is increasing every year in worldwide. India is also one the
largest country in population exceeds 100cr. So the use of vehicles also increased, according to
that the tyres for the vehicles also very much used and the amount of waste of tyre rubber is
increasing. This creates a major problem for the earth and their livings. For this issue, the easiest
and cheapest way of decomposing of the rubber is by burning it. This creates smoke pollution
and other toxic emission and it create global warming. Currently 75-80% of scrap tyres are
buried in landfills. Only 25% or fewer are utilized as a fuel substitute or as raw material for the
manufacture of a number of miscellaneous rubber goods. Burying scrap tyres in landfills is not
only wasteful, but also costly. Disposal of whole tyre has been banned in the majority of landfill
operations because of the bulkiness of the fires and their tendency to float to the surface with

National Conference on Recent Advancement and Sustainability in Civil Engineering, 10th
April2015
RASCE 2015 22
time. Thus, tyres must be shredded before they are accepted in most landfills.So many recycling
methods for the rubber tyre are carried according to the need. From this one of the processes is to
making the tyre rubber in to crumb rubber. It is used in many works such as Road construction,
Mould making etc
Ilker Bekir Topcu et al(1995) proposed the concrete was modified by mixing with crumb rubber
in coarse aggregate in the ratio of 15%, 30% and 45%. In this study the changes of the properties
of rubberized concrete were investigated according to the terms of both size and amount of
rubber chips added. In this the physical and mechanical properties were determined according to
that the stress strain diagram were developed from that the toughness value and the plastic and
elastic energy capacities were determined. Fattuhi et al(1996) proposed that, the cement paste, mortar, and concrete (containing OPC or
OPC and PFA) mixes were prepared using various proportions of either rubber crumb or low-
grade rubber obtained from shredding scrap tyres. Properties examined for the 32 mixes prepared
included density, compressive strength, impact and fire resistances, and nailability. Results
showed that density and compressive strength of various mixes were reduced by the addition of
rubber. (Rubber type had only marginal effect.) Density varied between about 1300 and 2300
kg/m3. Compressive strength reduced by 70% when the proportion of rubber to total solid
content by mass of concrete reached about 13%. Piti Sukontasukkul et al(2004) proposed the paper on crumb rubber concrete. In their study they
decided to replace the course and fine aggregate in concrete for moulding pedestrian blocks.
They believe that the concrete acting as a binder mixed with crumb rubber can make the concrete
blocks more flexible and it provide softness to the surface. In this study they saw that the
pedestrian blocks with crumb rubber performed quite well in skid and abrasion resistance. In this
study the process of making the concrete is economical due to the simplicity of the
manufacturing process.
Materials
Cement
II. EXPERIMENTAL INVESTIGATION
Ordinary Portland cement of Ultratech brand of 53 grade confirming to IS 12269-1987(9) was
used in the present study. The properties of cement are shown in Table 1
Table 1 Properties of Cement
Sl.No Property Result
1 Initial Setting time 35min
2
Specific Gravity
3.148
3 Fineness Modulus 1.5%

National Conference on Recent Advancement and Sustainability in Civil Engineering, 10th
April2015
RASCE 2015 23
Fine Aggregate
Natural sand as per IS: 383-1987 was used. Locally available river sand having bulk
density 1860kg/m3
was used. The properties of the fine aggregate are shown in Table 2
Table 2 Properties of Fine Aggregate
Sl.No Property Result
1 Specific Gravity 2.55
2
Fineness Modulus
2.36%
3
Water Absorption
0.50%
Coarse Aggregate
Crushed aggregate confirming to IS: 383-1987 was used. Aggregate of size 12mm of
specific gravity 2.63 and fineness modulus are shown in Table 3
Table 3 Properties of Coarse Aggregate
Sl.No Property Result
1 Specific Gravity 2.63
2
Fineness Modulus
6.75%
3
Water Absorption
2.4%
Crumb Rubber
The properties of crumb rubber are shown in Table 4
Table 4 Properties of Crumb Rubber
Sl.No Property Result
1 Specific Gravity 1.72
2
Fineness Modulus
4.48%
3
Water Absorption
2%
National Conference on Recent Advancement and Sustainability in Civil Engineering, 10th
April2015
RASCE 2015 24
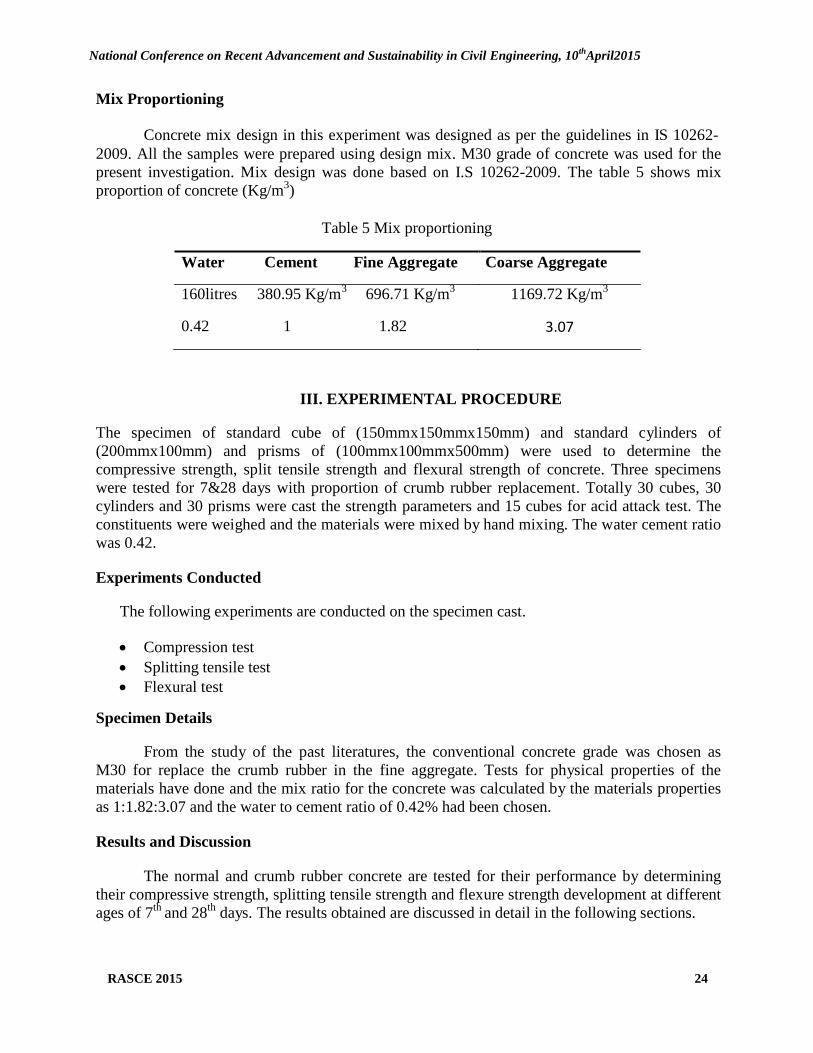
Mix Proportioning
Concrete mix design in this experiment was designed as per the guidelines in IS 10262-
2009. All the samples were prepared using design mix. M30 grade of concrete was used for the
present investigation. Mix design was done based on I.S 10262-2009. The table 5 shows mix
proportion of concrete (Kg/m3)
Table 5 Mix proportioning
Water Cement Fine Aggregate Coarse Aggregate
160litres 380.95 Kg/m3
696.71 Kg/m3
1169.72 Kg/m3
0.42 1 1.82 3.07
III. EXPERIMENTAL PROCEDURE
The specimen of standard cube of (150mmx150mmx150mm) and standard cylinders of
(200mmx100mm) and prisms of (100mmx100mmx500mm) were used to determine the
compressive strength, split tensile strength and flexural strength of concrete. Three specimens
were tested for 7&28 days with proportion of crumb rubber replacement. Totally 30 cubes, 30
cylinders and 30 prisms were cast the strength parameters and 15 cubes for acid attack test. The
constituents were weighed and the materials were mixed by hand mixing. The water cement ratio
was 0.42. Experiments Conducted
The following experiments are conducted on the specimen cast.
Compression test
Splitting tensile test
Flexural test
Specimen Details
From the study of the past literatures, the conventional concrete grade was chosen as
M30 for replace the crumb rubber in the fine aggregate. Tests for physical properties of the
materials have done and the mix ratio for the concrete was calculated by the materials properties
as 1:1.82:3.07 and the water to cement ratio of 0.42% had been chosen. Results and Discussion
The normal and crumb rubber concrete are tested for their performance by determining
their compressive strength, splitting tensile strength and flexure strength development at different
ages of 7th
and 28th
days. The results obtained are discussed in detail in the following sections.

National Conference on Recent Advancement and Sustainability in Civil Engineering, 10th
April2015
RASCE 2015 25
Compressive Strength
The limit of compressive strength of the cement concrete depends on both, the strength of the matrix and the particle tensile strength of the aggregate. The strength of the concrete is usually related to the cement content and water to cement ratio. However, in this study the crumb rubber is partially replaced with fine aggregate and test the strength under compression. The
compression strength of the concrete at 7th
and 28th
day were conducted is given in Table 6
Table 6 Compressive strength of normal and crumb rubber concrete
Replacement of Fine Aggregate
by crumb rubber
7 days
(N/mm2)
28 days
(N/mm2)
0%
5%
10%
15%
20%
23.99
26.07
21.92
18.65
16.32
36.73
38.66
33.47
29.63
22.17
Splitting tensile strength
The splitting tensile strength of the crumb rubber concrete with the different percentage
replacement of crumb rubber by fine aggregate in normal concrete at the 7th
and 28th
day results were to be tabulated in Table 7
Table 7 Splitting tensile strength of normal and crumb rubber concrete
Replacement of Fine Aggregate
by crumb rubber
7 days
(N/mm2)
28 days
(N/mm2)
0%
5%
10%
15%
20%
2.22
2.86
2.22
2.01
1.87
4.08
3.50
2.96
2.59
2.17
National Conference on Recent Advancement and Sustainability in Civil Engineering, 10th
April2015
RASCE 2015 26
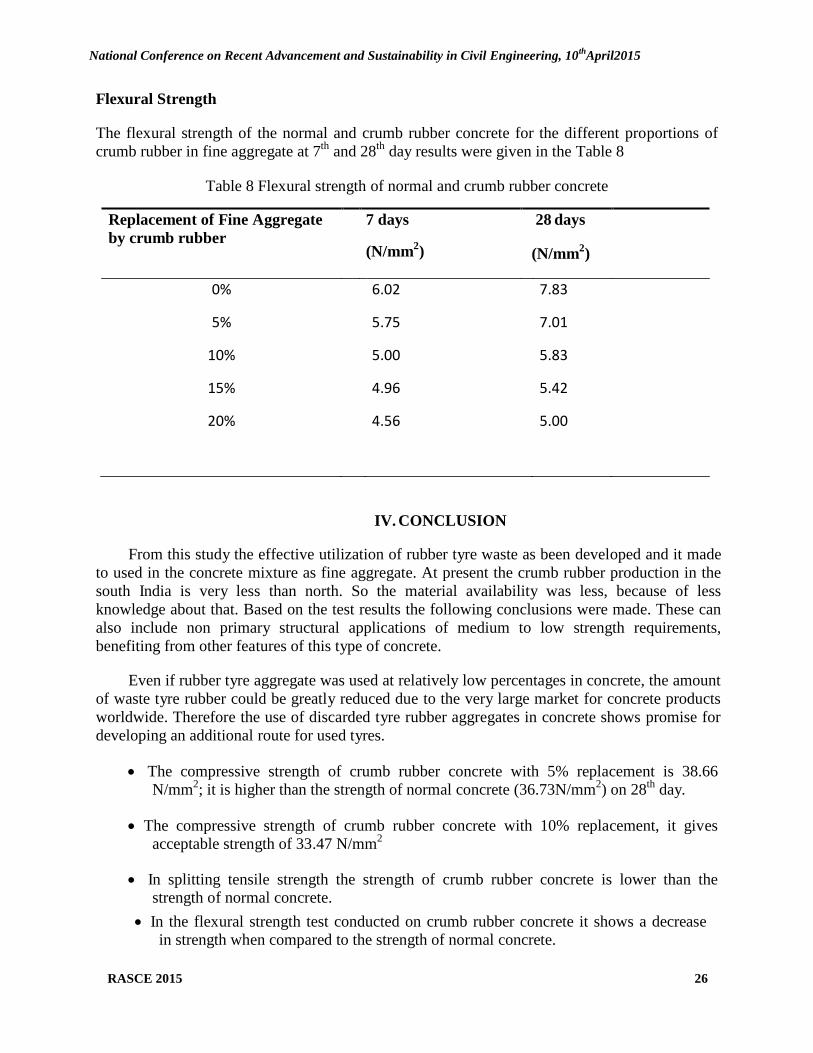
Flexural Strength
The flexural strength of the normal and crumb rubber concrete for the different proportions of
crumb rubber in fine aggregate at 7th
and 28th
day results were given in the Table 8
Table 8 Flexural strength of normal and crumb rubber concrete
Replacement of Fine Aggregate
by crumb rubber
7 days
(N/mm2)
28 days
(N/mm2)
0%
5%
10%
15%
20%
6.02
5.75
5.00
4.96
4.56
7.83
7.01
5.83
5.42
5.00
IV. CONCLUSION
From this study the effective utilization of rubber tyre waste as been developed and it made
to used in the concrete mixture as fine aggregate. At present the crumb rubber production in the
south India is very less than north. So the material availability was less, because of less
knowledge about that. Based on the test results the following conclusions were made. These can
also include non primary structural applications of medium to low strength requirements,
benefiting from other features of this type of concrete.
Even if rubber tyre aggregate was used at relatively low percentages in concrete, the amount
of waste tyre rubber could be greatly reduced due to the very large market for concrete products
worldwide. Therefore the use of discarded tyre rubber aggregates in concrete shows promise for
developing an additional route for used tyres.
The compressive strength of crumb rubber concrete with 5% replacement is 38.66
N/mm2; it is higher than the strength of normal concrete (36.73N/mm
2) on 28
th day.
The compressive strength of crumb rubber concrete with 10% replacement, it gives
acceptable strength of 33.47 N/mm2
In splitting tensile strength the strength of crumb rubber concrete is lower than the
strength of normal concrete.
In the flexural strength test conducted on crumb rubber concrete it shows a decrease
in strength when compared to the strength of normal concrete.

National Conference on Recent Advancement and Sustainability in Civil Engineering, 10th
April2015
RASCE 2015 27
From the test results, it is found that the crumb rubber posses less bonding ability
which has affected on the strength of the concrete. REFERENCES
[1] Ilker Bekir Topcu (1995) ―The properties of rubberized concrete‖, Cement and
Concrete Research, Vol. 25, No.2, pp. 304-310, 1995.
[2] N. I. Fattuhi and L. A. Clark (1996) ―Cement-based materials containing shredded
scrap tyre rubber‖ Construction and Building Materials, Vol. 10, No. 4, pp. 229-236, 1996.
[3] Piti Sukontasukkul and Chalermphol Chaikaew (2004) ―Properties of concrete
pedestrian block mixed with crumb rubber‖. Construction and Building 20 (2004) 450-
457.
[4] Piti Sukontasukkul (2008) ―Use of crumb rubber to improve thermal and sound
properties of pre-cast concrete panel‖, Construction and Building Materials 23 (2008) 1084–
1092.
[5] P. C. Varghese fourth edition ―Building materials‖ text book may 2009.
[6] IS: 2386 (part 2) Method of testing of sand. Determination of Specific gravity of sand.
[7] IS: 2386 (part 3 & 4) Method of testing of coarse aggregate. Determination of
Specific gravity and Crushing value.
[8] IS: 2720 (part 3) Method of testing of soil. Determination of Specific gravity.
[9] IS: 8112-1989 Method of testing of cement. Determination of Initial and Final
setting time.
[10] IS: 516 – 1959 Methods of tests for Strength of concrete.
[11] IS: 5816 – 1970 Method of test for splitting tensile strength of concrete
cylinders.
[12] IS: 10262-2009 For mix design.

National Conference on Recent Advancement and Sustainability in Civil Engineering, 10th
April2015
RASCE 2015 28
5. STUDY OF WATER QUALITY ANALYSIS IN AMBUR TOWN
Waseem Raza.K1 Sathish Kumar.D
1 Arul Raj.R
1 Anuradha.B
2
Karthik.G3
1Students, Final Year, Dept. of Civil Engineering, Madha Engineering College, Chennai
2Professor, Dept. of Civil Engineering, Madha Engineering College, Chennai
3 Assistant Professor, Dept. of Civil Engineering, Madha Engineering College, Chennai
ABSTRACT
Water is the basic source for the entire ecosystem. Almost ¾ of our planet is covered by water.
But 98% of water is Sea water and 2% of Fresh water out of which less than 0.3% of is directly
available for usage. Some of the source of water includes Rivers, Lakes, Oceans and
underground aquifers. Humans need water for drinking, sanitation, agriculture and industries. So
clean water is both an environmental and a public health issue. Water pollution plays a
predominant role in destructing the environment. Water pollution is a change in water quality
that can harm organisms or make water unfit for human uses.It also affects the parameters of
waters like pH, calcium, magnesium, TDS and so on. Ambur, is located on the Chennai-
Bangalore National Highway in Vellore district. It is one of the leading exporters of finished and
un-finished leather products in India. Due to the flowing of waste effluents on the Palar river
basin, the water quality of this area is unfit for Domestic purposes thus our motive is to purify
the Ground water quality. Hence this study was carried out to understand the quality of
deteriorated water and suggest few remedial solutions.
Keywords: Water quality, ecosystem, chemical parameter, health issues, water treatment.
INTRODUCTION
Water is vital for life, but also supports ecosystems, e.g. inland water ecosystems that provide a
multitude of services, including water, fish, habitat, cultural and aesthetic values, and flood
prevention, and also supports non-consumptive on-stream uses such as navigation. Poor water
quality has many economic costs associated with it, including degradation of ecosystem services;
health-related costs; impacts on economic activities such as agriculture, industrial production,
and tourism; increased water treatment costs; and reduced property values. Industrial activities
are a significant and growing cause of poor water quality. Industry. The leather industry in India
is the fourth largest export industry, therefore, becomes a significant contributor to economic
activity and employment, particularly in the state of Tamil Nadu, The leather industry in India is
the fourth largest export industry, therefore, becomes a significant contributor to economic
activity and employment, particularly in the state of Tamil Nadu. Effluent from all the leather
industries is dumped into the soil, road sides and agricultural fields. During the pronominal
rainfall, the deposited salts on the river basin and land, spread tremendously and seep into the
soil, polluting the ground water. During field survey, it was informed by farmers that three
decades ago agriculture in this basin was based on surface and sub surface irrigation but now, as
the groundwater turned very salty and is polluted, there is no irrigation facility and farmers
depend on the scanty rainfall for cultivation of crops. Although farmers have responded to
scarcity by adopting some water use technology, pollution of ground water has led to reduced
yields and crop pattern changes which have a direct impact on agricultural income. Crops like
National Conference on Recent Advancement and Sustainability in Civil Engineering, 10th
April2015
RASCE 2015 29
Paddy, sugarcane and banana which require large volumes of good quality water, are now
substituted by cotton and coconut plantations. This has implications for increasing rural
indebtedness, rural unemployment, and rural poverty.
REVIEW OF LITERATURE
S. Islam, B. S. Ismail, et al have studied, the purpose of this study was to assess the
hydrological properties and water quality characteristics of Chini Lake in Pahang, Malaysia. A
total of seven sampling stations were established at the main Feeder Rivers of Chini Lake
for measurement of stream flow. A total of 10 monitoring stations covering the study area
were selected for water sampling. Fourteen water quality parameters were analyzed based on
in-situ and ex-situ analysis for two seasons and laboratory analyses were carried out according to
the HACH and APHA methods. Stream flow from the seven Feeder Rivers into the Chini Lake
was relatively slow, ranging from 0.001 to 1.31 m/s 3 or an average of 0.21 m /s. According to
the INWQS (Interim National Water Quality Standards, Malaysia) 3 classification, the
temperature was within the normal ranges; conductivity, total suspended solids (TSS), nitrate,
sulphate and total dissolved solids (TDS) were categorized under class I, while turbidity,
dissolved oxygen (DO), biochemical oxygen demand (BOD), chemical oxygen demand
(COD), ammoniacal nitrogen and phosphate came under class II and pH under class III.
Furthermore water quality in Chini Lake varied temporally and spatially and the most affected
parameters were pH, TSS, turbidity, DO, ammoniacal nitrogen, phosphate and conductivity.
Based on the Malaysian Water Quality Index (WQI), the water in the Chini Lake was classified
under class II, meaning it is suitable for recreational activities and safe for body contact.
Dr. M. K. Mahesh, B. R. Sushmitha, H. R. Uma have explained, a water quality index (WQI)
developed by the Canadian Council of Ministers of the Environment (CCME) was applied to
Hebbal lake of Mysore, Karnataka State, India, to study its impact on aquatic life, livestock
and to know whether it is suitable for recreation, irrigation and drinking. The index of the lake
is rated as poor with respect to drinking, recreation and livestock, marginal with respect to
Aquatic life and excellent for irrigation purpose. The overall water quality is rated as poor. The
water quality is almost always endangered or deteriorated and the conditions often deviate from
natural levels. Anabaena and Microcystis aeruginosa form blooms, Phacus pleuronectes is also
recorded and the lake water is unsuitable to protect aquatic life. Incidence of Fish kill occurred in
2011 due to contamination of water.
K.Ramesh, V.Thirumangai (2014), Impacts of Tanneries on Quality of Groundwater in
Pallavaram, Chennai Metropolitan City, and The present study was carried out with the objective
of determining the extent of groundwater pollution caused by tanning industries and solid waste
dumpsite in Pallavaram area located south of Chennai (Madras), which is a town of number of
small and large scale leather industries. About 22 groundwater samples were collected and
analyzed for the concentration of physio-chemical parameters and trace ions during September
2011 and January 2012. The water quality index rated as poor to very poor quality except few
samples. The study reveals that the concentration of major ions and chromium are exceeding the
permissible limit. Groundwater is unsuitable for human consumption as it contains higher
concentration of major ions and chromium. Tannery uses a large number of chemicals during the
process of discharging toxic wastes into open drains and municipality solid waste dumpsite to the
nearby land is the major reasons deterioration of water quality in this area. Contamination of

National Conference on Recent Advancement and Sustainability in Civil Engineering, 10th
April2015
RASCE 2015 30
groundwater causes water scarcity for domestic purpose of this study is to highlight the impact of
tannery effluent on groundwater.
R,W. Gaikwad, V. V. Sasane has explained, the present work is aimed at assessing the
water quality of the groundwater in and around Lonar Lake. Water quality has been
determined by collecting groundwater samples and subjecting the samples to a comprehensive
physiochemical analysis. For assessing water quality, pH, total hardness, calcium,
magnesium, bicarbonate, chloride, nitrate, sulphate, total dissolved solids, iron, manganese
and fluorides have been considered. The higher values has been found to be mainly for Iron,
Total hardness, chloride, fluoride, calcium and magnesium, many literature shown that
groundwater quality in Lonar Taluka has been badly affected by nitrate contamination. The
analysis reveals that the groundwater of the area needs some degree of treatment before
consumption, and it also needs to be protected from the perils of contamination. Many different
options are now in progress for treatment of water locally. Various community based programs
have been tried in the past, but only few of these purely community run plants are successful.
The future lies in providing safe drinking water in rural areas with a mixture of these options so
that the objectives of providing safe water at low cost for sustaining over a long time and
reaching to maximum number of people is achieved.
M.Pejaver and M. Gurav have explained, the two lakes namely Kalwa and Jail lake of Thane
city are eutrophicated and hence the study were done to find the quality of water for the period of
6 months for various physio-chemical parameters to study the pollution status of the lakes.
The Jail lake is found to be relatively more organically polluted and greater degree of
eutrophication the Kalwa lake. Among water quality parameters, a positive correlation was
found between chlorophyll and temperature, suspended solids, pH, dissolved oxygen (not
with chlorophyll c), Co2 (only with chlorophyll C). A negative correlation was seen between
Chlorophyll and light penetration. The Chlorophyll a and b showed negative correlation with
Co2 silicates and Phosphates.
P.J. Puri , M. K. N. Yenkie, et al have studied water quality index (WQI) has been calculated
for different surface water resources especially lakes, in Nagpur city, Maharashtra (India),for
comprising of three the session January to 2008 seasons, summer, winter and rainy season.
Sampling points were selected on the basis of their importance. Water quality index was
calculated using water quality index calculator given by National Sanitation Foundation
(NSF) information system. The calculated (WQI) for various studied lakes showed fair water
quality in monsoon season which then changed to medium in winter and poor for summer
season. Gorewada Lake showed medium water quality rating in all season except monsoon
season. Futala, Ambazari and Gandhisagar Lake has also declined in aesthetic quality over past
decade following invasion of aquatic weeds such as hydrilla and water primrose, so the reasons
to import water quality change and measures to be taken up in terms of surface water (lakes)
quality management are required.
National Conference on Recent Advancement and Sustainability in Civil Engineering, 10th
April2015
RASCE 2015 31
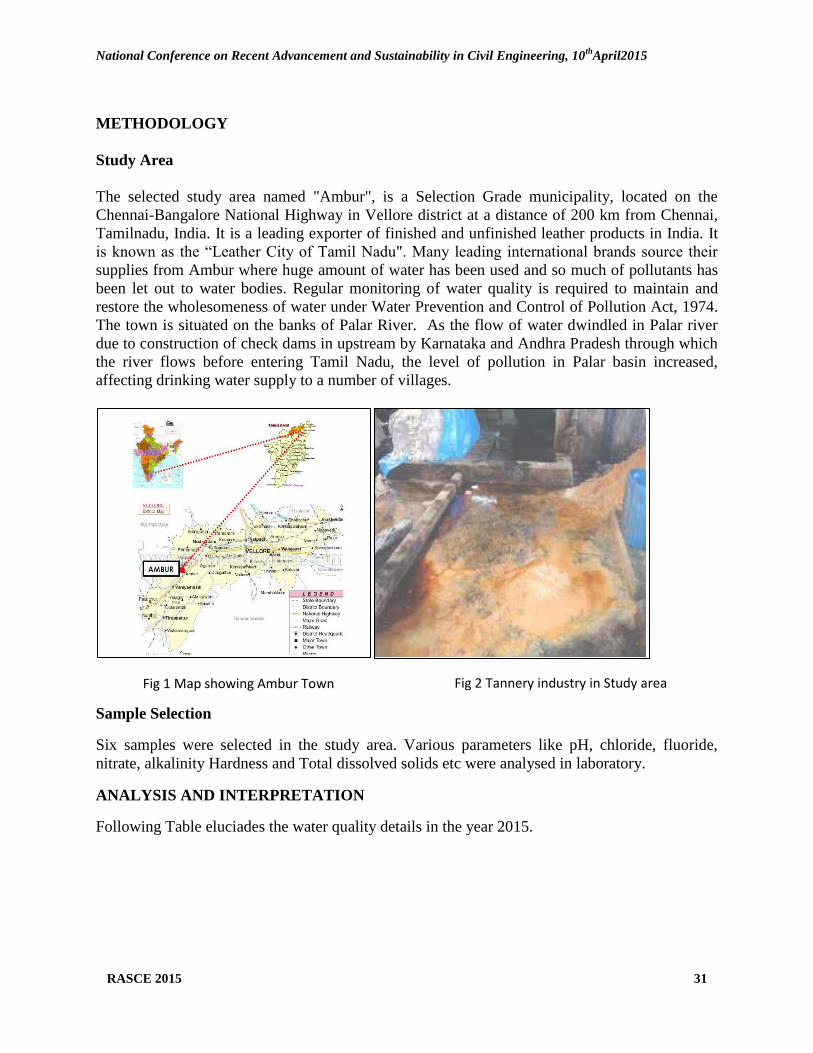
METHODOLOGY
Study Area
The selected study area named "Ambur", is a Selection Grade municipality, located on the
Chennai-Bangalore National Highway in Vellore district at a distance of 200 km from Chennai,
Tamilnadu, India. It is a leading exporter of finished and unfinished leather products in India. It
is known as the ―Leather City of Tamil Nadu". Many leading international brands source their
supplies from Ambur where huge amount of water has been used and so much of pollutants has
been let out to water bodies. Regular monitoring of water quality is required to maintain and
restore the wholesomeness of water under Water Prevention and Control of Pollution Act, 1974.
The town is situated on the banks of Palar River. As the flow of water dwindled in Palar river
due to construction of check dams in upstream by Karnataka and Andhra Pradesh through which
the river flows before entering Tamil Nadu, the level of pollution in Palar basin increased,
affecting drinking water supply to a number of villages.
Sample Selection
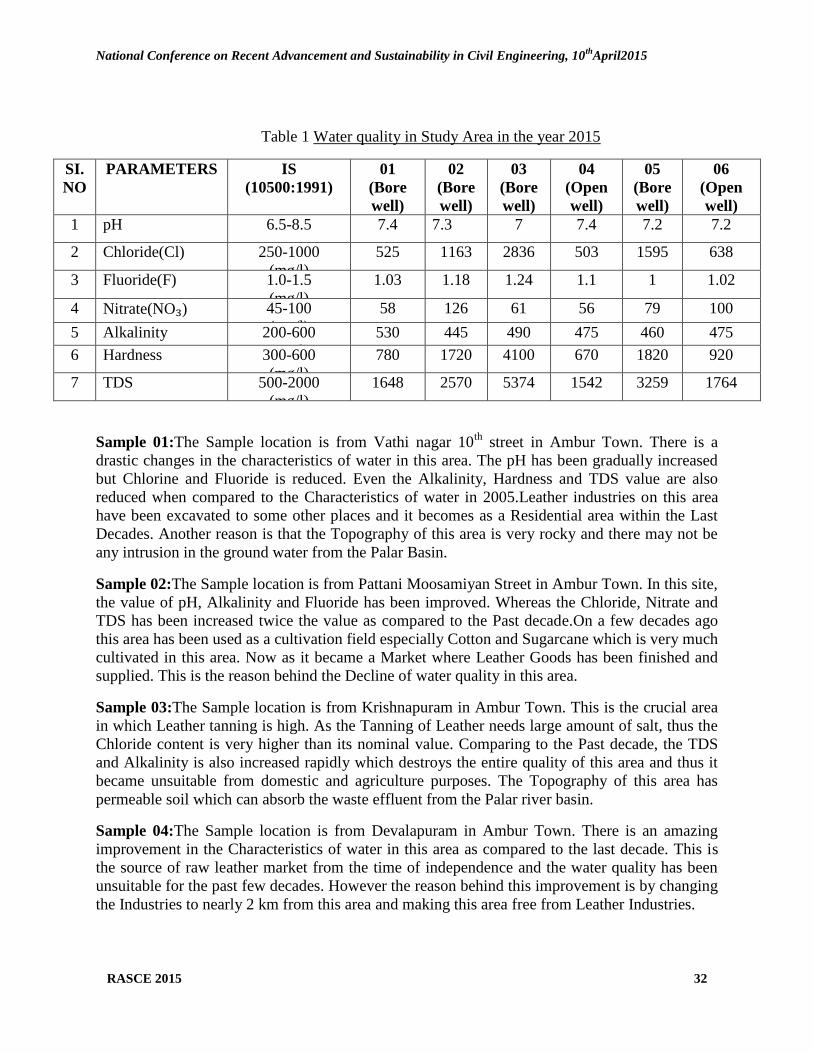
Six samples were selected in the study area. Various parameters like pH, chloride, fluoride,
nitrate, alkalinity Hardness and Total dissolved solids etc were analysed in laboratory.
ANALYSIS AND INTERPRETATION
Following Table eluciades the water quality details in the year 2015.
Fig 1 Map showing Ambur Town Fig 2 Tannery industry in Study area
National Conference on Recent Advancement and Sustainability in Civil Engineering, 10th
April2015
RASCE 2015 32
Table 1 Water quality in Study Area in the year 2015
SI.
NO
PARAMETERS IS
(10500:1991)
01
(Bore
well)
02
(Bore
well)
03
(Bore
well)
04
(Open
well)
05
(Bore
well)
06
(Open
well)
1 pH
6.5-8.5 7.4 7.3 7 7.4 7.2 7.2
2 Chloride(Cl) 250-1000
(mg/l)
525 1163 2836 503 1595 638
3 Fluoride(F) 1.0-1.5
(mg/l)
1.03 1.18 1.24 1.1 1 1.02
4 Nitrate(NO₃) 45-100
(mg/l)
58 126 61 56 79 100
5 Alkalinity 200-600
(mg/l)
530 445 490 475 460 475
6 Hardness 300-600
(mg/l)
780 1720 4100 670 1820 920
7 TDS 500-2000
(mg/l)
1648 2570 5374 1542 3259 1764
Sample 01:The Sample location is from Vathi nagar 10th
street in Ambur Town. There is a
drastic changes in the characteristics of water in this area. The pH has been gradually increased
but Chlorine and Fluoride is reduced. Even the Alkalinity, Hardness and TDS value are also
reduced when compared to the Characteristics of water in 2005.Leather industries on this area
have been excavated to some other places and it becomes as a Residential area within the Last
Decades. Another reason is that the Topography of this area is very rocky and there may not be
any intrusion in the ground water from the Palar Basin.
Sample 02:The Sample location is from Pattani Moosamiyan Street in Ambur Town. In this site,
the value of pH, Alkalinity and Fluoride has been improved. Whereas the Chloride, Nitrate and
TDS has been increased twice the value as compared to the Past decade.On a few decades ago
this area has been used as a cultivation field especially Cotton and Sugarcane which is very much
cultivated in this area. Now as it became a Market where Leather Goods has been finished and
supplied. This is the reason behind the Decline of water quality in this area.
Sample 03:The Sample location is from Krishnapuram in Ambur Town. This is the crucial area
in which Leather tanning is high. As the Tanning of Leather needs large amount of salt, thus the
Chloride content is very higher than its nominal value. Comparing to the Past decade, the TDS
and Alkalinity is also increased rapidly which destroys the entire quality of this area and thus it
became unsuitable from domestic and agriculture purposes. The Topography of this area has
permeable soil which can absorb the waste effluent from the Palar river basin.
Sample 04:The Sample location is from Devalapuram in Ambur Town. There is an amazing
improvement in the Characteristics of water in this area as compared to the last decade. This is
the source of raw leather market from the time of independence and the water quality has been
unsuitable for the past few decades. However the reason behind this improvement is by changing
the Industries to nearly 2 km from this area and making this area free from Leather Industries.
National Conference on Recent Advancement and Sustainability in Civil Engineering, 10th
April2015
RASCE 2015 33
Sample 05The Sample location is from Periya Koil 3rd
street in Ambur Town. The Topography
of this area is such that there is a lot of salt intrusion along the Ground water. There was lesser
cultivation in this area as compared to other site. The TDS, Hardness and chlorine is gradually
increased comparing to the past decade. Now as it also became a Market where Leather Goods
has been finished and supplied. This is the reason behind the Decline of water quality in this
area.
Sample 06:The Sample location is from T. Abdur Razzack Street in Ambur Town. A few
decades before, this area has been a cultivated farm especially Betel leaf, Mango and so on. Due
to the development of Population, Deforestation has been carried out resulting into Industrial and
Residential area. There a tannery namely ‗Farida Group‘ is located on 2006 which on releasing
ineffectively treated effluent on the ground resulting in water pollution on that area.
CONCLUSION AND RECOMMENDATION
This present paper gave an opportunity to understand the diverse nature of the problem of the
tannery effluent. Combining the results of laboratory water analysis with the real situation of the
area surrounding the tannery. It has helped us to analyze the problem and draw conclusions with
high degree of reliability.By analyzing this area, the major drawback is that nearly 65% of
houses don‘t have any Rain Water Harvesting Technique. Hence, this scenario needs to be
changed.Nearly 40% of the Industries are lacking in RO Plant technique, thus installing the
Reverse Osmosis Plant can make some changes and helps to retain the water quality. Winter
Cover crops have many potential benefits for both soil and water quality in an annual grain
cropping system. Some of the cover crops include corn-soybean rotation, Oat, barley, spring
wheat, and some varieties of winter wheat and winter triticale. It is also an opportunity for
scientists and socialists to work together to tackle a serious environmental problem and learn
from each other‘s approaches.
REFERENCE
1. K.Ramesh, V.Thirumangai (2014), Impacts of Tanneries on Quality of Groundwater in
Pallavaram, Chennai Metropolitan City, Tamil Nadu.
2. M. K. Mahesh, B. R. Sushmitha, H. R. Uma, Study of water quality index (WQI)
developed by the Canadian Council of Ministers of the Environment (CCME) was
applied to Hebbal lake of Mysore, Karnataka State, India.
3. M.Pejaver and M. Gurav, (2005-2006), To find the quality of water in Kalwa and Jail
lake of Thane city, India.
4. P.J. Puri, M. K. N. Yenkie, et al (2008) have studied water quality index (WQI) has been
calculated for different surface water resources especially lakes, in Nagpur city,
Maharashtra, India.
5. S. Islam, B. S. Ismail, et al (2005), Study of hydrological properties and water quality
characteristics, Chini Lake in Pahang, Malaysia.
National Conference on Recent Advancement and Sustainability in Civil Engineering, 10th
April2015
RASCE 2015 34
6. EXPERIMENTAL INVESTIGATION ON BEHAVIOUR OF HYBRID
FIBER REINFORCED CONCRETE COLUMN UNDER AXIAL
LOADING
Jackson Jacob1, Ms.P.Sarala
2 and Mr.R.S.Muralitharan
3
1 Student, M.E. Structural Engineering, Department of Civil Engineering, Prathyusha Institute of
Technology and Management, Tiruvallur, Tamil Nadu, India
Pho:08281584560 , email – id : [email protected] 2 Assistant Professor, Department of Civil Engineering, Prathyusha Institute of Technology and
Management, Tiruvallur, Tamil Nadu, India 3Associate Professor, Department of Civil Engineering, Prathyusha Institute of Technology and
Management, Tiruvallur, Tamil Nadu, India
ABSTRACT
This paper aimed for investigation on hybrid fiber reinforced concrete column under axial
loading in terms of load carrying capacity, compressive strength index and ductility factor.
The structure is modeled on the basis of different percentages of steel and nylon fibers.
The paper has a purpose to study the different properties of hybrid fiber reinforced concrete with
combination of steel fiber and non-metallic nylon fiber.
Test such as compressive strength by the cubes are conducted for better understanding of the
strength. Volume fractions of both metallic and non-metallic fibers are studied. Varying
percentages of steel fiber and nylon fiber used to cast for the short column and cured at an age of
28 days. The various combinations are steel fiber 25% nylon fiber 75% ,
steel fiber 50% nylon fiber 50% and steel fiber 75% nylon fiber 25% .The column with different
fiber proportions are also having the same dimension of 100x100x850mm and are tested in
loading frame. The compressive strength can be attained maximum in 25% of steel fiber and
75% of nylon fiber.
The structure made of these percentages are tested at an equal load interval of 25kN to determine
the load carrying capacity of the column. The yield load and ultimate load are thus to be
estimated and it is then compared with the controlled column. The damage states are considered
on the column as per the given load at same intervals.
Key words :load carrying capacity, compressive strength index, ductility factor
1. INTRODUCTION
Concrete is most widely used construction material which is plastic and malleable when it is
freshly prepared. Coarse aggregate, fine aggregate, cement, admixture and water are the
ingredients of normal concrete. Concrete is good in resisting compression but it is very weak in
resisting tension, hence reinforcement is provided in the concrete.
1.1 FIBER REINFORCED CONCRETE
Fiber reinforcement is commonly used to provide toughness and ductility to brittle cementitious
matrices. It contains short discrete fibers that are uniformly distributed and randomly oriented.
Fibers include steel fibers and nylon fibers each of which lend varying properties to the concrete.

National Conference on Recent Advancement and Sustainability in Civil Engineering, 10th
April2015
RASCE 2015 35
1.2 HYBRID FIBER REINFORCED CONCRETE
A composite is termed as hybrid, if two or more types of fibers rationally combined to produce a
composite that derives benefits from each of the individual fibers. Reinforcement of concrete
with a single type of fiber may improve the properties to a limited level.
However by using the concept of hybridization with two or more different types of fibers
incorporated in a common cement matrix, the hybrid composite can offer more attractive
engineering properties because the presence of one fiber enable the more efficient utilization of
the potential properties of other fiber.
2. SPECIMEN SPECIFICATION
Dimension of column – 100mm x 100mm x 850mm
2.1 CASTED SPECIMEN
Controlled column - 3 nos
Steel fiber 75% Nylon fiber 25% - 3 nos
Steel fiber 50% Nylon fiber 50% - 3 nos
Steel fiber 25% Nylon fiber 75% - 3 nos
2.2 BASE OF ADDITION OF FIBERS
Steel fiber - volume of concrete
Nylon fiber - volume of cement

National Conference on Recent Advancement and Sustainability in Civil Engineering, 10th
April2015
RASCE 2015 36
Reinforcement details
Casted Specimen
National Conference on Recent Advancement and Sustainability in Civil Engineering, 10th
April2015
RASCE 2015 37
3. RESULTS
The load carrying capacity of the column is obtained maximum in steel fiber of 25% and nylon
fiber of 75%. Hybrid fiber reinforced column is obtained an increase of 20% in comparison to
the controlled column.
The compressive strength index is thus to be maximum with steel fiber of 25% and nylon fiber of
75%.
The ductility factor for hybrid fiber reinforced concrete column is increased by 75% higher than
normal controlled column.
4. CONCLUSION
The compressive strength and load carrying capacity have improved with addition of steel and
nylon fibers at various percentages. The column specimen with fiber proportion steel 25%
and nylon 75% shows better properties. Load carrying capacity of steel fiber 25% and nylon
fiber 75% is 1.61 times greater than that of control specimen with no fiber content. The ductility
index of the hybrid fiber reinforced concrete column specimen is appreciably higher than that of
control specimen. The column specimen with fiber proportion steel 25% and nylon 75% reached
a value of 2.85 which is a higher value. The ductility index increased about 46% than the control
specimen.
The results explained to suggest that the use of fibers such as steel and nylon of the percentages
25 and 75 will increase the load carrying capacity, compressive strength index and ductility
factor which shows a new wave to the civil engineering new technological path.
ACKNOWLEDGMENT
Heartfelt thanks to Mr. S.Anbarasan, HOD (Dept. of Civil Engineering, Prathyusha Institute of
Technology and Management), Ms. K.S.Divya and Ms. V.J.Vedhanayaghi for their moral
support throughout the thesis.
REFERENCE
1. ACI Committee 544, Guide for Specifying, Proportioning, Mixing, Placing, and Finishing
Steel Fiber Reinforced Concrete, ACI 544.3R-93.
2. ASTM C 494, (1992), ―Standard Specifications for Chemical Admixtures for Concrete‖
Annual Book of American Society for Testing Materials Standards.
3. N. Banthia, et.al, (1998) ―Impact Resistance of Fiber Reinforced Concrete at Subnormal
Temperatures, Cement and Concrete Composites‖ 20, 393-404.
4. BIS: 383-1970 (reaffirmed 1997) ―Specification for Coarse and Fine Aggregates from
Natural Source for Concrete‖, New Delhi.
5. Deskovic. N. et.al, (1995). "Innovative design of FRP combined with concrete: Long-term
hehavior." J. Struct.Engrg..ASCE. 127(7). 1079-IOX9.
6. Gonzalo, et.al, (2006) "Concrete Reinforced with Irradiated Nylon Fibers, " J . Mater. Res.,
Vol. 21, No.2, pp. 484-491.
National Conference on Recent Advancement and Sustainability in Civil Engineering, 10th
April2015
RASCE 2015 38
7. IS 383: 1970 ―Specification for coarse and fine aggregates from natural sources for concrete‖
Bureau of Indian Standards, New Delhi, India.
8. Kurtz, S. and Balaguru, P, (2000) " Postcrack Creep of Polymeric Fiber-Reinforced Concrete
in Flexure, " Cem. Concr. Res., Vol. 30, No.2, pp. 183-190.
9. Nanni, A. et.al (1998). ―Acceleration of FRP bond degradation.‖ Proc. Durability of Fiber
Reinforced Polymer(FRP) Composites for Construction, Univ. of Sherbrooke, Canada, 45–
56.
10. Nystrom, H. E., Watkins, S. E., Nanni, A., and Murray, S. (2003). ―Financial viability of
fiber-reinforced polymer (FRP) bridges.‖ J. Manage.Eng., 19(1), 2–8.
11. Poon, W. K. et.al, (2008) ―Experimental study on structural behaviour of steel fiber
reinforced Dura T875 prestressed bridge girders.‖ Technical Rep. No. TR-0004, Dura
Technology Sdn Bhd, Perak, Malaysia.
12. Perez-Pena, M. and Mobasher, B. (1994), "Mechanical Properties of Fiber Reinforced
Lightweight Concrete Composites, "Cem. Concr. Res., Vol. 24, No.6, pp. 1121-1132.
National Conference on Recent Advancement and Sustainability in Civil Engineering, 10th
April2015
RASCE 2015 39
7. Effect of Vertical Stiffness Irregularity on Multi-Storey Shear Wall-
framed Structures using Response Spectrum Analysis
Hema Mukundan1, S.Manivel
2
P.G. Student, Department of Civil Engineering, SRM University, Kattankulathur,
Tamilnadu, India1
Assistant Professor (O.G), Department of Civil Engineering, SRM University, Kattankulathur,
Tamilnadu, India2
ABSTRACT Urbanization had led to housing problems. This has resulted in the rise of several Multi-storey
and High-rise buildings. Hence Structural Dynamics study has been steadily increasing over the
years. The modern trend is towards tall and slender structures (Irregular) and innovative
architecturally designed structures like the Baha‘i temple (Lotus shaped). These buildings are
affected by environmental factors like wind, earthquake and waterways. Millions of people
world-wide annually die due to earthquakes which are responsible for billions of rupees of
property damage. This has necessitated the study of Earthquake Engineering. However, study
and research in the field of Irregular Buildings under seismic conditions is gaining momentum.
The provision of shear wall in building has been found effective and economical. In this paper, a
10 storey building in Zone IV is presented to reduce the effect of earthquake using reinforced
concrete shear wall-framed structures in the building. The results were tabulated by performing
Response spectrum analysis using ETABS version 9.7.4 in the form of maximum storey
displacements, base shear reactions, mode shapes and storey drifts. Effect of Irregularity was
studied by creating openings in shear wall and by varying the thickness of Shear wall, along the
storey‘s.
Keywords:Base Shear, Multi-storey Buildings, Response Spectrum Analysis, Seismic loading,
Shear wall-framed structures, Vertical stiffness.
I. INTRODUCTION
1.0 General Aspects
Stability of earth is always disturbed due to internal forces which causes vibrations or
jerks in the earth's crust known as an earthquake. Earthquakes which are unpredictable and a
devastating natural disaster produces low - high waves which vibrate the base of the structure in
various manners and directions, so that lateral force is developed on the structure. Dynamics is
concerned with the study of forces and motions which are time dependent. When a structure is
subjected to dynamic load, it starts vibrating resulting in the displacement of the structure.
Seismic zones IV & V are high intensity earthquake zones. Shear walls are Concrete/masonry
vertical walls serving both architecturally as partitions and structurally to carry gravity & lateral
loading. Their very high in-plane stiffness and strength makes them ideally suited for bracing tall
buildings. They are usually continuous down to the base to which they are rigidly attached to
form vertical cantilevers. In this paper, study was done on a regular Multi-storey building (G+9)
with / without shear wall understanding parameters like storey drifts, lateral loads, mode shape
patterns, time period, base shear, and storey deflections. Three types of vertical irregularities

National Conference on Recent Advancement and Sustainability in Civil Engineering, 10th
April2015
RASCE 2015 40
were modelled.Effect of Irregularity was studied by creating openings in shear wall & by varying
the thickness of the Shear wall, along the storey‘s.
1.1 Regular & Irregular Configuration (As per 1S 1893 (Part 1):2002 Buildings having simple & regular geometry and uniformly distributed mass and stiffness
in plan as well as elevation, suffer much less damage than buildings with irregular configurations. Irregular buildings are of two types.
A. Plan Irregularities - a) Torsion Irregularity, b) Re-entrant Corners, (c) Diaphragm Discontinuity, (d) Non- parallel Systems
B. Vertical Irregularities – a) Stiffness Irregularity, b) Mass Irregularity, (c) Vertical Geometric Irregularity, (d) Discontinuity in Capacity – Weak Storey
Buildings are designed as per Design based earthquake (DBE), but the actual forces acting on the structure is far more than that of DBE. So, in higher seismic zones Ductility based design approach is preferred as it narrows the gap. The primary objective in designing an earthquake resistant structure is to ensure ductility to withstand the earthquake forces.
1.2 Objective
To evaluate lateral load behaviour of Multi-Storey Ductile Shear wall and Special Moment Resisting Frame structure (Dual Systems) with Vertical Stiffness Irregularities by studying the following parameters:-
Top Storey Deflection, Drift Pattern, Mode Shape Pattern, Base Shear & Time period.
1.3 Scope
a) To Analyse Shear wall Frame structures with time periods. b) Wall frame structure forms part of Institutional buildings c) Analysis corresponding to Zone IV. d) The analysis was done using Response Spectrum Method
II. LITERATURE SURVEY
2.0 Related Work
Literature review teaches us that an irregular structure needs a more careful structural analysis to resist Earthquake damages.
Venkata Sairam Kumar. N & et al (February 2014) carried out research mainly on application of cyclic load tests and behaviour of different types of shear walls in cyclic application of loads. Shear walls can be used as lateral load resisting Systems and also retrofitting of structures. Internal shear walls are more efficient than External shear walls when compared with cyclic load tests by researchers.
Ravikanth Chittiprolu, Ramacharla Pradeep Kumar, (June 2014) performed study on dynamic linear analysis using response spectrum method and lateral load analysis was done for structure with shear wall and structure without shear wall. Results were compared for the frame lateral forces and storey drifts of both the cases. It was inferred that shear walls are more resistant to lateral loads in an irregular structure. Storey drift is reduced in case of structure with
National Conference on Recent Advancement and Sustainability in Civil Engineering, 10th
April2015
RASCE 2015 41
shear wall. Also they can be used to reduce the effect of torsion.
Varsha R. Harne (2014) carried out a study to determine the strength of RC Shear wall of a multi-storied building by changing shear wall location. 3 different cases of shear wall position for a 6 storey building have been analyzed. Incorporation of shear wall has become inevitable in multi-storey building to resist lateral forces.
Shaikh Abdul Aijaj, Abdul Rahman & Girish Deshmukh (2013), made attempts to investigate the proportional distribution of lateral forces evolved through seismic action in each storey level due to changes in stiffness of frame on vertically irregular frame. As per the Bureau of Indian Standard (BIS) 1893:2002 (part 1) provisions, a G+10 vertically irregular building was modelled as a simplified lump mass model for the analysis with stiffness irregularity at Fourth floor. The result remarks the conclusion that, a building structure with stiffness irregularity provides instability and attracts huge storey shear.
.S.Kumbhare, A.C. Saoji (2012) had carried out study on the effect of seismic Loading on placement of shear wall in medium rise building at different alternative location. They found that frame type structural system becomes economical as compared to dual type structural system and can be used for medium rise residential building situated in high seismic zone.
Ashish S. Agrawal, S.D.Charkha (2012) carried out study on 25 storey building in Zone V by changing various position of shear wall with different shapes for determining parameters like storey drift, axial load and displacement. From the results of analysis they came to a conclusion that placing shear walls away from centre of gravity resulted in increase in most of the member forces.
Y.M. Fahjan & J. Kubin & M.T. Tan (2010) found that in the countries with active seismicity, reinforced concrete structural walls are widely used in multi-storey structure systems. Therefore, a proper modelling of the shear walls is very important for both linear and nonlinear analyses of building structures. Shear wall modelling requires mesh discretization in order to get realistic behaviour. The advantage of using shell elements is the ability to model very long, interacting and complex shear walls within the three dimensional model.
G. Nandini Devi, K.Subramanian & A.R.Santhakumar (June 2009) studied a three bay R.C frame without and with shear wall in middle bay which was subjected to Static cyclic lateral load. Shear wall of one bay was subjected to static reversed cyclic lateral load to assess its individual behaviour. Cyclic effects on the shear wall frame were considered for comparison.
J.Kubin, Y.M.Fahjan and M.T.Tan (2008) studied the different approaches of modelling the shear walls in structural analyses of buildings and compared their results. The shear walls within the building structures are generally modelled by either a composition of frame elements or a mesh of shell elements
N.S. Potty, W.A.Thanoon, H.H. Hamzah, et al (ICCBT2008) investigated the suitability, simplicity, accuracy, effectiveness of different structural models used in the analysis of shear wall and coupled shear wall structures. They found that the beam element model is simple compared with shell element model. As the size of the SW increases, the modelling and analysis of the wall with shell element become more complex and tedious.
National Conference on Recent Advancement and Sustainability in Civil Engineering, 10th
April2015
RASCE 2015 42
Devesh P. Soni and Bharat B. Mistry (2006) studied the seismic response of vertically irregular building frames and found that the largest seismic demand is found for the combined–stiffness–and–strength irregularity. The methodology proposed by Fragiadakis et al (2006) proposed a methodology based on Incremental Dynamic Analysis (IDA) to evaluate the response of structures with ‗single-story vertical irregularities in stiffness and strength using a nine-story steel frame.
III. SELECTION OF THE STRUCTURE
3.0 General
a) Material used was M25 Grade Concrete.
Analysis Property Data
b) Yield stress fy = 415 N/mm2
c) Compressive Cube Strength of Concrete = 25 N/mm2
d) Poisson‘s ratio = 0.2 e) Analysis was done using ETABS Software 9.7
3.1 Building Details
a) Type of frame: Special RC moment resisting frame fixed at the base b) Seismic zone: IV c) Number of storey: G+9 d) Floor height: 3.0 m e) Depth of Slab: 120 mm f) Size of beam: (250 × 450) mm g) Size of column: (300 × 450) mm h) Spacing between frames : (i) 6 m in X & Y direction (General), (ii) 24 m X 15 m in X &
Y direction i) Live load on floor: 2 kN/m
2
j) Floor finish: 1.5 kN/m2
k) Wall load: 14 kN/m l) Materials: M 25 concrete, Fe 500 steel Material m) Thickness of wall: 230 mm n) Thickness of shear wall: 150 mm o) Density of concrete: 25 kN/m
3
p) Density of masonry wall : 19 kN/m3
q) Type of soil: Medium r) Response spectra: As per IS 1893(Part-1):2002 s) Damping of structure: 5 percent
IV. PLANNING AND MODELLING
4.0 Seismic Analysis
Earlier, the buildings were designed just for gravity loads but in recent times, Seismic analysis is a major tool in earthquake engineering used to understand the response of buildings due to seismic excitations in a simpler manner . Different types of earthquake analysis methods are: Equivalent Static Analysis, Response Spectrum Analysis, Time History Analysis
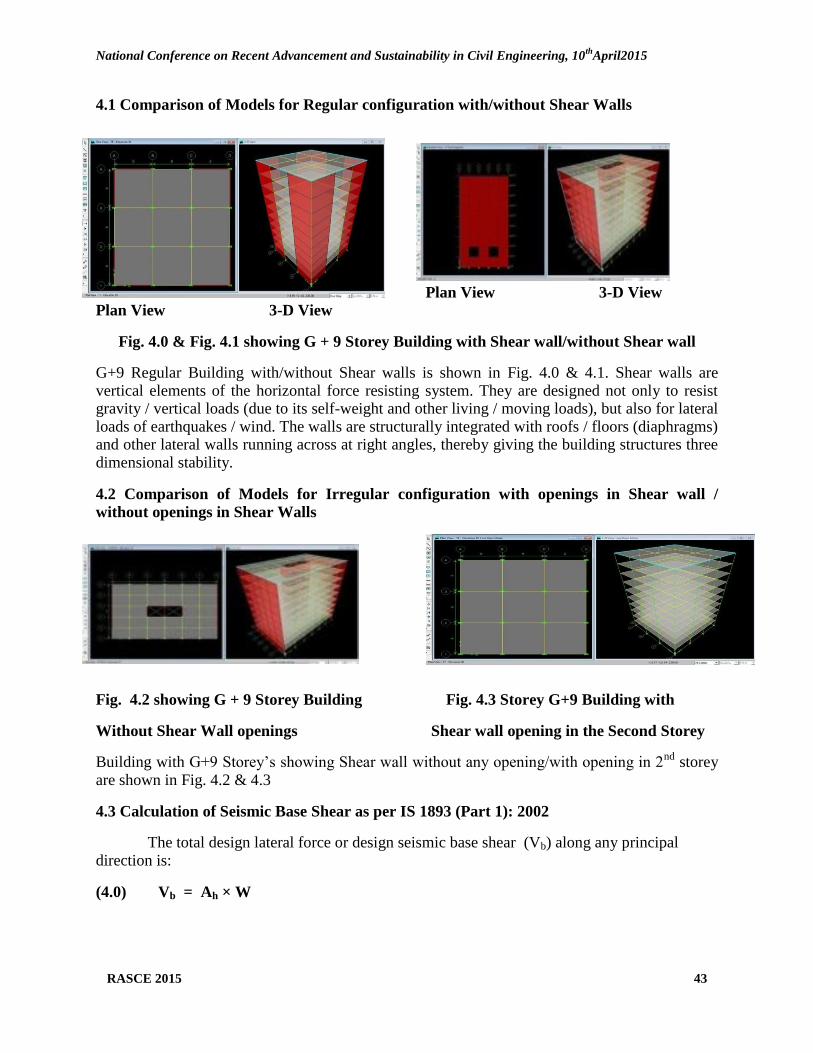
National Conference on Recent Advancement and Sustainability in Civil Engineering, 10th
April2015
RASCE 2015 43
4.1 Comparison of Models for Regular configuration with/without Shear Walls
Plan View 3-D View
Plan View 3-D View
Fig. 4.0 & Fig. 4.1 showing G + 9 Storey Building with Shear wall/without Shear wall
G+9 Regular Building with/without Shear walls is shown in Fig. 4.0 & 4.1. Shear walls are vertical elements of the horizontal force resisting system. They are designed not only to resist gravity / vertical loads (due to its self-weight and other living / moving loads), but also for lateral loads of earthquakes / wind. The walls are structurally integrated with roofs / floors (diaphragms) and other lateral walls running across at right angles, thereby giving the building structures three dimensional stability.
4.2 Comparison of Models for Irregular configuration with openings in Shear wall /
without openings in Shear Walls
Fig. 4.2 showing G + 9 Storey Building Fig. 4.3 Storey G+9 Building with
Without Shear Wall openings Shear wall opening in the Second Storey
Building with G+9 Storey‘s showing Shear wall without any opening/with opening in 2nd
storey are shown in Fig. 4.2 & 4.3
4.3 Calculation of Seismic Base Shear as per IS 1893 (Part 1): 2002
The total design lateral force or design seismic base shear (Vb) along any principal direction is:
(4.0) Vb = Ah × W
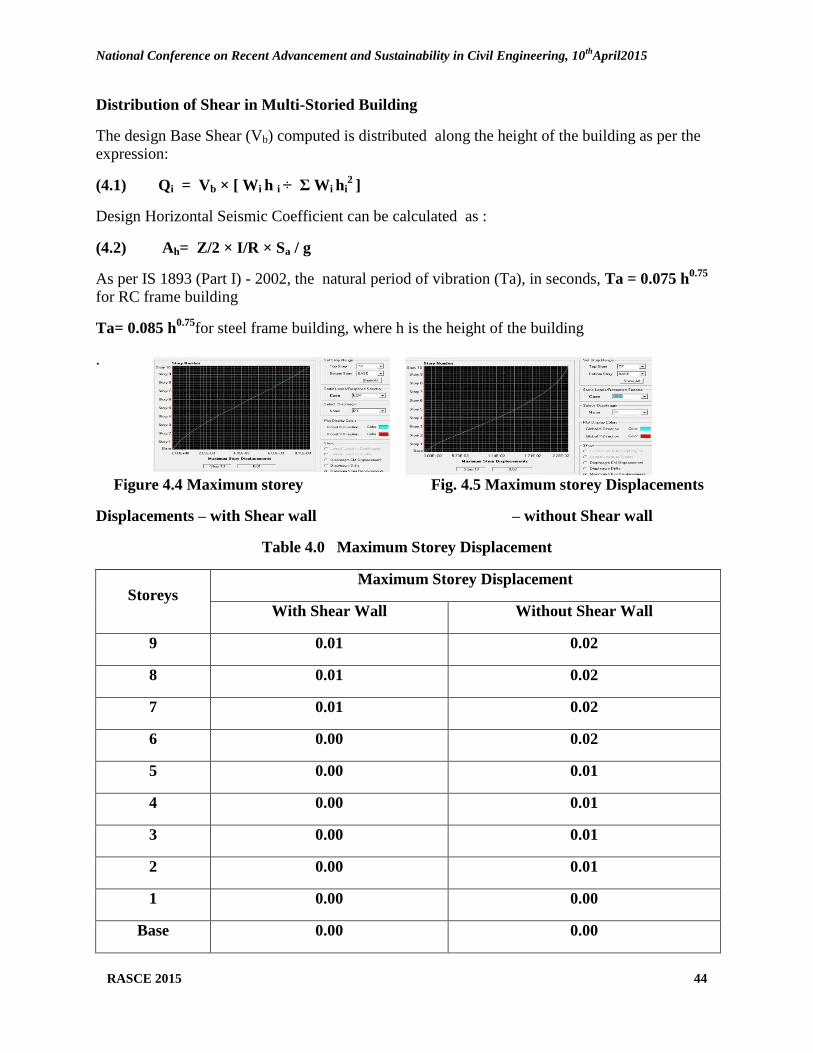
National Conference on Recent Advancement and Sustainability in Civil Engineering, 10th
April2015
RASCE 2015 44
Distribution of Shear in Multi-Storied Building
The design Base Shear (Vb) computed is distributed along the height of the building as per the expression:
(4.1) Qi = Vb × [ Wi h i ‚ Ʃ Wi hi2
]
Design Horizontal Seismic Coefficient can be calculated as :
(4.2) Ah= Z/2 × I/R × Sa / g
As per IS 1893 (Part I) - 2002, the natural period of vibration (Ta), in seconds, Ta = 0.075 h0.75
for RC frame building
Ta= 0.085 h0.75
for steel frame building, where h is the height of the building
.
Figure 4.4 Maximum storey Fig. 4.5 Maximum storey Displacements
Displacements – with Shear wall – without Shear wall
Table 4.0 Maximum Storey Displacement
Storeys Maximum Storey Displacement
With Shear Wall Without Shear Wall
9 0.01 0.02
8 0.01 0.02
7 0.01 0.02
6 0.00 0.02
5 0.00 0.01
4 0.00 0.01
3 0.00 0.01
2 0.00 0.01
1 0.00 0.00
Base 0.00 0.00

National Conference on Recent Advancement and Sustainability in Civil Engineering, 10th
April2015
RASCE 2015 45
Figure 4.6 Chart showing Maximum Storey Displacement
Fig. 4.4 & 4.5 show ETAB output. Table 4.0 is the value got by analysis & Fig. 4.6 represents the data in graphical form. The maximum storey displacement of the building is reduced by
50% when shear wall is provided.
Table 4.1 Response Spectrum Base Reactions with Shear wall
RESPONSE SPECTRUM BASE REACTIONS - WITH SHEAR WALL
Spec Mode F1 F2 F3 M1 M2 M3
EQX 2 1417.6 0 0 0 30439.163 -12758.373
EQX All 1469.78 0 0 0 30465.165 13228.046
Table 4.2 Response Spectrum Base Reactions without Shear wall
RESPONSE SPECTRUM BASE REACTIONS - WITHOUT SHEAR WALL
Spec Mode F1 F2 F3 M1 M2 M3
EQX 2.00 495.25 0.00 0.00 0.00 10153.80 -4457.22
EQY All 530.09 0.00 0.00 0.00 10172.22 4770.85

National Conference on Recent Advancement and Sustainability in Civil Engineering, 10th
April2015
RASCE 2015 46
Table 4.3 Moment Distribution for different Storey’s
Moment Distribution in kN-m
Moment for storey’s in C20 Shear Wall No Shear Wall
Storey Column Load M2 M3 M2 M3
TF C20 COMB3 MAX 5.974 24.388 30.845 70.113
8F C20 COMB3 MAX 5.165 24.622 24.881 50.994
7F C20 COMB3 MAX 5.081 24.086 25.145 57.803
6F C20 COMB3 MAX 5.149 25.837 24.243 57.628
5F C20 COMB3 MAX 4.908 25.312 23.151 58.021
4F C20 COMB3 MAX 4.762 25.186 21.736 57.806
3F C20 COMB3 MAX 4.413 24.093 20.017 56.976
2F C20 COMB3 MAX 3.943 22.478 17.955 54.546
1F C20 COMB3 MAX 3.373 20.114 15.797 47.379
GF C20 COMB3 MAX 1.834 15.623 11.358 23.371
Fig.4.7 Moment distribution for different Storey’s
Table 4.1, 4.2 & 4.3 are the results got from Response Spectrum Analysis showing base reaction forces and Moments with/without Shear Walls. The base reaction force is almost 3 times more in the building with shear wall as compared to the one without shear wall. Using Response Spectrum Analysis, it is found that out of all the mode shapes, mode Shape 2 has the maximum base reaction force for the building with/without shear wall. Moment distribution output for with/without Shear wall in different storey‘s is shown in Table 4.3 & the respective graph is shown above in Fig. 4.7
0
20
40
60
80
TF 8F 7F 6F 5F 4F 3F 2F 1F GF
Mo
men
t in
kN
-m
Storeys
Chart depicting Variation in Moment in Column C20
Shear wall with M3
moment
Without Shear wall
M3 moment
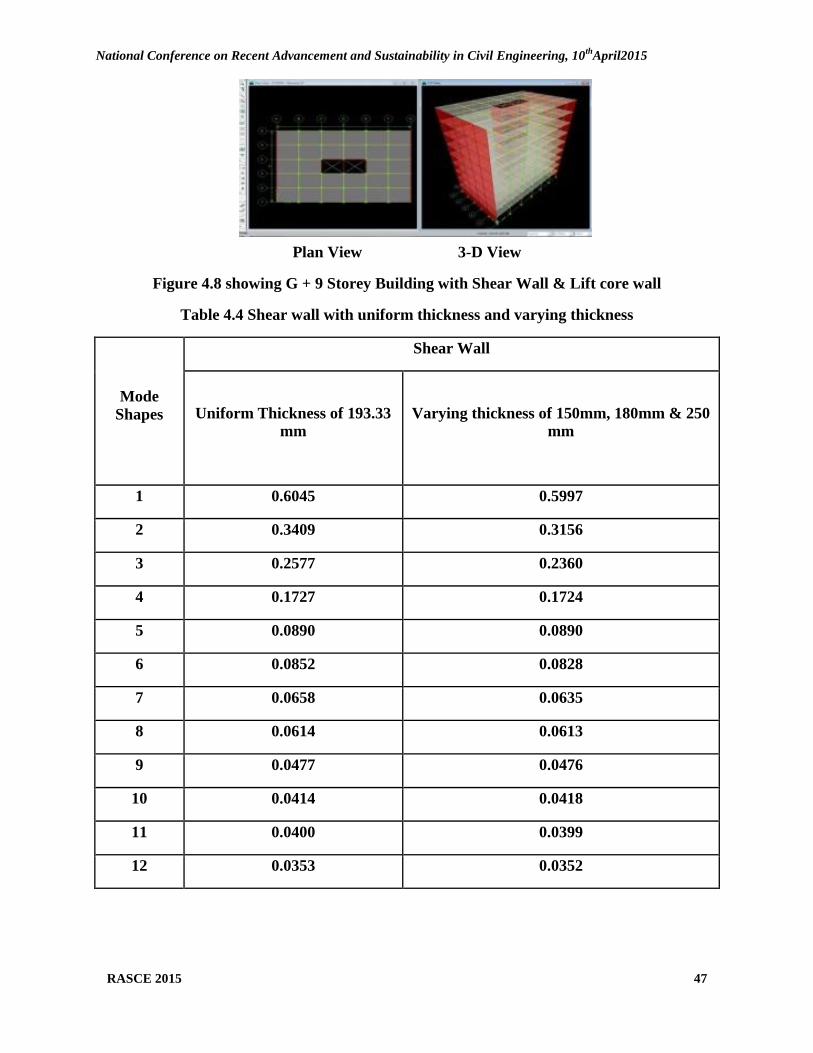
National Conference on Recent Advancement and Sustainability in Civil Engineering, 10th
April2015
RASCE 2015 47
Plan View 3-D View
Figure 4.8 showing G + 9 Storey Building with Shear Wall & Lift core wall
Table 4.4 Shear wall with uniform thickness and varying thickness
Mode
Shapes
Shear Wall
Uniform Thickness of 193.33
mm
Varying thickness of 150mm, 180mm & 250
mm
1 0.6045 0.5997
2 0.3409 0.3156
3 0.2577 0.2360
4 0.1727 0.1724
5 0.0890 0.0890
6 0.0852 0.0828
7 0.0658 0.0635
8 0.0614 0.0613
9 0.0477 0.0476
10 0.0414 0.0418
11 0.0400 0.0399
12 0.0353 0.0352

National Conference on Recent Advancement and Sustainability in Civil Engineering, 10th
April2015
RASCE 2015 48
The ETAB result for Varying/Uniform Thickness with/without Shear wall is tabulated in Table 4.4 and the corresponding graphical representation is depicted below in the Fig. 4.9 Fig. 4.8 shows the modelling of the same.
Mode shape 1 has the maximum time period and it gradually decreases for other mode shapes & there is a marked difference in the time periods between shear wall with uniform thickness and varying thicknes
Fig.4.9 Shear wall with Uniform Thickness and Varying Thickness
Table 4.5 Response Spectrum Base reactions – Shear wall without openings/with openings
RESPONSE SPECTRUM BASE REACTIONS - SHEAR WALL WITH NO
OPENINGS
Spec Mode F1 F2 F3 M1 M2 M3
EQX 1 717.78 0.00 0.00 0.00 519440 -211678
EQY 2 0.00 1030.61 0.00 -762889 0.00 486901
RESPONSE SPECTRUM BASE REACTIONS - SHEAR WALL WITH OPENINGS
Spec Mode F1 F2 F3 M1 M2 M3
EQX 1 714.98 0.00 0.00 0 517569.8 -210853
EQY 2 0.00 1054.07 0.00 -772973 0 497988
Result of analysis done on Shear wall with/without openings showing base reactions and moment distribution are displayed in Table 4.5. Of all mode shapes, mode shape 2 has the maximum base reaction force for the building with openings in shear wall/without any openings in shear wall.
0.00000.20000.40000.60000.80001.00001.20001.4000
1 2 3 4 5 6 7 8 9 10 11 12
Th
ick
nes
s in
mm
Mode Shapes
Shear Wall with Uniform Thickness and Varying Thickness
Shear Wall
Uniform Thickness
of 193.33 mm
Shear Wall
Varying thickness
of 150mm, 180mm
& 250 mm
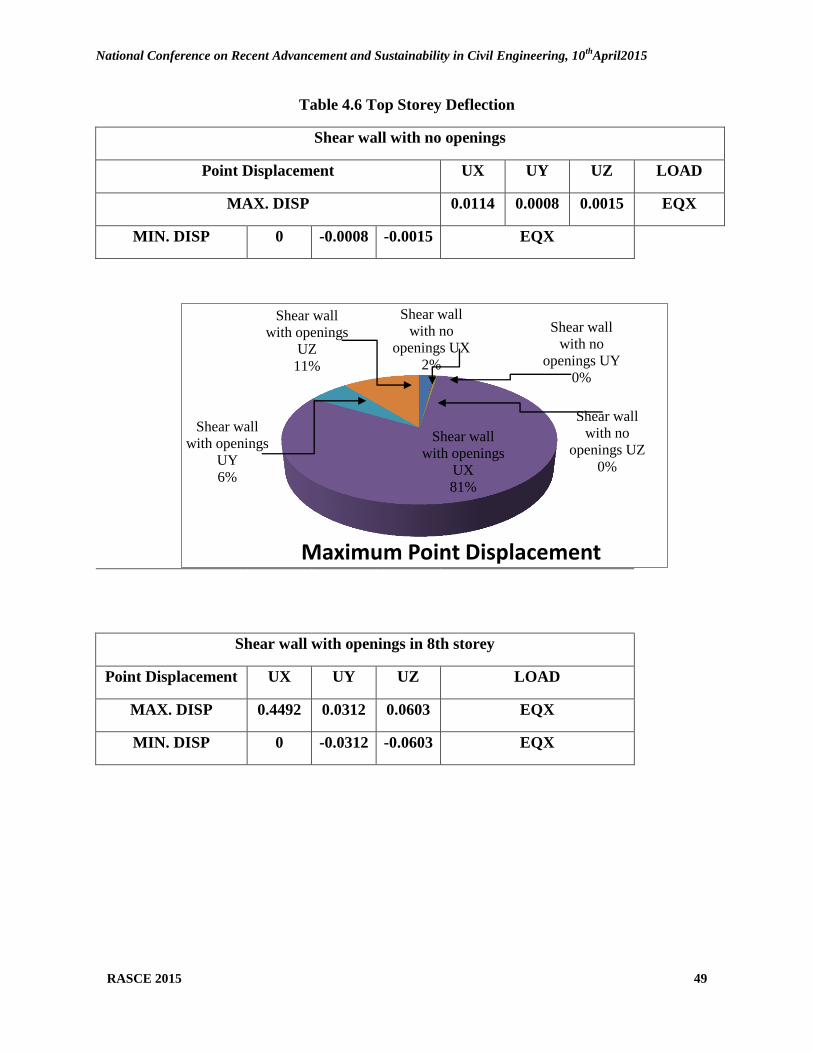
National Conference on Recent Advancement and Sustainability in Civil Engineering, 10th
April2015
RASCE 2015 49
Table 4.6 Top Storey Deflection
Shear wall with no openings
Point Displacement UX UY UZ LOAD
MAX. DISP 0.0114 0.0008 0.0015 EQX
MIN. DISP 0 -0.0008 -0.0015 EQX
Shear wall with openings in 8th storey
Point Displacement UX UY UZ LOAD
MAX. DISP 0.4492 0.0312 0.0603 EQX
MIN. DISP 0 -0.0312 -0.0603 EQX
Shear wall
with no
openings UX
2%
Shear wall
with no
openings UY
0%
Shear wall
with no
openings UZ
0%
Shear wall
with openings
UX
81%
Shear wall
with openings
UY
6%
Shear wall
with openings
UZ
11%
Maximum Point Displacement

National Conference on Recent Advancement and Sustainability in Civil Engineering, 10th
April2015
RASCE 2015 50
Table 4.6 represents the storey deflection in X, Y & Z directions under seismic loads for Shear
walls with/without openings. The maximum storey displacement of the building occurs in the 9th
storey. The corresponding pie graph of Table 4.6 is shown in Fig. 4.10. We infer that point
displacements in all 3 directions are comparatively high in shear wall with openings.
Table 4.7 Various Modes and the corresponding period in Seconds
Mode shapes Openings in Shear wall Shear Wall without Openings
2nd Storey 4th Storey 6th Storey 8th Storey
1 0.6049 0.6043 0.6033 0.6020 0.6038
2 0.3967 0.3887 0.3812 0.3760 0.3763
3 0.3023 0.2948 0.2881 0.2829 0.2839
4 0.1723 0.1717 0.1721 0.1721 0.1721
5 0.1021 0.0957 0.0964 0.0965 0.0941
6 0.0884 0.0887 0.0884 0.0887 0.0886
7 0.0807 0.0739 0.0749 0.0749 0.0728
8 0.0611 0.0611 0.0612 0.0612 0.0612
9 0.0475 0.0491 0.0475 0.0482 0.0475
10 0.0467 0.0475 0.0464 0.0475 0.0459
11 0.0399 0.0402 0.3990 0.0399 0.0399
12 0.0367 0.0393 0.0364 0.0384 0.0359
Deformation (mode shape) for Shear wall with/without openings for different storey‘s is shown in Tabular form above in Table 4.7 and as a 3D graph in Fig. 4.11. Deformation is peak at mode shape 1 and gradually becomes less for mode shape 12 & there is not much difference in the time periods between shear wall with openings/without openings. Openings in shear wall increases the stress and reduces the stability.
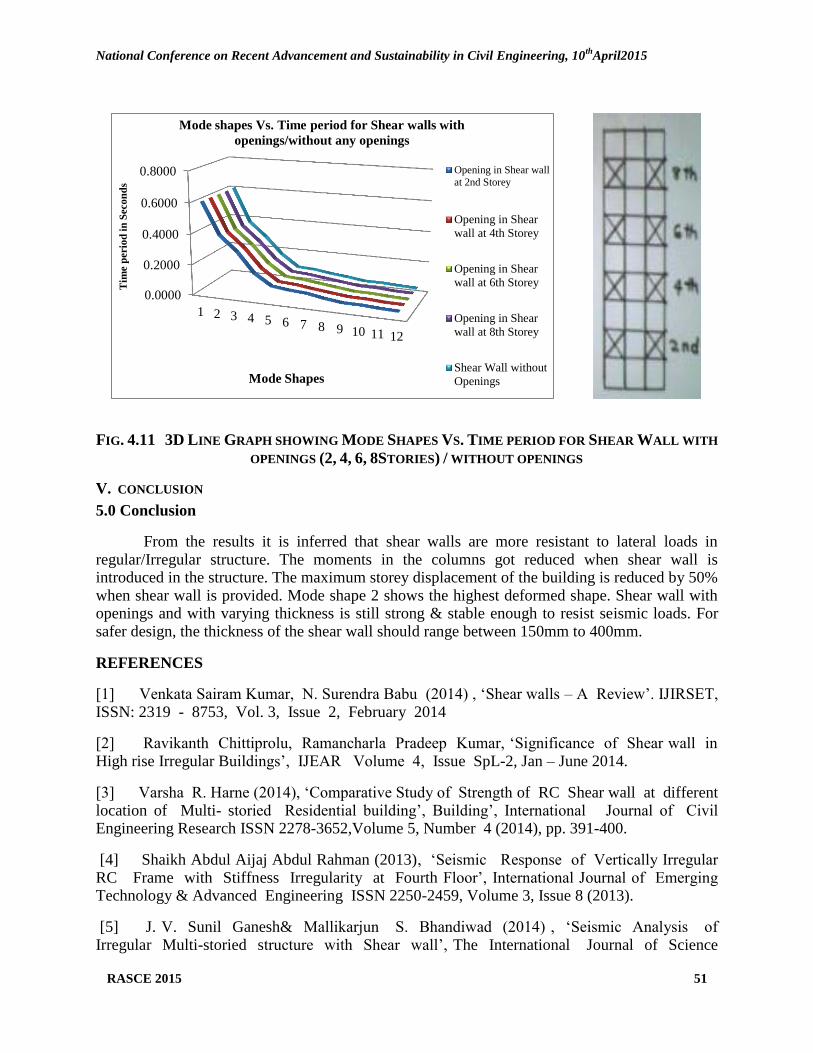
National Conference on Recent Advancement and Sustainability in Civil Engineering, 10th
April2015
RASCE 2015 51
FIG. 4.11 3D LINE GRAPH SHOWING MODE SHAPES VS. TIME PERIOD FOR SHEAR WALL WITH
OPENINGS (2, 4, 6, 8STORIES) / WITHOUT OPENINGS
V. CONCLUSION
5.0 Conclusion
From the results it is inferred that shear walls are more resistant to lateral loads in regular/Irregular structure. The moments in the columns got reduced when shear wall is introduced in the structure. The maximum storey displacement of the building is reduced by 50% when shear wall is provided. Mode shape 2 shows the highest deformed shape. Shear wall with openings and with varying thickness is still strong & stable enough to resist seismic loads. For safer design, the thickness of the shear wall should range between 150mm to 400mm.
REFERENCES
[1] Venkata Sairam Kumar, N. Surendra Babu (2014) , ‗Shear walls – A Review‘. IJIRSET, ISSN: 2319 - 8753, Vol. 3, Issue 2, February 2014
[2] Ravikanth Chittiprolu, Ramancharla Pradeep Kumar, ‗Significance of Shear wall in High rise Irregular Buildings‘, IJEAR Volume 4, Issue SpL-2, Jan – June 2014.
[3] Varsha R. Harne (2014), ‗Comparative Study of Strength of RC Shear wall at different location of Multi- storied Residential building‘, Building‘, International Journal of Civil Engineering Research ISSN 2278-3652,Volume 5, Number 4 (2014), pp. 391-400.
[4] Shaikh Abdul Aijaj Abdul Rahman (2013), ‗Seismic Response of Vertically Irregular RC Frame with Stiffness Irregularity at Fourth Floor‘, International Journal of Emerging Technology & Advanced Engineering ISSN 2250-2459, Volume 3, Issue 8 (2013).
[5] J. V. Sunil Ganesh& Mallikarjun S. Bhandiwad (2014) , ‗Seismic Analysis of Irregular Multi-storied structure with Shear wall‘, The International Journal of Science
0.0000
0.2000
0.4000
0.6000
0.8000
1 2 3 4 5 6 7 8 9 10 11 12
Tim
e p
erio
d i
n S
eco
nd
s
Mode Shapes
Mode shapes Vs. Time period for Shear walls with
openings/without any openings
Opening in Shear wall
at 2nd Storey
Opening in Shear
wall at 4th Storey
Opening in Shear
wall at 6th Storey
Opening in Shear
wall at 8th Storey
Shear Wall without
Openings

National Conference on Recent Advancement and Sustainability in Civil Engineering, 10th
April2015
RASCE 2015 52
&Technoledge, Vol. 2, Issue 6.
[6] Y.M. Fahjan & J. Kubin & M. T. Tan (2010), ‘Nonlinear Analysis Methods of Reinforced Concrete Buildings with Shear walls‗, ECEE.
[7] G. Nandini Devi, K. Subramanian & A.R. Santhakumar (2009) , ‗Structural Response of Multibay Multi-storey Lateral Load Resisting Systems under Seismic type loading‗, International Journal of Earth Sciences and Engineering, ISSN 0974 - 5904, Vol. 02, NO. 02, pp.45-153.
[8] J. Kubin, Y.M..Fahjan and M.T. Tan [(2008), ‗Comparison of Practical Approaches for Modelling Shear walls in Structural Analyses of Buildings‘, The 14th World Conference on Earthquake Engineering October 12- 17, Beijing, China.
[9] N. S. Potty, W. A. Thanoon, H .H Hamzah , A.M. M Hamadelnil (2008) , ‘ Practical Modelling Aspects for Analysis of Shear walls using Finite Element Method‘, ICCBT, Malaysia.
[10] Devesh P. Soni & Bharat B. Mistry (2006) , ‗Qualitative Response of Seismic Response of Vertically Irregular Building Frames‘, SVIT, Vasad.
BIOGRAPHY
Name : HEMA MUKUNDAN
Affiliation : P.G Student (M. Tech – Structural), Department of Civil Engineering,
SRM University, Kattankulathur – 603 203
Interest Area : Structural Dynamics, Design of Tall Buildings & Steel structures

National Conference on Recent Advancement and Sustainability in Civil Engineering, 10th
April2015
RASCE 2015 53
8. Behavior of Infilled Frames with Different Interface Materials
1V.THIRUMURNGAN,
2S.MUTHU KUMAR,
3WALA HUSAM AHMED*,
4T.P.GANESAN,
5K.S. SATYANARAYANAN
1,2Ph.D Research Scholar, Structural Engineering SRM University
3M .Tech Student, Structural Engineering SRM University
4Pro-Vice Chancellor, SRM University
5Professor, Department of Civil Engineering SRM University, Chennai, TN, India
ABSTRACT
Infilled frame structures are widespread and commonly exist worldwide in buildings as exterior
or partition walls for frames for functional reasons ,Infilled frame is defined as a composite
system of planar frame interacts with the infilling wall under lateral load and such interaction is
influenced by the parameters like relative stiffness of the frame-infill, types of interface
conditions, infill characteristics ,presence of openings and their size , location etc .
In the present study the effect ofdifferent interface materials on the behavior of infilled
frames carried out , Reinforced concrete frame with brick masonary infill with different interface
materials,viz cement mortar, lead, cork and pneumatic air medium are the material used as
interface. The interaction between frame and infill is simulated through using finite element
software . Comparison between bare frame and infilled frame for single storey frame is carried
out in this work.
It is found that the infilled frame has high stiffness when cement mortar is used and least
when pneumatic medium with a low air pressure of 2 psi is used.
Keywords: Infilled frame, interface, bare frame, cement mortar, pneumatic interface, cork, lead,
stiffness.
1. Introduction:
Infilled frame with brick masonry panel are wide spread and is commonly used in different
building systems. The brick masonry is normally used because of its convenience and
familiarity.
Usually frames are provided with partition walls for functional reasons. It is found
that the bounding frame and filler walls act compositely and alter the characteristics of the
bounding frame. In seismically active region active region infilled frame shows high
performance due to its high strength to absorb and dissipate seismic forces. Infill panels show
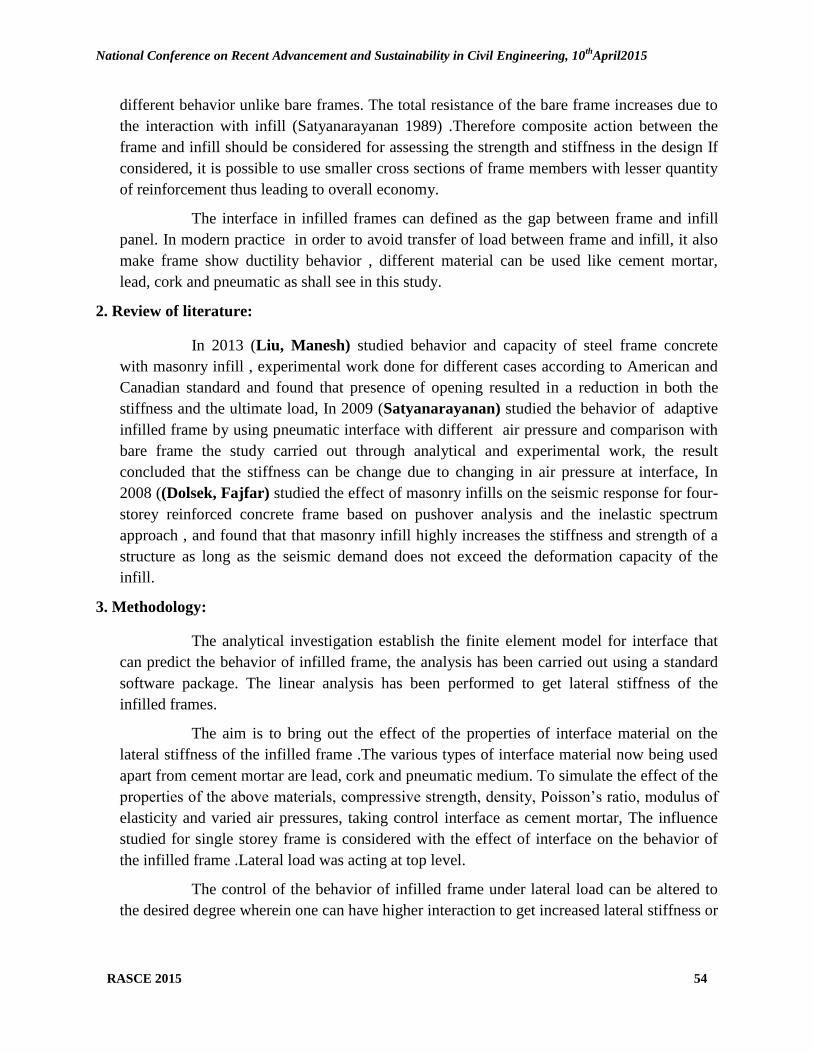
National Conference on Recent Advancement and Sustainability in Civil Engineering, 10th
April2015
RASCE 2015 54
different behavior unlike bare frames. The total resistance of the bare frame increases due to
the interaction with infill (Satyanarayanan 1989) .Therefore composite action between the
frame and infill should be considered for assessing the strength and stiffness in the design If
considered, it is possible to use smaller cross sections of frame members with lesser quantity
of reinforcement thus leading to overall economy.
The interface in infilled frames can defined as the gap between frame and infill
panel. In modern practice in order to avoid transfer of load between frame and infill, it also
make frame show ductility behavior , different material can be used like cement mortar,
lead, cork and pneumatic as shall see in this study.
2. Review of literature:
In 2013 (Liu, Manesh) studied behavior and capacity of steel frame concrete
with masonry infill , experimental work done for different cases according to American and
Canadian standard and found that presence of opening resulted in a reduction in both the
stiffness and the ultimate load, In 2009 (Satyanarayanan) studied the behavior of adaptive
infilled frame by using pneumatic interface with different air pressure and comparison with
bare frame the study carried out through analytical and experimental work, the result
concluded that the stiffness can be change due to changing in air pressure at interface, In
2008 ((Dolsek, Fajfar) studied the effect of masonry infills on the seismic response for four-
storey reinforced concrete frame based on pushover analysis and the inelastic spectrum
approach , and found that that masonry infill highly increases the stiffness and strength of a
structure as long as the seismic demand does not exceed the deformation capacity of the
infill.
3. Methodology:
The analytical investigation establish the finite element model for interface that
can predict the behavior of infilled frame, the analysis has been carried out using a standard
software package. The linear analysis has been performed to get lateral stiffness of the
infilled frames.
The aim is to bring out the effect of the properties of interface material on the
lateral stiffness of the infilled frame .The various types of interface material now being used
apart from cement mortar are lead, cork and pneumatic medium. To simulate the effect of the
properties of the above materials, compressive strength, density, Poisson‘s ratio, modulus of
elasticity and varied air pressures, taking control interface as cement mortar, The influence
studied for single storey frame is considered with the effect of interface on the behavior of
the infilled frame .Lateral load was acting at top level.
The control of the behavior of infilled frame under lateral load can be altered to
the desired degree wherein one can have higher interaction to get increased lateral stiffness or
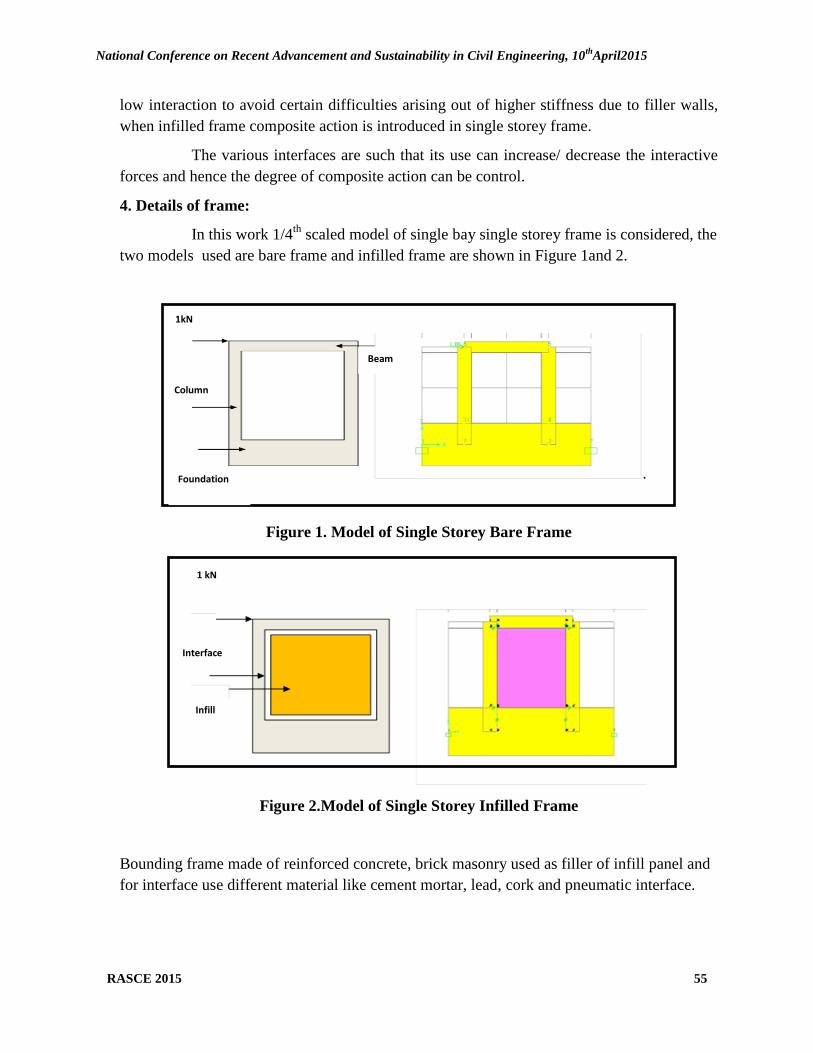
National Conference on Recent Advancement and Sustainability in Civil Engineering, 10th
April2015
RASCE 2015 55
low interaction to avoid certain difficulties arising out of higher stiffness due to filler walls,
when infilled frame composite action is introduced in single storey frame.
The various interfaces are such that its use can increase/ decrease the interactive
forces and hence the degree of composite action can be control.
4. Details of frame:
In this work 1/4th
scaled model of single bay single storey frame is considered, the
two models used are bare frame and infilled frame are shown in Figure 1and 2.
.
Figure 1. Model of Single Storey Bare Frame
Figure 2.Model of Single Storey Infilled Frame
Bounding frame made of reinforced concrete, brick masonry used as filler of infill panel and
for interface use different material like cement mortar, lead, cork and pneumatic interface.
Beam
1kN
Column
Foundation
Beam
1 kN
Interface
Infill
Panel

National Conference on Recent Advancement and Sustainability in Civil Engineering, 10th
April2015
RASCE 2015 56
Figure 3. Details of Reinforcement of RC Frame
RC frame consist of foundation beam, wind-ward column, lee-ward column, and storey beam as
shown in Figure 3 , infill panel of aspect ratio of (1:1) used , and interface thickness is 5 mm.
5. Modeling of frame:
For bounding frame beam element is used, for infill panel four noded plane stress rectangular
elements discretized to (16x16) as ideal discretization, for the interface link elements and four
noded rectangular elements are used with 30 kN/mm as stiffness for link element.
6. Material properties:
Different material has been used in this work with specific properties according to
experimental work as illustrated in Table1.
Table 1:
Material
Properties
* Satyanarayanan
(2009)
Material Density E Value Compressive
kN / N/ Strength
N/
Concrete 25.18 28280 20
Steel 77 2x -
Brick 18 1582 30
Masonry
Cement 18 10360 30
Mortar*
Cork* 1.765 20 0.25
Lead * 111.2 8000 20

National Conference on Recent Advancement and Sustainability in Civil Engineering, 10th
April2015
RASCE 2015 57
7. Results:
The effect of interface material is significant on the stiffness of the frame which is
defined as deflection under lateral load and used to control lateral displacement or drift,
comparison held in this work between bare frame and infilled frame using different interface
material.
From the result obtained for the single storey frame, It is clear that using bare frame
without infill cause high drift , on the other hand using infilled frame cause small drift
compared with bare frame.
Table 2: Result of single storey frame
Case Drift
mm
Stiffness
kN/mm
BF 0.108 9.26
IFCM 0.0413 24.21
IFL 0.042 23.81
IFC 0.056 17.86
IFP(2psi) 0.096 10.42
IFP(4psi) 0.085 11.76
IFP(6psi) 0.073 13.7
IFP(8psi) 0.062 16.13
IFP(10psi) 0.05 20
Notations of frame as (BF) Bare Frame, (IFCM) Infilled frame with cement mortar
interface, (IFL) Infilled frame with lead interface, (IFC) Infilled frame with cork interface,
(IFP(2psi)) Infilled frame with pneumatic interface using (2psi) as air pressure value.
8. Conclusion:
Based on the results obtained from numerical analysis, the following conclusions are
made.
1. BF has the least stiffness compared with Infilled frame.
National Conference on Recent Advancement and Sustainability in Civil Engineering, 10th
April2015
RASCE 2015 58
2. The stiffness of IFCM is 2.6 times greater than BF.
3. The stiffness of IFL is 2.57 times greater than BF.
4. The stiffness of IFC is 1.93 times greater than BF.
5. The stiffness of IFP (2psi) is 1.12 times greater than BF.
6. The stiffness of IFP (10psi) is 2.16 times greater than BF.
7. The stiffness of IFP is increased with increasing air pressure.
8. IFCM has the highest stiffness compared with other Infilled frames using different
interface materials.
9. Acknowledgment:
The work presented here is a part of research work on masonry Infilled R.C frames with various
interface materials at Department of Civil Engineering, SRM UNIVERSITY, Kattankulathur.
The authors sincerely acknowledge the Management of SRM UNIVERSITY for all the facilities
extended.
10. References:
[1]. B.S.Smith and A.Coull‘‘ method of analysis for Infilled frames‘‘
[2]. Matjaz Dolsek, Peter Fajfar‘‘ The effect of masonry infills on the seismic response of a
four-storey reinforced concrete frame‖, Engineering Structures vol. 30, page 1991–
2001,2008.
[3]. Alessandra Fiore, Adriana Netti, Pietro Monaco‘‘The influence of masonry infill on the
seismic behavior of RC frame buildings‖, Engineering Structures,vol. 44, page133–
145,2012.
[4]. Govindan P. , Lakshmipathy M. , and. Santhakumar A. R ‘‘Ductility of lnfilled
Frames‖ , ACI JOURNAL Tiltle No.83-50, page 567-576,1986.
[5]. SatyanarayananK.S, Lakshmipathy and Ganasan T.P’’Conceptualisation studies on the
development of adaptive interface in infilled frames‖,IJAER, ISSN 0973-4562, Vol.4,
page 1579-1589,2009.
[6]. Satyanarayanan K.S‘‘ Studies on the influences of different materials on the elastic
behaviour of Infilled frames‖,2009.
[7]. Doudoumis I.N‘‘Finite element modelling and investigation of the behaviour of elastic
infilled frames under monotonic loading‖,Engineering Structures vol.29,page 1004–
1024,2007.
[8]. Liu Yi , Manesh Pouria‘‘ Concrete masonry infilled steel frames subjected to combined
in-plane lateral and axial loading‖,Engineering Structures vol.52 , page 331–339, 2013.

National Conference on Recent Advancement and Sustainability in Civil Engineering, 10th
April2015
RASCE 2015 59
9. EXPERIMENTAL STUDIES ON FLEXURAL BEHAVIOUR OF BEAM
USING LATHE WASTE IN SIFCON
S.Gowthami¹, Dr.B.Hemalatha2
1PG Student (Structural Engineering),
2 Head of the Department, Department of civil
Engineering, Arulmigu meenakshi amman college of Engineering,Thiruvannamali (Dt), INDIA. Email:
ABSTRACT
Slurry infiltrated fibrous concrete (SIFCON) is one of the recently developed construction
material that can be considered as a special type of fibre reinforced concrete (FRC) with higher fibre
content. Fibre reinforced concrete is essentially a composite material in which fibres out of waste
having higher modulus of elasticity. SIFCON is a special type of high fibrous concrete and it is having
a high cementious content and sand. The matrix usually consists of cement-sand slurry or fluent mortar.
The construction industry is in need of finding cost effective materials for increasing the strength of
concrete structures hence an endeavor has been made in the present investigations to study the
influence of addition of waste material like Lathe waste from workshop at different dosages to the total
weight of concrete.The waste of steel scrap material which is available from the lathe is used as a steel
fibre for innovative construction industry. To get sustainable and environmental benefits, lathe scrap as
recycled fibres with concrete are likely to be used. An experimental program was carried out to
investigate the flexural behavior of Slurry infiltrated fibrous concrete (SIFCON) in which the fibres
having an aspect ratio of 100 is used. SIFCON specimens with 8%, 10% and 12% volume of fraction
fibres are used in this study. Test results were presented in comparison of SIFCON with and without
conventional steel reinforcement. The load carrying capacity of SIFCON specimen is higher than
conventional concrete and it also reduced crack width. In the SIFCON specimen less number of cracks
as compared with conventional concrete.
Keywords: SIFCON, Lathe waste, RCC, Fibre volume, Flexural behaviour.
1. INTRODUCTION
Concrete is one of the most extensively used construction materials in the world. However the
production of Portland cement, an essential constituent of concrete, leads to the release of large amount
of Carbon-di-oxide, a greenhouse gas. One ton of Portland cement clinker production creates one ton of
carbon-di-oxide and other greenhouse gases. Environmental issues will play a foremost role in the
sustainable development of the cement and concrete industry in this century. Presently waste materials
resulting from various physical and chemical processes are the most imperative defy in the industrial
and developing countries. Extensive investigations on wastage recycling are being implemented to
diminish the environmental reimbursement. In this regard, construction investigators, like other
recycling and production industries, have also achieved advances in using these waste materials. One of
the non-recyclable materials enters the environment is fibres that come out of waste. Conventional
concrete is a brittle material and having the values of modulus of rupture and strain capacity low. In
order to meet the required values of flexural strength and enhances the strain capacity of the
conventional concrete, the fibres are being used.
SIFCON is a high-strength, high performance material containing a relatively high volume
percentage of steel fibres as compared to SFRC. It is also termed as ‗high volume fibrous concrete‘.
The origin of SIFCON carried out extensive experiments in the laboratory proved that, if the
percentage of steel fibres in a cement matrix could be increased substantially, then a material of very
high strength could be obtained, which is christened as SIFCON. The use of waste lathe scrap as
recycled steel fibres provides more economical and environmental sustainable SIFCON. The fractal

National Conference on Recent Advancement and Sustainability in Civil Engineering, 10th
April2015
RASCE 2015 60
dimension increases with the increase of fibre volume content. The crack pattern becomes more
irregular as the fibre volume content increases. Compressive strength, bending strength, and toughness
index increase with the increase of fractal dimension simultaneously [1]. In this study fibres having
aspect ratios like 80, 90,100,110 and 120 are used. The SIFCON produced with fibres having an aspect
ratio of 120 yields the maximum strength [2]. The strength can be increased with increase of fibre
content [3, 8]. This paper reports the strength increased from 4% to 8% replacement of fibres and there
is a very small decrease for 9%. It shows the strength behavior of SIFCON produced with sand
replaced by Msand [4]. It has been observed that the compressive strength, tensile strength, flexural
strength and impact strength of SIFCON goes on increasing as the aspect ratio of fibres in it goes on
increasing. Waste coiled steel fibres effectively used in the production of SIFCON [5]. The four main
factors affecting the SIFCON strength. These factors are mortar strength, fibre volume, fibre alignment
and fibre type. Fibre alignment greately affects the behaviour of a SIFCON product. The strength,
ductility are all affected by the fibre alignment [6]. SIFCON is advantageous by its excellent energy
absorption capacity, greater strength and high ductility [7]. The cost of construction of SIFCON is high
on comparison with concrete and it can be used in the zones of blast and severe failure [8]. The
maximum displacement is getting reduced with increase in SIFCON volume. Increase in the depth of
SIFCON showed positive effect in the reduction of beam deflection [9]. Although the SIFCON material
itself is much more ductile than normal concrete, its material ductility is insufficient for use as a
compression yielding material. Confinement in the form of steel stirrups can significantly increase the
ductility of SIFCON blocks. Perforation in the form of holes is highly effective in increasing the
ductility of SIFCON blocks when it is combined with stirrups [10].
2. SIFCON
SIFCON is similar to fiber reinforced concrete which has a discrete fiber matrix that lends
significant tensile properties to the composite matrix. The percentage of steel fibres in a cement matrix
is increased substantially, when a material of very high strength is obtained, called as SIFCON. The
fiber volume fraction of fiber reinforced concrete is limited by the ability to effectively mix the fibers
into the wet concrete. This limits the fiber volume (Vf) to between 1% and 3%, depending upon the
type of fiber used and the workability of the mix. SIFCON specimens, on the other hand, have been
produced with Vf between 6% and 30% [2]. In SIFCON, the fibers are preplaced inside the form prior
to placing a cement-based binder. Once the fibers are placed, a fine, cement rich slurry is poured or
pumped into the forms. Thus, the slurry must have sufficient fineness to infiltrate the fiber matrix.
SIFCON composites provide excellent resistance to spalling under high temperature, thermal shock
conditions and under conditions of high mechanical abuse. There are four main variables to consider
when evaluating a SIFCON specimen.
slurry strength
fiber volume
fiber alignment
fiber type
The cement slurry greatly affects the behavior of SIFCON specimens because the slurry is the
backbone of the specimen. Although SIFCON is still a relatively new material, the composite has been
used successfully in a number of areas, especially for applications where high strength or high ductility
or both are needed. These include a large variety of earthquake-resistant structures, military
installations, explosive and penetration-resistant structures. In addition to many other uses such as
airport pavements, parking lots and bridge decks.
3. MATERIALS USED
3.1 Cement

National Conference on Recent Advancement and Sustainability in Civil Engineering, 10th
April2015
RASCE 2015 61
Ordinary Portland cement of 53 grade confirming to Indian standard Specifications IS: 12269
1987 from a single source was used. The specific gravity of the cement was 3.14. Initial and final
setting times were found as 30.66 and 120 minutes respectively.
3.2 Fine aggregate
Locally available river sand passing through 4.75 mm I.S. sieve was used. The specific gravity
of the sand is found to be 2.62, fineness modulus of 2.9.
3.3 Coarse aggregate
Crushed granite stones of 20 mm maximum size having specific gravity of 2.74, fineness
modulus of 3.95.
3.4 Fibres
The waste steel obtained from lathe machine was used as fibre, the size of the mild steel lathe
waste used as fibre is cut into the required length of 50 mm, 0.5 mm thick, 3 mm width and the aspect
ratio is 100.
3.5 Water
The portable fresh water confirming to IS 456 2000 was used for both mixing and curing of
concrete.
Table 1 Mix proportion
4. Casting of specimens
Mix proportions of the specimens as given in the table 1. Cubes of 150x150x150 mm were cast
to the determine the compressive strength of concrete. A cylinders of 150 mm diameter and 300 mm
height were cast to evaluate the split tensile strength. The cement slurry is prepared by 0.50 water
cement ratio. SIFCON specimens with 8%, 10%, 12% volume of fraction fibres are used in this study.
The mixing, casting and compacting were done carefully. The specimens were demoulded after 24
hours and cured for 3, 7 and 28 days.
5. Test performed
5.1 Compressive strength test
The cubes are tested in a compression testing machine of capacity 1000KN.Load is applied in
such a way that, the two opposite sides of the cube are compressed (Top and Bottom surface).
S.NO Specimen Mix proportion W/C
ratio
Mode of vibration
1 SIFCON 8% Cement and sand (1:1 by
wt)
0.50 Hand tamping
2 SIFCON 10% Cement and sand (1:1 by
wt)
0.50 Hand tamping
3 SIFCON 12% Cement and sand (1:1 by
wt)
0.50 Hand tamping
4 RCC 1:1.23:2.3 0.40 Hand tamping
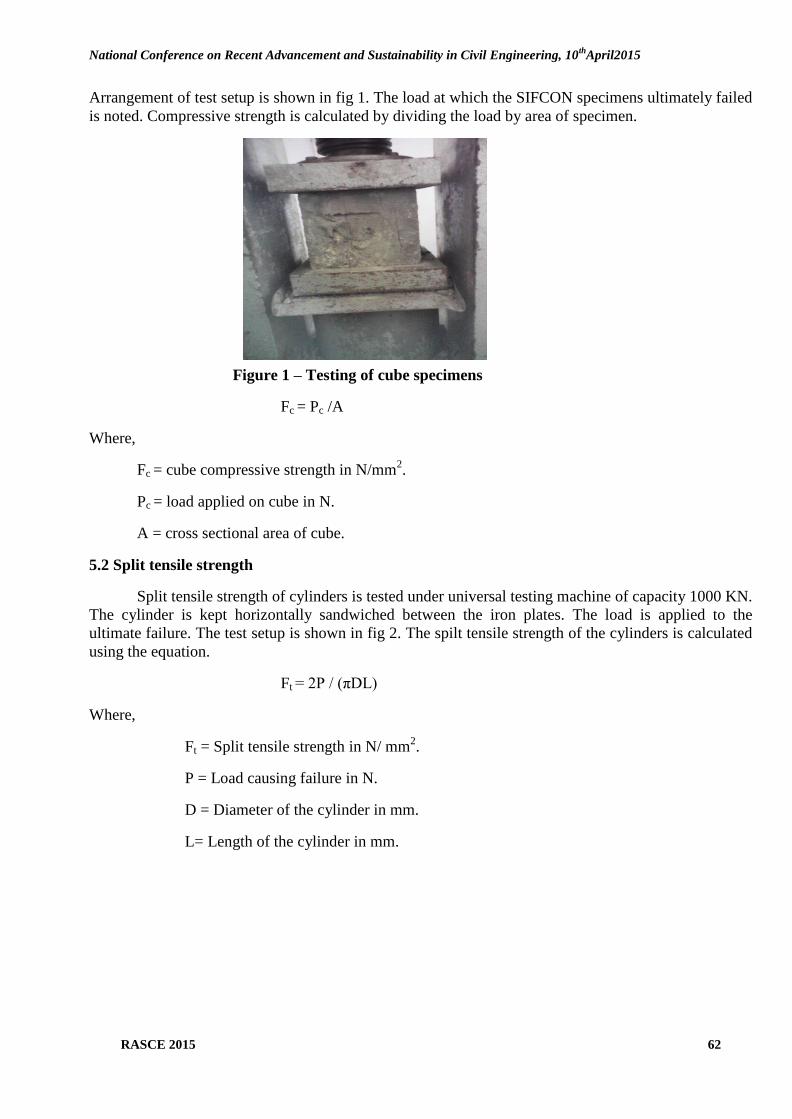
National Conference on Recent Advancement and Sustainability in Civil Engineering, 10th
April2015
RASCE 2015 62
Arrangement of test setup is shown in fig 1. The load at which the SIFCON specimens ultimately failed
is noted. Compressive strength is calculated by dividing the load by area of specimen.
Figure 1 – Testing of cube specimens
Fc = Pc /A
Where,
Fc = cube compressive strength in N/mm2.
Pc = load applied on cube in N.
A = cross sectional area of cube.
5.2 Split tensile strength
Split tensile strength of cylinders is tested under universal testing machine of capacity 1000 KN.
The cylinder is kept horizontally sandwiched between the iron plates. The load is applied to the
ultimate failure. The test setup is shown in fig 2. The spilt tensile strength of the cylinders is calculated
using the equation.
Ft = 2P / (πDL)
Where,
Ft = Split tensile strength in N/ mm2.
P = Load causing failure in N.
D = Diameter of the cylinder in mm.
L= Length of the cylinder in mm.
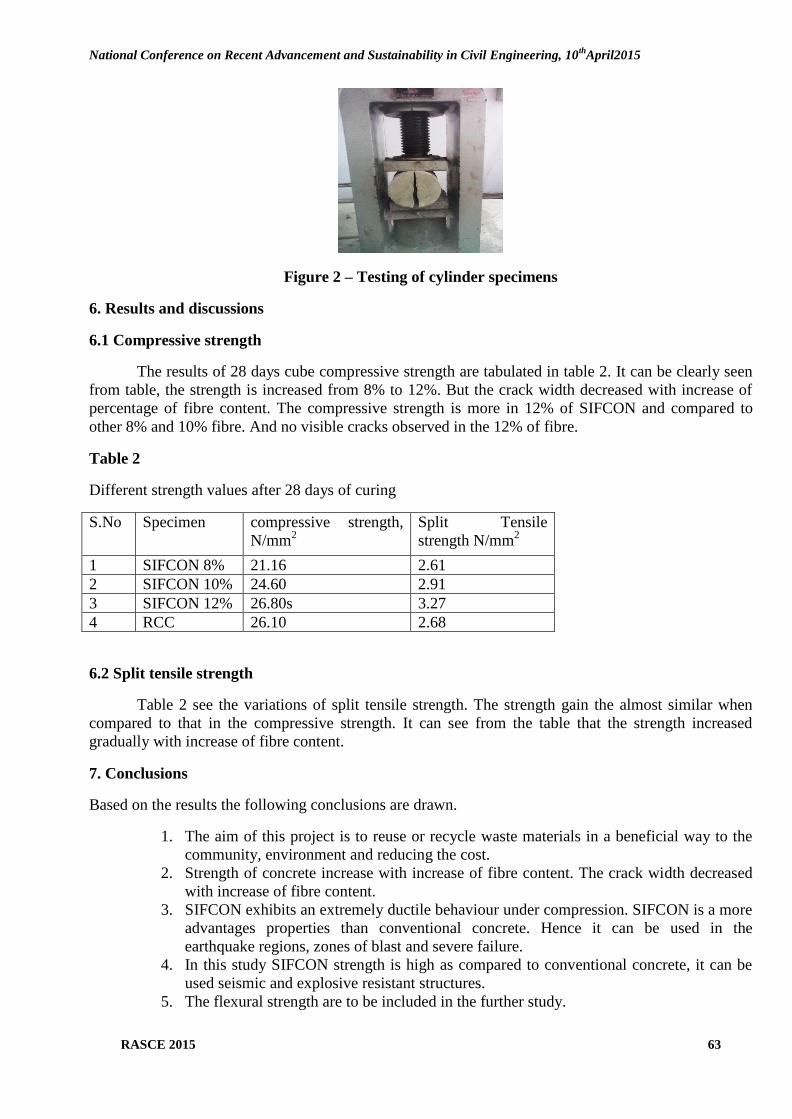
National Conference on Recent Advancement and Sustainability in Civil Engineering, 10th
April2015
RASCE 2015 63
Figure 2 – Testing of cylinder specimens
6. Results and discussions
6.1 Compressive strength
The results of 28 days cube compressive strength are tabulated in table 2. It can be clearly seen
from table, the strength is increased from 8% to 12%. But the crack width decreased with increase of
percentage of fibre content. The compressive strength is more in 12% of SIFCON and compared to
other 8% and 10% fibre. And no visible cracks observed in the 12% of fibre.
Table 2
Different strength values after 28 days of curing
S.No Specimen compressive strength,
N/mm2
Split Tensile
strength N/mm2
1 SIFCON 8% 21.16 2.61
2 SIFCON 10% 24.60 2.91
3 SIFCON 12% 26.80s 3.27
4 RCC 26.10 2.68
6.2 Split tensile strength
Table 2 see the variations of split tensile strength. The strength gain the almost similar when
compared to that in the compressive strength. It can see from the table that the strength increased
gradually with increase of fibre content.
7. Conclusions
Based on the results the following conclusions are drawn.
1. The aim of this project is to reuse or recycle waste materials in a beneficial way to the
community, environment and reducing the cost.
2. Strength of concrete increase with increase of fibre content. The crack width decreased
with increase of fibre content.
3. SIFCON exhibits an extremely ductile behaviour under compression. SIFCON is a more
advantages properties than conventional concrete. Hence it can be used in the
earthquake regions, zones of blast and severe failure.
4. In this study SIFCON strength is high as compared to conventional concrete, it can be
used seismic and explosive resistant structures.
5. The flexural strength are to be included in the further study.

National Conference on Recent Advancement and Sustainability in Civil Engineering, 10th
April2015
RASCE 2015 64
8. References
1. An Yan, Keru Wu, Xiong Zhang (2002), ‗A quantitative on the surface crack pattern of
concrete with high content of steel fiber‘, Cement and Concrete Research 32, pp. 1371-1375.
2. Ashish Kumar Parashar, RinkuParashan (2012), ‗Utility of Wastage Material as Steel Fibre in
Concrete Mix M-20‘, International Journal of Advancements in Research and Technology,
vol.3, Issue 1, pp. 1-7.
3. Ashish Kumar Parashar, RinkuParashan (2012), ‗Utility of Wastage Material as Steel Fibre in
Concrete Mix M-20‘, International Journal of Advancements in Research and Technology,
vol.3, Issue 1, pp. 1-7.
4. Chang Lin, ObadaKayali, Evgeny V. Morozov and David J. Sharp (2011), ‗Integrated Plain
and Slurry Infiltrated fibre Concrete (IP-SIFCON) Composite Beams‘, 16th
International
Conference on Composite Structures, pp.1-2.
5. Dr Ashish K Gurav and Dr.K.B. Prakash, ‗ A study on the effect of alternate wetting and
drying on the strength properties of SIFCON produced from waste coiled steel fibres‘(online),
http://www.nbmcw.com, 2010.
6. Elavarasi D., K. Saravanaraja Mohan and SibiChanderManavalan (2014), ‗Behavior of Fly
ash Based slurry Infiltrated Fibrous Concrete‘, Asian Journal of Applied Sciences 7(4), pp.
268-272.
7. Gopala Krishnan M., D. Elavarasi (2014), ‗Experimental Study on Slurry Infiltrated Fibrous
Concrete With Sand Replaced By Msand‘, International Journal of Engineering Research and
Technology (IJERT), Vol.3 Issue 5,pp. 534-537.
8. Gurav A.K., ‗Effect of replacement of cement by silica fume on the strength properties of
SIFCON produced from waste coiled steel fibres‘(online), http:// www.nbmcw.com, 2009.
9. HalitYazici, HuseyinYigiter,Serdar Aydin, BulentBaradan (2006), ‗Autoclaved SIFCON with
high volume Class C fly ash binder phase‘, Cement and Concrete Research 36, pp. 481-486.
10. Yu-Fei Wu, Jia-Fei Jiang, Kang Liu (2010), ‗Perforated SIFCON blocks – An extraordinarily
ductile material ideal for use in compression yielding structural systems‘, Hong Kong,
Construction and Building Materials 24, pp. 2454-2465.
National Conference on Recent Advancement and Sustainability in Civil Engineering, 10th
April2015
RASCE 2015 65
10. STUDY ON FIBRE REINFORCED TUBULAR BEAM COLUMN
CONNECTION BY VARIOUS CONNECTION METHODS
F.S.FRIEDA, S.SENTHIL SELVEN
SRM University, Chennai, Tamil nadu, India
Email: [email protected]
ABSTRACT
The concrete filled tubular column have the advantage that the steel tube provides confinement, thus
increasing the stiffness and strength of the concrete, while the concrete reduces the possibility of local
and global buckling of the tube wall .Composite steel-concrete framing enables high compressive
strength . Connecting a CFT column to a steel beam has been a challenge to avoid problems due to
brittle failure. In this project, three various types of beam-column connections like end plate
connection, reverse channel connection and through beam connections with hollow column, specimens
with conventional concrete and steel fibre reinforced column infill are proposed. Theoretical
calculations are made and experimentally Static load is applied on all specimens and the strength,
deflection, strain and the type of failures occurred are studied and compared.
Keywords:CFT column to steel beam, End plate,steel fibres, Reverse channel, Through beam
connection.
1. Introduction:
Building with composite steel-concrete framing are increasing around the world, as they combine the
advantages of high erection speed and ductility of the steel structures, with the high compressive
strength of concrete. The concrete-infilled steel tube column has been advantageous in that the steel
tube provides confinement, thus increasing the stiffness and strength of the concrete, while the concrete
reduces the possibility of the local and global buckling of the tube wall. Besides this, the steel tube
column eliminates the column formwork during construction.
1.1. Beam Column Connection
The use of concrete-filled steel tubular (CFST) columns is efficient and economical for both column
and bracing member in modern structures, due to their excellent static and earthquake- resistant
properties such as high strength and stiffness, good ductility, and large energy dissipation capacity.
Their use in this capacity is inhibited by problems in making connections to other members. Early
developments in overcoming the connection problem included additional fittings, through-bolt
connectionsinternal or external diaphragm plates, and passing the beam continuously through the
column.
Concrete is characterized by brittle failure, the nearly complete loss of loading capacity, once failure
is initiated. This characteristic, which limits the application of the material, can be overcome by the
inclusion of a small amount of short randomly distributed steel fibers and can be practiced among
others that remedy weaknesses of concrete, such as low growth resistance, high shrinkage cracking,
low durability, etc. Steel fiber reinforced concrete SFRChas the ability of excellent tensile strength,
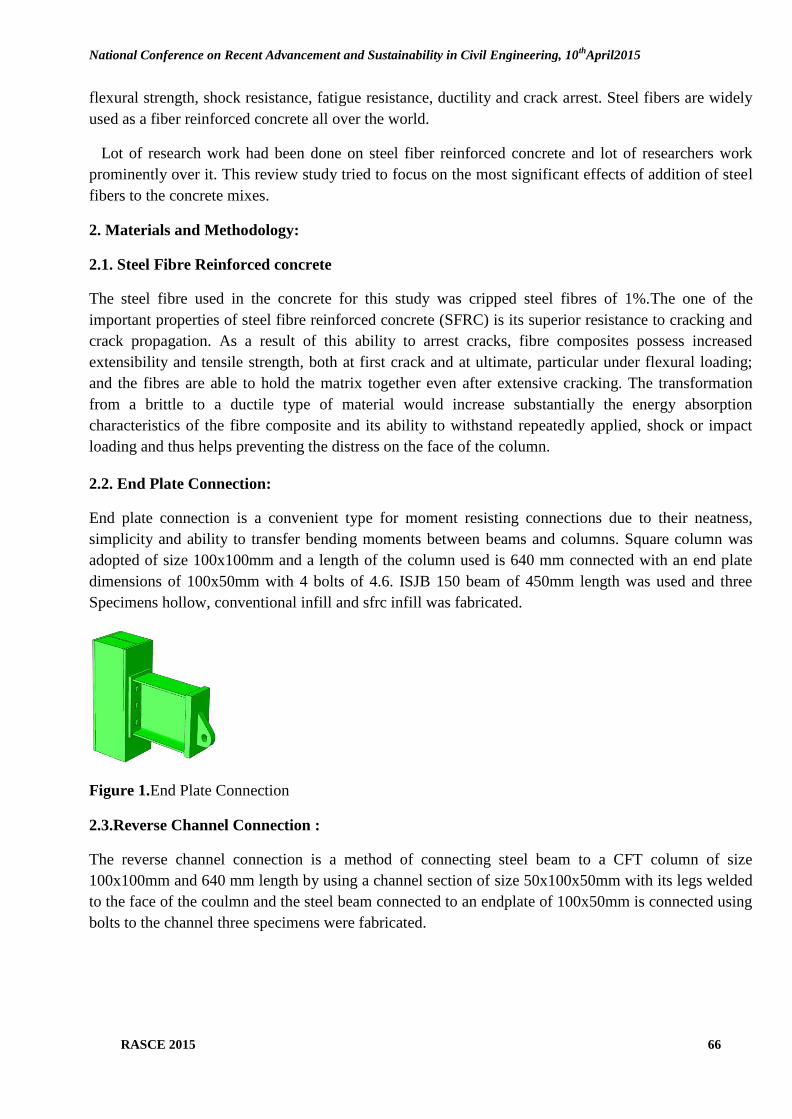
National Conference on Recent Advancement and Sustainability in Civil Engineering, 10th
April2015
RASCE 2015 66
flexural strength, shock resistance, fatigue resistance, ductility and crack arrest. Steel fibers are widely
used as a fiber reinforced concrete all over the world.
Lot of research work had been done on steel fiber reinforced concrete and lot of researchers work
prominently over it. This review study tried to focus on the most significant effects of addition of steel
fibers to the concrete mixes.
2. Materials and Methodology:
2.1. Steel Fibre Reinforced concrete
The steel fibre used in the concrete for this study was cripped steel fibres of 1%.The one of the
important properties of steel fibre reinforced concrete (SFRC) is its superior resistance to cracking and
crack propagation. As a result of this ability to arrest cracks, fibre composites possess increased
extensibility and tensile strength, both at first crack and at ultimate, particular under flexural loading;
and the fibres are able to hold the matrix together even after extensive cracking. The transformation
from a brittle to a ductile type of material would increase substantially the energy absorption
characteristics of the fibre composite and its ability to withstand repeatedly applied, shock or impact
loading and thus helps preventing the distress on the face of the column.
2.2. End Plate Connection:
End plate connection is a convenient type for moment resisting connections due to their neatness,
simplicity and ability to transfer bending moments between beams and columns. Square column was
adopted of size 100x100mm and a length of the column used is 640 mm connected with an end plate
dimensions of 100x50mm with 4 bolts of 4.6. ISJB 150 beam of 450mm length was used and three
Specimens hollow, conventional infill and sfrc infill was fabricated.
Figure 1.End Plate Connection
2.3.Reverse Channel Connection :
The reverse channel connection is a method of connecting steel beam to a CFT column of size
100x100mm and 640 mm length by using a channel section of size 50x100x50mm with its legs welded
to the face of the coulmn and the steel beam connected to an endplate of 100x50mm is connected using
bolts to the channel three specimens were fabricated.

National Conference on Recent Advancement and Sustainability in Civil Engineering, 10th
April2015
RASCE 2015 67
Figure 2.Reverse Channel Connection
2.4. Through Beam Connections:
Through beam connection is a method of connecting the beam to the column using the penetration of
the beam flange, web or entire cross-section through the steel tube. An opening with the shape of the
steel beam will be cut in the steel column, to allow the girder to pass through the column, these are
referred to through beam connections these connections. The angles used to connect are of size
50x50mm.
3.Test On Specimen
The specimens with hollow, PCC infill and SFRC infill were casted and fabricated for all three end
plate, reverse channel connection and through beam connection type of connection.
3.1. Test on End plate connection:
The column was made fixed and the static load was applied through jack, the strain gauges were fixed
on the bottom and top of the flange of the beam and top and bottom on the face of the column near the
connections. The deflectometer was connected near the connection and on the column and values were
obtained this type of testing was carried on for all three connections and the ultimate load, strength and
the mode of failure and the distress occurred on the face of the column was observed.
Figure 3.Set Up Of End Plate Connection

National Conference on Recent Advancement and Sustainability in Civil Engineering, 10th
April2015
RASCE 2015 68
Table 1: Deflection on End Plate Connection and Column
Load Deflection
(connection)
Deflection
(Column)
0 0.2 0
5 2.86 1
10 4.14 2.5
15 5.66 2.86
20 6.93 3.33
25 8.29 4.17
30 10.06 5.23
35 14.39 5.67
Figure 4. Load Vs Deflection ofEnd Plate Connection
Figure 5.Load Vs Strain End Plate Connection
0
20
40
0 5 10 15
LOA
D (
KN
)
DEFLECTION (MM)
Load Vs Deflection (End Plate)
Deflection (Connection) Deflection (Column)
0
50
100
150
200
250
300
350
400
-2000 -1500 -1000 -500 0 500 1000 1500 2000
Load
(K
N)
Deflection (mm)
Load vs Strain (End Plate)
Column Top
Column Bottom
Beam Top
Beam Bottom
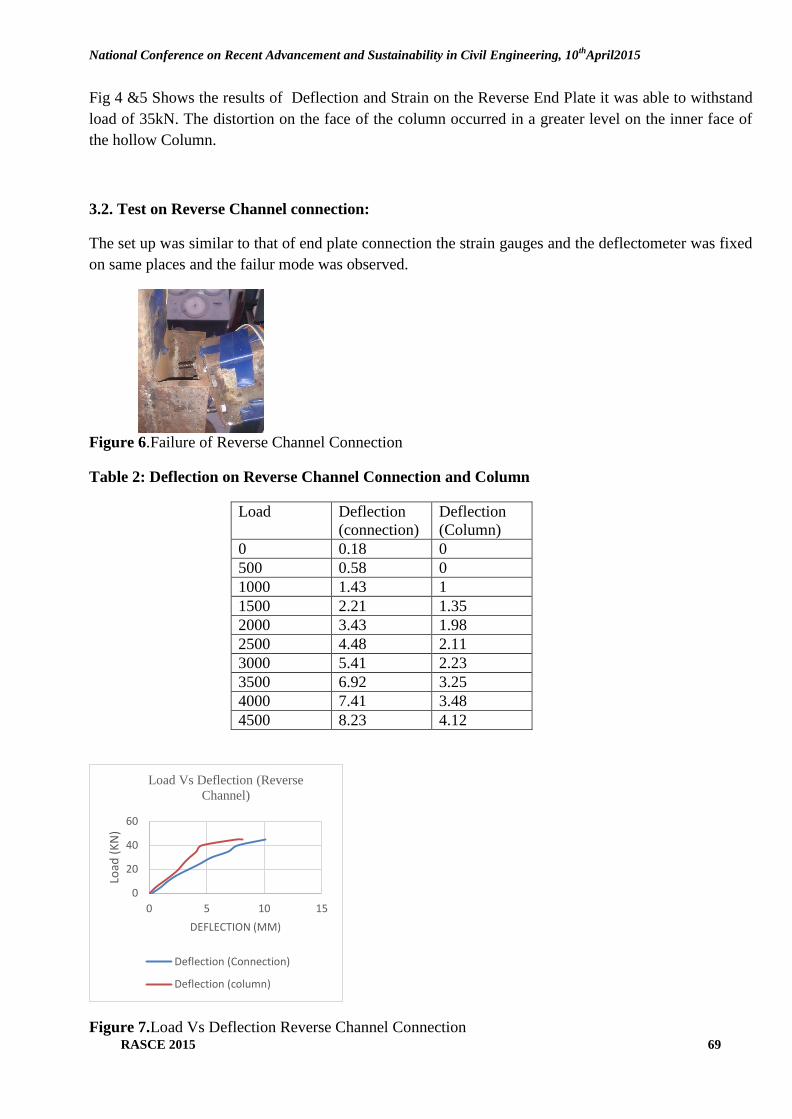
National Conference on Recent Advancement and Sustainability in Civil Engineering, 10th
April2015
RASCE 2015 69
Fig 4 &5 Shows the results of Deflection and Strain on the Reverse End Plate it was able to withstand
load of 35kN. The distortion on the face of the column occurred in a greater level on the inner face of
the hollow Column.
3.2. Test on Reverse Channel connection:
The set up was similar to that of end plate connection the strain gauges and the deflectometer was fixed
on same places and the failur mode was observed.
Figure 6.Failure of Reverse Channel Connection
Table 2: Deflection on Reverse Channel Connection and Column
Load Deflection
(connection)
Deflection
(Column)
0 0.18 0
500 0.58 0
1000 1.43 1
1500 2.21 1.35
2000 3.43 1.98
2500 4.48 2.11
3000 5.41 2.23
3500 6.92 3.25
4000 7.41 3.48
4500 8.23 4.12
Figure 7.Load Vs Deflection Reverse Channel Connection
0
20
40
60
0 5 10 15
Load
(K
N)
DEFLECTION (MM)
Load Vs Deflection (Reverse
Channel)
Deflection (Connection)
Deflection (column)
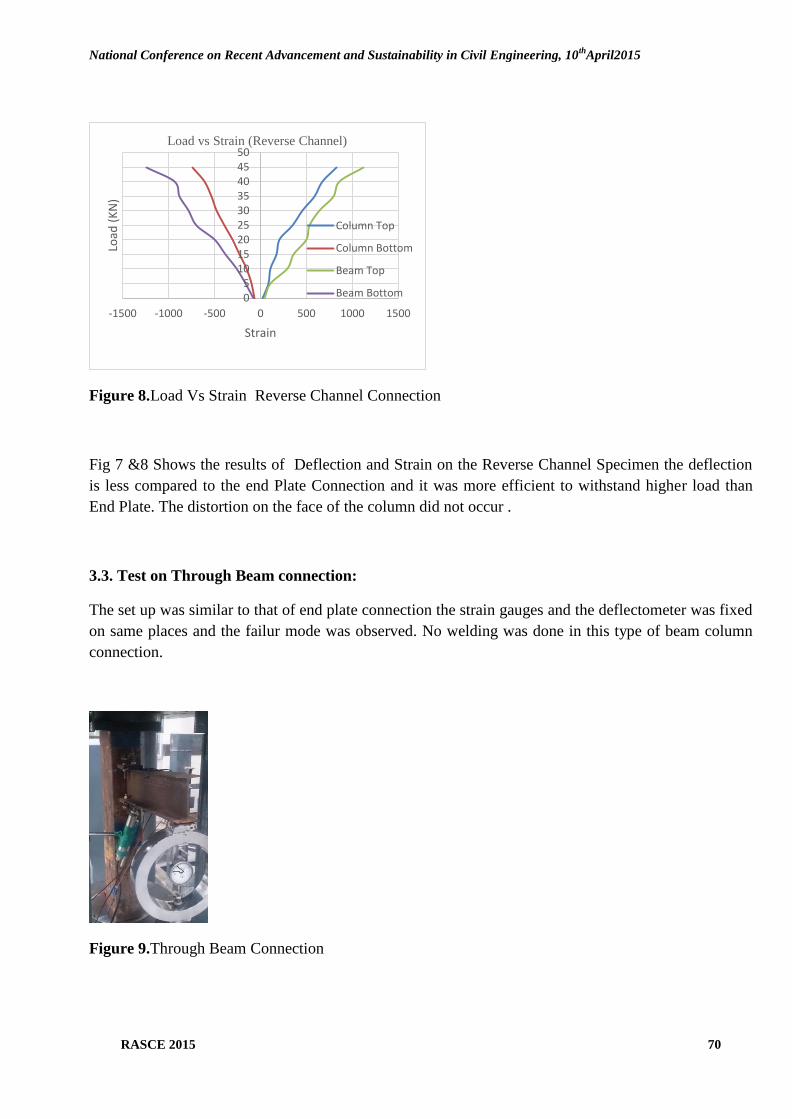
National Conference on Recent Advancement and Sustainability in Civil Engineering, 10th
April2015
RASCE 2015 70
Figure 8.Load Vs Strain Reverse Channel Connection
Fig 7 &8 Shows the results of Deflection and Strain on the Reverse Channel Specimen the deflection
is less compared to the end Plate Connection and it was more efficient to withstand higher load than
End Plate. The distortion on the face of the column did not occur .
3.3. Test on Through Beam connection:
The set up was similar to that of end plate connection the strain gauges and the deflectometer was fixed
on same places and the failur mode was observed. No welding was done in this type of beam column
connection.
Figure 9.Through Beam Connection
05
101520253035404550
-1500 -1000 -500 0 500 1000 1500
Load
(K
N)
Strain
Load vs Strain (Reverse Channel)
Column Top
Column Bottom
Beam Top
Beam Bottom
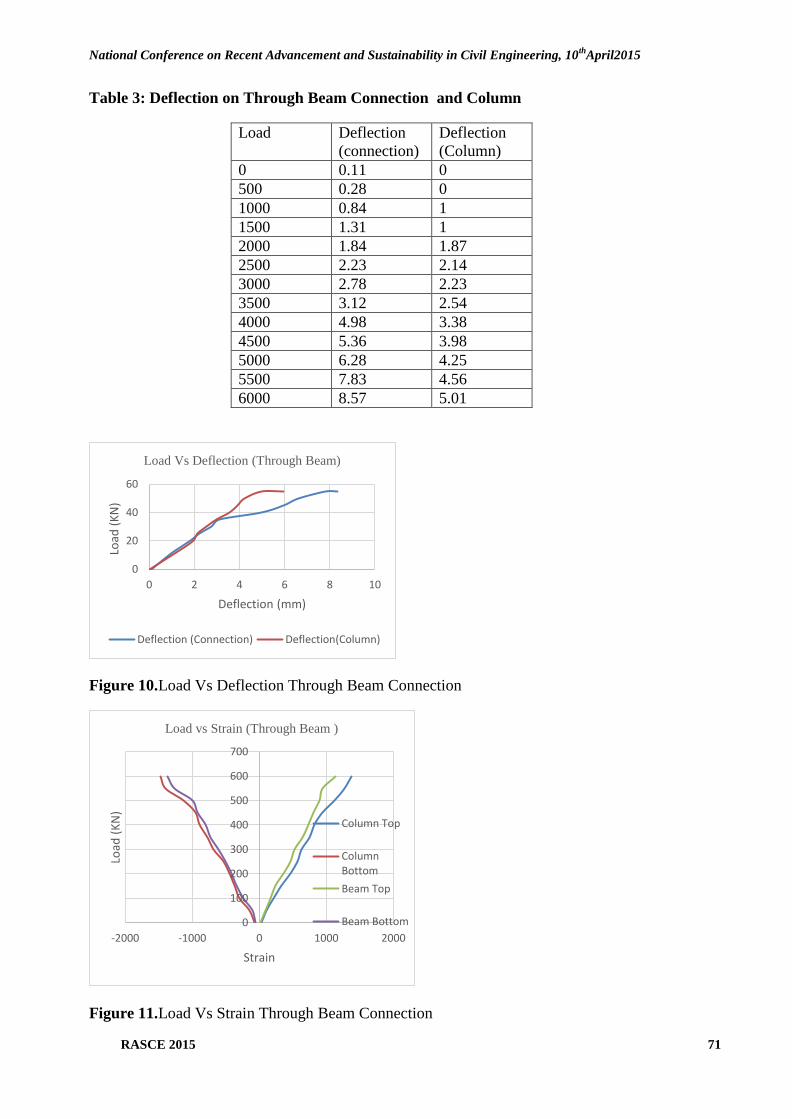
National Conference on Recent Advancement and Sustainability in Civil Engineering, 10th
April2015
RASCE 2015 71
Table 3: Deflection on Through Beam Connection and Column
Load Deflection
(connection)
Deflection
(Column)
0 0.11 0
500 0.28 0
1000 0.84 1
1500 1.31 1
2000 1.84 1.87
2500 2.23 2.14
3000 2.78 2.23
3500 3.12 2.54
4000 4.98 3.38
4500 5.36 3.98
5000 6.28 4.25
5500 7.83 4.56
6000 8.57 5.01
Figure 10.Load Vs Deflection Through Beam Connection
Figure 11.Load Vs Strain Through Beam Connection
0
20
40
60
0 2 4 6 8 10
Load
(K
N)
Deflection (mm)
Load Vs Deflection (Through Beam)
Deflection (Connection) Deflection(Column)
0
100
200
300
400
500
600
700
-2000 -1000 0 1000 2000
Load
(K
N)
Strain
Load vs Strain (Through Beam )
Column Top
ColumnBottom
Beam Top
Beam Bottom

National Conference on Recent Advancement and Sustainability in Civil Engineering, 10th
April2015
RASCE 2015 72
Fig 10 &11 Shows the results of Deflection and Strain on the through Beam Specimen the deflection is
less compared to the reverse channel and end Plate Connection and it was more efficient to withstand
higher loads. The distortion on the face of the column was very less than that of end Plate Connection.
6. Conclusion:
In this study, the tests were Conducted on three different types of connections end plate connection,
Reverse Channel Connection & Through Beam Connection. Out of three connections studied the
through beam connection where site welding can be avoided for square CFT columns showed better
results . The distress on the face of the column was very less compared to the other type of connections
due to the flexural capacity of the beam when the strong column-weak beam criterion is followed
through this through beam connection. The connection was able to withstand higher loads than the
other two types of connections which were studied. .
7 .References:
[1] Ahmed Elremaily, Atorod Azizinamini (2007)‖ Experimental behavior of steel beam to CFT
column connections‖ journal of constructional steel research 51 pg. 326-338.
[2] C.Malaga- chuquitaype ,A.Y. Elghazouli (2010) ―Behaviour of combined channel /angle
connections to tubular columns under monotonic and cyclic loading.‖ Engineering Structures 32
.pg 1600-1616
[3] Chin-Tung Cheng ,Lap-Loi Chung (2003), ―Seismic performance of steel beams to
concrete-filled steel tubular column connections‖journal of constructional steel research 59
pg.405-426
[4] Ikhlas S. Sheet, Umarani Gunasekaran (2013), Gregory A. MacRae ―Experimental
investigation of CFT column to steel beam connections under cyclic loading‖ journal of
constructional steel research 86 pg.167-182.
[5] IS 456 (2000) Indian Standard Plain and Reinforced Concrete -.Code of Practice. (Fourth
Revision).
[6] IS 10262 (2009), Indian Standard Concrete Mix Proportioning Guidelines
[7] IS 12269 (1987), Indian Standard for 53 grade OPC, reaffirmed January 1999.
[8] IS 516 (1959), Indian Standard for testing of specimens, reaffirmed January 2004.
[9] IS 5816 (1970), Indian Standard for testing of specimens, reaffirmed January 1999.
[10] Jingfeng wang, lin Zhang, B.F.Spencer J (2013). ―Seismic response of extended end plate
joints to CFT steel columns. Engineering Structures 49 pg.876-892.
[11]J.Beutel, D.Thambirathnam (2010). N. perera ―Cyclic behavior of concrete filled steel
tubular column to steel beam connections‖ Engineering Structures 24 pg. 29-38
National Conference on Recent Advancement and Sustainability in Civil Engineering, 10th
April2015
RASCE 2015 73
11. ANALYSIS OF THE REINFORCED CONCRETE GIRDER BRIDGE
K.Preethi[1],
D.Arulprakash[2]
[1] PG Student, Department of Structural Engineering,
SRM University
[2] Assistant professor, Department of Civil Engineering, SRM
University
ABSTRACT
T-beam and slab bridge decks are one of the principle types of cast-in-situ construction
of concrete bridges. T-beam bridge decks consist of a reinforced concrete slab integral with girders. It
is a simple and economical solution for medium span bridges. A simple span T-beam bridge was
analyzed by using I.R.C specifications for live loads vide IRC: 6 - 2014. The grillage method is used
to model the deck slab. A typical T-beam deck slab generally comprises the longitudinal girders,
continuous deck slab over girders cast monolithically to act as T- beams and the cross girders to
provide lateral rigidity to the bridge deck. The I.R.C loadings Class A, 70R wheeled and 70R tracked
and their combinations were ran on the deck as per relevant IRC stipulations. The bending moments
and shear forces for all load cases like Dead Load, Super Imposed Live Loads and Vehicular Live
Loads, are computed for each of the girders vise end girder and intermediate girder. The results of the
analysis show that the maximum bending moment and shear force occurs in the end girder. The beam
acts like a simply support. The maximum design moments and shear forces are obtained by adding
the live loads and dead load bending moments. The maximum bending moment occur at mid span and
the maximum shear force occurs at the support. The reinforcement in the main longitudinal girders are
designed for the maximum moments and shear developed in the girders using limit state method of
design as per IRC:112-2011 and detailed the same accordingly.
INTRODUCTION
A bridge is a structure providing passage over an obstacle without closing the way beneath.
Reinforced concrete is well suited for the construction of bridges in the small and medium span
range. The usual types of reinforced concrete bridges are slab bridges, girder and slab (T-beam)
bridges, voided decks, rigid frame bridges, arch bridges and bow string girder bridges
The flange of the girder serves as a compression member in resisting compressive stress. The
web of the girder serves to resist shear. The bottom bulb is provided to place the tension
reinforcement. The structure is so named because the main longitudinal girders are designed as T-
beam integral with part of the deck slab, which is cast monolithically with the girders. T-beam bridge
decks consist of a reinforced concrete slab integral with girders. It is a simple and economical
solution for medium span bridges. The grillage method is used to model the deck slab. The analysis is
done using the software STAAD ProV8. Axial, flexural and torsion stiffness are considered for all
members of the grillage model. The longitudinal girders are supported by neoprene bearings and the
support conditions are accordingly modelled.
DETAILS OF THE REINFORCED GIRDER BRIDGE
Span = 24 m
Number of lanes = 2
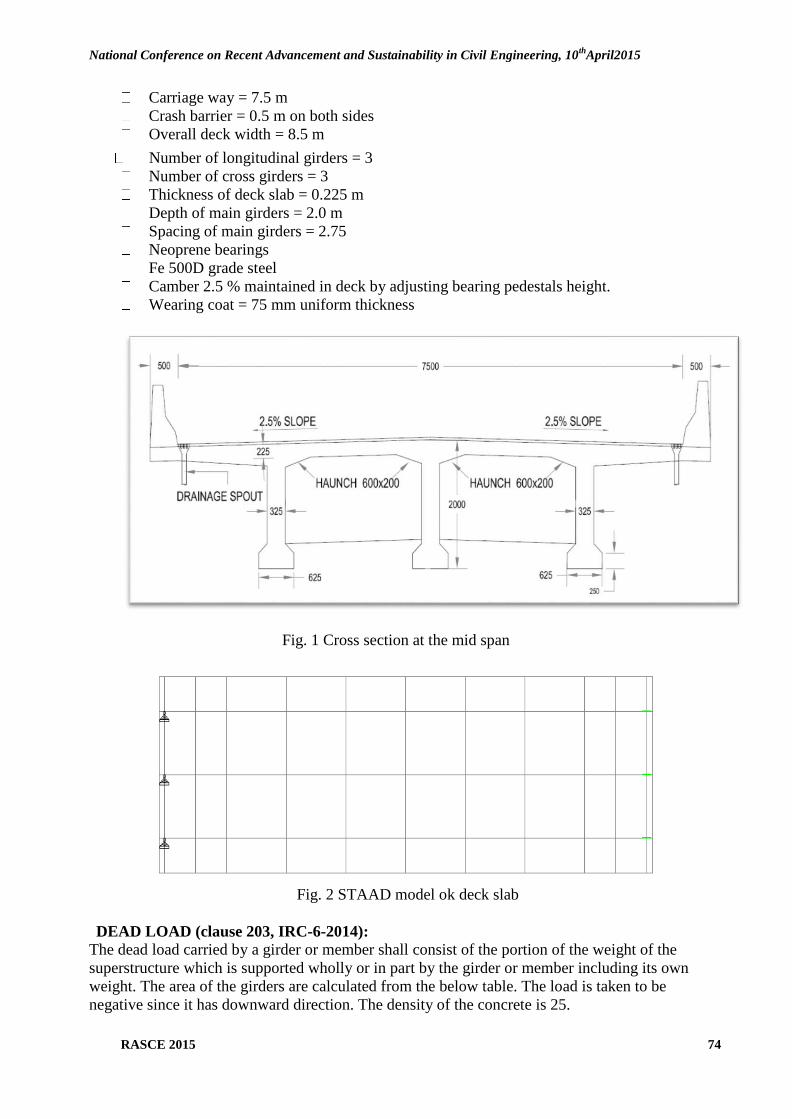
National Conference on Recent Advancement and Sustainability in Civil Engineering, 10th
April2015
RASCE 2015 74
Carriage way = 7.5 m
Crash barrier = 0.5 m on both sides
Overall deck width = 8.5 m
Number of longitudinal girders = 3
Number of cross girders = 3
Thickness of deck slab = 0.225 m
Depth of main girders = 2.0 m
Spacing of main girders = 2.75
Neoprene bearings
Fe 500D grade steel
Camber 2.5 % maintained in deck by adjusting bearing pedestals height.
Wearing coat = 75 mm uniform thickness
Fig. 1 Cross section at the mid span
Fig. 2 STAAD model ok deck slab
DEAD LOAD (clause 203, IRC-6-2014): The dead load carried by a girder or member shall consist of the portion of the weight of the
superstructure which is supported wholly or in part by the girder or member including its own
weight. The area of the girders are calculated from the below table. The load is taken to be
negative since it has downward direction. The density of the concrete is 25.
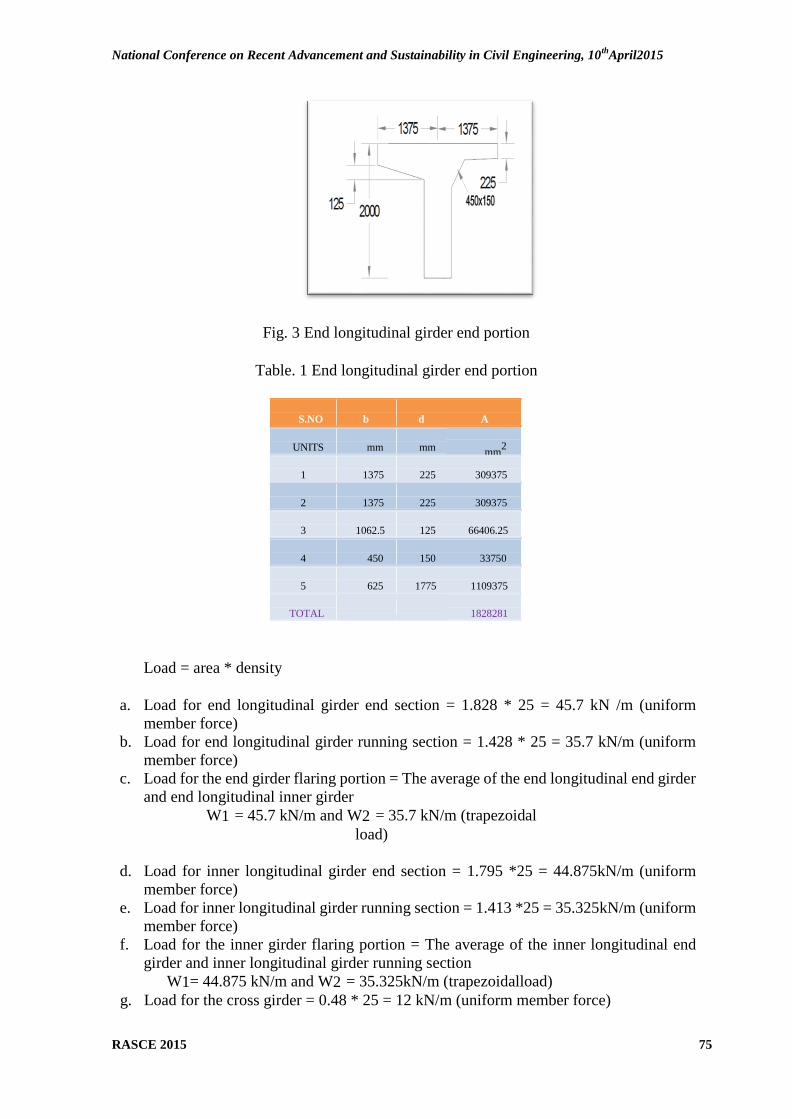
National Conference on Recent Advancement and Sustainability in Civil Engineering, 10th
April2015
RASCE 2015 75
Fig. 3 End longitudinal girder end portion
Table. 1 End longitudinal girder end portion
S.NO
b
d
A
UNITS
mm
mm
mm2
1
1375
225
309375
2
1375
225
309375
3
1062.5
125
66406.25
4
450
150
33750
5
625
1775
1109375
TOTAL
1828281
Load = area * density
a. Load for end longitudinal girder end section = 1.828 * 25 = 45.7 kN /m (uniform
member force)
b. Load for end longitudinal girder running section = 1.428 * 25 = 35.7 kN/m (uniform
member force)
c. Load for the end girder flaring portion = The average of the end longitudinal end girder
and end longitudinal inner girder
W1 = 45.7 kN/m and W2 = 35.7 kN/m (trapezoidal
load)
d. Load for inner longitudinal girder end section = 1.795 *25 = 44.875kN/m (uniform
member force)
e. Load for inner longitudinal girder running section = 1.413 *25 = 35.325kN/m (uniform
member force)
f. Load for the inner girder flaring portion = The average of the inner longitudinal end
girder and inner longitudinal girder running section
W1= 44.875 kN/m and W2 = 35.325kN/m (trapezoidalload)
g. Load for the cross girder = 0.48 * 25 = 12 kN/m (uniform member force)
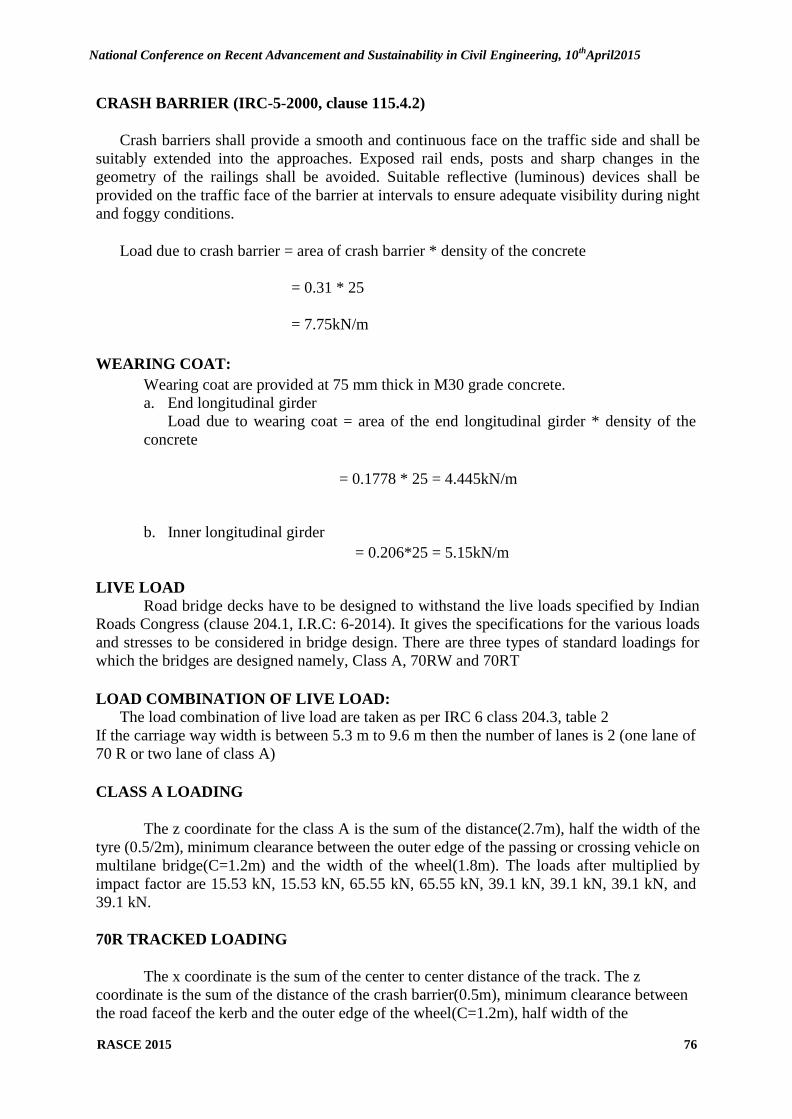
National Conference on Recent Advancement and Sustainability in Civil Engineering, 10th
April2015
RASCE 2015 76
CRASH BARRIER (IRC-5-2000, clause 115.4.2)
Crash barriers shall provide a smooth and continuous face on the traffic side and shall be
suitably extended into the approaches. Exposed rail ends, posts and sharp changes in the
geometry of the railings shall be avoided. Suitable reflective (luminous) devices shall be
provided on the traffic face of the barrier at intervals to ensure adequate visibility during night
and foggy conditions.
Load due to crash barrier = area of crash barrier * density of the concrete
= 0.31 * 25
= 7.75kN/m
WEARING COAT:
Wearing coat are provided at 75 mm thick in M30 grade concrete.
a. End longitudinal girder
Load due to wearing coat = area of the end longitudinal girder * density of the concrete
b. Inner longitudinal girder
= 0.1778 * 25 = 4.445kN/m
LIVE LOAD
= 0.206*25 = 5.15kN/m
Road bridge decks have to be designed to withstand the live loads specified by Indian
Roads Congress (clause 204.1, I.R.C: 6-2014). It gives the specifications for the various loads
and stresses to be considered in bridge design. There are three types of standard loadings for
which the bridges are designed namely, Class A, 70RW and 70RT
LOAD COMBINATION OF LIVE LOAD: The load combination of live load are taken as per IRC 6 class 204.3, table 2
If the carriage way width is between 5.3 m to 9.6 m then the number of lanes is 2 (one lane of
70 R or two lane of class A)
CLASS A LOADING
The z coordinate for the class A is the sum of the distance(2.7m), half the width of the
tyre (0.5/2m), minimum clearance between the outer edge of the passing or crossing vehicle on
multilane bridge(C=1.2m) and the width of the wheel(1.8m). The loads after multiplied by
impact factor are 15.53 kN, 15.53 kN, 65.55 kN, 65.55 kN, 39.1 kN, 39.1 kN, 39.1 kN, and
39.1 kN.
70R TRACKED LOADING
The x coordinate is the sum of the center to center distance of the track. The z
coordinate is the sum of the distance of the crash barrier(0.5m), minimum clearance between
the road faceof the kerb and the outer edge of the wheel(C=1.2m), half width of the

National Conference on Recent Advancement and Sustainability in Civil Engineering, 10th
April2015
RASCE 2015 77
track(0.84/2m) and the center to center distance of the track(2.06m). As per IRC-6-2014,
clause 211.3 the impact factor for tracked vehicles is 1.1 and the loads after multiplied by the
impact factor are 38.5kN, 38.5kN, 38.5kN, 38.5kN, 38.5kN, 38.5kN, 38.5kN, 38.5kN,
38.5kN and 38.5kN
70R WHEELED LOADING
The loads of the 70R wheeled vehicle are 80kN, 120 kN, 120 kN, 170 kN, 170 kN,170
kN, and 170kN at the distance 3.96m, 1.52m, 2.13m, 1.37m, 3.05m and 1.37m respectively.
The impact factor is 1.17. The loads are multiplied by the impact factor
Table 2 Forces in end longitudinal girder
Section Due to Load Section 6 Section 5 Section Section Section Section 1
Factors 4 3 2
Dist.
From
Support
0 1.50 3.00 5.9 8.8 11.7
Member No 14 15 16 17 18
Node No 15 16 16 17 17 18 18 19 19 20
Bendin
g
Moment
, kNm
Girder
+ Deck
1.35 131.9 758.0 758.1 1285.1 1285.1 2068.6 2068.7 2551.3 2551.4 2733.2
W/C 1.75 15.4 91.4 91.5 157.4 157.4 256.2 256.2 317.0 318.0 334.0
Crash
Barrier
1.35 11.9 101.8 101.4 176.0 175.6 279.7 279.8 343.3 343.8 364.6
VLL 1.50 1.5 661.2 1.4 1122.0 1.2 1834.5 0.8 2286.0 0.4 2543.4
VL
L
Cas
e
331 392 331 397 331 404 331 404 331 414
Shear
Force
, kN
Girder
+ Deck
1.35 451.7 383.1 383.1 322.1 321.9 218.4 218.2 114.7 114.5 10.9
W/C 1.75 54.0 47.3 47.3 40.6 40.5 27.6 27.4 14.5 14.4 1.5
Crash
Barrier
1.35 65.8 54.2 55.5 43.9 47.1 24.7 33.2 10.7 18.0 4.51
VLL 1.5 375.0 0.3 343.8 5.0 350.7 37.1 295.9 66.3 242.6 93.4
VLL
Case
392 332 398 190 398 207 410 219 421 230
Design bending moment,
kNm
385.02 2899.35 1551.04 4201.69 2424.55 7078.87 3714.84 8716.43 4466.54 9495.01
Design shear force, kN 1590.83 1070.78 1479.33 590.50 1336.41 708.64 986.18 590.53 624.433 493.93

National Conference on Recent Advancement and Sustainability in Civil Engineering, 10th
April2015
RASCE 2015 78
Fig. 4 Bending moment
diagram
SUMMARY
Analysis of a reinforced concrete girder is done using STAAD pro. The section
properties are calculated and assigned .The load due to dead load, crash barrier,
wearing coat, vehicular live load (class A, 70 R tracked, 70R wheeled) are given. Each
member and node are checked for the maximum bending moment and shear force. The
maximum bending moment and shear force occurs in end girder. The maximum
bending moment is 2543 kNm (Member 18).The maximum shear force is 451 kN
(member 14).
The maximum factored design forces are:
Design bending moment – 9495 kNm (Including torsion effects)
Design shear force – 1590 kN (Including torsion effects)
REFERENCES
[1] Amit Saxena, ―Comparative Study of the Analysis and Design of T-Beam Girder and
Box Girder Superstructure‖ 2013; ISSN: 2320 – 8791
[2] IRC 6-2010, ―Standard Specifications and Code of Practice for Road Bridges‖, Section
II, loads and stresses, The Indian Roads Congress, New Delhi, India, 2010.
[3] IRC: 5-2000, ―Standard Specifications and Code of Practice for Road Bridges‖,
Section I, general features of design, The Indian Roads Congress, New Delhi, India,
2000
[4] D. Johnson Victor (1980), Essentials of bridge engineering, Oxford & IBH
Publisher, Delhi
[5] N. Krishna Raju (2010), ―Design of bridges‖, 4th edition, Tata McGraw-Hill
Education Private limited, New Delhi

National Conference on Recent Advancement and Sustainability in Civil Engineering, 10th
April2015
RASCE 2015 79
12. STUDY ON THE INFLUENCE OF MARINE ALGAE
PROPERTIES USE ON THE CONCRETE
Abdul raffi1,S.Divya
2.
1Student, Department of Civil Engineering,Structural engineering, SRM University.
2Assistant Professor, Department of Civil Engineering, Structural engineering, SRM University.
Email:[email protected],
ABSTRACT Study of marine algae has started. Because of chemical reaction with cement and the
environment gets free from pollute and therefore the introduction of algae in concrete can control
these harmful reaction. Since algae is environmental friendly.This makes the concrete more
economic and, at the same time, there is a reduction of the problem of the waste. In this paper
marine brown algae is added in to concrete in wet form to find out the compression, split tensile,
slump cone, compaction factor and shrinkage test with 5%, 10%, and 15% of marine brown
algae with different grade of concrete. In which 15% of marine brown algae seen to be
predominate from remaining percentage. By comparison, wet form of marine brown algae has
good homogeneous mix and improvement of strength in all tests.
Keyword: Marine brown algae, Compression Test, Split Tensile Test, Shrinkage Test
Introduction:
Concrete based on Portland cement is the most widely usedconstruction material in the world,
and its production follows atrend of growth. In 2011, the world production of Portland cement
reached 2.8x10⁹ tones and is expected to increase around 4x10
9 tones for the 2050. About 15%
of the total concrete production contains chemical admixtures, which are chemicals added to
concrete, mortar or grout at the time of mixing to modify their properties, either in fresh or
hardened state. Algae are photosynthetic aquatic plants that utilize inorganic nutrients such as nitrogen and
phosphorus. The Phaeophyceae or brown algae (singular: alga), is a largegroup of mostly marine
multicellular algae, including manyseaweeds. Worldwide there are about 1500–2000 species of
brown algae
Some species are of sufficient commercial importance, such as Ascophyllum nodosum, that they
have become subjects of extensive research in their own right. Most brown algae contain the
pigment fucoxanthin, which is responsible for the distinctive greenish brown color that gives
them their name. Genetic studies show their closest relatives to be the yellow green algae. Brown
algae exist in a wide range of sizes and forms. The smallest members of the group grow as tiny,
feathery tufts of threadlike cells no more than a few centimeters long. Some species have a stage
in their life cycle that consists of only a few cells, making the entire alga microscopic. Other
groups of brown algae grow too much larger sizes.Used as fertilizer, energy source, food source,
for pigments, pollution control, and medicinal purposesWhatever their form, the body of all

National Conference on Recent Advancement and Sustainability in Civil Engineering, 10th
April2015
RASCE 2015 80
brown algae is termed a thallus, indicating that it lacks the complexxylem and phloem of
vascular plants. This does not mean that brown algae completely lack specializedstructures. But,
because some botanists define "true" stems, leaves, and roots by the presence of thesetissues,
their absence in the brown algae means that the stemlikeand leaflikestructures found in
somegroups of brown algae must be described using different terminology. Although not all
brown algae arestructurally complex, those that are typically possess one or more characteristic
parts.
2. Discussions and test results:
2.1. Compressive strength:
The compressive strength of wet marine brown algae concrete increased by 4% when compared
with conventional concrete conventional concrete. Cube size 15x15x15mm diameter .Testing is
shown in Fig.1and2. The results are presented in Table.1and2.comparison is shown in below fig.
Fig.1 Fig.2
2.2Split tensile strength:
Splitting tensile strength of wet marine brown algae concrete increased by 7.43N/mm² (8.01% of
compressive strength), conventional concrete is 5.98 N/mm².cylinder size 100x200mm diameter.
Testing is shown in Fig.3.The results are presented in Table.3 and 4.The comparison is shown in
below Fig.11.
Fig.3

National Conference on Recent Advancement and Sustainability in Civil Engineering, 10th
April2015
RASCE 2015 81
2.3 Shrinkage test:
The Shrinkage cracks such as shown in our photograph below are found in poured concrete, are
easily recognizable, and can be distinguished from other types of cracks that occur later in the
life of afloor slab. The size of the slab 850x540x250 mm diameter 15% of wet marine brown
algae is having greater strength and the percentage of wet marine brown algae
concrete+cement+sand is chosen to conduct shrinkage test.Testing is shown in below fig.4
Fig.4
S.No
Type of
concrete
Compression Test (N/mm2)
3 Days 7 Days 28 Days
1 M25 25.04 28.74 33.3
2 M35 26.50 33.12 42.8
3 M40 27.50 34.72 47.48
Table No: 1 Conventional concrete for compression Test
S.NO Type of
concrete
3 Days 7 Days 28 Days
5% 10% 15% 5% 10% 15% 5% 10% 15%
1 M25 24.9 25.1 23.01 26.4 28.7 26.7 29.3 30.9 31.2
2 M35 25.1 26.12 29.71 30.39 33.9 35.14 40.61 41.6 47.92
3 M40 26.5 28.1 30.79 34.1 35.4 39.71 46.7 49.4 55.72
Table No.2 Compression Test values of Wet Marine Brown Algae.

National Conference on Recent Advancement and Sustainability in Civil Engineering, 10th
April2015
RASCE 2015 82
S.No
Type of
concrete
Split Tensile Test (N/mm2)
3 Days 7 Days 28 Days
1 M25 2.31 2.68 3.39
2 M35 3.31 4.01 5.12
3 M40 3.79 4.34 5.98
Table No: 3 Conventional concrete for Spilt Tensile Test
S.NO Type of
concrete
3 Days 7 Days 28 Days
5% 10% 15% 5% 10% 15% 5% 10% 15%
1 M25 2.3 2.57 2.33 2.58 2.33 2.9 3.1 3.12 3.15
2 M35 3.1 3.57 3.5 3.9 4.5 4.70 3.79 5.12 5.5
3 M40 3.12 3.63 4.43 4.1 4.52 5.5 4.70 5.70 7.43
Table No:4 Split tensile test for Wet Marine Brown Algae
Compression Test:
The compression strength wet and conventional concrete comparison is shown in Fig.7, and 8
Fig.7 Conventional concrete Fig.8 wet marine brown algae
Split tensile test: The strength comparison to the Wet marine brown algae concrete and
conventional concrete. Is shown in the Fig.9and 10
0
10
20
30
40
50
60
com
pre
ssio
n st
ren
gth
N/m
m2
Days of curing
5%M25
5%M35
5%M40
10%M25
10%M35
10%M40
15%M25
15%M35
15%m40
0
10
20
30
40
50
M25 M35 M40com
pre
ssio
n s
tre
ngt
h N
/mm
2
Type of concrete
3 Days
7Days
28days
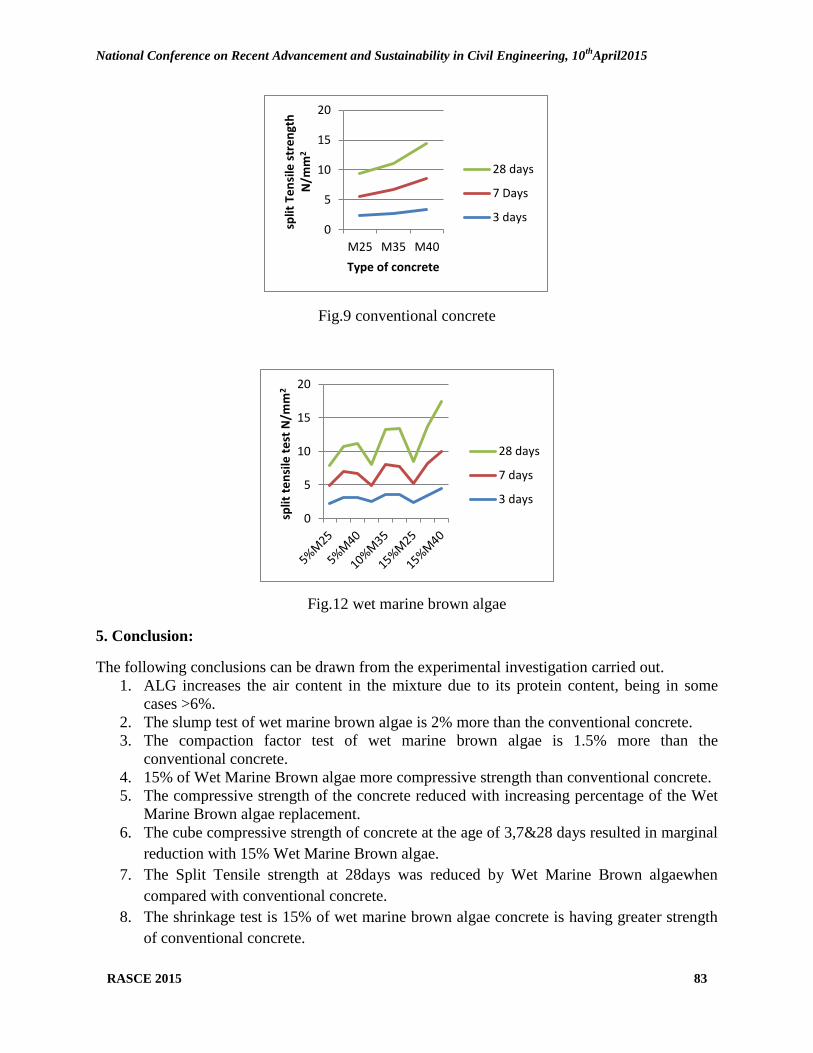
National Conference on Recent Advancement and Sustainability in Civil Engineering, 10th
April2015
RASCE 2015 83
Fig.9 conventional concrete
Fig.12 wet marine brown algae
5. Conclusion:
The following conclusions can be drawn from the experimental investigation carried out.
1. ALG increases the air content in the mixture due to its protein content, being in some
cases >6%.
2. The slump test of wet marine brown algae is 2% more than the conventional concrete.
3. The compaction factor test of wet marine brown algae is 1.5% more than the
conventional concrete.
4. 15% of Wet Marine Brown algae more compressive strength than conventional concrete.
5. The compressive strength of the concrete reduced with increasing percentage of the Wet
Marine Brown algae replacement.
6. The cube compressive strength of concrete at the age of 3,7&28 days resulted in marginal
reduction with 15% Wet Marine Brown algae.
7. The Split Tensile strength at 28days was reduced by Wet Marine Brown algaewhen
compared with conventional concrete.
8. The shrinkage test is 15% of wet marine brown algae concrete is having greater strength
of conventional concrete.
0
5
10
15
20
M25 M35 M40
split
Te
nsi
le s
tre
ngt
h
N/m
m2
Type of concrete
28 days
7 Days
3 days
0
5
10
15
20
split
te
nsi
le t
est
N/m
m2
28 days
7 days
3 days

National Conference on Recent Advancement and Sustainability in Civil Engineering, 10th
April2015
RASCE 2015 84
9. The wet marine brown algae concrete is preferable since the strength property is more
than dry condition.
10. The strength of wet marine brown algae was 55.76 N/mm2 for 28 days of M40 grade of
concrete.
11. The wet marine brown algae concrete strength was 7.43 N/mm2 for 28 days of split
tensile test of M40 grade of concrete.
References:
[1] Schneider M, Romer M, Tschudin M, Bolio H. Sustainable cement production presentand
future. Cem Concr Res 2011;41(7):642–50.
[2] Plank J. Applications of biopolymers and other biotechnological products in Building
materials. Appl Microbiol Biotechnol 2004;66(1):1–9.
[3] Dransfield J. Admixtures for concrete, mortar and grout. In: Newman J, Choo
BS, editors.Advanced concrete technology, constituent materials. Oxford: Butterworth-
Heinemann; 2003.
[4] Nanthagopalan P, Santhanam M. A new empirical test method for the
optimization of viscosity modifying agent dosage in self-compacting
concrete. Mater Struct 2010;43:203–12.
[5] Okamura H, Ouchi M. Self-compacting concrete.J Adv ConcrTechnol2003;1(1):515.
[6] Gaimster R, Dixon N. Self-compacting concrete. In: Newman J, Choo BS, editors.
Advanced concrete technology, processes. Oxford: Butterworth-Heinemann;2003.
[7] Łaz´niewska-Piekarczyk B. The influence of selected new generation
admixtures on the workability, air-voids parameters and frost-resistance of
self-compacting concrete. Constr Build Mater 2012;31:310–9
[8] Collepardi M. Admixtures used to enhance placing characteristics of concrete.
Cem Concr Compos 1998;20(2–3):103–12.
[9]. ACI committee 212, Admixtures for concrete, (1963), Journal of ACI. Vol. 60, pp.1481-
1524.
[10]. IS 10262 – 1982: Recommended guide lines for concrete mix design, Indian standard
institution, New Delhi.
[11]. Neville, A.M., ―Properties of Concrete‖, (1973), Publishers the English language book
society; pp-629-632.
[12]. Majid Ali, ―Coconut Fiber – A Versatile Material and its Applications in Engineering‖
(2010), University polytecnical delle Marche, Ancona, Italy.
[13]. Malhotra, V.M., ―No –fines concrete its properties and applications‖, (1976), journal of
American Concrete Institute, title no. 73-54, Nov., pp-628-644.
[14]. Mannan. M. A and Ganapathy .C, ―Engineering properties of concrete with oil palm shell
as coarse aggregate‖, (2002), International Journal of Construction and Building Materials, pp.
29-34.
National Conference on Recent Advancement and Sustainability in Civil Engineering, 10th
April2015
RASCE 2015 85
13. STUDY ON BEHAVIOR OF REMOVAL OF COVER CONCRETE
OVER REINFORCED CONCRETE BEAM
Ch.Sowmith1, S.Divya
2
1Student, Department of Civil Engineering, Structural engineering,SRM University.
2Assistant Professor, Department of Civil Engineering,
Structural engineering, SRM University.
Email:[email protected],
ABSTRACT
In the process of engineering design and construction, the concrete cover thickness is very
critical. If the concrete cover thickness does not reach to design specifications and drawing
requirements, it will be easy to cause some defects, such as surface cracks on building
components and even reduce the structure strength and durability etc. In this paper, strength
criteria is consider with three specimens with gradual removal of clear cover thickness (50-25-0
mm) of M35 grade of concrete to investigate the flexure behavior of over reinforced concrete
beam. The results of laboratory investigation on removal clear concrete are present. Data
presented includes load v/s deflection characteristics, crack width and stiffness when tested on 28
days.
Key words: Cover concrete, clear cover, flexure
1. Introduction
Concrete is a composite material composed mainly of water, aggregate, and cement The
word concrete comes from the Latin word "concretus" (meaning compact or condensed), the
perfect passive participle of "concrescere", from "con-" (together) and "crescere" (to grow).
In modern times, researchers have experimented with the addition of other materials to
create concrete with improved properties, such as higher strength, electrical conductivity, or
resistance to damages through spillage.
Concrete is widely used for making architectural structures, foundations, brick/block walls,
pavements, bridges/overpasses, highways, runways, parking structures, dams, pools/reservoirs,
pipes, footings for gates, fences and poles and even boats. Concrete is used in large quantities
almost everywhere mankind has a need for infrastructure.
Concrete cover, in reinforced concrete, is the least distance between the surface of
embedded reinforcement and the outer surface of the concrete (ACI 130). The concrete cover
depth can be measured with a cover meter. Therefore, firstly, the concrete cover thickness should
be selected and designed reasonably as per building structure types and its environment in

National Conference on Recent Advancement and Sustainability in Civil Engineering, 10th
April2015
RASCE 2015 86
engineering design. Secondly, the construction process should be controlled strictly, i.e., take
some measures to ensure the design thickness of concrete cover, control the location of steel bar
and formwork, formwork removal time and enough concrete curing period.
In the concrete structure, the rebar and concrete are so different in nature but they can work
together mainly due to bonding stress between rebar and concrete. As to the high-strength
deformed rebar, if the concrete cover is not thick enough, its external concrete will crack,
resulting in bonding strength descending and affecting the durability of structure. The work
conducted is given by consultancy of metro water supply to know behavior of the beam for
varying clear cover. So this experimental work is carried out.
2. Experimental Investigation
2.1 Materials
The materials used in the mix design were ordinary Portland cement (OPC) of 53 grade,
river sand, 12.5 mm aggregate and water. Beam specimens were made with M35 grade of
concrete. Fe 415 grade steel was used for longitudinal reinforcement and for stirrups.
2.2 Test specimen details
Three numbers of reinforced concrete beams of M35 grade of concrete with clear cover
of 50mm, 25mm and 0 mm were casted and tested. The span of the beam was 1500 mm and of
sizes 100 mm x150 mm, 100mm x 125 mm and 100 mm x 105 mm.
2.3 Test setup
The testing was carried out in a loading frame of 40 t capacity. All the specimens were
white washed in order to facilitate marking of cracks. The beams are simply supported and two
point loads are applied at L/3 distance from each end of supports under a load control mode. Dial
gauge was fixed at bottom of beam for measuring deflections. The development of cracks was
observed and the crack widths were measured using a hand-held microscope with an optical
magnification of X40 and a sensitivity of 0.01 mm. Figure 1 shows the arrangement of specimen
with dial gauge and hand held microscope.
Fig 1: Arrangement of the specimen with dial gauge and hand held microscope.

National Conference on Recent Advancement and Sustainability in Civil Engineering, 10th
April2015
RASCE 2015 87
3. Results and discussion
3.1 General observations:
Vertical flexural cracks were observed in the constant-moment region and final failure occurred
due to crushing of the compression concrete with significant amount of ultimate deflection.
When the maximum load was reached, the concrete cover on the compression zone started to fall
for the beams. Figure 2 shows the failure pattern of the test specimens. Crack formations were
marked on the beam at every load interval at the tension steel level.
Fig 2: Failure Pattern of the beams
3.2 Load-deflection curve
The experimental load v/s deflection curves of the RC beams with clear cover of 50mm, 25 mm ,
and 0 mm are tested at 28 days are shown in figure 3, 4, & 5 respectively and values are given in
table 2. The ultimate loads for 50 mm, 25 mm and 0 mm clear cover are 66.2 kN, 61.2 kN and 49
kN respectively. The valves of initial crack, type of crack, crack pattern, initial crack width, and
maximum crack width and stiffness are given in table 2.
Table 1: Load v/s deflection values
S.no
Grade of
concrete
Load (T)
Deflection(mm)
For 50 mm
clear cover
Deflection
(mm)
For 25 mm
clear cover
Deflection
(mm)
For 0 mm
clear cover
0.25 0 0.16 0.07
0.5 0.22 0.51 0.25
0.75 0.75 0.81 0.58
1 1.23 1.18 0.98
1.25 1.85 1.58 1.45
1.5 2.46 2.04 1.83
1.75 3.08 2.55 2.39
2 3.65 3.07 2.94
2.25 4.27 3.6 3.65

National Conference on Recent Advancement and Sustainability in Civil Engineering, 10th
April2015
RASCE 2015 88
2
M35
2.5 4.77 4.23 4.31
2.75 5.26 4.78 4.85
3 5.84 5.33 5.5
3.25 6.39 5.91 6.38
3.5 7.14 6.47 7.34
3.75 7.81 7 8.58
4 8.4 7.56 10.08
4.25 9.15 8.22 11.04
4.5 10.4 8.85 12.41
4.75 10.89 9.58 14
5 11.74 10.2 -
5.25 12.58 10.42 -
5.5 13.4 11.16 -
5.75 14.26 11.95 -
6 15.16 12.75 -
6.25 16.17 - -
6.5 - - -
Table 1: Stiffness, ultimate load and maximum crack width values
S
n
o
Grade
of
concret
e
Clear
Cover
(CC)m
m
Initia
l
crack
(kN)
Ultimat
e load
(kN)
Type
of
crack
Crack
pattern
Initia
l
Crac
k
width
(mm)
Maximu
m
Crack
width
(mm)
Stiffnes
s of the
beam
(N/mm)
1
M35
50 7.35 66.2 Flexur
e
Bendin
g
0.02 1.6 3.8
25 9.81 61.3 Flexur
e
Bendin
g
0.02 1.2 4.4
0 9.81 49 Flexur
e
Bendin
g
0.04 0.9 3.2

National Conference on Recent Advancement and Sustainability in Civil Engineering, 10th
April2015
RASCE 2015 89
Fig 3: Load- Deflection curves for the beams of 50 mm clear cover
Fig 4: Load- Deflection curves for the beams of 25 mm clear cover
y = 3.8934x + 4.8391 R² = 0.9908
05
1015202530354045505560657075
0 1 2 3 4 5 6 7 8 9 10 11 12 13 14 15 16 17
Load
(kN
)
Deflection (mm)
Load v/s deflection
y = 4.4685x + 4.3752 R² = 0.9925
05
101520253035404550556065
0 1 2 3 4 5 6 7 8 9 10 11 12 13 14
Load
(kN
)
Deflection (mm)
Load v/s deflection

National Conference on Recent Advancement and Sustainability in Civil Engineering, 10th
April2015
RASCE 2015 90
Fig 5: Load- Deflection curves for the beams of 0 mm clear cover.
4. CONCLUSION:
On the basis of experiment conducted on three beams specimen the following observations and
conclusions are drawn:
1. The ultimate load of 50 mm clear cover is more than 25 mm, 0 mm clear cover.
2. The deflection under the service loads for concrete beams is more for 50 mm and 0 mm
clear cover than 25 mm clear cover.
3. The stiffness of 25 mm clear cover is 4.4N/mm, more than 50 mm and 0 mm clear cover.
4. The measured crack width at service loads ranged between 0.9-1.6 and is beyond the
allowable limit prescribed by IS 456-2000.
REFERENCES:
[1] Hany Abdalla ―Concrete cover requirements for FRP reinforced members in hot
climates‖composite structure vol 73 pp 61–69,2015
[2] Dawei Zhang,Tamon Ueda, Hitoshi Furuuchi ―Concrete cover separation failure of
overlay-strengthened reinforced concrete beams‖ Construction and Building Materials
vol 26 pp 735–745,2012.
[3] Esref U¨ nlu¨og˘lu‖Concrete cover effect on reinforced concrete bars exposed to high
temperatures‖ Construction and Building Materials vol 21 pp1155–1160, 2007.
[4] Shetty MS. Concrete technology theory and practice. New Delhi: Chand & Company
Ltd. : 2006.
[5] IS 456 : 2000. Indian standard plain and reinforced concrete - code of practice, BIS, New
Delhi : 2000.
[6] IS: 516-1959. Methods of tests for strength of concrete, edition 1.2 (1991.07).
[7] ASTM C78-84. Standard test method for flexural strength of concrete. Annual Book of
ASTM Standards.
y = 3.2209x + 7.3896 R² = 0.94
05
1015202530354045505560
0 1 2 3 4 5 6 7 8 9 10 11 12 13 14 15
Load
(kN
)
Deflection(mm)
Load v/s deflection
National Conference on Recent Advancement and Sustainability in Civil Engineering, 10th
April2015
RASCE 2015 91
14. EXPERIMENTAL INVESTIGATION ON INTERACTION
BEHAVIOUR OF RC FRAME WITH WALL PANEL
N.Shifu Jahan1, Ms.K.S.Divya
2
1Student, M.E. Structural Engineering, Department of Civil Engineering, Prathyusha
Institute of Technology and Management, Tiruvallur-602025, Tel.:(044)27620512,
Tamil Nadu, India Email – id :[email protected]
2Assistant Professor, Department of Civil Engineering, Prathyusha Institute of Technology
and Management, Tiruvallur-602025, Tel.:(044)27620512, Tamil Nadu, India
Email – id :[email protected]
ABSTRACT
Sandwich panels are composite structural elements, consisting of two thin, stiff, strong faces
separated by a relatively thick layer of low-density and low stiffness material. Its high
strength to weight ratio, rapid installation, good thermal insulation properties and easy repair
and low maintenance cost makes them widely acceptable for the construction of structures.
The advantages of sandwich panels used as structural wall element over brick wall have been
studied. One-sixth scale model of RC frames of size 0.67 x 0.67m casted with M20 grade of
concrete have been used for the experiments. The vertical and horizontal stiffness of RC
frames without any infilling, brick infill and sandwich wall panel infilling with and without
edge stiffeners were studied. The behaviour of frames under lateral load have been studied by
placing the frame diagonally in the column testing machine and applying vertical load. From
the experiment it is clear that, with the use of brick as well as sandwich panel infill‘s, the
vertical stiffness of the frame improves comparing to the bare frame. The increase in stiffness
in case of sandwich panel with 2mm thick CR steel plate edge stiffeners is more compared to
sandwich panel without any edge stiffeners. Even though the improvement in stiffness is less
while using sandwich panel as infill compared to brick infill, the high strength to weight ratio
of the sandwich panel underlines the advantage of sandwich panel over the brick infill.
KEY WORD: Sandwich wall panel, Polyurethane, Cold Rolled steel, Brick infill.
INTRODUCTION
1.1 GENERAL
Research efforts are continuously looking for new, better and efficient
construction materials. The main goal of these researches is to improve the structural
efficiency, performance, very good thermal and damping properties and durability. Ease of

National Conference on Recent Advancement and Sustainability in Civil Engineering, 10th
April2015
RASCE 2015 92
transport and assembly in all conditions are additional advantages. New materials typically
bring new challenges to designer who utilizes these new materials. Sandwich panels attracted
designer's interest due to its light weight, excellent corrosion characteristics and rapid
installation capabilities. Sandwich panels have been implemented in many industrial
applications such as aerospace, marine, architectural and transportation industry.
1.2 SANDWICH PANELS
Sandwich panels are composite structural elements, consisting of two thin, stiff, strong faces
separated by a relatively thick layer of low-density and low stiffness material. The faces are
commonly made of steel, aluminium, hardboard or gypsum and the core material may be
polyurethane, polyisocyanurate, expanded polystyrene, extruded polystyrene, phenolic resin
or mineral wool. The sandwich panels most often used in civil engineering consist of two
steel flat or profiled faces and a relatively soft core. The faces carry normal stresses, while the
three principle roles of the core are to carry shear stress, to protect the compressed face
against buckling and to provide thermal insulation.
Fig 1.2 Sandwich panel structure
2. SPECIMEN SPECIFICATION
Dimension of RC frame – 600mm x 85mm x 60mm
2.1 CASTED SPECIMEN
Bare RC frame - 1 no
Brick infilled RC frame - 1 no
Sandwich panel without edge stiffener - 1 no
Sandwich panel with 2mm CR Steel - 1 no

National Conference on Recent Advancement and Sustainability in Civil Engineering, 10th
April2015
RASCE 2015 93
Fig 2.1 Reinforcement details of RC frame
Fig 2.2 Casted Specimen

National Conference on Recent Advancement and Sustainability in Civil Engineering, 10th
April2015
RASCE 2015 94
3. RESULTS
The Strength to weight ratio for bare frame obtained as 10.59kN/mm/kN.
The Strength to weight ratio for brick infilled frame obtained as 12.635kN/mm/kN.
The Strength to weight ratio for Sandwich panel without edge stiffener frame obtained as
11.969kN/mm/kN.
The Strength to weight ratio for Sandwich panel with 2mm edge stiffener frame obtained as
15.102kN/mm/kN. While comparing this the strength to weight ratio for sandwich panel is
more to brick infill frame
4. CONCLUSION
It is found that the use of cut bricks of size 90mm x 40mm x 40mm as infill increase the
vertical stiffness of the frame by 16.18% compared to the bare frame.When sandwich panels
are used as infilling material without edge stiffeners the vertical stiffness of the frame found
to be increased by 11.52% experimentally compared to the bare frame. The use of edge
stiffeners while using sandwich panel as infilling material improves the stiffness of the frame.
When 2mm CR steel plates used as edge stiffeners, the vertical stiffness of the frame
increased by 29.87% from experimental study as compared to sandwich panel without edge
stiffener. The improvement in vertical stiffness is found to be more while using brick as infill
compared to sandwich panel. Since the strength to weight ratio of the sandwich panel is more
than brick, the self weight of the structure got reduced which in turn reduce the size of section
and leads to more flexible structure for civil engineering.
National Conference on Recent Advancement and Sustainability in Civil Engineering, 10th
April2015
RASCE 2015 95
ACKNOWLEDGMENT
Heartfelt thanks to Mr. S.Anbarasan, HOD (Dept. of Civil Engineering, Prathyusha Institute
of Technology and Management), Ms. K.S.Divya and Ms. V.J.Vedhanayaghi for their moral
support throughout the thesis.
REFERENCE
1. A. Benayoune, A.A.A Samad, A.A Abang Ali, D.N Trikha (2007) ―Response of pre-
cast reinforced composite sandwich panels to axial loading‖, Construction and
Building Materials 21 (Pg:677-685)
2. C.V.R Murthy, Sudhir K Jain (2000) ―Beneficial influence of masonry infill walls on
seismic performance of RC frame buildings‖, 12WCEE 1790 (Pg:1-6)
3. Dr. Hayder H. Alkhudery, Prof. Kuldeep V. "Finite Element Investigation of
Sandwich Panels Subjected to Local Buckling".
4. Gracie (2012) "Analytical Investigation on the Interaction Behavior of RC Frame with
Wall Panel" is a thesis submitted in 2012 for partial fulfillment of the requirements of
degree of Master of Technology in Structural Engineering to the SRM University.
5. I.J.V Straalen (2000) ―Comprehensive overview of theories for sandwich panels‖,
Workshop on Modeling of Sandwich Panels and Adhesive Bonded Joints, Porto
6. IS 10262-1982, Rev:5 ―Recommended Guidelines for Concrete Mix Design‖, Indian
Standards.
7. IS 12269-1987, ―Specification for 53 Grade Ordinary Portland Cement‖, Indian
Standards.
8. IS 2720 -1980, Rev:1,(Part III/Sec 2) ―Method of Test for Soils, Part III-
Determination of Specific Gravity, Section 2-Fine, Medium and Coarse grained
Soils‖, Indian Standards.
9. IS 383-1970, Rev:2 ―Specification for Coarse and Fine Aggregates from Natural
Sources for Concrete‖, Indian Standards.
10. IS 4031 -1988, Rev:1,(Part 1,4,5,11) ―Methods of Physical Tests for Hydraulic
Cement‖, Indian Standards.
11. IS 4326 -1993, Rev:2 ―Earthquake Resistant Design and Construction of Buildings –
Code of Practice‖, Indian Standards.
12. IS 456 -2000, Rev:4 ―Plain and Reinforced Concrete – Code of Practice‖, Indian
Standards.
13. Jeyakumar (2011) "Preliminary Investigation on 3D RC Frame with Sandwich Wall
Panels" is a thesis submitted in 2011 for partial fulfillment of the requirements of
degree of Master of Technology in Structural Engineering to the SRM University.
14. J.M.DAVIES Sandwich panels Thin-Walled Structures 16 (1993) 179-198 University
of Salford, Salford, UK.
15. L. A. DEMSETZ and L. J. GIBSON(1986) Minimum Weight Design for Stiffness in
Sandwich Plates with Rigid Foam Cores
16. M.P Boyle, J.C Roberts, P.D Wienhold, G.Bao, G.J White (2001) ―Experimental,
numerical, analytical results for post-buckling of orthotropic rectangular sandwich
panels‖, Composite Structures 52 (Pg:375-380)
17. Michael MISTLER, Juan Puig VALLS (2004) ―Vulnerability assessment of RC frame
Structures using lightweight sandwich floor-systems‖, 13th World Conference on
Earthquake Engineering (Paper No:813)

National Conference on Recent Advancement and Sustainability in Civil Engineering, 10th
April2015
RASCE 2015 96
18. R. Gopi (2010) " Analytical and Experimental studies on Sandwich wall panels" is a
thesis submitted in 2007 for partial fulfillment of the requirements of degree of
Master of Technology in Structural Engineering to the SRM University.
19. Salih N. Akour, Hussein Z. Maaitah (2010) "Effect of Core Material Stiffness on
Sandwich Panel Behavior Beyond the Yield Limit", WCE 2010, June 30 - July 2 Vol
II.
20. Tarek Abdel Moneim Sharaf (2010) "Flexural Behavior of Sandwich Panels
Composed of Polyurethane Core and GFRP Skins and Ribs" is a thesis submitted to
the Department of Civil Engineering in conformity with the requirements for the
degree of Doctor of Philosophy.
21. Vijaya Raghavan R (2010) "Behavior of Infilled Frame with Sandwich Wall Panel" is
a thesis submitted in 2010 for partial fulfillment of the requirements of degree of
Master of Technology in Structural Engineering.

National Conference on Recent Advancement and Sustainability in Civil Engineering, 10th
April2015
RASCE 2015 97
15. GROUNDWATER FLOW MODELING FOR DELINEATION OF
SEAWATER-FRESHWATER INTERFACE
1Revathi.M.P, and
2Revathee.T,
3Ravikumar.G
1. M.Tech.(EST) student, Dept. of Chemical Engg, A C Tech, Anna University,
Chennai – 25, Email ID: [email protected]
2. Assistant Professor in Civil Engg, Dept. of Civil Engg, Velammal Engineering College,
Chennai.
3. Professor in Civil Engg, Dept. of Chemical Engg, A C Tech, Anna University, Chennai.
ABSTRACT
Groundwater is one of the most important water resources. But in recent years, due to
over exploitation, groundwater pollution and seawater intrusion, along the coast has increased
a lot resulting depletion of groundwater resources across the world. To preserve the ground
water resources, a proper management has to follow for the use of groundwater. Seawater
intrusion in groundwater is identified from the variation of specific water quality
parameters.GIS an effective tool has been utilized to know the spatial of groundwater quality.
Numerical models provide effective solutions to handle the various problems in groundwater.
In this study, the simulation of seawater intrusion has been carried out by using MODFLOW
in Chennai City, Ennore Creek to Adyar River. This study also concerns the spatial
distribution of groundwater quality in the Metropolitan area and investigates the relationship
between historical land developments and temporal variation of groundwater quality.
1. INTRODUCTION:
Coastal zones are often densely populated areas that experience high demand for
freshwater. In Coastal Aquifers, Water quality degradation resulting from salt water intrusion
is a common issue of concern. Saltwater intrusion is the movement of saline water into a
freshwater aquifer. Salt water intrusion occurs in coastal freshwater aquifers when the
different densities of both the saltwater and freshwater allow the ocean water to intrude into
the freshwater aquifer. Saltwater intrusion in coastal aquifers has traditionally relied upon
observation wells and collection of water samples. For the prediction of seawater intrusion,
the seawater-freshwater intrusion has to be located. This location can be delineated by using
the combination of MODFLOW and GIS software Technologies.
2. REVIEW OF LITERATURE:
MODFLOW is a groundwater flow modeling Program. Because of its structure and
fixed data format, MODFLOW can be integrated with Geographic Information system (GIS)
Technology for water resource management. The Chennai city, which is the Metropolitan
area, and also facing the saltwater intrusion problem along the coastal zone.The literature
review revealed that the researchers from the worldwide have developed and applied various
optimization techniques to solve the seawater intrusion management problems of coastal
aquifers.
Angelo L. Kontis investigated the Simulation of Freshwater-Saltwater Interfaces in
the Brooklyn-Queens Aquifer System, Long Island, New York. The U.S. Geological Survey
has recently developed a three-dimensional, four-layer ground- water flow model of the
freshwater aquifer system underlying Kings and Queens Counties, N.Y., that is based on the
National Conference on Recent Advancement and Sustainability in Civil Engineering, 10th
April2015
RASCE 2015 98
MODFLOW model code. Simulated heads from a steady-state model of conditions prevailing
during the early 1990‘s were used as the initial conditions for a series of transient-state
simulations in which several hypothetical pumping scenarios were evaluated to determine
how the aquifer system can best be utilized to supplement surface- water supplies during
future droughts or other emergencies. The seaward limit of freshwater in each aquifer was
conceptualized as a freshwater-saltwater interface and simulated in the steady-state model as
a zero lateral-flow boundary. The magnitude and duration of hypothetical pumping were
assumed to be insufficient to cause significant movement of the interface within each model
layer; thus, for the purposes of the three-dimensional transient-state simulations, the
interfaces between freshwater and salt water were considered to be stationary.
A new theoretical approach for evaluating the sharp interface position in a fractured aquifer
was applied to the Nardo` aquifer ,Southern Italy was indicated by C Masciopinto (2006).The
results, based on Dupuit and Ghyben–Herzberg approximations, clearly show both the extent
of seawater intrusion and how the latter can be reduced by means of artificial recharge. From
the literature survey, understanding the knowledge about Data collection for input parameters
in MODFLOW, various methods to process the MODFLOW with GIS.
3. METHODOLOGY
Delineation of sea water fresh water interface will be identified from the geochemical
methods. In this study the water quality is analyzed using GIS and mapped. A geographic
information system may be defined as an integrated system designed to collect, manage and
manipulate information in a spatial context. It can be more broadly stated that a geographic
information system consists of a set of software, hardware, processes and organization that
integrates the value of spatial data. From the spatial analysis the seawater movement will be
identified, after that using the MODFLOW the seawater-freshwater movement will be
predicted for the Future periods.
4. STUDY AREA:
The Study area is along the coastal zone of Chennai city. The study area is bounded
by Bay of Bengal in the east, Adyar River in the north, South side is Ennore creek and west
side is along the coastal zone. The Study area map is represented in Figure.1.Ennore creek is
a backwater located inEnnore,Chennaialong theCoromandel Coast of the Bay of Bengal. The
latitude and longitude of the Ennore creek is 13°23‘ N, 80°31‘ E. Ennore Creek is located
20 km north of the city centre and 2.6 km south of the Ennore Port, and the creek area
stretches 3 km into the sea and 5 km along the coast. The creek is nearly 400 m wide,
elongated in northeast-southwest direction and merging with the backwater bodies. The soil
in the region is of loamy and alluvial types.
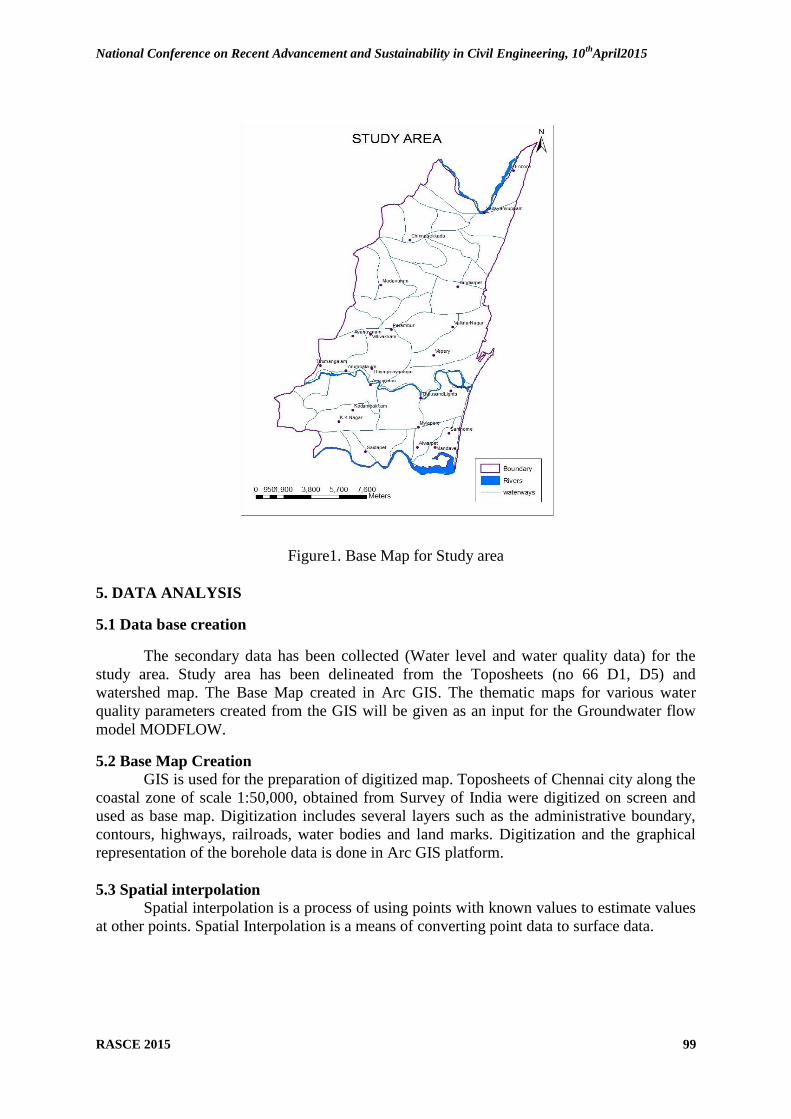
National Conference on Recent Advancement and Sustainability in Civil Engineering, 10th
April2015
RASCE 2015 99
Figure1. Base Map for Study area
5. DATA ANALYSIS
5.1 Data base creation
The secondary data has been collected (Water level and water quality data) for the
study area. Study area has been delineated from the Toposheets (no 66 D1, D5) and
watershed map. The Base Map created in Arc GIS. The thematic maps for various water
quality parameters created from the GIS will be given as an input for the Groundwater flow
model MODFLOW.
5.2 Base Map Creation
GIS is used for the preparation of digitized map. Toposheets of Chennai city along the
coastal zone of scale 1:50,000, obtained from Survey of India were digitized on screen and
used as base map. Digitization includes several layers such as the administrative boundary,
contours, highways, railroads, water bodies and land marks. Digitization and the graphical
representation of the borehole data is done in Arc GIS platform.
5.3 Spatial interpolation Spatial interpolation is a process of using points with known values to estimate values
at other points. Spatial Interpolation is a means of converting point data to surface data.

National Conference on Recent Advancement and Sustainability in Civil Engineering, 10th
April2015
RASCE 2015 100
6. SEAWATER INTRUSION IDENTIFICATION:
A comparison of the quality of groundwater in a coastal aquifer and sea water quality can
identify chemical ratios that are likely to provide good indications of sea water intrusion.
Useful ratios can be determined by comparing the chemistry of fresh groundwater for a
particular area, relative to the composition of sea water and choosing pairs of anions or
cations that have a high ratio in one type of water and a low ratio in the other. Typical ratios
for assessing sea water intrusion effects are:
Na/Cl Ratio
Cl/( CO3+HCO3 )Ratio (Revelle index)
Ca/Mg Ratio
These ratios are typically high in fresh groundwater (greater than 1) and lower in sea water
(less than 1). Consequently the ratios decrease as sea water intrusion occurs. A plot of
Temporal and Spatial variations these ratios versus well locations also helps to identify
different groupings of wells that are affected by sea water intrusion, with a general indicator
of increasing dissolved concentrations as sea water intrusion occurs.
6.1 SEAWATER INTRUSION IDENTIFIED BY Na/Cl Ratio:
Na / Cl ratios of saltwater intrusion are usually lower than the marine values (i.e.,
<0.86, molar ratio). On the other hand, high (>1) Na/Cl ratios, typically characterize
anthropogenic sources like domestic waters. Thus low Na/Cl ratios combined with other
geological parameters, can foretell the arrival of saltwater intrusion. According to Na/Cl
ratio, with less than 0.86 values in 23 Wells for the period of 5 years intervals in the years
2001, 2006, 2011 and 2013 shown in Figure 2.
Figure 2. Na/Cl Ratio
From this temporal variation by Na/Cl Ratio, Vepery, Mylapore, Madhavaram, Chinnasekadu
areas are highly contaminated by seawater intrusion in 2013 compared to 2001 and 2011.
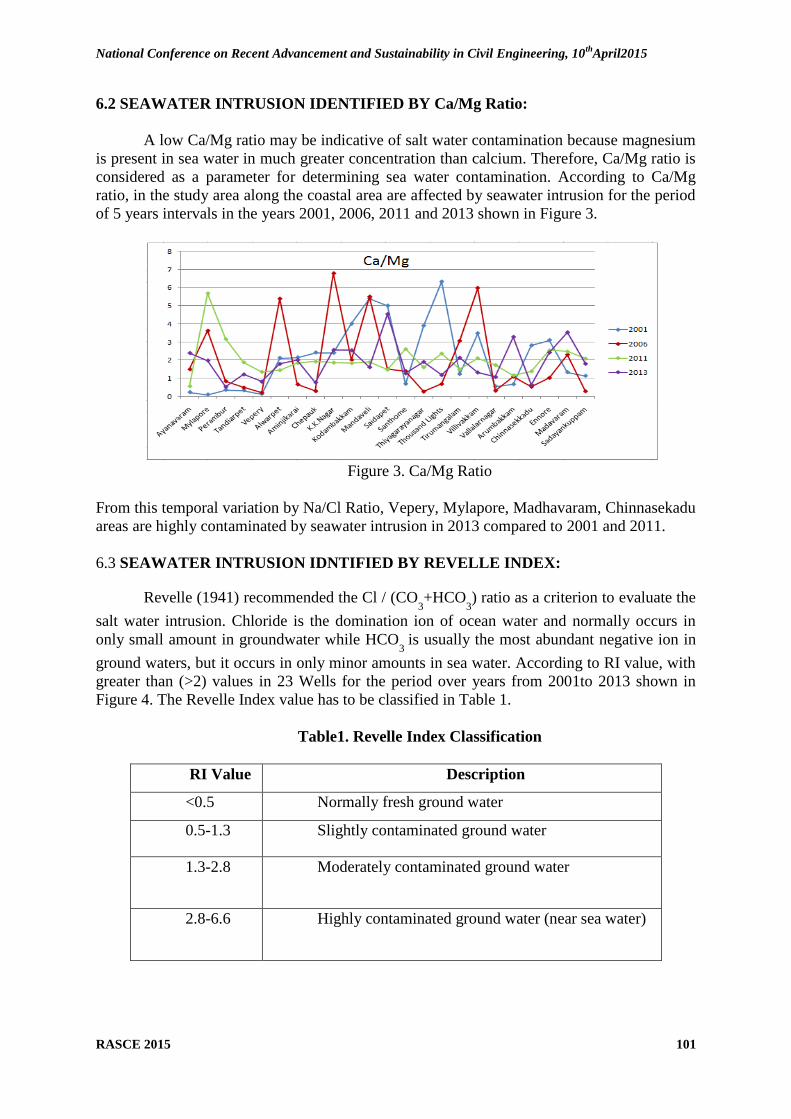
National Conference on Recent Advancement and Sustainability in Civil Engineering, 10th
April2015
RASCE 2015 101
6.2 SEAWATER INTRUSION IDENTIFIED BY Ca/Mg Ratio:
A low Ca/Mg ratio may be indicative of salt water contamination because magnesium
is present in sea water in much greater concentration than calcium. Therefore, Ca/Mg ratio is
considered as a parameter for determining sea water contamination. According to Ca/Mg
ratio, in the study area along the coastal area are affected by seawater intrusion for the period
of 5 years intervals in the years 2001, 2006, 2011 and 2013 shown in Figure 3.
Figure 3. Ca/Mg Ratio
From this temporal variation by Na/Cl Ratio, Vepery, Mylapore, Madhavaram, Chinnasekadu
areas are highly contaminated by seawater intrusion in 2013 compared to 2001 and 2011.
6.3 SEAWATER INTRUSION IDNTIFIED BY REVELLE INDEX:
Revelle (1941) recommended the Cl / (CO3+HCO
3) ratio as a criterion to evaluate the
salt water intrusion. Chloride is the domination ion of ocean water and normally occurs in
only small amount in groundwater while HCO3
is usually the most abundant negative ion in
ground waters, but it occurs in only minor amounts in sea water. According to RI value, with
greater than (>2) values in 23 Wells for the period over years from 2001to 2013 shown in
Figure 4. The Revelle Index value has to be classified in Table 1.
Table1. Revelle Index Classification
RI Value Description
<0.5 Normally fresh ground water
0.5-1.3 Slightly contaminated ground water
1.3-2.8 Moderately contaminated ground water
2.8-6.6 Highly contaminated ground water (near sea water)
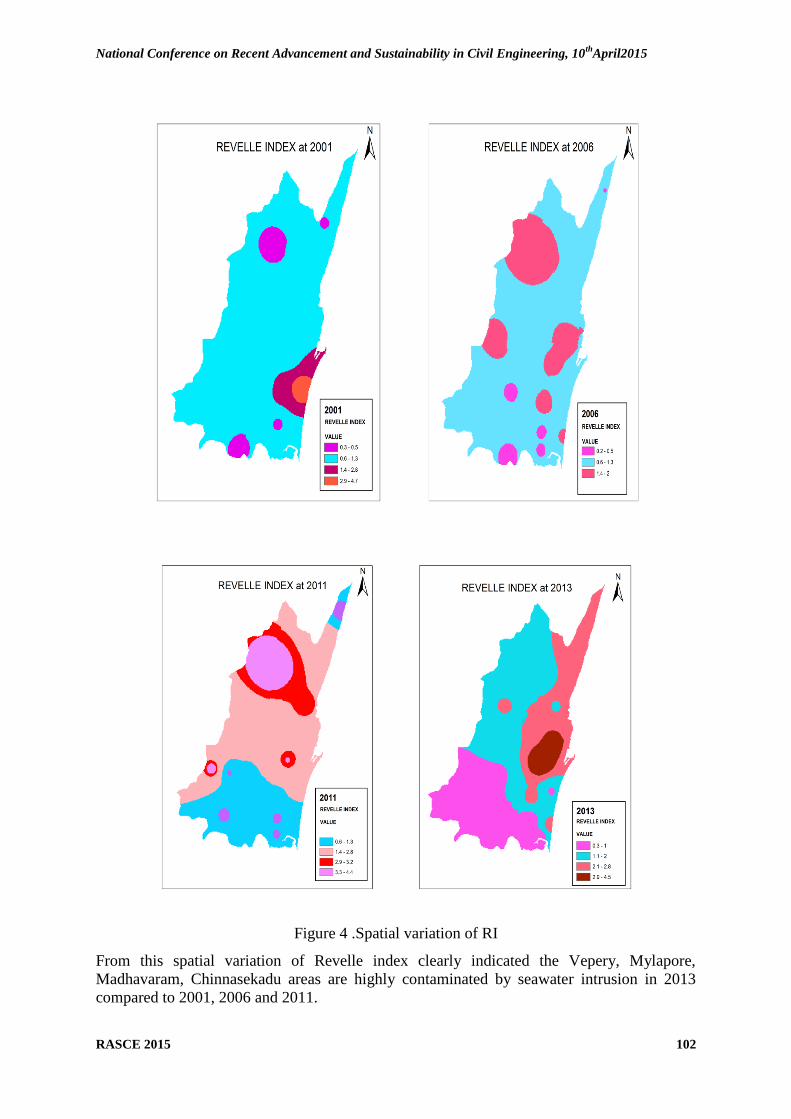
National Conference on Recent Advancement and Sustainability in Civil Engineering, 10th
April2015
RASCE 2015 102
Figure 4 .Spatial variation of RI
From this spatial variation of Revelle index clearly indicated the Vepery, Mylapore,
Madhavaram, Chinnasekadu areas are highly contaminated by seawater intrusion in 2013
compared to 2001, 2006 and 2011.
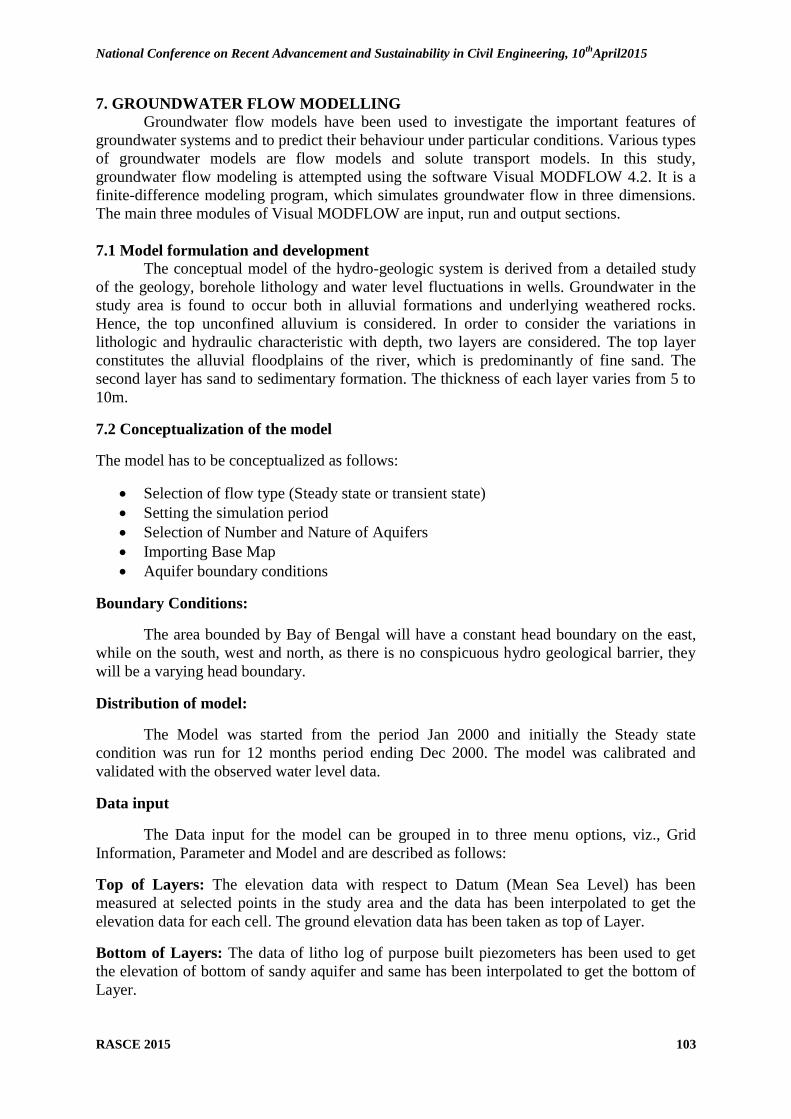
National Conference on Recent Advancement and Sustainability in Civil Engineering, 10th
April2015
RASCE 2015 103
7. GROUNDWATER FLOW MODELLING Groundwater flow models have been used to investigate the important features of
groundwater systems and to predict their behaviour under particular conditions. Various types
of groundwater models are flow models and solute transport models. In this study,
groundwater flow modeling is attempted using the software Visual MODFLOW 4.2. It is a
finite-difference modeling program, which simulates groundwater flow in three dimensions.
The main three modules of Visual MODFLOW are input, run and output sections.
7.1 Model formulation and development
The conceptual model of the hydro-geologic system is derived from a detailed study
of the geology, borehole lithology and water level fluctuations in wells. Groundwater in the
study area is found to occur both in alluvial formations and underlying weathered rocks.
Hence, the top unconfined alluvium is considered. In order to consider the variations in
lithologic and hydraulic characteristic with depth, two layers are considered. The top layer
constitutes the alluvial floodplains of the river, which is predominantly of fine sand. The
second layer has sand to sedimentary formation. The thickness of each layer varies from 5 to
10m.
7.2 Conceptualization of the model
The model has to be conceptualized as follows:
Selection of flow type (Steady state or transient state)
Setting the simulation period
Selection of Number and Nature of Aquifers
Importing Base Map
Aquifer boundary conditions
Boundary Conditions:
The area bounded by Bay of Bengal will have a constant head boundary on the east,
while on the south, west and north, as there is no conspicuous hydro geological barrier, they
will be a varying head boundary.
Distribution of model:
The Model was started from the period Jan 2000 and initially the Steady state
condition was run for 12 months period ending Dec 2000. The model was calibrated and
validated with the observed water level data.
Data input
The Data input for the model can be grouped in to three menu options, viz., Grid
Information, Parameter and Model and are described as follows:
Top of Layers: The elevation data with respect to Datum (Mean Sea Level) has been
measured at selected points in the study area and the data has been interpolated to get the
elevation data for each cell. The ground elevation data has been taken as top of Layer.
Bottom of Layers: The data of litho log of purpose built piezometers has been used to get
the elevation of bottom of sandy aquifer and same has been interpolated to get the bottom of
Layer.

National Conference on Recent Advancement and Sustainability in Civil Engineering, 10th
April2015
RASCE 2015 104
Parameters: In this menu option, following information has been uploaded.
Specific yield: Initially a uniform value of 0.015 was assumed for cells and during steady
state condition run, the values have been adjusted and final value assumed for each cell has
been furnished and Elevation database created as Figure 5.
Figure 5. Grid map for the study area
8. CONCLUSION:
The combination of MODFLOW with GIS is used to Digitizing the area as well as
delineates the saltwater-freshwater interaction. From Temporal Data collection and Spatial
Data collection we obtained results about the groundwater quality. Analysis of spatial data
and temporal data, identifying the hydraulic properties and statistical data about observation
wells are significant to the modelling. Through this investigation saltwater-freshwater
movement will be predicted, so that minimizing the saltwater intrusion into the Groundwater.
The Modeling is start with conceptualization and the Contour maps for various water quality
parameters were completed using GIS. Transient calibration and Model validation will be
over in another period of work.
LIST OF REFERENCES
1. Angelo L. Kontis, “Simulation of Freshwater-Saltwater Interfaces in the Brooklyn-
Queens Aquifer System, Long Island, New York‖.
2. N.Cartwright, L.Li, P.Nielsen, ―Response of the Salt-freshwater interface in a Coastal
Aquifer to a wave-induced groundwater pulse: field observations and modelling‖, Advances
in Water Resources (27) 297–303, November 2003.
3. Xun Zhou, “A method for estimating the freshwater-saltwater interface with hydraulic
heads in a coastal aquifer and its application‖, March 2011.
4. A.Paster, G.Dagan, “Mixing at the interface between fresh and salt waters in 3D
steady flow with application to a pumping well in a coastal aquifer‖, Advances in Water
Resources 31 (1565–1577), June 2008.
National Conference on Recent Advancement and Sustainability in Civil Engineering, 10th
April2015
RASCE 2015 105
5. Costantino Masciopinto, “Simulation of coastal groundwater remediation: the case of
Nardo fractured aquifer in Southern Italy‖, Environmental Modelling & Software 21, 85–97,
2006.
6. Bithin Datta, Harikrishna Vennalakanti, Anirban Dhar, ―Modeling and control of
saltwater intrusion in a coastal aquifer of Andhra Pradesh, India‖, Journal of Hydro-
environment Research 3 (148-159), September 2009.
7. Priyantha Ranjan Sarukkalige, (2011) ‗Assessment of Spatial Variation of
Groundwater Quality and Its Relationship with Land Use in Perth Metropolitan‘, Journal of
Water Resource and Protection, pp 311-317.
8. Masaki Hayashi (2003), ―Temperature-Electrical conductivity relation of water for
Environmental monitoring and Geophysical data inversion‖.
9. E.D.P.Perera, K.Jinno, A. Tstsumi (2003), ―Simulation of saltwater intrusion caused
EC flucations due to Groundwater pumping in a coastal aquifer‖.
10. Xun Zhou, (2011) ‘A method for estimating the freshwater-saltwater interface with
hydraulic heads in a coastal aquifer and its application‘.
11. Murat Cobaner, Recep Yurtal, Ahmet Dogan, Louis H.Motz, (2012) ‗Three
Dimensional Simulation of Seawater intrusions in Coastal Aquifers: A Case Study in the
Goksu Deltaic Plain‘, Journal of hydrology (464-465), pp 262-280.
12. Alyssa M. Dausman, Christian Langevin, Michael C. Sukop, and Virginia Walsh,
“Saltwater/Freshwater Interface Movement in Response to Deep-Well Injection in a Coastal
Aquifer‖, June 23-27, 2008.

National Conference on Recent Advancement and Sustainability in Civil Engineering, 10th
April2015
RASCE 2015 106
16. COMPREHENSIVE STUDY OF CEMENT MORTAR
USING MANUFACTURED SAND
D. Sivakumar1, N.P. Rajamane
2, M. Ilango
3, T. Nedunchezhiyan
4
1Professor,
3,4Graduate Students,
1,3,4Department of Civil Engineering
Vel Tech High Tech Dr.Rangarajan Dr.Sakunthala Engineering College
Avadi, Chennai, Tamil Nadu, India 2Head, Centre for Advanced Concrete Research,
SRM University, Kattankulathur, Chennai, Tamil Nadu, India
ABSTRACT
Now-a-days, curing process is not mostly done while constructing a building and use of cement
mortar is very high in bonding the bricks. Curing process need more time, days, and weeks to set
the cement mortar bonding between the bricks and to obtain its strength. There arises a need of
alternative material in the cement mortar for its internal curing. Selected size of manufactured
sand is added and tested for its self-curing process. After finding the self-curing of the
manufactured sand it is added to the cement mortar. By adding the manufactured sand, the
strength of cement mortar increased and the curing process is lowered, which can be obtained
through hydration process and by its self-curing process. Further, adding of manufactured sand
reduced the self-weight to 1.2 times the weight of ordinary cement mortar.
Keywords: Cement Mortar, Manufactured Sand, Compressive Strength
INTRODUCTION
Cement mortar is a building compound created by mixing sand and a selection of aggregates
with a specified amount of water. The mortar can be used for a number of applications, such as
plastering over bricks or other forms of masonry. Sometimes referred to as sand cement, mortar
blends today often incorporate different grades of plastics to create various types of polymer
cement mortars. Mortar has been used for centuries as a means of adhering bricks or concrete
blocks to one another. Cement mortar continues to be used in many different types of
construction. Professional building projects often employ mortar as the binder between bricks in
walls, fences, and walkways.
Around the house, this product is often employed to make quick repairs in patio slabs and reset
loosened stones or bricks in a walkway or retaining wall. Cement mortar also makes an excellent
medium for creating a smooth surface to walls made from bricks and other forms of masonry.
The mortar is applied with the use of a trowel and then smoothed into position. Often, the
application is conducted in more than one coat, making it possible to slowly achieve a covering
that adheres properly to the wall surface. A typical mortar will include both sand and cement,
with lime added to the mix. Other types of aggregates may be added, depending on the texture
that is desired for the mortar. In recent years, the inclusion of synthetic materials such as
polymers have helped to create cement mortar products that provide additional flexibility without
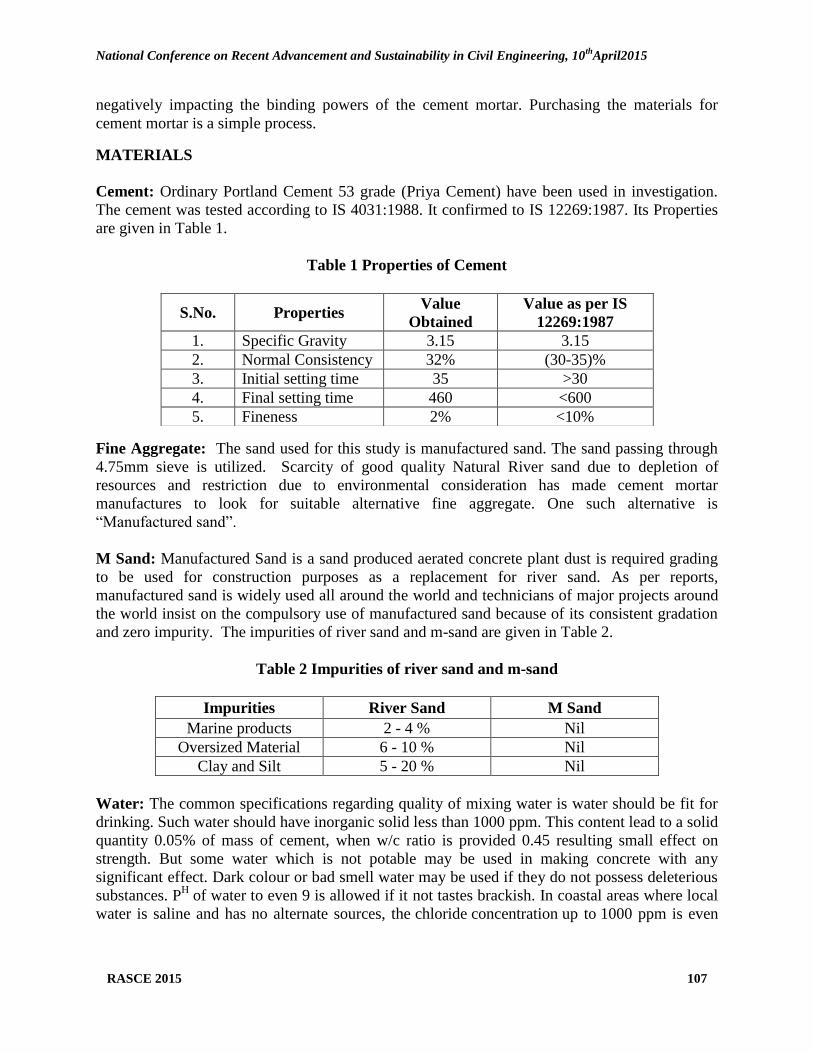
National Conference on Recent Advancement and Sustainability in Civil Engineering, 10th
April2015
RASCE 2015 107
negatively impacting the binding powers of the cement mortar. Purchasing the materials for
cement mortar is a simple process.
MATERIALS
Cement: Ordinary Portland Cement 53 grade (Priya Cement) have been used in investigation.
The cement was tested according to IS 4031:1988. It confirmed to IS 12269:1987. Its Properties
are given in Table 1.
Table 1 Properties of Cement
Fine Aggregate: The sand used for this study is manufactured sand. The sand passing through
4.75mm sieve is utilized. Scarcity of good quality Natural River sand due to depletion of
resources and restriction due to environmental consideration has made cement mortar
manufactures to look for suitable alternative fine aggregate. One such alternative is
―Manufactured sand‖.
M Sand: Manufactured Sand is a sand produced aerated concrete plant dust is required grading
to be used for construction purposes as a replacement for river sand. As per reports,
manufactured sand is widely used all around the world and technicians of major projects around
the world insist on the compulsory use of manufactured sand because of its consistent gradation
and zero impurity. The impurities of river sand and m-sand are given in Table 2.
Table 2 Impurities of river sand and m-sand
Impurities River Sand M Sand
Marine products 2 - 4 % Nil
Oversized Material 6 - 10 % Nil
Clay and Silt 5 - 20 % Nil
Water: The common specifications regarding quality of mixing water is water should be fit for
drinking. Such water should have inorganic solid less than 1000 ppm. This content lead to a solid
quantity 0.05% of mass of cement, when w/c ratio is provided 0.45 resulting small effect on
strength. But some water which is not potable may be used in making concrete with any
significant effect. Dark colour or bad smell water may be used if they do not possess deleterious
substances. PH of water to even 9 is allowed if it not tastes brackish. In coastal areas where local
water is saline and has no alternate sources, the chloride concentration up to 1000 ppm is even
S.No. Properties Value
Obtained
Value as per IS
12269:1987
1. Specific Gravity 3.15 3.15
2. Normal Consistency 32% (30-35)%
3. Initial setting time 35 >30
4. Final setting time 460 <600
5. Fineness 2% <10%

National Conference on Recent Advancement and Sustainability in Civil Engineering, 10th
April2015
RASCE 2015 108
allowed for drinking. But this excessive amount of alkali carbonates and bicarbonates, in some
natural mineral water, may cause alkali-silica reaction.
MATERIAL TESTING
The following tests that are to be conducted to find out the mix proportions they are as follows,
• Sieve analysis(IS 2386)
• Specific gravity(IS 2386)
• Water absorption test(IS 2386)
• Bulk density (IS 2386)
SIEVE ANALYSIS
Take 1 Kg of Fine aggregate Arrange the various sieves one over the other in the order of their
mesh openings the largest aperture sieve being kept at the top and the smallest aperture sieve at
the bottom. Keep a pan at the bottom of the whole assembly. Put the course aggregate on the top
sieve, cover it with a lid and put the whole assembly in the sieve shaking machine for 10 to 15
mi of shaking. Measure weight of the aggregate retained on each sieve. Calculate percentage of
aggregate retained on each sieve on the basis of the total mass of aggregate taken, and from these
results, calculate percentage passing through each sieve. Calculate The Fineness Modulus of fine
aggregates.
Table 3 River Sand Sieve Analysis Data
IS Sieve Weight
Retained (Kg)
% of
Weight
Retained
Cumulative % of
Weight Retained
Cumulative %
of Weight
Passing
4.75 mm 0.032 3.2 3.2 96.8
2.36 mm 0.114 11.4 14.6 85.4
1.18 mm 0.215 21.5 36.1 63.9
600 μm 0.170 17 53.1 46.9
300 μm 0.135 13.5 66.6 33.4
150 μm 0.323 32.3 98.9 1.1
Fineness modulus = ∑ (Cumulative percent retained)/ 100
For River sand, R = (3.2+14.6+36.1+53.1+66.6+98.9/100
= 2.72
River sand comes under zone 3 as per IS 10262:2009
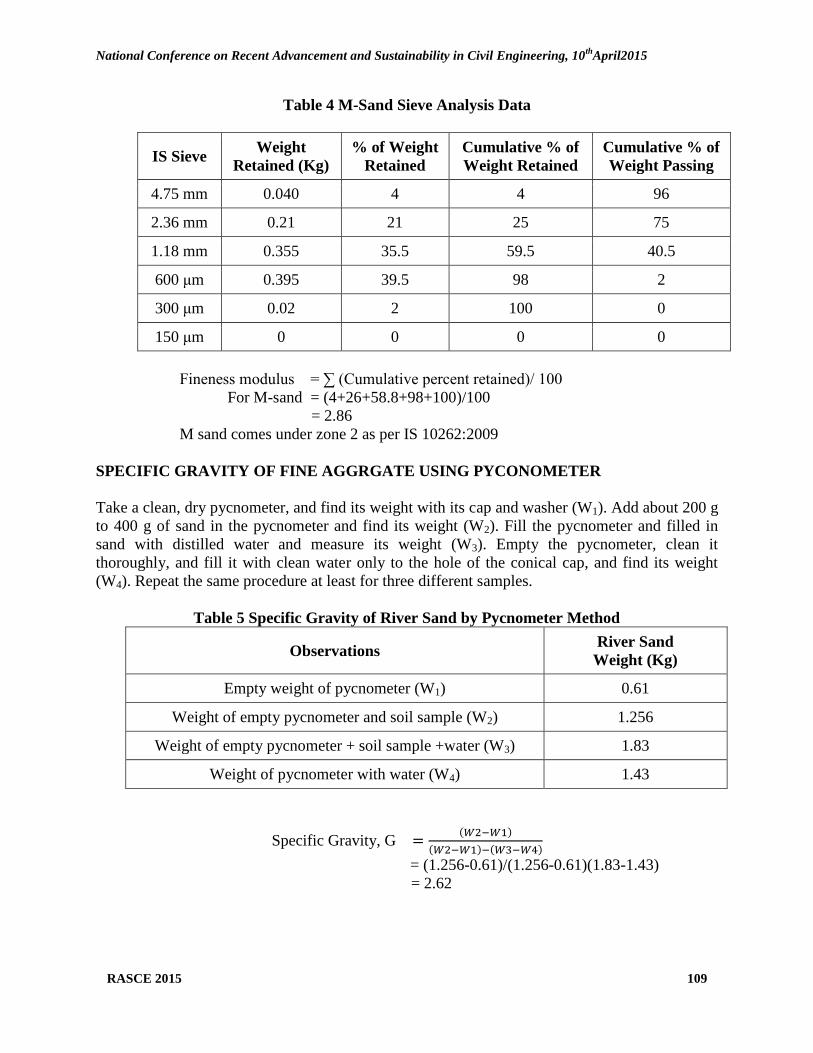
National Conference on Recent Advancement and Sustainability in Civil Engineering, 10th
April2015
RASCE 2015 109
Table 4 M-Sand Sieve Analysis Data
IS Sieve Weight
Retained (Kg)
% of Weight
Retained
Cumulative % of
Weight Retained
Cumulative % of
Weight Passing
4.75 mm 0.040 4 4 96
2.36 mm 0.21 21 25 75
1.18 mm 0.355 35.5 59.5 40.5
600 μm 0.395 39.5 98 2
300 μm 0.02 2 100 0
150 μm 0 0 0 0
Fineness modulus = ∑ (Cumulative percent retained)/ 100
For M-sand = (4+26+58.8+98+100)/100
= 2.86
M sand comes under zone 2 as per IS 10262:2009
SPECIFIC GRAVITY OF FINE AGGRGATE USING PYCONOMETER
Take a clean, dry pycnometer, and find its weight with its cap and washer (W1). Add about 200 g
to 400 g of sand in the pycnometer and find its weight (W2). Fill the pycnometer and filled in
sand with distilled water and measure its weight (W3). Empty the pycnometer, clean it
thoroughly, and fill it with clean water only to the hole of the conical cap, and find its weight
(W4). Repeat the same procedure at least for three different samples.
Table 5 Specific Gravity of River Sand by Pycnometer Method
Observations River Sand
Weight (Kg)
Empty weight of pycnometer (W1) 0.61
Weight of empty pycnometer and soil sample (W2) 1.256
Weight of empty pycnometer + soil sample +water (W3) 1.83
Weight of pycnometer with water (W4) 1.43
Specific Gravity, G ( )
( ) ( )
= (1.256-0.61)/(1.256-0.61)(1.83-1.43)
= 2.62

National Conference on Recent Advancement and Sustainability in Civil Engineering, 10th
April2015
RASCE 2015 110
WATER ABSORPTION TEST
Take 200 gms of coarse aggregate sample, immerse in water for 24 hours at a temperature
between 22°C and 32°C with a cover of at least 5 cm of water above the top of the basket. Take
out the immersed aggregate and place in a dry cloth. It shall then be spread out not more than one
stone deep, and best exposed to the atmosphere away from direct sunlight or any other source of
heat for not less than 10 minutes, or until it appears to be completely surface dry. Measure
weight of the aggregate (A) The aggregate shall then be placed in the oven in the shallow tray, at
a temperature of 100 to 110°C and maintained at this temperature for 24 hours. After 24 hours, It
shall then be removed from the oven, cooled in the airtight container and weighed (B).
Table 6 Water Absorption of Fine Aggregate
Observations Fine Aggregate
Weight (gms)
Weight of cleaned aggregate 200
Weight of saturated sample (A) 338
Weight of oven dry sample (B) 257
Percentage of water absorption = [(A-B)/B]*100
= [(338-257)/257)]*100
=37%
BULK DENSITY OF MATERIALS
The density of the materials are calculated using the cubes in the laboratory first the cubes are
cleaned and they are weighted as (w1) and the materials are filled and weighted as (w2)
Density of M sand
Weight of Empty cube (W1) =7.5kg
Weight with M-sand (W2) =8.074kg
Density = (W2-W1)/ volume of cube
= (8.074-7.5)/ (0.103)
=574kg/m3
Density of River sand
Weight of Empty cube (W1) =7.5kg
Weight with M-sand (W2) =9.024kg
Density = (W2-W1)/ volume of cube
= (9.024-7.5)/ (0.103)
=1524kg/m3
MIX PROPORTION
The cement mortar chosen was 1:3. The modified cement mortar mix was designed with 10%
and 20% partial replacement of sand by volume in control mix.
Cement Mortar Mix
Cement and Sand content =1:3
Water cement ratio, w/c =0.45
Manufacture sand added in partial Replacement =10% and 20%

National Conference on Recent Advancement and Sustainability in Civil Engineering, 10th
April2015
RASCE 2015 111
Cement content Weight of the cement content= (2200/(1+3))*0.014
=7.7 Kg
Sand content Weight of the Sand content =7.7*3
=23.1 Kg
Partial Replacement of Manufactured sand(10%) Now, Weight of the Sand =23.1-[(23.1/100)*10)]
= 20.79Kg
10% Weight of Manufactured Sand=(23.1*10)/100=2.31
=2.31/3
=770gms
Partial Replacement of Manufactured sand (20% )
Now, Weight of the Sand =23.1-[(23.1/100)*20]
=18.48 Kg
20% Weight of Manufactured Sand =(23.1*20)/100=4.62
=4.62/3
=1.54 Kg
EXPERIMENTAL PROCEDURE
The Cement mortar was prepared and found to be of good quality. Then Cubes were cast in steel
moulds of size 100mm×100mm×100mm. The specimens were allowed to dry for 24 hours, and
then they were kept for drying and curing at room temperature. Specimens were tested at the age
of 7, 14 and 28days for compressive strength.
RESULTS AND DISCUSSIONS
Average compressive strength of concrete specimens on 7th
day, 14th
day, and 28th
day of curing.
Compression
Test
Ordinary
Mix
Mix With
M-Sand
At 10% Replacement
Mix With
M-Sand
At 20% Replacement
7th
Day 16MPa 17.3MPa 13.3MPa
14th
Day 23MPa 24.6MPa 19MPa
28th
Day 32.8MPa 35.2MPa 27.2MPa

National Conference on Recent Advancement and Sustainability in Civil Engineering, 10th
April2015
RASCE 2015 112
Average compressive strength of concrete specimens on 7th
day, 14th
day, and 28th
day of drying.
7. CONCLUSIONS
1. The dry and wet cement mortar cubes were moulded to compare the compressive
strength.
2. The ordinary cement mortar gave the good compressive strength.
3. By adding 10% partial replacement of m-sand gave greater compressive strength than the
ordinary cement mortar.
4. By adding 20% partial replacement of m-sand gave lesser compressive strength.
5. By adding the m-sand in the cement mortar self-weight of cement mortar cubes was
reduced. The study suggests that 10% of m-sand can be used for designing the light
weight construction.
0
10
20
30
40
7th DAY 14th DAY 28th DAY
OPC
10% MSAND
20% MSAND
0
5
10
15
20
25
30
35
7 th DAY 14 th DAY 28 th DAY
OPC
10% M SAND
20% M SAND
Compression
Test
Ordinary
Mix
Mix With
M-Sand
At 10% Replacement
Mix With
M-Sand
At 20% Replacement
7th
DAY 14.1MPa 14.8MPa 10MPa
14th
DAY 20.2MPa 21.1MPa 14.4MPa
28th
DAY 28.8MPa 30.2MPa 20.5MPa

National Conference on Recent Advancement and Sustainability in Civil Engineering, 10th
April2015
RASCE 2015 113
REFERENCES
1. IS 383: 1970, Indian standards specification for coarse and fine aggregate.
2. IS 12269: 1987, Specification for 53 grade ordinary Portland cement.
3. Narasimha C., Patil B.T., and Sanni S. H., (1999), Performance of cement mortar with
quarry dust as fine aggregate - An experimental study, Civil Engineering and
Construction Review, 12, pp 19-24.
4. Ilangovan R., Nagamani K., and Kumarasamy K., (2006), Studies on strength and
behaviour of cement mortar by using crushed rock dust as fine aggregate, Civil
Engineering and Construction Review, pp 924-932.
5. Jadhav P., and Kulkarni D., (2012), An experimental investigation on the properties of
cement mortar containing manufactured sand,International Journal of Advanced
Engineering Technology. 3, pp 101-104.
6. Narasimha C., Patil B.T., and Sanni S.H., (1999), Performance of cement mortar with
quarry dust as fine aggregate - An experimental study, Civil Engineering and Review, 12,
pp 19-24.
7. Self-curing process on cement mortar ambily P.S, Scientist, and Rajamane N P, Deputy
Director and Head, Cement Composites Lab Structural Engineering Research Centre,
CSIR, Chennai
8. Structure and properties of manufactured sand N. Narayanan, K.Ramamurthy
9. Structural lightweight manufactured sand by algurnon steve vanrooyen
10. Study of partial replacement of natural sand by manufactured sand on the properties of
cement mortar
11. Suitability of Crushed Stone Dust as Fine Aggregate in cement Mortar
12. Hudson B.P., (1997), Manufactured sand for concrete, The Indian concrete Journal,
pp 237-240.
13. Prakash R D.S., and Giridhar K.V., (2004), Investigations on cement mortar with stone
crusher dust as fine aggregate, The Indian concrete Journal, pp 45-50.
14. Baali L., Naceri A., and Mehamed R., (2007), Mechanical response of mortar made with
natural and artificial fine aggregates, Asian Journal of Civil Engineering (Building
and Housing), 9, pp 85-92.
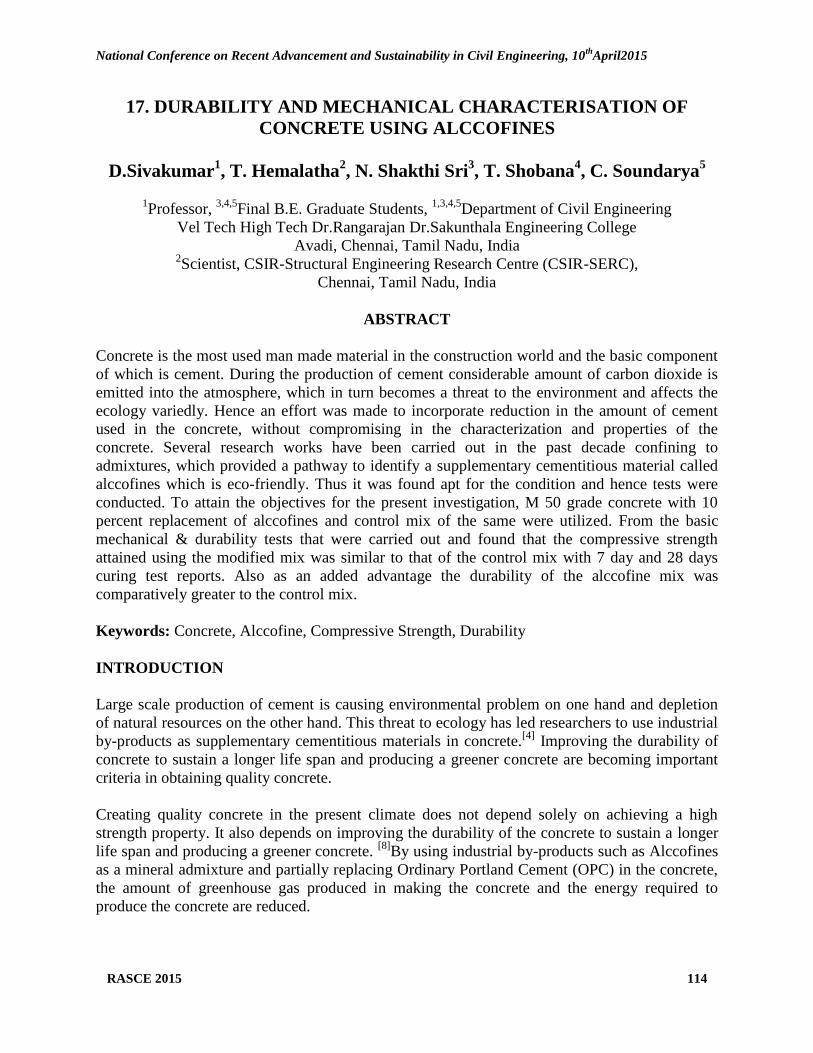
National Conference on Recent Advancement and Sustainability in Civil Engineering, 10th
April2015
RASCE 2015 114
17. DURABILITY AND MECHANICAL CHARACTERISATION OF
CONCRETE USING ALCCOFINES
D.Sivakumar1, T. Hemalatha
2, N. Shakthi Sri
3, T. Shobana
4, C. Soundarya
5
1Professor,
3,4,5Final B.E. Graduate Students,
1,3,4,5Department of Civil Engineering
Vel Tech High Tech Dr.Rangarajan Dr.Sakunthala Engineering College
Avadi, Chennai, Tamil Nadu, India 2Scientist, CSIR-Structural Engineering Research Centre (CSIR-SERC),
Chennai, Tamil Nadu, India
ABSTRACT
Concrete is the most used man made material in the construction world and the basic component
of which is cement. During the production of cement considerable amount of carbon dioxide is
emitted into the atmosphere, which in turn becomes a threat to the environment and affects the
ecology variedly. Hence an effort was made to incorporate reduction in the amount of cement
used in the concrete, without compromising in the characterization and properties of the
concrete. Several research works have been carried out in the past decade confining to
admixtures, which provided a pathway to identify a supplementary cementitious material called
alccofines which is eco-friendly. Thus it was found apt for the condition and hence tests were
conducted. To attain the objectives for the present investigation, M 50 grade concrete with 10
percent replacement of alccofines and control mix of the same were utilized. From the basic
mechanical & durability tests that were carried out and found that the compressive strength
attained using the modified mix was similar to that of the control mix with 7 day and 28 days
curing test reports. Also as an added advantage the durability of the alccofine mix was
comparatively greater to the control mix.
Keywords: Concrete, Alccofine, Compressive Strength, Durability
INTRODUCTION
Large scale production of cement is causing environmental problem on one hand and depletion
of natural resources on the other hand. This threat to ecology has led researchers to use industrial
by-products as supplementary cementitious materials in concrete.[4]
Improving the durability of
concrete to sustain a longer life span and producing a greener concrete are becoming important
criteria in obtaining quality concrete.
Creating quality concrete in the present climate does not depend solely on achieving a high
strength property. It also depends on improving the durability of the concrete to sustain a longer
life span and producing a greener concrete. [8]
By using industrial by-products such as Alccofines
as a mineral admixture and partially replacing Ordinary Portland Cement (OPC) in the concrete,
the amount of greenhouse gas produced in making the concrete and the energy required to
produce the concrete are reduced.

National Conference on Recent Advancement and Sustainability in Civil Engineering, 10th
April2015
RASCE 2015 115
Alccofine is a revolutionary material, used as a substitute to Micro Silica / Silica Fumes.
Alccofine is a new generation supplementary cementitious material (SCM) with a built-in high
tech content. In spite of its high fineness it does not increase water demand at the dosage range
of 5 to 15 percent of normal OPC in general. In fact concrete slump is seen to be improved, due
to the dense packing of cementitious material, producing low void content. The use of Alccofine
results in hydrated cement matrix to comprise of very small pores.[3]
Alccofine is a specially processed product based on high glass content with high reactivity
obtained through the process of controlled granulation. The raw materials are composed primary
of low calcium silicates.[7]
The processing with other select ingredients results in controlled
particle size distribution (PSD). The computed blain value based on PSD is around
12000cm2/gm and is truly ultra fine. Due to its unique chemistry and ultra fine particle size,
Alccofine 1203 provides reduced water demand for a given workability, even up to 70%
replacement level as per requirement of concrete performance. Alccofine 1203 can also be used
as a high range water reducer to improve compressive strength or as a super workability aid to
improve flow.
If the advantages of Alccofine are observed in the concrete mix design, the initial rate of strength
development is found to be increased. Durability test measuring the water permeability shows
better results with Alccofine mix than in OPC. In case of chloride permeability Alccofine with
OPC, the results show less permeability in case of Alccofine than that of OPC.
This paper reports the results of an experimental investigation of compressive and flexural
strength of concrete. This includes a control mixture, containing 10% of Alccofine as
replacement of cement. In this work the effect of ultrafine slag (Alccofine) replacement on the
mechanical properties of high strength concrete is studied. It has been found that use of ultrafine
slag not only improves the compressive strength of concrete but also improves the workability
and fluidity of the mix.
MATERIALS
CEMENT:
Ordinary Portland Cement 53 grade (Ambuja Cement) have been used in investigation. The
cement was tested according to IS 4031:1988. It confirmed to IS 12269:1987. Its Properties are
given in table.

National Conference on Recent Advancement and Sustainability in Civil Engineering, 10th
April2015
RASCE 2015 116
Table 1 Properties of Cement
FINE AGGREGATE AND COARSE AGGREGATE
Fine Aggregate: The sand used for this study is manufactured sand. The sand passing through
4.75 mm sieve is utilized. The sand conforms to grading Zone II as per IS: 383-1970 (Reaffirmed
2011).
RawMaterial Type Specific Gravity Total Absorption
CoarseAggregate 20mmgraded 2.68 0.54
CoarseAggregate 12.5mmgraded 2.71 0.70
FineAggregate RiverSand 2.57 1.35
ManufacturedSand 2.65 1.87
Water Potablewater 1 NA
Now-a-days good sand is not readily available; it is transported from a long distance. Those
resources are also exhausting very rapidly. So it is a need of the time to find some substitute to
natural river sand. The artificial sand produced by proper machines can be a better substitute to
river sand. The sand must be of proper gradation. When fine particles are in proper proportion,
the sand will have fewer voids. The cement quantity required will be less. Such sand will be
more economical. Demand for manufactured fine aggregates for making concrete is increasing
day by day as river sand cannot meet the rising demand of construction sector. Under this
circuoena medemfnoa dna ndemuea utm fomec mecnatsm.
S.No. Properties Value
Obtained
Value as per
IS 12269:1987
1. Specific Gravity 3.15 3.15
2. Normal Consistency 31% (30-35)%
3. Initial setting time 38 >30
4. Final setting time 453 <600
5. Fineness 3% <10%
6. Soundness(mm) 1.2 <10
7. Compressive strength
(3 days)
38 >27
8. Compressive strength
(7 days)
40.34
>37
9. Compressive strength
(28 days)
57.30
>53

National Conference on Recent Advancement and Sustainability in Civil Engineering, 10th
April2015
RASCE 2015 117
Table: Sieve Analysis of M-Sand
Sieve
(mm)
Weight
Retained
%of
Weight
Retained
Cum%of
Weight
Retained
%of
passing
Zone-II
Coarse Finer
4.75 1 0.20 0.20 99.80 90 100
2.36 105 21.00 21.20 78.80 75 100
1.18 126 25.20 46.40 53.60 55 90
600µ 84 16.80 63.20 36.80 35 59
300µ 70 14.00 77.20 22.80 8 30
150µ 35 7.00 84.20 15.80 0 20
75µ 43 8.60 92.80 7.20 - -
Pan 36 7.20 100.00 0.00 - -
2.92
Coarse Aggregate: Coarse aggregates of size 12.5mm and 20mm were taken for this
investigation. The properties coarse aggregate used in the investigation are as summarized below
Table: Sieve Analysis of 20 mm Aggregate
Sieve
(mm)
Weight
Retained
%of
Weight
Retained
Cum%of
Weight
Retained
%of
passing
Coarser
Limit
FinerLimit
25 0 0.00 0.00 100.00 100 100
20 141 2.82 2.82 97.18 85 100
16 1372 27.44 30.26 69.74 - -
12.5 2697 53.94 84.20 15.80 - -
10 604 12.08 96.28 3.72 0 20
6.3 167 3.34 99.62 0.38 - -
4.75 3 0.06 99.68 0.32 0 5
Pan 16 0.32 100.00 0.00 - -
Table: Sieve Analysis of 12.5 mm Aggregate
Sieve
(mm)
Weight
Retained
%of
Weight
Retained
Cum%of
Weight
Retained
%of
passing
Coarser
Limit
FinerLimit
16 0 0.00 0.00 100.00 100 100
12.5 121 6.05 6.05 93.95 85 100
10 765 38.25 44.30 55.70 0 45
6.3 1088 54.40 98.70 1.30 - -
4.75 19 0.95 99.65 0.35 0 10
2.36 3 0.15 99.80 0.20 - -
pan 4 0.20 100.00 0.00 - -
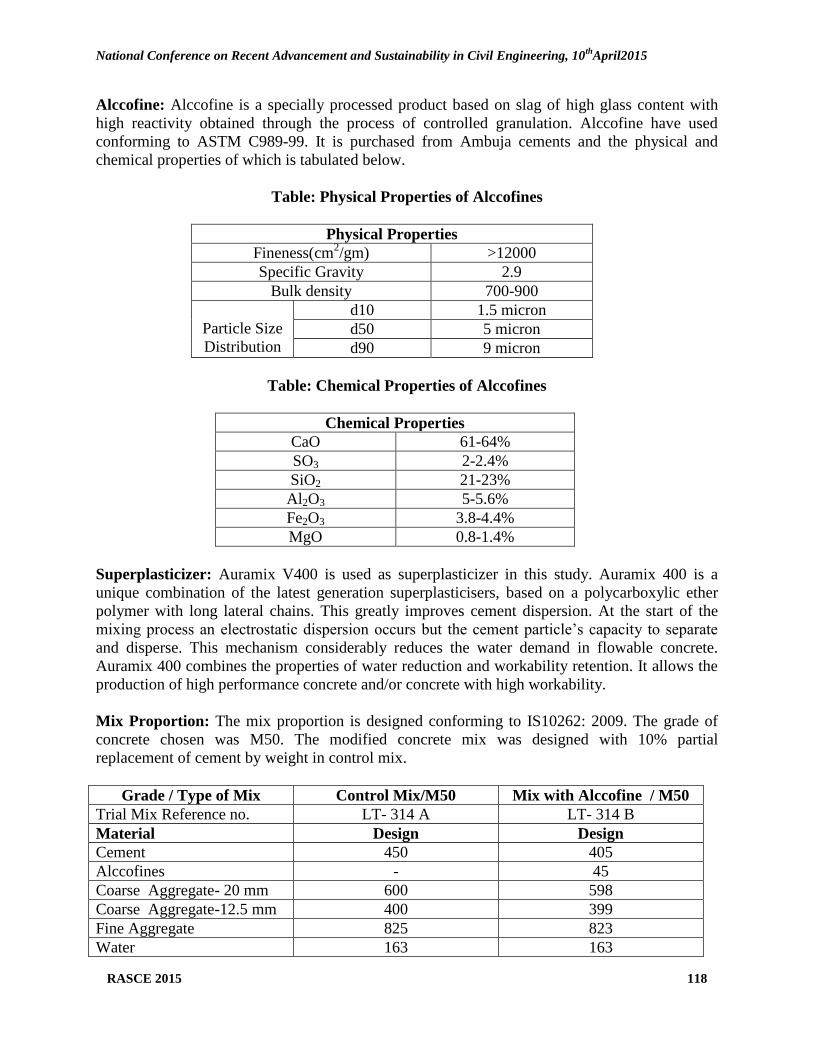
National Conference on Recent Advancement and Sustainability in Civil Engineering, 10th
April2015
RASCE 2015 118
Alccofine: Alccofine is a specially processed product based on slag of high glass content with
high reactivity obtained through the process of controlled granulation. Alccofine have used
conforming to ASTM C989-99. It is purchased from Ambuja cements and the physical and
chemical properties of which is tabulated below.
Table: Physical Properties of Alccofines
Physical Properties
Fineness(cm2/gm) >12000
Specific Gravity 2.9
Bulk density 700-900
Particle Size
Distribution
d10 1.5 micron
d50 5 micron
d90 9 micron
Table: Chemical Properties of Alccofines
Chemical Properties
CaO 61-64%
SO3 2-2.4%
SiO2 21-23%
Al2O3 5-5.6%
Fe2O3 3.8-4.4%
MgO 0.8-1.4%
Superplasticizer: Auramix V400 is used as superplasticizer in this study. Auramix 400 is a
unique combination of the latest generation superplasticisers, based on a polycarboxylic ether
polymer with long lateral chains. This greatly improves cement dispersion. At the start of the
mixing process an electrostatic dispersion occurs but the cement particle‘s capacity to separate
and disperse. This mechanism considerably reduces the water demand in flowable concrete.
Auramix 400 combines the properties of water reduction and workability retention. It allows the
production of high performance concrete and/or concrete with high workability.
Mix Proportion: The mix proportion is designed conforming to IS10262: 2009. The grade of
concrete chosen was M50. The modified concrete mix was designed with 10% partial
replacement of cement by weight in control mix.
Grade / Type of Mix Control Mix/M50 Mix with Alccofine / M50
Trial Mix Reference no. LT- 314 A LT- 314 B
Material Design Design
Cement 450 405
Alccofines - 45
Coarse Aggregate- 20 mm 600 598
Coarse Aggregate-12.5 mm 400 399
Fine Aggregate 825 823
Water 163 163

National Conference on Recent Advancement and Sustainability in Civil Engineering, 10th
April2015
RASCE 2015 119
Superplasticiser Auramix
V400 1.35 @ 0.3% 1.4 @ 0.32%
Total 2437 2433
Water to Binder Ratio 0.36 0.36
EXPERIMENTAL PROCEDURE
Initially Workability of the concrete is found using slump test and the values are tabulated
The Concrete was prepared and found to be of good quality. Then Cubes were cast in steel
moulds of size 150mm×150mm×150mm (IS 10086:1982) and the beams were cast in steel
moulds of size 100mm X 100mm X 500mm (IS 10086:1982). The specimens were allowed to
dry for 24 hours, and then they were kept for curing at room temperature.
Specimens were tested at the age of 7 and 28days for compressive strength. The load is applied
at a constant rate thus ensuring progressive increase in stress as the failure approaches. With
beams, the flexural strength of the concrete at the age of 28days is found out. Durability tests
were carried out with respect to ASTM C1202. For which core of diameter 100mm and height of
50mm was cut from the specimen and the tests were carried out according to the specifications.
RESULTS AND DISCUSSIONS
Average compressive strength of concrete specimens on 7th
and 28th
day of curing.
Compression Test Control Mix Mix With Alccofines
7th
DAY 56.9MPa 57.6MPa
28th
DAY 66.4MPa 66.7MPa
52
54
56
58
60
62
64
66
68
7th DAY 28th DAY
CO
MP
RES
SIV
E ST
REN
GTH
(MPa
)
CONTROL MIX MIX WITH ALCCOFINE
Workability – Slump Test Value in mm
Initial 180 220 60 min 165 110

National Conference on Recent Advancement and Sustainability in Civil Engineering, 10th
April2015
RASCE 2015 120
Average flexural strength of the concrete specimens on 28th
day of curing.
BEAM FLEXURAL STRENGTH TEST RESULTS- in MPa
Details Control mix Mix with alccofine
28 days 7.8 7.7
RCPT test was carried out according to ASTM C1202 and the average results are tabulated.
CONCLUSION
1. Alccofines has a larger total surface area, and thus, more of it is available for hydration
and pozzolanic reaction.
2. In addition, better workability and higher consistency were achieved by utilizing
Alccofines.
3. With the inclusion of Alccofines into the concrete, it is possible to obtain a consistent
mix, as the high surface area of Alccofines improves the rheology of fresh concrete.
4. With the inclusion of Alccofines, there is a significant improvement in the mechanical
properties of the concrete. The improvement is more obvious for higher concrete grade.
5. With the inclusion of Alccofines, the permeability of concrete is reduced significantly.
Due to the reduced permeability, chloride penetration into the concrete is reduced. This
marked a significant improvement in the durability aspect of the concrete
7.747.767.78
7.87.827.847.867.88
7.97.92
NORMAL MIX MIX WITHALCCOFINES
FLEX
UR
AL
STR
ENG
TH(M
Pa)
FLEXURAL STRENGTH
RAPID CHLORIDE PENETRATION TEST (in COULUMBS)
Particulars Control mix Mix with alccofine
28th
day report 2588 2840
Chloride permeability as
per ASTM C1202
moderate Moderate
National Conference on Recent Advancement and Sustainability in Civil Engineering, 10th
April2015
RASCE 2015 121
REFERENCES
1. Yatin H Patel, P.J.Patel, Prof. Jignesh M Patel, Dr. H.S. Patel, Study On Durability Of
High Performance Concrete With Alccofine And Fly Ash, ―International Journal of
Advanced Engineering Research and Studies.‖
2. Darren T.Y. Lim; Da Xu; B. Sabet Divsholi; B. Kondraivendhan and Susanto Teng,
Effect Of Ultra-Fine Slag Replacement On Durability And Mechanical Properties Of
High Strength Concrete, ―Our World in Concrete & Structures.‖
3. Siddharth P. Upadhyay, M. A. Jamnu, Effect on Compressive strength of High
Performance Concrete Incorporating Alccofine and Fly Ash, ―IJIRD‖
4. Praveen Nayak S, H. S. Narashimhan, Raghunandan V.Kadaba, Hardened Properties of
Concretes made with Micro Silica and Alccofine-A Performance Optimization based
Comparative Study, ―International Journal of Engineering Research and Development.‖
5. M.S. Pawar, A.C. Saoji, Effect of Alccofine on Self Compacting Concrete, ―The
International Journal Of Engineering And Science (IJES).‖
6. P.J.Patel, Mukesh A. Patel, Dr. H.S. Patel, Effect Of Coarse Aggregate Characteristics
On Strength Properties Of High Performance Concrete Using Mineral And Chemical
Admixtures, ―International Journal of Civil Engineering and Technology (IJCIET).‖
7. Mo.Tofik Y. Patel, Siddharth P Upadhyay, Prof. A.R. Darji, Prof. M.A. Jamnu , To Study
On Effect Of High Performance Concrete With Alccofine And Waste Glass Powder ,
―International Journal for Scientific Research & Development.‖
8. Saurav, Ashok Kumar Gupta, Experimental study of strength relationship of concrete
cube and concrete cylinder using ultrafine slag Alccofine, ―International Journal for
Scientific Research & Development.‖
9. IS:516-1959- Methods of tests for strength of concrete
10. IS:1199-1959- Methods of sampling and analysis of concrete
11. IS:2386 I-1963- Methods of test for aggregates for concrete, Particle size and shape
12. IS: 2386 III-1963- Methods of test for aggregate for concrete, Specific gravity, density,
voids, absorption and bulking.
13. IS: 10262- 2009- Guidelines for concrete mix design proportioning.

National Conference on Recent Advancement and Sustainability in Civil Engineering, 10th
April2015
RASCE 2015 122
18. INFLUENCE OF KONGU TREE SAW DUST ON REMOVAL OF
FLUORIDE IN AQUEOUS SOLUTION
D.Sivakumar1, R. Anand
2, S. Deepak
3, B. Hemanth Kumar
4
1Professor,
2Asst.Professor,
3,4Final B.E. Graduate Students,
1,2,3,4Department of Civil Engineering
Vel Tech High Tech Dr.Rangarajan Dr.Sakunthala Engineering College
Avadi, Chennai, Tamil Nadu, India
ABSTRACT
Fluoride in drinking water has a profound effect on teeth and bones. Up to a small level (1–1.5
mg/L) this strengthens the enamel. Concentrations in the range of 1.5–4 mg/L result in dental
fluorosis whereas with prolonged exposure at still higher fluoride concentrations (4–10 mg/L)
dental fluorosis progresses to skeletal fluorosis. High fluoride concentrations in groundwater, up
to more than 30 mg/L, occur widely, in many parts of the world. This review article is aimed at
providing precise information on efforts made by various researchers in the field of fluoride
removal for drinking water. The fluoride removal has been done by adsorption techniques.
Adsorption deals with adsorbents such as: alumina/aluminium based materials, clays and soils,
calcium based minerals, synthetic compounds and carbon based materials. Study on fluoride
removal from aqueous solutions using kongu tree saw dust is discussed in detail. The efficiency
of removal has been affected by different parameters like bed height, particle size and density of
compaction and the optimum values for each parameter is determined. Thus from the above
detailed observations 95% of removal is achieved.
Keywords: Fluoride Adsorption, Kongu Saw Dust, Dental Fluorosis
INTRODUCTION
The fluoride occurs mainly as sellaite (MgF2), fluorspar (CaF2), cryolite (Na3AlF6) and
luorapatite [3Ca3(PO4)2 Ca(F,Cl2)]. As fluorsparit is found in sedimentary rocks and as cryolite
in igneous rocks. These fluoride minerals are nearly insoluble in water. Hence fluorides will be
present in groundwater only when conditions favour their dissolution or high fluoride containing
effluents are discharged to the water bodies from industries.
Fluoride in drinking water has a profound effect on teeth and bones. Fluoride displaces
hydroxide ions from hydroxyapatite,Ca5(PO4)3OH, the principal mineral constituent of teeth (in
particular the enamel) and bones, to form the harder and tougher fluoroapatite, Ca5(PO4)3F. Up
to a small level this strengthens the enamel. However, fluoroapatite is an order of magnitude less
soluble than hydroxyapatite, and at high fluoride concentration the conversion of a large amount
of the hydroxyapatite into fluoroapatite makes the teeth and (after prolonged exposure) the bones
denser, harder and more brittle. In the teeth this causes mottling and embrittlement, a condition
known as dental fluorosis. With prolonged exposure (Dissanayake, 1991) at higher fluoride
concentrations dental fluorosis progresses to skeletal fluorosis. Fluoride is thus considered
beneficial in drinking water at levels of about 0.7 mg/L but harmful once it exceeds 1.5 mg/L

National Conference on Recent Advancement and Sustainability in Civil Engineering, 10th
April2015
RASCE 2015 123
which is the World Health Organisation limit being followed in most of the nations (WHO,
1985; Smet, 1990) and is also the Australian recommended limit (NHMRC, 2004). The
difference between desirable doses and toxic doses of fluoride is ill-defined, and fluoride may
therefore be considered as an essential mineral with a narrow margin of safety (WHO, 1984).
MATERIALS AND METHODS
The objective in fluoride removal is to treat the contaminated water so as to bring down fluoride
concentration to acceptable limits. The defluoridation techniques can be broadly classified into
two categories, namely membrane and adsorption techniques.
Adsorbent:Material used for the removal of fluoride is kongu tree saw dust. The adsorbent was
collected by grinding the kongu wood for the experimental purpose.
Equipment:The equipment used was pH metre, so that the optimum value of pH removal is
determined.
Preparation of fluoride solution:Fluoride solution is prepared by using Sodium fluoride (NaF –
41.99) which contains 18.99 of Fluoride and 22.99 of sodium. Fluoride solution was prepared by
diluting 8.84, 11.05, 13.26, 15.48mg of sodium fluoride for 4, 5, 6, 7 mg of fluoride per liter.
Batch Studies:In order to study the effect of different controlling parameters like bed height,
particle size, concentration of fluoride, density of packed saw bed on defluoridation capacity of
kongu tree saw dust, adsorption studies are carried out by a batch process. Batch equilibrium
experiments were conducted using a total sample volume of 500 ml for each adsorption run. The
samples were agitated in a reciprocating shaker to reach equilibrium. Suspensions were then
centrifuged at 500 rpm for 30 minutes and then Solution collected. The samples were analysed
fora fluoride concentration. All the experiments were carried out under natural conditions. Thus
form that we would obtain the optimum PH value for maximum removal of fluoride.
Fixed-Bed Column Studies:The adsorption studies were carried out in a acrylic pipe column of
1.5 cm diameter and bed height of 15, 30, 45, 60 cm. The column experiments were conducted
with 4, 5, 6, 7 mg/l fluoride solutions at different bed depths which is designed form Taguchi
method, design of experiments, at a constant flow rate of 60 ml/min.
Taguchi method Table of experiments
Run Bed Height
(cm)
particle Size
(mm)
Fluoride
Concentration
(mg/l)
Compaction
(%) (g)
1
15
2.36-850 4 5
2 850-600 5 10
3 500-300 6 15
4 300-90 7 20
5 2.36-850 5 15

National Conference on Recent Advancement and Sustainability in Civil Engineering, 10th
April2015
RASCE 2015 124
RESULT AND DISCUSSION
Effect due to pH
The pH of the aqueous solution is a controlling factor in the adsorption process. Thus, the role of
hydrogen ion concentration was examined at pH values of 5 - 8. This was adjusted by adding 0.1
NaCl or 0.1 M NaOH with 50 ml of standard solution of 4 mg/l of fluoride for a contact time of
30 min with a dose of 10 g/100ml of adsorbent. The influence of pH on the sorption rate is
Equilibrium fluoride sorption was increases with pH up to neutral and decreases with increase in
pH. Maximum adsorption by the bottom ash was observed at pH 6.0.
Removal of fluoride after treatment
After the treatment of aqueous solution the fluoride in the solution is determined and the
percentage of removal of fluoride in each experimental run is determined and tabulated, the
percentage of removal of fluoride in each run is used to determine the signal to noise ratio of
each parameter and its levels.
Signal to Noise Ratio
Signal-to-noise ratio (often abbreviated SNR or S/N) is a measure used in science and
engineering that compares the level of a desired signal (Levels) to the level of background noise
(parameters). It is defined as the ratio of signal power to the noise power.
1 2 3 4
Series1 1.26 0.9 2.2 2.8
0
1
2
3
Co
nce
ntr
atio
n o
f
flu
ori
de
Removal of fluoride
6 30 850-600 4 20
7 500-300 7 5
8 300-90 6 10
9
45
2.36-850 6 20
10 850-600 7 15
11 500-300 4 10
12 300-90 5 5
13
60
2.36-850 7 10
14 850-600 6 5
15 500-300 5 20
16 300-90 4 15

National Conference on Recent Advancement and Sustainability in Civil Engineering, 10th
April2015
RASCE 2015 125
S/N(or) SNR=μ/σ.
Percentage of fluoride removed
Signal to noise ratio
Parameter Levels S/N
Bed height
I 15 9.3581
II 30 8.1907
III 45 12.7028
IV 60 6.7041
Particle size
I 2.36-850 9.7752
II 850-600 12.9839
III 500-300 22.5053
IV 300-90 5.4665
Concentration of
fluoride
I 4 9.6261
II 5 18.8164
III 6 19.5001
IV 7 14.214
% of compaction
I 5 9.6048
II 10 17.4867
III 15 11.6890
IV 20 8.4453
Thus from the above table control run with the parameters with higher signal to noise ratio gives
the maximum efficiency in removal of fluoride
Run 30 mins (%) 60 mins (%) 90mins (%) 120mins (%)
1 56 68.75 73.75 56.75
2 76.8 84.8 73.2 68.4
3 89.5 87.17 71.5 70
4 74.86 95.43 92.57 81.57
5 91.8 92.6 94.6 76.8
6 60 71.75 69 65.75
7 87.43 71.71 69.28 68.57
8 65.67 92.83 90 83.33
9 74.17 82.83 81.5 39
10 70.57 72.71 79 80.43
11 57.5 81 75.5 59.25
12 86.8 94 94.6 86.4
13 86.14 86.28 86.14 82.71
14 39.33 85 82 81.83
15 76.4 79 81.8 8.6
16 62.75 55.5 45.25 42.5

National Conference on Recent Advancement and Sustainability in Civil Engineering, 10th
April2015
RASCE 2015 126
Control run
The control run is the necessary run that gives the highest efficiency of the run i.e., maximum
efficiency of removal of fluoride, according to Taguchi method of design of experiments (DOE)
approach, the experimental setup is made in our laboratory for the control run with the parameter
values of 45cm bed height, 500-300microns of particle size of sawdust, with the concentration of
fluoride has 6mg/l and with the compaction factor has 10%. As by Taguchi method of design of
experiments it is has been clearly observed from this run. The result of control run is tabulated
below.
Percentages of removal of fluoride control run
The efficiency of removal of fluoride is about the maximum value of 98.77% which has the
maximum removal of 5.926mg/lit of fluoride at the contact time of 60 minutes, on further
continuation of the run the efficiency of removal of fluoride start to decrease gradually to
90.15% for 90 minutes and then reached the least of 82.37% at 120 minutes contact time. Thus
from the above observations it can be seen that this control run favors removal of fluoride for
more than 120 minutes and shows higher efficiency.
CONCLUSION
Removal of fluoride was very successfully observed with the saw dust which makes the
treatment economical. This study demonstrated that kongu tree saw dust as a low-cost filter was
an effective adsorbent for the removal of fluoride in fixed-bed column. Titration analysis
illustrated that fluoride was success-fully uptaken by kongu tree saw dust filter in column tests.
Results showed that the kong tree saw dust filter was more than other common tree saw dusts,
Nature filter for fluoride uptake. The experimental parameters were discussed in detail including
bed height, particle size, concentration of fluoride and density of packed saw dust in optimum
PH value. Thus form this experimental parameter details it has been confirmed that there is a
maximum removal of 98.77% for the bed height of 45cm, particle size of 500-300microns and
density of packed saw dust in 10% compaction. Thus the optimum removal gives a rapid
description of influence of kongu tree saw dust on removal of fluoride.
REFERENCES
1. M.S. Mansour , M.E. Ossman , H.A. Farag , Removal of Cd (II) ion from waste water by
adsorption onto polyaniline coated on sawdust, 2011, Desalination 272 (2011) 301–305.
2. M. Mohapatra , S. Anand , B.K. Mishra , Dion E. Giles , P. Singh, Review of fluoride
removal from drinking water, Journal of Environmental Management 91 (2009) 67–77.
3. Akbar Eskandarpour , Maurice S. Onyango , Aoyi Ochieng , Shigeo Asai ,Removal of
fluoride ions from aqueous solution at low pH using schwertmannite, Journal of
Hazardous Materials 152 (2008) 571–579.
Run % % % %
Control run 96.41 98.77 90.15 82.37

National Conference on Recent Advancement and Sustainability in Civil Engineering, 10th
April2015
RASCE 2015 127
4. Ji-Lai Gong , Yong-Liang Zhang , Yan Jiang , Guang-Ming Zeng , Zhi-Hui Cui , Ke Liu ,
Can-Hui Deng , Qiu-Ya Niu , Jiu-Hua Deng , Shuang-Yan Huan, Continuous adsorption
of Pb(II) and methylene blue by engineered graphite oxide coated sand in fixed-bed
column, Applied Surface Science 330 (2015) 148–157.
5. V. Sivasankar , T. Ramachandramoorthy , A. Chandramohan, Fluoride removal from
water using activated and MnO -coated Tamarind Fruit 2 (Tamarindus indica) shell:
Batch and column studies , Journal of Hazardous Materials 177 (2010) 719–729.
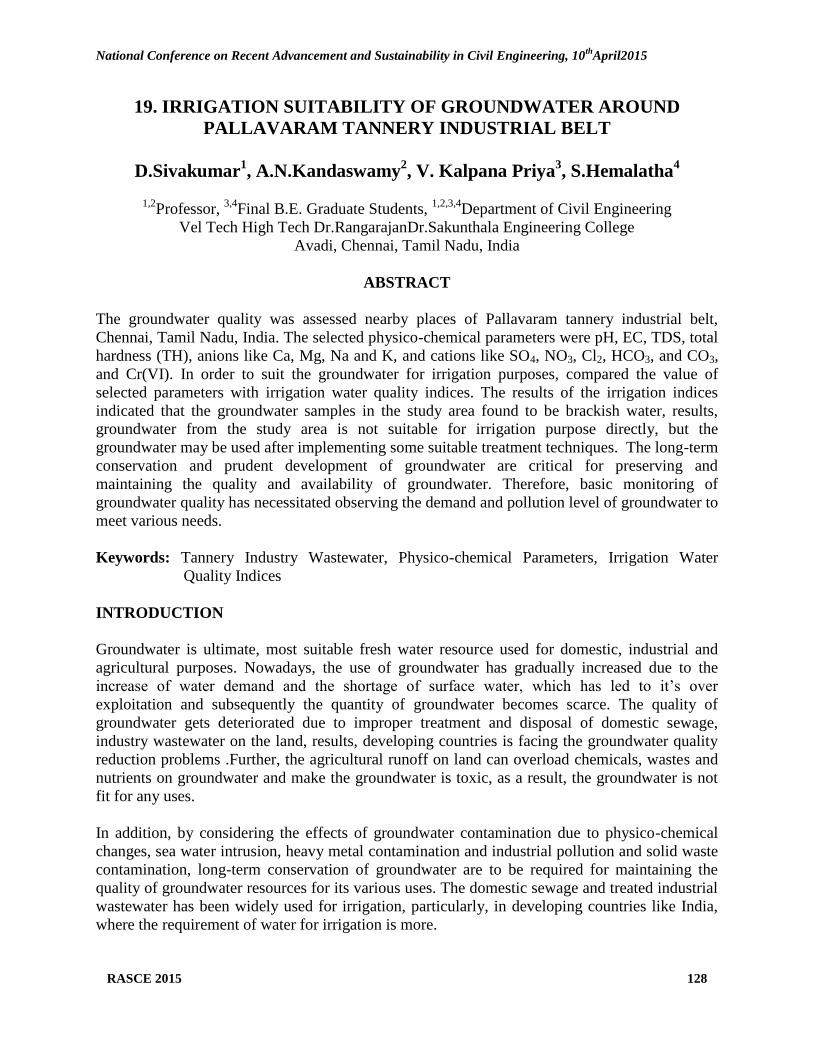
National Conference on Recent Advancement and Sustainability in Civil Engineering, 10th
April2015
RASCE 2015 128
19. IRRIGATION SUITABILITY OF GROUNDWATER AROUND
PALLAVARAM TANNERY INDUSTRIAL BELT
D.Sivakumar1, A.N.Kandaswamy
2, V. Kalpana Priya
3, S.Hemalatha
4
1,2
Professor, 3,4
Final B.E. Graduate Students, 1,2,3,4
Department of Civil Engineering
Vel Tech High Tech Dr.RangarajanDr.Sakunthala Engineering College
Avadi, Chennai, Tamil Nadu, India
ABSTRACT
The groundwater quality was assessed nearby places of Pallavaram tannery industrial belt,
Chennai, Tamil Nadu, India. The selected physico-chemical parameters were pH, EC, TDS, total
hardness (TH), anions like Ca, Mg, Na and K, and cations like SO4, NO3, Cl2, HCO3, and CO3,
and Cr(VI). In order to suit the groundwater for irrigation purposes, compared the value of
selected parameters with irrigation water quality indices. The results of the irrigation indices
indicated that the groundwater samples in the study area found to be brackish water, results,
groundwater from the study area is not suitable for irrigation purpose directly, but the
groundwater may be used after implementing some suitable treatment techniques. The long-term
conservation and prudent development of groundwater are critical for preserving and
maintaining the quality and availability of groundwater. Therefore, basic monitoring of
groundwater quality has necessitated observing the demand and pollution level of groundwater to
meet various needs.
Keywords: Tannery Industry Wastewater, Physico-chemical Parameters, Irrigation Water
Quality Indices
INTRODUCTION
Groundwater is ultimate, most suitable fresh water resource used for domestic, industrial and
agricultural purposes. Nowadays, the use of groundwater has gradually increased due to the
increase of water demand and the shortage of surface water, which has led to it‘s over
exploitation and subsequently the quantity of groundwater becomes scarce. The quality of
groundwater gets deteriorated due to improper treatment and disposal of domestic sewage,
industry wastewater on the land, results, developing countries is facing the groundwater quality
reduction problems .Further, the agricultural runoff on land can overload chemicals, wastes and
nutrients on groundwater and make the groundwater is toxic, as a result, the groundwater is not
fit for any uses.
In addition, by considering the effects of groundwater contamination due to physico-chemical
changes, sea water intrusion, heavy metal contamination and industrial pollution and solid waste
contamination, long-term conservation of groundwater are to be required for maintaining the
quality of groundwater resources for its various uses. The domestic sewage and treated industrial
wastewater has been widely used for irrigation, particularly, in developing countries like India,
where the requirement of water for irrigation is more.

National Conference on Recent Advancement and Sustainability in Civil Engineering, 10th
April2015
RASCE 2015 129
Though various treatment methods and remedial measures adopted for removing the
contaminants in the wastewater of various sources and the polluted groundwater resources, the
human being, plant and aquatic life has affected throughout the years .Therefore, basic
monitoring of groundwater quality is important to check the pollution level of groundwater
before being consumed for various needs. Different groups of chemists and biologists regularly
conducted a good number of groundwater quality analysis across the country.
The main objective of this case study is to assess the groundwater quality of 5 selected sites,
nearby places of Pallavaram, Chennai, Tamil Nadu, and India. the suitability of groundwater for
agricultural purposes were analyzed by assessing various physico-chemical parameters like pH,
EC, TDS, TH, Ca, Mg, Na, K, SO4, NO3, Cl2, HCO3, CO3 and Cr(VI). In order suit the
groundwater for the irrigation purposes, compared the value of selected parameters with
irrigation water quality indices.
MATERIALS AND METHODS
Study Area
The selected study area of this present study is Pallavaram tannery industrial belt, Chennai,
Tamil Nadu with 12.96 Latitude and 80.14 Longitude. The groundwater of Pallavaram was
polluted by untreated sewage and wastewater from tannery industry. Tannery industry
wastewater contains particularly, lime, sodium-carbonate, sodium bicarbonate,common salt,
sodium sulphate and chrome sulphate. Chromium present in wastewater is in the form of Cr(III)
butwhen tannery wastewater is discharged onto the land (soil), Cr(III) is in the oxidized form of
Cr(VI), which is more toxic innature. The Cr(VI) is carcinogenic to human beings when the
concentration of Cr(VI) exceeds the tolerance limit of 0.05 mg/L (BIS water quality standard –
IS 10500:1991). Thus, untreated sewage and untreated wastewater disposal of tannery industry
on the land in Pallavaram is leading to contaminate both soil and water environment.
Collection of Water Samples
The selected sites for the investigations are Nagalkeni (W1), Pallavaram (W2), Perunkudi (W3),
Chrompet (W4), and Thambaram (W5). The water samples were collected from the Bore wells
without the presence of bubbles using cleaned air tight plastic bottles. The collected groundwater
samples were immediately stored in a refrigerator to avoid contaminations at 5 °C. The
groundwater samples collected in the month of December 2014. The various physico-chemical
analyses were carried out for the collected samples in the Environmental Engineering
Laboratory.
Experimental Analysis
Analyzed the collected groundwater samples for various physico-chemical parameters like pH
was measured with the help of pH meter, electrical conductivity (EC) was measured with the
help of an electrical conductivity meter, anions like Ca, Mg, Na and K, and cations like SO4,
NO3, and Cl2, were measured as per the standard procedures stipulated by APHA. The Cr(VI)
was measured with the help of UV spectrophotometer.

National Conference on Recent Advancement and Sustainability in Civil Engineering, 10th
April2015
RASCE 2015 130
The values of these physic-chemical parameters in a Groundwater of different areas are used to
determine the Suitability of groundwater for irrigation purposes. The Irrigation water quality
indices such as a sodium adsorption ratio (SAR), soluble sodium percentage (SSP) and residual
sodium carbonate (RSC) along with BIS water quality standard used to check the groundwater
from selected areas are suitable for irrigation purposes.
Sodium Adsorption Ratio:
The sodium adsorption ratio gives a clear idea about the Adsorption of sodium by soil. It is the
proportion of sodium to calcium and magnesium, which affects the availability of theater to the
crop. The Sodium Adsorption Ratio (SAR) can be calculated the following equation:
SAR= [(Na)/ {√Ca+Mg)/2}] (1)
Where, all the ions are expressed in meq/L.
Soluble Sodium Percentage:
Sodium percent is an important factor for studying sodium hazard. It is also used for
adjudging the quality of water for agricultural purposes. High percentage sodium water for
irrigation purpose may stunt the plant growth and reduces soil permeability. The Soluble Sodium
Percentage (SSP) can be calculated by the following equation:
SSP= [(Na+K)/ (Ca+Mg+Na+K)]×100 (2)
Where, all the ions are expressed in meq/L.
Residual Sodium Carbonate
If groundwater having high concentration of bicarbonate, there is a tendency for calcium,
magnesium and sodium to precipitate as a result, the relative proportion of calcium, magnesium
and sodium in the water is increased in the form of calcium, magnesium and sodium carbonate.
RSC is calculated as:
RSC = [(HCO3 + CO3) – (Ca + Mg)] (3)
Where, all ionic are expressed in meq/L.
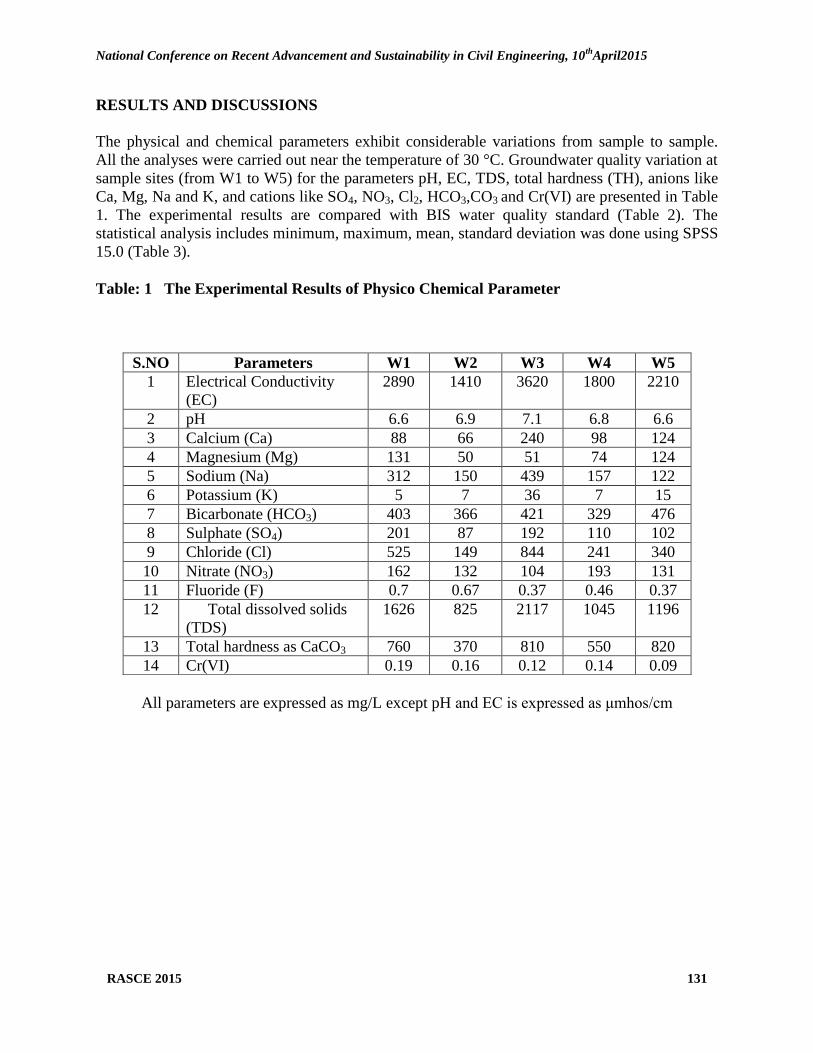
National Conference on Recent Advancement and Sustainability in Civil Engineering, 10th
April2015
RASCE 2015 131
RESULTS AND DISCUSSIONS
The physical and chemical parameters exhibit considerable variations from sample to sample.
All the analyses were carried out near the temperature of 30 °C. Groundwater quality variation at
sample sites (from W1 to W5) for the parameters pH, EC, TDS, total hardness (TH), anions like
Ca, Mg, Na and K, and cations like SO4, NO3, Cl2, HCO3,CO3 and Cr(VI) are presented in Table
1. The experimental results are compared with BIS water quality standard (Table 2). The
statistical analysis includes minimum, maximum, mean, standard deviation was done using SPSS
15.0 (Table 3).
Table: 1 The Experimental Results of Physico Chemical Parameter
All parameters are expressed as mg/L except pH and EC is expressed as μmhos/cm
S.NO Parameters W1 W2 W3 W4 W5
1 Electrical Conductivity
(EC)
2890 1410 3620 1800 2210
2 pH 6.6 6.9 7.1 6.8 6.6
3 Calcium (Ca) 88 66 240 98 124
4 Magnesium (Mg) 131 50 51 74 124
5 Sodium (Na) 312 150 439 157 122
6 Potassium (K) 5 7 36 7 15
7 Bicarbonate (HCO3) 403 366 421 329 476
8 Sulphate (SO4) 201 87 192 110 102
9 Chloride (Cl) 525 149 844 241 340
10 Nitrate (NO3) 162 132 104 193 131
11 Fluoride (F) 0.7 0.67 0.37 0.46 0.37
12 Total dissolved solids
(TDS)
1626 825 2117 1045 1196
13 Total hardness as CaCO3 760 370 810 550 820
14 Cr(VI) 0.19 0.16 0.12 0.14 0.09

National Conference on Recent Advancement and Sustainability in Civil Engineering, 10th
April2015
RASCE 2015 132
Table: 2 BIS Drinking Water Quality Standard
Parameters Standards (IS:10500, revision 2003)
pH 6.5-8
Calcium (Ca) 75 mg/L
Magnesium (Mg) 30 mg/L
Sodium (Na) 200 mg/L
Potassium (K) 10 mg/L
Bicarbonate (HCO3) 200 mg/L
Sulphate (SO4) 200 mg/L
Chloride (Cl) 250 mg/L
Nitrate (NO3) 50 mg/L
Fluoride (F) 1.5 mg/L
(TDS) 600 mg/L
TH 200 mg/L
Cr(VI) 0.05 mg/L
Table: 3 Statistical Analyses for the Selected Samples
S.No Parameters Min. Max. Mean S.D.
1 pH 6.6 7.1 6.8 0.2
2 Calcium (Ca) 66 240 123 57
3 Magnesium (Mg) 50 131 86 36
4 Sodium (Na) 122 439 236 114
5 Potassium (K) 5 36 14 9
6 Bicarbonate (HCO3) 329 476 399 70
7 Sulphate (SO4) 87 201 138 51
8 Chloride (Cl) 149 844 419 270
9 Nitrate (NO3) 104 193 144 40
10 Fluoride (F) 0.37 0.7 0.5 0.13
11 TDS 825 2117 1361 536
12 TH 370 820 662 292
13 EC 1410 3620 2386 976
14 Cr(VI)_ 0.09 0.19 0.14 0.05
From Table 1, it may be observed that the pH value of all sites is within the BIS limit and
groundwater is in acidic condition. The identified all parameters are not within the prescribed
limits as mentioned in the BIS except the nitrate, whose value in all sites is within the
prescribed limits as mentioned in the BIS. From the results mentioned in the Table1, it was
found that the groundwater from the selected sites (W1 to W5) is not suitable for irrigation
purposes directly, but it can be used for irrigation purpose after adopting suitable treatment
processes.
Hardness
Hardness is the sum of Ca and Mg concentrations expressed in terms of mg/L of calcium
carbonate. The degree of hardness in water is commonly based on the classification listed in
Table 4 and hardness of groundwater of selected sites is given in Table 5.

National Conference on Recent Advancement and Sustainability in Civil Engineering, 10th
April2015
RASCE 2015 133
Table 4 Classification of Water Hardness
Hardness range
(mg/L of CaCO3)
Water
Classification
0-75 Soft
75-150 Moderately
150-300 Hard
>300 Very Hard
Table 5 Groundwater Quality Based on
Hardness
Sample
Location
TH value Remark
W1 760 Very Hard
W2 370 Very Hard
W3 810 Very Hard
W4 550 Very Hard
W5 820 Very Hard
From Table 5, it may be observed that hardness from the selected sites is within the range of
370 to 820 mg/L .The groundwater quality of the selected sites can be classified as very hard
for the sites( W1, W2, W3, W4 and W5) and the quality of groundwater are unsuitable for
irrigation.
Salinity Hazards
Electrical Conductivity: Electrical conductivity is a measure of water‘s capacity to conduct
electric current. As most of the salts in the water are present in the ionic form, so they are
responsible to conduct electric current. Generally, groundwater tends to have high electrical
conductivity due to the presence of High amount of dissolved salts. In order to classify the
type of groundwater based on the salinity hazard, the total concentration of soluble salts in
groundwater can be expressed in terms of specific conductance. Salinity hazard
classifications presented in Table 6 and the salinity hazard of groundwater of selected sites is
given in Table 7.
Table 6 Salinity Hazard Classes
Salinity
Hazard
Class
EC
(µmhos/cm)
Remark
on quality
C1 100-250 Excellent
C2 250-750 Good
C3 750-2250 Doubtful
C4 >2250 Unsuitable
Table 7 Groundwater Quality Based on EC
Sample
Location
EC
value
Class Remark
W1 2890 C4 Unsuitable
W2 1410 C3 Doubtful
W3 3620 C4 Unsuitable
W4 1800 C3 Doubtful
W5 2210 C3 Doubtful
From Table 7, it may be observed that EC from the selected sites are within the range of 1410
to 3620 μmhos/cm, and hence, the groundwater quality of the selected sites can be classified
as C3 (W2, W4 & W5) and C4 (W1 & W3) group and the quality of groundwater is doubtful
and Unsuitable for irrigation.
Total Dissolved Solids
Total dissolved solids in a water sample include all solid materials in solution, whether
ionized or not. It does not include suspended sediments, colloids or dissolved gases. TDS is
the numerical sum of all dissolved solids determined accurately by chemical analyses. Its
general acceptance level is 500 mg/L according to BIS standard (Table 2). Salinity hazard
classification of groundwater based on TDS on groundwater of selected sites is given in

National Conference on Recent Advancement and Sustainability in Civil Engineering, 10th
April2015
RASCE 2015 134
Table 8. From Table 9, it may be observed that TDS from the selected sites are within range
of 825 to 2117 mg/L, and hence the groundwater quality of the selected sites can be classified
as C1 (W2) and C2 (W1, W3, W4, & W5) group and the quality of ground water freshwater
and brackish water for irrigation.
Table 8 Salinity Hazard Classes
Salinity
Hazard
TDS
(mg/L)
Remark on
quality
C1 0-1000 Fresh Water
C2 1000-10000 Brackish
Water
C3 10000-
100000
Saline Water
C4 >100000 Brine
Table 9 Groundwater Quality Based on TDS
Sample
Location
TDS
value
Class Remark
W1 1626 C2 Brackish
Water
W2 825 C1 Fresh Water
W3 2117 C2 Brackish
Water
W4 1045 C2 Brackish
Water
W5 1196 C2 Brackish
Water
Sodium Hazards
The SAR classification of groundwater samples from the study area is presented in Table 10
and the sodium hazard based on SAR of groundwater of selected sites is given in Table 11.
From Table 11 it may be observed that SAR from the selected sites are within range between
1.85 and 6.71 meq/l, and hence, the groundwater quality of the selected sites can be classified
as S1 (W1, W2, W3, and W4 & W5) group and the quality of groundwater excellent for
irrigation.
Table 10 Sodium Adsorption Ratio
SAR Class
Sodium
hazard
class
SAR
(me/l)
Remark on
quality
S1 >10 Excellent
S2 10-18 Good
S3 18-26 Doubtful
S4 >26 Unsuitable
Table 11 Groundwater Quality From
Selected Sites for SAR
Sample
Location
SAR
value
Class Remark
W1 4.94 S1 Excellent
W2 3.24 S1 Excellent
W3 6.71 S1 Excellent
W4 2.91 S1 Excellent
W5 1.85 S1 Excellent
Soluble Sodium Percentage
Sodium percent is an important factor for studying sodium hazard. It is also used for
adjudging the quality of water for agricultural purposes. High percentage sodium water for
irrigation purposes may stunt the plant growth and reduces soil permeability. The SSP
classification of groundwater samples from the study area is presented in Table 12 and the
sodium hazard based on SSP of ground water of selected sites is given in Table 13.

National Conference on Recent Advancement and Sustainability in Civil Engineering, 10th
April2015
RASCE 2015 135
Table 12 Soluble Sodium Percentage
(SSP) Class
Sodium
hazard class
SSP
(meq/l)
Remark on
quality
S1 <20 Excellent
S2 20-40 Good
S3 40-80 Doubtful
S4 >80 Unsuitable
Table 13 Groundwater Quality From
Selected Sites For SSP
Sample
Location
SSP
value
Class Remark
W1 47.45 S3 Doubtful
W2 47.81 S3 Doubtful
W3 55.4 S3 Doubtful
W4 38.91 S2 Good
W5 25.92 S2 Good
From Table 13, it may be observed that the soluble sodium percentage from the selected sites
are within range of 25.9 to 55.4 meq/l, and hence the groundwater quality of the selected sites
can be classified as S3 (W1.W2 & W5) and S2 (W4 & W5) group and the quality of
groundwater good and doubtful for irrigation.
Residual Sodium Carbonate
The classification of RSC is presented in Table 14 and the groundwater of the study area is
classified based on RSC is presented in the Table 15. From the Table 15, it may be observed
that the RSC value that were obtained for 5 places were found to be < 1.25 and thus they are
suitable for irrigation purpose.
Table 14 Residual Sodium Carbonate
(RSC) Class
RSC (meq/l) Remark on quality
<1.25 Good
1.25-2.25 Doubtful
>2.25 Unsuitable
Table 15 Groundwater Quality From
Selected Sites for RSC
Sample
Location
RSC
(meq/l)
Remark
W1 -8.56 Good
W2 -1.31 Good
W3 -9.19 Good
W4 -5.58 Good
W5 -8.58 Good
The above variations are mainly due to more wastewater Generated from the tannery industry
sectors left in the land and the same infiltrated through porous soil media, reached the
groundwater system and finally groundwater get contaminated. In addition, the above
variations are due to anthropogenic impact of processes carried out in tannery industry; all
quality parameters of groundwater were also contaminated. Further, due to municipal
wastewater, leach ate from all dumping places also contaminated the groundwater. The
wastewater contains toxic / non-toxic, organic and inorganic substances and many of which
were not readily susceptible to biodegradation. Finally, these pollutants in the form of
dissolved materials carried cause irreversible groundwater contamination.
National Conference on Recent Advancement and Sustainability in Civil Engineering, 10th
April2015
RASCE 2015 136
CONCLUSION
In order to assess the groundwater suitability for irrigation purposes, experimental
investigations have been performed on various parameters like pH, EC, TDS, TH, Ca, Mg,
Na, K, SO4, NO3, Cl2, HCO3 , CO3 and Cr(VI) in the groundwater and those parameters have
also been compared with BIS water quality standard and irrigation quality indices. From the
results of this study, it may be concluded that the groundwater is not suitable for irrigation
purposes directly, but it can be used for irrigation purposes after adopting proper treatment
techniques. In addition to the groundwater quality parameter analysis, other factors like soil
types, soil engineering properties, crop types, cropping patterns, frequency of rainfall,
frequency of irrigation, climate, etc. have important factors in determining the suitability of
groundwater for irrigation purposes.
REFERENCES
1. APPA, ―Standard methods for the examination of water and wastewater,‖20th ed.,
APHA Publication, Washington D.C., 2005.
2. D.P. Gupta, Sunita and J.P. Saharan, ―Physiochemical analysis of groundwater of
selected area of Kaithal City (Haryana) India, ―Researcher, vol. 1, no. 2, pp. 1-5,
2009.
3. A.S. Adekunle, ―Effects of Industrial Effluent on Quality of Well Water within Asa
Dam Industrial Estate, Ilorin, Nigeria,‖ Nature and Science, vol. 7, no. 1, pp. 39-43,
2009.
4. K. Saravanakumar and R. Ranjith Kumar, ―Analysis of water quality parameters of
groundwater near Ambattur industrial area, Tamil Nadu, India,‖ Indian Journal of
Science and Technology, vol. 4, no. 5, pp.660-662, 2011.
5. B. Nas, ―Geostatistical Approach to Assessment of Spatial Distribution of
Groundwater Quality,‖ Polish J. of Environ. Stud., vol. 18, no. 6, pp.1073-1082, 2009.
6. G.Tamma Rao, V.V.S. Gurunadha Rao and K.Ranganathan, ―Hydro geochemistry
and groundwater quality assessment of Ranipetindustrial area, Tamil Nadu, India,‖ J.
Earth Syst.Sci., vol. 122, no. 3, pp.855-867, 2013.
7. T. Pratiksha, M. Pravin, R.J. Batra and R.G. Weginwar, ―Quality assessment of
drinking water: A case study of Chandrapur District (M.S.),‖ Journal of Chemical and
Pharmaceutical Research, vol. 4, no. 5,pp. 2564-2570, 2012.
8. A. Jinwal and S. Dixit, ―Pre and post monsoon variation in physio-chemical
characteristic in groundwater quality in Bhopal, India,‖Asian j. Exp. Sci., vol. 22, no.
3, pp. 311-316, 2008.
9. N. Ravisankarand S. Poogothai, ―A study of ground water quality in Tsunami affected
areas of Sirkazhi taluk, Nagapattinam district,Tamilnadu,India.,‖ Sci.Tsunami
Hazards, vol. 27, no. 1, pp.47-55, 2008.
10. D. Sivakumar and D. Shankar, ―Effect of aeration on colour removal from textile
industry wastewater,‖ International Journal of EnvironmentalSciences, vol. 2, no. 3,
pp. 1386-1397, 2012.
11. [11] Sivakumar Durairaj, Shankar Durairaj, ―Colour Removal from Textile Industry
Wastewater Using Low Cost Adsorbents,‖ International Journalof Chemical,
Environmental and Pharmaceutical Research, vol. 3, no. 1,pp. 52-57, 2012b.
12. D. Sivakumar, ―A study on contaminant migration of sugarcane effluent through
porous soil medium,‖ Int. J. Environ. Sci. Tech., vol. 8, no. 3, pp.593-604, 2011.

National Conference on Recent Advancement and Sustainability in Civil Engineering, 10th
April2015
RASCE 2015 137
13. Sivakumar Durairaj, ―Experimental and analytical model studies on leachate volume
computation from solid waste,‖ Int. J. Environ. Sci.Tech.Int. J. Environ. Sci. Technol.
Vol. 10, pp. 903-916, 2013b.
14. Sivakumar Durairaj, ―Adsorption Study on Municipal Solid Waste Leachate was
using Moringa oleifera Seed,‖ Int. J. Environ. Sci. Technol.,vol. 10, pp. 113–124,
2013c.
15. N.V. SrikanthVuppala, ―Study of Ground Water Quality Analysis in Industrial Zone
of Visakhapatnam,‖ Journal of Advanced LaboratoryResearch in Biology, vol. 3, no.
3, pp. 231-236, 2013.

National Conference on Recent Advancement and Sustainability in Civil Engineering, 10th
April2015
RASCE 2015 138
20. SIZE EFFECT STUDIES ON CONCRETE MADE OF
NATURAL AND ARTIFICIAL SAND
D. Sivakumar1, T. Hemalatha
2, M. Kotteeswaran
3,
N. Murugan4, R. Rajeshwaran
5
1Professor,
3,4,5Final B.E. Graduate Students,
1,3,4,5Department of Civil Engineering
Vel Tech High Tech Dr. Rangarajan Dr. Sakunthala Engineering College
Avadi, Chennai, Tamil Nadu, India 2Scientist, CSIR-Structural Engineering Research Centre (CSIR-SERC),
Chennai, Tamil Nadu, India
ABSTRACT
An experimental investigation has been carried out to investigate the influences of size effect
and the variations in strength due to this size effects. If the size of the specimen increases
correspondingly the strength decreases or vice – versa. In conventional strength of materials
concept it is predicted that a larger and smaller concrete specimen will fail at the
same stress if they are made with same material. In the real world, because of size effects, a
larger concrete specimen will fail at a lower stress than a smaller beam .This concept is
mainly based on ―Size Effect‖ and to find this effect compressive and split tensile test have
been conducted on standard and high strength concrete (M30& M60) made of natural and M-
sand. In addition to this the flexural strength test is also conducted on standard and high
strength concrete made of natural and M-sand to compare the flexural strength of the beams.
Due to the depletion of natural sand, M-sand has been adopted because it makes the concrete
require less amount of water and provide higher workable concrete and increases the strength
of concrete than the natural sand; along with this the same size effect study is also carried out
with M-sand. As a result it is found that the change in size of specimen also varies the
stresses in both natural and M-sand.
Keywords: Size effect, Stress, M-sand, Compressive Strength, Split Tensile Strength,
Flexural Strength
INTRODUCTION
The size of a concrete specimen under static loading may influences its behavior. This is
known as a ‗‗size effect‖ and can be defined as the dependence of concrete nominal strength
on concrete specimen. Size effect can be explained by a combination of fracture mechanics
and plasticity because the fracture in a concrete structure is driven by the stored elastic
energy that is released globally from the entire structure and it is highly related to the energy
balance at the time of fracture process. Response of the structure and damage evolution is
expected to depend upon the size; however it is not that much clear how the strength of
material affect this size effect phenomenon.
The size effect is mainly due to the strength of the material and its randomness behavior &
also due to release of energy when a large crack occurs or a large fracture process zone
containing damaged material gets developed before the maximum load is reached. The
compressive strength is generally used to check the quality of concrete and is simply
calculated as the stress at the time of failure based on the transverse cross-sectional area of
National Conference on Recent Advancement and Sustainability in Civil Engineering, 10th
April2015
RASCE 2015 139
concrete specimen. The 28-days compressive strength is universally accepted as a general
index of concrete strength.
The compressive strength of concrete is the basic and important material property in the
design of reinforced concrete structures. It has become a problem to use this value as the
control specimen sizes and shapes are different from country to country. In India, the
characteristic compressive strength is usually measured based on 150 x 150 x 150 mm for
cubes, 150 x 300mm for cylinders and 100 x 100 x 500mm for beam. But, the ACI code of
practices, the use of lesser sizes gained more acceptance as the need to test high strength
concrete increases. In this context the size effect becomes an important parameter for the
compressive strength.
Experiments on concrete structure members under local pressure indicated that the
compressive strength of concrete at the bearing area is increased by the confinement effect
provided by the enveloping concrete. Although design codes propose specific criteria to
prevent bearing failure, they do not consider size effect which is an important phenomenon in
the fracture mechanics of concrete/reinforced concrete. Experimental and theoretical studies
carried out in the recent past showed that structural concrete behavior (subjected to tension,
compression, shear, or torsion) is largely influenced by the size of the specimen.
The size effect was studied by behavioral comparisons of geometrically similar test
specimens. Experimental and numerical studies are in plenty and those studies show that
larger compression specimens had steeper softening paths, and larger beams were weaker in
bending, shear and torsion. In addition to that, we also investigated the effect of 100%
replacement of natural sand by artificial sand where Cement, fine and coarse aggregate are
basic needs for any construction industry. Sand is a prime material used for preparation of
mortar and concrete and which plays a major role in mix design.
Now a day‘s erosion of naturals and considering environmental issues, there is a scarcity of
natural sand. The non-availability or shortage of natural sand will affect the construction
industry, hence there is a need to find the new alternative material to replace the natural sand,
such that excess natural erosion and harm to environment is prevented.
OBJECTIVES
To determine the influence of size effect on concrete.
To use M sand as a fine aggregate in concrete.
Compare the strength characteristics using M sand and natural sand in concrete.
To find out Workability, Compressive Strength, Split tensile strength of concrete
specimens.
RESEARCH SIGNIFICANCE
This size effect of structural component needs more focus and hence in this study it is
proposed to carry out a compression and split tensile test on concrete made of natural
and Artifical.
Two different geometrically similar specimens of standard and high strength concrete
are cast and tested to study the size effect behavior.

National Conference on Recent Advancement and Sustainability in Civil Engineering, 10th
April2015
RASCE 2015 140
In strength of materials concept, whatever the size of specimen either it may be larger
or smaller both fails at same stress but in conventional method the smaller specimen
fails at high stress whereas the larger specimen fails at lower stress.
NEED FOR REPLACEMENT OF FINE AGGREGATE
There is scarcity of natural sand due to heavy demand in growing construction activities
which forces to find the suitable substitute. The cheapest and the easiest way of getting
substitute for natural sand is by crushing natural stone to get artificial sand of desired size and
grade which would be free from all impurities. For the purpose of experimentation concrete
mixes are designed for M30& M 60 grade by 100% replacement of natural sand by artificial
sand.
ARTIFICIAL SAND ( M - SAND)
Artificial Sand is sand produced from crushing of granite stones in required grading to be
used for construction purposes as a replacement for natural sand. As per reports, artificial
sand is widely used all around the world and technicians of major projects around the world
insist on the compulsory use of manufactured sand because of its consistent gradation and
zero impurity.
The artificial sand ( M – Sand ) has required gradation of fines , physical properties
such as shape, smooth , surface textures and consistency.
These physical properties of sand provides greater strength to the concrete by
reducing segregation , bleeding , honeycombing, voids and capillary.
Since M – Sand is processed from quality of granite, it has the balanced physical and
chemical properties
This property of M – Sand helps the concrete structures withstand extreme
environmental
conditions and prevents the corrosion of reinforcement steel.
The M – Sand makes the concrete require less amount of water and provide higher
workable concrete and increases the strength of concrete.
The M – Sand has optimum initial setting and final setting time as well as excellent
fineness.
The usage of M – Sand is more ecofriendly.
Figure 1 Manufacture Sand
COMPARISON OF NATURAL SAND Vs ARTIFICIAL SAND
When particles below 75μ are nearer to the limit of 15%, it is advisable to make
suitableadjustment of water to cement ratio and ensure early curing to avoid problems of
plastic shrinkage cracking.

National Conference on Recent Advancement and Sustainability in Civil Engineering, 10th
April2015
RASCE 2015 141
Table 1 Comparison of Natural and Artificial Sand
MATERIALS USED
Cement (OPC of 53 grade)
Fine aggregate
1. Natural sand
2. Artificial sand
Coarse aggregate (20mm,12.5mm)
Water
Super plasticizers (PCE 4450&PCE 432)
MIX DESIGN
The following tests that are to be conducted to find out the mix proportions and they are as
follows:
Specific gravity (IS 2386 PART III)
Water absorption test (IS 2386 PART III)
Bulk density (IS 2386)
Sieve analysis (IS 2386 PART I)
Table 2 Results of Basic Tests
Properties of
Coarse and fine
aggregate
20mm
coarse
aggregate
12.5mm
coarse
aggregate
Natural
sand
Artificial
sand
Loose density 1412.03
kg/m3
1421.77
kg/m3
Nil Nil
Rodded density 1600.68
kg/m3
1578.23
kg/m3
Nil Nil
Fineness modulus 5.13 4.49 2.63 2.92
Specific gravity 2.68 2.71 2.57 2.65
Water absorption 0.54 0.70 1.35 1.87
Properties Natural Sand Artifical sand
Shape Spherical particle Cubical particle
Gradation Cannot be controlled Can be controlled
Particle passing 75
micron
Up to 3%(IS:383-1970) Up to 15% (IS:383-1970)
Clay and Organic
impurities
Likely to be present (retard
the setting &comp. strength)
Absent
Grading zone
(IS-383)
Mostly conforms to Zone II
and III
Manufactured to conform
to Zone II
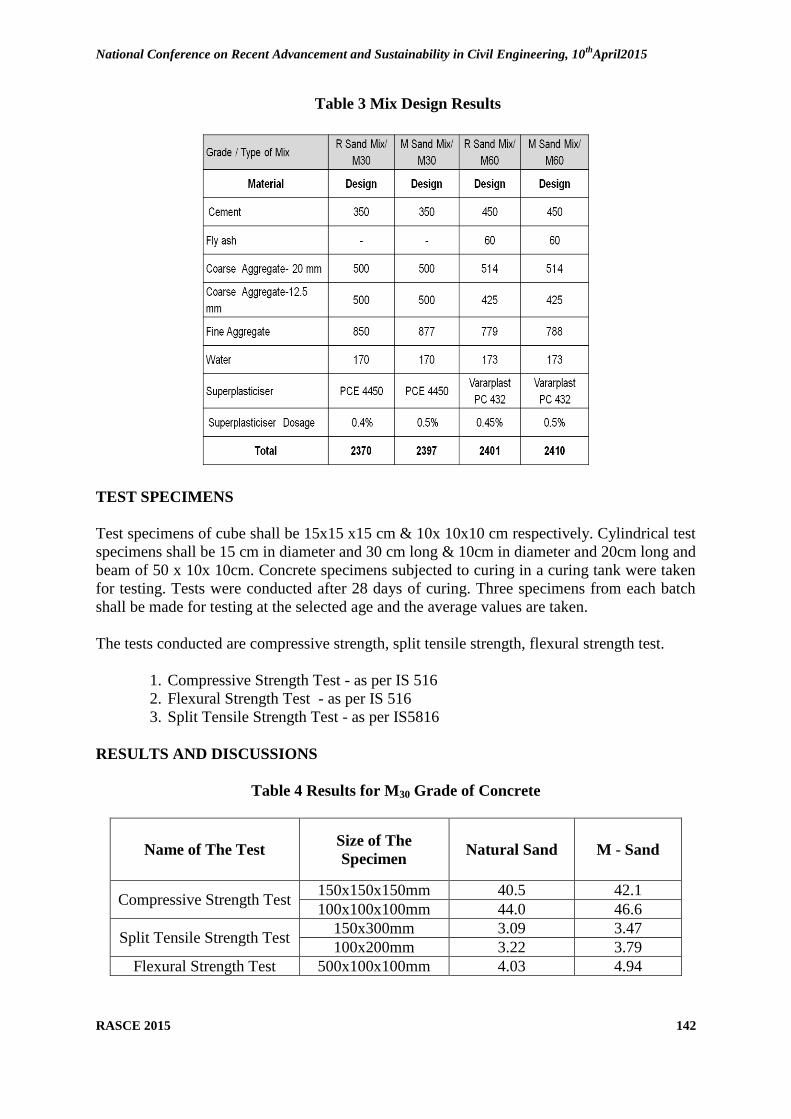
National Conference on Recent Advancement and Sustainability in Civil Engineering, 10th
April2015
RASCE 2015 142
Table 3 Mix Design Results
TEST SPECIMENS
Test specimens of cube shall be 15x15 x15 cm & 10x 10x10 cm respectively. Cylindrical test
specimens shall be 15 cm in diameter and 30 cm long & 10cm in diameter and 20cm long and
beam of 50 x 10x 10cm. Concrete specimens subjected to curing in a curing tank were taken
for testing. Tests were conducted after 28 days of curing. Three specimens from each batch
shall be made for testing at the selected age and the average values are taken.
The tests conducted are compressive strength, split tensile strength, flexural strength test.
1. Compressive Strength Test - as per IS 516
2. Flexural Strength Test - as per IS 516
3. Split Tensile Strength Test - as per IS5816
RESULTS AND DISCUSSIONS
Table 4 Results for M30 Grade of Concrete
Name of The Test Size of The
Specimen Natural Sand M - Sand
Compressive Strength Test 150x150x150mm 40.5 42.1
100x100x100mm 44.0 46.6
Split Tensile Strength Test 150x300mm 3.09 3.47
100x200mm 3.22 3.79
Flexural Strength Test 500x100x100mm 4.03 4.94

National Conference on Recent Advancement and Sustainability in Civil Engineering, 10th
April2015
RASCE 2015 143
Figure 2 Compressive Strength Graph for M30 Grade of Concrete
Figure 3 Split Tensile Strength Graph for M30 Grade of Concrete
37
38
39
40
41
42
43
44
45
46
47
150x150x150 100x100x100
40.5
44
42.1
46.6
Natural Sand
M-Sand
0
0.5
1
1.5
2
2.5
3
3.5
4
150 x 300 100 x 200
3.09 3.22 3.47
3.79
Natural Sand
M-Sand

National Conference on Recent Advancement and Sustainability in Civil Engineering, 10th
April2015
RASCE 2015 144
Figure 4 Flexural Strength Graph for M30 Grade of Concrete
Table 5 Results for M60 Grade of Concrete
Name of The Test Size of The Specimen Natural Sand M - Sand
Compressive Strength Test 150x150x150mm 69.5 71.6
100x100x100mm 75.2 76.2
Split Tensile Strength Test 150x300mm 3.14 3.99
100x200mm 3.65 4.12
Flexural Strength Test 500x100x100mm 7.23 7.89
Figure 5 Compressive Strength Graph for M60 Grade of Concrete
0
1
2
3
4
5
500x100x100
4.09
4.94
Natural Sand
M-Sand
66
68
70
72
74
76
78
150x150x150 100x100x100
69.5
75.2
71.6
76.2
Natural Sand
M Sand

National Conference on Recent Advancement and Sustainability in Civil Engineering, 10th
April2015
RASCE 2015 145
Figure 6 Split Tensile Strength Graph for M60 Grade of Concrete
Figure 7 Flexural Strength Graph for M60 Grade of Concrete
CONCLUSION
The compressive strength, split tensile strength were determined for two sizes and two grades
of concrete to evaluate the effect of size with respect to grade of concrete. Further, the
influence of 100% replacement of natural sand with M sand is also studied. The following
conclusions are derived.
The mechanical properties obtained with natural sand and M – sand indicates that
strength obtained for Artifical is higher than that of natural sand for both M30 and M60
grade of concrete.
In general, the size of the specimen affects the load carrying capacity or stiffness of the
concrete. From the size effect study conducted, it is observed that there is no significant
variation in the strength with two sizes considered. Size effect is not dominant for the
0
0.5
1
1.5
2
2.5
3
3.5
4
4.5
150 x 300 100 x 200
3.28
3.65
3.99 4.12
Natural Sand
M Sand
6.9
7
7.1
7.2
7.3
7.4
7.5
7.6
7.7
7.8
7.9
500 x 100 x100
7.23
7.89
Natural sand
M Sand
National Conference on Recent Advancement and Sustainability in Civil Engineering, 10th
April2015
RASCE 2015 146
two sizes considered in this study. Moreover, the size effect is not influenced by the type
of fine aggregate used. The mechanical properties obtained from both Artifical and
natural sand were almost the same.
Hence, from this study, it can be concluded that the standard cube of 150 x 150 x 150 mm
and 100 x 100 x 100 mm can be used interchangeably for the test purpose. Similarly, for split
tensile strength, standard cylinder of 150 x 300 mm and 100 x 200mm can be used
interchangeably.
REFERENCES
[1] Dynamic Size Effect In Normal High-strength Concrete Cylinders
(Author(s): Motaz M. Elfahal And Theodor Krauthammer)
[2] Size Effect For Normal Strength Concrete Cylinders Subjected To Axial Impact
(By M. M. Elfahal, T. Krauthammer, T. Ohno, M. Beppu, S. Mindess)
[3] Size Effect In Normal And High-strength Concrete Cylinders Subjected To Static And
Dynamic Axial Compressive Loads (By Elfahal, Motaz)
[4] Manufactured Sand, A Solution And An Alternative To Natural Sand And In Concrete
Manufacturing (By Dr.S.Elavenil, B. Vijaya)
[5] Concrete With Smart Material (Manufactured Crushed Sand)
(By Swapnil S. Fate Civil Engineering Department, J.D. Polytechnic, Nagpur, India)
[6] IS 10262 – 2009 , IS 516 – 1959 , IS 5816 – 1999
[7] IS 2386 (I) – 1963 , IS 2386 (III) – 1963 , IS 456 - 2000

National Conference on Recent Advancement and Sustainability in Civil Engineering, 10th
April2015
RASCE 2015 147
21. RESPONSE OF REINFORCED SANDWICH PANELS UNDER LATERAL
LOADING
A.N.Kandaswamy1, M. Ponvalavan
2, A. Jagathan Prakaash
3,
S. Kumarappan4, D. Raj Kumar
5
1Professor,
2,3,4,5Final B.E. Graduate Students,
1,2,3,4,5Department of Civil Engineering,
Vel Tech High Tech Dr.Rangarajan Dr.Sakunthala Engineering College
Avadi, Chennai, Tamil Nadu, India
ABSTRACT
This paper summarizes the result of an experimental study of precast reinforced sandwich panels subjected
to lateral loading. In order to reduce the self-weight of solid walls, poly urethane sheets were used as
insulation layer between the concrete wythes. A brief review of previous research works undertaken in the
axial load bearing capacity of the reinforced concrete walls is presented. But no literature is available on the
lateral load study on reinforced sandwich panels. Hence Full scale tests were carried out to determine their
lateral load bearing capacity of sandwich panels. Two types of Sandwich panels were casted. One is with
the frame around the infill and other is a box type sandwich panel (without frame). Load - Deformation
response, crack appearance and propagation under increasing lateral load were recorded and analyzed. Test
results of sandwich panels were compared with solid walls in context with load - Deflection profile, critical
load, crack pattern, mode of failure. Finally the replacement of precast solid walls with sandwich wall
panels was discussed.
Key words: Lateral loads; Ultimate strength; Precast reinforced concrete; Sandwich wall panels; Load
bearing walls
INTRODUCTION
Construction Systems based on sandwich panels are commonly used worldwide for intensive building
production. Sandwich panels are typically constituted by two concrete layers which are separated by an
internal insulation layer of various materials (i.e. expanded and extruded polystyrene, rigid polyurethane
foam) and are usually joined with shear connectors (i.e. truss connectors) able to transfer the longitudinal
interface shear between the layers so as to ensure a fully - composite or a semi composite behaviour of the
sandwich panel.
Sandwich concrete panels have consisted of a single Wythe of factory-manufactured precast concrete that
was installed on a building to provide the architectural finish and cladding for a building. Architectural
precast concrete sandwich panels are a more recent innovation. They consist of two wythes of factory-
manufactured precast concrete, which are fabricated with a layer of insulation ―sandwiched‖ between them.
As with traditional architectural precast, the exterior Wythe provides the architectural finish and weather-
resistant cladding. The combination of exterior Wythe, insulation, and interior Wythe in architectural
precast concrete sandwich panels offers the opportunity to provide all performance requirements of an
exterior wall within one assembly.
In order to provide effective performance, both the sandwich panels and the system in which they are
assembled must incorporate building science principles in their design. It is relatively easy to provide the

National Conference on Recent Advancement and Sustainability in Civil Engineering, 10th
April2015
RASCE 2015 148
requirements of an exterior wall in the field of the panel because concrete can handle many of the
requirements on its own (e.g., fire resistance, structural sufficiency). However, the requirements at the joints
between the panels and at junctions with other components must be addressed to complete the design.
PCSP function as efficiently as precast solid wall panels but differ in their build-up. Interest in sandwich
panels as load-bearing wall panels has been growing over the past few years because the manufacturers are
looking for more viable products and architects/engineers are pleased with the structural and energy
performance of the sandwich panels PCSP acting as load bearing elements are structurally efficient,
providing economical means of transferring floor and roof loads to the foundations. The structural
behaviour of the panel depends greatly on the strength and stiffness of the connectors, while the thermal
resistance of the insulation layer governs the insulation value of the panel.
OBJECTIVES
To reduce Self weight of the wall
To use the sandwich panel as load bearing wall
To compare the response of sandwich panels and solid walls under lateral loading.
Analyzing the test results in the context of
Lateral Load Bearing Capacity
Load - Deflection Profiles
Crack Pattern
Mode of Failure
Critical Load
RESEARCH SIGNIFICANCE
If the structural members fail due to lateral loading by earthquake forces, the column in between the
columns is going to suffer due to horizontal forces. To overcome these forces, solid brick walls, solid walls,
RCC walls are used. The dead weight of the above walls is sharing most of the load transfer to the
foundation. To overcome the above problem it is proposed to reduce the dead weight of the intermediate
walls, a light weight RCC wall is planed with insulation layer.Experimental Studies on Precast Sandwich
Panels under Axial Loading,Performance assessment of low - rise confined masonry structures for
Earthquake induced ground motions, Experimental Investigation of unconfined masonry structures under
lateral loading are all found in the literature. But Response of Precast Sandwich Panels subjected to lateral
loading is not found on literature, thus emerges the need of current investigation. A review of studies on
reinforced concrete solid wall panels as described below is, therefore important, as the behaviour of PCSP is
often extrapolated from the behaviour of the reinforced concrete (RC) solid panels.
EXPERIMENTAL SETUP
We placed the Proving Ring in between the Hydraulic Jack and the wall Specimen. The Dial Gauges are
fixed at the other end to find the Deflection. The one 50 mm Dial Gauges are fixed at the place exactly
straight to the Proving Ring. Another to 50 mm Dial Gauges is fixed at one - third distance from the first
50mm Dial Gauge. Demac Gauge is fixed at two sides of wall specimen. One at the side where load is
applied, other at the side where the deflection is measured. It is fixed 20 cm from the top of wall specimen.
A button is fixed with the 20cm centre to centre distance. If the extension occurs, the elongated length is
measured. Dividing the Elongated length with the initial length gives the Strain developed in the Concrete.

National Conference on Recent Advancement and Sustainability in Civil Engineering, 10th
April2015
RASCE 2015 149
The Wall Specimen is tested by fixing the bottom end fixed and top end free (considering as a cantilever).
The bottom end is fixed with the ground using L-angles, 12 ton Hydraulic Jack, 10 ton Hydraulic Jack, 20
ton Hydraulic Jack, I Sections and Channel Sections.
A 100mm Dial Gauge is fixed at Top of the wall specimen near the proving Ring to determine the uplift of
wall.The Proving Ring used in our Experiment was being calibrated by us using Compressive Testing
Machine. The Deflection is noted for every 20 KN load applied by the Compression Testing Machine. The
Readings were taken upto 350 KN load. A Load Vs Deflection graph was plotted. The deflection was noted
during experiment. Using the graph corresponding Load for that particular deflection can be find out.
MATERIALS USED
Cement
Fine Aggregate (Natural sand)
Coarse Aggregate (10mm)
Water
Polyurethane sheet
Steel rods
DETERMINATION OF BALANCED SECTION
We determined the balanced section by trial and error method. we started with minimum dimension of 100
x 100 cross section with 8mm dia bars as main reinforcement. Substituting the corresponding values in the
Xu formula, we checked whether the assumed cross section is enough or not. The Formula used to
determine the balanced section is as follows,
=
( )( )
( )( )
Xm = 0.48d
If Xu > Xm, then the section is Over Reinforced Section.
If Xu = Xm, then the section is Balanced Section.
If Xu< Xm, then the section is Over Reinforced Section.
The Section should not be Over Reinforced. It may be Under Reinforced or Balanced Section. As per Codal
Provision, the concrete should get failed first before the reinforcement fails.Hence we adopted 130mm x
130mm cross section with 4 No's of 8 mm dia bars and M25 grade Concrete.
MIX DESIGN
The following tests that are to be conducted to find out the mix proportions and they are as follows:
Specific gravity (IS 2386 PART III)
Sieve analysis (IS 2386 PART I)
Table 1 Aggregate Test Results
Test Fine Aggregate Coarse Aggregate
Sieve Analysis 4.136 3.713
Specific Gravity 2.65 2.68

National Conference on Recent Advancement and Sustainability in Civil Engineering, 10th
April2015
RASCE 2015 150
Table 2 Mix Ratio
Cement
(Kg/m3)
Fine Aggregate
(Kg/m3)
Coarse Aggregate
(Kg/m3)
Water
(Kg/m3)
416 909.48 849.024 208
SPECIMENS
The Concrete and Reinforcement details of sandwich panel specimen is shown below
FIGURE 1 CONCRETE DETAILS
FIGURE 2 REINFORCEMENT DETAILS
CASTING OF SPECIMENS
The concrete is prepared in the Mix Ratio 1 : 2.18 : 2.04. The two specimens were casted of size 1000 *
2000* 130mm. Three cubes and three cylinders were casted for each specimen simultaneously at the time of
wall castingThe Cubes and Cylinders were casted simultaneously to determine the compressive strength and
Split Tensile Strength of concrete used for the particular wall specimen.The Mould of 1000 x 2000 x 130
mm size was prepared and was placed in its position. The Reinforcement (contains outer frame, top and
bottom reinforcement) is placed inside the mould. Outer frame contains 4 No's of 8mm dia bars with 6 mm
dia stirrups. Top and Bottom reinforcement contains 8 mm dia bars at 200 mm spacing. The 40mm cover is
maintained throughout the portal frame. The materials of the concrete mix were thoroughly mixed
manually. First 40mm thick layer of concrete was poured first. Then the insulated material of 50 mm
thickness was placed. Then Top reinforcement was placed over the insulated material. Now the next 40 mm
concrete was poured and finished properly with trowel.
TESTING OF SPECIMENS
28 days of curing, the Sandwich wall was taken out from the curing tank. Once the sandwich panel was
dried, it was whitewashed to find developed cracks during testing. Then the solid wall was set in the loading
frame. The Top left face of the sandwich panel was connected with the Hydraulic Jack through Proving
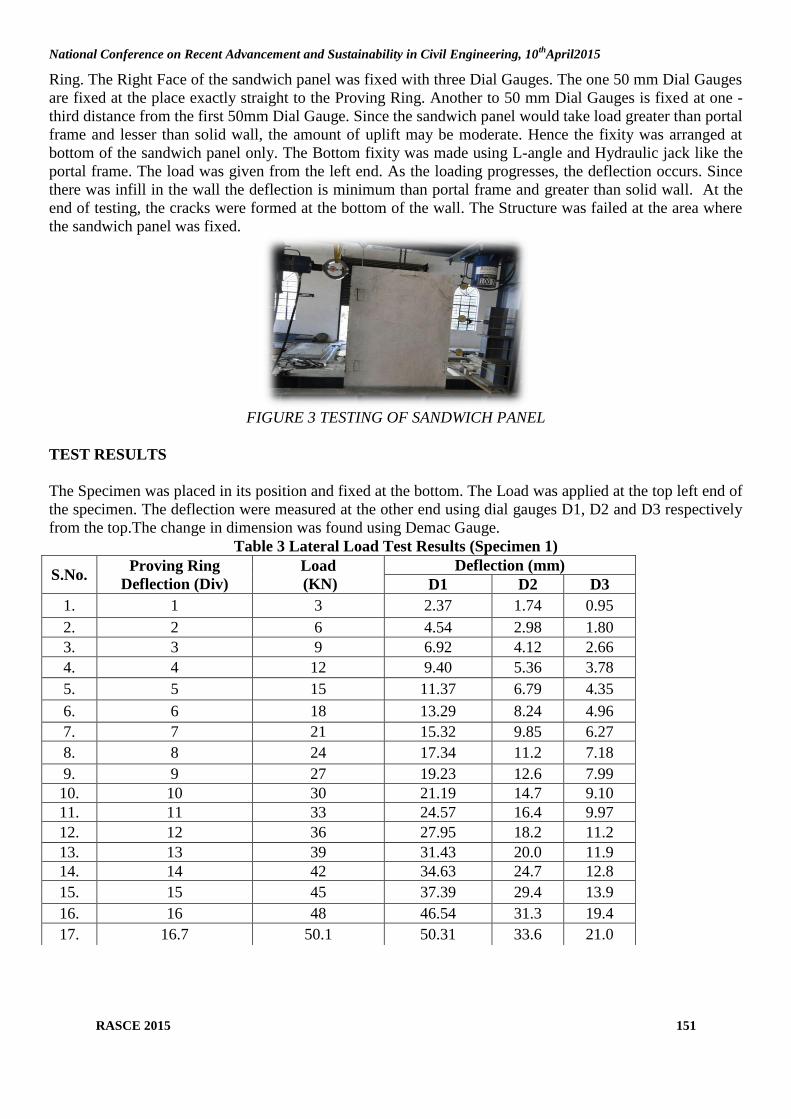
National Conference on Recent Advancement and Sustainability in Civil Engineering, 10th
April2015
RASCE 2015 151
Ring. The Right Face of the sandwich panel was fixed with three Dial Gauges. The one 50 mm Dial Gauges
are fixed at the place exactly straight to the Proving Ring. Another to 50 mm Dial Gauges is fixed at one -
third distance from the first 50mm Dial Gauge. Since the sandwich panel would take load greater than portal
frame and lesser than solid wall, the amount of uplift may be moderate. Hence the fixity was arranged at
bottom of the sandwich panel only. The Bottom fixity was made using L-angle and Hydraulic jack like the
portal frame. The load was given from the left end. As the loading progresses, the deflection occurs. Since
there was infill in the wall the deflection is minimum than portal frame and greater than solid wall. At the
end of testing, the cracks were formed at the bottom of the wall. The Structure was failed at the area where
the sandwich panel was fixed.
FIGURE 3 TESTING OF SANDWICH PANEL
TEST RESULTS
The Specimen was placed in its position and fixed at the bottom. The Load was applied at the top left end of
the specimen. The deflection were measured at the other end using dial gauges D1, D2 and D3 respectively
from the top.The change in dimension was found using Demac Gauge.
Table 3 Lateral Load Test Results (Specimen 1)
S.No. Proving Ring
Deflection (Div)
Load
(KN)
Deflection (mm)
D1 D2 D3
1. 1 3 2.37 1.74 0.95
2. 2 6 4.54 2.98 1.80
3. 3 9 6.92 4.12 2.66
4. 4 12 9.40 5.36 3.78
5. 5 15 11.37 6.79 4.35
6. 6 18 13.29 8.24 4.96
7. 7 21 15.32 9.85 6.27
8. 8 24 17.34 11.2 7.18
9. 9 27 19.23 12.6 7.99
10. 10 30 21.19 14.7 9.10
11. 11 33 24.57 16.4 9.97
12. 12 36 27.95 18.2 11.2
13. 13 39 31.43 20.0 11.9
14. 14 42 34.63 24.7 12.8
15. 15 45 37.39 29.4 13.9
16. 16 48 46.54 31.3 19.4
17. 16.7 50.1 50.31 33.6 21.0
National Conference on Recent Advancement and Sustainability in Civil Engineering, 10th
April2015
RASCE 2015 152
Table 4 Compressive Strength of Cube (1st Specimen)
S.No Trail No Load (KN) Compressive Strength (N/mm2)
1. Trail 1 590 26.2
2 Trail 2 530 23.5
3 Trail 3 610 27.1
AVERAGE 25.6
Table 5 Split Tensile Strength of Cylinder (1st Specimen)
S.No Trail No Load (KN) Split Tensile Strength (N/mm2)
1. Trail 1 140 1.98
2. Trail 2 170 2.40
3. Trail 3 180 2.54
AVERAGE 2.31
Table 6 Lateral Loading Results (Specimen 2)
S.No Proving Ring Deflection
(Div)
Load (KN) Deflection (mm)
D1 D2 D3
1. 1 3 1.53 0.87 0.45
2. 2 6 3.06 1.74 0.93
3. 3 9 4.60 2.65 1.38
4. 4 12 6.13 3.54 1.83
5. 5 15 7.65 4.43 2.27
6. 6 18 9.61 5.53 2.89
7. 7 21 11.5 6.69 3.52
8. 8 24 13.54 7.82 4.14
9. 9 27 15.51 8.96 4.77
10. 10 30 17.49 10.1 5.41
11. 11 33 20.07 12.9 6.07
12. 12 36 22.65 15.7 6.74
13. 13 39 25.24 18.5 7.41
14. 14 42 27.82 21.3 8.14
15. 15 45 30.41 24.1 8.74
16. 16 48 36.30 26.9 11.7
17. 17 51 42.24 29.7 14.7
18. 18 54 48.17 32.5 17.6
19. 19 57 53.47 35.3 20.5
20. 20 60 59.89 38.1 23.7
21. 21 63 63.4 40.7 25.0
22. 21.2 63.6 64.9 42.0 26.7
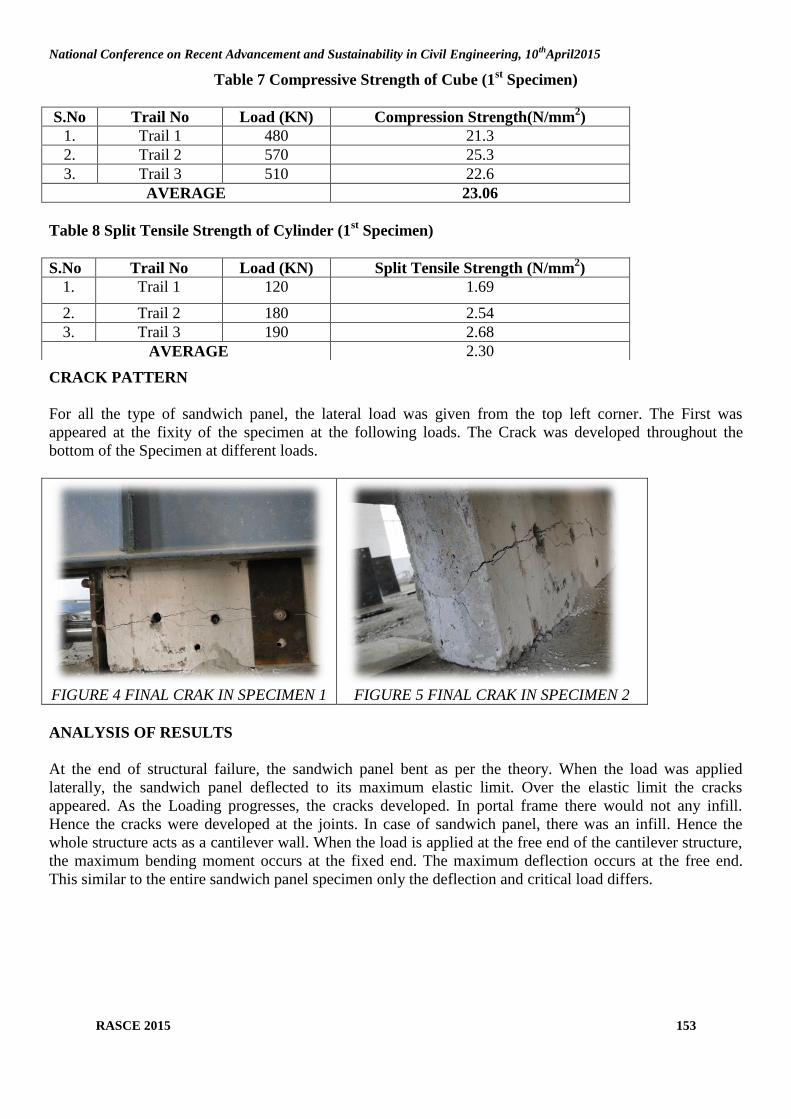
National Conference on Recent Advancement and Sustainability in Civil Engineering, 10th
April2015
RASCE 2015 153
Table 7 Compressive Strength of Cube (1st Specimen)
S.No Trail No Load (KN) Compression Strength(N/mm2)
1. Trail 1 480 21.3
2. Trail 2 570 25.3
3. Trail 3 510 22.6
AVERAGE 23.06
Table 8 Split Tensile Strength of Cylinder (1st Specimen)
CRACK PATTERN
For all the type of sandwich panel, the lateral load was given from the top left corner. The First was
appeared at the fixity of the specimen at the following loads. The Crack was developed throughout the
bottom of the Specimen at different loads.
FIGURE 4 FINAL CRAK IN SPECIMEN 1
FIGURE 5 FINAL CRAK IN SPECIMEN 2
ANALYSIS OF RESULTS
At the end of structural failure, the sandwich panel bent as per the theory. When the load was applied
laterally, the sandwich panel deflected to its maximum elastic limit. Over the elastic limit the cracks
appeared. As the Loading progresses, the cracks developed. In portal frame there would not any infill.
Hence the cracks were developed at the joints. In case of sandwich panel, there was an infill. Hence the
whole structure acts as a cantilever wall. When the load is applied at the free end of the cantilever structure,
the maximum bending moment occurs at the fixed end. The maximum deflection occurs at the free end.
This similar to the entire sandwich panel specimen only the deflection and critical load differs.
S.No Trail No Load (KN) Split Tensile Strength (N/mm2)
1. Trail 1 120 1.69
2. Trail 2 180 2.54
3. Trail 3 190 2.68
AVERAGE 2.30

National Conference on Recent Advancement and Sustainability in Civil Engineering, 10th
April2015
RASCE 2015 154
Specimen 1: The maximum deflection at the top of frame is 64.91mm. The deflection at the second and
third dial gauges are 42.03mm and 26.72mm respectively. The Portal Frame structure fails at the load of
63.6KN. The maximum crack width at the failure load is 8.3mm.
Specimen 2: The maximum deflection at the top of frame is 61.02mm. The deflection at the second and
third dial gauges are 39.61mm and 24.79mm respectively. The Portal Frame structure fails at the load of
60.9KN. The maximum crack width at the failure load is 8.5mm.
FIGURE 6 DEFLECTION OF SPECIMEN 1
FIGURE 6 DEFLECTION OF SPECIMEN 2
1.53 3.06 4.6 6.13 7.65 9.61
11.58 13.54
15.51 17.49
20.07 22.65
25.24 27.82
30.41
36.3
42.24
48.17
53.47
59.89 63.43 64.91
0.87 1.74 2.65 3.54 4.43 5.53 6.69 7.82 8.96 10.12 12.92
15.72 18.52
21.32 24.12
26.92 29.71
32.57 35.32
38.12 40.72 42.03
0.45 0.93 1.38 1.83 2.27 2.89 3.52 4.14 4.77 5.41 6.07 6.74 7.41 8.14 8.74 11.74
14.75 17.67
20.57 23.78 25.04 26.72
0
10
20
30
40
50
60
70
3 6 9
12
15
18
21
24
27
30
33
36
39
42
45
48
51
54
57
60
63
63
.6
Def
lect
ion
Load
D1
D2
D3
1.13 2.86 4.2 5.83 7.25
9.31 11.18
13.04 14.87
17.29 18.89 22.41
25.04 27.52
30.11
36.1
42.01
47.88
53.21
59.59 61.02
0.57 1.54 2.25 3.14 4.15 5.26 6.32 7.43 8.45 10.02 12.73
15.51 18.31
21.11 23.89
26.72 29.54
32.31 35.19
38.01 39.61
0.25 0.53 1.18 1.63 2.07 2.69 3.34 4.01 4.57 5.21 5.87 6.54 7.11 7.84 8.44 11.54
14.45 17.37
20.17 23.38 24.79
0
10
20
30
40
50
60
70
3 6 9
12
15
18
21
24
27
30
33
36
39
42
45
48
51
54
57
60
60
.9
Def
lect
ion
Load
D1
D2
D3
National Conference on Recent Advancement and Sustainability in Civil Engineering, 10th
April2015
RASCE 2015 155
CONCLUSION
The Experimental investigation was done on the sandwich panel under lateral loading. Deflection of
sandwich panel was much over the solid wall. But the failure load was just 14% below the failure load of
solid wall. The cost of sandwich pane of is 25% below the cost of solid wall. The previous study on
sandwich panel under loading suggests the use of this type of wall as load bearing wall. This study on
sandwich panels under lateral loading adds advantage to the usage of sandwich panels as load bearing wall.
If cost, light weight, fast construction and strength is needed, then the sandwich panels is the solution.
REFERENCES
[1] Response Of Precast Reinforced Composite Sandwich Panels Subjected To Axial
Loading"A.Benayoune, Aaa.Samad, Aa.Abang Ali, Dn.Trikha (Science Direct - Construction And
Building Materials 21(2007) 677-685)
[2] Experimental Tests And Numerical Modeling Of Wall Sandwich Panels.Fabrizio Gara, Laura
Ragni, Davide Roia, Luigino Dezi (Science Direct - Engineering Structures 37(2012) 193 - 204)
[3] The Experimental And Analytical Investigation Of The Lateral Load Response Of Confined Masonry
Walls Hussein Okail, Amr, Abdelrahman, Amr Abdelkhalik, Mostafa Metwaly

National Conference on Recent Advancement and Sustainability in Civil Engineering, 10th
April2015
RASCE 2015 156
22. COMPARISON OF PRODUCTIVITY ACROSS VARIOUS CONSTRUCTION
PROJECTS
Mr. A. MOHAMAD RAFI B.E
Master in Construction Management,
B.S.Abdur Rahman University, Vandalur,
Chennai-48, India
Mr. P. JAGADEESH M.Tech., (Ph.D)
Assistant Professor
B.S.Abdur Rahman University, Vandalur,
Chennai-48, India
ABSTRACT
Productivity plays an important role in the construction industry. It is one of the key
components of all company‘s success and competitiveness in the market. It helps
construction industries to achieve goals and to meet the stakeholder‘s valuable propositions.
The objectives of the project are; to investigate factors affecting the labour productivity
across various nature of projects. To improve productivity and identify the factors affecting
the project performance. The above objectives have been achieved through the analysis of
questionnaires and the result of this analysis shows that, there are seven main groups which
have significant impact on the construction productivity projects. They are man power group,
project management, drawings /procedures, site management, safety/quality, labour
motivation and environment. Factor analysis and reliability analysis was carried out before
analyzing the
The result of the study is recommended by conducting Multiple Linear Regression and
correlation using statistical package social science (SPSS) which should explain the total
variance regarding the factors affecting labour productivity in construction projects.
Keywords: construction labour productivity, regression analysis.
I. Introduction
Productivity has been generally defined as the ratio of outputs / inputs. Construction
projects are mostly labour based with basic hand tools and equipment, as labour costs
comprise 30 % to 50 % of overall project cost. Productivity in economics refers to measures
of output from production processes, per unit of input. Productivity may be conceived of as a
measure of the technical or engineering efficiency of production.
Productivity enables an organization to be competitive, achieve set goals, meet
stakeholder value propositions and maintain strategic and financial health. At the industry
level, productivity enables the sector to maintain satisfied clientele, attract investment, remain
viable and contribute to the economic growth and well-being of the nation.
A successful construction project is one that achieves the intended objectives in terms
of cost, time, quality and safety. This is possible only when the planned levels of productivity
are attained. However, the productivity, or lack of it, is perhaps one of the major problems

National Conference on Recent Advancement and Sustainability in Civil Engineering, 10th
April2015
RASCE 2015 157
confronting the construction industry, as well as construction firm and the construction
project. Since due to consequences of the importance of the construction industry along with
the nature of construction projects and the available economic resources, should be given to
improve productivity.
All the stated things leads this study to raise the questions, ―What are the factors
affecting construction productivity‖ and ―How to evaluate the effects of this factor on the
fluctuation of labour productivity; To answers this questions, it is necessary to conduct the
topic Factors Affecting the Fluctuation of Productivity in the Construction Projects.
objectives of study
This study is conducted to achieve the following objectives.
To investigate factors affecting the labour productivity across various nature of
projects.
To improve productivity and identify the factors affecting the project performance.
scope
Capture the productivity in projects of different nature
Compare them with industrial standards and analyze the variance
Observe the best/worst practices adapted
Propose measures to improve them
literature Review
Productivity in construction is often broadly defined as output per labour hour. Since
labour constitutes a large part of the construction cost and the quantity of labour hours in
performing a task in construction is more susceptible to the influence of management than are
materials and capital, then productivity measured is often referred to as labour productivity.
Hence, it is important to state that, labour productivity is a measure of overall effectiveness of
an operating system in utilizing labour, equipment and capital to convert labor efforts into
useful output, which is not a measure of the capabilities of labour alone.
Homyun Jang et al (2009) identified 25 critical variables and were grouped into 4
groups, namely work management; work technique; work characteristic and worker
component. Durdyev and Mbachu (2011) identified 56 variables affecting construction
productivity, and categorized them into eight factors of internal group and external group.
Enshassi (2007) classifies factors affecting productivity in the construction projects
into 10 groups, namely: factors associated with the internal workforce, factors associated with
leadership, factors associated with work motivation factor associated with time, factors
associated with materials and equipment, factors related to supervision, factors related to
project characteristic, factors related to security, factors related to quality and external
factors.
Soekiman et al (2011) identified 113 variables affecting construction labour productivity and
these variables were grouped into 15 groups of factors according to their characteristics,
namely:

National Conference on Recent Advancement and Sustainability in Civil Engineering, 10th
April2015
RASCE 2015 158
Design, execution plan, material, equipment, labor, health and safety, supervision, working
time, project factor, quality, financial, leadership and co-ordination, organization,
owner/consultant and external factor.
Nabil Ailabouni et al (2007) identified 32 significant variables affecting the
productivity in the construction industry and these were grouped into 4 groups based on their
characteristic, namely: environment factors, organizational factors, group dynamics and
personal factors.
In summary, based on the previous research, 44 factors are selected and grouped into
7 groups according to their characteristics, namely: Man power group, project management,
drawings /procedures, site management, safety/quality, labour motivation and environment.
Table I - Factors Affecting Labour Productivity
S. NO GROUP FACTORS
A MANPOWER
1 Lack of experience
2 Increase of labor age
3 Labor abseentism
4 Lack of training
5 Labour personal problems
6 Changing supervisors
7 Changing workers
8 High rate of labour turn over
9 Discipline
B PROJECT
MANAGEMENT
10 Improper scheduling of work
11 Shortage of materials
12 Poor supply chain management
13 Unsuitable material storage
14 Increase in price of materials

National Conference on Recent Advancement and Sustainability in Civil Engineering, 10th
April2015
RASCE 2015 159
15 Crew size
16 Stop work orders because of site accidents
C DRAWINGS &
PROCEDURES
17 supervision in delays
18 Variation in drawings
19 Incomplete drawings
20 Inspection delays from authorities
21 Accessibility or availability of work procedure
D SITE
MANAGEMENT
22 Poor site management
23 Poor communication
24 Misunderstanding between labors and supervisors
25 Lack of periodic meeting with labors
26 Incidences e.g. equipment breakdown & planning
errors
E SAFETY &
QUALITY
27 Working at high places
28 Unavailability of safety devices
29 Insufficient lighting
30 Poor access and egress housekeeping
31 Low quality raw materials
32 Rework

National Conference on Recent Advancement and Sustainability in Civil Engineering, 10th
April2015
RASCE 2015 160
33 Quality inspection delay
34 No safety awareness programme
F LABOUR
MOTIVATION
35 Lack of motivation program
36 Little or no financial rewards
37 Late payments
38 Low amount of pay
39 Poor coordination of camping
G ENVIRONMENT
40 Weather changes
41 Project location
42 Working with confined space
43 Large project size
V. research methodology
Figure 1 Research method

National Conference on Recent Advancement and Sustainability in Civil Engineering, 10th
April2015
RASCE 2015 161
SPSS is a Windows based program that can be used to perform data entry and analysis and
to create tables and graphs. SPSS is capable of handling large amounts of data and can
perform all of the analyses covered in the text and much more. SPSS is commonly used in
the Social Sciences and in the business world, so familiarity with this program should serve
you well in the future. SPSS is updated often.
VI. data collection
The primary data will be collected via direct visit to site or indirect through email or online
survey. The secondary data sources are from literature, international business articles,
journals, books, professional newspaper and business or expertise website.
VII. questionnaire survey
Questionnaire is at the front line of the research – it is what the general public
understanding research, particularly social research. The form of questionnaire contains four
sections:
Section1: A cover letter with the research plan and intention to carry out the research and
research title.
Section2: General information of the project which respondent has involved.
Section3: Including 43 factors affecting construction productivity with five point Likert
rating scale.
Section4: Respondents information if any.
Finally the completed questionnaire will be shown in the appendices.
Reliability analysis:
The determination of scale reliability is a measurement of the internal consistency of
the constructed items in the research in order to evaluate its reliability of each variable in
measurement scales. However, the observed variables describes the common construct. The
constructs with high reliability are those in which the items are highly inter correlated. It
states that they are all measured with the same construct. Reliability Analysis is used to
identify Cronbach‘s alpha coefficient and item tital correlation. The reliability coefficient of
Cronbach‘s alpha also examines how relation of the items in a set which are significantly
correlated from one to other.
Factor analysis:
Factors were classified into several components. During this process components classified
on the basis of relevant literature review (manpower, project management, drawings &
procedures, site management, safety & quality, labour motivation and environment). Those
components that were properly classified were examined, and that were not classified were
reclassified so that the components could properly represent the factors.

National Conference on Recent Advancement and Sustainability in Civil Engineering, 10th
April2015
RASCE 2015 162
Generally, the value of Cronbach‘s alpha for acceptable reliability is 0.7 and it could
decrease to 0.6 in exploratory research and any variables which have the value of Corrected
Item-Total Correlation below 0.4 would be consider to be rejected.
Multiple Regression analysis:
This is the last stage of the statistical analysis in which the factors that significantly
influenced labour productivity variation in construction. The significance of the components
are analyzed whereas insignificant components were discarded at the final stage. Then the
regression model was evaluated and impact of each component was analyzed.
VIII. data analysis & discussion
A total of 150 questionnaires were distributed to the construction firms in the population.
Of these, 100 questionnaires were successfully filled. Once the data was collected the
analysis was done as per questionnaires that were used to collect the data.
Questionnaire was collected from various nature of projects such as;
1. Nuclear power plant projects
2. Institutional or commercial projects
3. Metro projects
4. Residential projects
5. Pipeline projects
Summary on data result analysis:
After conducting Reliability Analysis, Factor Analysis, Multi Linear Regression Analysis,
on 43 variables affecting to labour productivity, there were 6 variables have been deleted
because of its‘ Corrected – Item Total Correlation value are smaller than 0.3 within
Reliability Analysis, including: labour personal problems, increase of labor age,
misunderstanding between labor and supervisors, high rate of labour turn over and after
conduct Factor Analysis, the variables inspection delay from authorities and low quality raw
materials are deleted, the management team factor also removed because of its‘ variables:
poor supply chain management, Lack of training, Lack of periodic meeting with labor have
been moved to supervision and workforce factor. After conducted Multi Linear Regression
Analysis, manpower, project management, site management, drawings & procedures, safety&
quality factor are supported, but labour motivation and environment factor was not supported
by the research.

National Conference on Recent Advancement and Sustainability in Civil Engineering, 10th
April2015
RASCE 2015 163
TABLE: LABOUR EFFICIENCY RATING SCALE
S.
No
Act
ivit
y
Bad Not
bad
Good Better Excellen
t
1 2 3 4 5
1
2
3
5
6
7
8
9
10
IX. conclusions and recommendations
The most significant objective of this study is to develop a model in order to determine the
factors affecting construction labour productivity across various projects. Initially this chapter
summaries the main findings and also outline for future research.
Research finding:
The proposed concept model of this study proposed seven independent factors affect
Labour Productivity in construction projects which are man power group, project
management, drawings /procedures, site management, safety/quality, labour motivation and
environment. After conducting Reliability analysis, Exploratory Analysis, there were 2
independent variables are rejected because of Corrected Item- Total coefficient less than 0.3
and loading score less than 0.5. Furthermore, variable (manpower), (Lack of experience) and
(Lack of periodic meeting with labour) in project management Factor have been loaded to
another factor. There was no changing in that variables and factors and the number of factor
decrease from 7 to 6 factors with environment factor has been deleted.
The Multiple Linear Regression was performed and defined 7 independent factors
positively affecting Labor Productivity Fluctuation as final research. Regression analysis
indicates
that the model explains 68.7% of the variance in Labor Productivity Fluctuation. Among five
extracted factors, labour motivation Factor is the most positively affecting to the Labor

National Conference on Recent Advancement and Sustainability in Civil Engineering, 10th
April2015
RASCE 2015 164
Productivity with highest standardized beta of 0.310. It means that the any changing of
Motivation factor would be most affect to Labour productivity than others. Therefore the
project manager or construction manager who is handling the construction projects needs to
pay attention on those factors, especially site management and labour motivation.
The groups of factors which are highly effective are: supervision, material, execution plan,
and design. Moreover, for large companies, equipment factors have also highly effective.
While in small and medium companies, owner/consultant factors also need special attention
because it has high effect too. Research findings also show that health and safety factors has
not been a concern of small, medium companies and has some effect, while in large
companies are better, although not as major concern and has average effect.
Practically it is difficult task to all to improve labour productivity upto 100%. But if you
have properly control on above factors, productivity can be improved up to large extent.
References
[1] Enshassi, A., Mohamed, A., Mustafa, Z. A., & Mayer, P. E. (2007). Factors affecting
labour productivity in building project in the Gaza strip. Journal of Civil Engineering
and Management, 8(4), 245-254.H. Kunzel, T. Grosskinsky, Vapor Barrier for Use in the
Heat Insulation of Buildings. U.S. Patent, 2004.
[2] Homyun Jang, Kyonghoom Kim, Juhyung Kim, and Jaejun Kim. (2009). Labour
productivity model for reinforced concrete construction projects. Construction
Innovationm Process, Management, 11(1), 92-113.
[3] Homyun Jang, Kyonghoom Kim, Juhyung Kim, and Jaejun Kim. (2011). Labour
productivity model for reinforced concreteConstruction projects.
[4] Construction Innovationm Process, Management, 11(1), 92-113.
[5] Durdyev, S., & Mbachu, J. (2011). On-site Labour Productivity of New Zealand
Construction Industry: Key Constraints and Improvement Measures. Australasian Journal
of Construction Economic and Building, 1(3), 18-33.
[6] Soekiman, A., Pribadi, A. S., Soemardi, B. W., & Wirahaddikusumah, R. D. (2011).
Fatcors relating to labor productivity affecting the project schedule performance in
indonesia. Procedia Engineering, 14(10), 865-873.
[6] Dissanayake, M., Fayek, R.A., Russell, A.D. and Pedrycz, W. (2005), ―A hybrid neural
network for predicting construction labour productivity‖, Proceeding of ASCE
International Conference on Computing in Civil Engineering, 12-15 July, Cancun,
Mexico.
[7] Durdyev, S., & Mbachu, J. (2011). On-site Labour Productivity of New Zealand
Construction Industry: Key Constraints and Improvement Measures. Australasian Journal
of Construction Economic and Building, 1(3), 18-33.
[8] Soekiman, A., Pribadi, A. S., Soemardi, B. W., & Wirahaddikusumah, R. D. (2011).
Fatcors relating to labor productivity affecting the project schedule performance in
indonesia. Procedia Engineering, 14(10), 865-873.
[9] Attar, A.A, Gupta, A.k, Desai, D.B, ‗A Study of Various Factors Affecting Labour
Productivity and Methods to Improve It‗, Journal of Mechanical and Civil Engineering,
11-14.

National Conference on Recent Advancement and Sustainability in Civil Engineering, 10th
April2015
RASCE 2015 165
[10] Abdulaziz M. Jarkas,ph.D., P.Eng.1; And Camille G. Bitar, P.Eng, 2012, ‗Factors
Affecting Construction Labor Productivity IKuwait‗, Journal Of Construction
Engineering And Management .ASC.
[11] Wen Yi, Albert P.C. Chan, 2013, ‗Critical Review of Labor Productivity Research in
Construction‗, Journal of Management in Engineering.
[12] Abdul Kadir, M. R., Lee, w. P., Jaafar, M. S., Sapuan, S. M., and Ali, A. A.
(2005).―Factors Affecting Construction Labour Productivity for Malaysian Residential
Projects.‖ Struct.Surv., 23 (1), 42–54.
[13] Mostafa E. Shehata , Khaled M. El-Gohary b, June 2011, Towards improving
construction labor productivity and projects performance‗, Alexandria Engineering
Journal , 50, 321–330 Struct. Surv., 23 (1), 42–54.
[14] Jimoh, I.A, ‗Effects of delay factors on labour productivity on nigerian construction
sites‗, Interdisciplinary Journal of contemporary research in business, vol 5, no 4.
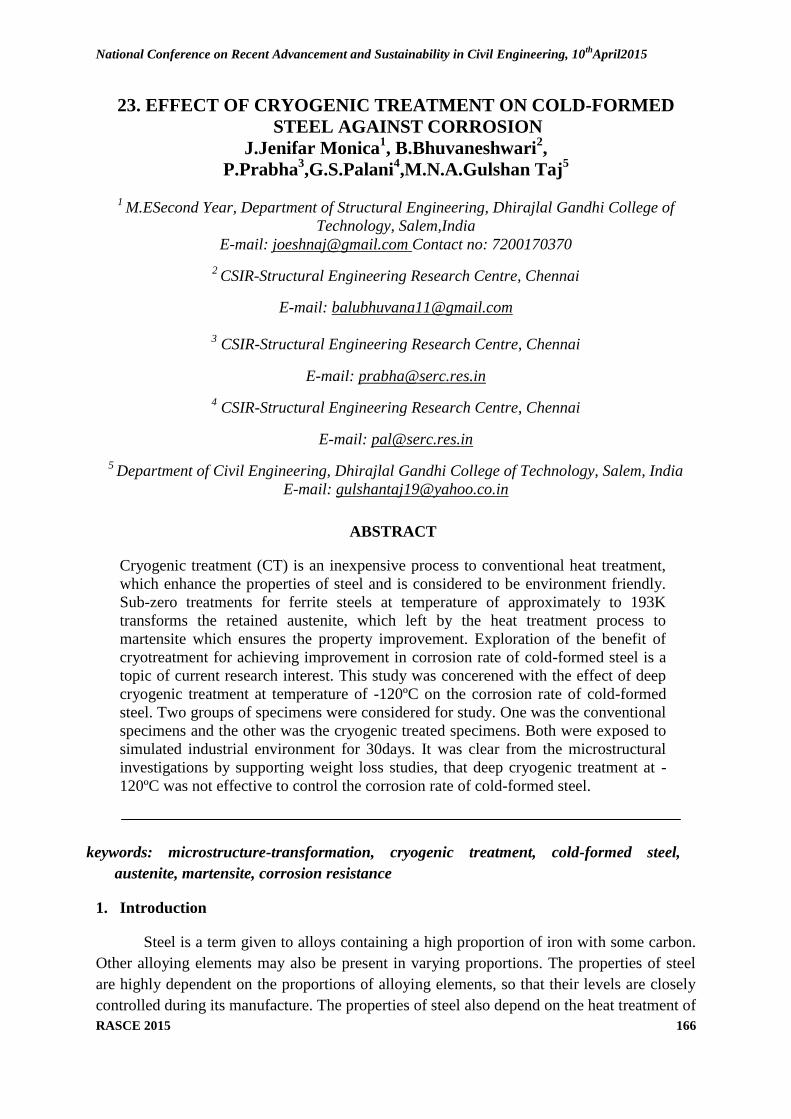
National Conference on Recent Advancement and Sustainability in Civil Engineering, 10th
April2015
RASCE 2015 166
23. EFFECT OF CRYOGENIC TREATMENT ON COLD-FORMED
STEEL AGAINST CORROSION
J.Jenifar Monica1, B.Bhuvaneshwari
2,
P.Prabha3,G.S.Palani
4,M.N.A.Gulshan Taj
5
1
M.ESecond Year, Department of Structural Engineering, Dhirajlal Gandhi College of
Technology, Salem,India
E-mail: [email protected] Contact no: 7200170370
2 CSIR-Structural Engineering Research Centre, Chennai
E-mail: [email protected]
3 CSIR-Structural Engineering Research Centre, Chennai
E-mail: [email protected]
4 CSIR-Structural Engineering Research Centre, Chennai
E-mail: [email protected]
5 Department of Civil Engineering, Dhirajlal Gandhi College of Technology, Salem, India
E-mail: [email protected]
ABSTRACT
Cryogenic treatment (CT) is an inexpensive process to conventional heat treatment,
which enhance the properties of steel and is considered to be environment friendly.
Sub-zero treatments for ferrite steels at temperature of approximately to 193K
transforms the retained austenite, which left by the heat treatment process to
martensite which ensures the property improvement. Exploration of the benefit of
cryotreatment for achieving improvement in corrosion rate of cold-formed steel is a
topic of current research interest. This study was concerened with the effect of deep
cryogenic treatment at temperature of -120ºC on the corrosion rate of cold-formed
steel. Two groups of specimens were considered for study. One was the conventional
specimens and the other was the cryogenic treated specimens. Both were exposed to
simulated industrial environment for 30days. It was clear from the microstructural
investigations by supporting weight loss studies, that deep cryogenic treatment at -
120ºC was not effective to control the corrosion rate of cold-formed steel.
keywords: microstructure-transformation, cryogenic treatment, cold-formed steel,
austenite, martensite, corrosion resistance
1. Introduction
Steel is a term given to alloys containing a high proportion of iron with some carbon.
Other alloying elements may also be present in varying proportions. The properties of steel
are highly dependent on the proportions of alloying elements, so that their levels are closely
controlled during its manufacture. The properties of steel also depend on the heat treatment of

National Conference on Recent Advancement and Sustainability in Civil Engineering, 10th
April2015
RASCE 2015 167
the metal. The major disadvantage of steel is that it will oxidise under corrosive conditions to
form rust.The growing attention that the scientific community has paid in the last decades to
the corrosion phenomena is related to the huge economic, social and environmental losses
that result from the spread of damage on several metal constructions.From the structural point
of view, the loss of thickness of the cross section due to corrosion attack leads to a smaller
resistant area, reduces the structural performance in terms of strength, stiffness and ductility.
In some cases, the local failure of a component or joint could affect the stability of the whole
structure. In order to prevent failures due to corrosion, thermal treatment can be adopted to
improve the properties of steel [1]. The objective of this work is to investigate the effects of
deep cryogenic treatment on the corrosion rate of cold-formed steel.
2. Cold-Formed Steel
Cold-formed steel (CFS) is the common term for products made by rolling or pressing
thin gauges of sheet steel into goods. Cold-formed steel structural elements are created by the
working of sheet steel using stamping, rolling, or presses to deform the sheet into a usable
product. Cold worked steel products are commonly used in all areas of manufacturing of
durable goods like appliances or automobiles but the phrase cold form steel is most
prevalently used to describe construction materials. The use of cold-formed steel construction
materials has become more popular. In the construction industry both structural and non-
structural elements are created from thin gauges of sheet steel. These building materials
encompass columns, beams, joists, studs, floor decking, built-up sections and other
components. Cold-formed steel construction materials differ from other steel construction
materials known as hot-rolled steel. The manufacturing of cold-formed steel products occurs
at room temperature using rolling or pressing.Cold forming has the effect of increasing the
yield strength of steel, the increase being the consequence of cold working well into the
strain-hardening range. These increases are predominant in zones where the metal is bent by
folding. The effect of cold working is thus to enhance the mean yield stress by 15% - 30%.
For purposes of design, the yield stress may be regarded as having been enhanced by a
minimum of 15% [6]. The thickness of steel sheet used in cold formed construction is usually
1 to 3 mm. Since cold-formed steel structural elements are of reduced thickness it is very
much essential that it should have corrosion resistance property. If not by itself protective
measures have to be adopted to make it corrosion resistant.
2.1 Applications of Cold-formed Steel
Cold-formed steel members have been used in buildings, bridges, storage racks, grain
bins, car bodies, railway coaches, highway products, transmission towers, transmission
poles, drainage facilities, various types of equipment and others. These types of sections are
cold-formed from steel sheet, strip, plate, or flat bar in roll forming machines, by press brake
(machine press) or bending operations. A broad classification of the cold-formed shapes used
in the construction industry can be made as individual structural framing members or panels
and decks. Some of the popular applications and the preferred sections are
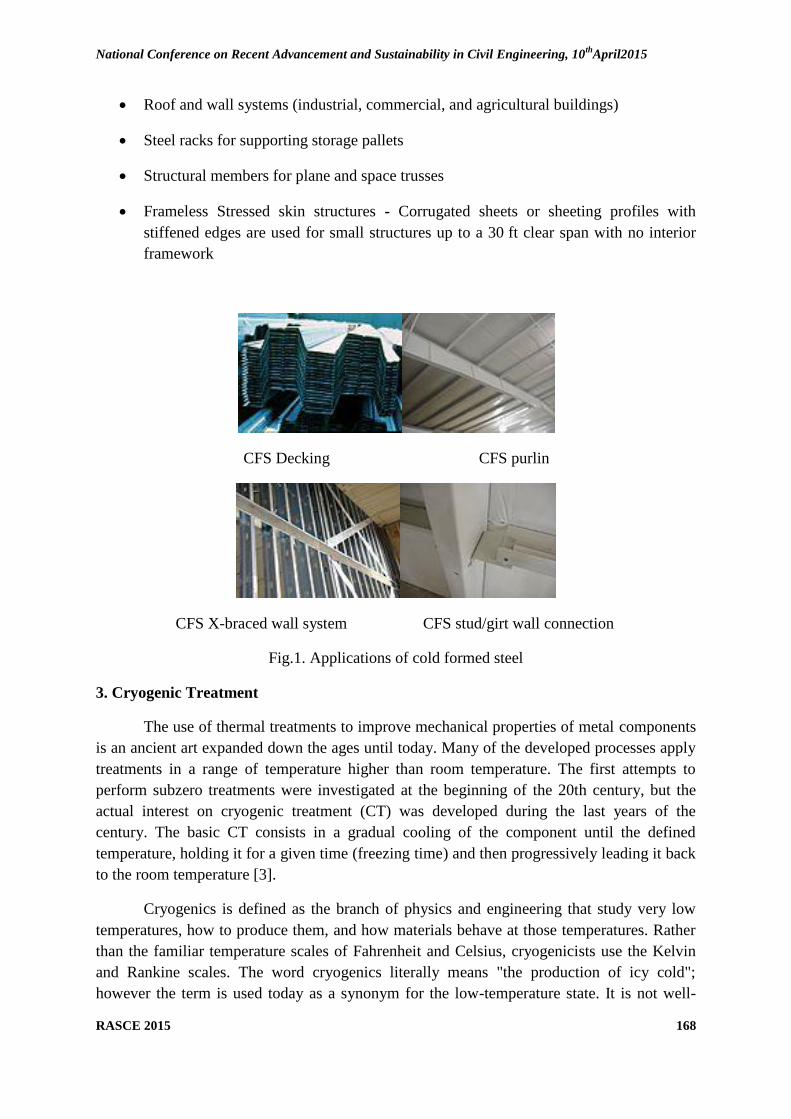
National Conference on Recent Advancement and Sustainability in Civil Engineering, 10th
April2015
RASCE 2015 168
Roof and wall systems (industrial, commercial, and agricultural buildings)
Steel racks for supporting storage pallets
Structural members for plane and space trusses
Frameless Stressed skin structures - Corrugated sheets or sheeting profiles with
stiffened edges are used for small structures up to a 30 ft clear span with no interior
framework
CFS Decking CFS purlin
CFS X-braced wall system CFS stud/girt wall connection
Fig.1. Applications of cold formed steel
3. Cryogenic Treatment
The use of thermal treatments to improve mechanical properties of metal components
is an ancient art expanded down the ages until today. Many of the developed processes apply
treatments in a range of temperature higher than room temperature. The first attempts to
perform subzero treatments were investigated at the beginning of the 20th century, but the
actual interest on cryogenic treatment (CT) was developed during the last years of the
century. The basic CT consists in a gradual cooling of the component until the defined
temperature, holding it for a given time (freezing time) and then progressively leading it back
to the room temperature [3].
Cryogenics is defined as the branch of physics and engineering that study very low
temperatures, how to produce them, and how materials behave at those temperatures. Rather
than the familiar temperature scales of Fahrenheit and Celsius, cryogenicists use the Kelvin
and Rankine scales. The word cryogenics literally means "the production of icy cold";
however the term is used today as a synonym for the low-temperature state. It is not well-
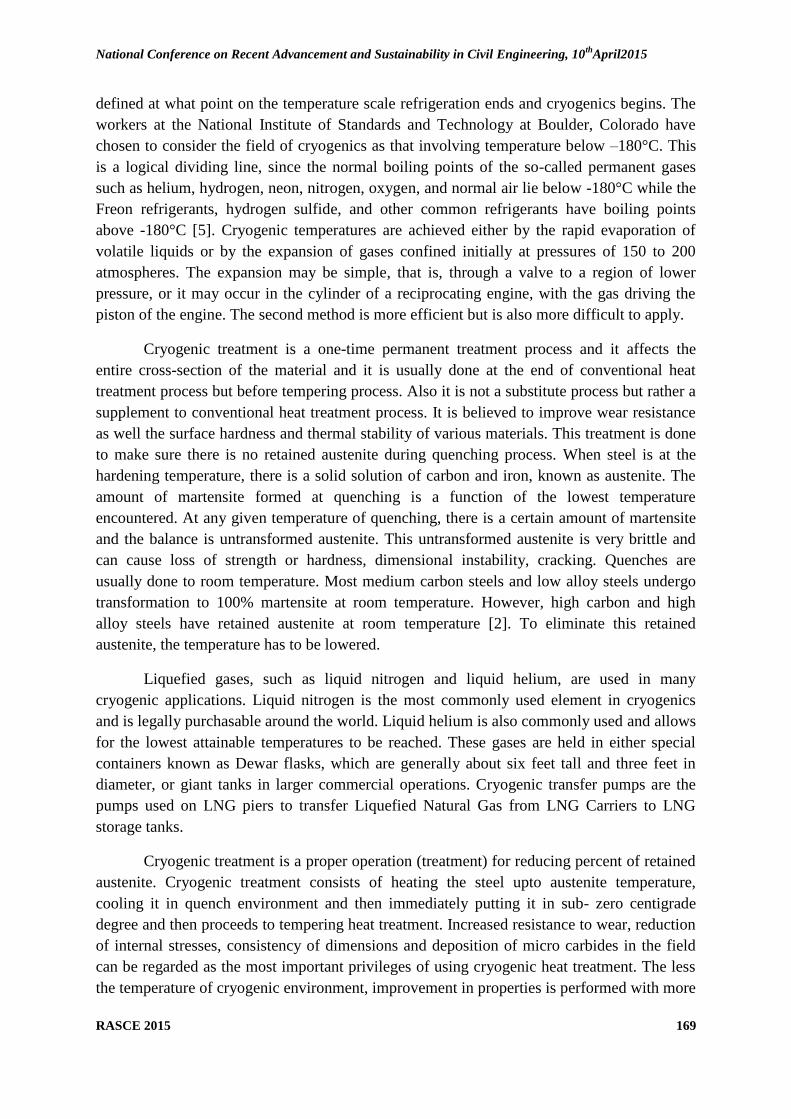
National Conference on Recent Advancement and Sustainability in Civil Engineering, 10th
April2015
RASCE 2015 169
defined at what point on the temperature scale refrigeration ends and cryogenics begins. The
workers at the National Institute of Standards and Technology at Boulder, Colorado have
chosen to consider the field of cryogenics as that involving temperature below –180°C. This
is a logical dividing line, since the normal boiling points of the so-called permanent gases
such as helium, hydrogen, neon, nitrogen, oxygen, and normal air lie below -180°C while the
Freon refrigerants, hydrogen sulfide, and other common refrigerants have boiling points
above -180°C [5]. Cryogenic temperatures are achieved either by the rapid evaporation of
volatile liquids or by the expansion of gases confined initially at pressures of 150 to 200
atmospheres. The expansion may be simple, that is, through a valve to a region of lower
pressure, or it may occur in the cylinder of a reciprocating engine, with the gas driving the
piston of the engine. The second method is more efficient but is also more difficult to apply.
Cryogenic treatment is a one-time permanent treatment process and it affects the
entire cross-section of the material and it is usually done at the end of conventional heat
treatment process but before tempering process. Also it is not a substitute process but rather a
supplement to conventional heat treatment process. It is believed to improve wear resistance
as well the surface hardness and thermal stability of various materials. This treatment is done
to make sure there is no retained austenite during quenching process. When steel is at the
hardening temperature, there is a solid solution of carbon and iron, known as austenite. The
amount of martensite formed at quenching is a function of the lowest temperature
encountered. At any given temperature of quenching, there is a certain amount of martensite
and the balance is untransformed austenite. This untransformed austenite is very brittle and
can cause loss of strength or hardness, dimensional instability, cracking. Quenches are
usually done to room temperature. Most medium carbon steels and low alloy steels undergo
transformation to 100% martensite at room temperature. However, high carbon and high
alloy steels have retained austenite at room temperature [2]. To eliminate this retained
austenite, the temperature has to be lowered.
Liquefied gases, such as liquid nitrogen and liquid helium, are used in many
cryogenic applications. Liquid nitrogen is the most commonly used element in cryogenics
and is legally purchasable around the world. Liquid helium is also commonly used and allows
for the lowest attainable temperatures to be reached. These gases are held in either special
containers known as Dewar flasks, which are generally about six feet tall and three feet in
diameter, or giant tanks in larger commercial operations. Cryogenic transfer pumps are the
pumps used on LNG piers to transfer Liquefied Natural Gas from LNG Carriers to LNG
storage tanks.
Cryogenic treatment is a proper operation (treatment) for reducing percent of retained
austenite. Cryogenic treatment consists of heating the steel upto austenite temperature,
cooling it in quench environment and then immediately putting it in sub- zero centigrade
degree and then proceeds to tempering heat treatment. Increased resistance to wear, reduction
of internal stresses, consistency of dimensions and deposition of micro carbides in the field
can be regarded as the most important privileges of using cryogenic heat treatment. The less
the temperature of cryogenic environment, improvement in properties is performed with more

National Conference on Recent Advancement and Sustainability in Civil Engineering, 10th
April2015
RASCE 2015 170
rapidity [4]. With deep-cryogenic treatment applied immediately after quenching, residual
austenite is reduced, and spots for the nucleation of Ƞ-carbides created during tempering are
created in martensite. Cryogenic treatments can produce not only transformation of retained
austenite to martensite, but also can produce metallurgical changes within the martensite . In
the present paper the effect of deep cryogenic treatment on cold-formed steel against
corrosion is assessed by microscopic analysis.
4. Experimental Investigations
4.1 Deep cryogenic treatment
The liquid nitrogen as generated from the nitogen plant was stored in storage vessels.
With help of transfer lines, it was directed to a closed vacuum evacuated chamber called
cryogenic freezer through a nozzle. The supply of liquid nitrogen into the cryo-freezer was
operated with the help of soleniod valves. Inside the chamber gradual cooling occurs at a rate
of 1ºC /min from the room temperature to a temperature of -120ºC. Once the sub zero
temperature was reached, the cold formed specimens were transferred to the nitrogen
chamber or soaking chamber where in they were stored for 24 hours with continuous supply
of liquid nitrogen. Finally the specimens were heated to the room temperature at a rate of 1ºC
/min.
A. 4.2 Optical Microscope Analysis
In order to carry out the analysis first the cold-formed samples (conventional and
cryogenically treated) of dimension 30x20x0.8mm were polished using emery paper of four
different grits. This was followed by mirror finishing by polishing the samples on velvet cloth
which is mounted on a rotating disc. Microstructure examination was carried out using an
optical microscope. The optical microscope, often referred to as the "light microscope", is a
type of microscope which uses visible light and a system of lenses to magnify images of
small samples. The image from an optical microscope can be captured by normal light-
sensitive cameras to generate a micrograph. Optical micrographs were acquired on a stereo
microscope ZEISS SteREO Discovery V20 (See Fig 2) (manufactured by Zeiss International,
United states) and the image was captured by camera Axiocam ICc3.
Fig.2. SteREO microscope
5. Results And Discussions
The effect of the microstructure on the corrosion behaviour of experimental material was
investigated, where the surface morphologies had been examined after removing the
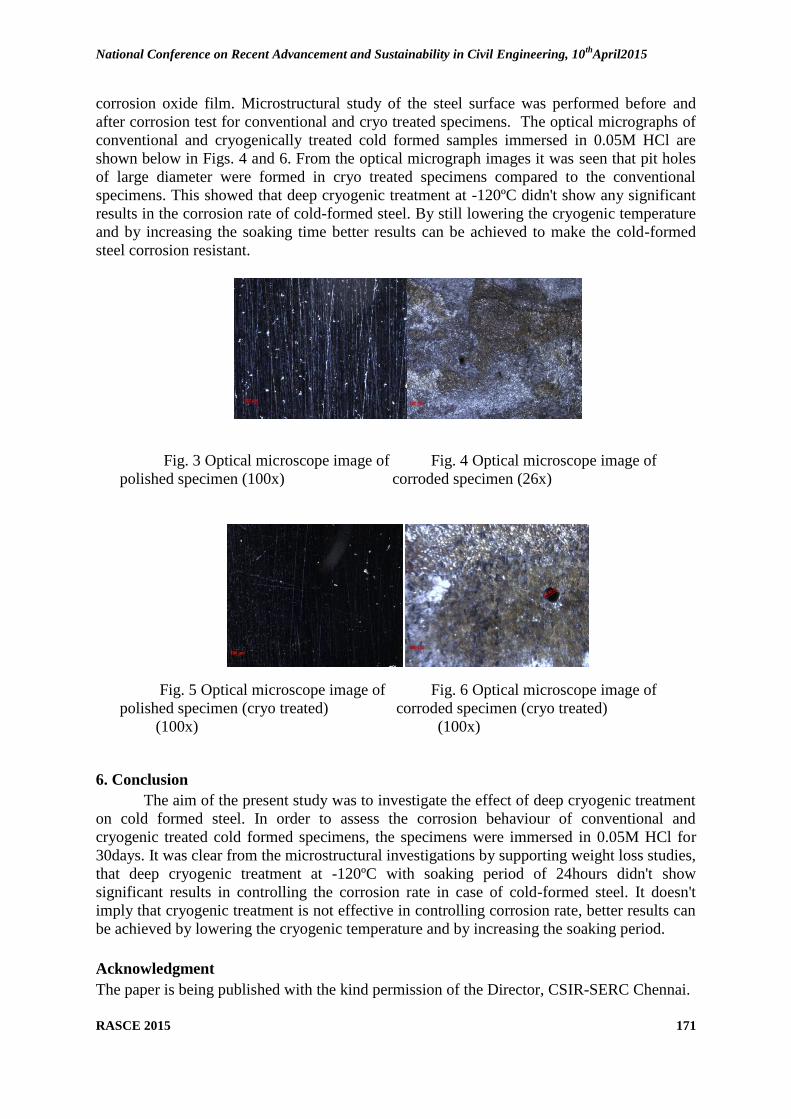
National Conference on Recent Advancement and Sustainability in Civil Engineering, 10th
April2015
RASCE 2015 171
corrosion oxide film. Microstructural study of the steel surface was performed before and
after corrosion test for conventional and cryo treated specimens. The optical micrographs of
conventional and cryogenically treated cold formed samples immersed in 0.05M HCl are
shown below in Figs. 4 and 6. From the optical micrograph images it was seen that pit holes
of large diameter were formed in cryo treated specimens compared to the conventional
specimens. This showed that deep cryogenic treatment at -120ºC didn't show any significant
results in the corrosion rate of cold-formed steel. By still lowering the cryogenic temperature
and by increasing the soaking time better results can be achieved to make the cold-formed
steel corrosion resistant.
Fig. 3 Optical microscope image of Fig. 4 Optical microscope image of
polished specimen (100x) corroded specimen (26x)
Fig. 5 Optical microscope image of Fig. 6 Optical microscope image of
polished specimen (cryo treated) corroded specimen (cryo treated)
(100x) (100x)
6. Conclusion
The aim of the present study was to investigate the effect of deep cryogenic treatment
on cold formed steel. In order to assess the corrosion behaviour of conventional and
cryogenic treated cold formed specimens, the specimens were immersed in 0.05M HCl for
30days. It was clear from the microstructural investigations by supporting weight loss studies,
that deep cryogenic treatment at -120ºC with soaking period of 24hours didn't show
significant results in controlling the corrosion rate in case of cold-formed steel. It doesn't
imply that cryogenic treatment is not effective in controlling corrosion rate, better results can
be achieved by lowering the cryogenic temperature and by increasing the soaking period.
Acknowledgment
The paper is being published with the kind permission of the Director, CSIR-SERC Chennai.

National Conference on Recent Advancement and Sustainability in Civil Engineering, 10th
April2015
RASCE 2015 172
References
[1] Ajit Behera and Mishra S.C., (2012) ―Comparative Study of Cryo -Treated Steel‖,
International Journal of Scientific & Technology Research, Vol. 01, No. 07, pp.46-49,
Aug.
[2] Candane D., Alagumurthi N. and Palaniradja K., (2013) ―Effect of cryogenic
treatment on microstructure and wear characteristics of AISI M35 HSS‖, International
Journal of Materials Science and Applications, Vol. 02, No. 02, pp.56-65, Mar.
[3] Harpreet Singh, Er. Ubhi B. S., Er. Harvinder Lal (2013) ―Improvement in the
corrosion rate and mechanical properties of low carbon steel‖, International Journal
Of Scientific & Technology, Vol. 02, No. 06, June.
[4] Paolo Baldissera, (2010) ―Deep cryogenic treatment of AISI 302 stainless steel: Part
II – Fatigue and corrosion‖, Materials and Design, Vol. 31, pp.4731-4737.
[5] Patil P.I. and Dr.Bimlesh kumar, (2013) ―Deep Cryogenic Treatment of Alloy Steels :
A Review‖, International Journal of Electronics, Communication & Soft Computing
Science and Engineering, Vol. 02, No. 08, pp.29-34, Mar.
[6] Wale A.D., Wakchaure V.D (2013) ―Effect of cryogenic treatment on mechanical
properties of cold work tool steels‖, International Journal of Modern Engineering,
Vol. 03, No. 01, pp.149-154, Jan-Feb.

National Conference on Recent Advancement and Sustainability in Civil Engineering, 10th
April2015
RASCE 2015 173
24. SUSTAINABLE CAMPUS PLAN FOR AN EDUCATIONAL
INSTITUTION - A Case Study of TCE, Madurai
R.Jegan 1, V.Ravi Sankar
2
1 PG Student, Dept. of Civil, TCE, Madurai, India
E-mail: [email protected] 2
Assistant Professor, Dept of Civil, TCE, Madurai, India
E-mail: [email protected]
ABSTRACT
The world is at a critical juncture where social, environmental and economic problems
require transformative solutions. In such a world, higher education plays a vital role in
ensuring that people have an understanding of the interdependencies between environmental,
social, and economic forces and the skills and abilities to meet sustainability challenges.
There is mounting evidence that planet earth is on fire, that global warming is an inexorable
reality, that there is scant need for further studies.The evidence submitted cries for individual
and collective solutions. Sustainable initiatives have been gathering momentum on campuses
for over a decade. With the future of the planet at stake, Colleges must be on the side of
solutions. With that purpose in mind, the Campus Plan formulates a series of planning
principles that reflect the value we place on the landscape, the architectural quality of our
buildings, and the ways in which we seek to ensure an environment that facilitates and
enhances academic work. To transform mere buildings into a green learning laboratory, the
plan requires sustainable efforts. Sustainable Campus Plan is a broad transformational
initiative to increase sustainability campus wide and move TCE toward its vision. The plan
seeks to define the precincts of future campus development and suggest possible uses for
lands currently held or potentially to be acquired by the college. It also includes individual
views about our physical environment. The campus plan provides a guideline for the
maintenance and future growth of a campus that actively contributes to the teaching, learning,
and working experience of all members of the institution including sustainability aspect in all
forms of campus activity.The primary purpose of the "campus master planning" is to
establish a consensus vision for the physical development of the campus environment over
the next 25 to 50 years that is comprehensive, creative, useful and most importantly –
inspiring.Adherence to the principles will protect against short term decisions that could
impair long term opportunities and ensure that the campus is making the most efficient use of
present and future infrastructure in support of physical development.
Keywords - Sustainability, Campus Plan, Infrastructure development, Sustainability index,
ISCN, AASHE, Sustainability Assessment Questionnaire.
Introduction
Campuses function like small towns and cities. They have significant carbon footprints that
can be reduced if administration, staff, faculty and students work together to find ways to
champion sustainability in the built environment, operations and all aspects of campus life.
Colleges can potentially influence the way people think about the world.The quality of the
physical campus environment also plays a major role in prospective students‘ decisions to
attend the college.
The definition of sustainable development provided by the Brundtland Report (1987)
―development that meets the needs of the present without compromising the ability of future

National Conference on Recent Advancement and Sustainability in Civil Engineering, 10th
April2015
RASCE 2015 174
generations to meet their own needs‖ is perhaps the most cited definition among leading
scholars. Campus Master Plans are effective tools for managing the growth and
redevelopment of a campus. However, incorporating sustainability would fetch a world of
good to the campus. With a 20-year time horizon, this plan establishes a framework within
which campus administrators can prepare for future needs of the physical campus setting in
order to meet the goals of the institution, and the needs of its colleges, departments and the
entire student population. The stressful university life threatens students' academic
performance. In this sense, design of campus is far beyond providing a place for study. It
should also be healing—serving functional as well as mental needs.The Campus Plan guides
where and how future academic and research activities, student housing and associated
campus services will be accommodated over the future.The sustainable use of land resources
is a fundamental goal of The Campus Plan, requiring more efficiency in land use patterns,
higher densities, less sprawland careful stewardship of future potential.
A university‘s buildings and landscape reflect the ideals of the institution and influence the
process of learning.A campus plan provides planning principles and guidelines which ensure
that future buildings, infrastructure, and landscape are well conceived and designed. Beyond
individual buildings, an entire campus can be used in an integrated, systematic way as a test
bed for innovations and to create research and teaching opportunities. Ultimately, the plan is
used as a guideline to honor and preserve the university‘s history, while striving to support
and advance its future aspirations.
There is always a ―too expensiveroadblock‖ for sustainable initiatives inside campus.
"Sustainability" implies that the critical activities of a college or university are ecologically
sound, socially just and economically viable, and that they will continue to be so for future
generations.
To transform mere buildings into a green learning laboratory, the plan requires sustainable
efforts.
In such a world, higher education plays a vital role in ensuring that people have an
understanding of the interdependencies between environmental, social, and economic forces
and the skills and abilities to meet sustainability challenges.
Study area
The entire campus of Thiagarajar College of Engineering is taken as the study area.
Thiagarajar College of Engineering is an Autonomous institution established in the year
1957. The institution and its hostels are located near Thiruparankundram on the outskirts of
Madurai, 8 kilometres south-west of the city of Madurai. It is one of several educational and
philanthropic institutions founded by Philanthropist and Industrialist Late. Shri.Karumuttu
Thiagarajan Chettiar, covering about 140 acres of land.
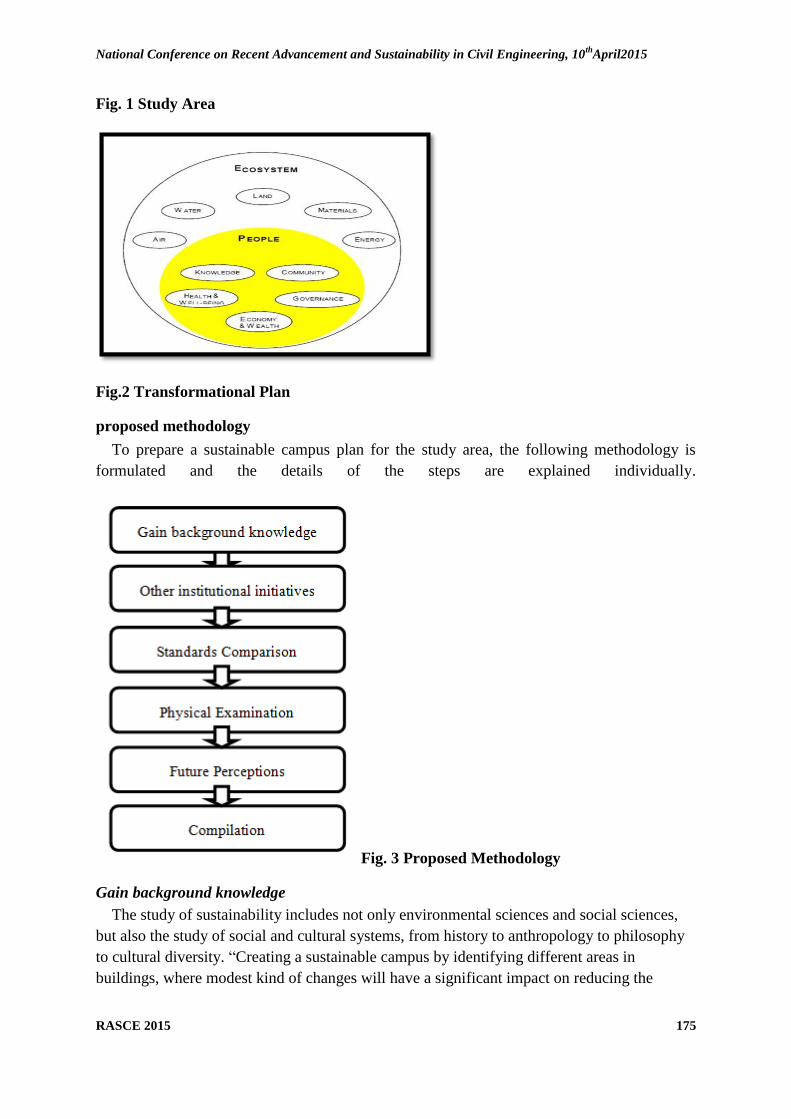
National Conference on Recent Advancement and Sustainability in Civil Engineering, 10th
April2015
RASCE 2015 175
Fig. 1 Study Area
Fig.2 Transformational Plan
proposed methodology
To prepare a sustainable campus plan for the study area, the following methodology is
formulated and the details of the steps are explained individually.
Fig. 3 Proposed Methodology
Gain background knowledge
The study of sustainability includes not only environmental sciences and social sciences,
but also the study of social and cultural systems, from history to anthropology to philosophy
to cultural diversity. ―Creating a sustainable campus by identifying different areas in
buildings, where modest kind of changes will have a significant impact on reducing the

National Conference on Recent Advancement and Sustainability in Civil Engineering, 10th
April2015
RASCE 2015 176
resource demand‖ is the idea adhered about sustainable campus planning. Sustainable
Campus is gaining its importance in Asia after storming the universities at the US.
Other institutional initiatives
Over 60 schools from more than 20 countries on 6 continents are represented in
International Sustainable Campus Network (ISCN) as ISCN member schools. With
overwhelming response for sustainability initiatives in the universities, reports have been
generated by ISCN with the work done by their members
Fig 4. ISCN Member Schools
More than 700 higher education institutions have enrolled in ―Association for the
Advancement of Sustainability in Higher Education‖ (AASHE).
With all the guidance from the different sustainability forums, the transformation of buildings
into a green learning laboratory takes place in a much easier way. Few institutions followed
the default sustainability initiatives such as
Car pooling
Bicycle Movement
Waste Management
Energy Efficiency.
Standards Comparison
Standards assist the campus to develop the infrastructure not only embedding
sustainability, but also fulfilling their basic requirements. With respect to Indian context,
these are some of the recognized standards.
• LEED Certification
• STARS (Sustainability Tracking, Assessment and Rating System)
• GRIHA (Green Rating for Integrated Habitat Assessment)
• T&CP (DCR), (Development Control Rules in Town and Country Planning)
• NBC , (National Building Code) and
• AICTE (All India Council for Technical Education)

National Conference on Recent Advancement and Sustainability in Civil Engineering, 10th
April2015
RASCE 2015 177
Physical Examination
Each and every building block is physically examined and the classified details are noted
down and drafted in spreadsheet for further computations. Details include class room area,
lab area, staff room area, admin area, toilet area, stairs, corridors and amenities if any. The
plan is not only for buildings, it includes every aspect inside the campus premises such as,
Buildings
People
Waste
Waste Water
Energy Efficiency
Renewable Energy
Management methods
Materials used etc.
Future Perceptions
With the expansion in requirement taking place at humongous rate, it is vital to foresee the
requirements for the horizon year and plan accordingly with short and long term goals to
fulfil the needs of the institution. Infrastructure development needs careful planning and
patience. 2030 would be an ideal benchmark year for the institution to frame short term and
long term plans accordingly.
Compilation
Sustainable development indicators (SDI) are measures of sustainability, and attempt to
quantify beyond the generic concept. Some of the methods to measure them are,
Daly Rules approach
Ecological footprint approach
Circles of Sustainability approach
Environmental Sustainability Index etc.
National Conference on Recent Advancement and Sustainability in Civil Engineering, 10th
April2015
RASCE 2015 178
The sustainability levels of about 151 countries are calculated by Sustainable Society
Foundation (SSF) using their calculation methodology. For the institutional plan, a different
methodology is adopted.
Results and Discussions
Discussion about the project is held with the management committee comprising the
Principal, Registrar, Estate Officer and the executive members. On the account of the
brainstorming session the management people is pretty impressed with the fruitful future
outcome and encouraged to carry forward the sustainability initiative throughout the campus.
With all the support from the management, staff, supporting staff and students, the study area
details is covered comprehensively. Area classification along with the staff room offset inside
the laboratory room is carefully plotted. Water usage details are collected from the pump
house and it has been crosschecked with that of other institutional water usage. The waste
water treatment plant along with the amount of recycled water used for gardening is also
noted. Energy details comprising energy usage per block per floor is noted for every
department. Perception about the campus for staff and student point of view is assessed
through sustainability assessment questionnaire. All India Council for Technical Education
(AICTE) standards are checked with the collected area details from the physical examination.
As the institution is approved by AICTE, all the standards do match with the current
infrastructure inside the campus, in fact it is well ahead the normal requirement. Similarly,
the requirement for the current strength inside the institution holds well with respect to
Development Control Rules and NBC. Incorporating sustainability into the campus could be
executed through STARS, an initiative of the ―Association for the Advancement of
Sustainability in Higher Education‖ or ISCN Best practices. The institution preferred ISCN
over STARS and with the previous reports of ISCN member schools, a transformational
initiative gained importance throughout each and every activity in the campus. Template
regarding Sustainable TCE is on the verge of completion and would gain significant response
after completion.
CONCLUSION
Sustainability is gaining importance globally. But the complete outreach would happen
only with the help of institutions educating the future generation from their learning
laboratory, transforming them and showing them how beautiful the ambience would look
like. The transformation would surely happen within the individual and then the so called
impossible would happen, the sustainable globe. Efforts are made to transform Thiagarajar
College of Engineering, Madurai into a sustainable campus and set a benchmark for
sustainability in the southern part of developing India.
REFERENCES
1) M.Z. Abd-Razaka, N.K.F Mustafab, A.I. Che-Ania, N.A.G. Abdullaha, M.F.I Mohd-Nora
―Campus Sustainability: Student‘s Perception on Campus Physical Development Planning in
Malaysia‖ Science Direct Procedia Engineering 20 (230 – 237) 2011

National Conference on Recent Advancement and Sustainability in Civil Engineering, 10th
April2015
RASCE 2015 179
2) Wong Nyuk Hien, Steve Kardinal Jusuf ―GIS-based greenery evaluation on campus master
plan‖ Science Direct Landscape and Urban Planning 84 (166–182) 2008
3) R. G. Congalton, K. Green, ―Assessing the Accuracy of Remotely Sensed Data: Principles
and Practices,‖ Boca Raton, Second Edition FL: CRC Press, 2008.
4) Stephen Siu Yu Laua, Zhonghua Gouc, Yajing Liub ―Healthy campus by open space
design: Approaches and guidelines‖ Science direct Frontiers of Architectural Research 3,
(452–467) 2014.
5) Anne Steinemann.Implementing Sustainable Development through Problem-Based
Learning: Pedagogy and Practice‖ ASCE 1052-3928 29:4 (216) 2003
6) Chris Scheuer, Gregory A. Keoleian, Peter Reppe ―Life cycle energy and environmental
performance of a new university building: modeling challenges and design implications‖
Science direct. Energy and Buildings 35 (104–106) 2003.
7) Shemdoe Riziki Silas ―Reducing Impact of Land Degradation in Tanzania: Do Incentive
Market Based Mechanisms Work for Sustainable Land Management?‖ Journal of Sustainable
Development; Vol. 7, No. 6; 2014
8) Beena Patel , PankajPatel ―Sustainable campus of Claris lifesciences through green
initiatives‖ Renewable and Sustainable Energy Reviews 16 (4901–4907) 2012
9) Faris Ataallah Matlooba, Ahmad Bashri Sulaiman, Turki Hasan Ali, Shuhana
Shamsuddinb, Wan Nurul Mardyy. ―Sustaining Campuses Through Physical Character- The
Role Of Landscape‖ Procedia - Social and Behavioral Sciences 140 (282 – 290)2014
10) Aminatuzuhariah Megat Abdullah, Alice Sabrina Ismail, EkaSediadi. ―Towards
Sustainable Campus Environment: Case Study of Universiti Teknologi Malaysia Campus‖
National Conference on Recent Advancement and Sustainability in Civil Engineering, 10th
April2015
RASCE 2015 180
25. ANALYSIS OF OPTIMAL SELECTION OF ENERGY EFFICIENT
ROOFING MATERIAL – AN EXPERIMENTAL STUDY
Mr. R. Moorthy B.E
Master in Construction Management,
B.S.Abdur Rahman University, Vandalur,
Chennai-48, India
Dr. M. V. Molykutty M.Tech., Ph.D
Professor & Dean (School of Infrastructure)
B.S.Abdur Rahman University, Vandalur,
Chennai-48, India
ABSTRACT
This paper presents the results of an experimental program of an innovative cool roof
system on thermal behavior and energy performance of a prototype located in Men‘s hostel,
B. S. Abdur Rahman University, Chennai. An experimental monitoring has been carried out
during summer 2015 to assess both indoor and outdoor thermal conditions of the building. In
Chennai, temperature is always at a higher level except two to three months and finding out a
cost effective and energy efficient roofing material is the need of the hour not only to tackle
heat but to abate pollution as well. A cool roof is energy efficient roof one that strongly
reflects sunlight and also cools itself by efficiently emitting radiation to its surroundings. This
is also known as passive cooling technique. If an occupant does not have air conditioner, this
roof keeps the building cooler and maintains a constant temperature. The term 'cool roof'
encompasses an extensive array of roof types, colors, textures, paints, coatings, and slope
applications. In this paper it is proposed to study the performance of different energy efficient
roofing materials by conducting experiments on four physical models of 15 Sq.ft roof areas.
Thermal performance is measured by using Infrared Thermometer and Hygrometer.
Keywords – Cool Roof; Energy Efficient; Solar Reflectance; Thermal Performance.
I. INTRODUCTION
Anyone who has lived on the uppermost floor of a building may have experienced
significantly higher temperatures during the summer months compared to other floors in the
building. Many modern buildings in India are constructed of concrete or cinder blocks and
are topped with flat, tar covered roofing. Such surfaces absorb the incident sunlight,
transferring it to the interiors of the building. The hot ceiling continues to heat up the space
during the day and well into the night - making the spaces unbearably hot throughout the
summer season. In Chennai, temperature is always at a higher level except two to three
months and finding out a cost effective and energy efficient roofing material is the need of
the hour not only to tackle heat but to abate pollution as well.
A cool roof is or energy efficient roof one that strongly reflects sunlight and also cools
itself by efficiently emitting radiation to its surroundings. This roof literally stays cooler and
reduces the amount of heat conducted to the building below. If an occupant does not have air
conditioner, this roof keeps the building cooler and maintains a constant temperature. The
term, 'cool roof' refers to the outer layer or exterior surface of the roof which acts as the key
reflective surface. These roofs have higher solar reflectance than a ordinary typical roof
surface. The term 'cool roof' encompasses an extensive array of roof types, colors, textures,
paints, coatings, and slope applications.
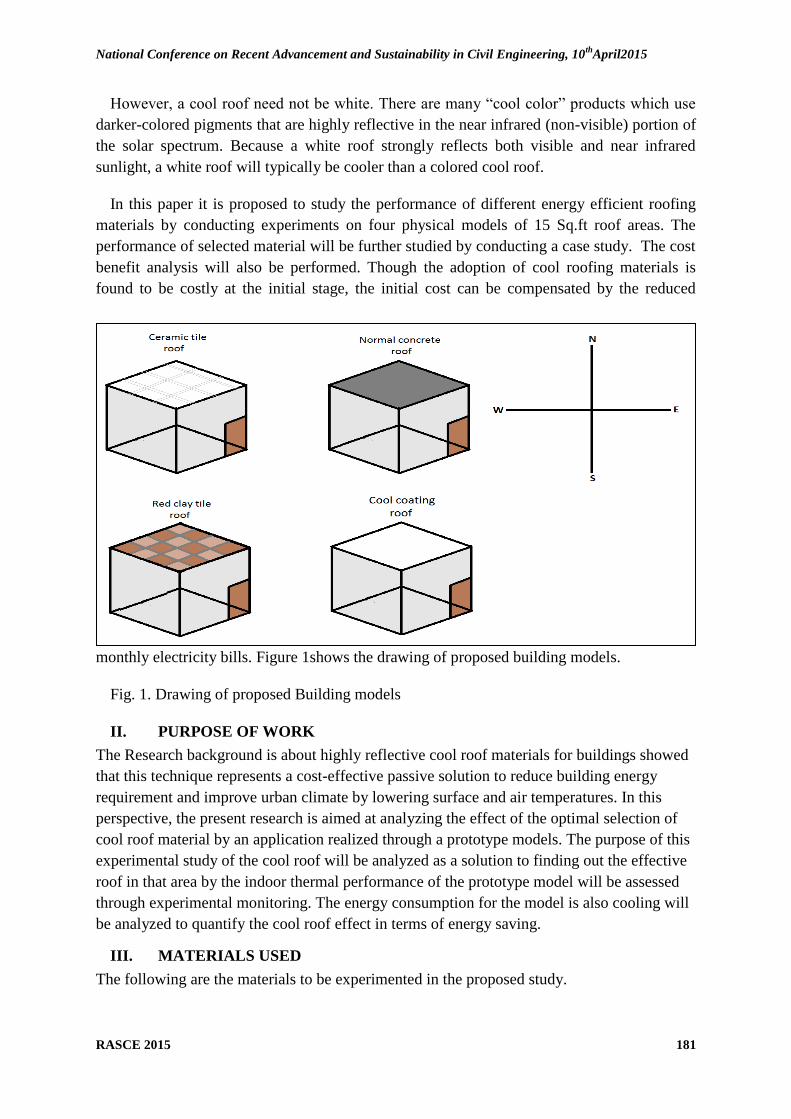
National Conference on Recent Advancement and Sustainability in Civil Engineering, 10th
April2015
RASCE 2015 181
However, a cool roof need not be white. There are many ―cool color‖ products which use
darker-colored pigments that are highly reflective in the near infrared (non-visible) portion of
the solar spectrum. Because a white roof strongly reflects both visible and near infrared
sunlight, a white roof will typically be cooler than a colored cool roof.
In this paper it is proposed to study the performance of different energy efficient roofing
materials by conducting experiments on four physical models of 15 Sq.ft roof areas. The
performance of selected material will be further studied by conducting a case study. The cost
benefit analysis will also be performed. Though the adoption of cool roofing materials is
found to be costly at the initial stage, the initial cost can be compensated by the reduced
monthly electricity bills. Figure 1shows the drawing of proposed building models.
Fig. 1. Drawing of proposed Building models
II. PURPOSE OF WORK
The Research background is about highly reflective cool roof materials for buildings showed
that this technique represents a cost-effective passive solution to reduce building energy
requirement and improve urban climate by lowering surface and air temperatures. In this
perspective, the present research is aimed at analyzing the effect of the optimal selection of
cool roof material by an application realized through a prototype models. The purpose of this
experimental study of the cool roof will be analyzed as a solution to finding out the effective
roof in that area by the indoor thermal performance of the prototype model will be assessed
through experimental monitoring. The energy consumption for the model is also cooling will
be analyzed to quantify the cool roof effect in terms of energy saving.
III. MATERIALS USED
The following are the materials to be experimented in the proposed study.

National Conference on Recent Advancement and Sustainability in Civil Engineering, 10th
April2015
RASCE 2015 182
A. White coat
It contains white or special reflective pigments (Titanium Dioxide) that reflect
sunlight. Coatings are like very thick paints that can protect the roof surface from ultra-violet
(UV) light and chemical damage, and some offer water protection and restorative features as
well. Coatings can extend a roof‘s service life as long as the roof is in good condition.
B. Ceramic tiles
It can be made of clay, slate, or concrete. Clay and slate tiles come from the ground,
so their colors differ depending on the earth‘s composition. Some varieties will naturally be
reflective enough to achieve cool roof standards. Tiles can also be glazed to provide
waterproofing or coated to provide customized colors and surface properties. These surface
treatments can transform tiles with low solar reflectance into cool roof tiles
C. Terracotta tiles (Red clay tiles)
Red clay tile can be made of clay, shale, or similar naturally-occurring earthy
substances and subjected to heat treatment at elevated temperatures, which is a strongly
scattering, weakly absorbing, stable, and also inexpensive.
TABLE I. Properties of roof materials
Properties White coat Ceramic tile Red clay tile
SRI (Solar Reflective Index) 79 - 90% 73 - 85% 40 - 65%
Thermal Emittance 0.73 - 0.85 0.67 - 0.81 0.45 – 0.71
Aged reflectance 0.52 0.43 0.30
Price/Sq.ft 35 50 30
IV. METHODOLOGY
The field study of the model is deals with an experiment carried out during summer 2015,
which methodology for data analysis consists of the following phases:
Internal and External roof surface monitoring. Internal and External roof surface
temperature have been monitored by using Non-Conduct IR Thermometer.
Indoor and outdoor monitoring. Hygrometer is used to find out the indoor and outdoor
ambient room temperature.
The experimental monitoring campaign is carried out for all models during the month of
summer 2015. The results reported in this paper basically represent experimental findings
produced through a 10 days experimental monitoring.

National Conference on Recent Advancement and Sustainability in Civil Engineering, 10th
April2015
RASCE 2015 183
V. DESCRIPTION OF BUILDING MODEL
The prototype building models are located in Vandalur area, Chennai. The monitored
building models are represented by a rectangular 15 Sq.ft. The dimensions of building models
are length, breadth and height are 5, 3 and 3.3ft respectively. The buildings structure consists
of single wall brick, common bond brick building. The Model 1 roof was constructed without
any finishing material, Model 2 roof was adopted with ceramic tile, Model 3 was
implemented with Tio2 coatings and Model 4 roof was implemented with Teracotta (Red
clay tile). The building orientation was located in such a way that maximum solar intensity
falls over the models. Figure 2 shows the location of the prototype model.
Fig. 2. Prototype models
VI. IN FIELD EXPERIMENTAL PROGRAM
The experimental monitoring program consists of the prototype building models is
continuous monitoring the parameters of Internal and External roof surface temperature,
Indoor and outdoor monitoring for all models.
Model 1: This model is made only a concrete roof without any cool roof material
External surface : 43°c
temperature
Internal surface : 39°c
Temperature
Indoor : 35.6°c
Temperature
Fig. 3. Conventional roof, External surface temperature and Indoor temperature
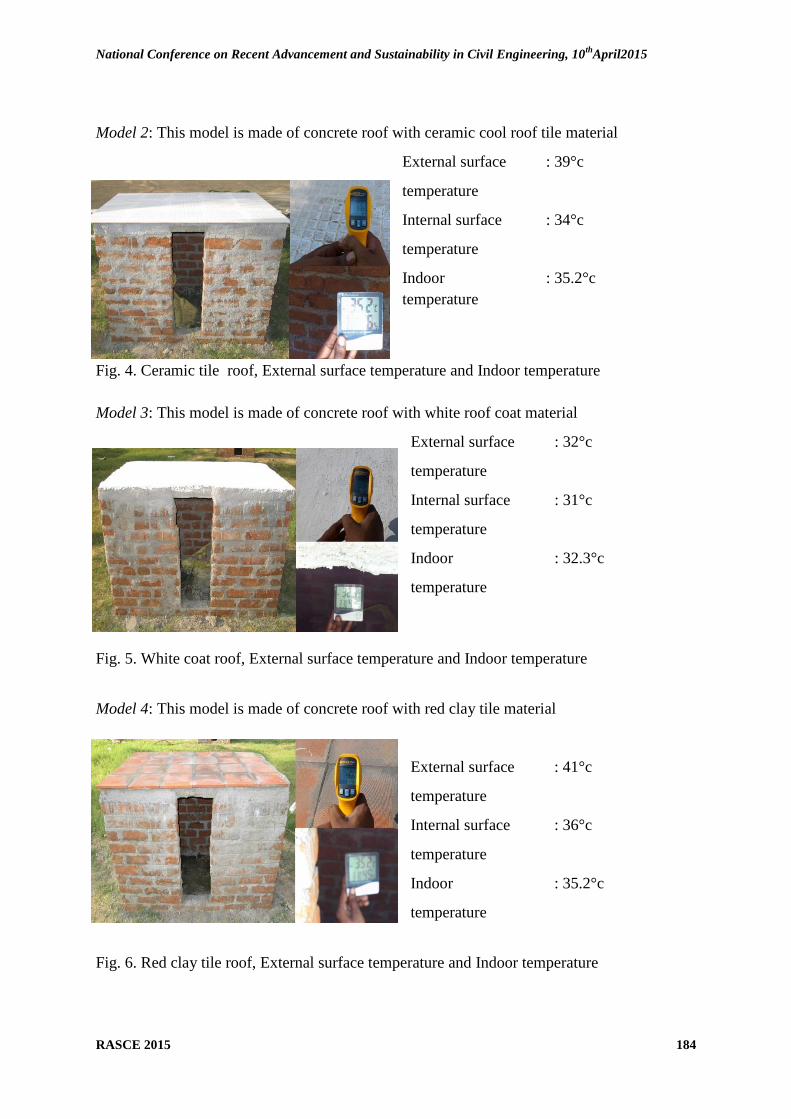
National Conference on Recent Advancement and Sustainability in Civil Engineering, 10th
April2015
RASCE 2015 184
Model 2: This model is made of concrete roof with ceramic cool roof tile material
External surface : 39°c
temperature
Internal surface : 34°c
temperature
Indoor : 35.2°c
temperature
Fig. 4. Ceramic tile roof, External surface temperature and Indoor temperature
Model 3: This model is made of concrete roof with white roof coat material
External surface : 32°c
temperature
Internal surface : 31°c
temperature
Indoor : 32.3°c
temperature
Fig. 5. White coat roof, External surface temperature and Indoor temperature
Model 4: This model is made of concrete roof with red clay tile material
External surface : 41°c
temperature
Internal surface : 36°c
temperature
Indoor : 35.2°c
temperature
Fig. 6. Red clay tile roof, External surface temperature and Indoor temperature
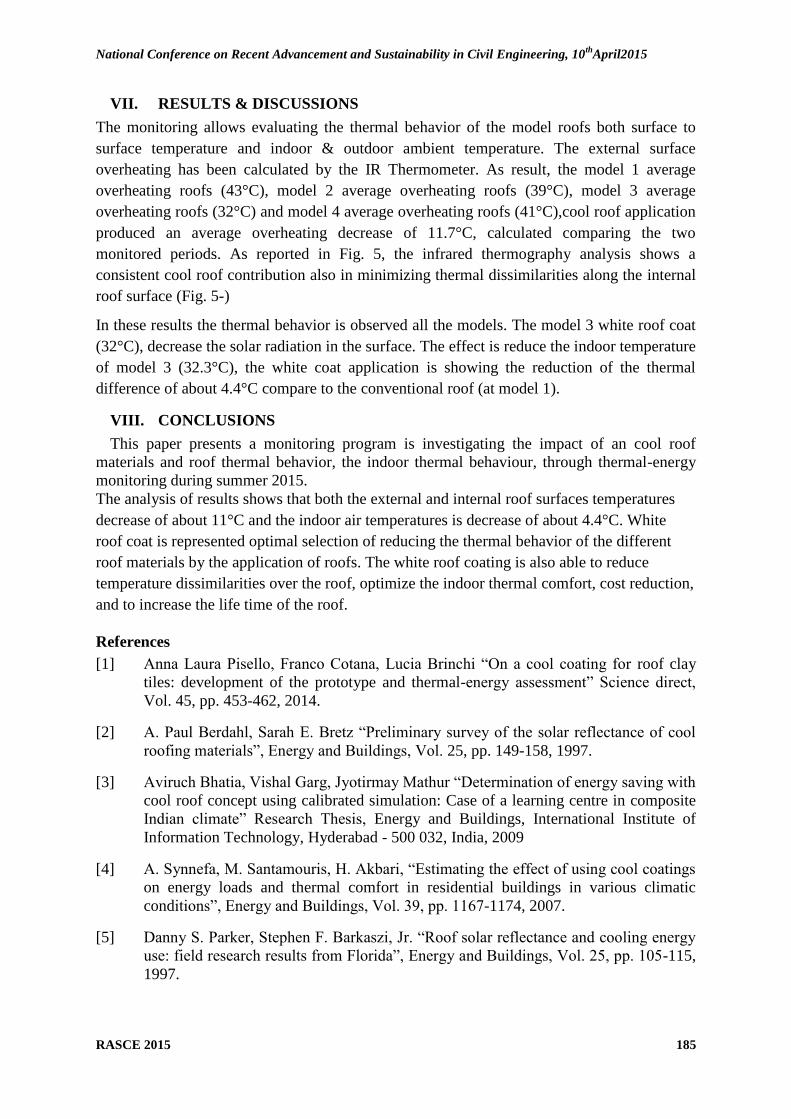
National Conference on Recent Advancement and Sustainability in Civil Engineering, 10th
April2015
RASCE 2015 185
VII. RESULTS & DISCUSSIONS
The monitoring allows evaluating the thermal behavior of the model roofs both surface to
surface temperature and indoor & outdoor ambient temperature. The external surface
overheating has been calculated by the IR Thermometer. As result, the model 1 average
overheating roofs (43°C), model 2 average overheating roofs (39°C), model 3 average
overheating roofs (32°C) and model 4 average overheating roofs (41°C),cool roof application
produced an average overheating decrease of 11.7°C, calculated comparing the two
monitored periods. As reported in Fig. 5, the infrared thermography analysis shows a
consistent cool roof contribution also in minimizing thermal dissimilarities along the internal
roof surface (Fig. 5-)
In these results the thermal behavior is observed all the models. The model 3 white roof coat
(32°C), decrease the solar radiation in the surface. The effect is reduce the indoor temperature
of model 3 (32.3°C), the white coat application is showing the reduction of the thermal
difference of about 4.4°C compare to the conventional roof (at model 1).
VIII. CONCLUSIONS
This paper presents a monitoring program is investigating the impact of an cool roof
materials and roof thermal behavior, the indoor thermal behaviour, through thermal-energy
monitoring during summer 2015.
The analysis of results shows that both the external and internal roof surfaces temperatures
decrease of about 11°C and the indoor air temperatures is decrease of about 4.4°C. White
roof coat is represented optimal selection of reducing the thermal behavior of the different
roof materials by the application of roofs. The white roof coating is also able to reduce
temperature dissimilarities over the roof, optimize the indoor thermal comfort, cost reduction,
and to increase the life time of the roof.
References
[1] Anna Laura Pisello, Franco Cotana, Lucia Brinchi ―On a cool coating for roof clay
tiles: development of the prototype and thermal-energy assessment‖ Science direct,
Vol. 45, pp. 453-462, 2014.
[2] A. Paul Berdahl, Sarah E. Bretz ―Preliminary survey of the solar reflectance of cool
roofing materials‖, Energy and Buildings, Vol. 25, pp. 149-158, 1997.
[3] Aviruch Bhatia, Vishal Garg, Jyotirmay Mathur ―Determination of energy saving with
cool roof concept using calibrated simulation: Case of a learning centre in composite
Indian climate‖ Research Thesis, Energy and Buildings, International Institute of
Information Technology, Hyderabad - 500 032, India, 2009
[4] A. Synnefa, M. Santamouris, H. Akbari, ―Estimating the effect of using cool coatings
on energy loads and thermal comfort in residential buildings in various climatic
conditions‖, Energy and Buildings, Vol. 39, pp. 1167-1174, 2007.
[5] Danny S. Parker, Stephen F. Barkaszi, Jr. ―Roof solar reflectance and cooling energy
use: field research results from Florida‖, Energy and Buildings, Vol. 25, pp. 105-115,
1997.
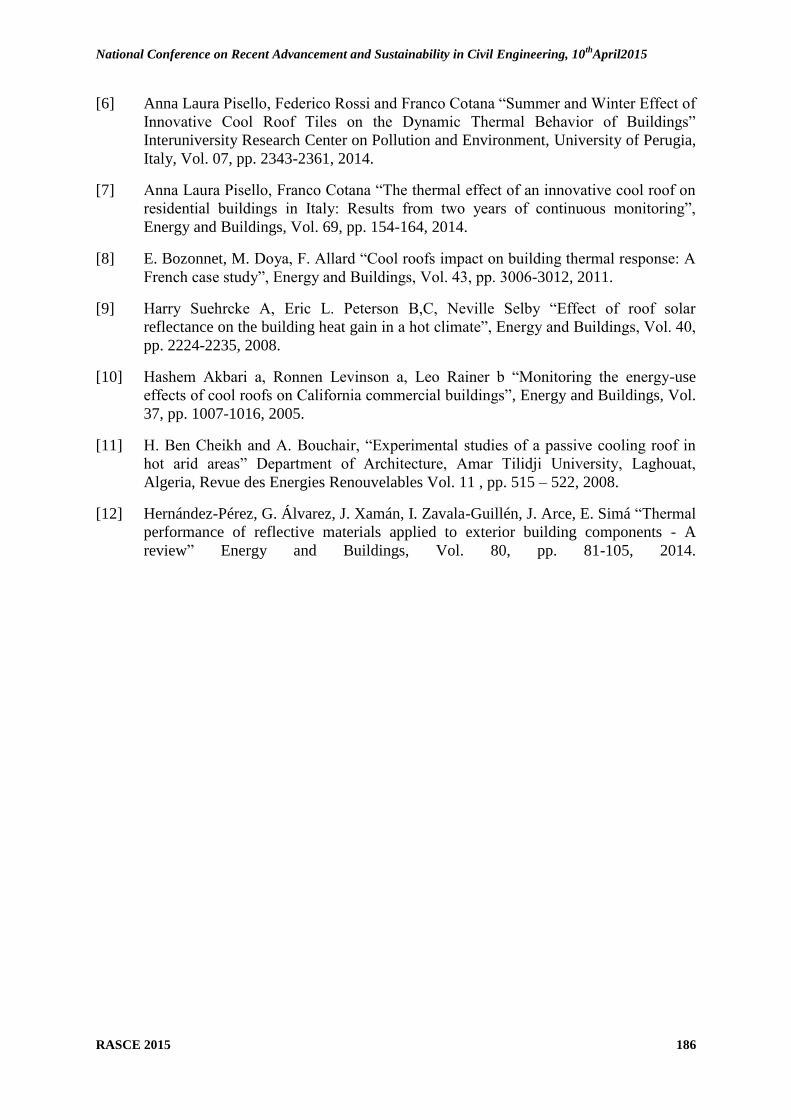
National Conference on Recent Advancement and Sustainability in Civil Engineering, 10th
April2015
RASCE 2015 186
[6] Anna Laura Pisello, Federico Rossi and Franco Cotana ―Summer and Winter Effect of
Innovative Cool Roof Tiles on the Dynamic Thermal Behavior of Buildings‖
Interuniversity Research Center on Pollution and Environment, University of Perugia,
Italy, Vol. 07, pp. 2343-2361, 2014.
[7] Anna Laura Pisello, Franco Cotana ―The thermal effect of an innovative cool roof on
residential buildings in Italy: Results from two years of continuous monitoring‖,
Energy and Buildings, Vol. 69, pp. 154-164, 2014.
[8] E. Bozonnet, M. Doya, F. Allard ―Cool roofs impact on building thermal response: A
French case study‖, Energy and Buildings, Vol. 43, pp. 3006-3012, 2011.
[9] Harry Suehrcke A, Eric L. Peterson B,C, Neville Selby ―Effect of roof solar
reflectance on the building heat gain in a hot climate‖, Energy and Buildings, Vol. 40,
pp. 2224-2235, 2008.
[10] Hashem Akbari a, Ronnen Levinson a, Leo Rainer b ―Monitoring the energy-use
effects of cool roofs on California commercial buildings‖, Energy and Buildings, Vol.
37, pp. 1007-1016, 2005.
[11] H. Ben Cheikh and A. Bouchair, ―Experimental studies of a passive cooling roof in
hot arid areas‖ Department of Architecture, Amar Tilidji University, Laghouat,
Algeria, Revue des Energies Renouvelables Vol. 11 , pp. 515 – 522, 2008.
[12] Hernández-Pérez, G. Álvarez, J. Xamán, I. Zavala-Guillén, J. Arce, E. Simá ―Thermal
performance of reflective materials applied to exterior building components - A
review‖ Energy and Buildings, Vol. 80, pp. 81-105, 2014.
National Conference on Recent Advancement and Sustainability in Civil Engineering, 10th
April2015
RASCE 2015 187
26. STUDY ON THE BEHAVIOUR OF STYRENE ACRYLIC
POLYMER CONCRETE
DR.P.ASHA*, E.SARANYASRI** * Professor,**PG student, Dept of Civil Engg, St.Peter‘s University,Chennai.
email:[email protected]
ABSTRACT
This paper describes how the properties of plain cement concrete can be improved by
making use of epoxy styrene acrylic polymer . Most of the water based polymer systems re-
emulsify in alkaline conditions. To overcome this problem an epoxy emulsion based polymer
system is developed. The process allows building up of composite polymer cement
microstructures on a nanoscale, which can avoid the negative influences of the polymer –
admixture-cement interactions on shape and distribution of the cement hydrate crystal and on
the transition zones between cementious binder matrix and aggregates. This modified cement
concrete contains two types of binder: the system based on hydraulic cement and polymer
system. Styrene acrylic polymer is added in different percentages to plain cement concrete
and its optimum dosage with respect to flow and strength characteristics are found.
Keywords: styrene acrylic polymer,plain cement concrete
Introduction
In modern concrete construction and repair works the role of polymers is increasing
day by day. Polymers are either incorporated in a cement aggregate mix or used as a single
binder. The composites made by using polymer along with cement and aggregates are called
polymer modified concrete. Polymer modified concrete composites are environment
conscious and confirm to concerns of saving natural resources, the longevity of
infrastructures and environmental protection.
The incorporation of polymers greatly improves strength, adhesion, resilience,
impermeability, chemical resistance and durability properties of concrete. These properties
make PMC a suitable material for making various structural and non-structural pre-cast
products, repair of structural members, waterproofing, anticorrosive and decorative finishes,
overlaying of pavements, bridges and industrial floors.
A number of thermoplastic or thermosetting polymers are used in modifying mortars and
concrete. These are used in various forms like: liquid resins, latexes, re-dispersible powders
and water-soluble homo-polymers or copolymers. The choice of the polymer depends upon
the intended use, and requirement of performances like strength, durability and chemical
resistance. Moreover, the polymer systems can also be modified by use of additives like
surfactants, stabilizers, Anti-foaming agents and coloring pigments.
For making PMM, most of the researchers use latexes of a single or combinations of
polymers like polyvinyl acetate, copolymers of vinyl acetate–ethylene, styrene–butadiene,
styrene–acrylic, and acrylic. Latex can also be made by using epoxy resin, which comes
under the non re-emulsifiable category. The non re-emulsifiable latexes are expected to have
greater resistant to chemical, alkaline and humid environment. However, very little
information is available on the use of epoxy emulsion in making PMM.

National Conference on Recent Advancement and Sustainability in Civil Engineering, 10th
April2015
RASCE 2015 188
Literature review
Muthukumar and Mohan (2005), studied the mechanical properties and chemical resistance
of Furan-based polymer concretes and concluded that they were cost effective materials for
construction in civil engineering applications.
Agarwal et al., (2007), studied the properties of polymer-modified mortar using epoxy and
acrylic emulsion, and found that these materials had superior strength properties and better
resistance to penetration of chloride ions and carbon-di-oxide than PMC based on vinyl
acetate-ethylene, styrene-butadiene, styrene acrylic, and acrylic- styrene-butadiene rubber
emulsions.
Pranab Ghosh et al., (2011), studied that styrene incorporation enhances the thermal
stability of this acrylate copolymer used as performance additive in construction materials. It
tends to increase the workability and inhibit water absorption in epoxy form. They have
excellent bond strength, are not re-wettable, and have good water resistance characteristics.
Salima Boutt et al., (2007),demonstrated the role of the different structural parameter of the
latex on some properties of latex modified mortars. The first part of this study showed that,
independently of the particle surface charge density, sterically stabilized latexes remain stable
for several hours in cement interstitial medium. This makes latex modified mortars workable.
Straus, S., et al., (2009),studied that styrene acrylic when used as an admixture by 5% wt
enhances the water resistivity and in uniform dispersion of the mix. Finally, the
microstructure analysis confirms that the particles are homogenously dispersed in the mineral
matrix and that they remain smooth and spherical in the experimental conditions studied.
Muhammad Aamer et al., (2010), showed that concrete-polymer composites with high
performance, multi-functionality and sustainability are expected to become the promising
construction materials in Japan in the 21st century. Recently, environment-conscious
concrete-polymer composites are arduously developed for sustainable development in the
construction industry. Many national andinstitutional standards for them have been published
in Japan.
Islam, M. A., et al., (2011), described although polymer concrete might initially seem abit
more expensive when compared to conventionalmaterials because of the monetary cost per
unit weight,it will appear extremely feasible when judged on itslow maintenance
requirements, its durability and otherparameters. Polymer - modified concrete materials are a
very promising group of new building materials. They possess remarkable potential due to a
wide variety of interesting features, properties and applications. Such materials can respond
to the many needs of current and future construction works. Structures in hostile
environments, inaccessible for repair, or subject to impact, cyclic, or dynamic loading could
benefit from PMC. Aging infrastructure can be repaired using PMC.
Sivakumar, M. V. N., (2010), described the results of an experimental study performed to
gain insight into the performance of polymer modified concrete and its mechanism. In
addition to this the optimum dosage of polymer that influences the mechanical and structural
properties are reported. At last the styrene acrylic polymer has shown its superiority over
latex polymer because of its fine particle size and relatively less viscous. The important
feature of this material is that a large proportion of the void volume is filled with polymer,
which forms a continuous reinforcing network. The concrete structure may be impregnated to
varying depths or in the surface layer only, depending on whether increased strength and/or
durability is sought. This results in a remarkable improvement in tensile, compressive and
flexural strength of polymer modified Portland cement concrete.
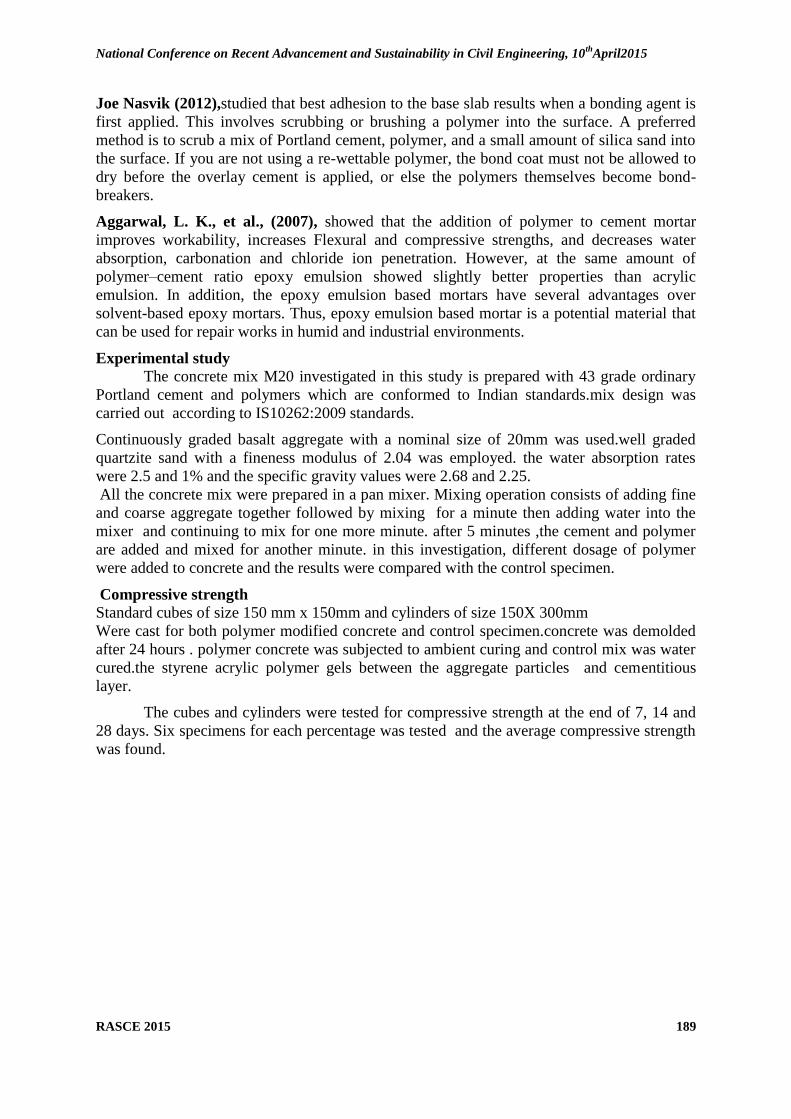
National Conference on Recent Advancement and Sustainability in Civil Engineering, 10th
April2015
RASCE 2015 189
Joe Nasvik (2012),studied that best adhesion to the base slab results when a bonding agent is
first applied. This involves scrubbing or brushing a polymer into the surface. A preferred
method is to scrub a mix of Portland cement, polymer, and a small amount of silica sand into
the surface. If you are not using a re-wettable polymer, the bond coat must not be allowed to
dry before the overlay cement is applied, or else the polymers themselves become bond-
breakers.
Aggarwal, L. K., et al., (2007), showed that the addition of polymer to cement mortar
improves workability, increases Flexural and compressive strengths, and decreases water
absorption, carbonation and chloride ion penetration. However, at the same amount of
polymer–cement ratio epoxy emulsion showed slightly better properties than acrylic
emulsion. In addition, the epoxy emulsion based mortars have several advantages over
solvent-based epoxy mortars. Thus, epoxy emulsion based mortar is a potential material that
can be used for repair works in humid and industrial environments.
Experimental study
The concrete mix M20 investigated in this study is prepared with 43 grade ordinary
Portland cement and polymers which are conformed to Indian standards.mix design was
carried out according to IS10262:2009 standards.
Continuously graded basalt aggregate with a nominal size of 20mm was used.well graded
quartzite sand with a fineness modulus of 2.04 was employed. the water absorption rates
were 2.5 and 1% and the specific gravity values were 2.68 and 2.25.
All the concrete mix were prepared in a pan mixer. Mixing operation consists of adding fine
and coarse aggregate together followed by mixing for a minute then adding water into the
mixer and continuing to mix for one more minute. after 5 minutes ,the cement and polymer
are added and mixed for another minute. in this investigation, different dosage of polymer
were added to concrete and the results were compared with the control specimen.
Compressive strength
Standard cubes of size 150 mm x 150mm and cylinders of size 150X 300mm
Were cast for both polymer modified concrete and control specimen.concrete was demolded
after 24 hours . polymer concrete was subjected to ambient curing and control mix was water
cured.the styrene acrylic polymer gels between the aggregate particles and cementitious
layer.
The cubes and cylinders were tested for compressive strength at the end of 7, 14 and
28 days. Six specimens for each percentage was tested and the average compressive strength
was found.

National Conference on Recent Advancement and Sustainability in Civil Engineering, 10th
April2015
RASCE 2015 190
Compressive strength
Compression test on cylinders was conducted at the end of 28 days with the aid of
compressometer apparatus to plot the
Flexural strength
Flexural strength test was conducted for 14 and 28 days on beams of size 500 x 150x
150mm.four specimens of each percentage was casted. only the control mix was water cured
the polymer concrete was subjected to ambient curing. The graph shows the flexural strength
results at the end of 14 days.
control mix 5% SAP 10% SAP 15% SAP
Co
mp
ress
ive
str
en
gth
in N
/mm
2
% of polymer
Graph showing compressive strength of cubes at the end of 7 days

National Conference on Recent Advancement and Sustainability in Civil Engineering, 10th
April2015
RASCE 2015 191
Results and discussion
Compression test results.
Compression test of cubes at 7th
day.
From the above results it is clear that there is an increase of comp. strength of 35% with
respect to the control mix on addition of 10% of SA polymer concrete. Increased comp.
strength of 44% has been achieved on adding 15% of SA polymer at the age of 7 days.
Compression test of cubes at 14th
day.
There was 15% increase in compressive strength on addition of 5% of SA polymer. 29% of
compressive strength has been increased on addition of 10% of SA polymer. Almost 54%
increase in strength has been obtained on 15% addition of SA polymer at the end of 14 days.
Compression test of cubes at 28th
day.
Increase of 30% of compressive strength has been achieved for 5 and 10% of styrene acrylic
polymer concrete. 50.4% of strength has been increased with 10% addition of styrene acrylic
polymer.
0
10
20
30
40
50
control mix 5% SAP 10%SAP 15%SAP
Co
mp
ress
ive
stre
ngt
h
% of polymer addition
Graph showing compressive strength of cubes at the end of 14 days
Normal Concrete
SAP Added Concrete
0
20
40
60
control mix 5%SAP 10%SAP 15%SAP
Co
mp
ress
ive
stre
ngt
h i
n N
/mm
2
% of polymer addition
Graph showing compressive strength of cubes at the end of 28 days
Normal Concrete SAP Added Concrete
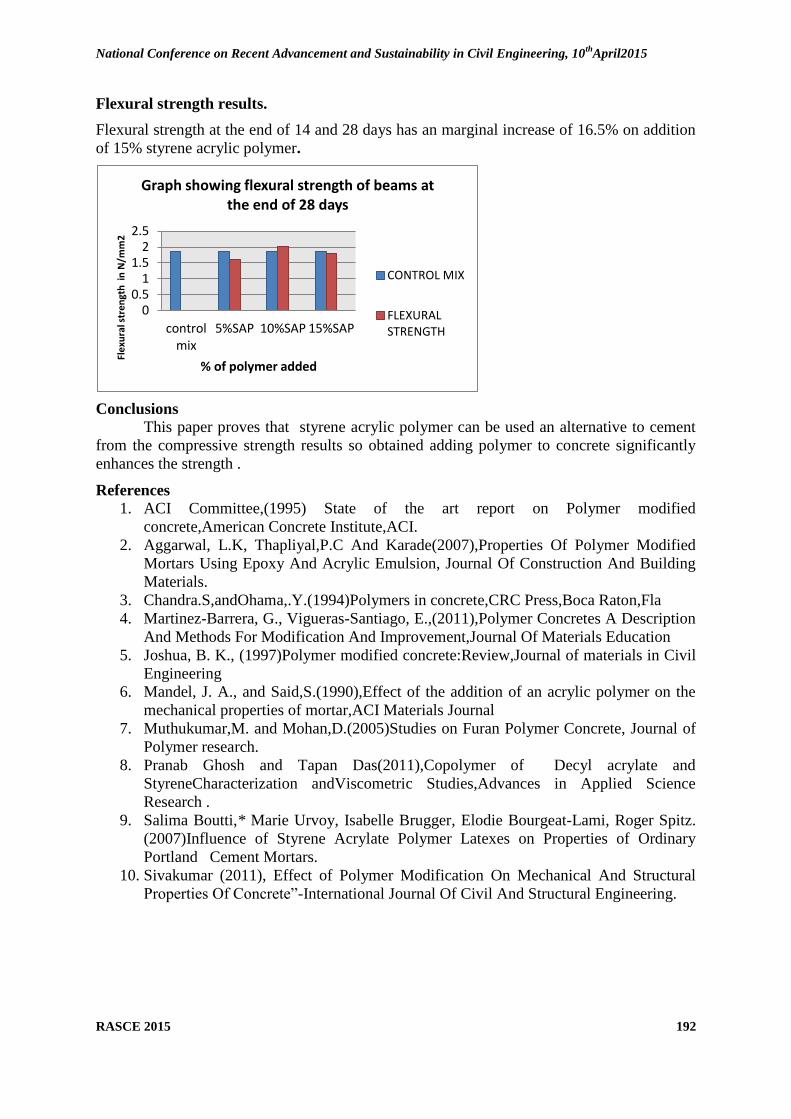
National Conference on Recent Advancement and Sustainability in Civil Engineering, 10th
April2015
RASCE 2015 192
Flexural strength results.
Flexural strength at the end of 14 and 28 days has an marginal increase of 16.5% on addition
of 15% styrene acrylic polymer.
Conclusions
This paper proves that styrene acrylic polymer can be used an alternative to cement
from the compressive strength results so obtained adding polymer to concrete significantly
enhances the strength .
References
1. ACI Committee,(1995) State of the art report on Polymer modified
concrete,American Concrete Institute,ACI.
2. Aggarwal, L.K, Thapliyal,P.C And Karade(2007),Properties Of Polymer Modified
Mortars Using Epoxy And Acrylic Emulsion, Journal Of Construction And Building
Materials.
3. Chandra.S,andOhama,.Y.(1994)Polymers in concrete,CRC Press,Boca Raton,Fla
4. Martinez-Barrera, G., Vigueras-Santiago, E.,(2011),Polymer Concretes A Description
And Methods For Modification And Improvement,Journal Of Materials Education
5. Joshua, B. K., (1997)Polymer modified concrete:Review,Journal of materials in Civil
Engineering
6. Mandel, J. A., and Said,S.(1990),Effect of the addition of an acrylic polymer on the
mechanical properties of mortar,ACI Materials Journal
7. Muthukumar,M. and Mohan,D.(2005)Studies on Furan Polymer Concrete, Journal of
Polymer research.
8. Pranab Ghosh and Tapan Das(2011),Copolymer of Decyl acrylate and
StyreneCharacterization andViscometric Studies,Advances in Applied Science
Research .
9. Salima Boutti,* Marie Urvoy, Isabelle Brugger, Elodie Bourgeat-Lami, Roger Spitz.
(2007)Influence of Styrene Acrylate Polymer Latexes on Properties of Ordinary
Portland Cement Mortars.
10. Sivakumar (2011), Effect of Polymer Modification On Mechanical And Structural
Properties Of Concrete‖-International Journal Of Civil And Structural Engineering.
00.5
11.5
22.5
controlmix
5%SAP 10%SAP 15%SAP
Fle
xura
l str
en
gth
in
N/m
m2
% of polymer added
Graph showing flexural strength of beams at the end of 28 days
CONTROL MIX
FLEXURALSTRENGTH

National Conference on Recent Advancement and Sustainability in Civil Engineering, 10th
April2015
RASCE 2015 193
Selvam .A, Krithika Priyadarshini B.S.Abdur Rahman University, Vandalur, Chennai, India
[email protected], [email protected]
ABSTRACT
This study explores the various safety and control measures (SCM) of accidents in building
projects to minimize accidents‘ occurrence and consequent waste generation. A research
methodology, consisting of a literature review and a field study were used to achieve the
research objectives. The field survey involves a designed questionnaire that was administered
through convenience sampling technique within Lagos State and descriptive analysis tools
were used for the analysis. The field survey reveals different control measures in place and
their rate of usage on building projects. On the other hand, the literature survey sheds light on
the types of accidents on building projects and their respective control measures with
methodologies for accidents‘ preventions. Recommendations based on the findings of the two
surveys are outlined in the paper.
INTRODUCTION
Accidents as an unplanned and unexpected occurrence, which upsets a planned sequence
of work; are resulting to loss of production, injury to personnel, damage to plant and
equipment and eventually interrupting production flow. Control measures as an act of
limiting or making something to happen in a particular way, stop something from spreading,
going out of hand or getting worse. Identify safety in construction as the process or way of
protecting the health and life of those who build, operate, maintain and demolish engineering
works; and others affected by those works.
Construction industry a deadly working place. Accidents on building sites are inevitable,
but could be controlled to prevent minor or serious-consequences on the workers. Thus,
control measures of accidents to ensure safety of workers and minimize accident-related
waste on sites are essential. Hence, the ultimate aim of this research is to minimize accidents‘
occurrence on sites. The specific objectives are to identify types of accidents on sites and
their control measures, to identify accidents prevention methodologies, to examine the
frequency of usage of control measures on sites and to compare the perceptions of
construction organizations on the rate of usage of the control measures on sites.
Procedure for Safety measures
SAFETY PLANS
Management of any construction firm has the responsibility of developing a comprehensive
and written safety program that is performance oriented. The information should include the
basics of personal protective equipment‘s, the proper use of tools and power equipments, safe
work practice, company policy on safety, safety responsibilities, emergency procedure, e.t.c.
This document must be made available to every worker on site and adherent to it must not be
compromised. The responsibility of the safety personnel shall be to draw up a safety plan,
settingout the rules applicable to the construction or building site, and shall make any
adjustment to the plan, ensure effective distribution and use of safety equipment
27. SAFETY MANAGEMENT AND HAZARDS CONTROL
MEASURES IN CONSTRUCTION

National Conference on Recent Advancement and Sustainability in Civil Engineering, 10th
April2015
RASCE 2015 194
SAFETY TRAINING AND MEETINGS
Safety training is an essential part of any safety and health program. Safety personnel
and site workers should be trained in hazard identification, control and method of
encouraging safe practices. The safety training and meetings must emphasis the project‘s
safety requirements, review past activities, plan ahead for new operations; discuss the causes
of accidents on site and ways of preventing future occurrence. This training should be
provided in the language well understood by the workers
FIRSTAID AND MEDICAL ARRANGEMENTS
First aid facilities must be provided on site regardless of the size of the project and the
number of workers on site. In case of any injury such as cuts, strips or trips; prompt treatment
with first aid facility can help prevent further aggravation of such injury. The employer
should be responsible for the provision of first aid facility and personnel at all time on site
MANAGEMENT POLICY
The type of management policy or commitment to safety at workplace is very
essential to the prevention of accidents. The various commitment of construction
management are in drawing up of an effective safety plans, provision of protective
equipments for all site workers and personnel, encourage safe working habits, incentives for
safety and regular review of accident prevention or safety program.
All of these accident preventive measures and many more are required on site to effectively
prevent or reduce the occurrence of accident on building sites.
Health and Safety Executive (H.S.E.) and Occupational Safety and Health Administration
outline preventive measures as:
Wearing clothes that are appropriate to the work and weather condition on site.
Wearing of hand gloves.
Wearing of work traction boots at all times on site.
Wearing of hardhats or helmet at anywhere on site.
Provision of eyewear or goggle for welding purposes e.t.c.
Constant inspection and assessment of equipments, plants, tools and other site
materials before use.
Organizing effective safety training for all site workers and personnel whether on site
or off site.
Provision of effective first aid facility and personnel on site.
Provision of barriers, signs or reflector around dangerous areas on site (e.g. barrier around
trench and so on)
Accidents
TYPES OF ACCIDENTS AND CONTROL MEASURES ON BUILDING
PROJECTS.Various types of accidents and their respective control measures from literatures
are:

National Conference on Recent Advancement and Sustainability in Civil Engineering, 10th
April2015
RASCE 2015 195
SCAFFOLD ACCIDENTS
Fall of person from scaffold and collapse of scaffolds has constantly been the number one
killer in Hong-Kong construction industry (U.S Department of Labour, 2005). Between 2000
and 2004, the department shows that fatal accident arising from bamboo scaffold and
working on platform have accounted for nearly half of the total number of fall-from-height
fatal accidents in the period. Similarly, O.S.H.A (2005) reports that hazards occur due to
improper erection of scaffold. They add that 4,500 injuries and 50 fatalities from 2.3 million
construction workers annually can be prevented with proper erection and use of scaffolds.
CONTROL MEASURES
Scaffold must be checked to be sound, rigid and sufficient enough to carry its own
weight plus four times the maximum intended load without settling or swaying.
Scaffold must not be erected, moved, dismantled or altered except under the
supervision of a competent person.
Unstable objects such, as boxes, loose bricks or concrete blocks must not be used to
support scaffold or planks on scaffold.
Scaffold should be used with safety net and belt especially when use for works at
height.
Scaffold accessories such as braces, brackets, trusses or screw legs that are damaged
or weakened from any cause must be immediately repaired or replaced.
A competent person must inspect the scaffold and re-inspect at designated intervals.
Scaffold must be at least 10 feet away from any electric power lines at all time to
avoid any forms of electrocution or contact with live cable.
ACCIDENT DUE TO SLIP, TRIP AND FALLS
Increase in international and national attention is being placed on occupational strips, trips
and falls (STF) as the extent of the problem is recognized. This growing interest reflects an
understanding that strips, trips and falls are preventable in lieu of daily occurrence on
building sites. More than a million people suffer from these accidents annually. Slips, trips
and falls account for 15% to 20% of all workers‘ compensation cases; with older ones having
higher percentage of falls compare to younger ones. This is as a result of the fact that,
regardless of the kind of work to be done or the position of such work, slip or trip falls can
occur at any place or point on the construction site, thus, the reason for its control to prevent
casualty.
CONTROL MEASURES.
Immediate cleaning of spillage on site.
The floor must be kept clean and dry always.
Immediate disposal of waste materials from site.
Avoid causing trailing cables or littering binding wires.
Constant wearing of suitable and traction footwear on site.
Immediate removal of any obstructions on the walk way on site.
Keep the site clear of any obstacle such as debris, broken blocks or concrete.
CRANE ACCIDENT
Factors associated with mobile cranes failure include support failure, failure to use
outriggers, crane failure or collapses and rigging failure. Though, the collapse of tower cranes
is rare, accidents and near misses do occur. Failure of any part of the crane or load carry
systems are likely to cause serious accidents, with both crane operators, site personnel and
general public involved posits that significant and serious injuries of fatality may occur if

National Conference on Recent Advancement and Sustainability in Civil Engineering, 10th
April2015
RASCE 2015 196
cranes are not inspected before use and if they are not used properly. Often, these injuries
occur when a worker is struck by an overhead load or caught within the crane‘s swing radius.
It therefore implies that, crane accidents are associated with erection or assembling, usage,
dismantling and supervision or inspection and are major treat to life of workers on any
building site.
CONTROL MEASURES.
Checking of all crane control to ensure proper operation before use.
Inspection of wire rope, chains and hook for any damage.
Ensuring that the load does not exceed the crate rated or carrying capacity.
Full check of all rigging prior to use.
Fully extend of outriggers before full operation.
Never move a load over a worker.
The load must be raised few inches to verify balance and effectiveness of the brake
system.
Watch for overhead electrical distribution and transmission lines and maintain a safe working
clearance of at least 10 feet from energized and electrical lines
LADDER ACCIDENT
Ladder falls or accidents increased significantly in 2001-2005, which gives a significant rise
in serious injury from ladder falls. A fall from height, more than one metre, was the most
common mechanism of injury accounting for 59% of the total. It was also established that
about 20% of ladder-related falls greater that one metre and major trauma cases occurred
while people are working on site. despite the knowledge of the dangers of falls from ladders,
there has being a significant increase in the number of casualties from ladder falls which
resulted into broken limb, fracture and bruises on building sites.
CONTROL MEASURES
The use of correct ladder for the task or job.
Ladders are ensured to be long enough to safely reach the work area without
unnecessary reaching to the sides.
Avoidance of the use of ladder, especially metallic, near electrical work and overhead
lines.
Never load ladders beyond the maximum intended load or beyond the manufacturer‘s
rated capacity.
Mark or tag (do not use) damaged or defective ladders for repair or replacement to
prevent their usage.
ELECTRICAL ACCIDENTS
It implies that electrical works involving the use of electricity on site is very risky. He
further shows that most people affected by electrical injuries are electrical workers (i.e
electricians; electrical power installers and repairers; their apprentices and their supervisors).
These workers had one-third of the electrical deaths followed by general labourers on site.
also conclude that the majority of electrocution death resulted either from direct or indirect
contact with power lines; but having the power de-energized in close proximity to building
sites and other settings, where there are potential for power line contact reduces this hazard.
Where not possible or practicable to de-energize lines, adequate clearance must be
maintained or lines encased in insulated sleeves to prevent electrocution of whatever kind.
CONTROL MEASURES
National Conference on Recent Advancement and Sustainability in Civil Engineering, 10th
April2015
RASCE 2015 197
All electrical workers must wear a non-conductive hand glove at work.
De-energizing of electrical lines in proximity to construction sites
Ensuring that all cables are in proper conditions before switch in on the machine.
Adequate provision of personal protective equipments on site
FIELD SURVEY
Control Measures of Accidents on Sites.
Table 1 shows the response to the provision of safety control measures of accidents on sites.
It can be observe that 26 of the respondents (76.5%) claimed to always provide control
measures of accidents to workers on site, 8 respondents (23.5%) provide it sometimes while
none claim to never providing it. This shows that, most construction organization know the
importance of controlling or preventing occupational accidents among workers on site and
also valued the life of their workers.
Table 1:Provision of Control Measures of Accident on sites.
Provision of control measures on sites Frequency Percent
Always 26 76.5
Sometimes 8 23.5
Total 34 100.0
Table 2:Different Control Measure of Accidents used on sites.
Control Measures N Rateof Usage
3 2 1
Mean
Value
Rank
Provision of First Aid Facility
Provision of Helmet or Hard Hat
Provision of Protective Cloth
Provision of Traction Boots
Provision of Hand Gloves
Use of Signs, Guides, Caution and
Reflector
Provision of Goggle or Eye wear
Use of Protective Equipments
Use of Safety Belt
Use of Safety Net on Scaffolds
34
34
33
34
34
34
33
31
32
30
28 6 -
28 6 -
26 7 -
26 8 -
26 8 -
24 9
1
22 11 -
12 19 -
15 13
4
11 16
3
2.82
2.82
2.79
2.76
2.76
2.68
2.67
2.39
2.34
2.27
1.5
1.5
3
4.5
4.5
6
7
8
9
10

National Conference on Recent Advancement and Sustainability in Civil Engineering, 10th
April2015
RASCE 2015 198
Note: N represents total number of respondents, 3 represent Always, 2 represent sometimes, 1
represent never.
Table 2 shows the different control measures of accidents used on building sites as reported
by the respondents. It can be shown from this Table that hardhat and first aid facility are often
used as control measures of accidents on site. Hard hat or helmet are provided to prevent
been struck on the head by falling objects or materials while first aid services are provided to
give a firsthand treatment to any injury sustained on site, so as to limit its fatality before
proper hospital attention is given. Protective cloth, traction boots and hand gloves follow
these descendingly. Traction boots are provided to prevent any step-on or slip accident while
hand gloves are provided to protect the hand from direct contact with energized cable or
circuit, sharp objects or materials, etc. Next are usage of signs, guides, caution and reflectors
to give signal of danger ahead to any one approaching; eyes wear; and protective equipment.
This shows that protective equipment is not often used on site as control measures of
accidents. Provision of safety net on scaffold is least used among other measures as control
measures of scaffold accident. Though, it is used to prevent falling-off of workers, tools or
materials from a scaffold, its usage are not common on site in Lagos state. Despite the
varying of usage of these measures, all of the respondents signified all the control measures
as a means of controlling accidents on sites.
CONCLUSION
RECOMMENDATIONS
The study reveals:
The various types of accidents that exist on construction sites and their respective
control measures.
Several accidents‘ prevention methodologies.
The types and frequency of usage of accidents‘ control measures on sites.
That helmet, first aid services, protective clothes and traction boots are the most used
safety measures on sites, though their usage differs from site to site.
First aid facility and attendant should be made available on site at all time.
A safety officer, different from the site engineer or manager, should be employed on
site to specifically plan, monitor and ensure adherence to control measures on site to
minimize accidents‘ occurrence and waste.
The use of safety equipments or control measures of accidents should be highly
enforced on all workers on site.
Warning signs, guides or reflector should be displaced where necessary on site
REFERENCES
[1] A critical review on the evolution of the construction accident ―Occupational Electrical
Injuries in the United State (1992-1998) and recommendations for safety research.
Journal of National Institute for Occupational safety and Health, U.S.A.‖
[2] Anna Levis, Jack Nickson a survey of construction site safety in china zeng, s.x.
Aetna school of management,‖ Journal of Construction Management (October) 23: 851-
859.‖
[3] Aref charehzehi, Alireza Ahankoob, Johor Bahru enhance the safety performance at
construction site ―Journal of SH& E Research, Vol. 4, Number 1. 1-33.‖
National Conference on Recent Advancement and Sustainability in Civil Engineering, 10th
April2015
RASCE 2015 199
[4] Bhimaraya A. Metri*
analyse critical success factors for construction firms. The
construction industry has lagged behind total quality management ―America Industrial
Hygene Conference, San Diego, CA‖
[5] Brad Hardlry, Micheal Philp, health and safety plan in construction ―volume 5 – fall
from height. Research Report pp. 234-244‖
[6] C.M. Tam a, S.X. Zeng Z.M. Deng A identifying elements of poor constructionsafety
management in china ―Report for World Day for Safety And Health at Work,
International Labour Office, Geneva, 2005. ISBN 92-2-117107-8‖
[7] Construction health and safety plan this construction health and safety plan (chasp)
has been developed to comply with the regulations under occupational safety and health
administration
[8] Edwin Sawacha, Shamil Naoum and Daniel Fong computes factors affecting safety
performance on construction sites
[9] John smallwood and Theo Haupt :the need for construction health and safety (h&s)
and the construction regulations ―Ladder Revisited, The Medical Journal of Australia,
186 (1) 31-34.‖
[10] Justin Micheal, Anna Pissco health and safety management systems - an analysis of
system types and effectiveness
[11] Lkechukwu a. Diugwu, Dorothy l. Baba, Ashem E. Egila effective regulation and
level of awareness
[12] Michael Charles, Janet Pillay, Rachel Ryan guide the best practice for safer
construction
[13] Mohammad S. El-mashaleh was analysed the jordanian society and economy have
suffered human and financial losses as a result of the poor safety record in the
construction industry.
[14] Paul Kingston., Chris Aadley. The effectiveness of work health and safety
interventions by regulators ―Journal of Centre for Human Factors and Ergonomics,
Volume 5, No 4, ISSN 1174-1234.‖
[15] Rómel g. Solís-carcaño*, Ricardo j. Franco-Poot construction workers‘ perceptions of
safety practices
[16] S.V.S.Raja Prasad and K.P.Reghunath study the empirical analysis of construction
safety climate construction industry
[17] Sathish, Kamalakannan., safety behavior in the construction sector
[18] Sílvia Silva, Adriana Araújo, Dário Costa safety climates in construction industry
―.Applied Occupational and Environmental Hygiene, Vol. 16 (120 1106-1117)‖
[19] Somik Ghosh lean construction and safety research occupational accidents are
wasteful and non-value-adding (nva) events in any form of production system

National Conference on Recent Advancement and Sustainability in Civil Engineering, 10th
April2015
RASCE 2015 200
[20] Steven Hecker understanding safety culture and safety climate in construction safety
culture and safety climate
[21] Taroun, A., Yang, J.B. and Lowe, d. Conducting the construction risk modelling and
assessment ―Applied Occupational and Environmental Hygiene, Vol. 16 (120 1106-
1117)‖
[22] Thanet Aksorn and B.H.W. Hadikusumo conduct gap analysis was used to examine
the differences between the importance of these csfs (critical successful factors ) and their
actual status.
[23] Tom Connors built safe life safe and the provisions for construction high‐rise site
safety from chapter 33 of the 2008 nyc building code ―Fatal Occupational Electrocutions
United States. A Journal Of Occup Med, (52): 102-106.‖

National Conference on Recent Advancement and Sustainability in Civil Engineering, 10th
April2015
RASCE 2015 201
28. ROLE OF WATER HYACINTH IN ZERO WASTE GENERATION
AND POWER GENERATION - A STUDY
Reya George.K,Asst.Professor,
Dr.R.Ganesan,Professor,
Alex christopher,Asst.Professor,
Department of Civil Engineering, Velammal Engineering College
ABSTRACT
Water Hyacinth ( Eichhornia Crassipes ,Solms) a common aquatic weed has an extremely high
potential in zero waste generation. In the present study the ability of water hyacinth in wastewater
treatment and the quality of biomass produced is estimated. The economic feasibility of biogas
generation is also studied in reference to Retteri lake. Outdoor experiments were conducted in test
ponds with and without hyacinth in a batch mode of operation. The results indicate that under
adequate operational conditions, the test ponds with hyacinth showed a better treatment. The nitrate,
phosphate and potassium uptake by the plant shows that the biomass produced is an adequate nutrient
resource, which can be used for animal feed or agricultural fertilization or for biogas generation. But
various extraction procedures will have to be adopted in case of toxic wastes. Proper harvesting is
extremely important for adequate treatment.
KEYWORDS: Water Hyacinth, biogas generation, Nitrate removal, Phosphate removal,
Potassium removal, COD removal
1. INTRODUCTION
Wastewater produced in all modern societies often create large problems in
watersheds (eutrophication and lack of oxygen) both locally and sometimes also
regionally due to its content of nutrients and organic compounds. The main aim of the
study is the treatment of this wastewater using certain natural method, which will save
the cost of treatment and also produce water of better quality. Water Hyacinth, an aquatic
plant that is abundantly found in our climatic conditions is used for treatment. The
qualities of water hyacinth like easy availability, high purification capacity, suitability for
tropical climate, a good network of roots for better absorption, low cost of treatment
,economic potential of the harvested plant as feed, fertilizer,biogas,etc make it an ideal
candidate for wastewater treatment. Controlled growth of the plant with proper harvesting
may produce biomass of high nutrient value which can be converted to a compost by
vermicomposting, aerobic or anaerobic composting, or for animal feed, or extraction of
carotene, biogas generation, etc.

National Conference on Recent Advancement and Sustainability in Civil Engineering, 10th
April2015
RASCE 2015 202
2. EXPERIMENTAL STUDY
An experimental study was conducted in ponds with and without hyacinth and a
comparative study done to know the actual efficiency of hyacinth in waste treatment. The
analysis was done for pH, Nitrate, Phosphate, Potassium and COD for varying initial
concentrations at a constant plant density and temperature for a detention period of 10 days.
Data collection and assessment of Lake Ratteri was also checked out for studying the
feasibility on the implementation of a biogas plant on the Lake.
COLLECTION OF MATERIALS
Wastewater was collected from the sewerage system of VEC and the wastewater
characteristics analysed.
The water hyacinth ( Eichhornia Crassipes,Solms ) was collected from a nearby
wetland and allowed to multiply in a fresh water pond. Identification of the species was done
with the help of a taxonomist.
EXPERIMENTAL SETUP
Experiments were conducted in test ponds of internal diameter 50 cm, depth 70 cm,
and of 137L capacity with varying initial concentrations with and without hyacinth in a batch
mode of operation. The natural conditions of ponds were created. Sunlight, air and
atmospheric temperature were naturally available to the system as no efforts were made to
control them. Wastewater collected from the sewerage system was substituted by synthetic
wastewater to obtain different initial concentrations. Distilled water was added to make up
the volume for the loss by evapotranspiration.
Initially the ponds were operated to acclimate the plants collected from a nearby
sewage pond. During this period the plants grew, multiplied and formed a compact mat over
the wastewater. Plants covered the entire water surface to maintain a density of 10690
kg/hectare. A blank was kept with each setup as a control to study the actual effect of water
hyacinth.
SAMPLING
Proper sampling techniques are vital for accurate testing in evaluation studies. To be
representative of the entire flow, samples should be taken where the waste water is well
mixed. An instantaneous grab sample represents conditions at the time of sampling only and
cannot be considered to represent a longer time period, since the character of the wastewater
discharge is not stable. A composite sample is a mixture of individual grabs proportional
according to wastewater flow pattern. In deep and narrow trenches wastewater should be
collected at one third depth from bottom.
Wastewater was collected from different points in the sewerage network of VEC and
composite samples prepared. For this individual samples were collected at a time interval of 4

National Conference on Recent Advancement and Sustainability in Civil Engineering, 10th
April2015
RASCE 2015 203
hours and stored in a refrigerator. The volume of grab sample collected was proportional to
the flow. The composite samples were analyzed to study the characteristics of flow.
The samples from the test ponds were taken at a depth of 30 cm from bottom. The
containers were rinsed out 2 to 3 times with the water to be examined before being finally
filled.
ANALYSIS
The analysis of each parameter was done by different analytical methods. They are
given in table below. The testing of the various parameters was done according to ―standard
methods for the estimation of water and wastewater‖. Pilot scale experiments with hyacinths
and other aquatic plants in shallow containers showed that the overall nitrogen removal
follows a first order reaction rate.
Table 1.Analytical methods of different parameters
Sl.
No. Parameter Method Equipment
1. pH Electrode method pH Meter
2. TDS Electrode method TDS analyser
3. Phosphate Colorimetric method Spectrophotometer
4. Nitrate Colorimetric method Spectrophotometer
5. BOD Titrimetric method BOD incubator
6. COD Titrimetric method Reflux apparatus
7. Potassium Flame ionization Flame photometer
3. RESULTS AND DISCUSSION
The various physico-chemical parameters of the wastewater collected were studied.
Change in phosphate concentration, nitrate concentration, potassium, COD and pH
change with time is studied in tanks with and without hyacinth.
The feasibility on the implementation of a biogas plant on Lake Ratteri was studied.
National Conference on Recent Advancement and Sustainability in Civil Engineering, 10th
April2015
RASCE 2015 204
a. Effect of concentration of phosphate on its removal
Plants were exposed to phosphate concentrations ranging from 20.2 to 60.2 mg/l. The
results show that the plants were capable of removing phosphate over the entire duration of
study except that at times it showed a slight increase than the previous value. This is possible
due to leakage of plant contained compounds back into the system. It has been observed that
though in the beginning the uptake was rapid it subsequently changed to a much slower rate.
The only significant removal pathway for phosphorous is plant uptake and the removal will
be maximum if there is a careful vegetation management program involving frequent harvest.
b. Effect of pH on phosphate uptake
To observe the effect of pH on the ability of water hyacinth to take phosphate was
examined over a pH range of 4.1 to 10.0. The phosphate uptake increased with the increase in
pH to a maximum at 7.6.
c. Effect of concentration of nitrate on its removal
Plants were exposed to nitrate concentrations ranging from 20.0 to 120.0 mg/l.
Nitrogen removal far in excess of plant uptake levels has been observed. The nitrifier
organisms can flourish attached to hyacinth roots, which provide oxygen, while adjacent
microsites and the benthic layer provide the anaerobic conditions and the carbon sources
needed for denitrification.
The rate of removal is found to increase with increase in initial nitrate concentration. In a
detention time of 10 days, all the concentrations tested fall below the permissible limit of 45
mg/l.
d. Effect of pH on nitrate uptake
To observe the effect of pH on the ability of water hyacinth to take nitrate was
examined over a pH range of 4.1 to 10.0. The phosphate uptake increased with the increase in
pH to a maximum at 7.6and after pH 8.2 it started decreasing. The plants did not survive at
pH below 4 and greater than 9.
e. Effect of concentration of potassium on its removal
Figure shows that potassium concentration decreases, but at times it is found to increase. The
potassium uptake was found to be extremely low in case of initial concentration of 23 mg/l.
The uptake of potassium can be explained on the basis of contact exchange hypothesis of the
cation uptake by plants. In the free space (agroplasm) of the root there exists an exchangeable
cation fraction electrostatically bound to the negatively charged groups of peptic cell wall
distance.
f. Effect of COD on its removal
Batch experiments were carried out for initial CODs of 280.0 mg/l,386.0 mg/l and
808.0 mg/l. Plants had a healthy growth throughout the study period. Figure shows that the
initial rate of COD reduction is fast and it decreases over time. The residual COD is possible
due to living or dead bacterial biomass and release of organics from plants. The results
National Conference on Recent Advancement and Sustainability in Civil Engineering, 10th
April2015
RASCE 2015 205
showed that the rate of COD reduction is fast in case of wastewater treatment with hyacinth
than that without hyacinth.
g. Data collection and assessment of Lake Ratteri for studying the feasibility of
implementation of a biogas plant on the Lake .
Location
Located in the northern part of Chennai city on the Grand Northern Trunk (GNT)
Road, also known as Kolkata Highway, the lake is spread over 5.42 million square
metres(54.2 hectares) and fed by adjacent water bodies such as Red Hills reservoir
and Korattur lake. Separate concrete channels were set up a few years ago between
the two water bodies and Retteri lake to discharge excess rainwater from the former to
the latter during monsoon. This also helps prevent flooding in neighbouring areas,
which include Kolathur, Padi, Korattur, Ambattur and Villivakkam.
The annual production of 200 tons/ha/yearmight be attainable in eutrophic waters in
the tropics. The leaf stalks are swollen into spongy, bulbous structures. Flowers are light
purple with a darker blue or purple with yellow centre. The plant propagates itself from tiny
root fragments, which break off from the parent plants and quickly develop leaf stalks and
broad green leaves.
From the statistics collected it can be concluded that for Ratteri lake on an average 54.2 *
200= 10840 tons of hyacinth will be produced annually.
A) Projection 1
From the literature review,1Kg of water hyacinth will produce 970.38cm3 of biogas
1 Metric ton of water hyacinth will produce 1,000 x 930cm3
1 Metric ton of water hyacinth will yield 0.930m3 of biogas.
10840 tons of hyacinth will produce 10081.2 m3 of biogas
B) Projection 2
From the Literature review, 1m3 of biogas is equivalent to 0.46Kg of Liquified Petroleum
Gas (LPG)
One standard cylinder of LPG weighs 12.5Kg
By calculations, 26m3 of biogas is equivalent to one standard cylinder of LPG
As 1 ton of Water Hyacinth yields 0.930cm3 of biogas from this study, 27.95 tons of water
hyacinth is equivalent to 1 standard cylinder of LPG.
That means biogas equivalent to 387 standard cylinders of LPG (12.5kg) can be produced in
a year from the lake.
C) Projection3
Electrical Power Generation Potential
From the Literature review, 1m3 of biogas is equivalent to 1.25kWh of electricity
Electricity generation Potential = 10081.2*1.25 = 12601.5kWh/year
Taking a year to have 24 *365 hrs, Electricity Generation = 1.44 kw

National Conference on Recent Advancement and Sustainability in Civil Engineering, 10th
April2015
RASCE 2015 206
4. CONCLUSION
The feasibility of the use of water hyacinth to reduce nutrients in eutrophic water (a lake),
coupled with the economic feasibility of production of biogas were studied.
The Phosphate, Nitrate and Potassium removal rates of the water hyacinth plant show that the
harvested plant has a high nutritional value. Controlled growth of the plant and a high level of
treatment is possible if there is a proper harvesting. The harvested plant can be used for
animal feed or for agricultural fertilization. Thus the savings from water hyacinth waste water
treatment system can be of two fold – Savings due to natural means of treatment and savings
from the bio-gas production.
No odours were produced even from the water hyacinth ponds that received a high COD
loading. Cost effective mosquito control measures must be developed before hyacinth
systems can be used. Certain larvicidal fishes like Gambusia can be effectively used for their
control.finding an appropriate technology for biogas production from water hyacinth will
help in the optimum usage of this plant in waste reduction as well as energy generation.
REFERENCES:
1) Clair.n.sawyer,perry.l.mccarty and gene f.parkin,chemistry for environmental
engineering,mc graw hill publications
2) An Economic Analysis of the Use of Water Hyacinth for Phytoremediation and
Biogas Production in Dianchi Lake, China by Zanxin Wang and Jin Wan
3) Experiments on Co-Digestion of Cow Dung and Water Hyacinth
(EichhorniaCrassipes) for Biogas Yield M. K. C. Sridhara* , etal., International
Journal of Sciences: Basic and Applied Research (IJSBAR) ISSN 2307-4531
4) Work on Retteri lake begins - www.thehindu.com/features/downtown/...retteri-
lake.../article7043340.ec...Mar 28, 2015
5) de Alwis AAP, Biogas – A review of Sri Lanka‘s performance with a renewable
energy technology, Energy for Sustainable Development, 6(1), 30-37, 2002.

National Conference on Recent Advancement and Sustainability in Civil Engineering, 10th
April2015
RASCE 2015 207
29. DE-ICING CONCRETE -A STUDY METHODOLOGY
AJ Samson*,TA Rajha Rajeswaran** *Final Year Student, Dept of Civil Engineering, Velammal Engineerng College,
**Assistant Professor, Dept of Civil Engineering, Velammal Engineerng College
ABSTRACT Conventional concrete is not electrically conductive. Conduction of electricity through concrete
may take place in two ways: electronic and electrolytic. Electronic conduction occurs through
the motion of free electrons in the conductive medium, while electrolytic conduction takes place
by the motion of ions in the pore solution. In fresh concrete and during hydration, conduction of
electricity takes place by the motion of ions. However, in the hardened state, in which no
moisture is available, conduction takes place by the motion of free electrons. In order for
hardened concrete to be adequately conductive, metallic or other conductive particles must be
added to the concrete matrix, and they must be in good electrical contact with each other. In this
project, several conductive concrete mixtures were prepared.
INTRODUCTION Concrete pavements are prone to ice accumulation. The deck freezes before the approaches do,
making wintry travel on highways hazardous. Traditionally, removing ice from pavement can be
accomplished by a combination of several methods, such as plowing, natural melting, traffic
movement and chemical treatment. Because the bond between ice and pavement is strong,
removal by plowing alone may not be effective. Chemical treatment helps break the bond by
melting into the ice and spreading under the ice layer. Most highway winter maintenance
depends on using chemicals and fine granular particles as a primary means for de-icing and anti-
icing. The use of road salts and chemicals for de-icing is an effective method for ice removal but
causes damage to concrete and corrosion of reinforcing steel in concrete bridge decks. This
problem is a major concern to transportation and public works officials due to rapid degradation
of existing concrete pavements and bridge decks. The search for improved de-icing methods has
been a research focus for quite some time. The use of electric heating cables and heated fluid in
pipes has been attempted, however, those techniques were too expensive to operate and difficult
to maintain.
Conductive concrete is a cementitious composite containing a certain amount of electrically
conductive components to attain stable and high electrical conductivity. Due to its electrical
resistance and impedance, a thin conductive concrete overlay can generate enough heat to
prevent ice formation on a bridge deck when connected to a power source. Conductive concrete
is a relatively new material technology, which has been used for anti-static flooring,
electromagnetic shielding, and cathodic protection of steel reinforcement in concrete structures.
However, its applications have been limited because the earlier conductive concrete mixes did
not meet strength requirements and/or were too expensive to produce.
OBJECTIVES The objectives of this project were:
Design a conductive concrete mix specifically for pavement for de-icing and anti-
icing application;
Conduct de-icing and anti-icing experiments using a small-scale conductive concrete
overlay in a natural environment to determine factors affecting its heating
performance; and
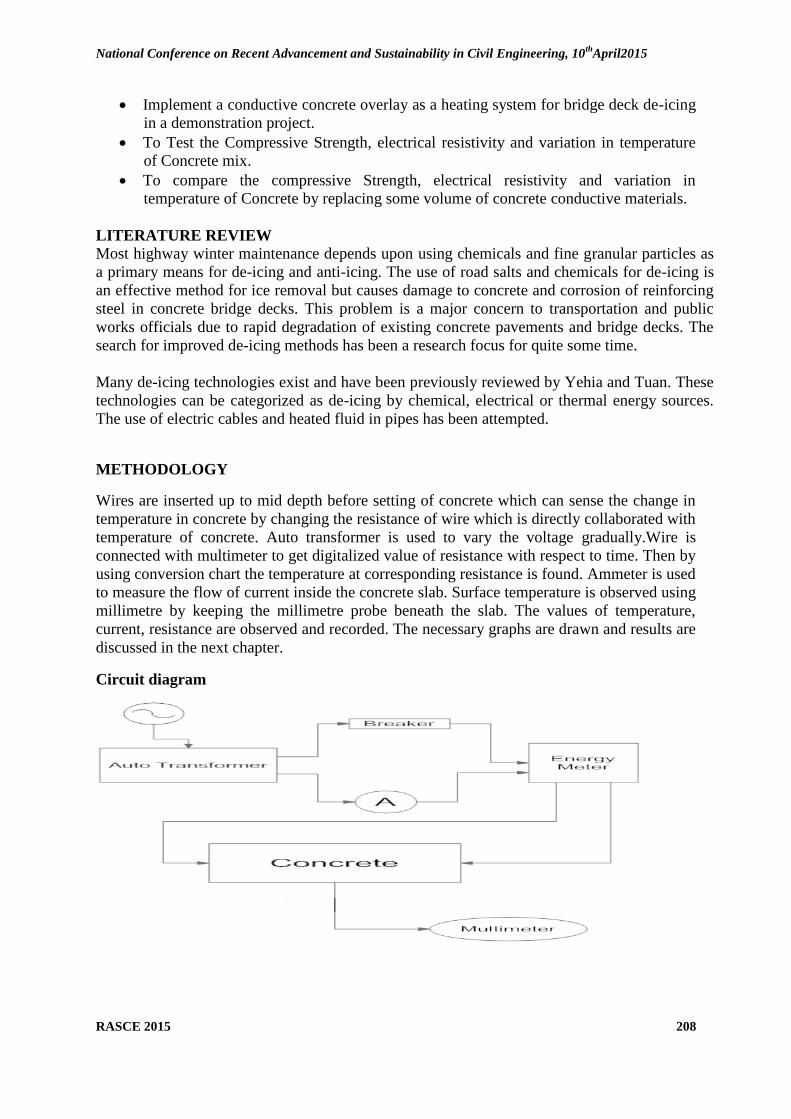
National Conference on Recent Advancement and Sustainability in Civil Engineering, 10th
April2015
RASCE 2015 208
Implement a conductive concrete overlay as a heating system for bridge deck de-icing
in a demonstration project.
To Test the Compressive Strength, electrical resistivity and variation in temperature
of Concrete mix.
To compare the compressive Strength, electrical resistivity and variation in
temperature of Concrete by replacing some volume of concrete conductive materials.
LITERATURE REVIEW Most highway winter maintenance depends upon using chemicals and fine granular particles as
a primary means for de-icing and anti-icing. The use of road salts and chemicals for de-icing is
an effective method for ice removal but causes damage to concrete and corrosion of reinforcing
steel in concrete bridge decks. This problem is a major concern to transportation and public
works officials due to rapid degradation of existing concrete pavements and bridge decks. The
search for improved de-icing methods has been a research focus for quite some time.
Many de-icing technologies exist and have been previously reviewed by Yehia and Tuan. These
technologies can be categorized as de-icing by chemical, electrical or thermal energy sources.
The use of electric cables and heated fluid in pipes has been attempted.
METHODOLOGY
Wires are inserted up to mid depth before setting of concrete which can sense the change in
temperature in concrete by changing the resistance of wire which is directly collaborated with
temperature of concrete. Auto transformer is used to vary the voltage gradually.Wire is
connected with multimeter to get digitalized value of resistance with respect to time. Then by
using conversion chart the temperature at corresponding resistance is found. Ammeter is used
to measure the flow of current inside the concrete slab. Surface temperature is observed using
millimetre by keeping the millimetre probe beneath the slab. The values of temperature,
current, resistance are observed and recorded. The necessary graphs are drawn and results are
discussed in the next chapter.
Circuit diagram
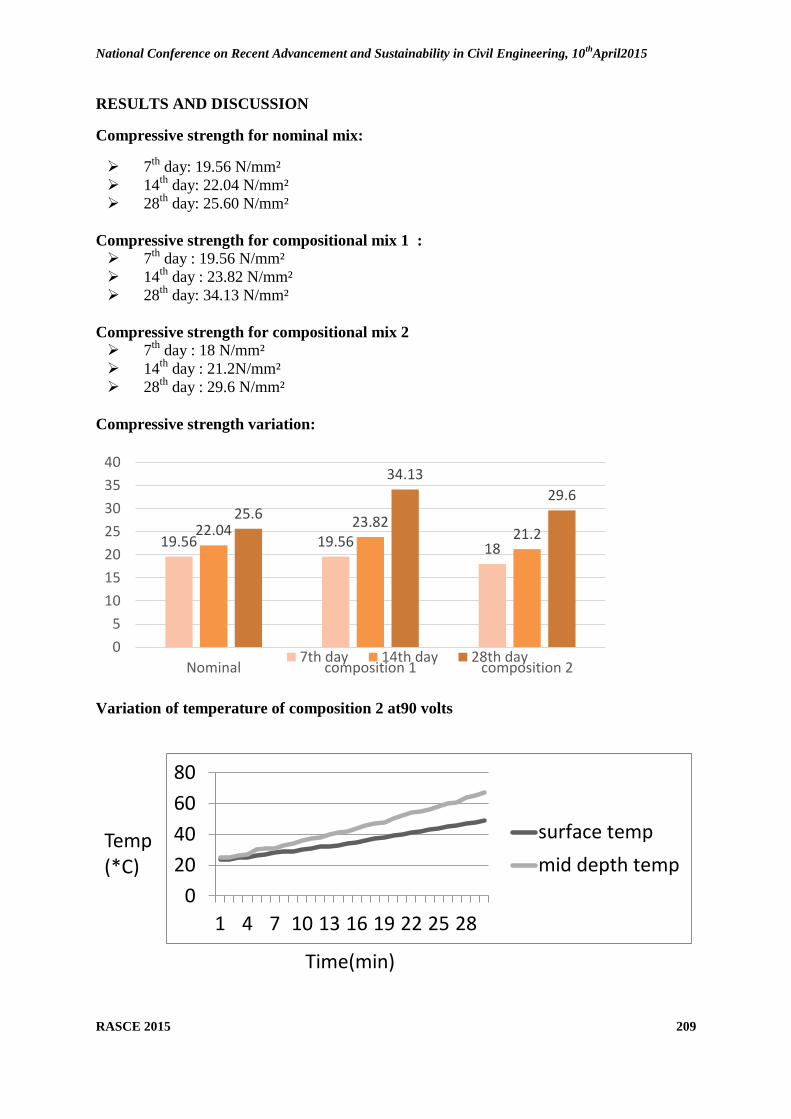
National Conference on Recent Advancement and Sustainability in Civil Engineering, 10th
April2015
RASCE 2015 209
RESULTS AND DISCUSSION
Compressive strength for nominal mix:
7th
day: 19.56 N/mm²
14th
day: 22.04 N/mm²
28th
day: 25.60 N/mm²
Compressive strength for compositional mix 1 :
7th
day : 19.56 N/mm²
14th
day : 23.82 N/mm²
28th
day: 34.13 N/mm²
Compressive strength for compositional mix 2
7th
day : 18 N/mm²
14th
day : 21.2N/mm²
28th
day : 29.6 N/mm²
Compressive strength variation:
Variation of temperature of composition 2 at90 volts
19.56 19.56 18 22.04
23.82 21.2
25.6
34.13
29.6
0
5
10
15
20
25
30
35
40
Nominal composition 1 composition 27th day 14th day 28th day
0
20
40
60
80
1 4 7 10 13 16 19 22 25 28
surface temp
mid depth temp

National Conference on Recent Advancement and Sustainability in Civil Engineering, 10th
April2015
RASCE 2015 210
Variation of temperature of composition 1 at 110 volts
Variation of temperature of composition 1at 150 volts
CONCLUSION
The new mix design containing conductive particles is found to be superior in that the
electrical conductivity and the heating rate are improved without the drawbacks.
The construction costs and de-icing performance of the heated bridge deck would
demonstrate its cost-effectiveness as opposed to other existing de-icing technologies.
The conductive concrete de-icing technology can be readily implemented at accident-
prone areas such as bridge overpasses, exit ramps, airport runways, street
intersections, sidewalks, and driveways.
Using a 1/16-in. epoxy or a 0.25 in. regular concrete topping on a conductive concrete
deck can significantly reduce the electric shock potential without compromising
heating rate.
The conductive concrete de-icing technology is readily deployable at any accident-
prone roadways, bridge decks and interstate exit ramps.
REFERENCES
1.Lee, R.C., Sackos, J.T., Nydahl, J.E., and Pell, K.M., ―Bridge Heating Using
Ground-Source Heat Pipes.‖ Transportation Research Record 962, pp. 51-57, 1984
2. Henderson, D. J., ―Experimental Roadway Heating Project on a Bridge Approach,‖
Highway Research Record, No. 14, Publication 111, pp. 14-23, 1963
3. Xie, P., Gu, P., and Beaudoin, J. J., ―Electrical percolation phenomena in cement
composites containing conductive fibers,‖ Journal of Materials Science, Vol.31, No.15,
August 1996, pp.4093-4097.
0
20
40
60
1 4 7 10 13 16 19 22 25 28
surfacetemperature
mid depthtemp
0
50
100
1 4 7 10 13 16 19 22 25 28
surface temp
mid depth temp
National Conference on Recent Advancement and Sustainability in Civil Engineering, 10th
April2015
RASCE 2015 211
30. EFFECT OF CHANGE IN TYPES AND LOCATION OF SHEAR
WALL ON SOFT-STOREY BUILDING SUBJECTED TO LATERAL
LOAD
1Abdul Haseeb and
2Mr.K.Dhanasekar
1PG Scholar, ME.Structural Engineering, MNM.Jain Engineering College, Chennai-600013
2Head Of Department, Civil Engineering. MNM Jain Engineering College, Chennai-600013
ABSTRACT
Shear wall is a structural element used to resist horizontal forces parallel to the plane of the
wall. Shear wall has highly in plane stiffness and strength which can be used to
simultaneously resist large horizontal loads and support gravity loads. Shear Walls are
specially designed structural walls include in the buildings to resist horizontal forces that are
induces in the plane of the wall due to wind, earthquake and other forces. They are mainly
flexural members and usually provided in high rise buildings to avoid the total collapse of the
high rise buildings under seismic forces. In this project collection of some literatures is done
according to them different types and locations of shear walls are selected to be used in the
second phase. By continuation analyzing of a soft-storey building is to be done by using the
selected types and location of shear wall for determining parameters like storey drift,
maximum shear force, and maximum bending moment in the second phase by using standard
software Staad.Pro.
KEY WORDS: Shear Wall, Horizontal Load, Wind, Earthquake Load, Seismic Force, Soft-
Storey Building.
I INTRODUCTION
The primary purpose of all kinds of structural systems used in the building structures
is to support gravity loads. The most common loads resulting from the effect of gravity are
dead load, live load and snow load. Besides these vertical loads, buildings are also subjected
to lateral loads caused by wind, blasting or earthquake. Lateral loads can develop high
stresses, produce sway movement or cause vibration. Therefore, it is very important for the
structure to have sufficient strength against vertical loads together with adequate stiffness to
resist lateral forces. Shear wall systems are one of the most commonly used lateral load
resisting in high rise building. Shear wall has high in plane stiffness and strength which can
be used to simultaneously resist large horizontal loads and support gravity loads. It is very
necessary to determine effective, efficient and ideal location of shear wall.
The shear wall is a structural element designed to resist lateral forces. For slender
walls where the bending deformation is higher shear wall resists the loads due to cantilever
action and for short walls where the shear deformation is higher it resists the loads due to
truss action. These walls are more important in seismically active zones because during
earthquakes shear forces on the structures increase. Shear wall may become essential from
the point of view of economy and control of horizontal displacement.
II SOFT-STOREY BUILDING
If a constructing has a floor that is 70% less rigid than the floor above it, it is believed
as a soft storey building. A soft storey constructing is a multi-story constructing alongside
one or extra floors that are soft due to structural design. These floors can be exceptionally
hazardous in earthquakes, because they cannot cope alongside the lateral powers and get

National Conference on Recent Advancement and Sustainability in Civil Engineering, 10th
April2015
RASCE 2015 212
damage by the swaying of the constructing across a quake. As a consequence, the soft storey
building can be damage in the earthquake waves or due to wind load. If you have ever seen
pictures of large damage of the earthquake, you must have seen a number of examples of soft
storey downfall, because it is one of the main reasons of damage to confidential residences.
Soft storey constructions are described by possessing a report that has a lot of open
space. For example there are frequently soft storey buildings which are having more spaces
for building purpose like parking, lift or floors alongside a lot of windows. The space of the
soft storey building could be aesthetically or commercially used. Hereby there are less
opportunities of damaging, collapse of the building if shear walls are constructed that are
projected to allocate lateral powers so that a constructing can protect the swaying
characteristic of a building in earthquake.
III SHEAR WALL
Reinforced concrete (RC) constructions frequently have vertical plate-like RC walls,
slabs, beams and columns. This wall usually starts at foundation level and are constant across
the constructing height. Their thickness can be as low as 150mm, or as elevated as 400mm in
elevated development buildings. Shear walls are normally endowed alongside both length and
width of buildings. Shear walls are like vertically-oriented expansive beams that hold
earthquake loads downwards to the foundation. Walls can be projected as plain concrete
walls after there is merely compression alongside no tension or else they ought to be
projected as underpinned concrete walls. Shear walls are specially projected structural walls
incorporated in constructing to challenge lateral powers that are endowed in the plane of the
wall due to wind, earthquake and supplementary forces. Shear wall is rather misleading as
such walls behave extra like flexural members. It is always advisable to incorporate them in
constructions craft in spans probable to experience earthquake of colossal intensity or
elevated winds.
They are normally provided in supported to columns, in stair wells, lift wells, toilets,
utility shaft etc., though the most vital property of shear wall for seismic design is mainly to
disparate from winds load, is that it ought to have good ductility below reversible and
recapped overloads. In arranging shear wall the tensile stress due to lateral loads as far as
probable by loading them alongside as far gravity powers as it can safely take. They ought to
be additionally allocated symmetrically to circumvent torsional stresses. It is extremely vital
to note that shear wall meant to challenge earthquake ought to be design for ductility.
VI TYPES OF SHEAR WALL
Types of Shear wall to be used in the project are given below:-
1) Simple Rectangular Shear Wall
2) Colunm Supported Shear Wall
3) Core type Shear Wall
SIMPLE RECTANGULAR SHEAR WALL :-
These simple types were the first to be used in construction. Such shear walls under
the action of in-plane vertical loads and horizontal shear along its length are subjected to
bending and shear. Uniform distribution of steel along its length as is used in the simple shear
walls is not as efficient as putting the minimum steel over the inner 0.7-0.8 length L of the
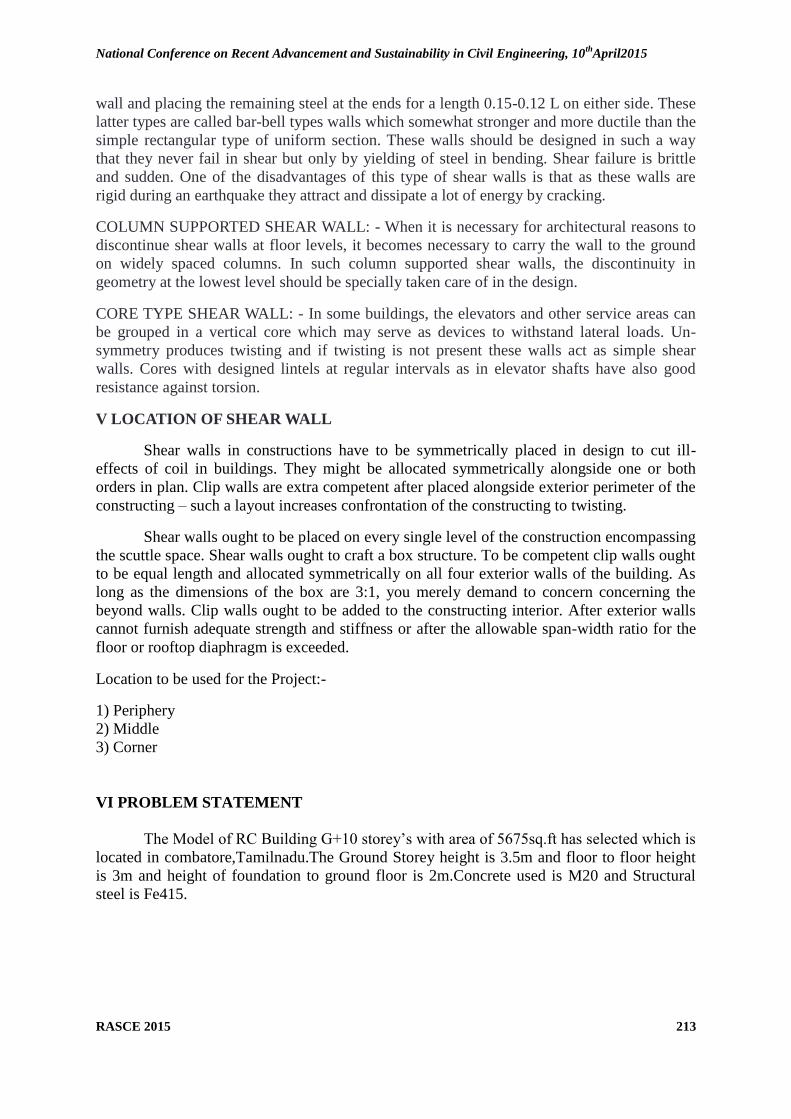
National Conference on Recent Advancement and Sustainability in Civil Engineering, 10th
April2015
RASCE 2015 213
wall and placing the remaining steel at the ends for a length 0.15-0.12 L on either side. These
latter types are called bar-bell types walls which somewhat stronger and more ductile than the
simple rectangular type of uniform section. These walls should be designed in such a way
that they never fail in shear but only by yielding of steel in bending. Shear failure is brittle
and sudden. One of the disadvantages of this type of shear walls is that as these walls are
rigid during an earthquake they attract and dissipate a lot of energy by cracking.
COLUMN SUPPORTED SHEAR WALL: - When it is necessary for architectural reasons to
discontinue shear walls at floor levels, it becomes necessary to carry the wall to the ground
on widely spaced columns. In such column supported shear walls, the discontinuity in
geometry at the lowest level should be specially taken care of in the design.
CORE TYPE SHEAR WALL: - In some buildings, the elevators and other service areas can
be grouped in a vertical core which may serve as devices to withstand lateral loads. Un-
symmetry produces twisting and if twisting is not present these walls act as simple shear
walls. Cores with designed lintels at regular intervals as in elevator shafts have also good
resistance against torsion.
V LOCATION OF SHEAR WALL
Shear walls in constructions have to be symmetrically placed in design to cut ill-
effects of coil in buildings. They might be allocated symmetrically alongside one or both
orders in plan. Clip walls are extra competent after placed alongside exterior perimeter of the
constructing – such a layout increases confrontation of the constructing to twisting.
Shear walls ought to be placed on every single level of the construction encompassing
the scuttle space. Shear walls ought to craft a box structure. To be competent clip walls ought
to be equal length and allocated symmetrically on all four exterior walls of the building. As
long as the dimensions of the box are 3:1, you merely demand to concern concerning the
beyond walls. Clip walls ought to be added to the constructing interior. After exterior walls
cannot furnish adequate strength and stiffness or after the allowable span-width ratio for the
floor or rooftop diaphragm is exceeded.
Location to be used for the Project:-
1) Periphery
2) Middle
3) Corner
VI PROBLEM STATEMENT
The Model of RC Building G+10 storey‘s with area of 5675sq.ft has selected which is
located in combatore,Tamilnadu.The Ground Storey height is 3.5m and floor to floor height
is 3m and height of foundation to ground floor is 2m.Concrete used is M20 and Structural
steel is Fe415.
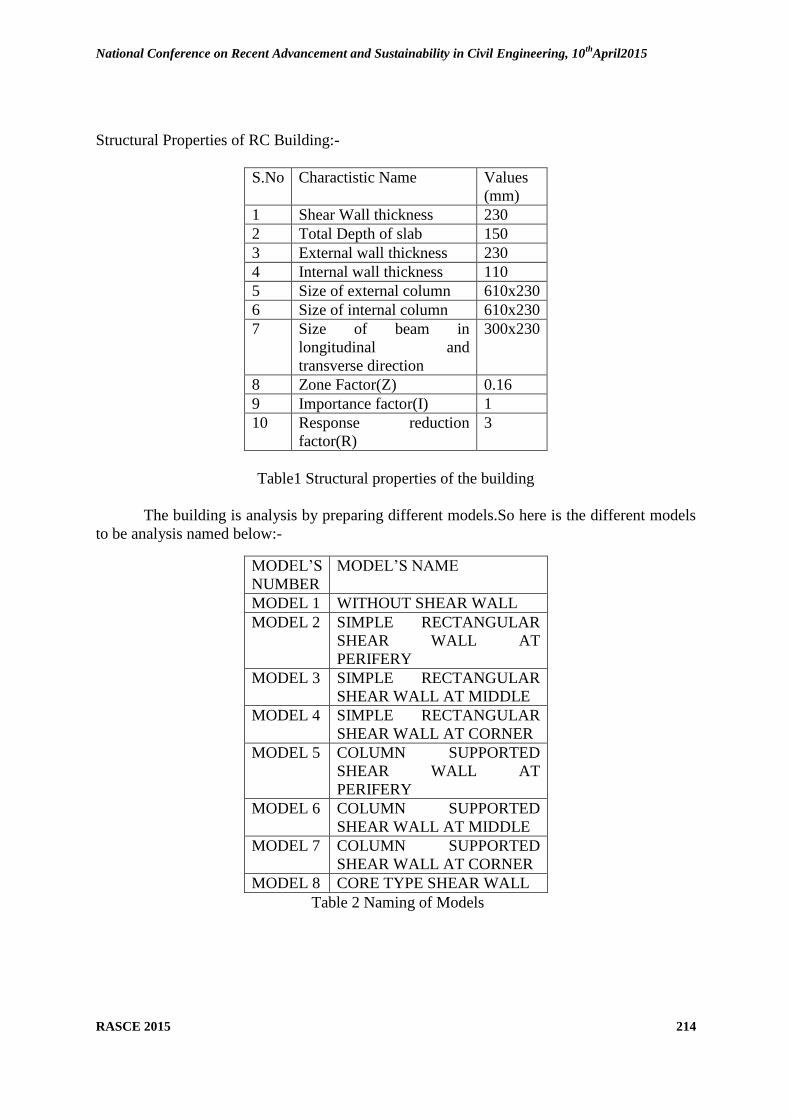
National Conference on Recent Advancement and Sustainability in Civil Engineering, 10th
April2015
RASCE 2015 214
Structural Properties of RC Building:-
S.No Charactistic Name Values
(mm)
1 Shear Wall thickness 230
2 Total Depth of slab 150
3 External wall thickness 230
4 Internal wall thickness 110
5 Size of external column 610x230
6 Size of internal column 610x230
7 Size of beam in
longitudinal and
transverse direction
300x230
8 Zone Factor(Z) 0.16
9 Importance factor(I) 1
10 Response reduction
factor(R)
3
Table1 Structural properties of the building
The building is analysis by preparing different models.So here is the different models
to be analysis named below:-
MODEL‘S
NUMBER
MODEL‘S NAME
MODEL 1 WITHOUT SHEAR WALL
MODEL 2 SIMPLE RECTANGULAR
SHEAR WALL AT
PERIFERY
MODEL 3 SIMPLE RECTANGULAR
SHEAR WALL AT MIDDLE
MODEL 4 SIMPLE RECTANGULAR
SHEAR WALL AT CORNER
MODEL 5 COLUMN SUPPORTED
SHEAR WALL AT
PERIFERY
MODEL 6 COLUMN SUPPORTED
SHEAR WALL AT MIDDLE
MODEL 7 COLUMN SUPPORTED
SHEAR WALL AT CORNER
MODEL 8 CORE TYPE SHEAR WALL
Table 2 Naming of Models
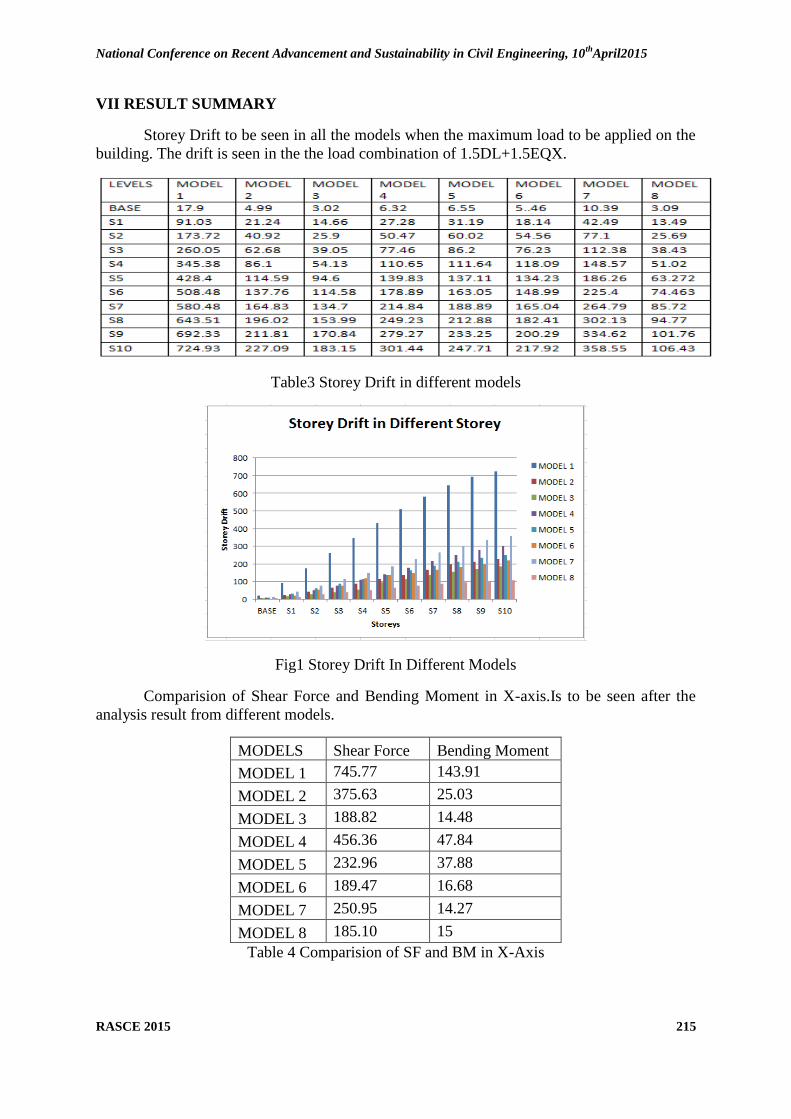
National Conference on Recent Advancement and Sustainability in Civil Engineering, 10th
April2015
RASCE 2015 215
VII RESULT SUMMARY
Storey Drift to be seen in all the models when the maximum load to be applied on the
building. The drift is seen in the the load combination of 1.5DL+1.5EQX.
Table3 Storey Drift in different models
Fig1 Storey Drift In Different Models
Comparision of Shear Force and Bending Moment in X-axis.Is to be seen after the
analysis result from different models.
MODELS Shear Force Bending Moment
MODEL 1 745.77 143.91
MODEL 2 375.63 25.03
MODEL 3 188.82 14.48
MODEL 4 456.36 47.84
MODEL 5 232.96 37.88
MODEL 6 189.47 16.68
MODEL 7 250.95 14.27
MODEL 8 185.10 15
Table 4 Comparision of SF and BM in X-Axis

National Conference on Recent Advancement and Sustainability in Civil Engineering, 10th
April2015
RASCE 2015 216
Fig 2 Comparision of SF and BM in X-Axis
Comparision of Shear Force and Bending Moment in Z-Axis is to be analysis by
applying the load in same direction.
MODELS
Shear
Force
Bending
Moment
MODEL 1 386.27 16.89
MODEL 2 494 96.02
MODEL 3 376.73 27.99
MODEL 4 124.65 91.21
MODEL 5 249.84 38.49
MODEL 6 450.87 15.07
MODEL 7 329.64 57.36
MODEL 8 161.65 98.35
Table 5 Comparision of SF and BM in Z-Axis
Fig 3 Comparision of SF and BM in Y-Axis
National Conference on Recent Advancement and Sustainability in Civil Engineering, 10th
April2015
RASCE 2015 217
VIII CONCLUSION
According to the analysis done on a residential building and by carring out the result the
following conclusion is to be seen:-
1) From all the load combination it is found that the load 1.5DL+1.5EQX is the giving
more effect in the building.
2) Storey drift in the building without shear wall is having maximum value and the value
decrease as shear wall is added.
3) According to the analysis simple rectangular shear wall is giving more protection to
the building because it starts from the foundation.
4) Column supported shear wall is also giving support to the building but not more as
compare to simple rectangular shear wall.
5) In the case of location the best location is found to be in middle of the building.
Hence, According to the analysis it is said that simple rectangular shear wall with
middle location is giving the best result as compare to other models.
XI REFERENCE
1) Anshuman. S, Dipendu Bhunia, Bhavin Ramjiyani On International Journal Of Civil
And Structural Engineering Volume 2, No 2, 2011, Solution Of Shear Wall Location
In Multi-Storey Building.
2) Amit S. Gawande ―Seismic Analysis of RC Frame With Soft Ground Storey‖ ijpret,
2013; Volume 1(8): 213-223.
3) Ashishs.Agrawal, S.D.Charkha On International Journal Of Engineering Research
And Applications (Ijera), Effect Of Change In Shear Wall Location On Storey Drift
Of Multistorey Building Subjected To Lateral Loads.
4) C.V.R.Murty on Indian Institute of Technology Kanpur, Learning Earthquake Design
and Construction.
5) Desai Pallavi T, Prof. Mrs. A. Rajan. ―Seismic Performance of Soft Storey
Composite Column‖ International Journal of Scientific & Engineering Research,
Volume 4, Issue 1, January-2013.
6) Gregory Macrae on Iitgn Short Course, Lateral Load Resisting Systems.
7) Garrett Richard Hagen on California Polytechnic State University, San Luis Obispo.
Performance-Based Analysis Of A Reinforced Concrete Shear Wall Building.
8) Johan Vessby, Linnaeus University Press, Analysis Of Shear Walls For Multi-Storey
Timber Buildings.
9) John Nichols, Bachelor of Engineering (Civil, Honours I.) University Of Newcastle In
Partial Fulfilment Of The Requirements For The Degree Of Doctor Of Philosophy.
October 2000,A Study Of The Progressive Degradation Of Masonry Shear Wall
Subjected To Harmonic Loading.
10) M. Ashraf & Z.A. Siddiqi & M.A. Javed (Asian Journal Of Civil Engineering
(Building And Housing) Vol. 9, No. 5 (2008),Configuration Of A Multistorey
Building Subjected To Lateral Forces Pages 525-537.
11) Misam Abidi & Mangulkar Madhuri. N. On International Journal of Engineering and
Advanced Technology (Ijeat) Issn: 2249 – 8958, Volume-1, Issue-6, August 2012.
Review on Shear Wall for Soft Story High-Rise Buildings.

National Conference on Recent Advancement and Sustainability in Civil Engineering, 10th
April2015
RASCE 2015 218
12) Manak Bhavan, Bahadur Shah Zafar Marg,IS 1893(part 1) : 2002, ― Criteria for
earthquake resistant design of structures,,part 1, general provisions and buildings ―,
Fifth revision, Bureau of Indian Standerds, New Delhi 110002.
13) P.C.Varghese, shear wall, advanced reinforced concrete design second edition, PHI
Learning Private Limited, 2009(pgno.337-356).
14) Ravikanth Chittiprolu & Ramancharla Pradeep Kumar On Earthquake Engineering
Research Centre, International Institute Of Information Technology, Hyderabad, Ap,
India. Significance of Shear Wall In Highrise Irregular Buildings.
15) Reddy.K, D.S.Prakash Rao and A.R.Chandrasekaran, "modeling of rc frame buildings
with soft ground storey", the indian concrete journal, volume 81, no. 10, october
2007, pp 42-49.
16) Shahzad Jamil Sardar and Umesh. N. Karadi ,(International Journal Of Innovative
Research In Science, Engineering And Technology) Vol. 2, Issue 9, September 2013,
Effect Of Change In Shear Wall Location On Storey Drift Of Multistorey Building
Subjected To Lateral Loads.
17) Seyed M. Khatami, Alireza Mortezaei & Rui C. Barros, Comparing Effects Of
Openings In Concrete Shear Walls Under Near-Fault Ground Motions.
18) Sharany Haque and Khan Mahmud Amanat, ―strength and drift demand of columns of
rc framed buildings with soft ground story‖ journal of civil engineering (ieb), 37 (2)
(2009) 99-110.
19) Saraswati Setia and Vineet Sharma ―seismic response of r.c.c building with soft
storey‖ international journal of applied engineering research, issn 0973-4562 vol.7
no.11 (2012).
20) Tolga Aki.S on The Graduate School Of Natural And Applied Sciences Of The
Middle East Technical University. Lateral Load Analysis Of Shear Wall-Frame
Structures.
21) Timothy P & Mccormick.P.E. On Seismic Retrofit Training,Shear Walls.
22) Varsha R. Harne,Civil Engineering Department, Rcoem, Nagpur, Shri Ramdeobaba
College Of Engineering & Management, Nagpur, India. Comparative Study Of
Strength Of Rc Shear Wall At Different Location On Multi-Storied Residential
Building.
National Conference on Recent Advancement and Sustainability in Civil Engineering, 10th
April2015
RASCE 2015 219
31. GREEN CONCRETE –A REVIEW
A.Latha 1
Dr.R.Ganesan 2
Reya George3
1. Associate Professor, Department of Civil Engineering, Panimalar Engineering College, Chennai-123.
2. Professor & Head , Department of Civil Engineering, Velammal Engineering College, Chennai-66.
3. Asst. Professor-II, Department of Civil Engineering, Velammal Engineering College, Chennai-66.
ABSTRACT Concrete is the most widely used man-made material, and the manufacture
of Portland cement the active ingredient of concrete - accounts for 6 to 8 percent
worldwide of all anthropogenic emissions of carbon dioxide, a leading greenhouse
gas involved in global warming. Globally, nearly 2.77 billion metric tons (t) (3.05
billion st) of portland and hydraulic cement was produced in 2007. The concrete
construction sector has a responsibility to take immediate action to reduce its
environmental impacts, including the generation reduction of CO2. This
responsibility also brings the opportunity to develop innovative technologies,
including use of materials from Coal Combustion Products (CCP's).
These newly developed activated fly ash based products leave virtually no
carbon footprint. These cements have been engineered for use in fast track concrete
repairs and construction, conventional paving, walls and concrete block masonry,
new construction and repair projects. Activated pozzolanic material cements and
resulting products are comprised of up to 95 percent green sustainable industrial
waste stream materials, primarily fly ash. They are manufactured via a low energy,
powder blending process. This technology possesses excellent performance and
durability characteristics, including high early strengths and 28-day strengths over
70 MPa (10,000 psi). Moreover, they can be placed effectively with ambient
temperatures ranging from –1°C to 49°C (30°F to 120°F).
National Conference on Recent Advancement and Sustainability in Civil Engineering, 10th
April2015
RASCE 2015 220
1. INTRODUCTION
Green concrete can be defined as the concrete with material as a partial or
complete replacement for cement or fine or coarse aggregates. The substitution
material can be of waste or residual product in the manufacturing process. The
substituted materials could be a waste material that remain unused, that may be
harmful (material that contains radioactive elements). Green concrete should
follow reduce, reuse and recycle technique or any two process in the concrete
technology. The three major objective behind green concept in concrete is to
reduce green house gas emission (carbon dioxide emission from cement industry,
as one ton of cement manufacturing process emits one ton of carbon dioxide),
secondly to reduce the use of natural resources such as limestone, shale, clay,
natural river sand, natural rocks that are being consume for the development of
human mankind that are not given back to the earth, thirdly use of waste materials
in concrete that also prevents the large area of land that is used for the storage of
waste materials that results in the air, land and water pollution.
This objective behind green concrete will result in the sustainable
development without destruction natural resources. The concrete is made with
concrete wastes which are eco-friendly so called as “Green concrete”. The other
name for green concrete is resource saving structures with reduced environmental
impact for e.g. Energy saving, CO2 emissions, waste water. “Green concrete” is a
revolutionary topic in the history of concrete industry.
2. GREEN LIGHTWEIGHT AGGREGATES
Green lightweight aggregates Synthetic lightweight aggregate produced from
environmental waste is a viable new source of structural aggregate material. The
uses of structural grade lightweight concrete reduce considerably the self-load of a
structure and permit larger precast units to be handled. Water absorption of the
National Conference on Recent Advancement and Sustainability in Civil Engineering, 10th
April2015
RASCE 2015 221
green aggregate is large but the crushing strength of the resulting concrete can be
high. The 28-day cube compressive strength of the resulting lightweight aggregate
concrete with density of 1590 kg/m3 and respective strength of 34 MPa.Most of
normal weight aggregate of normal weight concrete is natural stone such as
limestone and granite.
Cement production accounts for more than 6% of all CO2 emission which is a
major factor in the world global warming (Greenhouse gas). India is the third
largest cement producer in the World and one of the largest consumers of cement
per capita in the world. Rough figures are that India consumes about 1.2
Ton/year/capita, while as World average is 0.6 Ton/year/capita.
There have been a number of efforts about reducing the CO2 emissions from
concrete primarily through the use of lower amounts of cement and higher amounts
of supplementary cementitious material (SCM) such as fly ash, blast furnace slag
etc. CO2 emissions from 1 ton of concrete produced vary between 0.05 to 0.13
tons. 95% of all CO2 emissions from a cubic meter of concrete is from cement
manufacturing. It is important to reduce CO2 emissions through the greater use of
SCM.
i) Cement:
Most of CO2 in concrete is from the cement manufacturing process. A typical
cubic meter of concrete contains about 10% cement by weight. Out of all
ingredients, cement gives out most carbon dioxide. The reaction in the process of
Cement manufacture is: CaCO3 = CaO + CO2
ii) Aggregate:
Use of virgin aggregates contributes about 1% of all CO2 emissions from a typical
cubic meter of concrete. Therefore, the use of alternate aggregate is desirable. The
use of local and recycled aggregates is desirable as it can reduce transportation and
fuel cost and support sustainable development.
National Conference on Recent Advancement and Sustainability in Civil Engineering, 10th
April2015
RASCE 2015 222
iii) Resources:
The growing shortage of natural aggregate and sand is another aspect the
construction industry must consider. While this may not appear to be a priority
topic, pressure from environmentalist and conservationists worldwide will continue
to encourage both legislators and construction engineers to look for viable
alternatives to natural resources. Use of recycled materials like aggregate, water is
some ingredient which should be encouraged since fresh resources are becoming
increasingly scarce.
3.0 MATERIALS FOR GREEN CONCRETE
Green construction materials are composed of renewable, rather than non-
renewable resources. Green materials are environmentally responsible because
impacts are considered over the life of the product. Depending upon project-
specific goals, green materials may involve an evaluation of one or more of the
following criteria.
Locally available: Construction materials, components, and systems found
locally or regionally, saving energy and resources in transportation to the
project site.
Salvaged, re-furnished, or re-manufactured: Includes saving a material
from disposal and renovating, repairing, restoring, or generally improving
the appearance, performance, quality, functionality, or value of a product.
Reusable or recyclable: Select materials that can be easily dismantled and
reused or recycled at the end of their useful life.
National Conference on Recent Advancement and Sustainability in Civil Engineering, 10th
April2015
RASCE 2015 223
4.0 COARSE AGGREGATE:
Aggregate contents have direct and far-reaching effect on both the quality and
cost of concrete. Unlike water and cement, which do not alter in any particular
characteristic except in the quantity in which they are used, the aggregate
component is infinitely variable in terms of shape, size and grading etc. With
coarse aggregates graded infractions between 5mm and 40mm, differences in
particle shape and surface texture affect the bulk void content and frictional
properties of concrete. Generally the requirement of course aggregate in concrete is
more than 50% as shown in figure 1. Similarly sand required is about 30%. They
contribute in large quantity so its availability and effect on environment must be
carefully examined. Following source of coarse aggregate are discussed Fresh
Local Aggregate
Recycled Demolition Waste Aggregate
Recycled Concrete Material (RCM)
Blast Furnace Slag (BFS)
5.0 FINE AGGREGATE :
a) Manufactured Sand For Concrete: Sand is generally obtained from river bed. However, sand can also be
manufactured / produced after crushing stone from rocks. This process is similar to
getting crushed coarse aggregate. Infect after crushing rock stone for coarse
aggregate and sieving it on set of sieves between 40 - 6 mm size, the remaining
portion passing through 6 mm is called stone dust. This can also be said to be a bi-
product of manufacturing coarse aggregate. Such product / stone dust is generally
in cubical form and depend on the type of rock being crushed and can be called
manufactured sand. Cubical sand manufactured from crushed rock is the most
National Conference on Recent Advancement and Sustainability in Civil Engineering, 10th
April2015
RASCE 2015 224
desirable fine material for concrete production. It is generally accepted that particle
shape depends on the rock type, breakage energy and the type of crusher used. It is
also generally accepted that the crushers most successful at producing non-flaky
aggregates are autogenous (rock on rock) and vertical-shaft impactor. If it is
produced simultaneously, it saves energy and cost, providing further economies in
the overall production cost. Here, fracture in rock generally takes place along the
rock's natural grain, producing the characteristic cubical shape and surface texture.
Natural Sand Vs Manufactured Sand:
Natural sand often contains undesirable minerals and clays, and the effect of these
materials on both the fresh and the hardened concrete can be extremely harmful.
For example, the effect of clay particles in fresh concrete is obvious, as the
particles absorb disproportionate volume of water and hence swell to many times
their original size. This swelling occupies a volume in the cement paste in its fresh
state. When it hardens, the clay particles contract and leave minute voids which in
turn increase the shrinkage and permeability. This in turn reduces the concrete's
chemical resistance and compressive strength. Other undesirable materials, ranging
from basic chlorides to harmful chemicals, can exist in such fine material fraction.
The use of manufactured sand, however, reduces the risk of impurities.
It has been proven that about 20kg of cement can be saved for every cubic meter of
concrete that is made by replacing a poorly shaped aggregate with a cubical
aggregate. In addition, both compressive strength and flexural strength are
improved by using cubical aggregates, which also increases workability and
reduces bleeding and shrinkage. The impact of the physical characteristics of the
sand used in the concrete mix is even greater than that of the coarse aggregate
fractions, both in the concrete's plastic and hardened states

National Conference on Recent Advancement and Sustainability in Civil Engineering, 10th
April2015
RASCE 2015 225
Recycled Glass Aggregate:
Glass is formed by super cooling a molten mixture of sand (silicon dioxide),
soda ash (sodium carbonate), and/or limestone to form a rigid physical state. Glass
aggregate is a waste product of recycled mixed glass from manufacturing and post
consumer waste. Glass aggregate, also known as glass cullet, is 100 percent
crushed material that is generally angular, flat and elongated in shape. This
fragmented material comes in variety of colors or colorless. The size varies
depending on the chemical composition and method of production / crushing.
When glass is properly crushed, this material exhibits fineness modulus &
coefficient of permeability similar to sand. It has very low water absorption. High
angularity of this material, compared to rounded sand, enhances the stability of
concrete mixes. Such material can be easily used in concrete construction as fine
aggregate and give a better cohesive mix which will save on the consumption of
cement.
Blast Furnace Slag (BFS): Blast furnace slag is described above under coarse aggregate. Here if
blast furnace slag may be broken down as typical fine aggregate also with the
help of processing equipment to meet gradation specifications. Thus it can be
available as fine aggregate also as construction materials and acceptable for use in
green Concrete
6.0 CEMENTITIOUS MATERIALS - FLY ASH
Fly ash is a by-product produced during the operation of coal-fired power
plants. The finely divided particles from the exhaust gases are collected in
electrostatic precipitators. These particles are called Fly ash. Gray to black
represents increasing percentages of carbon, while tan color is indicative of lime
National Conference on Recent Advancement and Sustainability in Civil Engineering, 10th
April2015
RASCE 2015 226
and/or calcium content. Fly ash particles are very smooth and quite spherical in
shape. These particles range from 1 to 150 m in diameter. A typical shape of fly
ash particles is seen in figure 10. Based on its composition, fly ash is classified into
two groups: ASTM Class C or high calcium fly ash and ASTM Class F or low
calcium fly ash are the two categories of fly ash.
Use of Fly ash and Economic Impact:
Fly ash can be used as part replacement of Cement in Concrete. Finer the fly ash,
better is its reactivity and lesser is its water requirement. Fly ash particles finer
than 10 microns get adsorbed on cement particles giving a negative charge causing
dispersion of cement particle flocks, thereby releasing the water trapped within the
cement particle flocks and improves workability.
Advantages of Using Fly Ash in Concrete:
Utilization of fly ash as a part replacement of cement or as a mineral
admixture in concrete saves on cement and hence the emission of CO2.
Use of good quality fly ash in concrete has shown remarkable improvement
in durability of concrete, especially in aggressive environment.
7.0 GREEN CONCRETE MIX DESIGN
The concrete mix design method for such concrete is the same as for
conventional concrete. However, the constituent materials shown in figure 11
must pack themselves in such a manner that they occupy minimum volume or give
minimum voids in concrete. In figure 11 all individual material has large voids. For
getting a dense or impervious green concrete, all such voids must be packed with
smaller particles of next type of material.
This can be done by seeing the slump test of dry all - in - aggregates and other
materials.
7.1 Green Concrete Mix Design Objectives:

National Conference on Recent Advancement and Sustainability in Civil Engineering, 10th
April2015
RASCE 2015 227
Optimizes void space between aggregates by optimizing particle
proportions and packing of materials. This makes more effective use of
the cement binder.
Aggregates replace excess cement paste to give improved stability, less
shrinkage and increase in strength & durability.
Less cement also generates less heat of hydration.
The slump of the concrete and its flow are a function of the shape & the
quantity of the predominant size of the aggregate in the mix.
Use of more fine aggregate gives higher slump & flow. So the optimum
proportions of coarse & fine aggregate must be critically found to have the
best and dense concrete in both fresh & hardened stage of concrete.
7.2 Advantage Of Green Concrete:
It will give enhanced cohesion so user friendly - easier to place, compact & finish
concrete. It can be seen in concrete slump given in figure 13. Some other
advantages of such mix are:
Optimized mix designs mean easier handling, better consistency and easier
finishing
Reduction in shrinkage & creep
Green Concrete uses local and recycled materials in concrete.
The heat of hydration of green concrete is significantly lower than traditional
concrete
This result in a lower temperature rise in large concrete pours which is a
distinct advantage for green concrete.
Improved engineering properties:
Mix can result in a reduced paste volume within the concrete structure
resulting in a higher level of protection against concrete deterioration.
Higher strength per kilogram of cement

National Conference on Recent Advancement and Sustainability in Civil Engineering, 10th
April2015
RASCE 2015 228
Increased durability & lower permeability
More aggregates typically mean higher Modulus of elasticity.
Concrete stiffness or MOE is an important property of concrete in a reinforced
concrete structure.
8.0 Geopolymer Green Concrete:
The term 'Geopolymer' was first introduced by Davidovits, a French technologist.
It is a mineral polymer resulting from geochemistry. The Geopolymerisation
process comprises of a chemical reaction under highly alkaline conditions on Al-Si
minerals in slag or fly ash yielding polymeric Si-O-Al-O bonds. Geopolymer is
used as the binder, instead of Cement paste, to produce concrete. In this process it
does not produce CO2 like in production of Portland cement. This process of
polymer concrete can be compared with conventional concrete as below:
Geopolymer Concrete:
Low calcium flyash + Alkali solution + water = Polymerrisation gets hard product
on curing
Conventional concrete:
Conventional Cement + water = Hydration process gets hard product on curing
The Geopolymer paste binds the coarse and fine aggregates and other un-reacted
materials together to form Geopolymer Concrete. The production of Geopolymer
Concrete is similar to that of Portland Cement Concrete. In both types of concrete,
the aggregates occupy the largest volume. It is truly a Green Concrete. The
structural model of Geopolymeric material is still under investigation. One of the
'visualized mechanism' of Geopolymerisation' is 'dissolution, transportation and
poly condensation', which takes place through an exothermic process.
The Silicon and aluminum in the fly ash are activated by a combination of Sodium
hydroxide and Sodium silicate solutions to form the Geopolymer paste that binds
the aggregates and other un-reacted materials. They are defined as:
National Conference on Recent Advancement and Sustainability in Civil Engineering, 10th
April2015
RASCE 2015 229
These are also termed - 'Alkali Activators'
These can be single or a combination of several materials
A combination of Sodium or Potassium Silicate and Sodium or Potassium
hydroxide has been widely used
The 'Alkali Activator - to - base material' (i.e., flyash or slag) ratio is
generally in the range of 0.25 to 0.35
Hydroxide solutions of Concentration 8 M to 16 M are generally used.
Chemical composition of Geopolymers is similar to Zeolites, but shows an
amorphous micro - structure.
8.2 Properties of fresh Geopolymer Concrete Mix:
a) Workability Of Geopolymer Concrete Mix:
Fresh fly ash based Geopolymer concrete, in general, has good consistency
and is glossy in appearance. Generally it is cohesive as seen from figure 14.
Similar to Portland Cement Concrete, water content in the mix influences
the workability, as measured by conventional slump test
The mix is aminable for vibration
Generally such concretes can be workable upto about 1 1/2 hrs.
b) Curing Of Geopolymer Concrete:
Curing is generally carried out at elevated temperature in the range of 50 to
80OC. Adequate humidity has to be ensured otherwise the product/element is
to be insulated to preserve water in the mix.
Curing is done generally at elevated temperatures (ensuring humidity), right
from the time water and activation source material are added to the base
material.
Curing at elevated temperatures (ensuring humidity or insulation) after about
12 hours when water and activation source material are added to base
material.
National Conference on Recent Advancement and Sustainability in Civil Engineering, 10th
April2015
RASCE 2015 230
Later curing is done at normal temperatures in traditional way. Duration of
curing is generally for a short period; say about 3 to 5 days. Generally higher
the curing temperature, higher is the compressive strength achieved.
8.3 Properties of Hardened Geopolymer Concrete:
a. Strength Of Geopolymer Concrete:
The Strength of Geopolymer Concrete depends on the nature of source
materials and the curing temperature.
At present Geopolymer Concrete upto 90 MPa Strength has been developed.
Geopolymer concrete made from calcined source materials such as
metakaolin (calcined kaolin), flyash, slag etc. reach higher strength when
compared to those made from non-calcined materials such as Kaolin.
The alkali activator used for Geopolymerisation also has a dominant
influence on strength.
b. Stress - Strain Relations:
The general Stress - Stress curves of Geopolymer concrete, indicate that the
Stress - Strain relations are similar to that of Portland Cement Concrete.
The Stress - Strain relations of geopolymer concrete can also be predicted
using equations developed for Portland Cement Concrete.
9. GREEN CEMENT WITH REDUCED ENV. IMPACT:
The cement is based on an intermediate product, clinker, which is produced with
minor additions of mineralizes (CaSO4 and CaF2 ) to the kiln resulting in 5%
reduction in energy consumption and 5-10% increase in 28-day strength of the
cement. cement with reduced environmental impact. (mineralized cement,
National Conference on Recent Advancement and Sustainability in Civil Engineering, 10th
April2015
RASCE 2015 231
limestone addition, waste-derived fuels). By replacing cement with fly ash, micro
silica in larger amounts.
Green concrete requires less maintenance and repairs. Green concrete having
better workability than conventional concrete. Good thermal resistant and fire
resistant. Compressive strength behaviour of ceracrete with water cement ratio is
similar to conventional concrete. Flexural strength of green concrete is almost
equal to that of conventional concrete.
10. PRODUCTION OF GREEN CONCRETE:
Concrete with inorganic residual products (stone dust, crushed concrete as
aggregate.) ceramic wastes used as green aggregates. By replacing cement with fly
ash, micro silica in larger amounts. To develop new green cements and binding
materials (i.e. by increasing the use of alternative raw materials and alternative
fuels, and by developing/improving cement with low energy consumption). To use
residual products from the concrete industry, i.e. stone dust (from crushing of
aggregate) and concrete slurry (from washing of mixers and other equipment). To
use new types of cement with reduced environmental impact. (mineralized cement,
limestone addition, waste-derived fuels).
National Conference on Recent Advancement and Sustainability in Civil Engineering, 10th
April2015
RASCE 2015 232
11. SUSTAINABLE BUILDING MATERIAL
Concrete is a friend of the environment in all stages of its life span, from raw
material production to demolition, making it a natural choice for sustainable home
construction. Here are some of the reasons why, according to the Portland Cement
Association and the Environmental Council of Concrete Organizations:
Resource efficiency.
The predominant raw material for the cement in concrete is limestone, the
most abundant mineral on earth. Concrete can also be made with fly ash, slag
cement, and silica fume, all waste byproducts from power plants, steel mills, and
other manufacturing facilities.
Durability.
Concrete builds durable, long-lasting structures that will not rust, rot, or burn.
Life spans for concrete building products can be double or triple those of other
common building materials.
Thermal mass.
Homes built with concrete walls, foundations, and floors are highly energy
efficient because they take advantage of concretes inherent thermal massor ability
to absorb and retain heat. This means homeowners can significantly cut their
heating and cooling bills and install smaller-capacity HVAC equipment.
Reflectivity.
Concrete minimizes the effects that produce urban heat islands. Light-colored
concrete pavements and roofs absorb less heat and reflect more solar radiation than

National Conference on Recent Advancement and Sustainability in Civil Engineering, 10th
April2015
RASCE 2015 233
dark-colored materials, such as asphalt, reducing air conditioning demands in the
summer.
Ability to retain stormwater.
Paved surfaces tend to be impervious and can block natural water infiltration
into the soil. This creates an imbalance in the natural ecosystem and leads to
problems such as erosion, flash floods, water table depletion, and pollution.
Pervious concrete is a special type of structural concrete with a sponge-like
network of voids that water passes through readily. When used for driveways,
sidewalks, parking lots, and other pavements, pervious concrete can help to retain
storm water runoff and replenish local water supplies.
Minimal waste.
Concrete can be produced in the quantities needed for each project, reducing
waste. After a concrete structure has served its original purpose, the concrete can
be crushed and recycled into aggregate for use in new concrete pavements or as
backfill or road base
12. LIMITATION:
By using stainless steel, cost of reinforcement increases. Structures constructed
with green concrete have comparatively less life than structures with conventional
concrete. Split tension of green concrete is less than that of conventional concrete.
13. CONCLUSION:
Green concrete having reduced environmental impact with reduction of the
concrete industries CO2 emissions by 30%. Green concrete is having good thermal
and fire resistant. In this concrete recycling use of waste material such as ceramic
wastes, aggregates, so increased concrete industry‟s use of waste products by 20%
hence green concrete consumes less energy and becomes economical. So definitely
National Conference on Recent Advancement and Sustainability in Civil Engineering, 10th
April2015
RASCE 2015 234
use of concrete product like green concrete in future will not only reduce the
emission of CO2 in environment and environmental impact but also economical to
produce.
REFERENCES
1. Swamy RN, Mehmod HB. Mix proportions and strength characteristics of concrete containing
50% low calcium fly ash. In: Malhotra VM, editor. Proceedings of the second international
congress on fly ash, silica fume, slag and national pozzolanas in concretes, Madrid, ACJ SP 91,
vol. 1; 1986. p. 413–32.
2. Orsos, T., „BST: The Lightweight concrete aggregate‟, Concrete Institute of Australia seminar
on Special Use Concretes, Melbourne, 1992.
3. Ahmed E. Ahmed and Ahmed A. E. kourd.1989. Properties of concrete incorporating natural
and crushed stone very fine sand.ACI Material journal.86 (4):417-424.
4. Rebeiz, K. S., 1996. Precast use of polymer concrete using unsaturated polyester resin based
on recycled PET waste. Construction and Building Materials 10 (3), 215-220
5. Abrams, D. A., (1918), “Design of Concrete Mixtures”, Bulletin No 1, Structural Materials
Research Laboratory, Lewis Institute, Chicago, Dec 1918, PP. 20
6. ACI Committee 363, (1984). “State –of-the-art report on high-strength concrete, ACI Journal,
Proceeding 81(4), July-August, pp. 364-411
7. Ahmad, S.H. and Shah, S.P., (1985). “Structural properties of high strength concrete and its
implications for precast pre-stressed concrete”, PCI Journal, 30(6), November-December 1985,
pp. 91-119

Our Sincere Thanks to our sponsorers
Thulasi Products,Dindigul
Prof.K.V.NatarajanDhanalakshmi Publishers, Chennai
SHRUTHI PUBLICATIONS,Chennai